17
Review on the LCT Planning of Banda Aceh Michinaga Kohno, President Michi Creative City Designers Inc. The 1 st APEC Low-Carbon Model Town Symposium 14 September 2017

Review on the LCT Planning of Banda Aceh
Michinaga Kohno, President
Michi Creative City Designers Inc.
The 1st APEC Low-Carbon Model Town Symposium14 September 2017

Findings on the LCT Planning of Banda Aceh (1)
Characteristics of the town:
The target area of the town is a mixed use community of residential, commercial and educational , with the residential being the broadest.
Population: 249,499 (2014)
Expected growth of population is 3-4% in 5 years
Size of town: 61,359 ha
On December 26, 2004, the city was hit by a “tsunami” caused by the 9.2 Richter scale earthquake in the Indonesian Ocean, which caused casualties of hundreds of thousands of people and destroyed over 60% of city’s buildings.
[Source: Nomination Sheet and Wikipedia]

Findings on the LCT Planning of Banda Aceh (2)
On-going projects related to “low-carbon town”:
“Rencana Tata Kota dan Wilayah (RTKW)” (City and Regional Spatial Plan) for 2009-2029
BRT Transkutaraja
Consolidated Urban Development Plan(CUDP) for Krueng Aceh River
“Green City”
[Source: Nomination Sheet]

Findings on the LCT Planning of Banda Aceh (3)
Itemized efforts towards “low-carbon town” by the city
The recovery of methane from solid waste landfill
The conversion of organic waste into fertilizer
The introduction of PV for street lighting and traffic lights
The development of BRT network
Green building regulations
Green waste management
Monitoring and management of energy use in government buildings and public service facilities
[Source: Nomination Sheet]

Evaluation on the Application of the LCT- I System
Question Excellent Good AverageBelow
AveragePoor
Information of the LCT-I Volunteer Town ✓
Understanding of each LCT-I System indicators ✓
Explanation (evidence) provided for the self-evaluation
✓
Collection of data necessary for the evaluation ✓
Calculation of CO2 emissions ✓
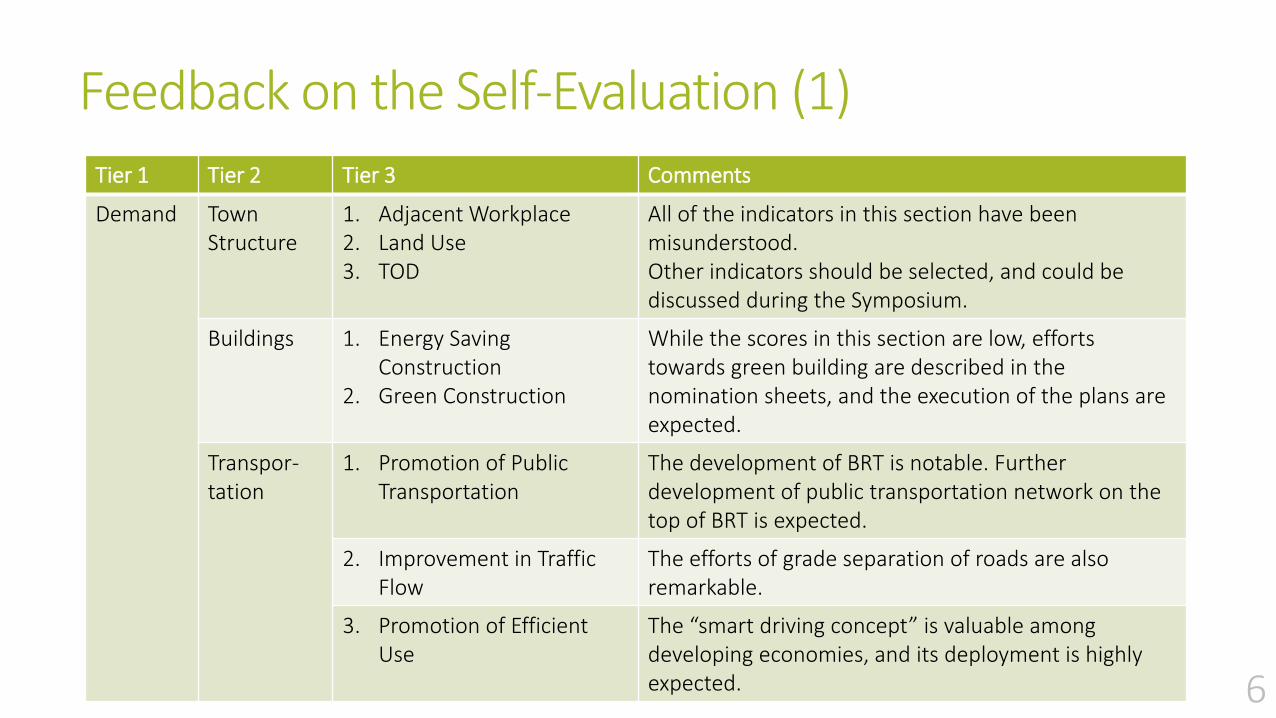
Feedback on the Self-Evaluation (1) Tier 1 Tier 2 Tier 3 Comments
Demand Town Structure
1. Adjacent Workplace2. Land Use3. TOD
All of the indicators in this section have been misunderstood.Other indicators should be selected, and could be discussed during the Symposium.
Buildings 1. Energy Saving Construction
2. Green Construction
While the scores in this section are low, efforts towards green building are described in the nomination sheets, and the execution of the plans are expected.
Transpor-tation
1. Promotion of Public Transportation
The development of BRT is notable. Further development of public transportation network on the top of BRT is expected.
2. Improvement in Traffic Flow
The efforts of grade separation of roads are also remarkable.
3. Promotion of Efficient Use
The “smart driving concept” is valuable among developing economies, and its deployment is highly expected.

Feedback on the Self-Evaluation (2) Tier 1 Tier 2 Tier 3 Comments
Supply Area Energy System
Area Energy Area energy systems should be planned along with the urban development and infrastructure plans in high-density areas.
Untapped Energy
Untapped Energy The collection of methane from solid waste landfill is remarkable and advanced among developing economies. This should be expanded to other areas of the economy.
Renewable Energy
Renewable Energy PVs have been introduced to traffic lights and street lighting. Further introduction of PV to public buildings and houses is encouraged.The possibility of other RE such as wind, sea tide, and compact hydraulic should be examined.
Multi-EnergySystem
Multi-Energy The combined supply of electricity and heat does not necessarily create benefits in tropical areas.

Feedback on the Self-Evaluation (3) Tier 1 Tier 2 Tier 3 Comments
Demand and Supply
Energy Manage-ment
Energy Management of Building / Areas
Energy management systems, such as area energy management systems and smart grids, are needed only when the use of unstable renewable energy becomes remarkable and the fluctuation of energy demand becomes significant.The fluctuation of energy demand should be carefully monitored including the future forecast.
Environ-ment and Resources
Greenery Securing Green Space The efforts to expand greenery including mangrove area in the coastal areas should be maintained for both purposes of shading and disaster risk mitigation.
WaterManage-ment
Water Resources The model of blackwater treatment in Gampong Jawashould be extended to other areas.

Feedback on the Self-Evaluation (4) Tier 1 Tier 2 Tier 3 Comments
Environ-ment and Resources
Waste Manage-ment
Waste Products Regardless of current status, the efforts to reduce and reuse solid waste and to collect waste in the separated ways are under way, and are expected to be accelerated and expanded.
Pollution 1. Air2. Water Quality3. Soil
Plans have already been made and efforts of executions are under way.The efforts are expected to be continued and expanded towards upper grade of quality.
Govern-ance
Policy Frame-work
1. Efforts toward a Low-Carbon Town
As indicated in the nomination sheet, plans on higherlevels such as greenhouse gas reduction 2013-2018 and “Green City” program have been enacted and the low-carbon efforts are in line with these plans.
2. Efforts toward Sustainability
For Banda Aceh, which experienced the tsunami disaster, the focus of sustainability should be on the resilience and disaster risk mitigation, as well as adaptation to the climate change.

Feedback on the Self-Evaluation (5) Tier 1 Tier 2 Tier 3 Comments
Govern-ance
Education & Manage-ment
Life Cycle Management The cooperation between the city government and communities of residents is recognized, but dormant activities are also found, which should be revived for further activities.

Feedback on the Self-Evaluation
Demand Side
Supply Side
Demand & Supply Side
Environment & Resource
Governance
The scores at Tier 1 shows fairly well-balanced pattern except “Demand & Supply Side”, which is represented by energy management systems and smart grids, which are applicable to areas with advanced energy sources and demand fluctuations.
Needs re-assessment
Fairly well-balanced
Needs acceleration

For the Improvement 1. Since green building guideline has
been established at the national level, it should be applied to the town, and expand the applications from public buildings to private sector.
2. BRT has been employed, but its coverage is limited, and acceleration of BRT network development and introduction of other low-carbon transportation measures is needed.
3. Untapped energy (methane from landfill) and PV are being employed, and other renewable energy should be studied the resilience of the city.

Ideas for the LCT Development
Proposed roadmap of LCT development
Demand Side
Supply Side
Promotion of green building guideline Expansion of BRT network & use of other
green transportation measures
Further implementation of PVs for city life Investigation into the use of other renewables Use of multiple power sources for resilience
Monitoring of fluctuation of energy demand
Implementation of energy management systems
Improved resilience and disaster risk mitigation by different energy sources
Residents engagement
Current Score
Environmental (Waste management)Governance (Education & PDCA)

Comments for the Improvement of LCT-I System (1)
Structural problems of LCT-I System:
1. Tier 1 categories have different number of Tier 2 items, which creates unintended weighting on Tier 2 scores onto Tier 1 result, and same problems exist between Tier 2 and Tier 3.
2. In some indicators, qualitative evaluation and quantitative evaluation are placed in line on the same 1-5 star scale.
3. Some indicators can be applied only in advanced economies, where urban development and administration regulations are mature.
Proposals of LCT-I Improvement:
1. To increase indicators of Tier 2 and 3 to make them equally affect to Tier 1 and 2 respectively, as well as to enable economy to select indicator to fit their data sets.
2. Employ generally accepted maturity model of 5 steps to 1-5 star scale, and separate qualitative and quantitative indicators.

Comments for the Improvement of LCT-I System (2)
“Residential Use and Non-residential Use”
[An example]
Legend Residential areas Floor area (*)
Non-residential areas (Commercial, Industrial)Floor Area (*)
This indicator evaluates how close the residential areas and non-residential areas are located in the town (the area to be studied).
The closeness of these areas reflects less travel of residents to their workplaces, which reduces the use of vehicles for commuting.
Tier 1 Tier 2
Demand Town Structure
Tier 3
Adjacent Workplace and Residence
Indicator value =[Total floor area of non-residential areas]
[Total floor area of residential areas]X 100 (%)
Numerator
Denominator
(*) Floor area: Total floor areas in case of multi-story buildings
Alternatives:Percentage of residents in working age, who commute to and
from their workplaces on foot or by bicyclesThe ratio of the number of employees to the population of
residents in working age
[Indicators users might misunderstand]

Comments for the Improvement of LCT-I System (3)[Indicators users might misunderstand]
“Floor Area Ratio”
[An example]
Tier 1 Tier 2 Tier 3
Demand Town Structure Land Use
Floor area of 1st floor
Floor area of Ground floor
Ground area of the plot
The “Floor Area Ratio” is the ratio of the total floor area of a building to the total ground area of the plot, where the building stands.
The “Floor Area Ratio” is generally regulated by local governments based on the intended use of land, which is regarded as “standard (authorized) floor area ratio” in LCT-I.
The indicator evaluates how much of the “standard floor area ratio” has already been filled by actual construction.
Indicator value =[“Standard” floor area ration planned for the area]
[Actual floor area ratio in current situation]X 100 (%)
(*) In the emerging economies, the “standard floor area ratio” tends to be held down to eliminate overdevelopment beyond the capacity of infrastructure.
(Authorized)
AF1
AFg
AL
ALFloor Area Ratio =
AFg AF1+X 100 (%)
Legend
Floor area
Land area
Alternatives proposed:Remove this indicator from LCT-I
Floor area of 2nd floorAF2
AF2+ + ・・・

Contact Information
Michinaga Kohno
President, Michi Creative City Designers Inc.Tokyo, Japan
Senior Research Fellow, School of Science and Technology,Nihon University
Michi Kohno
www.Michi-city.com


