12
RFM Analysis in R 2016 MATH 3201 DATAMINING FOUNDATION YI FAN
RFM Analysis in R
2016
MATH 3201 DATAMINING FOUNDATION YI FAN
Executive Summary
It is an old business adage: about 80 percent of your sales come from 20 percent of your
customers. You are in business largely because of the support of a fraction of your customer base: Your
best customers. (Mutyala, 2011) From the perspective of database marketing or direct marketing, the
best customers or the right customers who are more likely to respond to the strengths of your business
and remain loyal to it. So how to predict and identify best customers or valuable customers is the key to
make business success.
In database marketing or direct marketing, it is costly and unnecessary or even impossible for
salespeople to send mails or make phone calls to all the customers. Thus, it becomes necessary to
concern about two questions:
1. How to segment the customers in the database to find out the right customers who have
higher potential to response to mails or buy products?
2. Salespeople should send the mails to what kind of customer so that the business can reach
breakeven and make profit? (Remember it has a cost for sending mails to or making
connections in other ways with customers)
RFM method is considered a very easy but effective customer analysis method to solve those
kind of questions as I mentioned above. R, F, and M which construct the name of RFM method are
related to the following 3 aspects: (RFM (Customer Value), 2016)
Recency – How recently did the customer purchase our products?
Frequency – How often do they make the purchase?
Monetary Value – How much do they averagely spend per purchase?
So RFM analysis is a marketing technique that can be used to determine quantitatively which customers
are the best/right ones by examining how recently a customer has purchased, how often they purchase,
and how much the customer spends. RFM method is used for analyzing customers` behaviors and
defining market segment.
In this case, I would like to introduce CDNOW_master.txt dataset. This dataset contains the
purchase history of 23,570 individuals. All of them had their first purchase at CDNOW from the first
quarter in 1997 to the end of June in 1998. There are 69,659 transaction records in this dataset, and
each record comprises four field: the customer’s ID, the date of the transaction, the number of CDs
purchased, and the dollar value of the transaction. Even the year of the data is old, this dataset is still
meaningful to deliver the concept of RFM analysis.
In this report, I will implement RFM customer analysis of CDNOW_master.txt file with R
language. During the process of experiment, I would like to use independent method to segment
customers into RFM cells and calculate the Recency, Frequency, and Monetary scores independently.
Then determine breaks for each dimension and calculate the RFM score with breaks. Finally, calculate
the breakeven point as the standard to pick valuable/best customers.
RFM analysis aims to identify valuable customers in business, it only focuses on the best
customers. However, it provides little meaningful scoring on Recency, Frequency and Monetary when
most customers do not buy often, spent a little and have no purchase lately. RFM method ignores the
analysis on new firms setting up in a short period and customers that only purchase once and placed
small orders. Using limited number of selection variables is another issue, which means there may be
other variables to determine the value of customers, such as the geo-demographic information and so
on. (Jo-Ting Wei, 2010)
Problem Description
CDNOW_master.txt file is representative to deliver the concept of RFM analysis. This dataset file
contains the purchase history of 23,570 customers. They made their first purchase at CDNOW from first
quarter in 1997 to the end of June in 1998. There are 69,659 transaction records in this dataset, and
each record comprises four fields: the customer’s ID, the date of the transaction, the number of CDs
purchased, and the dollar value of the transaction. However the 69,659 transactions contain several
duplicate records with the same customer ID. So I remove the duplicate records which with same
customer ID, then I got 23,570 records with no duplication for same customer ID.
The purpose of the experiment is based on CDNOW transaction records to implement the
independent RFM scoring and calculate RFM scores with breaks, in order to predict and identify the
valuable customers who has the higher response rate to respond mails or phone calls. At the end, find
the breakeven point so we can use it to select valuable customers for CDNOW.
Analysis Technique
RFM stands for Recency, Frequency, Monetary amount – the three key elements in customer
behavior that help to predict/identify customers who have higher response rates. Based on the
experience we believe that Recency is the most important factor for the higher response rate because
customers who have purchased from you recently are more likely to buy from you again than customers
who you haven’t seen for a while. The Frequency is the second important factor for higher response rate
and the Monetary is the last one. There are three digital numbers for each RFM score, in general we rate
the customers using points from 1 to 5 in each dimension. Higher score means better customer value so
5 points is the best and 1 is the worst score. For example, a score of “532” means that this customer has
5 points for Recency, 4 points for Frequency, and 2 points for Monetary. Becasue the Recency of this
customer is 5, the highest point, means the customer has higher response rate than customers who get
Recency point below 5 point.
Users are not always want to determine the breaks in the same way and it is possible for them
to determine breaks by themselves based on their own business requirements. (RFM Customer Analyisis
with R Language, 2013). For example, a user can set 0-30 days, 31-90 days, 91-180 days, 181-360 days,
and what`s more set than 360 days as the 5 breaks for Recency. The latest purchase date within 30 days
ranks as 5 point, the most recently purchase date between 31-90 days ranks as 4 point...the most
recently purchase date more than 360 days ranks as 1 point. The 5 breaks of Frequency and Monetary
set up can be done in the same manner as Recency. So the setup for breaks of each dimension is flexible
which depends on the different requirements of different businesses.
As we know, RFM analysis divides customers into RFM cells by the three dimensions of R, F, and
M. Normally, there are two methods to segment customers. The first one is Nested, the other one is
Independent. In nested binning, each customer is assigned a Recency rank, a Frequency rank, and
combined with each Monetary rank. This way is more likely to provide a more even distribution with
combined RFM scores. But nested binning is more likely to make Frequency and Monetary rank scores
more difficult to interpret. (Peck, 2013) For example, there is one customer assigned with a “543” RFM
score and the other customer assigned with a “443” RFM score. Even they got same Frequency and
Monetary rank it may not describe the same thing since they have different Recency ranks. Also,
Frequency rank is dependent on the Recency rank.
In independent method, simple ranks are independently assigned to Recency, Frequency, and
Monetary values. Thus, the interpretation of each of the three RFM components is unambiguous. The 5
points score of Frequency for a customer means the same as the 5 points score of Frequency for
another customer, regardless of their Recency scores. However, when the sample is smaller, this
method will probably give a less even distribution for combined RFM score. (Peck, 2013)
In this case, I will implement the independent method first in R language, and then implement
nested method. The nested method will allow users to input the parameters to set the breaks for each
dimension based on their own business requirements.
I make an experiment plan for the RFM customer analysis of CDNOW based on
CDNOW_master.txt file. The goal is to find out valuable customers who may have higher response rates
and select the customers to reach breakeven point.
Explore Data – I will use CDNOW_master.txt data during the demonstration. Since the original
data has no frames the first step of exploring data is to build a data frame with the columns of
customer ID, transaction data, and money amount paid by each transaction. After this, we
should add appropriate column for these three columns and transfer the text column type of
data to date type. Finally remove the records with the duplicated IDs.
Segment the customers into RFM cells – since we have the data ready now, we use independent
method to segment the customers into RFM cells. For each RFM cell, it contains a three-digital
number. R is in hundred`s digit (*100), F is ten’s digit (*10) and M is unit’s digit (*1). So, the
score of RFM is easy to read, for example a score of “542” means that the customers has 5
points in Recency, 4 points in Frequency, and 2 points in Monetary.
Calculate the Recency, Frequency, and Monetary – to implement RFM analysis, we need to
further process the data set in the CDNOW_master.txt by first finding the most recent date for
each ID and calculating the days from one day until now or some other dates to get the Recency
data. For example, I set 19970101 as startDate and 19980701 as endDate. Then, the Recency of
the customer who shopped at CDNOW on 19970112 should have a score of 535 because there
are 535 days from 19970112 to 19980701, then follow this order to calculate the Recency data
for each record. Secondly, calculate the quantity of translations for customers in order to get
their Frequency data. For example, there are some customers who shopped 6 times from the

time between 19970101 to 19980701. Then, Frequency data for these customers are 6. Finally,
to get the amount per transaction on average, add all the amount of money a customer spent
and divide it by Frequency to, and this number will be the Monetary data.
Independent RFM Scoring – scoring the Recency, Frequency and Monetary in r, f, and m in
aliquots number separately. I will use “getIndependentScore” function to implement the
independent scoring. And it results in a new data frame with “R_Score”, “F_Score”, “M_Score”,
and “Total_Score” as the new four columns.
RFM Scoring with Breaks – businesses can determine the breaks for each dimension by
themselves based on their own business requirements. Thus, in this step, I will score the
Recency, Frequency, and Monetary in r, f, and m which are vector objects with a series of
breaks. For CDNOW, it will set 0-30 days, 31-90 days, 91-180 days, 181-360 days, and more than
360 days as the 5 breaks for Recency. The most recently purchase date within 30 days ranks as 5
point, the most recently purchase date between 31-90 days ranks as 4 point...the most recently
purchase date more than 360 days ranks as 1 point. Next, I set the Frequency ranges as 0-2
times, 3-5 times, 6-8 times, 9-11 times, and more than 11 times as 5 breaks. And then, I set the
Monetary ranges to be 0-10 dollars, 11-20 dollars, and so on as 5 breaks. Then, we can use the
function of “getScoreWithBreaks” and find out the customers’ distributions in the RFM cells.
After every step above, I can also find out how many customers have total scores that are
greater than or equal to 500 or 400 and those customers will be considered as high response
rate customers.
Estimate response rate for each RFM cell – the calculation of response rate is based on historical
responding data. There is no historical data if it is the first time to use RFM analysis. Thus, we
can randomly select some customers, for example 10%, from each RFM cells. (RFM Customer
Analyisis with R Language, 2013)
Calculate the breakeven point to select valuable customers – to reach the breakeven we should
satisfy P-C/R = 0 where P is price or profit per deal or per response; C is the cost for each mail
sent out. It includes production cost, mailing cost, and so on, R is the response rate. (RFM
Customer Analyisis with R Language, 2013). Based on this equation we could get the breakeven
point and pick valuable customers for CDNOW. Then, send out the direct marketing mails to
these customers to make profits.
Select the Target Customers
Assumption
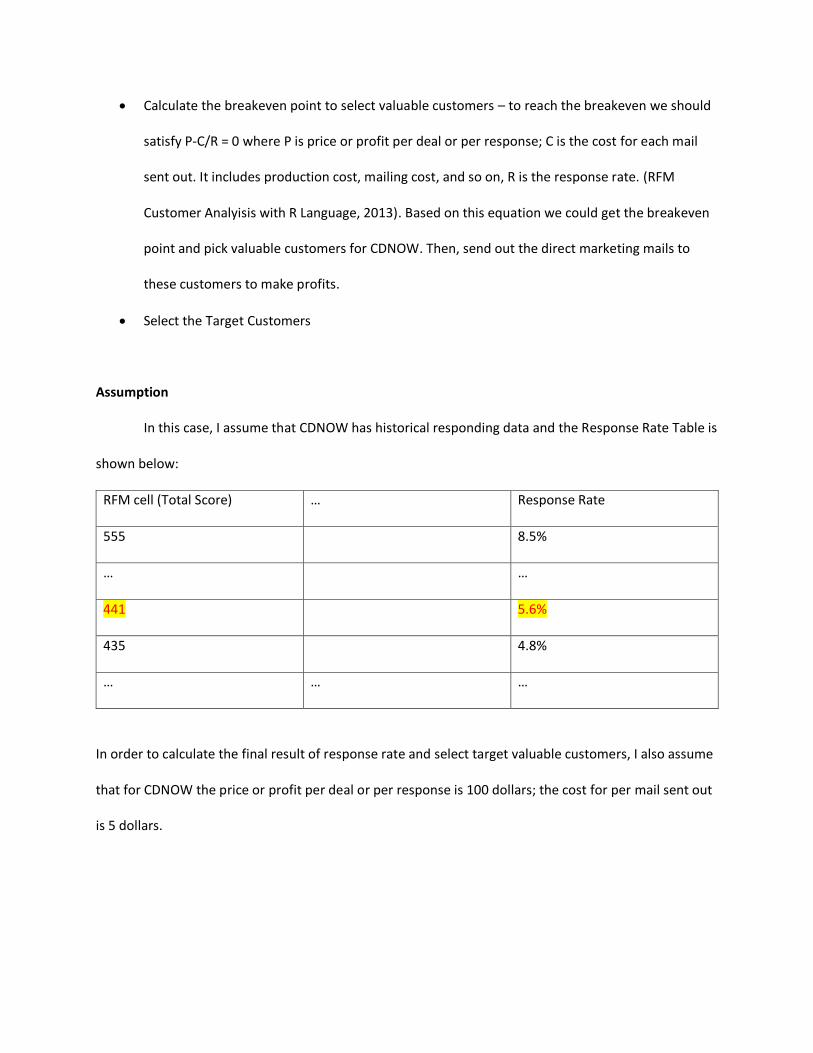
In this case, I assume that CDNOW has historical responding data and the Response Rate Table is
shown below:
RFM cell (Total Score) … Response Rate
555 8.5%
… …
441 5.6%
435 4.8%
… … …
In order to calculate the final result of response rate and select target valuable customers, I also assume
that for CDNOW the price or profit per deal or per response is 100 dollars; the cost for per mail sent out
is 5 dollars.
Result
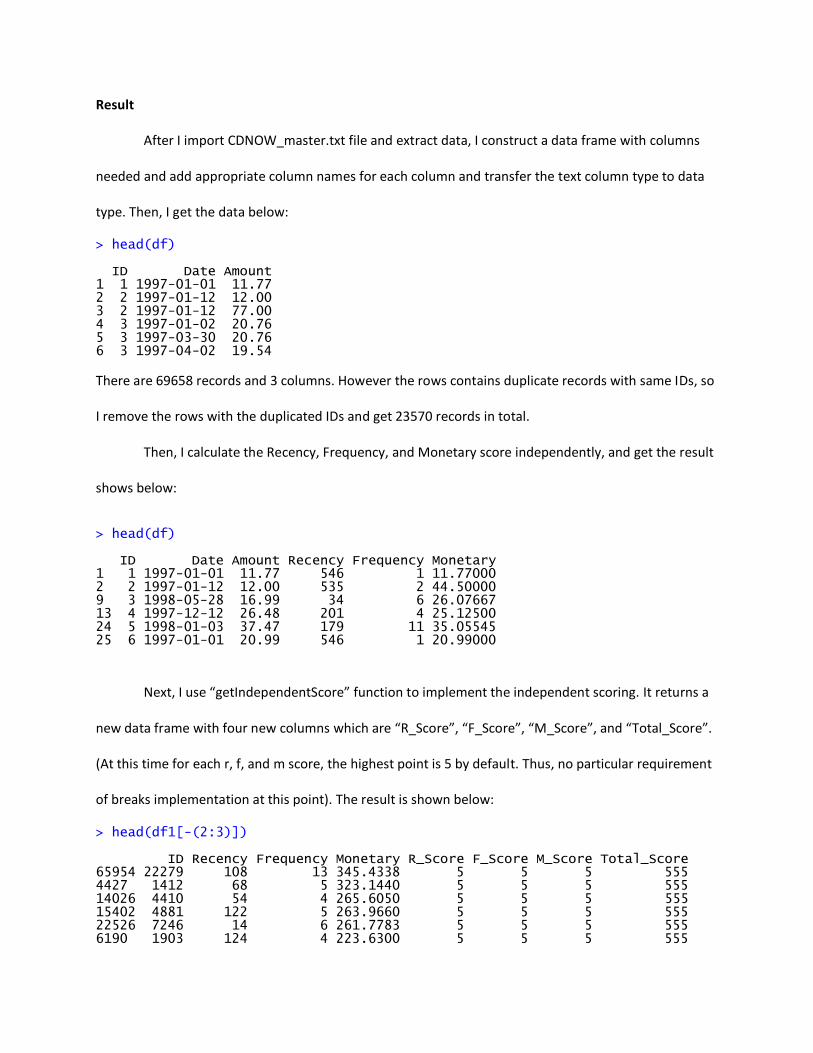
After I import CDNOW_master.txt file and extract data, I construct a data frame with columns
needed and add appropriate column names for each column and transfer the text column type to data
type. Then, I get the data below:
> head(df) ID Date Amount 1 1 1997-01-01 11.77 2 2 1997-01-12 12.00 3 2 1997-01-12 77.00 4 3 1997-01-02 20.76 5 3 1997-03-30 20.76 6 3 1997-04-02 19.54
There are 69658 records and 3 columns. However the rows contains duplicate records with same IDs, so
I remove the rows with the duplicated IDs and get 23570 records in total.
Then, I calculate the Recency, Frequency, and Monetary score independently, and get the result
shows below:
> head(df) ID Date Amount Recency Frequency Monetary 1 1 1997-01-01 11.77 546 1 11.77000 2 2 1997-01-12 12.00 535 2 44.50000 9 3 1998-05-28 16.99 34 6 26.07667 13 4 1997-12-12 26.48 201 4 25.12500 24 5 1998-01-03 37.47 179 11 35.05545 25 6 1997-01-01 20.99 546 1 20.99000
Next, I use “getIndependentScore” function to implement the independent scoring. It returns a
new data frame with four new columns which are “R_Score”, “F_Score”, “M_Score”, and “Total_Score”.
(At this time for each r, f, and m score, the highest point is 5 by default. Thus, no particular requirement
of breaks implementation at this point). The result is shown below:
> head(df1[-(2:3)]) ID Recency Frequency Monetary R_Score F_Score M_Score Total_Score 65954 22279 108 13 345.4338 5 5 5 555 4427 1412 68 5 323.1440 5 5 5 555 14026 4410 54 4 265.6050 5 5 5 555 15402 4881 122 5 263.9660 5 5 5 555 22526 7246 14 6 261.7783 5 5 5 555 6190 1903 124 4 223.6300 5 5 5 555
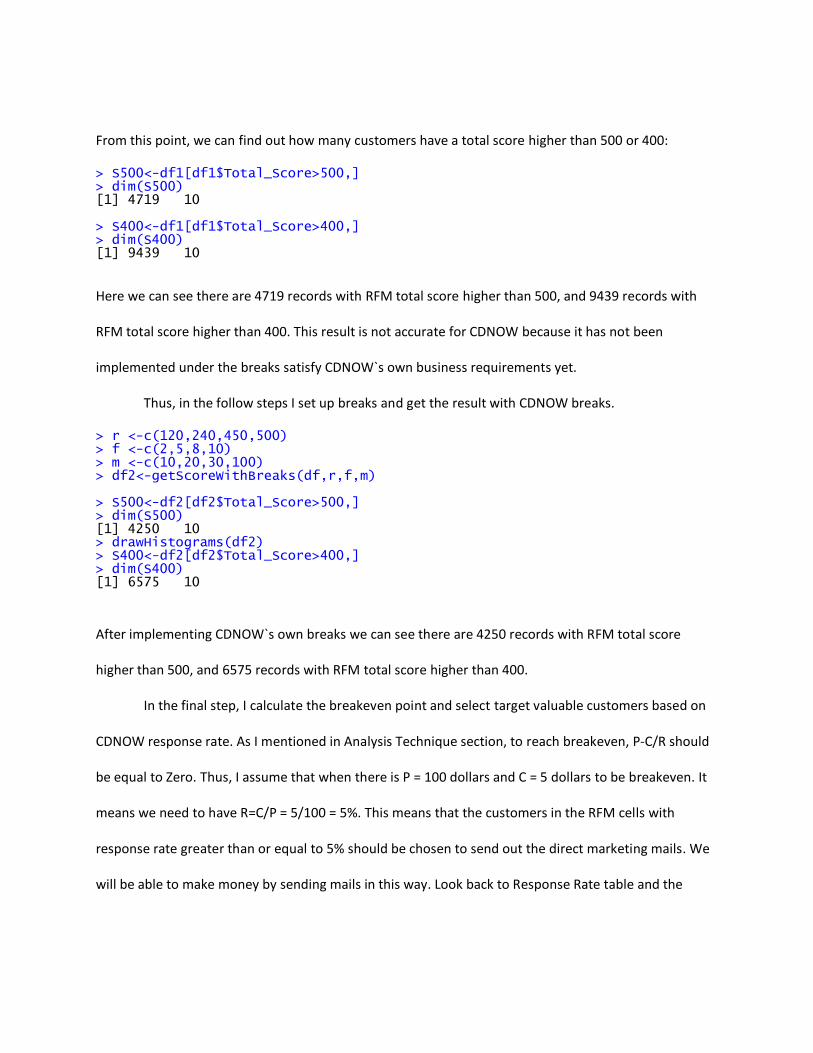
From this point, we can find out how many customers have a total score higher than 500 or 400:
> S500<-df1[df1$Total_Score>500,] > dim(S500) [1] 4719 10 > S400<-df1[df1$Total_Score>400,] > dim(S400) [1] 9439 10
Here we can see there are 4719 records with RFM total score higher than 500, and 9439 records with
RFM total score higher than 400. This result is not accurate for CDNOW because it has not been
implemented under the breaks satisfy CDNOW`s own business requirements yet.
Thus, in the follow steps I set up breaks and get the result with CDNOW breaks.
> r <-c(120,240,450,500) > f <-c(2,5,8,10) > m <-c(10,20,30,100) > df2<-getScoreWithBreaks(df,r,f,m) > S500<-df2[df2$Total_Score>500,] > dim(S500) [1] 4250 10 > drawHistograms(df2) > S400<-df2[df2$Total_Score>400,] > dim(S400) [1] 6575 10
After implementing CDNOW`s own breaks we can see there are 4250 records with RFM total score
higher than 500, and 6575 records with RFM total score higher than 400.
In the final step, I calculate the breakeven point and select target valuable customers based on
CDNOW response rate. As I mentioned in Analysis Technique section, to reach breakeven, P-C/R should
be equal to Zero. Thus, I assume that when there is P = 100 dollars and C = 5 dollars to be breakeven. It
means we need to have R=C/P = 5/100 = 5%. This means that the customers in the RFM cells with
response rate greater than or equal to 5% should be chosen to send out the direct marketing mails. We
will be able to make money by sending mails in this way. Look back to Response Rate table and the
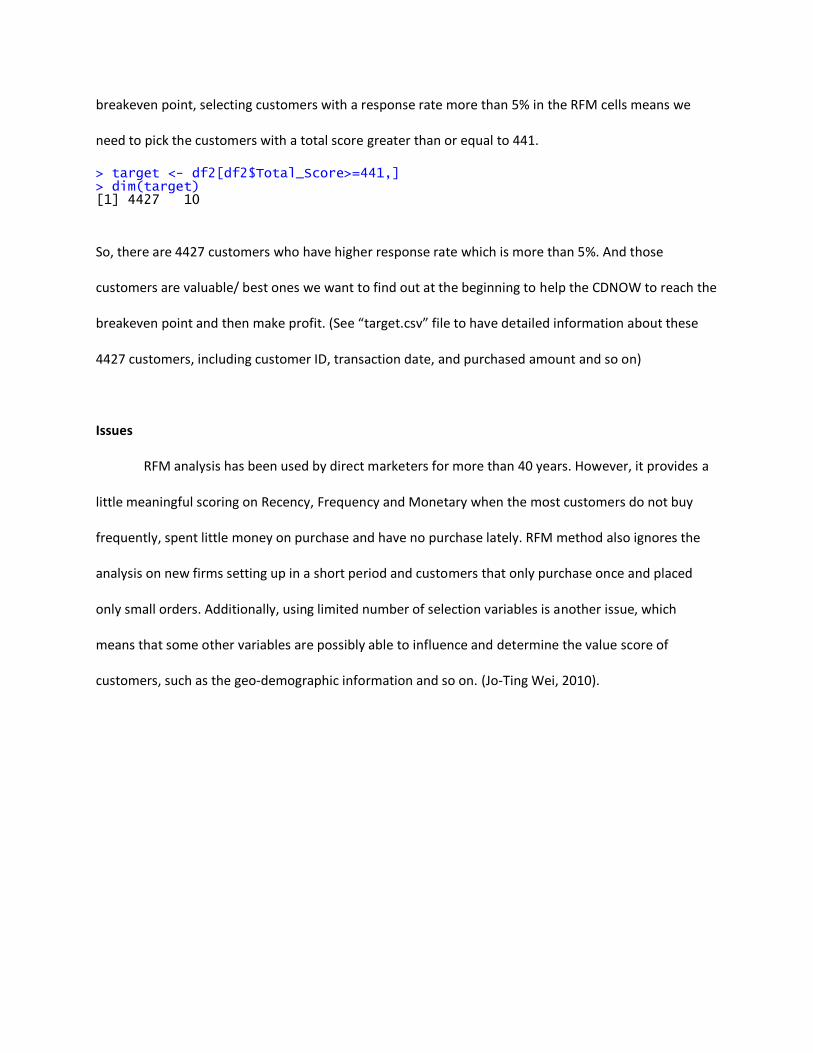
breakeven point, selecting customers with a response rate more than 5% in the RFM cells means we
need to pick the customers with a total score greater than or equal to 441.
> target <- df2[df2$Total_Score>=441,] > dim(target) [1] 4427 10
So, there are 4427 customers who have higher response rate which is more than 5%. And those
customers are valuable/ best ones we want to find out at the beginning to help the CDNOW to reach the
breakeven point and then make profit. (See “target.csv” file to have detailed information about these
4427 customers, including customer ID, transaction date, and purchased amount and so on)
Issues
RFM analysis has been used by direct marketers for more than 40 years. However, it provides a
little meaningful scoring on Recency, Frequency and Monetary when the most customers do not buy
frequently, spent little money on purchase and have no purchase lately. RFM method also ignores the
analysis on new firms setting up in a short period and customers that only purchase once and placed
only small orders. Additionally, using limited number of selection variables is another issue, which
means that some other variables are possibly able to influence and determine the value score of
customers, such as the geo-demographic information and so on. (Jo-Ting Wei, 2010).
References Jo-Ting Wei, S.-Y. L.-H. (2010). A review of the application of RFM model. African Journal of Business
Management, 4203-4204.
Mutyala, S. (2011, 01). Using RFM to Identify Your Best Customers. Retrieved from EightLeaves:
http://www.eightleaves.com/2011/01/using-rfm-to-identify-your-best-customers
Peck, J. (2013, March 20). SPSS: Pros and Cons of Nested and Idependent Bining for RFM Analysis.
Retrieved from Quora: https://www.quora.com/SPSS/SPSS-Pros-and-Cons-of-Nested-and-
Independent-Binning-for-RFM-Analysis
RFM (Customer Value). (2016, November 8). Retrieved from Wikipedia:
https://en.wikipedia.org/wiki/RFM_(customer_value)
RFM Customer Analyisis with R Language. (2013, July 7). Retrieved from Data Apple:
http://www.dataapple.net/?p=84


