Macromolecules 1994,27, 337-347 337 Rheological Characterization of Director Dynamics in a Nematic Monodomain Containing Mesogenic Polymers of Differing Architectures DongFeng Gu and Alex M. Jamieson* Macromolecular Science Department, Case Western Reserve University, Cleveland, Ohio 44106 Received June 30, 1993; Revised Manuscript Received September 3, 1993. ABSTRACT The rheological behavior of dilute nematic mixtures containing liquid crystal polymers (LCP) with differentmolecular architecturesdissolved in low molar mass nematogens is investigated. Addition of a side-chainLCP (MSHMA) to a flow-aligning nematic solvent, pentylcyanobiphenyl(5CB), altersthe rheology to director-tumblingcharacter. Conversely,dissolution of a main-chainLCP (TPB-15) in a director-tumbling nematic,octylcyanobiphenyl(8CB), suppressesthe tumbling behavior and produces a flow-aligning response. A characteristic pattern of shear stress oscillations is observed for MSHMAl5CB mixtures and pure 8CB, indicative of director tumbling, in flow startup, step flow, and flow reversal experiments. In contrast, TPB- 15/8CBand TPB-l5/5CB mixtures show no oscillatory response but a single stress overshoot, characteristic of a flow-aligning nematic such as pure 5CB. Concentrationand temperature dependences of the rheological effect of LCP are presented. Our results demonstrate that addition of sufficient amounts of LCP to a nematic solvent can change the sign of the Leslie viscosity coefficient as. Our findings are qualitatively consistent with a theoretical model of Brochard (1979), provided that the side-chain LCP has an oblate molecular configuration,while the main-chain LCP maintains a prolate molecular configuration in the nematic solvent. Analysis of the transient shear response function via the Erickson-Leslie-Parodi formalism yields viscosity coefficients of the mixtures and hence an estimate of the effective axial ratio of the polymer chain. 1. Introduction When a nematic liquid crystal monodomain is subjected to a shear flow, the orientational response of the nematic director depends on the six Leslie viscosity coefficients L]L1-(Y6 and the three Ffank elastic constants K11-K33."2 In particular, nematics can be divided into two classes according to the sign of the coefficient as, given that the coefficient a2 is generally negative. The first class, comprising materials with a3 < 0, will shear-align, with the director at a characteristic angle with respect to the flow direction in a simple shear field. The second class are materials with a3 > 0, for which the director is forced to rotate by the hydrodynamic torques in a simple shear flow. The former is referred to as "flow aligning" and the latter as "tumbling", respectively. For low molar mass nematics (LMMN), director tumbling is not a common rheological phenomenon. For a few LMMN, such as p-(n- hexy1oxy)benzilidene-p'-aminobenzonitrile (HBAB) and octylcyanobiphenyl(8CB), a3 has been reported positive and director-tumbling behavior has been clearly dem- onstrated.3-" In recent years, many efforts have been made to understand and modify the rheological behavior of polymer liquid crystalline solutions and melts, with a view to obtaining optimal physical properties of the processed materials. There have been experimental reports iden- tifying pronounced oscillations of both shear stress and optical response, in the rheological behavior of liquid crystal polymers (LCP) solutions and melts. Systems studied include lyotropic nematic solutions of poly(benzyl glutamate) (PBG),&13 (hydroxylpropy1)cellulose (HPC),l4 poly@-phenylenebenzobisthiazole) (PBZT),16 poly(n-hex- yl isocyanate) (PHIC),16J7 and thermotropic copolyester nematic melts in transient shear flow.'18J9 Theoretical analysis suggests that these oscillations are due to director tumbling.17J*~20J1 The explanation for the stress oscilla- e Abstract published in Advance ACS Abstracts, December 1, 1993. 0024-9297/94/2227-0337$04.50/0 tions is that when the shear flow starts at a high enough shear rate, the director will rotate through several multiples of A under the influence of the hydrodynamic torque coupled to the director; thus, the transient shear stress exhibits a series of extrema which correspond to certain angles of director orientation. The characteristics of the stress oscillation, such as amplitude, frequency, and relaxation rate, depend on the initial director orientation state, the shear rate, and, most importantly, on the vis- coelastic properties of the nematic. The rheology of LCP solutions and melts is complicated by the fact that the coupling between the nematic director and the polymer chain makes it difficult for the director to avoid hydro- dynamic torques. Moreover, the flexibility of the backbone and/or spacer,the configurational anisotropy,and the high density of defects or the polydomain structure generate additional complexity. Here we are interested in the rheological behavior of dilute nematic solutions of LCP in low molar mass nematogens (LCP/LMMN mixtures). By using nematic monodomains,we avoid the problem of high defect density in characterizing the rheological behavior. Also, as we shall see, a molecular hydrodynamic formulation of liquid crystal rheology in terms of LCP chain configuration is simpler in dilute than in concentrated systems. When a small amount of a liquid crystal polymer is dissolved into anematic solvent, a large change in the rheological behavior of the mixture may be expected, since the polymer chain occupies a large hydrodynamic volume fraction in the nematic medium. In addition, the interaction between the anisotropic solvent and the mesogenic groups ina liquid crystal polymer can make the polymer backbone config- uration highly nonspherical. This configurational ani- sotropy has been observed directly via small-angle scat- tering experiments for side-chain and main-chain liquid crystal polymers in low molar mass nematic solventa.22~23 For main-chain LCP, the chain configuration is generally prolate with the long axis parallel to the nematic director; for side-chain LCP, prolate or oblate configurations may 0 1994 American Chemical Society
Transcript
Macromolecules 1994,27, 337-347 337
Rheological Characterization of Director Dynamics in a Nematic Monodomain Containing Mesogenic Polymers of Differing Architectures
DongFeng Gu and Alex M. Jamieson* Macromolecular Science Department, Case Western Reserve University, Cleveland, Ohio 44106
Received June 30, 1993; Revised Manuscript Received September 3, 1993.
ABSTRACT The rheological behavior of dilute nematic mixtures containing liquid crystal polymers (LCP) with different molecular architectures dissolved in low molar mass nematogens is investigated. Addition of a side-chain LCP (MSHMA) to a flow-aligning nematic solvent, pentylcyanobiphenyl(5CB), alters the rheology to director-tumbling character. Conversely, dissolution of a main-chain LCP (TPB-15) in a director-tumbling nematic, octylcyanobiphenyl (8CB), suppresses the tumbling behavior and produces a flow-aligning response. A characteristic pattern of shear stress oscillations is observed for MSHMAl5CB mixtures and pure 8CB, indicative of director tumbling, in flow startup, step flow, and flow reversal experiments. In contrast, TPB- 15/8CB and TPB-l5/5CB mixtures show no oscillatory response but a single stress overshoot, characteristic of a flow-aligning nematic such as pure 5CB. Concentration and temperature dependences of the rheological effect of LCP are presented. Our results demonstrate that addition of sufficient amounts of LCP to a nematic solvent can change the sign of the Leslie viscosity coefficient as. Our findings are qualitatively consistent with a theoretical model of Brochard (1979), provided that the side-chain LCP has an oblate molecular configuration, while the main-chain LCP maintains a prolate molecular configuration in the nematic solvent. Analysis of the transient shear response function via the Erickson-Leslie-Parodi formalism yields viscosity coefficients of the mixtures and hence an estimate of the effective axial ratio of the polymer chain.
1. Introduction When a nematic liquid crystal monodomain is subjected
to a shear flow, the orientational response of the nematic director depends on the six Leslie viscosity coefficients L]L1-(Y6 and the three Ffank elastic constants K11-K33."2 In particular, nematics can be divided into two classes according to the sign of the coefficient as, given that the coefficient a2 is generally negative. The first class, comprising materials with a 3 < 0, will shear-align, with the director a t a characteristic angle with respect to the flow direction in a simple shear field. The second class are materials with a3 > 0, for which the director is forced to rotate by the hydrodynamic torques in a simple shear flow. The former is referred to as "flow aligning" and the latter as "tumbling", respectively. For low molar mass nematics (LMMN), director tumbling is not a common rheological phenomenon. For a few LMMN, such as p-(n- hexy1oxy)benzilidene-p'-aminobenzonitrile (HBAB) and octylcyanobiphenyl(8CB), a3 has been reported positive and director- tumbling behavior has been clearly dem- onstrated.3-"
In recent years, many efforts have been made to understand and modify the rheological behavior of polymer liquid crystalline solutions and melts, with a view to obtaining optimal physical properties of the processed materials. There have been experimental reports iden- tifying pronounced oscillations of both shear stress and optical response, in the rheological behavior of liquid crystal polymers (LCP) solutions and melts. Systems studied include lyotropic nematic solutions of poly( benzyl glutamate) (PBG),&13 (hydroxylpropy1)cellulose (HPC),l4 poly@-phenylenebenzobisthiazole) (PBZT),16 poly(n-hex- yl isocyanate) (PHIC),16J7 and thermotropic copolyester nematic melts in transient shear flow.'18J9 Theoretical analysis suggests that these oscillations are due to director tumbling.17J*~20J1 The explanation for the stress oscilla-
e Abstract published in Advance ACS Abstracts, December 1, 1993.
0024-9297/94/2227-0337$04.50/0
tions is that when the shear flow starts a t a high enough shear rate, the director will rotate through several multiples of A under the influence of the hydrodynamic torque coupled to the director; thus, the transient shear stress exhibits a series of extrema which correspond to certain angles of director orientation. The characteristics of the stress oscillation, such as amplitude, frequency, and relaxation rate, depend on the initial director orientation state, the shear rate, and, most importantly, on the vis- coelastic properties of the nematic. The rheology of LCP solutions and melts is complicated by the fact that the coupling between the nematic director and the polymer chain makes it difficult for the director to avoid hydro- dynamic torques. Moreover, the flexibility of the backbone and/or spacer, the configurational anisotropy, and the high density of defects or the polydomain structure generate additional complexity.
Here we are interested in the rheological behavior of dilute nematic solutions of LCP in low molar mass nematogens (LCP/LMMN mixtures). By using nematic monodomains, we avoid the problem of high defect density in characterizing the rheological behavior. Also, as we shall see, a molecular hydrodynamic formulation of liquid crystal rheology in terms of LCP chain configuration is simpler in dilute than in concentrated systems. When a small amount of a liquid crystal polymer is dissolved into anematic solvent, a large change in the rheological behavior of the mixture may be expected, since the polymer chain occupies a large hydrodynamic volume fraction in the nematic medium. In addition, the interaction between the anisotropic solvent and the mesogenic groups ina liquid crystal polymer can make the polymer backbone config- uration highly nonspherical. This configurational ani- sotropy has been observed directly via small-angle scat- tering experiments for side-chain and main-chain liquid crystal polymers in low molar mass nematic solventa.22~23 For main-chain LCP, the chain configuration is generally prolate with the long axis parallel to the nematic director; for side-chain LCP, prolate or oblate configurations may
0 1994 American Chemical Society
338 Gu and Jamieson
be found, depending on backbone flexibility and spacer length. A theoretical analysis of the viscosity increments due to the dissolution of flexible polymer chains in a nematic fluid has been described by Brochard?' who developed expressions in terms of a few microscopic parameterssuchasRL,RII (theradiiofgyrationofpolymer chains perpendicular and parallel to the director), and the configurational relaxation time of the chain TR:
(1) 67, = (ckT/N)TR(RL2 - R112)2/RL2R112
6 ~ 2 (ckT/N)r,(R,' - RII4)/Rl2RII2 (2)
67, = (ckT/MrR(R,2/R1~) (3) Application of the relations a2 = ( 7 2 - yl)/2 and a3 = (71 + y2)/2 to eqs 1 and 2 yields directly
(4) &a2 = (ckT/N)rR(RL2 - Rl12)/R,2
6a3 (ckT/N)TR(RL2- Rll2)/RIl2 (5) Here y1 is the twist viscosity, qb is one of the Miesowicz viscosities, c is the concentration, k is Boltzmann's constant, Tis theahsolutetemperature,andNisthedegree of polymerization. According to eqs 1-5, the incremental changes on addition of polymer for the various viscosity coefficients are numerically different and depend strongly on the anisotropic ratio RJRII. Note that, as indicated by eq 5, addition of an oblate LCP results in a positive increment to 013, whereas addition of a prolate LCP gives a negative increment. This implies that a flow-aligning low molar mass nematic can be converted to a director- tumbling system simply by dissolution of a sufficient quantity of a side-chain liquid crystal polymer which has anoblate configuration, and a director-tumblinglowmolar mass nematic can be turned into a flow-aligning system by adding a main-chain liquid crystal polymer which has a prolate configuration. Also, because a3 is usually small in amplitude for low molar mass nematics, this distinctive change in rheological behavior can be achieved at very low polymer concentrations.
Inpreviousstudies,2S-*?we haveinvestigated thechanges inthe viscosityand elastic coefficients of nematic mixtures of 5CB with certain side-chain and main-chain liquid crystal polymers using dynamic light scattering and Freedericksz transition techniques. Our results suggest thatthe backboneoftheside-chainliquidcrystalpolymers takes an oblate configuration, that is, Rl/Rll > 1. On the other hand, a prolate configuration, that is, RL/R1l < 1, was deduced for the main-chain liquid crystal polymers. However, dynamic light scattering measurements cannot unambiguously determine the sign of a3, since the relax- ation time for the splay deformation mode, in which a3 appears, is insensitive to the sign of a3.25 Furthermore, since the magnitude of a3 for low molar mass nematics is always much smaller than that of the other viscosity coefficients, such as a2, y1, and qb. which contribute to the relaxation times measured in dynamic light scattering, the contributions from 013 are smaller than the experi- mental error. Therefore, a more sensitive method such as direct rheological or rheooptical investigation is required to determine the sign and magnitude of a3.
Following the linear nematohydrodynamic formalism of Erickson, Leslie, and Parodi (ELP)?a30 a characteristic oscillating response of the shear stress is predicted for a material which exhibits director tumbling, whereas an initial stress overshoot followed by a steady shear stress value is predicted for a flow-aligning nematic. According to Erickson's transversely isotropic fluid model which
Macromolecules, Vol. 27, No. 2, 1994
y=d LT y=o
Figure 1. Two-dimensional schematic description of shear flow for a nematic monodomain. neglects the stress tensor T is
T = 2rD + 2f i1Df i f i f i i l+ 2p2(fifi*D + DMI) (6) and the director evolution equation becomes
d f i i d t = A47 + A(&D - D:fififi) (7)
where Iz is the unit vector identifying the nematic director, Distherateofdeformationtensor,Risthevorticitytensor, and the parameters p, p2, and A are functions of the Leslie coefficient^^^
Considering a two-dimensional system, as shown in Figure 1, we have n, = sin 8, n, = cos 8, n, = 0, D;, = oij = C, except D, = Dyx = wry = -0,. = y/2 ( y is the velocity gradient or shear rate). Using relationships a2 + ag = ag - abg0 and qb = (a3 + a, + 01g)/2,3~ from eq 6, we obtain
Y?., (12) and from eq 7, we have
where qapp is the apparent viscosity. The distinctive difference between flow-aligning and director-tumbling behavior is implicitly contained in eq 13. Noting that a2 is always negative, integration over eq 13 gives
tan 8 = (:) tan[ -73 for a3 > 0 (14)
and
tan 8 = ($'"tanb[ -1 for a3 < 0
(15) a3 - a2
As indicated by eq 14, for a3 > 0, the director rotation angle 8 will always increase with strain and an indefinite oscillatory response is predicted, resembling the behavior of a single fiber tumbling in a shear flow (a Jeffery orbit). In contrast, since tanh(r) - 1 as x >> 1, eq 15 predicts flow-aligning behavior since a maximum director rotation angle is reached at 8 = tan-1[(al/a3)1/21 when the strain y is large enough. According to eqs 12, 14, and 15, the apparentviscosity ?.,,is afunctionofthedirector rotation
Macromolecules, Vol. 27, No. 2, 1994
angle which changes with shear strain. By taking first and second derivatives of qapp with respect to 6, it is easy to show that a single maximum appears in qapp at 6 = s / 4 for a flow-aligning nematic, while for a director-tumbling system, a series of maxima are present in qapp a t 6 = ma/4 (m = odd), and a series of minima are present a t 8 = nxI2 ( n = 0, 1, 2, 3 , . . . ) , I 7 3 provided that
This inequality is generally true for low molar mass nematic rnaterial~.3~
The applicability of the 2D Erickson transversely isotropic fluid model to depict the transient shear response of tumbling nematics is limited in the event that the director moves out of the shear plane (out-of-plane in- stability). Such out-of-plane motion has been shown theoretically and experimentally to occur a t relatively small Erickson numbers (ratios of hydrodynamic to elastic forces) of 20-40.33v34 However, tumbling has also been observed without an out-of-plane instability in a torsional parallel-plate flow e ~ p e r i m e n t . ~ ~ It was proposed by Carlson2 that a pressure drop induced by a hydrodynamic back tends to keep the director in the shear plane.
Recently, we examined the transient shear flow response of a homeotropic monodomain formed from a nematic mixture of 5CB with a side-chain LCP, poly[6-(4-methoxy- a-methylstilben-4'-yl)oxy] hexyl methacrylate] (MSH- MA), at a polymer concentration of 4.5% wlw and compared this response to that of pure 5CB and pure 8CB.37 Since pure 5CB is known to have negative cy3 and negative a2 over its entire nematic range and since pure 8CB is a material with a positive a3 over a major part of its nematic range, these two low molar mass nematics provide us respectively with reference examples of flow- aligning and tumbling systems. We found that, on addition of MSHMA to the nematic solvent 5CB, the shear flow character was altered from flow-aligning to director- tumbling, as evidenced by the appearance of a charac- teristic oscillatory stress response in startup flow and in flow reversal. The tumbling pattern of the mixture was very similar to that observed for pure 8CB, and, in agreement with theoretical prediction based on eqs 12 and 14, showed shear strain scaling of the oscillatory periodicity and the presence of characteristic doublet peaks. In direct contrast to the oscillatory behavior of 8CB and the MSHMA/SCB mixture, and again consistent with theo- retical expectation, a single stress overshoot was observed for pure 5CB.
In this work, we investigate further aspects of the shear flow response of nematic monodomains containing LCPs. We demonstrate experimentally that the flow-aligning response of 5CB is changed gradually to director-tumbling behavior by a progressive increase of the side-chain LCP concentration. We also show for the first time that the director-tumbling character of 8CB can be suppressed by addition of sufficient quantities of a main-chain LCP. In addition, flow startup, flow reversal, and step flow studies are shown to support the existence of a unique director orientation profile a t a specified shear strain. Results of the influence of temperature on the sign of a3 are also presented. Finally, we carry out a numerical analysis of the periodicity, amplitude, and the shape of the stress response waveform to extract certain viscosity coefficients associated with director-tumbling and flow-aligning be- haviors.
Rheological Characterization of Director Dynamics 339
MSHMA
Figure 2. Molecular structures of the liquid crystal polymers and nematic solvents used in this study.
2. Experimental Section A Rheometrics RFS8500 fluid rheometer, equipped with a 10
gcm transducer was used to perform the rheological measure- ments. To ensure a constant shear strain throughout the sample, a stainless steel cone and plate fixture (angle 0.02 rad; diameter 5 mm) was utilized as the sample cell. The sample thickness at the perimeter of the cell is 500 pm. The inner surfaces of the cone and plate assembly were treated with a 0.35% w/v solution of lecithin (Epikuron, Lucas Meyer Inc.) in ethanol to achieve surface anchoring for homeotropic alignment?' We indepen- dently verified that a uniform homeotropic monodomain can be obtained in a glass cell of thickness 600 pm using the same surface treatment. The sample temperature was controlled by a circu- lating thermal bath with temperature control accurate to within 0.1 OC. 8CB and 5CB were purchased from BDH Chemicals and used as received. A Carl Zeiss optical polarizing microscope, equipped with a Mettler FP82 hot stage and a Mettler FP800 central processor, was used to evaluate the miscibility of the LCP/LMMN mixtures and the phase transition temperatures for the materials. The nematic to isotropic transition temper- atures TNJ were determined to be 35.0 "C for 5CB and 39.8 O C
for 8CB. The smectic A to nematic transition temperature T s ~ - N was found to be 33.3 O C for 8CB. The chemical structures of the LCPs used are shown in Figure 2. The side-chain LCP is poly- [6-(4-methoxy-a-methylstilbene-4'-yl)oxyl hexyl methacrylate] (MSHMA) and the main-chain LCP consists of mesogenic groups, 1-(4-hydroxy-4'-biphenyl)-2-(4-hydroxyphenyl)bute, separated by flexible spacers of 15 methylene units (TPB-15). Both side- chain and main-chain LCPs were synthesized by Professor Virgil Percec and co-workers and have been characterized previously.- MSHMA has a molecular weight of M. = 12 000 with Mw/M. = 1.35. TPB-15 has a molecular weight of M. = 30 000 with Mw/ M , = 2.12. These twoLCPs were found miscible with thenematic solvents 5CB and 8CB in the entire concentration range.25pa Our studies were performed over a concentration range of 0 4 . 5 % w/w for MSHMA and 04.0% w/w for PBT-15. The mixtures have TN-I in the range 0-2.0 O C higher than that of solvents and exhibit a narrow biphasic region (<3.0 "C) depending on concentration.
For observation of the transient response to shear flow, three different types of measurements were performed (i) flow startup; (ii) step flow; (iii) flow reversal. In the flow startup measurements, the homeotropic monodomain in ita rest state was subjected to a constant shear rate y at time t = 0, and the torque applied on the cone was measured to evaluate the average shear stress or, equivalently, the apparent viscosity of the sample. Since the measured torque must exceed 0.1 % of the full scale of 10 gcm to ensure an adequate signal-to-noise ratio, the lower limit of the shear rate permissible is about 4 s-l for the nematic solvents and about 1 s-1 for the mixtures. The shear rate range in our experiments is located in the constant steady-state viscosity plateau region, as confirmed by steady shear rate sweep mea- surements; thus, the linear ELP theory is applicable. In the flow reversal measurements, the torque signal was recorded by an
340 Gu and Jamieson
0.80 I
Macromolecules, Vol. 27, No. 2, 1994
0.20 20 5:0 d o 15'0 2d.0 25.0 30.0 3;.0
STRAIN Figure 3. Comparison between theoretical calculation and experimental observation of director tumbling in transient shear flow of pure 8CB: (-) 2D linear ELP model neglecting.elaaticity; (e) measured result at AT = TN-I - T = 4.8 "C and y = 16 s-*. The oscillation amplitude decays with strain, but the periodicity remains constant. Good agreement between calculation and experiment is found, up to approximately 8 strain unita and with regard to the positions of the maxima and minima over the first five oscillations.
X-Y chart recorder through a cable output at the rear panel of the rheometer, while the rate sweep operation in steady shear mode waa utilized in two shear directions. In the measurements of step flow, the specimen experiencing stress oscillation at a specified shear rate is suddenly subjected to a different shear rate while maintaining the direction of shear, and the shear stress is recorded as a function of time.
3. Results and Discussion A. Transient Flow Behavior of MSHMAI5CB
Mixtures. 8CB is a nematic material which has a positive a3 over a major part of its nematic temperature range. Its viscoelastic properties have been well characterized, and thus it provides an ideal model system for rheological characterization of director-tumbling behavior. In Figure 3, we exhibit the transient response of this material to a simple shear flow in a cone and plate geometry. The apparent viscosity of 8CB is shown as a function of strain a t AT = TN-I - T = 4.8 "C, together with a least-squares fit of the data to eqs 12 and 14. After the shear rate jumps from 0 to a constant value 16 s-l a t t = 0, the measured apparent viscosity shows several oscillations with an increase of strain. The peak-to-peak amplitude of the first oscillation, Aq, defined as the difference between the first maximum and the following minimum, is about 0.4 P. Since it is known that, a t AT = 4.8 "C, 8CB has cy3 > 0, these oscillations can certainly be related to the director- tumbling phenomenon. From Figure 3, it is evident that the theoretical model based on eqs 12 and 14 fits the data rather well, except for the observed decrease of the tumbling amplitude with increasing strain. As discussed in more detail later, this damping effect may be due to several factors including out-of-plane motion of the director, the suppressive effect of the increasing elastic torque, and/or the appearance of polydomain structure. In Figure 3, it can be further seen that there is a small time lag of 30ms, corresponding to about 0.5 strain unit, between time zero and the calculated first viscosity minimum. This time lag is due to a mechanical inertia effect, since the servo needs a finite period of time to accelerate to a constant shear rate. Details of the fitting procedure will be discussed later. Here we simply note that there are four viscosity coefficients involved in the fits: the Leslie Coefficients a1, a2, and a3 and the Miesowicz viscosity T)b. The twist viscosity 71, that is, the quantity a3 - a2, was measured indeppndently by dynamic light scattering from
0.2 0 0'3F 30 60 90 120 150 STRAIN
Figure 4. Director-tumbling behavior observed for 4.5 7% w/w MSHMA/5CB at different shear rates (AT = 10.0 "C). The oscillation periodicity clearly shows a strain scaling law, and the existence of double-peak features similar to that for 8CB is evident in the initial oscillation cycles.
a homeotropic monodomain under application of an ac electric field.26 Thus, there are only three independent parameters in the fitting procedure. The fitting values are y1 = 0.60 P, cy1 = 1.14 P, a2 = -0.51 P, a3 = 0.092 P, and T)b = 0.35 P. These results agree very well with literature values for 8CB reported by Kneppe et a1.32741
By dissolving a small amount of the side-chain LCP MSHMA into 5CB, the shear flow response of the nematic is changed from shear-aligning to director-tumbling. In Figure 4, the transient shear behavior of the MSHMAI 5CB mixture a t c = 4.5% wlw is shown at temperature T = 26.0 "C (AT = 10.0 "C) for four shear rates: y = 4, 8, 16, and 32 s-l. Evidently, the oscillatory stress response of the mixture is very similar to that observed for the director-tumbling LMMN, 8CB. There are two significant features of this oscillatory response worthy of mention here: one is that the strain periodicity of the oscillations remains at a constant value (yp = 14.2 f 0.3), not only at increasing strains but also for different shear rates, sug- gesting that the tumbling process scales with the shear strain in the shear rate range utilized in our experiments. The other feature is that, after q reaches the first minimum, a double peak always follows the minima of 11 for several oscillation cycles. These features are qualitatively con- sistent with the theoretical model which describes the tumbling transient flow behavior of 8CB. For the 4.5 ?4 w/w MSHMAIBCB mixture, the steady-state apparent viscosity, observed a t sufficiently large strains, is 0.38 P. The initial oscillation amplitude is about 0.13 P, about 30% of the steady-state apparent viscosity. As observed for 8CB,37 the oscillation amplitude attenuates with the strain. We also found that, for consecutive applications of shear, the oscillation amplitude depends on the rest time, which is defined as the time interval between cessation and reapplication of shear. The recovery process exhibits an exponential time dependence, and, typically, the mixture takes about 10-15 min to revert back to the original homeotropic ~ r i e n t a t i o n . ~ ~ An estimation of the size L of the flow-induced structure can be made from the relation L = ( K ~ / T ) ~ / ~ , where K is the appropriate elastic
Macromolecules, Vol. 27, No. 2, 1994 Rheological Characterization of Director Dynamics 341
0.5 I
0.3 '
0.2.
0.3 { f
h
ATd3.g.C
0.3.
0.2 1 m I ATd.24:
I I
0 20 40 60 80 100 STRAIN
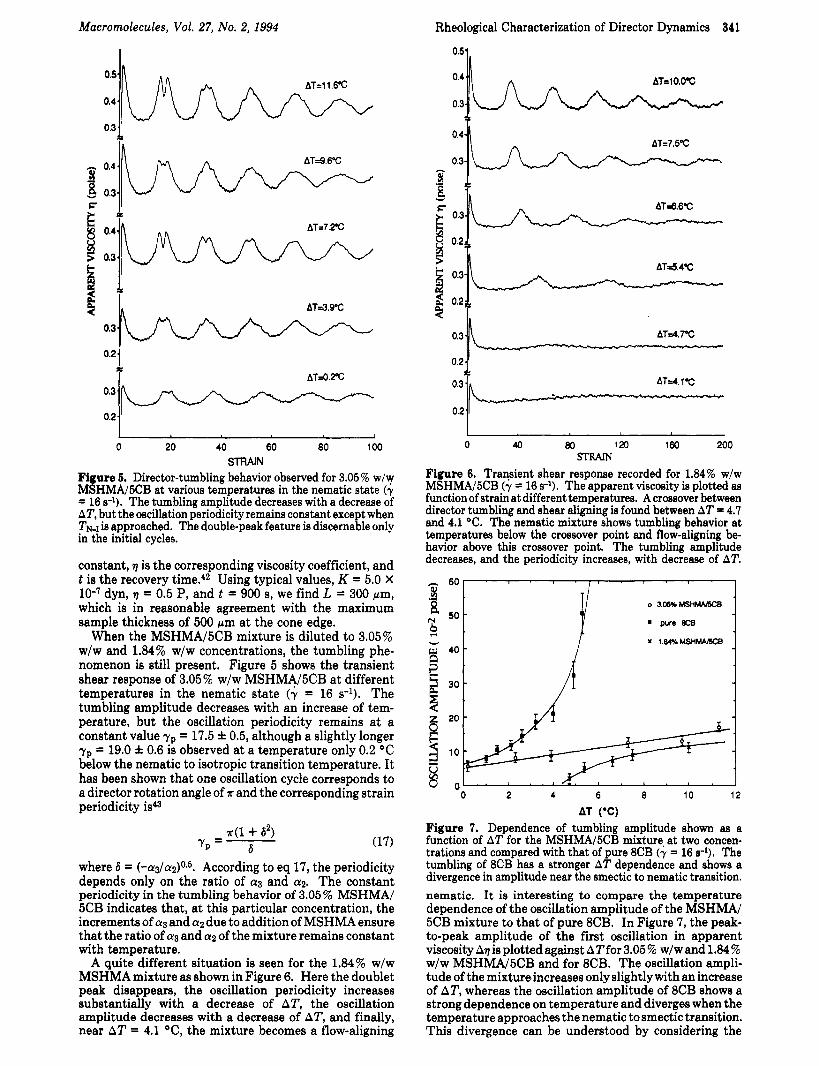
Figure 5. Director-tumbling behavior observed for 3.05% w/w MSHMA/5CB at various temperatures in the nematic state (y = 16 8-l). The tumbling amplitude decreases with a decrease of AT, but the oscillation periodicity remains constant except when TN-1 is approached. The double-peak feature is discernable only in the initial cycles.
constant, r] is the corresponding viscosity coefficient, and t is the recovery time.42 Using typical values, K = 5.0 X le7 dyn, r] = 0.5 P, and t = 900 s, we find L = 300 pm, which is in reasonable agreement with the maximum sample thickness of 500 pm at the cone edge.
When the MSHMAI5CB mixture is diluted to 3.05% w/w and 1.84% w/w concentrations, the tumbling phe- nomenon is still present. Figure 5 shows the transient shear response of 3.05% w/w MSHMAIBCB at different temperatures in the nematic state (y = 16 s-l). The tumbling amplitude decreases with an increase of tem- perature, but the oscillation periodicity remains at a constant value yp = 17.5 f 0.5, although a slightly longer yp = 19.0 f 0.6 is observed at a temperature only 0.2 "C below the nematic to isotropic transition temperature. I t has been shown that one oscillation cycle corresponds to a director rotation angle of s and the corresponding strain periodicity is43
- a(1 + 62)
7, - 6 (17)
where 6 = According to eq 17, the periodicity depends only on the ratio of a3 and 012. The constant periodicity in the tumbling behavior of 3.05% MSHMAI 5CB indicates that, a t this particular concentration, the increments of a3 and a2 due to addition of MSHMA ensure that the ratio of a3 and a2 of the mixture remains constant with temperature.
A quite different situation is seen for the 1.84% w/w MSHMA mixture as shown in Figure 6. Here the doublet peak disappears, the oscillation periodicity increases substantially with a decrease of AT, the oscillation amplitude decreases with a decrease of AT, and finally, near AT = 4.1 "C, the mixture becomes a flow-aligning
AT=lO.OT: 0.4.
0.3-
AT=7.5'C
0.3
P ATS.6S:
0.3
ATS.4C 0.3-
0.3. AT-4.1 g:
0.2.
0 40 80 120 160 200 STRAIN
Figure 6. Transient shear response recorded for 1.84% w/w MSHMA/BCB (y = 16 s-l). The apparent viscosity is plotted as function of strain at different temperatures. A crossover between director tumbling and shear aligning is found between AT = 4.7 and 4.1 "C. The nematic mixture shows tumbling behavior at temperatures below the crossover point and flow-aligning be- havior above this crossover point. The tumbling amplitude decreases, and the periodicity increases, with decrease of AT.
N '' 50
5
I ' ' ' ' I ' ' ' ' ' ' I
" 0 2 4 6 8 10 12
AT ('C) Figure 7. Dependence of tumbling amplitude shown as a function of AT for the MSHMAIBCB mixture, at two concen- trations and compared with that of pure 8CB (y = 16 8-l). The tumbling of 8CB has a stronger AT dependence and shows a divergence in amplitude near the smectic to nematic transition. nematic. I t is interesting to compare the temperature dependence of the oscillation amplitude of the MSHMAI 5CB mixture to that of pure 8CB. In Figure 7, the peak- to-peak amplitude of the first oscillation in apparent viscosity Aqisplottedagainst ATfor3.05% wlwand 1.84% w/w MSHMAI5CB and for 8CB. The oscillation ampli- tude of the mixture increases only slightly with an increase of AT, whereas the oscillation amplitude of 8CB shows a strong dependence on temperature and diverges when the temperature approaches the nematic to smectic transition. This divergence can be understood by considering the
Gu and Jamieson
0.7 1 I
0.6tA i
i i
5CB 0.3
0.2 p i
0.11 I
0 8 16 24 32 40 STRAIN
Figure% At 1.20% w/w concentration, MSHMA/5CB appearing a a floyaligning nematic over its entire nematic temperature range (7 = 16 s-l). Ita transient shear flow response is similar to that of pure 5CB. A shear stress overshoot appears at a shear strain of about 1, and a steady state is reached after 10 strain units.
dependence of the oscillation amplitude on the related viscosity coefficients of 8CB. Setting 6 = 0 and 1r14 in eq 12 and taking the difference between the two calculated values, we have
It has been previously reported that, for 8CB, both a1 and a3 diverge as the temperature approaches TS.N.6'32 Thus, based on eq 18, the oscillation amplitude in the apparent viscosity must also diverge near TSN. For the MSHMAI 5CB mixtures, no such divergence was found, since the mixtures do not have a smectic phase. From eq 18, an approximate estimation of Aq can be made. Because the polymer concentration is very low, the magnitude of the change in the viscosity coefficients appearing in eq 18 is small and can be neglected. I t then follows that a2 is the dominant factor which contributes to Aq, since it is about 1 order larger than a1 and a3 for 5CB.44 We may therefore write Aq = -a2/4, where a2 is the solvent value. Comparing the measured value of Aq (-0.20 P) in the tumbling response of a 3.05 5% w/w MSHMA/5CB mixture, as shown in Figure 7, to the value of a2 (-0.84 P) for 5CB reported by Skarp et al. a t AT = 10 0C,44 good agreement is found. When the MSHMA/5CB mixture was further diluted to a concentration of 1.20% w/w, the sample exhibits transient shear flow behavior characteristic of a flow- aligning nematic a t all temperatures in the nematic state. In Figure 8, the apparent viscosity of 1.20% w/w MSHMAi 5CB is compared with that of pure 5CB at a shear rate of 16 s-1, and AT = 10.0 OC, deep in the nematic state. I t is clear that no oscillatory response is present. Instead, as for pure 5CB, a single stress overshoot peak appears, following the inception of flow. This flow-aligning behavior of the mixture indicates that the MSHMA concentration of 1.20 % w/w is below the concentration threshold required to switch the sign of a3 and induce director tumbling in the mixture over the entire nematic temperature range.
To provide further support that the stress oscillations observed in the transient response of the mixture to simple shear are not due to some unknown instability but are due to director tumbling, step flow experiments were per- formed on a 3.05% w/w MSHMA/5CB solution. If the director orientation profile or the director rotation angle is a unique function of shear strain, as predicted by the theoretical model, then a sudden change of the shear rate
Macromolecules, Vol. 27, No. 2, 1994
88
t O ( I I
0 3 6 9 12 15 TIME (s)
101 I
-~ ~
0 2 4 6 8 10 TIME (s)
Figure 9. Transient stress response to step-up flow (a change inshear rate from4 to 16 s-l) compared for 3.05% wlw MSHMA/ 5CB (AT = 10.0 "C) and for 8CB (AT = 4.8 OC): (a) for MSHMA/ 5CB, the shear rate is stepped at t = 4.40 s, corresponding to director orientation angle 0 = ?r. (b) For MSHMA/SCB, the shear rate is stepped at t = 6.60 s, corresponding to 6 = 3?r/2. (c ) For 8CB, the shear rate is stepped at t = 6.66 s, corresponding to 6 = 5r i2 .
to a different constant value at any moment during the oscillation should not disrupt the director orientation profile and the coherent strain scaling of the variation in the apparent viscosity. The results are shown in Figure 9 in the form of shear stress plotted against time. In Figure 9a, at t = 4.40 s, the shear rate is changed from 4 to 16 s-l. The strain at which the shear rate is changed corresponds to a director rotation angle of a; i.e., the director is oriented
Macromolecules, Vol. 27, No. 2, 1994
s 40 i o -
6
i 3 - g -2-
-4 -
I
i
60 TIME (s)
---r*--c*c
Rheological Characterization of Director Dynamics 343
T-----7
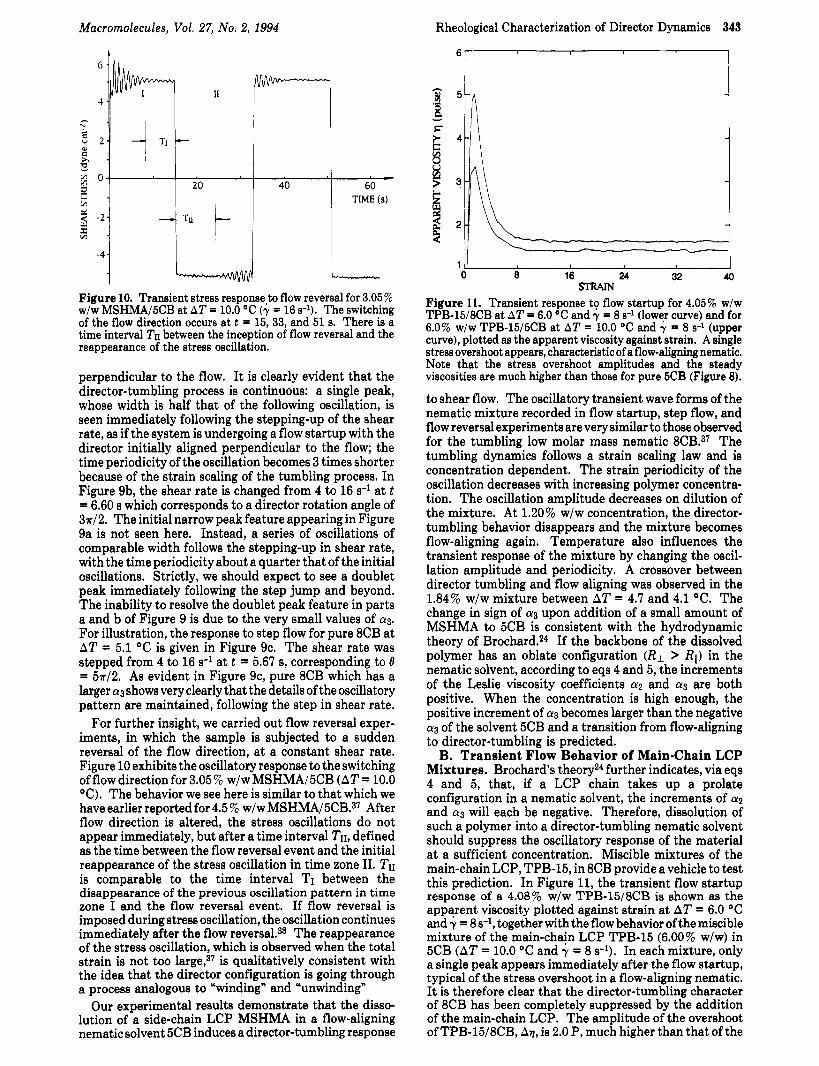
Figure 10. Transient stress responseto flow reversal for 3.05% w/w MSHMA/5CB at AT = 10.0 "C (y = 16 s-l). The switching of the flow direction occurs at t = 15, 33, and 51 s. There is a time interval TII between the inception of flow reversal and the reappearance of the stress oscillation.
perpendicular to the flow. It is clearly evident that the director-tumbling process is continuous: a single peak, whose width is half that of the following oscillation, is seen immediately following the stepping-up of the shear rate, as if the system is undergoing a flow startup with the director initially aligned perpendicular to the flow; the time periodicity of the oscillation becomes 3 times shorter because of the strain scaling of the tumbling process. In Figure 9b, the shear rate is changed from 4 to 16 s-1 at t = 6.60 s which corresponds to a director rotation angle of 3d2. The initial narrow peak feature appearing in Figure 9a is not seen here. Instead, a series of oscillations of comparable width follows the stepping-up in shear rate, with the time periodicity about a quarter that of the initial oscillations. Strictly, we should expect to see a doublet peak immediately following the step jump and beyond. The inability to resolve the doublet peak feature in parts a and b of Figure 9 is due to the very small values of as. For illustration, the response to step flow for pure 8CB at AT = 5.1 "C is given in Figure 9c. The shear rate was stepped from 4 to 16 s-l a t t = 5.67 s, corresponding to 0 = 5?r/2. As evident in Figure 9c, pure 8CB which has a larger a3 shows very clearly that the details of the oscillatory pattern are maintained, following the step in shear rate.
For further insight, we carried out flow reversal exper- iments, in which the sample is subjected to a sudden reversal of the flow direction, at a constant shear rate. Figure 10 exhibits the oscillatory response to the switching of flow direction for 3.05% w/w MSHMA/5CB (AT = 10.0 "C). The behavior we see here is similar to that which we have earlier reported for 4.5 % w/w MSHMA/5CB.37 After flow direction is altered, the stress oscillations do not appear immediately, but after a time interval TU, defined as the time between the flow reversal event and the initial reappearance of the stress oscillation in time zone 11. 7'11 is comparable to the time interval TI between the disappearance of the previous oscillation pattern in time zone I and the flow reversal event. If flow reversal is imposed during stress oscillation, the oscillation continues immediately after the flow reversal.% The reappearance of the stress oscillation, which is observed when the total strain is not too large,37 is qualitatively consistent with the idea that the director configuration is going through a process analogous to "winding" and "unwinding"
Our experimental results demonstrate that the disso- lution of a side-chain LCP MSHMA in a flow-aligning nematic solvent 5CB induces a director-tumbling response
Figure 11. Transient response to flow startup for 4.05% w/w TPB-l5/8CB at AT = 6.0 "C and y = 8 8-l (lower curve) and for 6.0% w/w TPB-l5/5CB at AT = 10.0 "C and y = 8 s-1 (upper curve), plotted as the apparent viscosity against strain. A single stress overshoot appears, characteristic of a flow-aligning nematic. Note that the stress overshoot amplitudes and the steady viscosities are much higher than those for pure 5CB (Figure 8).
to shear flow. The oscillatory transient wave forms of the nematic mixture recorded in flow startup, step flow, and flow reversal experiments are very similar to those observed for the tumbling low molar mass nematic 8CB.37 The tumbling dynamics follows a strain scaling law and is concentration dependent. The strain periodicity of the oscillation decreases with increasing polymer concentra- tion. The oscillation amplitude decreases on dilution of the mixture. At 1.20% w/w concentration, the director- tumbling behavior disappears and the mixture becomes flow-aligning again. Temperature also influences the transient response of the mixture by changing the oscil- lation amplitude and periodicity. A crossover between director tumbling and flow aligning was observed in the 1.84% w/w mixture between AT = 4.7 and 4.1 "C. The change in sign of a3 upon addition of a small amount of MSHMA to 5CB is consistent with the hydrodynamic theory of B r ~ c h a r d . ~ ~ If the backbone of the dissolved polymer has an oblate configuration (RL > RII) in the nematic solvent, according to eqs 4 and 5, the increments of the Leslie viscosity coefficients (112 and (113 are both positive. When the concentration is high enough, the positive increment of a3 becomes larger than the negative a3 of the solvent 5CB and a transition from flow-aligning to director-tumbling is predicted.
B. Transient Flow Behavior of Main-Chain LCP Mixtures. Brochard's theory24 further indicates, via eqs 4 and 5, that, if a LCP chain takes up a prolate configuration in a nematic solvent, the increments of cy2 and a3 will each be negative. Therefore, dissolution of such a polymer into a director-tumbling nematic solvent should suppress the oscillatory response of the material a t a sufficient concentration. Miscible mixtures of the main-chain LCP, TPB-15, in 8CB provide avehicle to test this prediction. In Figure 11, the transient flow startup response of a 4.08% w/w TPB-l5/8CB is shown as the apparent viscosity plotted against strain a t AT = 6.0 "C and y = 8 s-l, together with the flow behavior of the miscible mixture of the main-chain LCP TPB-15 (6.00% w/w) in 5CB (AT = 10.0 "C and y = 8 s-l). In each mixture, only a single peak appears immediately after the flow startup, typical of the stress overshoot in a flow-aligning nematic. I t is therefore clear that the director-tumbling character of 8CB has been completely suppressed by the addition of the main-chain LCP. The amplitude of the overshoot of TPB-l5/8CB, AT, is 2.0 P, much higher than that of the
Gu and Jamieson
3.0 I
~
'"wu 1.2 h i 0 Y
0 0 16 24 32 40 STRAM
Figure 12. Transient response to flow startup for 2.0% w/w TPB-l5/8CB at different temperatures (AT = 1.5,3.8, 5.4, and 6.4 "C, y = 16 s-l). With an increase of AT, both the overshoot amplitude and the steady viscosity increase systematically, though the flow-aligning character of the mixture does not change.
1.20% w/w side-chain LCP mixture and pure 5CB (Figure 8). The steady-state viscosity is 1.4 P, again much higher than that of the 1.20% w/w side-chain LCP mixture and pure 5CB. A single stress overshoot peak, similar to that observed for the 4.08% w/w TPB-15/8CB mixture, was also found for the 6.0% w/w TPB-l5/5CB mixture. The amplitude A7 is about 3.4 P and the steady apparent viscosity is 1.6 P, in each case somewhat higher than the corresponding values for 4.08% w/w TPB-l5/8CB, re- flecting the higher TPB-15 concentration.
Upon dilution of the TPB-l5/8CB mixture to 2.00% w/w concentration, there was still no evidence for director tumbling in the transient response function, as shown in Figure 12. Here, the apparent viscosity of the mixture is plotted as a function of strain for different temperatures in the nematic state. Evidently, both the amplitude of the stress overshoot and the steady apparent viscosity increase with an increase of AT. The increment of the steady apparent viscosity of this 2.00% w/w mixture is about 4 times larger than that of the 3.05 % w/w MSHMAI 5CB, indicating that the effective hydrodynamic volume of the main-chain LCP is larger than that of the side- chain LCP. Efforts will be made in the following section to quantitatively relate the shape of the transient response function to specific viscosity coefficients of the mixtures. When the polymer concentration is further diluted to 0.48% w/w in 8CB, an interesting temperature-dependent crossover between tumbling and flow-aligning behavior is found, analogous to that observed in the 1.84% w/w side- chain LCP/5CB mixture, as shown in Figure 13. At AT = 6.0 "C, the mixture clearly exhibits director-tumbling, as evidenced by the presence of the characteristic oscil- lations, including doublet peaks, in the transient shear response. The initial oscillation amplitude is compara- tively large: Aq = 1.3 P, indicating that the mixture is near TSN, at which Aq diverges as seen in Figure 7 for pure 8CB. When ATdecreases to 5.2 "C, more oscillatory cycles are seen, and the oscillation periodicity doubles compared with that a t AT = 6.0 "C. When AT is decreased further to 4.4 "C, the oscillation periodicity becomes 4 times longer than that a t AT = 6.0 "C. The crossover between tumbling and flow-aligning occurs between AT = 4.4 and 4.0 "C as the oscillation has totally disappeared at the latter temperature. At AT < 4.0 "C, the mixture shows flow-aligning behavior.
Our rheological investigation of the TPB-l5/8CB mix- ture indicates that dissolution of a sufficient quantity of
Macromolecules, Vol. 27, No. 2, 1994
0 1' 1
0 20 40 60 80 100
STRAIN Figure 13. Crossover between director-tumbling and flow- aligning whenTPB-l5/8CB isdilutedto aconcentration of0.48% w/w. At AT > 4.0 "C, the mixture shows tumbling behavior; at AT 5 4.0 "C, a single stress overshoot is evident, characteristic of a flow-aligning nematic (y = 16 s-l).
a main-chain LCP in a director-tumbling nematic solvent can indeed suppress the tumbling behavior and convert the mixture into a flow-aligning nematic. The increase of the apparent viscosity is much larger than those due to the addition of a side-chain LCP MSHMA into 5CB. A crossover between director-tumbling and flow-aligning is found between AT = 4.4 and 4.0 "C at concentration c = 0.48 % w/ w.
C. Quantitative Analysis of the Transient Shear Response of LCP/LMMN Mixtures. Clearly the 08- cillatory waveforms in the director-tumbling response which we observe for the LCP/LMMN nematic mixtures are highly structured. The question naturally arises as to whether these waveforms can be quantitatively analyzed in terms of the linear ELP hydrodynamic theory embodied in eqs 12,14, and 15. The oscillatory responses observed in our studies have a higher information content than those reported for lyotropic liquid crystal polymer solutions and thermotropic liquid crystal polymer As noted earlier, our results contain features which are indeed very similar to those predicted by the linear ELP theory for simple shear deformation of a homeotropic monodomain of 8CB. In particular, the "doublet peak" characteristic appears in the numerical prediction of the transient response to shear flow of 8CB at high Erickson numbers under director-tumbling conditions.20 The doublet arises directly from the difference in the absolute values of a 2 and (113. As indicated by eqs 13 and 14, the director rotation speed is dominated by a2 when the director is near the vertical position (8 = nr) and is dominated by a3 when the director is near the horizontal positions (6 = ma/2, m = odd). A small (113 value means that the director spends a longer time passing through the horizontal position. Thus the shear stress maxima corresponding to 6 = f m r f 4 ( m = odd) occur relatively close to the strain locations which correspond to vertical positions of the director, and the
Macromolecules, Vol. 27, No. 2, 1994
doublet peak effect appears. When a2 = -a3 the director rotation speed is essentially constant and a single- frequency oscillation should be observed. This has been experimentally confirmed by us in a study of the transient shear response of pure 8CB near its smectic to nematic transition where a2 = -a3.45 According to eq 12, the oscillation amplitude Aq depends on the viscosity coef- ficients al, a2, and a3, and the time-averaged viscosity depends on the viscosity coefficients qb, a2, and ag. Thus we can determine these coefficients by appropriate analysis of the experimental data.
Efforts of this kind were made by Yang and Shinel7 to estimate the Leslie viscosity coefficients for a lyotropic poly(n-hexyl isocyanate) (PHIC) solution. However, in their study, the fitting was limited to the first oscillation peak because of a lack of subsequent oscillation ~yc1es.l~ We note that a parallel-plate sample fixture was used in their experiments which may lead to destructive inter- ference between stress oscillations with different strain scaling frequencies. In our investigation, a unique shear rate is specified by the angular velocity of the plate relative to the cone. The dimensionless velocity VO is then the Erickson number:20
where uo is the velocity of the moving plate, d the sample thickness, and K11 the splay elastic constant. In the analysis of Burghardt and Fuller,20 the presence of the doublet peak is evident when E, is larger than 300. In our experimental geometry, E, is proportional to the square of the radial distance r in the sample from the center of the cone. If the angular velocity is chosen as 0.16 rad s-1 corresponding to a shear rate of 8 s-l for 8CB at AT = 3 "C, using literature values of ( ~ 2 ~ and K1114~ the Erickson numberE,varies typically from 325 to 32 500, as the sample thickness increases from 50 pm at the center to 500 pm at the edge of the conelplate. Considering the dominant contribution of the shear stress from the edge region to the torque (torque dF 0: r2 dr), the effective value of VO is around lo4 in our experiments. Furthermore, in the cone and plate arrangement, the macroscopic strain is constant, a t a given shear rate, throughout the entire sample volume. Therefore, an extended oscillatory re- sponse and the presence of the doublet peak features is clearly to be expected. Since the cone angle is very small (B = 1.15") and the sample thickness is much larger than the coherence length over which the surface anchoring influence is effective, a homeotropic orientation condition remains a good approximation. The observed strain scaling in the oscillation periodicity and the continuity of the stress waveform in step flow are clear confirmation that the peaks and valleys in the stress oscillation correspond to particular director orientation angles. In our observations, however, while the periodicity of the oscillation remains constant, the amplitude of the oscil- lation decays to zero with an increase of strain. Apparently, the director rotates with a constant mean angular velocity until the tumbling amplitude decays to zero.
As noted earlier, a possible mechanism which leads to this attenuation is the increase of elastic torque due to the continual "winding up" of the director orientation profiles. With increasing rotation, the director orientation profile becomes more distorted and there will be a gradual increase in the nematic elastic energy until the oscillation in the shear stress attenuates to zero. However, if the shear rate is high enough, the elastic suppression of the tumbling is not severe in the first few oscillation cycles. Thus a numerical curve-fitting procedure which involves only the hydrodynamic torques can be utilized, in principle, to extract the pertinent viscosity coefficients. Indeed, the
Rheological Characterization of Director Dynamics 345
success of such an analysis is demonstrated in Figure 3, for pure 8CB, for which these viscosities are known. For flow-aligning nematics, the neglect of elasticity is safer, since the increase in the elastic distortion energycan occur only within the initial few strain units where it should be negligible. Additionally, we pointed out that, in the ELP model, the director is assumed to be always located in the shear plane. This is a potential oversimplification because there is a distinct possibility that the director may go out of the shear plane.33334 Theoretical analysis by B ~ r g h a r d t ~ ~ indicates that the oscillation amplitude attenuates and that the depth of the minima at 6 = mr/2 (m is odd) diminishes relative to those at 6 = n ~ , leading to a gradual disappearance of the doublet peak as the director moves out off the shear plane. Importantly, however, the oscillation periodicity remains constant.47 This behavior is quite consistent with the changes observed in our experiments as the strain increases (Figure 3). Our flow reversal experiments indicate that, in the conelplate geometry, if the director moves out of the shear plane, a switch in the flow direction is able to bring it back toward the shear plane again. However, in our previous study37 of flow reversal in 4.5% w/w MSHMA/5CB, we found that, if the sample is sheared too long (at least 3 times longer than the time duration of the oscillatory response), then the stress oscillation does not reappear after flow reversal. Apparently, a critical value of the total strain exists. When this value is exceeded, flow reversal does not lead to tumbling. This indicates that an out-of-plane process may indeed occur, but with a time scale which is much longer than that of the tumbling phenomenon. The presence of a polydomain texture is another possible factor which may influence the tumbling amplitude, since the magnitude of the oscillation diminishes in the polydomain case, as noted by Yang and Shine.17 To gain more detailed insight into director dynamics during shear deformation, we need to resort to additional experimental techniques such as rheooptical measurements.
In numerical curve fitting of the transient response, four independent viscosity coefficients appear in eq 12. We find that one of these coefficients, specifically from a1, a2, and ag, must be independently measured in order to obtain an unambiguous solution. Therefore, using dynamic light scattering with application of an ac electric fieldF6 we measured y1 = a3 - a2 for the LCP mixtures. Shown in Figure 14 are the twist viscosities of 3.05% w/w MSHMAI 5CB and 2.0% w/w TPB-l5/8CB, together with those of 5CB and 8CB, plotted as a function of temperature. The main-chain LCP shows a much larger viscosity increase than the side-chain LCP, despite having a lower concen- tration. Using a least-squares algorithm in a three- parameter fitting to eqs 12,14, and 15, we then obtained a1, a2, ag, and q b for both director-tumbling and flow- aligning LCP mixtures. In Figures 15 and 16, examples are given for the curve fits to the tumbling response of 3.05% w/w and 1.84% w/w MSHMA/5CB mixtures, a t AT = 7.5 "C, and to the flow-aligning response of 2.0% w/w TPB-1518CB at AT = 6.4 "C. The increments in the viscosity coefficients associated with these fittings are listed in Table 1.
According to Figure 15, when the LCP concentration is reduced from 3.05% wlw to 1.84% wlw, the oscillation periodicity is doubled and the double-peak feature dis- appears. The curvature near the strain region which corresponds to 0 = */2 becomes flatter, indicating asmaller hydrodynamic torque is experienced by the director and a slower director rotation speed. The most sensitive parameter in the fitting is the ratio 6 = -a3/a2 which determines the strain periodicity of the oscillations. The precision in the calculated viscosity coefficients is deter-
346 Gu and Jamieson Macromolecules, Vol. 27, No. 2, 1994
o*5w '
0.0' ' ' " ' ' " ' ' ' ' 0 2 4 6 8 10 12
AT ('C)
B v '& 0 2.O%TPB/8CS 3
n I I 0 2 4 6 8
AT ("C) Figure 14. Results of dynamic light scattering under application of an ac electric field shown for MSHMA/SCB and TPB-15/ 8CB. The twist viscosities of the mixture are compared with those of the solvents at different temperatures. A comparatively high viscosity increase is produced in the case of the main-chain LCP TPB-15.
A 0 1 0.06 f 0.03 0.06 f 0.03 -1.24 f 0.15 h 2 -0.113 f 0.04 -0.062 f 0.04 -5.27 f 0.30 ha3 0.067 f 0.002 0.044 f 0.002 -0.40 f 0.03 A? 1 0.180 f 0.04 0.106 f 0.04 4.87 f 0.30 Allb 0.058 f 0.04 0.048 f 0.04 0.074 f 0.08 A71/Aa3 2.7 f 0.7 2.4 f 1.0 --12.2 f 1.6 haa/AVb 1.2 * 0.9 0.9 f 0.8 -5.4 f 5.9
mined by fitting data up to the leading edge of the second oscillation peak. In Figures 15 and 16, the initial minima of the calculated viscosities do not appear a t time zero. As noted earlier, this delay in instrument response arises from the inertia of the rheometer servo and does not contribute significantly to the fitting errors, since it can be corrected by a zero-time shift. The uncertainties in Table 1 for most viscosity increments are comparatively large since they reflect the differences between values for the mixtures and solvents.
Bearing in mind the large uncertainties in Table 1, a comparison can be made between the measured viscosity increments and the predictions of the Brochard model. First, the increments in cy3 for the solutions, induced by addition of only a few percent of LCP, are larger in magnitude and of opposite sign to the cy3 values of the corresponding solvents. This reflects the dramatic chang- es, demonstrated in this work, in the transient shear responses for the LCP mixtures compared to the solvents. According to R r ~ c h a r d ? ~ uia eq 5, anisotropic polymer chain configurations must be present in order to have such changes in the sign of cy3. Specifically, Rl > Rli for the side-chain LCP MSHMA, and RI < Ri; for the main-chain
0,200 0.0 5.0 10.0 15.0 20.0 25.0 30.0
STRAIN
0.500 T I
1
8 0.250 4 4
I
I i
0.200 i 0 10 20 30 40 50 60 70
STRAIN Figure 15. Comparison between theoretical fits and experi- mental results on the oscillatory tumbling response shown for MSHMAI5CB at concentrations of (a) 3.05% w/w (9 = 16 s-l, AT = 7.2 O C ) and (b) 1.84% w/w (y = 16 s-l, AT = 7.5 "C). The periodicity becomes longer, and the double peak in the exper- imental datadisappears at the lower concentration. The accuracy of the fit is good at smaller strains y < 15 in a and y < 35 in b.
'.I 2.0 4.3 6.0 8.3 10.0 STRAIN
Figure 16. Theoretical fits and experimental results on the flow- aligning response of 2.0% w/w TPB-l5/8CB at AT = 6.4 "C and y = 16 s-l.
LCP TPB-15. This is qualitatively in accord with the results of our earlier light scattering experiment^.^^^' Second, according to eqs 1, 3, and 5, we may write
(20)
From Table 1, we have A, < 0 for the main-chain LCP mixture, consistent with the prolate condition RL < Rile Using the more precise estimate based on Ay1/Aa3, for the main-chain LCP TPB-15, Rl/Ril = 0.28. The picture for
A , = - = - - A71 A% - R L 2 - R,12 A'Ys Aqb R12
Macromolecules, Vol. 27, No. 2, 1994
the side-chain LCP mixtures in Table 1 is not so clear due to the relatively large uncertainties. In fact, for side-chain LCP mixtures, the observations that Aa2 < 0 and A71/Aa3 > 1, beyond any experimental uncertainty, are funda- mentally inconsistent with the Brochard prediction, as can be seen by comparing eqs 4 and 20. If the side-chain LCP core is indeed oblate, Aa2 should be positive. This suggests that an improved theoretical description is required when the chain anisotropy is small.
The curve-fitting results indicate that by using the 2D linear ELP description, the viscosity coefficients a1, a2, a3, and Ob can be extracted with reasonable precision from the transient shear responses of both director-tumbling and shear-aligning nematics, provided an independent determination of the twist viscosity is made. The ratio of the increments of Leslie coefficients A f f 3 / h p can be unambiguously and precisely measured in the director- tumbling case. Brochard's theory qualitatively explains the change in sign of a3 upon dissolution of LCPs in nematic solvents but appears to need further refinement in order to quantitatively describe the phenomenon.
4. Conclusion
We examined the transient shear flow responses of nematic monodomains containing two LCPs with different architectures. The addition of a side-chain LCP MSHMA to an originally flow-aligning nematic (5CB) induces director-tumbling responses in flow startup, step flow, and flow reversal. In contrast, dissolution of a main-chain LCP (TPB-15) in a director-tumbling nematic solvent 8CB suppresses the tumbling behavior of the mixture. Director- tumbling LCP mixtures show a characteristic oscillatory response which scales and decays with shear strain, similar to the rheological behavior of pure 8CB, whereas a single stress overshoot is present in the shear response of flow- aligning LCPmixtures, as also observed in pure 5CB. With a change in the sample temperature, a crossover between director-tumbling and flow-aligning was found at certain LCP concentrations for both side-chain and main-chain LCP mixtures. Using the 2D model based on linear ELP theory, the transient responses of both tumbling and aligning systems were numerically analyzed to extract the associated viscosity coefficients. For pure 8CB, the curve- fitting results are consistent with the literature values. The switch in sign of the Leslie coefficient as, that is, the distinct rheological behavior of the solutions relative to that of the solvents, can be qualitatively explained by Brochard's theory, provided that an oblate configuration in the polymer backbone is present for side-chain LCP MSHMA in 5CB and a prolate configuration exists for the main-chain LCP TPB-15 in 8CB.
Acknowledgment. We are grateful to the National Science Foundation for support of this research through the Material Research Group Award DMR MRG 01845. We owe special thanks to Professor Virgil Percec and his students, who synthesized and kindly provided us with the liquid crystal polymers. We also thank Drs. S. Q. Wang,
Rheological Characterization of Director Dynamics 347
W. R. Burghardt, A. D. Shine, and M. Srinivasirao for helpful comments.
References and Notes (1) de Gennes, P.-G. The Physics of Liquid Crystals; Clarendon:
(2) Carlsson, T. Mol. Cryst. Liq. Cryst. 1984,104, 307. (3) Gahwiller, Ch. Phys. Reu. Lett. 1972, 28, 1554. (4) Pieranski, P.; Guyon, E. Phys. Reu. Lett. 1974, 32, 924. (5) Cladis, P. E.; Torza, S. Phys. Reu. Lett. 1974, 35, 1283. (6) Skarp, K.; Carlsson, T.; Lagerwall, S. T.; Stebler, B. Mol. Cryst.
(7) Clark, M. G.; Saunders, F. C.; Shanks, I. A,; Leslie, F. M. Mol.
(9) Moldenaers, P.; Fuller, G.; Mewis, J. Macromolecules 1989,22,
(IO) Berry, G. C.; Srinivasarao, M. J. Stat. Phys. 1991, 62, 1041. (11) Moldenaers, P.; Yanase, H.; Mewis, J. J. Rheol. 1991,35,1681. (12) Burghardt, W. R.; Fuller, G. Macromolecules 1991,24, 2546. (13) Hongladarom, K.; Burghardt, W. R. Macromolecules 1993,26,
(14) Grizzuri, N.; Lavella, S.; Cicarelli, P. J. Rheol. 1990, 34, 1293. (15) Chow, A. W.; Hamlin, R. D.; Ylitalo, C. M. Macromolecules
(16) Yang, I. K.; Shine, A. D. J. Rheol. 1992, 36, 1079. (17) Yang, I. K.; Shine, A. D. Macromolecules 1993,26, 1529. (18) Viola, G. G.; Baird, D. G. J. Rheol. 1986, 30, 601. (19) Guskey, S. M.; Winter, H. H. J. Rheol. 1991, 35, 1191. (20) Burghardt, W. R.; Fuller, G. J. Rheol. 1990, 34, 959. (21) Larson, R. G.; Doi, M. J. Rheol. 1991, 35, 539. (22) Mattoussi, H.; Ober, R.; Veyssie, M.; Finkelmann, H. Europhys.
Lett. 1986,2 (3), 233. (23) D'Allest, J. F.; Maissa, P.; ten Bosch, A.; Sixou, P.; Blumstein,
A.; Blumstein, R.; Teixeira, J.; Noirez, L. Phys. Reu. Lett. 1988, 61, 2562.
(24) Brochard, F. J. Polym. Sci., Polym. Phys. Ed. 1979,17, 1367. (25) Gu, D.; Jamieson, A. M.; Rosenblatt, C. M.; Tomazos, D.; Lee,
M.; Percec, V. Macromolecules 1991,24, 2385. (26) Gu. D.; Jamieson. A. M.: Kawasumi. M.: Lee. M.: Percec. V.
Oxford, U.K., 1974; Chapter 5.
Liq. Cryst. 1981, 66, 199.
Cryst. Liq. Cryst. 1981, 70, 195.
291.
960.
785.
1992,25, 7135.
. . . , Liq. cryst. 1992,12, 961:
Phys. I I Fr. 1993, 3, 937. (27) Gu, D.; Smith, S. R.; Jamieson, A. M.; Lee, M.; Percec, V. J.
(28) Erickson. J. L. Arch. Ration. Mech. Anal. 1960.4. 231. (29j Leslie, F.' M. J. Mech. Appl. Math. 1966, 19, 357.' (30) Parodi, 0. J. Phys. 1970,31, 581. (31) de Jeu, W. H. Physical Properties of Liquid Crystalline
(32) Kneppe, H.; Schneider, F.; Sharma, N. K. Ber. Bunsen-Ges.
(33) Pieranski, P.; Guyon, E.; Pikin, S. A. J. Phys. Colloq. 1976, C l ,
(34) (a) Zuniga, I.; Leslie, F. M. Europhys. Lett. 1989, 9, 689. (b)
(35) Carlson, T.; Skarp, K. Liq. Cryst. 1986, I , 455. (36) Chandrasekhar, S. Liquid Crystals; Cambridge University
(37) Gu, D.; Jamieson, A. M.; Wang, S. Q. J. Rheol. 1993, 37,985. (38) Percec, V.; Tomazos, D. J. Polym. Sci., Part A: Polym. Chem.
(39) Percec, V.; Kawasumi, M. Macromolecules 1992,24, 6318. (40) Chen, F. L.; Jamieson, A. M. Liq. Cryst. 1993, 15, 171. (41) Kneppe, H.; Schneider, F.; Sharma, N. K. J. Chem. Phys. 1982,
Materials; Gordon and Breach: London, 1980; p 105.
Phys. Chem. 1981,85, 784.
3.
Zuniga, I.; Leslie, F. M. Liq. Cryst. 1989, 5, 725.
Press: Cambridge, U.K., 1977; p 152.
1989, 27, 999.
77, 3203. I , . " . .
1983,94, 359. '
(43) Marrucci. G. Pure ADD!. Chem. 1985.57. 1545. (44) Skarp, K.'; Lagerwall: S. T.; Stebler, B. Mol. Cryst. Liq. Cryst.
(45) Gu, D.; Jamieson, A. M., to be published. (46) Bradshaw, M. J.; Raynes, E. P. J. Phys. 1985, 46, 1513. (47) Burghardt, W. R. Ph.D. Thesis, Stanford University, Stanford,