63
1 © This is a licensed product of Ken Research and should not be copied
| Date post: | 31-Mar-2016 |
| Category: |
Documents |
| Upload: | ken-research |
| View: | 215 times |
| Download: | 0 times |
1
© This is a licensed product of Ken Research and should not be copied

2
© This is a licensed product of Ken Research and should not be copied
TABLE OF CONTENTS
1. Asia-Pacific Insurance Industry
1.1. Industry Introduction
1.2. Asia-Pacific Insurance Value Chain
1.3. Asia-Pacific Insurance Market Size by Direct Written Premium, 2005-2012P
1.4. Asia-Pacific Insurance Market Segmentation
1.4.1. By Geography, 2005-2012P
1.4.2. By Life and Non Life, 2005-2012P
2. Japan Insurance Industry
2.1. Japan Insurance Market Size by Direct Written Premium, FY’2005-FY’2012
2.2. Japan Insurance Government Regulations
2.3. Japan Life Insurance Market
2.3.1. Japan Life Insurance Market Size, FY’2005-FY’2012
2.3.1.1. Japan Life Insurance Segmentation, FY’2005-FY’2012
2.3.2. Market Share of Major Life Insurers in Japan, FY’2012
2.3.3. Japan Life Insurance Market Future Outlook and Projections, FY’ 2013-FY’2016
2.4. Japan Non-Life Insurance Market
2.4.1. Japan Non-Life Insurance Market Size, FY’2005-FY’2012
2.4.2. Japan Non Life Distribution Channel, FY’2010-FY’2012
2.4.3. Non-Life Insurance Segmentation, FY’2005-FY’2012
2.4.3.1. Japan Automobile Insurance Industry
2.4.3.1.1. Japan Automobile Insurance Market Size and Introduction, FY’2005-FY’2012
2.4.3.1.2. Automobile Insurance Segmentation, FY’2005-FY’2012
2.4.3.1.3. Market Share of Domestic and Foreign Insurers in Automobile Insurance Industry in Japan, FY’2012

3
© This is a licensed product of Ken Research and should not be copied
2.4.3.1.4. Japan Automobile Insurance Market Future Outlook and Projection, FY’2013-FY’2016
2.4.3.2. Japan Fire Insurance Industry
2.4.3.2.1. Japan Fire Insurance Market Size and Introduction, FY’2005-FY’2012
2.4.3.2.2. Market Share of Domestic and Foreign Insurers in Fire Insurance Industry in Japan, FY’2012
2.4.3.2.3. Japan Fire Insurance Market Future Outlook and Projections, FY’2013-FY’2016
2.4.4. Japan Personal Accident Insurance Industry
2.4.4.1. Japan Personal Accident Insurance Market Size and Introduction, FY’2005-FY’2012
2.4.4.2. Market Share of Domestic and Foreign Insurers in Personal Accident Insurance Industry in Japan, FY’2012
2.4.4.3. Japan Personal Accident Insurance Market Future Outlook and Projections, FY’2013-FY’2016
2.4.5. Japan Marine and Inland Transit Insurance Industry
2.4.5.1. Japan Marine and Inland Transit Insurance Market Size and Introduction, FY’2005-FY’2012
2.4.5.2. Marine and Inland Transit Insurance Segmentation, FY’2005-FY’2012
2.4.5.3. Market Share of Domestic and Foreign Insurers in Marine and Inland Transit Insurance Industry in Japan, FY’2012
2.4.5.4. Japan Marine and Inland Transit Insurance Market Future Outlook and Projections, FY’2013-FY’2016
2.4.6. Japan Miscellaneous Casualty Insurance Industry
2.4.6.1. Japan Miscellaneous Casualty Insurance Market Size and Introduction, FY’2005-FY’2012
2.4.6.2. Miscellaneous Casualty Insurance Segmentation, FY’2005-FY’2012
2.4.6.3. Market Share of Domestic and Foreign Insuerers in Miscellaneous Casualty Insurance Industry in Japan, FY’2012
2.4.6.4. Japan Miscellaneous Casualty Insurance Market Future Outlook and Projections, FY’2013-FY’2016
4
© This is a licensed product of Ken Research and should not be copied
2.4.7. Japan Non-Life Insurance Market Future Outlook and Projections, FY’2013-FY’2016
2.4.8. Japan Insurance Industry Future Outlook and Projections, FY’2013-FY’2016
2.4.9. Company Profile of Major Players in Japan Life Insurance Industry
2.4.9.1. Japan Post Insurance
Company Profile
Business Strategies
Financial Performance
2.4.9.2. Nippon Life Insurance
Company Overview
Business Strategies
Financial Performance
2.4.9.3. Meiji Yasuda Life Insurance
Company Overview
Business Strategies
Financial Performance
2.4.10. Company Profile of Major Players in Japan Non-Life Insurance Industry
2.4.10.1. MS&AD Insurance
Company Overview
Business Strategies
Financial Performance
2.4.10.2. NKSJ Holdings
Company Overview
Business Strategies
Financial Performance
2.4.10.3. Tokio Marine and Nichido Fire
Company Overview
5
© This is a licensed product of Ken Research and should not be copied
Business Strategies
Financial Performance
2.4.11. Japan Insurance Industry Macro-Economic Indicators: Historical and Projections
2.4.11.1. Japan Population, 2005-2016
2.4.11.2. GDP Performance in Japan, 2005-2016
2.4.11.3. Healthcare Expenditure of Japan, 2005-2016
2.4.11.4. Total Vehicle in-Use in Japan, 2005-2016
3. China Insurance Industry
3.1. China Insurance Market Size by Direct Written Premium, 2005-2012
3.2. China Government Regulations in Insurance Industry
3.3. China Life Insurance Market
3.3.1. China Life Insurance Market Size, 2005-2012
3.3.1.1. China Life insurance Claim Paid, 2005-2012
3.3.2. Market Share of Major Life Insurers in China, 2012
3.3.3. Company Profile of Major Players in China Life Insurance Industry
3.3.3.1. China Life Insurance
Company Profile
Business Strategies
Financial Performance
3.3.3.2. Ping An Life Insurance
Company Profile
Business Strategies
Financial Performance
3.3.3.3. New China Life Insurance
Company Profile
Business Strategies
6
© This is a licensed product of Ken Research and should not be copied
Financial Performance
3.3.4. China Life Insurance Market Future Outlook and Projections, 2013-2016
3.4. China Non-Life Insurance Market
3.4.1. China Non-Life Insurance Market Size, 2005-2012
3.4.2. Non-Life Insurance Segmentation, 2005-2012
3.4.2.1. China Property and Casualty Insurance Industry
3.4.2.1.1. China Property and Casualty Insurance Market Size, 2005-2012
3.4.2.1.2. China Property and Casualty insurance Claim Paid, 2005-2012
3.4.2.1.3. Property and Casualty Insurance Segmentation, 2005-2012
3.4.2.1.4. Market Share of Major Property and Casualty Insurers in China, 2012
3.4.2.1.5. China Property and Casualty Insurance Market Future Outlook and Projections, 2013-2016
3.4.2.2. China Motor Insurance Industry
3.4.2.2.1. China Motor Insurance Market Size, 2005-2012
3.4.2.2.2. China Motor Insurance Market Future Outlook and Projections, 2013-2016
3.4.2.3. China Commercial Property Insurance Industry
3.4.2.3.1. China Commercial Property Insurance Market Size, 2005-2012
3.4.2.3.2. China Commercial Property Insurance Market Future Outlook and Projections, 2013-2016
3.4.2.4. China Agricultural Insurance Industry
3.4.2.4.1. China Agricultural Insurance Market Size, 2005-2012
3.4.2.4.2. China Agricultural Insurance Market Future Outlook and Projections, 2013-2016
3.4.2.5. China Liability Insurance Industry
3.4.2.5.1. China Liability Insurance Market Size, 2005-2012
3.4.2.5.2. China Liability Insurance Market Future Outlook and Projections, 2013-2016
3.4.2.6. China Credit Insurance Industry
3.4.2.6.1. China Credit Insurance Market Size, 2005-2012

7
© This is a licensed product of Ken Research and should not be copied
3.4.2.6.2. China Credit Insurance Market Future Outlook and Projections, 2013-2016
3.4.2.7. China Accident Insurance Industry
3.4.2.7.1. China Accident Insurance Market Size, 2005-2012
3.4.2.7.2. China Accident Insurance Market Future Outlook and Projections, 2013-2016
3.4.2.8. China Cargo Insurance Industry
3.4.2.8.1. China Cargo Insurance Market Size, 2005-2012
3.4.2.8.2. China Cargo Insurance Market Future Outlook and Projections, 2013-2016
3.4.2.9. China Health Insurance Industry
3.4.2.9.1. China Health Insurance Market Size, 2005-2012
3.4.2.9.2. China Health insurance Claim Paid, 2005-2012
3.4.2.9.3. China Health Insurance Market Future Outlook and Projections, 2013-2016
3.4.3. Market Share of Major Non Life Insurers in China, 2011
3.4.4. Company Profile of Major Players in China Non-Life Insurance Industry
3.4.4.1. Public Insurance Company of China (PICC)
Company Profile
Business Strategies
Financial Performance
3.4.4.2. China Pacific Insurance (CPIC)
Company Profile
Business Strategies
Financial Performance
3.4.5. China Non-Life Insurance Market Future Outlook and Projections, 2013-2016
3.5. China Insurance Industry Future Projections, 2013-2016
3.6. China Insurance Industry Macro-Economic Indicators: Historical and Projections
3.6.1. China Population, 2005-2016
3.6.2. GDP of China, 2005-2016
8
© This is a licensed product of Ken Research and should not be copied
3.6.3. Healthcare Expenditure of China, 2005-2016
3.6.4. Total Vehicle in Use in China, 2007-2016
4. South Korea Insurance Industry
4.1. South Korea Insurance Market Size by Direct Written Premium, FY’2005-FY’2012P
4.2. South Korea Insurance Government Regulations
4.3. South Korea Life Insurance Market
4.3.1. South Korea Life Insurance Market Size, FY’2005-FY’2012P
4.3.2. Life Insurance Segmentation, FY’2005-FY’2012P
4.3.3. Market Share of Domestic and Foreign Insurers in Life Insurance Industry in South Korea, FY’2011
4.3.4. Company Profile of Major Players in South Korea Life Insurance Industry
4.3.4.1. Samsung Life
Company Profile
Business Strategies
Financial Performance
4.3.4.2. Hanwha Life
Company Profile
Business Strategies
4.3.4.3. Kyobo Life
Company Profile
Business Strategies
Financial Performance
4.3.5. South Korea Life Insurance Market Future Outlook and Projections, FY’2013-FY’2016
4.4. South Korea Non-Life Insurance Market
4.4.1. South Korea Non-Life Insurance Market Size, FY’2005-FY’2012P
4.4.2. South Korea Non Life Distribution Channel, FY’ 2005-FY’2011

9
© This is a licensed product of Ken Research and should not be copied
4.4.3. Non-Life Insurance Segmentation, FY’2005-FY’2012P
4.4.3.1. South Korea Long Term Insurance Industry
4.4.3.1.1. South Korea Long Term Insurance Market Size, FY’2005-FY’2012P
4.4.3.1.2. Long Term Insurance Segmentation, FY’2005-FY’2012P
4.4.3.1.3. South Korea Long Term insurance Claim Paid, FY’2005-FY’2011
4.4.3.1.4. Market Share of Domestic and Foreign Insurers in Long Term Insurance Industry in South Korea, FY’2011
4.4.3.1.5. South Korea Long Term insurance Market Future Outlook and Projections, FY’2013-FY’2016
4.4.3.2. South Korea Automobile Insurance Industry
4.4.3.2.1. South Korea Automobile Insurance Market Size, FY’2005-FY’2012P
4.4.3.2.2. Automobile Insurance Segmentation, FY’2005-FY’2012P
4.4.3.2.3. South Korea Automobile insurance Claim Paid, FY’2005-FY’2011
4.4.3.2.4. Market Share of Domestic and Foreign Insuerers in Automobile Insurance Industry in South Korea, FY’2011
4.4.3.2.5. South Korea Automobile insurance Market Future Outlook and ProjectionS, Fy’2013-FY’2016
4.4.3.3. South Korea Casualty Insurance Industry
4.4.3.3.1. South Korea Casualty Insurance Market Size, FY’2005-FY’2012P
4.4.3.3.2. South Korea Casualty insurance Claim Paid, FY’2005-FY’2012P
4.4.3.3.3. Market Share of Domestic and Foreign Insurers in Casualty Insurance Industry in South Korea, FY’2011
4.4.3.3.4. South Korea Casualty insurance Market Future Outlook and Projections, FY’2013-FY’2016
4.4.3.4. South Korea Guarantee Insurance Industry
4.4.3.4.1. South Korea Guarantee Insurance Market Size, FY’2005-FY’2012P
4.4.3.4.2. South Korea Guarantee insurance Claim Paid, FY’2005-FY’2011

10
© This is a licensed product of Ken Research and should not be copied
4.4.3.4.3. Market Share of Domestic and Foreign Insurers in Guarantee Insurance Industry in South Korea, FY’2011
4.4.3.4.4. South Korea Guarantee insurance Market Future Outlook and Projections, FY’2013-FY’2016
4.4.3.5. South Korea Marine Insurance Industry
4.4.3.5.1. South Korea Marine Insurance Market Size, FY’2005-FY’2012P
4.4.3.5.2. South Korea Marine insurance Claim Paid, FY’2005-FY’2011
4.4.3.5.3. Market Share of Domestic and Foreign Insurers in Marine Insurance Industry in South Korea, FY’2011
4.4.3.5.4. South Korea Marine insurance Market Future Outlook and Projections, FY’2013-FY’2016
4.4.3.6. South Korea Fire Insurance Industry
4.4.3.6.1. South Korea Fire Insurance Market Size, FY’2005-FY’2012P
4.4.3.6.2. South Korea Fire insurance Claim Paid, FY’2005-FY’2011
4.4.3.6.3. Market Share of Domestic and Foreign Insurers in Fire Insurance Industry in South Korea, FY’2011
4.4.3.6.4. South Korea Fire insurance Market Future Outlook and Projections, FY’2013-FY’2016
4.4.4. Market Share of Major Non Life Insurers in South Korea, FY’2011
4.4.5. Company Profile of Major Players in South Korea Non-Life Insurance Industry
4.4.5.1. Hyundai Marine and Fire Insurance
Company Profile
Business Strategies
Financial Performance
4.4.5.2. LIG Insurance
Company Profile
Business Strategies
Financial Performance

11
© This is a licensed product of Ken Research and should not be copied
4.4.6. South Korea Non-Life Insurance Market Future Outlook and Projections, FY’2013-FY’2016
4.5. South Korea Insurance Industry Future Outlook and Projections, FY’2013-FY’2016
4.6. South Korea Insurance Industry Macro-Economic Indicators: Historical and Projections
4.6.1. South Korea Population, 2005-2016
4.6.2. GDP of South Korea, 2005-2016
4.6.3. Healthcare Expenditure of South Korea, 2005-2016
4.6.4. Total Vehicle Production in South Korea, 2005-2016
5. Taiwan Insurance Industry
5.1. Taiwan Insurance Market Size by Direct Written Premium, 2005-2012P
5.2. Taiwan Insurance Government Regulation
5.3. Taiwan Life Insurance Market
5.3.1. Taiwan Life Insurance Market Size, 2005-2012P
5.3.2. Taiwan Life Insurance Distribution Channel, 2009-2011
5.3.3. Life Insurance Segmentation, 2005-2012P
5.3.4. Market Share of Major Life Insurers in Taiwan, 2011
5.3.5. Company Profile of Major Players in Taiwan Life Insurance Industry
5.3.5.1. Cathay Life
Company Profile
Business Strategies
Financial Performance
5.3.5.2. Fubon Life
Company Profile
Business Strategies
Financial Performance
5.3.5.3. Nan Shan Life

12
© This is a licensed product of Ken Research and should not be copied
Company Profile
Business Strategies
Financial Performance
5.3.6. Taiwan Life Insurance Market Future Outlook and Projections, 2013-2016
5.4. Taiwan Non-Life Insurance Market
5.4.1. Taiwan Non-Life Insurance Market Size, 2005-2012P
5.4.2. Non-Life Insurance Segmentation, 2005-2012P
5.4.2.1. Taiwan Automobile Insurance Industry
5.4.2.1.1. Taiwan Automobile Insurance Market Size, 2005-2012P
5.4.2.1.2. Automobile Insurance Segmentation, 2005-2012P
5.4.2.1.3. Market Share of Major Automobile Insurers in Taiwan, 2011
5.4.2.1.4. Taiwan Automobile insurance Market Future Outlook and Projections, 2013-2016
5.4.2.2. Taiwan Property and Casualty Insurance Industry
5.4.2.2.1. Taiwan Property and Casulaty Insurance Market Size, 2005-2012P
5.4.2.2.2. Property and Casualty Insurance Segmentation, 2005-2012P
5.4.2.2.3. Market Share of Major Property and Casulaty Insurers in Taiwan, 2011
5.4.2.2.4. Taiwan Property and Casualty insurance Market Future Outlook and Projections, 2013-2016
5.4.2.3. Taiwan Fire Insurance Industry
5.4.2.3.1. Taiwan Fire Insurance Market Size, 2005-2012P
5.4.2.3.2. Taiwan Fire Insurance Market Future Outlook and Projections, 2013-2016
5.4.2.4. Taiwan Marine Insurance Industry
5.4.2.4.1. Taiwan Marine Insurance Market Size, 2005-2012P
5.4.2.4.2. Marine Insurance Segmentation, 2005-2012P
5.4.2.4.3. Taiwan Marine insurance Market Future Outlook and Projections, 2013-2016
5.4.2.5. Taiwan Aviation Insurance Industry
13
© This is a licensed product of Ken Research and should not be copied
5.4.2.5.1. Taiwan Aviation Insurance Market Size, 2005-2012P
5.4.2.5.2. Taiwan Aviation Insurance Market Future Outlook and Projections, 2013-2016
5.4.3. Market Share of Major Non Life Insurers in Taiwan, 2011
5.4.4. Company Profile of Major Players in Taiwan Non-Life Insurance Industr
5.4.4.1. Shinkong Insurance
Company Profile
Business Strategies
Financial Performance
5.4.4.2. MSIG Mingtai Insurance
Company Profile
Business Strategies
Financial Performance
5.4.5. Taiwan Non-Life Insurance Market Future Outlook and Projections, 2013-2016
5.5. Taiwan Insurance Industry Future Projections, 2013-2016
5.6. Taiwan Insurance Industry Macro-Economic Indicators: Historical and Projections
5.6.1. Taiwan Population, 2005-2016
5.6.2. GDP of Taiwan, 2005-2016
5.6.3. Healthcare Expenditure of Taiwan, 2005-2016
5.6.4. Total number of Vehicle in Use in Taiwan, 2005-2016
6. India Insurance Industry
6.1. India Insurance Market Size by Direct Written Premium, FY’2005-FY’2012
6.2. India Insurance Government Regulations
6.3. India Life Insurance Market
6.3.1. India Life Insurance Market Size, FY’2005-FY’2012
6.3.2. Life Insurance Segmentation, FY’2005-FY’2012
6.3.3. Market Share of Major Life Insurers in India, FY’2012

14
© This is a licensed product of Ken Research and should not be copied
6.3.4. Company Profile of Major Players in India Life Insurance Industry
6.3.4.1. Life Insurance Corporation
Company Profile
Business Strategies
Financial Performance
6.3.4.2. ICICI Prudential
Company Profile
Business Strategies
Financial Performance
6.3.4.3. SBI Life
Company Profile
Business Strategies
Financial Performance
6.3.5. India Life Insurance Market Future Outlook and Projections, FY’2013-FY’2016
6.4. India Non-Life Insurance Market
6.4.1. India Non-Life Insurance Market Size, FY’2005-FY’2012
6.4.2. Non-Life Insurance Segmentation, FY’2005-FY’2012
6.4.2.1. India Motor Insurance Industry
6.4.2.1.1. India Motor Insurance Market Size, FY’2005-FY’2012
6.4.2.1.2. Motor Insurance Segmentation, 2005-2012
By Public and Private Motor Insurance Direct Written Premium, FY’2005-FY’2012
BY Motor Own Damage and Motor Third Party Insurance Direct Written Premium, FY’2010-FY’2012
6.4.2.1.3. India Automobile Insurance Distribution Channel, FY’ 2010-FY’2012
6.4.2.1.4. Market Share of Major Motor Insurers in India, FY’2012
6.4.2.1.5. India Motor insurance Market Future Outlook and Projection, FY’2013-FY’2016

15
© This is a licensed product of Ken Research and should not be copied
6.4.2.2. India Health Insurance Industry
6.4.2.2.1. India Health Insurance Market Size, FY’2005-FY’2012
6.4.2.2.2. Health Insurance Segmentation, FY’2005-FY’2012
6.4.2.2.3. India Health Insurance Distribution Channel, FY’ 2010-FY’2012
6.4.2.2.4. Market Share of Major Health Insurers in India, FY’2012
6.4.2.2.5. India Health insurance Market Future Outlook and Projections, FY’2013-FY’2016
6.4.2.3. India Fire Insurance Industry
6.4.2.3.1. India Fire Insurance Market Size, FY’ 2005-FY’2012
6.4.2.3.2. Fire Insurance Segmentation, FY’2005-FY’2012
6.4.2.3.3. India Fire Insurance Distribution Channel, FY’ 2010-FY’2012
6.4.2.3.4. Market Share of Major Fire Insurers in India, FY’2012
6.4.2.3.5. India Fire insurance Market Future Outlook and Projections, FY’2013-FY’2016
6.4.2.4. India Marine Insurance Industry
6.4.2.4.1. India Marine Insurance Market Size, FY’2005-FY’2012
6.4.2.4.2. Marine Insurance Segmentation
By Public and Private Insurance Direct Written Premium, FY’2005-FY’2012
By Marine Cargo and Marine Hull Insurance Direct Written Premium, Fy’2010-FY’2012
6.4.2.4.3. India Marine Insurance Distribution Channel, FY’ 2010-FY’2012
6.4.2.4.4. Market Share of Major Marine Insurers in India, FY’2012
6.4.2.4.5. India Marine insurance Market Future Outlook and Projections, FY’2013-FY’2016
6.4.2.5. India Miscellaneous Insurance Industry
6.4.2.5.1. India Miscellaneous Insurance Market Size, FY’2005-FY’2012
6.4.2.5.2. Miscellaneous Insurance Segmentation, FY’2005-FY’2012
By Public and Private Insurance Direct Written Premium, FY’2005-FY’2012
By Crop, Personal Accident and Liability Insurance Direct Written Premium, Fy’2010-FY’2012
16
© This is a licensed product of Ken Research and should not be copied
6.4.2.5.3. India Miscellaneous Insurance Distribution Channel, FY’ 2010-FY’2012
6.4.2.5.4. Market Share of Major Miscellaneous Insurers in India, FY’2012
Market Share of Major Personal Accident Insurers in India, FY’2012
6.4.2.5.5. India Miscellaneous insurance Market Future Outlook and Projections, FY’2013-FY’2016
6.4.3. Market Share of Major Non Life Insurers in India, FY’2012
6.4.4. Company Profile of Major Players in India Non-Life Insurance Industry
6.4.4.1. New India Assurance
Company Profile
Business Strategies
Financial Performance
6.4.4.2. United India Insurance
Company Profile
Business Strategies
Financial Performance
6.4.4.3. India Non-Life Insurance Market Future Outlook and Projections, FY’2013-FY’2016
6.5. India Insurance Industry Future Projections, FY’2013-FY’2016
6.6. India Insurance Industry Macro-Economic Indicators: Historical and Projections
6.6.1. India Population, 2005-2016
6.6.2. GDP of India, 2005-2016
6.6.3. Healthcare Expenditure of India, 2005-2016
6.6.4. Total number of Vehicle in Use in India, 2005-2016
7. Australia Insurance Industry
7.1. Australia Insurance Market Size by Direct Written Premium, FY’2005-FY’2012
7.2. Australia Insurance Government Regulations
7.3. Australia Life Insurance Market
17
© This is a licensed product of Ken Research and should not be copied
7.3.1. Australia Life Insurance Market Size, FY’2005-FY’2012
7.3.2. Australia Life Insurance Market Future Outlook and Projections, FY’2013-FY’2016
7.3.3. Company Profile of Major Players in Australia Life Insurance Industry
7.4. Australia Non-Life Insurance Market
7.4.1. Australia Non-Life Insurance Market Size, FY’2005-FY’2012
7.4.2. Non-Life Insurance Segmentation, FY’2005-FY’2012
7.4.2.1. Australia Health Insurance Industry
7.4.2.1.1. Australia Health Insurance Market Size, FY’2005-FY’2012
7.4.2.1.2. Market Share of Major Health Insurers in Australia, FY’2012
7.4.2.1.3. Australia Health Insurance Market Future Outlook and Projections, FY’2013-FY’2016
7.4.2.2. Australia Motor Vehicle Insurance Industry
7.4.2.2.1. Australia Motor Vehicle Insurance Market Size, FY’2005-FY’2012
7.4.2.2.2. Motor Vehicle Insurance Segmentation, FY’2005-FY’2012
7.4.2.2.3. Market Share of Major Motor Vehicle Insurers in Australia, FY’2012
7.4.2.2.4. Australia Motor Vehicle insurance Market Future Outlook and Projections, FY’2013-FY’2016
7.4.2.3. Australia Household Insurance Industry
7.4.2.3.1. Australia Household Insurance Market Size, FY’2005-FY’2012
7.4.2.3.2. Market Share of Major Household Insurers in Australia, FY’2012
7.4.2.3.3. Australia Household Insurance Market Future Outlook and Projections, FY’2013-FY’2016
7.4.2.4. Australia Liability Insurance Industry
7.4.2.4.1. Australia Liability Insurance Market Size, FY’2005-FY’2012
7.4.2.4.2. Liability Insurance Segmentation, FY’2005-FY’2012
7.4.2.4.3. Australia Liability insurance Market Future Outlook and Projections, FY’2013-FY’2016
18
© This is a licensed product of Ken Research and should not be copied
7.4.2.5. Australia Fire and ISR Insurance Industry
7.4.2.5.1. Australia Fire and ISR Insurance Market Size, FY’2005-FY’2012
7.4.2.5.2. Australia Fire and ISR Insurance Market Future Outlook and Projections, FY’2013-FY’2016
7.4.3. Market Share of Major Non Life Insurers in Australia, FY’2012
7.4.4. Company Profile of Major Players in Australia Non-Life Insurance Industry
7.4.4.1. Suncorp Group
Company Profile
Business Strategies
Financial Performance
7.4.4.2. Insurance Australia Group
Company Profile
Business Strategies
Financial Performance
7.4.5. Australia Non-Life Insurance Market Future Outlook and Projections, FY’2013-FY’2016
7.5. Australia Insurance Industry Future Projections, FY’2013-FY’2016
7.6. Australia Insurance Industry Macro-Economic Indicators: Historical and Projections
7.6.1. Australia Population, 2005-2016
7.6.2. GDP of Australia, 2005-2016
7.6.3. Healthcare Expenditure of Australia, 2005-2016
7.6.4. Total number of Vehicle in Use in Australia, 2005-2016
8. Asia-Pacific Insurance Industry Trends and Developments
9. Asia-Pacific Insurance Industry Future Outlook
9.1. Cause and Effect Relationship Between Dependent and Independent Factors Prevailing in Asia-Pacific Insurance Market
9.2. Asia-Pacific Insurance Industry Future Projections
9.2.3. By Geography, 2013-2016

19
© This is a licensed product of Ken Research and should not be copied
9.2.4. By Life and Non Life, 2013-2016
10. Appendix
10.1. Market Definitions
10.2. Abbreviations
10.3. Research Methodology
Data Collection Methods
Approach
Variables (Dependent and Independent)
Multi Factor Based Sensitivity Model
Final Conclusion
10.4. Disclaimer

20
© This is a licensed product of Ken Research and should not be copied
LIST OF FIGURES
Figure 1: Insurance Value Chain
Figure 2: Asia-Pacific Insurance Market Size on the Basis of Direct Written Premium in USD Million, 2005-2012P
Figure 3: Asia-Pacific Insurance Market Segmentation by Life and non Life on the Basis of Direct Written Premium in Percentage, 2005-2012P
Figure 4: Japan Insurance Market Size on the Basis of Direct Written Premium in USD Million, FY’2005-FY’2012
Figure 5: Japan Life Insurance Market Size on the Basis of Direct Written Premium in USD Million, FY’2005-FY’2012
Figure 6: Japan life Insurance Market Segmentation by Individual Insurance and Annuities, Group Insurance and Annuities and Others on the Basis of Direct Written Premium in Percentage, FY’2005-FY’2012
Figure 7: Market Share of Major Life Insurers on the Basis of Direct Written Premium in Percentage, FY’2012
Figure 8: Japan Life Insurance Market Projections on the Basis of Direct Written Premium in USD Million, FY’2013-FY’2016
Figure 9: Japan Non Life Insurance Market Size on the Basis of Direct Written Premium in USD Million, FY’2005-FY’2012
Figure 10: Japan Non life Insurance Distribution Channel by Agents, Direct Sales and Broker on the Basis of Direct Written Premium in Percentage, FY’2010-FY’2012
Figure 11: Japan Non life Insurance Market Segmentation by Automobile, Fire, Personal Accident, Miscellaneous Casualty, Marine and Inland Transit on the Basis of Direct Written Premium in Percentage, 2005-2012
Figure 12: Japan Automobile Insurance Market Size on the Basis of Direct Written Premium in USD Million, FY’2005-FY’2012
Figure 13: Japan Automobile Insurance Market Size on the Basis of Net Written Premium in USD Million, FY’2005-FY’2012
Figure 14: Japan Automobile Insurance Market Segmentation by Voluntary Automobile, and Compulsory Automobile Liability on the Basis of Direct Written Premium in Percentage, 2005-2012

21
© This is a licensed product of Ken Research and should not be copied
Figure 15: Market Share of Domestic and Foreign Insurers in Automobile Insurance Industry on the Basis of Direct Written Premium in Percentage, FY’2012
Figure 16: Japan Fire Insurance Market Size on the Basis of Direct Written Premium in USD Million, FY’2005-FY’2012
Figure 17: Japan Fire Insurance Market Size on the Basis of Net Written Premium in USD Million, 2005-2012
Figure 18: Market Share of Domestic and Foreign Insurers in Fire Insurance Industry on the Basis of Direct Written Premium in Percentage, FY’2012
Figure 19: Japan Fire Insurance Market Projections on the Basis of Direct Written Premium in USD Million, FY’2013-FY’2016
Figure 20: Japan Personal Accident Insurance Market Size on the Basis of Direct Written Premium in USD Million, FY’2005-FY’2012
Figure 21: Japan Personal Accident Insurance Market Size on the Basis of Net Written Premium in USD Million, FY’2005-FY’2012
Figure 22: Market Share of Domestic and Foreign Insurers in Personal Accident Insurance Industry on the Basis of Direct Written Premium in Percentage, FY’2012
Figure 23: Japan Personal Accident Insurance Market Projections on the Basis of Direct Written Premium in USD Million, FY’2013-FY’2016
Figure 24: Japan Marine and Inland Transit Insurance Market Size on the Basis of Direct Written Premium in USD Million, FY’2005-FY’2012
Figure 25: Japan Marine and Inland Transit Insurance Market Size on the Basis of Net Written Premium in USD Million, FY’2005-FY’2012
Figure 26: Japan Marine and Inland Transit Insurance Market Segmentation by Marine Cargo and Hull and Inland Transit Insurance on the Basis of Direct Written Premium in Percentage, FY’2005-FY’2012
Figure 27: Market Share of Domestic and Foreign Insurers in Marine and Inland Transit Insurance Industry on the Basis of Direct Written Premium in Percentage, FY’2012
Figure 28: Japan Miscellaneous Casualty Insurance Market Size on the Basis of Direct Written Premium in USD Million, FY’2005-FY’2012
Figure 29: Japan Miscellaneous Casualty Insurance Market Size on the Basis of Net Written Premium in USD Million, FY’2005-FY’2012
Figure 30: Market Share of Domestic and Foreign Insurers in Miscellaneous Casualty Insurance Industry on the Basis of Direct Written Premium in Percentage, FY’2012
22
© This is a licensed product of Ken Research and should not be copied
Figure 31: Japan Miscellaneous Casualty Insurance Market Projections on the Basis of Direct Written Premium in USD Million, FY’2013-FY’2016
Figure 32: Japan Non life Insurance Market Projections on the Basis of Direct Written Premium in USD Million, FY’2013-FY’2016
Figure 33: Japan Insurance Market Projections on the Basis of Direct Written Premium in USD Million, 2013-2016
Figure 34: Japan Life Insurance Premium Income of Japan Post Insurance in USD Million, FY’2008-FY’2012
Figure 35: Japan Life Insurance Premium Income of Nippon Life Insurance in USD Million, FY’2005-FY’2012
Figure 36: Japan Life Insurance Premium Income of Meiji Yasuda Life Insurance in USD Million, FY’2005-FY’2012
Figure 37: Japan Life Insurance Net Premium Written of MS&AD Insurance in USD Million, FY’2008-FY’2012
Figure 38: Japan Life Insurance Net Written Premium of NSJK Holdings Insurance in USD Million, FY’2010-FY’2012
Figure 39: Japan Non-Life Insurance Net Written Premium of Tokio Marine and Nichido Fire Insurance in USD Million, FY’2005-FY’2012
Figure 40: Japan Population in Million, 2005-2016
Figure 41: GDP of Japan in USD Million, 2005-2016
Figure 42: Healthcare Expenditure of Japan in USD Million, 2005-2016
Figure 43: Total Vehicle in-Use in Japan in Million, 2005-2016
Figure 44: China Insurance Market Size on the Basis of Direct Written Premium in USD Million, 2005-2012
Figure 45: China Life Insurance Market Size on the Basis of Direct Written Premium in USD Million, 2005-2012
Figure 46: China Life Insurance Market Claim Paid on the Basis of Direct Written Premium in USD Million, 2005-2012
Figure 47: Market Share of Major Life Insurers on the Basis of Direct Written Premium in Percentage, 2012
Figure 48: China Life Insurance Net Written Premium of China Life Insurance Company in USD Million, 2006-2012

23
© This is a licensed product of Ken Research and should not be copied
Figure 49: China Life Insurance Premium Income of Ping An Life Insurance in USD Million, 2008-2012
Figure 50: China Life Insurance Premium Income of New China Life Insurance in USD Million, 2006-2012
Figure 51: China Life Insurance Market Projections on the Basis of Direct Written Premium in USD Million, 2013-2016
Figure 52: China Non Life Insurance Market Size on the Basis of Direct Written Premium in USD Million, 2005-2012
Figure 53: China Non life Insurance Market Segmentation by Property and Casualty and Health Insurance on the Basis of Direct Written Premium in Percentage, 2005-2012
Figure 54: China Property and Casualty Insurance Market Size on the Basis of Direct Written Premium in USD Million, 2005-2012
Figure 55: China Property and Casualty Insurance Market Claim Paid on the Basis of Direct Written Premium in USD Million, 2005-2012
Figure 56: China Property and Casualty Insurance Market Segmentation by Motor, Commercial Property, Agricultural, Liability, Credit, Accident, Cargo and Others Insurance on the Basis of Direct Written Premium in Percentage, 2005-2012
Figure 57: Market Share of Major Property and Casualty Insurers on the Basis of Direct Written Premium in Percentage, 2012
Figure 58: China Property and Casualty Insurance Market Projections on the Basis of Direct Written Premium in USD Million, 2013-2016
Figure 59: China Motor Insurance Market Size on the Basis of Direct Written Premium in USD Million, 2005-2012
Figure 60: China Motor Insurance Market Projections on the Basis of Direct Written Premium in USD Million, 2013-2016
Figure 61: China Commercial Property Insurance Market Size on the Basis of Direct Written Premium in USD Million, 2005-2012
Figure 62: China Commercial Property Insurance Market Projections on the Basis of Direct Written Premium in USD Million, 2013-2016
Figure 63: China Agricultural Insurance Market Size on the Basis of Direct Written Premium in USD Million, 2005-2012
Figure 64: China Agricultural Insurance Market Projections on the Basis of Direct Written Premium in USD Million, 2013-2016

24
© This is a licensed product of Ken Research and should not be copied
Figure 65: China Liability Insurance Market Size on the Basis of Direct Written Premium in USD Million, 2005-2012
Figure 66: China Liability Insurance Market Projections on the Basis of Direct Written Premium in USD Million, 2013-2016
Figure 67: China Credit Insurance Market Size on the Basis of Direct Written Premium in USD Million, 2005-2012
Figure 68: China Credit Insurance Market Projections on the Basis of Direct Written Premium in USD Million, 2013-2016
Figure 69: China Accident Insurance Market Size on the Basis of Direct Written Premium in USD Million, 2005-2012
Figure 70: China Accident Insurance Market Projections on the Basis of Direct Written Premium in USD Million, 2013-2016
Figure 71: China Cargo Insurance Market Size on the Basis of Direct Written Premium in USD Million, 2005-2012
Figure 72: China Cargo Insurance Market Projections on the Basis of Direct Written Premium in USD Million, 2013-2016
Figure 73: China Health Insurance Market Size on the Basis of Direct Written Premium in USD Million, 2005-2012
Figure 74: China Health Insurance Market Claim Paid on the Basis of Direct Written Premium in USD Million, 2005-2012
Figure 75: China Health Insurance Market Projections on the Basis of Direct Written Premium in USD Million, 2013-2016
Figure 76: Market Share of Major Non Life Insurers on the Basis of Direct Written Premium in Percentage, 2011
Figure 77: China Life Insurance Premium Income of Public Insurance Company of China in USD Million, 2005-2011
Figure 78: China Life Insurance Gross Written Premium of China Pacific Insurance in USD Million, 2008-2011
Figure 79: China Non life Insurance Market Projections on the Basis of Direct Written Premium in USD Million, 2013-2016
Figure 80: China Insurance Market Projections on the Basis of Direct Written Premium in USD Million, 2013-2016
Figure 81: China Population in Million, 2005-2016

25
© This is a licensed product of Ken Research and should not be copied
Figure 82: GDP of China in USD Million, 2005-2016
Figure 83: Healthcare Expenditure of China in USD Million, 2005-2016
Figure 84: Total Vehicle in Use in China in Million, 2007-2016
Figure 85: South Korea Insurance Market Size on the Basis of Direct Written Premium in USD Million, FY’2005-FY’2012P
Figure 86: South Korea Life Insurance Market Size on the Basis of Direct Written Premium in USD Million, FY’2005-FY’2012P
Figure 87: South Korea life Insurance Market Segmentation by General and Separate Account on the Basis of Direct Written Premium in Percentage, FY’2005-FY’2012P
Figure 88: Market Share of Domestic and Foreign Insurers in Life Insurance Industry on the Basis of Direct Written Premium in Percentage, FY’2011
Figure 89: South Korea Life Insurance Premium Income of Samsung Life in USD Million, FY’2005-FY’2011
Figure 90: South Korea Life Insurance Premium Income of Kyobo Life in USD Million, FY’2006-FY’2011
Figure 91: South Korea Life Insurance Market Projections on the Basis of Direct Written Premium in USD Million, FY’2013-FY’2016
Figure 92: South Korea Non Life Insurance Market Size on the Basis of Direct Written Premium in USD Million, FY’2005-FY’2012P
Figure 93: South Korea Non life Insurance Distribution Channel by Agents, Solicitors, Company Employees, Bank, Broker and Insurance Pools on the Basis of Direct Written Premium in Percentage, FY’2005-FY’2011
Figure 94: Japan Non life Insurance Market Segmentation by Long Term, Automobile, Casualty, Guarantee, Marine, Fire and others on the Basis of Direct Written Premium in Percentage, FY’2005-FY’2012P
Figure 95: South Korea Long Term Insurance Market Size on the Basis of Direct Written Premium in USD Million, FY’2005-FY’2012P
Figure 96: South Korea Long Term Insurance Market Segmentation by Personal Accident, Health, Property and Others on the Basis of Direct Written Premium in Percentage, FY’2005-FY’2012P
Figure 97: South Korea Long Term Insurance Market Claim Paid on the Basis of Direct Written Premium in USD Million, FY’2005-FY’2011
26
© This is a licensed product of Ken Research and should not be copied
Figure 98: Market Share of Domestic and Foreign Insurers in Long Term Insurance Industry on the Basis of Direct Written Premium in Percentage, FY’2011
Figure 99: South Korea Automobile Insurance Market Size on the Basis of Direct Written Premium in USD Million, FY’2005-FY’2012P
Figure 100: South Korea Automobile Insurance Market Segmentation by Voluntary and Compulsory Auto Liability Insurance on the Basis of Direct Written Premium in Percentage, 2005-2012P
Figure 101: South Korea Automobile Insurance Market Claim Paid on the Basis of Direct Written Premium in USD Million, FY’2005-FY’2011
Figure 102: Market Share of Domestic and Foreign Insurers in Automobile Insurance Industry on the Basis of Direct Written Premium in Percentage, FY’2011
Figure 103: South Korea Casualty Insurance Market Size on the Basis of Direct Written Premium in USD Million, FY’2005-FY’2012P
Figure 104: South Korea Casualty Insurance Market Claim Paid on the Basis of Direct Written Premium in USD Million, FY’2005-FY’2011
Figure 105: Market Share of Domestic and Foreign Insurers in Casualty Insurance Industry on the Basis of Direct Written Premium in Percentage, FY’2011
Figure 106: South Korea Casualty Insurance Market Projections on the Basis of Direct Written Premium in USD Million, FY’2013-FY’2016
Figure 107: South Korea Guarantee Insurance Market Size on the Basis of Direct Written Premium in USD Million, FY’2005-FY’2012P
Figure 108: South Korea Guarantee Insurance Market Claim Paid on the Basis of Direct Written Premium in USD Million, FY’2005-FY’2011
Figure 109: Market Share of Domestic and Foreign Insurers in Guarantee Insurance Industry on the Basis of Direct Written Premium in Percentage, FY’2011
Figure 110: South Korea Guarantee Insurance Market Projections on the Basis of Direct Written Premium in USD Million, FY’2013-FY’2016
Figure 111: South Korea Marine Insurance Market Size on the Basis of Direct Written Premium in USD Million, FY’2005-FY’2012
Figure 112: South Korea Marine Insurance Market Claim Paid on the Basis of Direct Written Premium in USD Million, FY’2005-FY’2011
Figure 113: Market Share of Domestic and Foreign Insurers in Marine Insurance Industry on the Basis of Direct Written Premium in Percentage, FY’2011

27
© This is a licensed product of Ken Research and should not be copied
Figure 114: South Korea Marine Insurance Market Projections on the Basis of Direct Written Premium in USD Million, FY’2013-FY’2016
Figure 115: South Korea Fire Insurance Market Size on the Basis of Direct Written Premium in USD Million, 2005-2012P
Figure 116: South Korea Fire Insurance Market Claim Paid on the Basis of Direct Written Premium in USD Million, FY’2005-FY’2011
Figure 117: Market Share of Domestic and Foreign Insurers in Fire Insurance Industry on the Basis of Direct Written Premium in Percentage, FY’2011
Figure 118: South Korea Fire Insurance Market Projections on the Basis of Direct Written Premium in USD Million, FY’2013-FY’2016
Figure 119: Market Share of Major Insurers in Non Life Insurance Industry on the Basis of Direct Written Premium in Percentage, FY’2011
Figure 120: South Korea Non-Life Insurance Direct Written Premium of Hyundai Marine and Fire Insurance in USD Million, FY’2005-FY’2011
Figure 121: South Korea Non-Life Insurance Direct Written Premium of LIG Insurance in USD Million, FY’2007-FY’2012
Figure 122: South Korea Non life Insurance Market Projections on the Basis of Direct Written Premium in USD Million, FY’2013-FY’2016
Figure 123: South Korea Insurance Market Projections on the Basis of Direct Written Premium in USD Million, FY’2013-FY’2016
Figure 124: South Korea Population in Million, 2005-2016
Figure 125: GDP of South Korea in USD Million, 2005-2016
Figure 126: Healthcare Expenditure of South Korea in USD Million, 2005-2016
Figure 127: Total Vehicle Production in South Korea in Million, 2005-2016
Figure 128: Taiwan Insurance Market Size on the Basis of Direct Written Premium in USD Million, 2005-2012P
Figure 129: Taiwan Life Insurance Market Size on the Basis of Direct Written Premium in USD Million, 2005-2012P
Figure 130: Taiwan Life Insurance Distribution Channel by Banks, Solicitors and Others on the Basis of Direct Written Premium in Percentage, 2009-2011
Figure 131: Taiwan life Insurance Market Segmentation by Life and Annuity on the Basis of Direct Written Premium in Percentage, 2005-2012P
28
© This is a licensed product of Ken Research and should not be copied
Figure 132: Market Share of Major Life Insurers on the Basis of Direct Written Premium in Percentage, 2011
Figure 133: Taiwan Life Insurance Premium Income of Cathay Life Insurance in USD Million, 2005-2011
Figure 134: Taiwan Life Insurance Premium Income of Fubon Life Insurance in USD Million, 2005-2011
Figure 135: Taiwan Life Insurance Premium Income of Nan Shan Life Insurance in USD Million, 2005-2011
Figure 136: Taiwan Non Life Insurance Market Size on the Basis of Direct Written Premium in USD Million, 2005-2012P
Figure 137: Taiwan Non life Insurance Market Segmentation by Health, Accident, Automobile, Fire, Marine, Aviation and Property and Casualty on the Basis of Direct Written Premium in Percentage, 2005-2012P
Figure 138: Taiwan Automobile Insurance Market Size on the Basis of Direct Written Premium in USD Million, 2005-2012P
Figure 139: Taiwan Automobile Insurance Market Segmentation by Voluntary and Compulsory Motor Liability Insurance on the Basis of Direct Written Premium in Percentage, 2005-2012P
Figure 140: Market Share of Major Automobile Insurers on the Basis of Direct Written Premium in Percentage, 2011
Figure 141: Taiwan Property and Casualty Market Size on the Basis of Direct Written Premium in USD Million, 2005-2012P
Figure 142: Taiwan Property and Casualty Insurance Market Segmentation by Accident, Liability, Engineering, Credit, Health and Others on the Basis of Direct Written Premium in Percentage, 2005-2012P
Figure 143: Market Share of Major Property and Casualty Insurers on the Basis of Direct Written Premium in Percentage, 2011
Figure 144: Taiwan Fire Insurance Market Size on the Basis of Direct Written Premium in USD Million, 2005-2012P
Figure 145: Taiwan Fire Insurance Market Projections on the Basis of Direct Written Premium in USD Million, 2013-2016
Figure 146: Taiwan Marine Insurance Market Size on the Basis of Direct Written Premium in USD Million, 2005-2012P
Figure 147: Taiwan Marine Insurance Market Segmentation by Marine Cargo, Marine Hull and Fishing Vessel on the Basis of Direct Written Premium in Percentage, 2005-2012P
29
© This is a licensed product of Ken Research and should not be copied
Figure 148: Taiwan Aviation Insurance Market Size on the Basis of Direct Written Premium in USD Million, 2005-2012P
Figure 149: Taiwan Aviation Insurance Market Projections on the Basis of Direct Written Premium in USD Million, 2013-2016
Figure 150: Market Share of Major Non Life Insurers on the Basis of Direct Written Premium in Percentage, 2011
Figure 151: Taiwan Non-Life Insurance Direct Written Premium of Shinkong Insurance in USD Million, 2005-2011
Figure 152: Taiwan Non-Life Insurance Direct Written Premium of MSIG Mingtai Insurance in USD Million, 2005-2011
Figure 153: Taiwan Non life Insurance Market Projections on the Basis of Direct Written Premium in USD Million, 2013-2016
Figure 154: Taiwan Insurance Market Projections on the Basis of Direct Written Premium in USD Million, 2013-2016
Figure 155: Taiwan Population in Million, 2005-2016
Figure 156: GDP of Taiwan in USD Million, 2005-2016
Figure 157: Healthcare Expenditure of Taiwan in USD Million, 2005-2016
Figure 158: Total Number of Vehicle in Use in Taiwan in Million, 2005-2016
Figure 159: India Insurance Market Size on the Basis of Direct Written Premium in USD Million, FY’2005-FY’2012
Figure 160: India Life Insurance Market Size on the Basis of Direct Written Premium in USD Million, FY’2005-FY’2012
Figure 161: India life Insurance Market Segmentation by Public and Private Insurers on the Basis of Direct Written Premium in Percentage, FY’2005-FY’2012
Figure 162: India life Insurance Market Segmentation by Renewal and First Premium on the Basis of Direct Written Premium in Percentage, FY’2005-FY’2012
Figure 163: Market Share of Major Life Insurers on the Basis of Direct Written Premium in Percentage, FY’2012
Figure 164: India Life Insurance Premium Income of Life Insurance Corporation in USD Million, FY’2005-FY’2012
Figure 165: India Life Insurance Premium Income of ICICI Prudential in USD Million, FY’2005-FY’2012
30
© This is a licensed product of Ken Research and should not be copied
Figure 166: India Life Insurance Premium Income of SBI Life in USD Million, FY’2005-FY’2012
Figure 167: India Life Insurance Market Projections on the Basis of Direct Written Premium in USD Million, FY’2013-FY’2016
Figure 168: India Non Life Insurance Market Size on the Basis of Direct Written Premium in USD Million, FY’2005-FY’2012
Figure 169: Life Non life Insurance Market Segmentation by Motor, Health, Fire, Marine and Others on the Basis of Direct Written Premium in Percentage, FY’2005-FY’2012
Figure 170: India Motor Insurance Market Size on the Basis of Direct Written Premium in USD Million, FY’2005-FY’2012
Figure 171: India Motor Insurance Market Segmentation by Private and Public Insurance on the Basis of Direct Written Premium in Percentage, FY’2005-FY’2012
Figure 172: India Motor Insurance Market Segmentation by Motor Own Damage and Motor Third Party Insurance on the Basis of Direct Written Premium in Percentage, FY’2010-FY’2012
Figure 173: India Motor Insurance Market Distribution Channel by Individual Agent, Direct Business, Brokers, Corporate Agent, Referral Arrangements and Others on the Basis of Direct Written Premium in Percentage, FY’2010-FY’2012
Figure 174: Market Share of Major Motor Insurers on the Basis of Direct Written Premium in Percentage, FY’2012
Figure 175: India Health Insurance Market Size on the Basis of Direct Written Premium in USD Million, FY’2005-FY’2012
Figure 176: India Health Insurance Market Segmentation by Public, Private and Standalone Insurance on the Basis of Direct Written Premium in Percentage, 2005-2012
Figure 177: India Health Insurance Market Distribution Channel by Direct Business, Individual Agent, Brokers, Corporate Agent, Referral Arrangements and Others on the Basis of Direct Written Premium in Percentage, FY’2010-FY’2012
Figure 178: Market Share of Major Health Insurers on the Basis of Direct Written Premium in Percentage, FY’2012
. Figure 179: India Fire Insurance Market Size on the Basis of Direct Written Premium in USD Million, FY’2005-FY’2012
Figure 180: India Fire Insurance Market Segmentation by Public and Private Insurance on the Basis of Direct Written Premium in Percentage, 2005-2012
31
© This is a licensed product of Ken Research and should not be copied
Figure 181: India Fire Insurance Market Distribution Channel by Direct Business, Individual Agent, Brokers, Corporate Agent, Referral Arrangements and Others on the Basis of Direct Written Premium in Percentage, FY’2010-FY’2012
Figure 182: Market Share of Major Fire Insurers on the Basis of Direct Written Premium in Percentage, FY’2012
Figure 183: India Marine Insurance Market Size on the Basis of Direct Written Premium in USD Million, FY’2005-FY’2012
Figure 184: India Marine Insurance Market Segmentation by Public and Private Insurance on the Basis of Direct Written Premium in Percentage, FY’2005-FY’2012
Figure 185: India Marine Insurance Market Segmentation by Marine Cargo and Hull Insurance on the Basis of Direct Written Premium in Percentage, FY’2010-FY’2012
Figure 186: India Marine Insurance Market Distribution Channel by Direct Business, Broker, Individual Agent, Corporate Agent, Referral Arrangements and Others on the Basis of Direct Written Premium in Percentage, FY’2010-FY’2012
Figure 187: Market Share of Major Marine Insurers on the Basis of Direct Written Premium in Percentage, FY’2012
Figure 188: India Miscellaneous Insurance Market Size on the Basis of Direct Written Premium in USD Million, FY’2005-FY’2012
Figure 189: India Miscellaneous Insurance Market Segmentation by Public and Private Insurance on the Basis of Direct Written Premium in Percentage, FY’2005-FY’2012
Figure 190: India Miscellaneous Insurance Market Segmentation by Crop, Personal Accident, Liability and Other Insurance on the Basis of Direct Written Premium in Percentage, FY’2010-FY’2012
Figure 191: India Miscellaneous Insurance Market Distribution Channel by Direct Business, Individual Agent, Broker, Corporate Agent, Referral Arrangements and Others on the Basis of Direct Written Premium in Percentage, FY’2010-FY’2012
Figure 192: Market Share of Major Miscellaneous Insurers on the Basis of Direct Written Premium in Percentage, FY’2012
Figure 193: Market Share of Major Personal Accident Insurers on the Basis of Direct Written Premium in Percentage, FY’2012
Figure 194: Market Share of Major Non Life Insurers on the Basis of Direct Written Premium in Percentage, FY’2012
Figure 195: India Non-Life Insurance Direct Written Premium of New India Assurance in USD Million, FY’2005-FY’2012
32
© This is a licensed product of Ken Research and should not be copied
Figure 196: India Non-Life Insurance Direct Written Premium of United India Insurance in USD Million, FY’2005-FY’2012
Figure 197: India Non life Insurance Market Projections on the Basis of Direct Written Premium in USD Million, FY’2013-FY’2016
Figure 198: India Insurance Market Projections on the Basis of Direct Written Premium in USD Million, 2012-2016
Figure 199: India Population in Million, 2005-2016
Figure 200: GDP of India in USD Million, 2005-2016
Figure 201: Healthcare Expenditure of India in USD Million, 2005-2016
Figure 202: Total Number of Vehicle in Use in India in Million, 2005-2016
Figure 203: Australia Insurance Market Size on the Basis of Direct Written Premium in USD Million, FY’2005-FY’2012
Figure 204: Australia Life Insurance Market Size on the Basis of Direct Written Premium in USD Million, FY’2005-FY’2012
Figure 205: Australia Life Insurance Market Projections on the Basis of Direct Written Premium in USD Million, FY’2013-FY’2016
Figure 206: Australia Non Life Insurance Market Size on the Basis of Direct Written Premium in USD Million, FY’2005-FY’2012
Figure 207: Australia Non life Insurance Market Segmentation by Health, Motor Vehicle, Household, liability, Fire and ISR and Others on the Basis of Direct Written Premium in Percentage, FY’2005-FY’2012
Figure 208: Australia Health Insurance Market Size on the Basis of Direct Written Premium in USD Million, FY’2005-FY’2012
Figure 209: Market Share of Major Non Life Insurers on the Basis of Number of Policies in Percentage, FY’2012
Figure 210: Australia Health Insurance Market Projections on the Basis of Direct Written Premium in USD Million, FY’2013-FY’2016
Figure 211: Australia Motor Vehicle Insurance Market Size on the Basis of Direct Written Premium in USD Million, FY’2005-FY’2012
Figure 212: Australia Motor Vehicle Insurance Market Segmentation by Domestic, CTP and Commercial Motor Vehicle Insurance on the Basis of Direct Written Premium in Percentage, FY’2005-FY’2012
33
© This is a licensed product of Ken Research and should not be copied
Figure 213: Market Share of Major Motor Vehicle Insurers on the Basis of Direct Written Premium in Percentage, FY’2012
Figure 214: Australia Household Insurance Market Size on the Basis of Direct Written Premium in USD Million, FY’2005-FY’2012
Figure 215: Market Share of Major Household Insurers on the Basis of Direct Written Premium in Percentage, FY’2012
Figure 216: Australia Household Insurance Market Projections on the Basis of Direct Written Premium in USD Million, FY’2013-FY’2016
Figure 217: Australia Liability Insurance Market Size on the Basis of Direct Written Premium in USD Million, FY’2005-FY’2012
Figure 218: Australia Liability Insurance Market Segmentation by Public and Product Liability, Employers Liability and Professional Indemnity Insurance on the Basis of Direct Written Premium in Percentage, FY’2005-FY’2012
Figure 219: Australia Fire and ISR Insurance Market Size on the Basis of Direct Written Premium in USD Million, FY’2005-FY’2012
Figure 220: Australia Fire and ISR Insurance Market Projections on the Basis of Direct Written Premium in USD Million, FY’2013-FY’2016
Figure 221: Market Share of Major Non Life Insurers on the Basis of Direct Written Premium in Percentage, FY’2012
Figure 222: Australia Non-Life Insurance Gross Written Premium of Suncrop Group in USD Million, FY’2011-FY’2012
Figure 223: Australia Non-Life Insurance Gross Written Premium of Insurance Australia Group in USD Million, FY’2005-FY’2012
Figure 224: Australia Non life Insurance Market Projections on the Basis of Direct Written Premium in USD Million, FY’2013-FY’2016
Figure 225: Australia Insurance Market Projections on the Basis of Direct Written Premium in USD Million, FY’2013-FY’2016
Figure 226: Australia Population in Million, 2005-2016
Figure 227: GDP of Australia in USD Million, 2005-2016
Figure 228: Healthcare Expenditure of Australia in USD Million, 2005-2016
Figure 229: Total Number of Vehicle in Use in Australia in Million, 2005-2016

34
© This is a licensed product of Ken Research and should not be copied
LIST OF TABLES
Table 1: Asia-Pacific Insurance Market Segmentation by Countries on the Basis of Direct Written Premium in USD Billion, 2005-2012P
Table 2: Asia-Pacific Insurance Market Segmentation by Life and Non Life on the Basis of Direct Written Premium in USD Billion, 2005-2012P
Table 3: Japan life Insurance Market Segmentation by Individual Insurance and Annuities, Group Insurance and Annuities and Others on the Basis of Direct Written Premium in USD Million, FY’2005-FY’2012
Table 4: Market Share of Major Life Insurers on the Basis of Direct Written Premium in USD Million, FY’2012
Table 5: Japan Non life Insurance Market Segmentation by Agents, Direct Sales and Broker on the Basis of Direct Written Premium in USD Million, FY’2010-FY’2012
Table 6: Japan Automobile Insurance Market Segmentation by Voluntary Automobile, and Compulsory Automobile Liability on the Basis of Direct Written Premium in USD Million, FY’2005-FY’2012
Table 7: Market Share of Domestic and Foreign Insurers in Automobile Insurance Industry on the Basis of Direct Written Premium in USD Million, FY’2012
Table 8: Japan Automobile Insurance Market Projections on the Basis of Direct Written Premium in USD Million, 2013-2016
Table 9: Market Share of Domestic and Foreign Insurers in Fire Insurance Industry on the Basis of Direct Written Premium in USD Million, FY’2012
Table 10: Market Share of Domestic and Foreign Insurers in Personal Accident Insurance Industry on the Basis of Direct Written Premium in USD Million, FY’2012
Table 11: Japan Marine and Inland Transit Insurance Market Segmentation by Marine Cargo and Hull and Inland Transit Insurance on the Basis of Direct Written Premium in USD Million, FY’2005-FY’2012
Table 12: Market Share of Domestic and Foreign Insurers in Marine and Inland Transit Insurance Industry on the Basis of Direct Written Premium in USD Million, FY’2012
Table 13: Japan Marine and Inland Transit Insurance Market Projections on the Basis of Direct Written Premium in USD Million, FY’2013-FY’2016

35
© This is a licensed product of Ken Research and should not be copied
Table 14: Japan Miscellaneous Casualty Insurance Market Segmentation on the Basis of Direct Written Premium in Percentage, FY’2005-FY’2012
Table 15: Japan Miscellaneous Casualty Insurance Market Segmentation on the Basis of Direct Written Premium in USD Million, FY’2005-FY’2012
Table 16: Market Share of Domestic and Foreign Insurers in Miscellaneous Casualty Insurance Industry on the Basis of Direct Written Premium in USD Million, FY’2012
Table 17: Market Share of Major Life Insurers on the Basis of Direct Written Premium in USD Million, 2012
Table 18: Market Share of Major Non Life Insurers on the Basis of Direct Written Premium in USD Million, 2011
Table 19: Market Share of Major Property and Casualty Insurers on the Basis of Direct Written Premium in USD Million, 2012
Table 20: South Korea life Insurance Market Segmentation by General and Separate Account on the Basis of Direct Written Premium in USD Million, FY’2005-FY’2012P
Table 21: Market Share of Domestic and Foreign Insurers in Life Insurance Industry on the Basis of Direct Written Premium in USD Million, FY’2011
Table 22: South Korea Non life Insurance Market Segmentation by Agents, Direct Sales and Broker on the Basis of Direct Written Premium in USD Million, FY’2005-FY’2011
Table 23: Market Share of Major Insurers in Non Life Insurance Industry on the Basis of Direct Written Premium in USD Million, FY’2011
Table 24: South Korea Long Term Insurance Market Segmentation by Personal Accident, Health, Property and Others on the Basis of Direct Written Premium in USD Million, FY’2005-FY’2012P
Table 25: Market Share of Domestic and Foreign Insurers in Long Term Insurance Industry on the Basis of Direct Written Premium in USD Million, FY’2011
Table 26: South Korea Long Term Insurance Market Projections on the Basis of Direct Written Premium in USD Million, FY’2013-FY’2016
Table 27: South Korea Automobile Insurance Market Segmentation by Voluntary and Compulsory Auto Liability Insurance on the Basis of Direct Written Premium in USD Million, FY’2005-FY’2012P
Table 28: Market Share of Domestic and Foreign Insurers in Automobile Insurance Industry on the Basis of Direct Written Premium in USD Million, FY’2011
36
© This is a licensed product of Ken Research and should not be copied
Table 29: South Korea Automobile Insurance Market Projections on the Basis of Direct Written Premium in USD Million, FY’2013-FY’2016
Table 30: Market Share of Domestic and Foreign Insurers in Casualty Insurance Industry on the Basis of Direct Written Premium in USD Million, FY’2011
Table 31: Market Share of Domestic and Foreign Insurers in Casualty Insurance Industry on the Basis of Direct Written Premium in USD Million, FY’2011
Table 32: Market Share of Domestic and Foreign Insurers in Marine Insurance Industry on the Basis of Direct Written Premium in USD Million, FY’2011
Table 33: Market Share of Domestic and Foreign Insurers in Fire Insurance Industry on the Basis of Direct Written Premium in USD Million, FY’2011
Table 34: Taiwan life Insurance Market Segmentation by Life and Annuity on the Basis of Direct Written Premium in USD Million, 2005-2011
Table 35: Market Share of Major Life Insurers on the Basis of Direct Written Premium in USD Million, 2011
Table 36: Taiwan Life Insurance Distribution Channel by Banks, Solicitors and Others on the Basis of Direct Written Premium in USD Million, 2009-2011
Table 37: Taiwan Life Insurance Market Projections on the Basis of Direct Written Premium in USD Million, 2013-2016
Table 38: Market Share of Major Non Life Insurers on the Basis of Direct Written Premium in USD Million, 2011
Table 39: Taiwan Automobile Insurance Market Segmentation by Voluntary and Compulsory Motor Liability Insurance on the Basis of Direct Written Premium in USD Million, 2005-2012P
Table 40: Market Share of Major Automobile Insurers on the Basis of Direct Written Premium in USD Million, 2011
Table 41: Taiwan Automobile Insurance Market Projections on the Basis of Direct Written Premium in USD Million, 2013-2016
Table 42: Taiwan Property and Casualty Insurance Market Segmentation by Accident, Liability, Engineering, Credit, Health and Others on the Basis of Direct Written Premium in USD Million, 2005-2012P
Table 43: Market Share of Major Property and Casualty Insurers on the Basis of Direct Written Premium in USD Million, 2011
37
© This is a licensed product of Ken Research and should not be copied
Table 44: Taiwan Property and Casualty Insurance Market Projections on the Basis of Direct Written Premium in USD Million, 2013-2016
Table 45: Taiwan Marine Insurance Market Segmentation by Marine Cargo, Marine Hull and Fishing Vessel on the Basis of Direct Written Premium in USD Million, 2005-2012P
Table 46: Taiwan Marine Insurance Market Projections on the Basis of Direct Written Premium in USD Million, 2013-2016
Table 47: Top Insurance Product of the Leading Insurance Companies in India
Table 48: Difference between ULIP and Traditional Policies
Table 49: India life Insurance Market Segmentation by Public and Private Insurers on the Basis of Direct Written Premium in USD Million, FY’2005-FY’2012
Table 50: India life Insurance Market Segmentation by Renewal and First Premium on the Basis of Direct Written Premium in USD Million, FY’2005-FY’2012
Table 51: Market Share of Major Life Insurers on the Basis of Direct Written Premium in Percentage, FY’2012
Table 52: Market Share of Major Non Life Insurers on the Basis of Direct Written Premium in USD Million, FY’2012
Table 53: India Motor Insurance Market Segmentation by Private and Public Insurance on the Basis of Direct Written Premium in USD Million, FY’2005-FY’2012
Table 54: India Motor Insurance Market Segmentation by Motor Own Damage and Motor Third Party Insurance on the Basis of Direct Written Premium in USD Million, FY’2010-FY’2012
Table 55: India Motor Insurance Market Distribution Channel by Individual Agent, Direct Business, Brokers, Corporate Agent, Referral Arrangements and Others on the Basis of Direct Written Premium in USD Million, FY’2010-FY’2012
Table 56: Market Share of Major Motor Insurers on the Basis of Direct Written Premium in USD Million, FY’2012
Table 57: India Motor Insurance Market Projections on the Basis of Direct Written Premium in USD Million, FY’2013-FY’2016
Table 58: India Health Insurance Market Segmentation by Public, Private and Standalone Insurance on the Basis of Direct Written Premium in USD Million, 2005-2012
38
© This is a licensed product of Ken Research and should not be copied
Table 59: India Fire Insurance Market Distribution Channel by Direct Business, Individual Agent, Brokers, Corporate Agent, Referral Arrangements and Others on the Basis of Direct Written Premium in USD Million, FY’2010-FY’2012
Table 60: Market Share of Major Health Insurers on the Basis of Direct Written Premium in USD Million, FY’2012
Table 61: India Health Insurance Market Projections on the Basis of Direct Written Premium in USD Million, FY’2013-FY’2016
Table 62: India Fire Insurance Market Segmentation by Public and Private Insurance on the Basis of Direct Written Premium in USD Million, 2005-2012
Table 63: India Fire Insurance Market Distribution Channel by Direct Business, Individual Agent, Brokers, Corporate Agent, Referral Arrangements and Others on the Basis of Direct Written Premium in USD Million, FY’2010-FY’2012
Table 64: Market Share of Major Fire Insurers on the Basis of Direct Written Premium in USD Million, FY’2012
Table 65: India Fire Insurance Market Projections on the Basis of Direct Written Premium in USD Million, FY’2013-FY’2016
Table 66: India Marine Insurance Market Segmentation by Public and Private Insurance on the Basis of Direct Written Premium in USD Million, FY’2005-FY’2012
Table 67: India Marine Insurance Market Segmentation by Marine Cargo and Hull Insurance on the Basis of Direct Written Premium in USD Million, FY’2010-FY’2012
Table 68: India Marine Insurance Market Distribution Channel by Direct Business, Broker, Individual Agent, Corporate Agent, Referral Arrangements and Others on the Basis of Direct Written Premium in USD Million, FY’2010-FY’2012
Table 69: Market Share of Major Marine Insurers on the Basis of Direct Written Premium in USD Million, FY’2012
Table 70: India Marine Insurance Market Projections on the Basis of Direct Written Premium in USD Million, FY’2013-FY’2016
Table 71: India Marine Insurance Market Segmentation by Public and Private Insurance on the Basis of Direct Written Premium in USD Million, FY’2005-FY’2012
Table 72: India Miscellaneous Insurance Market Segmentation by Crop, Personal Accident, Liability and Other Insurance on the Basis of Direct Written Premium in USD Million, FY’2010-FY’2012
39
© This is a licensed product of Ken Research and should not be copied
Table 73: India Miscellaneous Insurance Market Distribution Channel by Direct Business, Individual Agent, Broker, Corporate Agent, Referral Arrangements and Others on the Basis of Direct Written Premium in USD Million, FY’2010 -FY’2012
Table 74: Market Share of Major Miscellaneous Insurers on the Basis of Direct Written Premium in USD Million, FY’2012
Table 75: Market Share of Major Personal Accident Insurers on the Basis of Direct Written Premium in USD Million, FY’2012
Table 76: India Miscellaneous Insurance Market Projections on the Basis of Direct Written Premium in USD Million, FY’2013-FY’2016
Table 77: New India Assurance Offices in India
Table 78: Market Share of Major Non Life Insurers on the Basis of Direct Written Premium in USD Million, FY’2012
Table 79: Market Share of Major Non Life Insurers on the Basis of Number of Policies in Thousand Units, FY’2012
Table 80: Australia Motor Vehicle Insurance Market Segmentation by Domestic, CTP and Commercial Motor Vehicle Insurance on the Basis of Direct Written Premium in USD Million, 2005-2012
Table 81: Market Share of Major Motor Vehicle Insurers on the Basis of Direct Written Premium in USD Million, FY’2012
Table 82: Australia Motor Vehicle Insurance Market Projections on the Basis of Direct Written Premium in USD Million, FY’2013-FY’2016
Table 83: Market Share of Major Household Insurers on the Basis of Direct Written Premium in USD Million, FY’2012
Table 84: Australia Liability Insurance Market Segmentation by Public and Product Liability, Employers Liability and Professional Indemnity Insurance on the Basis of Direct Written Premium in USD Million, FY’2005-FY’2012 ............................. Error! Bookmark not defined.
Table 85: Australia Liability Insurance Market Projections on the Basis of Direct Written Premium in USD Million, FY’2013-FY’2016
Table 86: Company Profile of Major Players in Australia Life Insurance Industry, FY’2012
Table 87: Cause and Effect Relationship Analysis between Industry Factors and Expected Industry Prospects of Asia-Pacific Insurance Market
40
© This is a licensed product of Ken Research and should not be copied
Table 88: Asia-Pacific Insurance Market Projections by Countries on the Basis of Direct Written Premium in USD Million, 2013-2016
Table 89: Asia-Pacific Insurance Market Projections by Life and Non Life on the Basis of Direct Written Premium in USD Million, 2013-2016
Table 90: Correlation Matrix of the India Insurance Industry
Table 91: Regression Coefficients Output of India Insurance Industry
41
© This is a licensed product of Ken Research and should not be copied
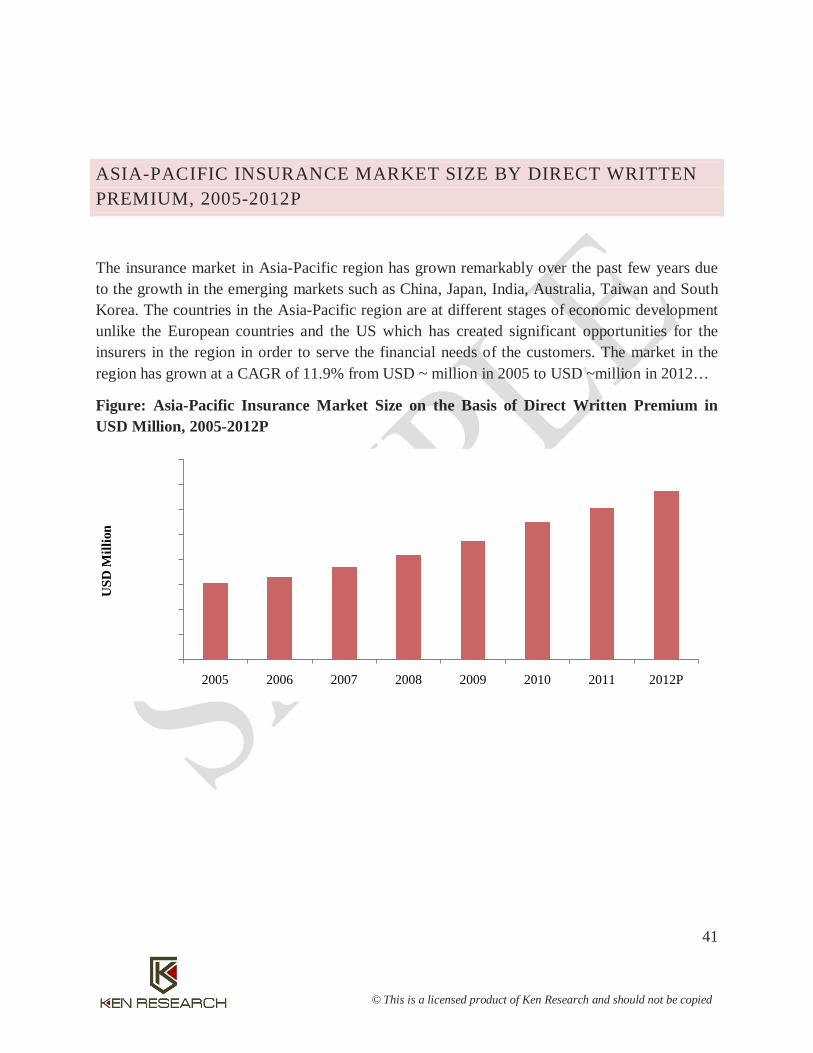
ASIA-PACIFIC INSURANCE MARKET SIZE BY DIRECT WRITTEN PREMIUM, 2005-2012P
The insurance market in Asia-Pacific region has grown remarkably over the past few years due to the growth in the emerging markets such as China, Japan, India, Australia, Taiwan and South Korea. The countries in the Asia-Pacific region are at different stages of economic development unlike the European countries and the US which has created significant opportunities for the insurers in the region in order to serve the financial needs of the customers. The market in the region has grown at a CAGR of 11.9% from USD ~ million in 2005 to USD ~million in 2012…
Figure: Asia-Pacific Insurance Market Size on the Basis of Direct Written Premium in USD Million, 2005-2012P
0.0
2,00,000.0
4,00,000.0
6,00,000.0
8,00,000.0
10,00,000.0
12,00,000.0
14,00,000.0
16,00,000.0
2005 2006 2007 2008 2009 2010 2011 2012P
USD
Mill
ion
42
© This is a licensed product of Ken Research and should not be copied
China insurance industry is one of the predominant markets in the insurance industry in the Asia-Pacific region with a contribution of ~% of the direct written premium in the region in 2012.
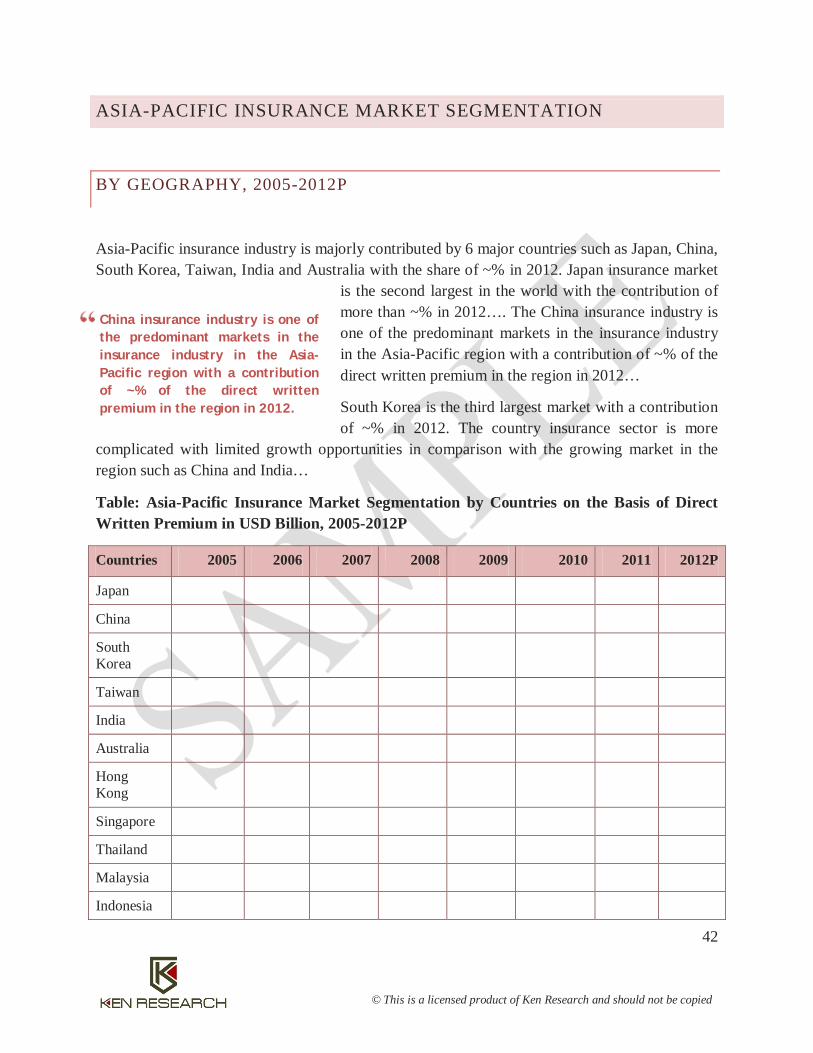
ASIA-PACIFIC INSURANCE MARKET SEGMENTATION
BY GEOGRAPHY, 2005-2012P
Asia-Pacific insurance industry is majorly contributed by 6 major countries such as Japan, China, South Korea, Taiwan, India and Australia with the share of ~% in 2012. Japan insurance market
is the second largest in the world with the contribution of more than ~% in 2012…. The China insurance industry is one of the predominant markets in the insurance industry in the Asia-Pacific region with a contribution of ~% of the direct written premium in the region in 2012…
South Korea is the third largest market with a contribution of ~% in 2012. The country insurance sector is more
complicated with limited growth opportunities in comparison with the growing market in the region such as China and India…
Table: Asia-Pacific Insurance Market Segmentation by Countries on the Basis of Direct Written Premium in USD Billion, 2005-2012P
Countries 2005 2006 2007 2008 2009 2010 2011 2012P
Japan
China
South Korea
Taiwan
India
Australia
Hong Kong
Singapore
Thailand
Malaysia
Indonesia
43
© This is a licensed product of Ken Research and should not be copied
Japan insurance industry is the second largest market in the world after the US and has experienced a direct written premium of USD ~ million in FY’2012
New Zealand
Philippines
Vietnam
Pakistan
Kazakhstan
Bangladesh
Sri Lanka
Total
JAPAN INSURANCE INDUSTRY
JAPAN INSURANCE MARKET SIZE BY DIRECT WRITTEN PREMIUM, FY’2005-FY’2012
Japan insurance industry is the second largest market in the world after the US. The country’s insurance market has increased at a CAGR of 10.4% from FY’2005-FY’2012 with the direct
written premium of USD ~ million in FY’2012 in comparison to USD ~ million in FY’2005… The insurance companies in Japan has experienced an increase of 2% in assets to JPY ~ million in FY’2012 in comparison to JPY ~ million in FY’2011 due to surge in
unrealized capital gains which has inclined the value of investment assets.
…In FY’2011, the country insurance market comprised of only ~ life insurance companies in comparison to ~ life insurers in the US. The non life insurance industry of the country consisted of ~ domestic players and ~ foreign insurers offering their products in FY’2011…

44
© This is a licensed product of Ken Research and should not be copied
Figure: Japan Insurance Market Size on the Basis of Direct Written Premium in USD Million, FY’2005-FY’2012
Note:
FY ending- 31st March
Life Insurance is in Premium Income
Non-Life Insurance is in Direct Written Premium
JAPAN LIFE INSURANCE MARKET
JAPAN LIFE INSURANCE MARKET SIZE, FY’2005-FY’2012
…In FY’2011, approximately ~% of Japanese men are insured under the life insurance as compared to ~% of Japanese women...
The country’s life insurance companies are continuously diversifying sales channel such as selling products through in house sales representative, manned sales office, direct marketing and internet sales channel. In FY’2011, there are ~ sales representative, ~ tied agents and ~ insurance agencies….
0.0
1,00,000.0
2,00,000.0
3,00,000.0
4,00,000.0
5,00,000.0
6,00,000.0
7,00,000.0
FY'2005 FY'2006 FY'2007 FY'2008 FY'2009 FY'2010 FY'2011 FY'2012
USD
Mill
ion

45
© This is a licensed product of Ken Research and should not be copied
The life insurance market can be grouped under three categories such as government-owned, private sector and foreign-owned organization. Japan Post Insurance is the leading government owned life insurance player in the country with the total assets of JPY ~ billion in FY’2012. In FY’2012 there are ~ private sector companies and ~ foreign-owned players in Japan life insurance market.
Figure: Japan Life Insurance Market Size on the Basis of Direct Written Premium in USD Million, FY’2005-FY’2012
Note:
FY ending- 31st March
Life Insurance is in Premium Income
1.1.1.1. MARKET SHARE OF MAJOR LIFE INSURERS IN JAPAN, FY’2012
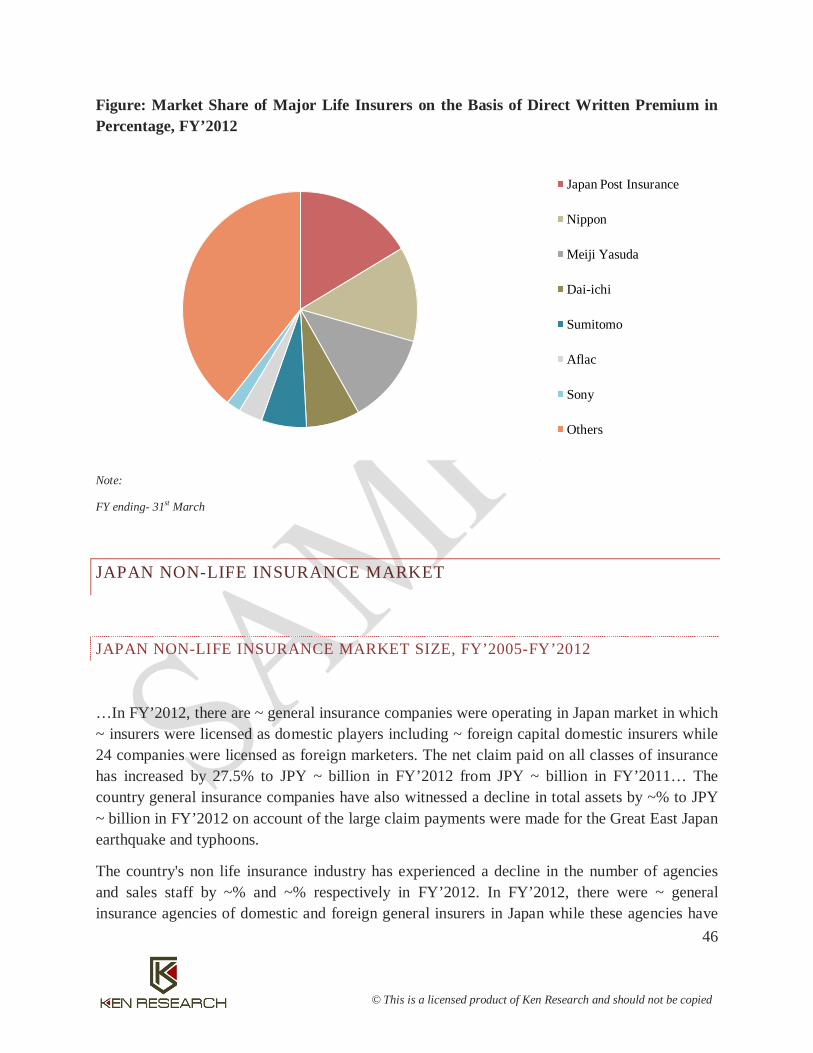
Japan insurance industry is a concentrated market with top six players contributing around ~% of the total direct written premium in FY’2012.
Japan Post Insurance is the leading life insurance player in the country with the share of ~% and the direct written premium of USD ~ million in FY’2012…
Dai-ichi and Sumitomo remains at fourth and fifth position with the share of ~% and ~% respectively in FY’2012 followed by Aflac and Sony with the contribution of ~% and ~% respectively in FY’2012…
0.0
1,00,000.0
2,00,000.0
3,00,000.0
4,00,000.0
5,00,000.0
6,00,000.0
FY'2005 FY'2006 FY'2007 FY'2008 FY'2009 FY'2010 FY'2011 FY'2012
USD
Mill
ion
46
© This is a licensed product of Ken Research and should not be copied
Figure: Market Share of Major Life Insurers on the Basis of Direct Written Premium in Percentage, FY’2012
Note:
FY ending- 31st March
JAPAN NON-LIFE INSURANCE MARKET
JAPAN NON-LIFE INSURANCE MARKET SIZE, FY’2005-FY’2012
…In FY’2012, there are ~ general insurance companies were operating in Japan market in which ~ insurers were licensed as domestic players including ~ foreign capital domestic insurers while 24 companies were licensed as foreign marketers. The net claim paid on all classes of insurance has increased by 27.5% to JPY ~ billion in FY’2012 from JPY ~ billion in FY’2011… The country general insurance companies have also witnessed a decline in total assets by ~% to JPY ~ billion in FY’2012 on account of the large claim payments were made for the Great East Japan earthquake and typhoons.
The country's non life insurance industry has experienced a decline in the number of agencies and sales staff by ~% and ~% respectively in FY’2012. In FY’2012, there were ~ general insurance agencies of domestic and foreign general insurers in Japan while these agencies have
Japan Post Insurance
Nippon
Meiji Yasuda
Dai-ichi
Sumitomo
Aflac
Sony
Others

47
© This is a licensed product of Ken Research and should not be copied
employed ~ sales staff at the end of FY’2012. The number of agencies contributes approximately ~% of the direct written premium in FY’2012
Figure: Japan Non Life Insurance Market Size on the Basis of Direct Written Premium in USD Million, FY’2005-FY’2012
Note:
FY ending- 31st March
NON-LIFE INSURANCE SEGMENTATION, FY’2005-FY’2012
…In 2011, there are around ~ motor vehicles for every ~ residents in Japan which has witnessed an increase of ~% from 2010...
The automobile insurance segment of the general insurance industry was followed by a fire insurance segment which contributed around ~% of the total direct written premium of USD ~ million in FY’2012... In 2009, 46.5% of household had fire insurance while 23% had the additional earthquake insurance. The earthquake insurance coverage provides approximately ~% of what a fire insurance policy would cover.
…The contribution of miscellaneous casualty has increased in the last seven years from 9% in FY’2005 to ~% in FY’2012 on account of rising number of general liability insurance taken by an organization in order to protect their business from third party claims.
0.0
20,000.0
40,000.0
60,000.0
80,000.0
1,00,000.0
1,20,000.0
FY'2005 FY'2006 FY'2007 FY'2008 FY'2009 FY'2010 FY'2011 FY'2012
USD
Mill
ion

48
© This is a licensed product of Ken Research and should not be copied
The marine and inland transit segments contributed around ~% of the overall general insurance market in FY’2012.
Figure: Japan Non life Insurance Market Segmentation by Automobile, Fire, Personal Accident, Miscellaneous Casualty, Marine and Inland Transit on the Basis of Direct Written Premium in Percentage, 2005-2012
Note: FY ending- 31st March
0.0%
10.0%
20.0%
30.0%
40.0%
50.0%
60.0%
70.0%
80.0%
90.0%
100.0%
FY'2005 FY'2006 FY'2007 FY'2008 FY'2009 FY'2010 FY'2011 FY'2012
In P
erce
ntag
e %
Marine and Inland Transit Miscellaneous Casualty Personal Accident Fire Automobile

49
© This is a licensed product of Ken Research and should not be copied
JAPAN AUTOMOBILE INSURANCE INDUSTRY
JAPAN AUTOMOBILE INSURANCE MARKET SIZE AND INTRODUCTION, FY’2005-FY’2012
Japan automobile insurance industry is the leading contributor in the non life insurance segment with the direct written premium of USD ~ million in FY’2012.
… The country's automobile insurance industry has witnessed a growth of 2.5% from USD ~ million in FY’2011 to USD ~ million in FY’2012. The growth has been influenced by an incline in the number of vehicles in use from ~ thousand units in 2010 to ~ thousand units in 2011 due to improving economic conditions of the country…
Figure: Japan Automobile Insurance Market Size on the Basis of Direct Written Premium in USD Million, FY’2005-FY’2012
Note: FY ending- 31st March
0.0
10,000.0
20,000.0
30,000.0
40,000.0
50,000.0
60,000.0
FY'2005 FY'2006 FY'2007 FY'2008 FY'2009 FY'2010 FY'2011 FY'2012
USD
Mill
ion
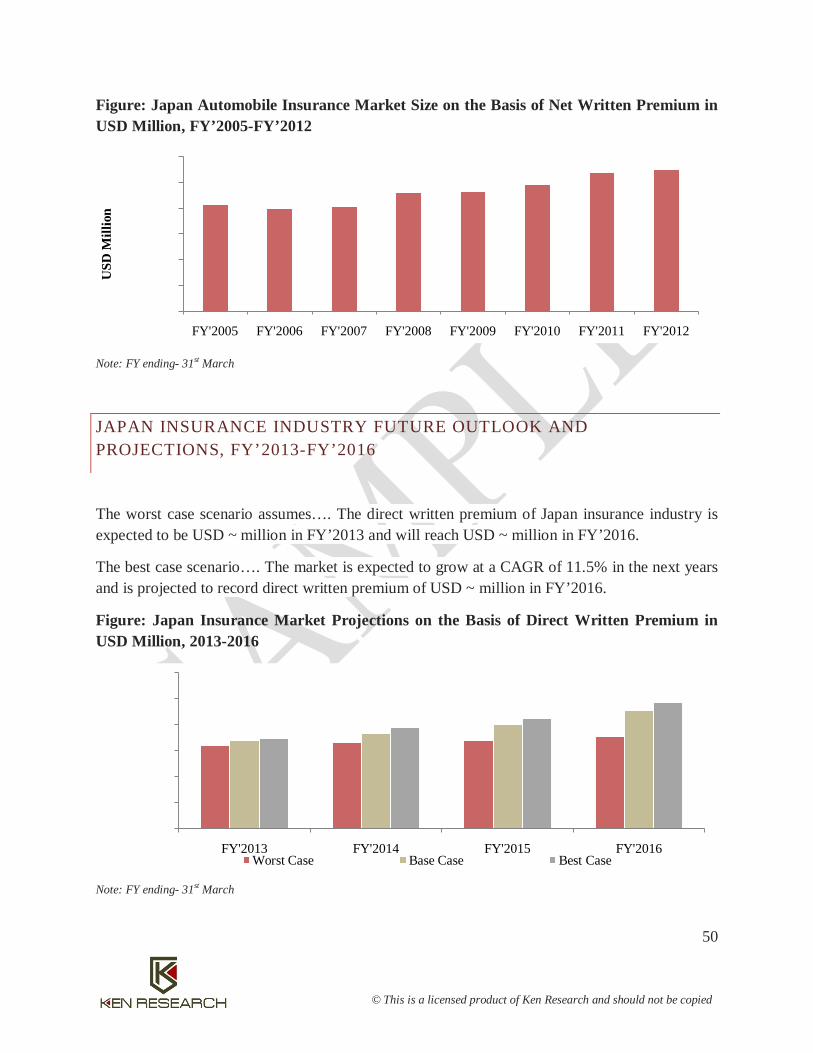
50
© This is a licensed product of Ken Research and should not be copied
Figure: Japan Automobile Insurance Market Size on the Basis of Net Written Premium in USD Million, FY’2005-FY’2012
Note: FY ending- 31st March
JAPAN INSURANCE INDUSTRY FUTURE OUTLOOK AND PROJECTIONS, FY’2013-FY’2016
The worst case scenario assumes…. The direct written premium of Japan insurance industry is expected to be USD ~ million in FY’2013 and will reach USD ~ million in FY’2016.
The best case scenario…. The market is expected to grow at a CAGR of 11.5% in the next years and is projected to record direct written premium of USD ~ million in FY’2016.
Figure: Japan Insurance Market Projections on the Basis of Direct Written Premium in USD Million, 2013-2016
Note: FY ending- 31st March
0.0
10,000.0
20,000.0
30,000.0
40,000.0
50,000.0
60,000.0
FY'2005 FY'2006 FY'2007 FY'2008 FY'2009 FY'2010 FY'2011 FY'2012
USD
Mill
ion
0.0
2,00,000.0
4,00,000.0
6,00,000.0
8,00,000.0
10,00,000.0
12,00,000.0
FY'2013 FY'2014 FY'2015 FY'2016Worst Case Base Case Best Case
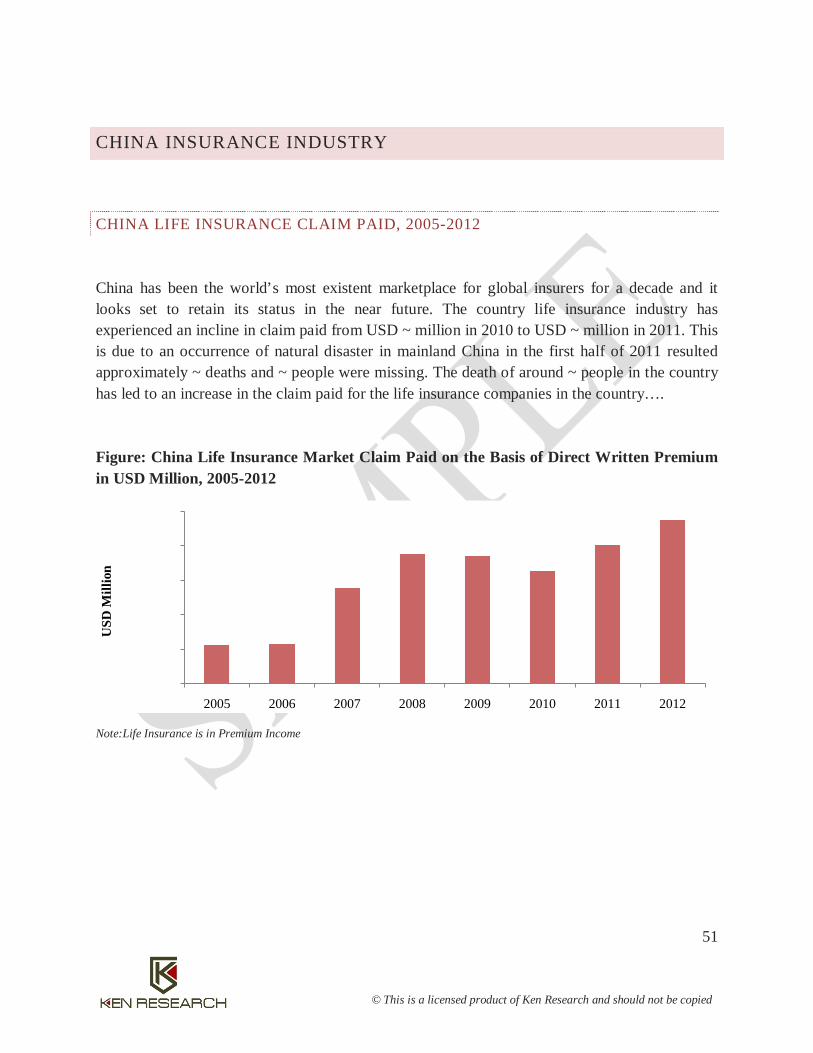
51
© This is a licensed product of Ken Research and should not be copied
CHINA INSURANCE INDUSTRY
CHINA LIFE INSURANCE CLAIM PAID, 2005-2012
China has been the world’s most existent marketplace for global insurers for a decade and it looks set to retain its status in the near future. The country life insurance industry has experienced an incline in claim paid from USD ~ million in 2010 to USD ~ million in 2011. This is due to an occurrence of natural disaster in mainland China in the first half of 2011 resulted approximately ~ deaths and ~ people were missing. The death of around ~ people in the country has led to an increase in the claim paid for the life insurance companies in the country….
Figure: China Life Insurance Market Claim Paid on the Basis of Direct Written Premium in USD Million, 2005-2012
Note:Life Insurance is in Premium Income
0.0
5,000.0
10,000.0
15,000.0
20,000.0
25,000.0
2005 2006 2007 2008 2009 2010 2011 2012
USD
Mill
ion

52
© This is a licensed product of Ken Research and should not be copied
NON-LIFE INSURANCE SEGMENTATION, 2005-2012
…The country non life insurance market is dominated by property and casualty segment with the contribution of ~% in 2012. The main property and casualty insurance products sold in the country are automobile, commercial property, cargo, liability, agricultural and others. The motor vehicle is the leading contributor in property and casualty segment with the share of around ~% in 2012. The motor vehicle insurance is divided into two types such as compulsory liability and voluntary insurance. The second largest contributor in property and casualty segment is a property with the share of approximately ~% in 2012 followed by agricultural insurance with the share of ~% in 2012.
The health insurance market contributes 13.1% of the non life insurance industry in China in 2012. The private health insurance coverage in the country has expanded and now it covers approximately ~% of China’s population. The health insurance coverage in the country has grown at an impressive rate of ~% annually over the past 10 years. The number of health insurance plan in the country has also increased from around ~ in 2008 to over ~ in 2011.
Figure: China Non life Insurance Market Segmentation by Property and Casualty and Health Insurance on the Basis of Direct Written Premium in Percentage, 2005-2012
Source: Insurance Association of China and Ken Research
Note:Non-Life Insurance is in Premium Income
0.0%10.0%20.0%30.0%40.0%50.0%60.0%70.0%80.0%90.0%
100.0%
2005 2006 2007 2008 2009 2010 2011 2012
In P
erce
ntag
e %
Health Property and Casualty

53
© This is a licensed product of Ken Research and should not be copied
CHINA COMMERCIAL PROPERTY INSURANCE INDUSTRY
CHINA COMMERCIAL PROPERTY INSURANCE MARKET SIZE, 2005-2012
The commercial insurance direct written premium has witnessed remarkable growth in the past three years from USD ~ million in 2009 to USD ~ million in 2011 on account of rising natural catastrophic risk in the country...
Figure: China Commercial Property Insurance Market Size on the Basis of Direct Written Premium in USD Million, 2005-2012
Note:Commercial Property Insurance is in Premium Income
0.0
1,000.0
2,000.0
3,000.0
4,000.0
5,000.0
6,000.0
7,000.0
8,000.0
2005 2006 2007 2008 2009 2010 2011 2012
USD
Mill
ion

54
© This is a licensed product of Ken Research and should not be copied
The separate account insurance has also experienced a growth of 13.5% to USD ~ million in FY’2011
SOUTH KOREA INSURANCE INDUSTRY
SOUTH KOREA LIFE INSURANCE MARKET
LIFE INSURANCE SEGMENTATION, FY’2005-FY’2012P
….The general account insurance has witnessed an increase in direct written premium of ~% from USD ~ million in FY’2010 to USD ~ million in FY’2011 due to the growth in premium income for pensions and endowment insurance. In FY’2011, the endowment insurance has experienced a growth of ~% with the premium income of KRW ~ million. The group term life insurance is offered to an individual of an age between 15-65 years with a waiting period of 1 year. This insurance policy needs to meet the guidelines of the ministry of finance and economy.
The separate account insurance has also experienced a growth of 13.5% to USD ~ million in FY’2011. The premium income of retirement insurance has witnessed a decline of ~% in FY’2011 from the previous year
while the corporate insurance has posted a growth of ~% to USD 4,123.2 million in FY’2011…
Figure: South Korea life Insurance Market Segmentation by General and Separate Account on the Basis of Direct Written Premium in Percentage, FY’2005-FY’2012P
Note:FY ending- 31st March
Life Insurance is in Premium Income
0.0
0.2
0.4
0.6
0.8
1.0
1.2
FY'2005 FY'2006 FY'2007 FY'2008 FY'2009 FY'2010 FY'2011 FY'2012P
In P
erce
ntag
e
Separate Account General Account
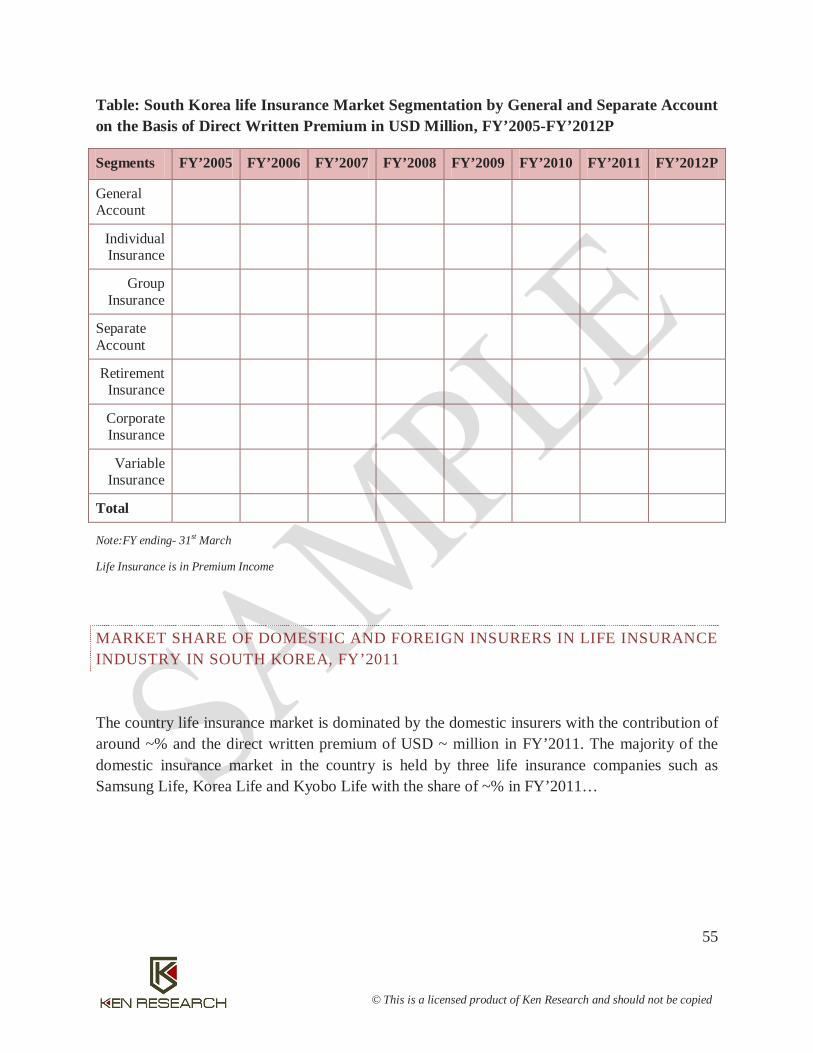
55
© This is a licensed product of Ken Research and should not be copied
Table: South Korea life Insurance Market Segmentation by General and Separate Account on the Basis of Direct Written Premium in USD Million, FY’2005-FY’2012P
Segments FY’2005 FY’2006 FY’2007 FY’2008 FY’2009 FY’2010 FY’2011 FY’2012P
General Account
Individual Insurance
Group Insurance
Separate Account
Retirement Insurance
Corporate Insurance
Variable Insurance
Total
Note:FY ending- 31st March
Life Insurance is in Premium Income
MARKET SHARE OF DOMESTIC AND FOREIGN INSURERS IN LIFE INSURANCE INDUSTRY IN SOUTH KOREA, FY’2011
The country life insurance market is dominated by the domestic insurers with the contribution of around ~% and the direct written premium of USD ~ million in FY’2011. The majority of the domestic insurance market in the country is held by three life insurance companies such as Samsung Life, Korea Life and Kyobo Life with the share of ~% in FY’2011…
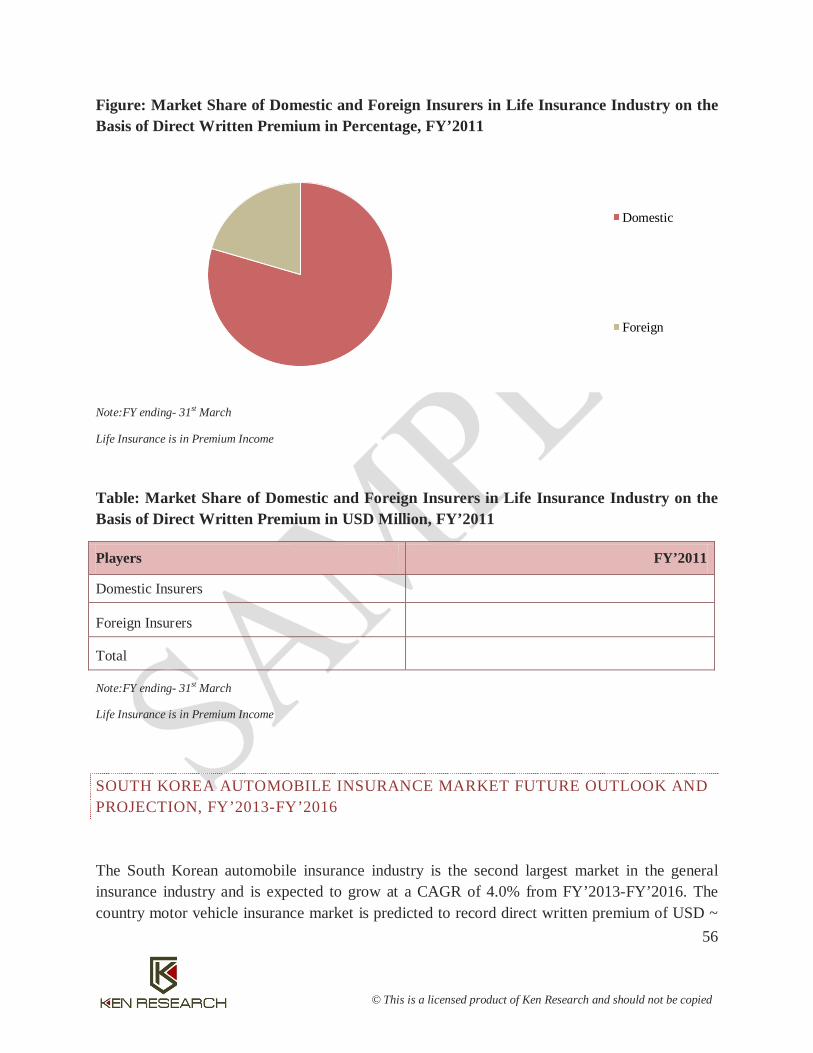
56
© This is a licensed product of Ken Research and should not be copied
Figure: Market Share of Domestic and Foreign Insurers in Life Insurance Industry on the Basis of Direct Written Premium in Percentage, FY’2011
Note:FY ending- 31st March
Life Insurance is in Premium Income
Table: Market Share of Domestic and Foreign Insurers in Life Insurance Industry on the Basis of Direct Written Premium in USD Million, FY’2011
Players FY’2011
Domestic Insurers
Foreign Insurers
Total
Note:FY ending- 31st March
Life Insurance is in Premium Income
SOUTH KOREA AUTOMOBILE INSURANCE MARKET FUTURE OUTLOOK AND PROJECTION, FY’2013-FY’2016
The South Korean automobile insurance industry is the second largest market in the general insurance industry and is expected to grow at a CAGR of 4.0% from FY’2013-FY’2016. The country motor vehicle insurance market is predicted to record direct written premium of USD ~
Domestic
Foreign
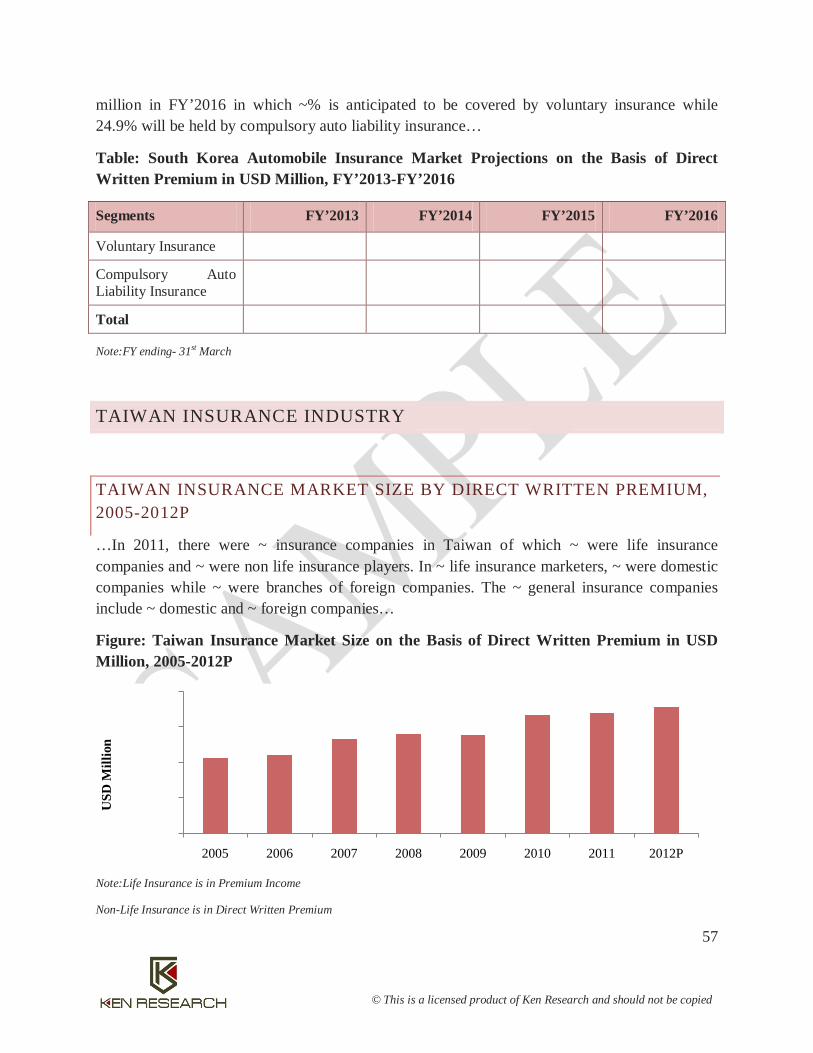
57
© This is a licensed product of Ken Research and should not be copied
million in FY’2016 in which ~% is anticipated to be covered by voluntary insurance while 24.9% will be held by compulsory auto liability insurance…
Table: South Korea Automobile Insurance Market Projections on the Basis of Direct Written Premium in USD Million, FY’2013-FY’2016
Segments FY’2013 FY’2014 FY’2015 FY’2016
Voluntary Insurance
Compulsory Auto Liability Insurance
Total
Note:FY ending- 31st March
TAIWAN INSURANCE INDUSTRY
TAIWAN INSURANCE MARKET SIZE BY DIRECT WRITTEN PREMIUM, 2005-2012P
…In 2011, there were ~ insurance companies in Taiwan of which ~ were life insurance companies and ~ were non life insurance players. In ~ life insurance marketers, ~ were domestic companies while ~ were branches of foreign companies. The ~ general insurance companies include ~ domestic and ~ foreign companies…
Figure: Taiwan Insurance Market Size on the Basis of Direct Written Premium in USD Million, 2005-2012P
Note:Life Insurance is in Premium Income
Non-Life Insurance is in Direct Written Premium
0.0
20,000.0
40,000.0
60,000.0
80,000.0
2005 2006 2007 2008 2009 2010 2011 2012P
USD
Mill
ion
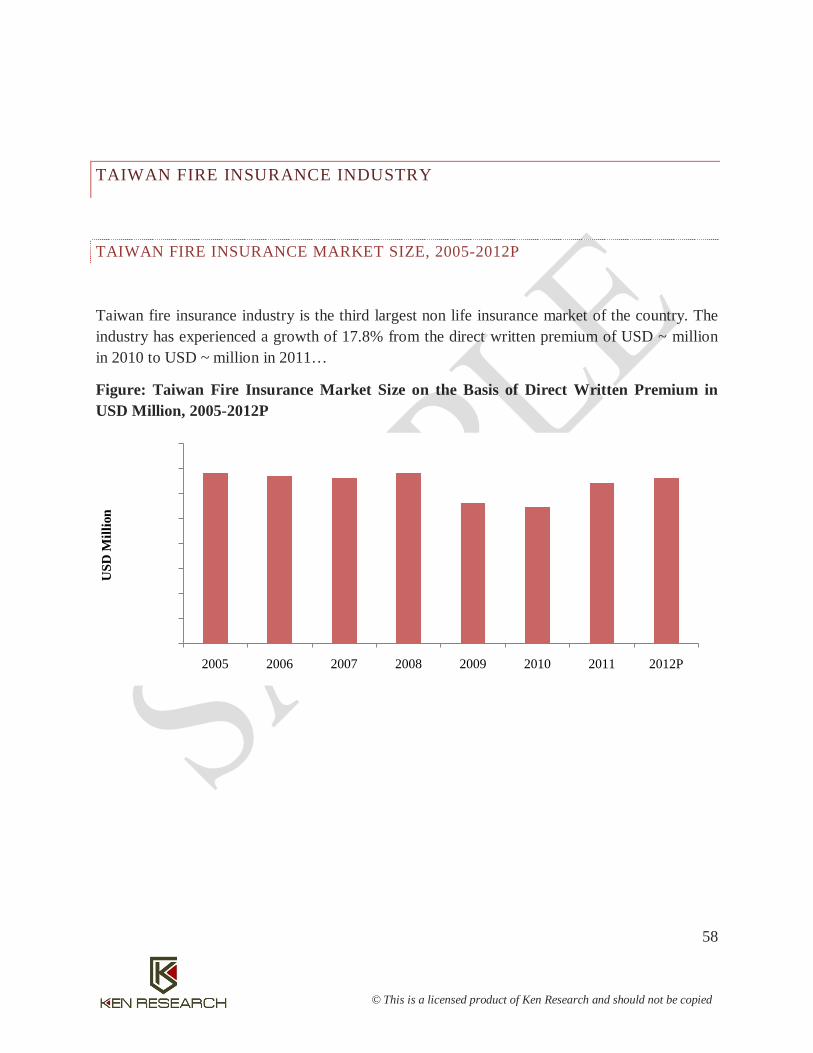
58
© This is a licensed product of Ken Research and should not be copied
TAIWAN FIRE INSURANCE INDUSTRY
TAIWAN FIRE INSURANCE MARKET SIZE, 2005-2012P
Taiwan fire insurance industry is the third largest non life insurance market of the country. The industry has experienced a growth of 17.8% from the direct written premium of USD ~ million in 2010 to USD ~ million in 2011…
Figure: Taiwan Fire Insurance Market Size on the Basis of Direct Written Premium in USD Million, 2005-2012P
0.0
100.0
200.0
300.0
400.0
500.0
600.0
700.0
800.0
2005 2006 2007 2008 2009 2010 2011 2012P
USD
Mill
ion

59
© This is a licensed product of Ken Research and should not be copied
INDIA INSURANCE INDUSTRY
INDIA LIFE INSURANCE MARKET FUTURE OUTLOOK AND PROJECTION, FY’2013-FY’2016
…Under the base case scenario analysis the life insurance market of the country is expected to grow at a CAGR of 12.2% from FY’2013-FY’2016 and is expected to record direct written premium of USD ~ million in FY’2016…
The conservative case scenario analysis assumes that the market is predicted to record direct written premium of USD ~ million in FY’2016 and is anticipated to grow at a marginal CAGR of 1.6% in the next four years...
Figure: India Life Insurance Market Projections on the Basis of Direct Written Premium in USD Million, FY’2013-FY’2016
Note: FY ending- 31st March
Life Insurance is in Premium Income
0.0
20,000.0
40,000.0
60,000.0
80,000.0
1,00,000.0
1,20,000.0
FY'2013 FY'2014 FY'2015 FY'2016
USD
Mill
ion
Worst Case Base Case Best Case
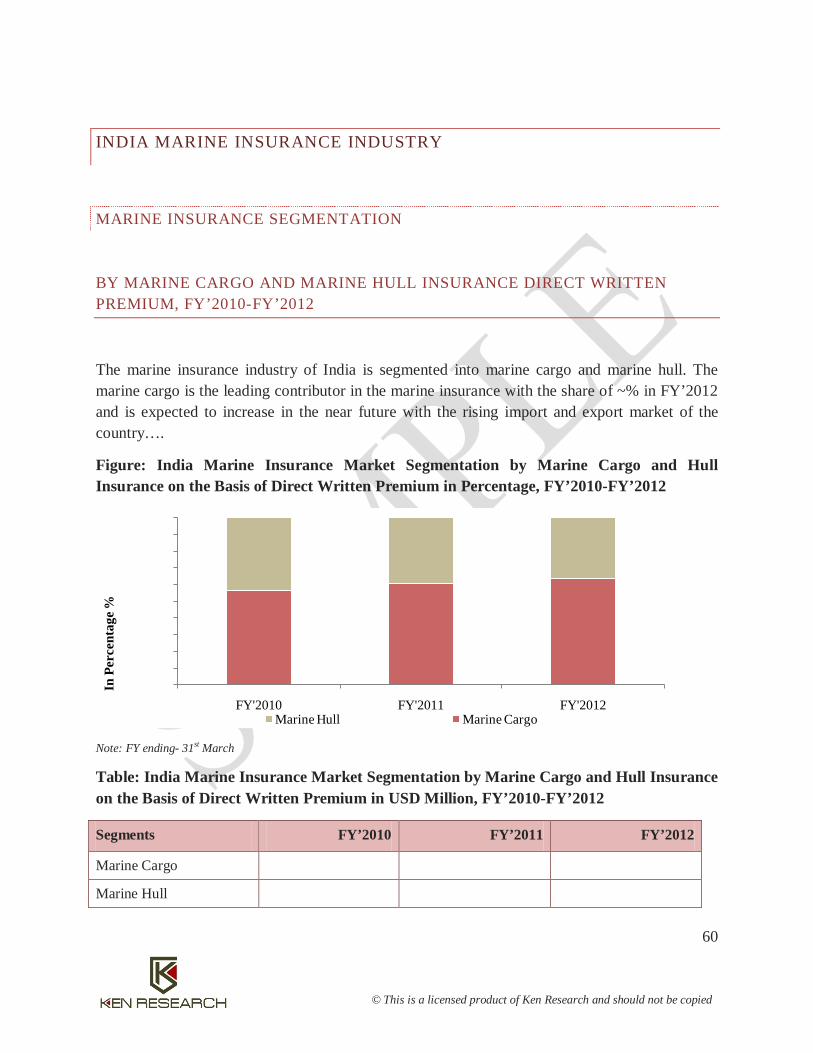
60
© This is a licensed product of Ken Research and should not be copied
INDIA MARINE INSURANCE INDUSTRY
MARINE INSURANCE SEGMENTATION
BY MARINE CARGO AND MARINE HULL INSURANCE DIRECT WRITTEN PREMIUM, FY’2010-FY’2012
The marine insurance industry of India is segmented into marine cargo and marine hull. The marine cargo is the leading contributor in the marine insurance with the share of ~% in FY’2012 and is expected to increase in the near future with the rising import and export market of the country….
Figure: India Marine Insurance Market Segmentation by Marine Cargo and Hull Insurance on the Basis of Direct Written Premium in Percentage, FY’2010-FY’2012
Note: FY ending- 31st March
Table: India Marine Insurance Market Segmentation by Marine Cargo and Hull Insurance on the Basis of Direct Written Premium in USD Million, FY’2010-FY’2012
Segments FY’2010 FY’2011 FY’2012
Marine Cargo
Marine Hull
0.0%10.0%20.0%30.0%40.0%50.0%60.0%70.0%80.0%90.0%
100.0%
FY'2010 FY'2011 FY'2012
In P
erce
ntag
e %
Marine Hull Marine Cargo

61
© This is a licensed product of Ken Research and should not be copied
Total
Note: FY ending- 31st March
AUSTRALIA INSURANCE INDUSTRY
AUSTRALIA HOUSEHOLD INSURANCE INDUSTRY
AUSTRALIA HOUSEHOLD INSURANCE MARKET SIZE, FY’2005-FY’2012
…The household insurance industry in Australia has experienced a growth of 18.7% with the direct written premium of USD ~ million in FY’2012 compared to USD ~ million in FY’2011 on account of rising awareness among the people after the occurrence of successive natural disaster in the country. In 2011, the occurrence of Tropical Cyclone Yasi in the multiple locations of Queensland has resulted into loss of AUD ~ million.
Figure: Australia Household Insurance Market Size on the Basis of Direct Written Premium in USD Million, FY’2005-FY’2012
Note: FY ending- 30st June
Household Insurance is in Gross Written Premium
0.0
2,000.0
4,000.0
6,000.0
8,000.0
FY'2005 FY'2006 FY'2007 FY'2008 FY'2009 FY'2010 FY'2011 FY'2012
USD
Mill
ion

62
© This is a licensed product of Ken Research and should not be copied
ASIA-PACIFIC INSURANCE INDUSTRY TRENDS AND DEVELOPMENTS
RISING AFFLUENT MIDDLE CLASS
The rising affluent middle class in the Asia-Pacific region has triggered the demand for the insurance products….
ASIA-PACIFIC INSURANCE INDUSTRY FUTURE OUTLOOK
….Overall, the market of the Asia-Pacific insurance is expected to grow at a CAGR of 11.2% from 2013-2016. The market in the near future is expected to witness consolidation and higher competition level with the entrance of more global players in the market….
CAUSE AND EFFECT RELATIONSHIP BETWEEN DEPENDENT AND INDEPENDENT FACTORS PREVAILING IN ASIA-PACIFIC INSURANCE MARKET
Table: Cause and Effect Relationship Analysis between Industry Factors and Expected Industry Prospects of Asia-Pacific Insurance Market
Industry Factors Market Impact Comments
Strict Government Regulations and Support
Cause: Positive Effect: Negative Effect:
Increasing Population
Cause: Effect:

63
© This is a licensed product of Ken Research and should not be copied
Increasing Consumer Spending
Cause: Effect:.
Intensifying Competition
Cause: Positive Effect: Negative Effect:
ASIA-PACIFIC INSURANCE INDUSTRY FUTURE PROJECTIONS
BY LIFE AND NON LIFE, 2013-2016
…The life insurance premium is expected to grow at a rate of 11.3% in 2013 with the rising demand of retirement and linked insurance product in the region. The improving economic and investment risks will also favor the growth of traditional protection type products….
Table: Asia-Pacific Insurance Market Projections by Life and Non Life on the Basis of Direct Written Premium in USD Million, 2013-2016
Segments 2013 2014 2015 2016
Life
Non Life
Total
DISCLAIMER
No part of this manual or any material appearing may be reproduced, stored in or transmitted on any other Web site without written permission of Ken Research and any payments of a specified fee. Requests to republish any material may be sent to us.


