246 | ASSA CONVENTION 2012, CAPE TOWN, 16–17 OCTOBER 2012 RISK ADJUSTED PERFORMANCE MEASURES IN A PROPERTY FINANCE BUSINESS IN SOUTH AFRICA: A BANKING PERSPECTIVE By Michael Tichareva Presented at the Actuarial Society of South Africa’s 2012 Convention 16–17 October 2012, Cape Town International Convention Centre ABSTRACT is research analyses risk adjusted performance measures in a South African Property Finance Business. is is performed through the application of the Treynor, Sharpe and Jensen measures, which are risk adjusted performance measures in finance, to banking. Conclusions are drawn on whether risk adjusted performance measures lead to materially different results on ranking of performance when compared with traditional measures such as return on equity and return on assets. e research also discusses the strategic decisions that would result from using risk adjusted performance measures. e study contrasts risk adjusted performance measures with non-risk adjusted traditional performance measures in a Property Finance business within the banking sector in South Africa. Following a literature review, the research proposes that risk adjusted performance measures, when compared with traditional non-risk based performance measures such as return on equity and return on assets, lead to different results on performance ranking of business units or activities within a business unit. Both quantitative and qualitative approaches to research are undertaken. We chose Nedbank Corporate Property Finance as a case study because of the simplicity for the researcher to access financial data for the quantitative part of the research and interviewees for the qualitative part of the research. e key findings in this research are that there are differences in performance rankings between traditional measures of performance and risk adjusted measures. Business activities that perform better on non-risk adjusted basis are not necessarily the best performing on a risk adjusted basis. Hypothesis testing also shows that the differences in performance rankings are material.
Transcript
246 | ASSA CONVENTION 2012, CAPE TOWN, 16–17 OCTOBER 2012
RISK ADJUSTED PERFORMANCE MEASURES IN A PROPERTY FINANCE BUSINESS IN SOUTH AFRICA: A BANKING PERSPECTIVEBy Michael Tichareva
Presented at the Actuarial Society of South Africa’s 2012 Convention16–17 October 2012, Cape Town International Convention Centre
ABSTRACTThis research analyses risk adjusted performance measures in a South African Property Finance Business. This is performed through the application of the Treynor, Sharpe and Jensen measures, which are risk adjusted performance measures in finance, to banking. Conclusions are drawn on whether risk adjusted performance measures lead to materially different results on ranking of performance when compared with traditional measures such as return on equity and return on assets. The research also discusses the strategic decisions that would result from using risk adjusted performance measures. The study contrasts risk adjusted performance measures with non-risk adjusted traditional performance measures in a Property Finance business within the banking sector in South Africa. Following a literature review, the research proposes that risk adjusted performance measures, when compared with traditional non-risk based performance measures such as return on equity and return on assets, lead to different results on performance ranking of business units or activities within a business unit. Both quantitative and qualitative approaches to research are undertaken. We chose Nedbank Corporate Property Finance as a case study because of the simplicity for the researcher to access financial data for the quantitative part of the research and interviewees for the qualitative part of the research. The key findings in this research are that there are differences in performance rankings between traditional measures of performance and risk adjusted measures. Business activities that perform better on non-risk adjusted basis are not necessarily the best performing on a risk adjusted basis. Hypothesis testing also shows that the differences in performance rankings are material.
MICHAEL TICHAREVA RISK ADJUSTED PERFORMANCE MEASURES IN A PROPERTY FINANCE BUSINESS IN SA | 247
ASSA CONVENTION 2012, CAPE TOWN, 16–17 OCTOBER 2012
We therefore conclude that there is significant change in performance rankings after adjusting returns for risk, suggesting that the risk adjusted measures of performance lead to materially different strategic decisions on capital allocation and investment or disinvestment from a business activity compared with the non-risk adjusted performance measures. The study provides guidance to executives in banking and the financial services industry at large. The key message is, therefore, that banking executives must pay particular attention to risk adjusted performance measures in making strategic decisions such as pricing, capital allocation, investment and disinvestment from business activities. Risk adjusted performance measures have been found to be superior to the traditional measures, leading to optimal strategic decisions. Executives should implement sustainable risk based performance measurement systems that are built on a strong governance and risk management culture for the whole organisation. Apart from banking, executives in the financial services industry in general should focus on risk adjusted performance measures when making strategic decisions affecting the performance of their financial institutions. Shareholders also need to start asking critical questions about the performance of their investments relative to the risks taken by the executives. Very often, prospective and current shareholders look at return on equity and return on asset performance measures without paying particular attention to the risks associated with a particular investment. On a risk adjusted basis, businesses that perform better should, ideally, receive greater attention and be allocated more capital.
KEY WORDSEconomic capital; economic profit; economic value added (EVA); expected loss; risk adjusted performance measures (RAPMs); risk adjusted return on capital (RAROC); risk adjusted net income, unexpected loss
1. INTRODUCTION1.1 Purpose of the StudyThe purpose of this research is to analyse risk adjusted performance measures in a South African Property Finance Business. Conclusions are drawn on whether risk adjusted performance measures lead to materially different results on ranking of performance of property finance activities. The research also discusses the strategic decisions that result from using risk adjusted performance measures when compared with traditional measures such as return on equity and return on assets.
248 | MICHAEL TICHAREVA RISK ADJUSTED PERFORMANCE MEASURES IN A PROPERTY FINANCE BUSINESS IN SA
ASSA CONVENTION 2012, CAPE TOWN, 16–17 OCTOBER 2012
1.2 Context of the StudyThe study aims to contrast risk adjusted performance measures (RAPMs) with traditional performance measures such as return on equity (ROE) and return on assets (ROA) in a Property Finance business within the banking sector in South Africa. The Property Finance Business relates to the funding of commercial and industrial property investments and developments through both equity and debt funding. In South Africa, this is commonly performed within divisions of major banks.
The study analyses RAPMs, commonly referred to as risk adjusted return on capital or RAROC (Geyfman, 2005; Landskroner et al., 2005). These RAPMs also reflect the impact of diversification on performance (Geyfman, 2005; Landskroner et al., 2005).
An important concept closely related to RAROC is Economic Profit, which is a RAPM arrived at by subtracting the opportunity cost of capital from headline accounting profit (Kimball, 1998; Uyemura et al., 1996). Also known as Economic Value Added (EVA), it is considered the ultimate measure of shareholder value (Kimball, 1998; Uyemura et al., 1996). EVA was developed by and is a registered trademark of Stern Stewart and Company (Stoughton & Zechner, 2007; Uyemura et al., 1996).
The concept is that a firm only adds value for its shareholders if it makes a profit in excess of what could have been earned if its capital were invested elsewhere (Dermine, 1998; Zaik et al., 1996). This is an important concept in the efficient allocation of capital where there are competing priorities. Firms that make business decisions without explicitly incorporating the opportunity cost of capital will be inefficient users of capital, engaging in investments that generate low returns for shareholders (Kimball, 1998). This research, therefore, also analyses Economic Profit alongside RAROC.
While RAROC systems and Economic Profit are not new concepts, the focus on measuring risk adjusted performance is in the spotlight within the banking sector. In the US and Europe, this was mainly due to historic factors as noted by Zaik et al. (1996). There was increased requirement to provide management with a more reliable way to allocate capital. It was also a result of the implementation of Basel risk based capital requirements. There was increased focus by providers of capital on Economic Capital and risk adjusted return on capital as a measure of the efficient allocation and use of capital (Zaik et al., 1996). The concept of risk based capital became even more prominent with the implementation of Basel II in the past few years (Styper & Vosloo, 2005) and the more stringent Basel III capital requirements first announced in 2009 (Blundell-Wignall & Atkinson, 2010; Eubanks, 2010).
In addition, the increased competition in the banking industry and their provision of a wide range of non-traditional fee-based products and services also led to the pressure. The deregulation of the banking industry led to non-traditional products that use less capital. Then there were regulatory pressures to increase capital requirements to back capital intensive and riskier products (Zaik et al., 1996).
Other papers noted similar factors (Geyfman, 2005; James, 1996; Kupper, 2000;
MICHAEL TICHAREVA RISK ADJUSTED PERFORMANCE MEASURES IN A PROPERTY FINANCE BUSINESS IN SA | 249
ASSA CONVENTION 2012, CAPE TOWN, 16–17 OCTOBER 2012
Landskroner et al., 2005). These same factors apply to South Africa to a large extent and are evident in the banking industry today. For example, the Basel II framework as summarised by The Banking Association of South Africa (Styper & Vosloo, 2005) on the risk management and capital allocation for South African banking institutions can be noted as a key driver.
Banks have traditionally applied ROE and ROA as performance measures. For example, Bank of America had applied ROA until 1993 (Zaik et al., 1996). In South Africa, reporting of financial results for listed banks is based on achieving a ROE target. However, such performance measures were found to be inadequate (Geyfman, 2005; James, 1996; Kimball, 1998; Kupper, 2000; Landskroner et al., 2005; Zaik et al., 1996). These previous studies concluded that the use of RAROC as a performance measure would lead to different performance ranking among banks and banking divisions, different capital allocation decisions and different strategic decisions on investing and disinvesting from business units.
1.3 Problem StatementTo determine if the use of risk adjusted performance measures in a South African Property Finance Business leads to different strategic decisions by banking executives.
1.4 Significance of the StudyThe study fills a gap in that previous international studies conducted separate analysis of risk and return without deriving RAPMs. Studies conducted for banking institutions in the US (Geyfman, 2005) and Israel (Landskroner et al., 2005) noted a similar gap. No similar studies appear to have been conducted in South Africa. The study, therefore, brings to the fore the use of RAROC in measuring performance within a South African Property Finance business within the banking sector and the implications on strategic decision-making by banking executives.
With providers of capital focusing more on Economic Profit as a measure of performance (Nedbank, 2009a; Zaik et al., 1996), executives in banks will find themselves increasingly under pressure to maximise RAROC (Geyfman, 2005; James, 1996; Kimball, 1998; Kupper, 2000; Landskroner et al., 2005). This will imply designing and implementing strategies that focus on growing the share of Economic Profit rather than market share (Ward & Lee, 2002). Nedbank Group Limited has adopted this approach by implementing an Economic Capital Framework and a Risk Adjusted Performance Measurement Framework. (Nedbank, 2009b, 2009c). This approach requires a change in mindset by executives.
The study provides guidance to banking executives in the Property Finance industry to understand the implications of focusing on RAPMs and Economic Profit as measures of performance and to strategise accordingly in order to make appropriate strategic decisions.
1.5 Delimitations of the Study
250 | MICHAEL TICHAREVA RISK ADJUSTED PERFORMANCE MEASURES IN A PROPERTY FINANCE BUSINESS IN SA
ASSA CONVENTION 2012, CAPE TOWN, 16–17 OCTOBER 2012
— The study focuses on a Property Finance business within the banking sector as opposed to the property finance sector or the banking sector as a whole.
— The study was carried out using Nedbank Corporate Property Finance, the largest Commercial Property Finance division within a banking institution in South Africa.
— The study looks at portfolios in three regions in which Nedbank Corporate Property Finance operates i.e. Gauteng, KZN and Cape Town.
— The study looks at the debt funding and the equity funding books as separate operations.
— Due to the absence of data recorded consistently over the chosen sample period, the study only looks at a 7-year period from 2005 to 2011 as opposed to a longer period.
— Due to the absence of consistent data as stated above, the study was not carried out by property classes (i.e. offices, industrial, retail, vacant land and other specialist property classes).
1.6 Definition of Terms
Economic CapitalEconomic Capital refers to the risk capital allocated to cover unexpected losses with a specified degree of confidence (Geyfman, 2005; James, 1996; Kimball, 1998; Landskroner et al., 2005; Ward & Lee, 2002; Zaik et al., 1996). For example, this could be defined as the amount of capital needed to guarantee the solvency of a bank at a 99.97% confidence level, or alternatively, to cover a 0.03% probability of default over a 1 year period (James, 1996).
Economic ProfitEconomic Profit refers to earnings less opportunity cost of capital. (Geyfman, 2005; Kimball, 1998; Landskroner et al., 2005; Zaik et al., 1996). It is the “residual” earnings that are left after subtracting the cost of Economic Capital from risk adjusted net income (Zaik et al., 1996). Economic Profit is also often referred to as Economic Value Added (EVA), a trademark of Stern Steward and Company (James, 1996; Kupper, 2000; Uyemura et al., 1996). It is a RAPM.
Expected LossThis is the average rate of loss expected from a portfolio over a defined period, say one year (James, 1996; Zaik et al., 1996). This is charged to the Income Statement. In formula terms, Expected Loss can be defined as follows in terms of Basel II applications at Nedbank (Nedbank, 2009a, 2009c):
MICHAEL TICHAREVA RISK ADJUSTED PERFORMANCE MEASURES IN A PROPERTY FINANCE BUSINESS IN SA | 251
ASSA CONVENTION 2012, CAPE TOWN, 16–17 OCTOBER 2012
Risk Adjusted Performance Measures (RAPMs)RAPMs are performance measures or return on capital adjusted for the risks taken in doing business. RAROC and Economic Profit are RAPMs. Whichever way they are calculated, all RAPMs have one thing in common: they compare risk adjusted return against an appropriate hurdle rate that reflects the bank’s cost of capital or the opportunity cost to shareholders in holding equity in the bank (Geyfman, 2005; James, 1996; Landskroner et al., 2005).
Risk Adjusted Return on Capital (RAROC)RAROC, in its simplest form, is measured as Economic Profit divided by Economic Capital. It is a RAPM, registered as a trademark, that was developed by Banker’s Trust as part of a comprehensive system of risk management. It can be described as the ROE that would result from the company holding an amount of capital equal to Economic Capital (Ward & Lee, 2002). Other terms commonly used synonymous to RAROC (Dermine, 1998; Geyfman, 2005; James, 1996; Landskroner et al., 2005) are:
— RORAA: Return on Risk Adjusted Assets, — RAROA: Risk Adjusted Return on Assets, — RORAC: Return on Risk Adjusted Capital, and — RARORAC: Risk Adjusted Return on Risk Adjusted Capital.
Risk Adjusted Net IncomeThis is net income adjusted for Expected Loss and other adjustments such as non-recurring items and taxes (Uyemura et al., 1996).
Unexpected LossThis is the volatility of returns or losses, as measured by the standard deviation (actual capital may be held at multiple standard deviations as opposed to one standard deviation) of those losses or returns, around their expected value. It is the unexpected losses that create the need for Economic Capital (James, 1996).
EL = PD x LGD x EADWhere:EL is the Expected Loss.PD is the Probability of Default which measures the likelihood of a default event taking place.LGD is the Loss Given Default, which measures the actual loss incurred in the event of default.EAD is the Exposure at Default, which measures the outstanding loan balance at the time of default.
252 | MICHAEL TICHAREVA RISK ADJUSTED PERFORMANCE MEASURES IN A PROPERTY FINANCE BUSINESS IN SA
ASSA CONVENTION 2012, CAPE TOWN, 16–17 OCTOBER 2012
1.7 AssumptionsCapital Markets are imperfect (Froot & Stein, 1998; Zaik et al., 1996) and banks will incur costs of market frictions, including the following:
— taxes, — bankruptcy costs, — agency costs i.e. costs of conflicts between managers and shareholders, — costly renegotiations and restructuring of troubled credit, — costs of liquidation and recovery, and — legal costs.
These assumptions introduce reality by departing from the Modigliani & Miller’s Proposition 1 theory (Modigliani & Miller, 1958) that assumes frictionless capital markets with no costs.
— An implication of the above is that executives also add value in their businesses by reducing the costs of market frictions through active risk management. This means that risk management is important and affects the way capital is allocated among businesses, and ultimately the value of the businesses (Froot & Stein, 1998).
— Unlike in a perfect market, a large component of a bank’s assets and liabilities are not tradable i.e. are illiquid (Froot & Stein, 1998; Geyfman, 2005; Landskroner et al., 2005).
— Nedbank Corporate Property Finance is considered a representative of the Commercial Property Finance businesses within the South African banking institutions in the context of this research.
— The information provided by Nedbank Corporate Property Finance for the analysis is relatively accurate and relevant for the purposes of the study.
— The respondents to the open-ended face-to-face interview are fairly knowl-edgeable in the management of banking institutions and the property finance business.
2. LITERATURE REVIEW2.1 IntroductionThis section reviews the literature on RAPMs. In particular, we consider RAROC based systems and Economic Profit and their implications for strategic decision-making. We outline the reasons for banks moving to RAPM systems. We also discuss briefly the financial theory behind the systems.
The implication of diversification and risk management was an important result of previous studies (Geyfman, 2005; Landskroner et al., 2005). We, therefore, discuss diversification and risk management and the strategic decisions that arise on capital allocation used for calculating RAPMs.
The use of single or multiple hurdle rates as the minimum required cost of capital is also discussed. This was another important result from previous studies that
MICHAEL TICHAREVA RISK ADJUSTED PERFORMANCE MEASURES IN A PROPERTY FINANCE BUSINESS IN SA | 253
ASSA CONVENTION 2012, CAPE TOWN, 16–17 OCTOBER 2012
has an impact on applicability of RAPMs (Kimball, 1997). A section on Economic Profit is included to discuss its use for calculating RAROC and to highlight results drawn from previous studies (Kimball, 1998). Economic Capital, another important element of RAROC, is not included as a separate section but is discussed extensively throughout the literature review.
Finally, results of analysis of RAROC drawn from previous studies in Israel (Landskroner et al., 2005) and the US (Geyfman, 2005) are outlined and their implications discussed. These two previous studies on the analysis of RAROC form the basis for this study.
Definitions of key terms relevant to the study have already been included in section 1.6 above. These terms feature frequently in this literature review and the rest of the research report.
The literature reviewed is mainly from the late 1990s to the mid 2000s. This is because of limited recent literature written over the past five years identified on the subject. However, although relatively old, the literature continues to be relevant and applicable to the current environment and across different markets.
2.2 Background discussionBanks in Europe and the US have been under tremendous pressure to use RAPMs as a basis for measuring financial performance of their businesses. As one study noted (Zaik et al., 1996), the most powerful impetus to bankers’ use of more systematic risk measures came from increasingly activist institutional investors. The expectation was that better measurement methods would produce better performance by holding managers accountable for the amount of investor capital they are putting at risk (Zaik et al., 1996). Another study highlighted the changes in the structure of financial markets due to innovations in the last three decades that has led to new investment opportunities and new ways of managing risk (Merton, 1995).
Apart from this, the following are the other key factors forcing banks to allocate capital and measure performance on a risk adjusted basis:
— To provide management with a more reliable way to allocate capital (Zaik et al., 1996).
— Implementation of Basel risk based capital requirements (James, 1996). In South Africa, the Basel II framework as summarised by The Banking Association of South Africa (Styper & Vosloo, 2005) on the risk management and capital allocation for banking institutions can be noted as a key driver. Internationally, there is now also the proposed Basel III (Blundell-Wignall & Atkinson, 2010; Eubanks, 2010).
— Increased deregulation in the US and other international markets leading to bank consolidation and diversification where the required Economic Capital to support a well diversified business was expected to be lower due to reduced risks of the overall business (Zaik et al., 1996).
254 | MICHAEL TICHAREVA RISK ADJUSTED PERFORMANCE MEASURES IN A PROPERTY FINANCE BUSINESS IN SA
ASSA CONVENTION 2012, CAPE TOWN, 16–17 OCTOBER 2012
— The increased competition in the banking industry and their provision of a wide range of non-traditional fee-based products and services that do not consume large amounts of capital (James, 1996).
— Banks started to allocate capital on a risk adjusted basis partly because of regulatory initiatives, but also because of the realisation that businesses with few assets can be significant users of capital (Kimball, 1997). In the South African Property Finance industry, a notable example is the funding of non-income producing properties such as vacant land that are considered riskier, therefore uses proportionately more Economic Capital and yield poorer RAROCs, unless specifically priced for, compared with income producing assets.
It was hoped that RAPM systems such as RAROC would create a culture of value creation within an organisation (Kimball, 1997). A number of studies have concluded that traditional based performance measures, in particular ROE and ROA, are inadequate as a means for optimal decision-making (Geyfman, 2005; James, 1996; Kimball, 1998; Kupper, 2000; Landskroner et al., 2005; Uyemura et al., 1996; Zaik et al., 1996). They concluded that the use of RAROC as a performance measure would lead to different performance ranking among banks and banking divisions, different capital allocation decisions and different strategic decisions on investing and disinvesting from business units.
To show its importance, application of RAROC includes (Geyfman, 2005; James, 1996; Kimball, 1998; Kupper, 2000; Landskroner et al., 2005; Uyemura et al., 1996; Zaik et al., 1996):
— pricing decisions for products, — capital allocation among business units, products and activities, — performance measurement for business units, products and activities, — risk management, — strategic decision-making such as investment and disinvestment decisions or
mergers and acquisition decisions, and — performance incentives for managers.
Taking pricing decisions for example, a major contribution of RAROC is the inclusion of explicit charges for cost of capital in addition to other risk premiums such as credit risk premium. By doing this, it ensures that banks price individual loans to cover credit risks and also generate adequate return for shareholders (Kimball, 1998). Often, pricing is done with reference to competition rather than economic based pricing. As a result, the risk-adjusted profitability is traded for market share. This behaviour destroys shareholder value since the resultant RAROC is then below a hurdle rate. If value is being destroyed, a decision to redeploy capital should, ideally, be taken (Ward & Lee, 2002).
MICHAEL TICHAREVA RISK ADJUSTED PERFORMANCE MEASURES IN A PROPERTY FINANCE BUSINESS IN SA | 255
ASSA CONVENTION 2012, CAPE TOWN, 16–17 OCTOBER 2012
2.3 Risk Adjusted Performance Measurement Systems2.3.1 Risk Adjusted Return on Capital (RAROC) Based System at Bank of
AmericaRAROC was first developed by Bankers’ Trust in the late 1970s and is registered as a trademark (Stoughton & Zechner, 2007). The aim was to measure the risk of the bank’s credit portfolio and to determine the amount of capital required to limit the risks to a specified probability of loss (Zaik et al., 1996). Bank of America then implemented a RAROC based system in 1993 after years of measuring performance based on ROA. The main reason was to use it as a tool to allocate capital efficiently among business units (James, 1996).
RAROC-based systems allocate capital for two basic reasons (James, 1996; Zaik et al., 1996). The first is risk management, where the aim is to determine the bank’s optimal capital allocation. The process involves estimating how the risk of each business unit contributes to the overall risk for the bank, hence to the bank’s overall capital requirements. RAROC based systems imply that you get a better return on the application of capital, which by implication maximises the bank’s Economic Profit. The second is performance evaluation, where the aim is to assign capital so that risk adjusted rate of return, and ultimately the Economic Profit, of each business unit is assessed. This then enables an assessment of each business unit’s contribution to shareholder value (James, 1996; Zaik et al., 1996).
These views were reiterated in later studies (Geyfman, 2005; Landskroner et al., 2005). Failure to allocate capital based on the amount of risk involved can lead to serious performance measurement errors (Kimball, 1997).
In terms of the Modigliani & Miller’s Proposition 1 (Modigliani & Miller, 1958), where an efficient market exists, with no taxes, bankruptcy costs and conflict between managers and shareholders, pricing of specific risks would be the same for all business units (Froot & Stein, 1998). If markets were assumed to be efficient, then managers would not add value by managing or diversifying risks as investors are able to diversify their portfolios at fair costs.
However, this is rarely the case in practice. Because of the inefficiency of the market, RAROC systems are very important as an integral strategy of the bank’s operations (Froot & Stein, 1998). Capital market frictions provide an economic rational for risk management and allocation of capital based on riskiness of the operations (Ishikawa, Yamai & Ieda, 2003). Risk management and capital allocation based on the volatility of a business unit’s cashflows, for example, were the basis of and the justification for Bank of America’s RAROC system (James, 1996).
Bank of America implemented the RAROC system on the basis that if market frictions exist, then each business unit or project must have a hurdle rate or cost of capital that reflects the unit’s contribution to the overall volatility of the bank’s cashflows (James, 1996; Zaik et al., 1996). From financial theory, they recognised that the bank should hedge all tradable risks, typically interest rate risks and currency risks, at fair cost in the market since the cost of the bank bearing these would exceed the cost
256 | MICHAEL TICHAREVA RISK ADJUSTED PERFORMANCE MEASURES IN A PROPERTY FINANCE BUSINESS IN SA
ASSA CONVENTION 2012, CAPE TOWN, 16–17 OCTOBER 2012
of the bank hedging the risks at fair value. Thus, they argued that the only risks the bank should assume are illiquid or non-tradable risks in which it has a comparative advantage to assume, such as credit risk that it can manage (Froot & Stein, 1998; Zaik et al., 1996). It, therefore, follows that one of the fundamental roles of banks and other financial institutions is to trade in illiquid assets, which, because of their information insensitive nature, cannot be traded without friction in the market (Froot & Stein, 1998).
In practice, though, there does not seem to be evidence that hedging all tradable risks in the market at fair value will be less costly to the bank than to assume these risks internally. There are other strategic factors such as loss leading and portfolio diversification that may outweigh the costs and cause the bank to continue to hold tradable risks alongside non-tradable risks. There may also not be a sufficiently large enough market for all tradable risks if all the banks were to be in the market seeking a buyer for their tradable risks.
Before RAROC and Economic Profit can be calculated, capital must be allocated to business units. At the Bank of America, the policy was to capitalise each of the 45 business units in a manner consistent with an AA credit rating based on each business unit’s stand-alone risk, but also adjusting for the impact of diversification on risk reduction and capital requirements (James, 1996; Zaik et al., 1996).
Bank of America identified four key sources of risk associated with its various operations (James, 1996; Zaik et al., 1996). These were:
— credit risk, the risk of default by a borrower, — country risk, the risk of loss on foreign exposures arising from government
action, — market risk, the risk of loss due to changes in market conditions i.e. currency
risk and interest rate risk, and — business risk, the uncertainty in revenue and expenses associated with non-
portfolio risks. This is a function of general industry factors, company specific factors and external factors such as regulations and technological changes. Business risk is well defined and discussed within an Economic Capital framework in a later paper (Doff, 2008).
These risks were to be measured along two dimensions (James, 1996; Zaik et al., 1996). The first is the Expected Loss, the average loss expected from a portfolio. The second is the Unexpected Loss, the amount of capital required to guarantee solvency of the bank with a particular degree of confidence, 99.97% say, or a particular probability of default, 0.03% say. This represents the Economic Capital.
Risk measurement and capital requirements were made at the lowest level that the data could support. This then provided the basis for allocating capital among the bank’s business units and ultimately calculating RAROCs and Economic Profits. By 1997, RAROCs could be calculated down to the product and transaction level (James, 1996; Zaik et al., 1996).
MICHAEL TICHAREVA RISK ADJUSTED PERFORMANCE MEASURES IN A PROPERTY FINANCE BUSINESS IN SA | 257
ASSA CONVENTION 2012, CAPE TOWN, 16–17 OCTOBER 2012
Other papers (Nakada et al., 1999; Ward & Lee, 2002) discussed the application of RAROC based systems in risk management and capital allocation in a property and casualty insurance context. These papers noted the absence of standard frameworks that link capital and the risks assumed by an insurance company. They noted that insurance executives tended to manage the capital available rather than the capital required to support the risks that they take. They then proposed frameworks for linking risks with capital, similar to the banking industry RAROC approaches.
2.3.2 Implications of Risk ManagementRisk management is critical in the management of financial institutions such as banks. If risk is defined as the volatility of market value (James, 1996), then the overall bank capital should be allocated on that basis, and capital to individual business units should be made on the basis of the contributions of each unit to the overall volatility of the bank’s market value (Kupper, 2000; Zaik et al., 1996). This implies that risk management by business unit managers to reduce this volatility is an important element of their jobs.
Risk management should be viewed as a tool to optimise risk/reward trade-off and not about minimising the absolute level of risk (Kupper, 2000). Measuring the risk and reward trade-off through RAPMs reinforces the need for sound risk management practices (Kupper, 2000). The main point of interest, therefore, is minimising all the factors that affect the volatility in market value or cashflows. Adjusting the results for risk is expected to create a level playing field for performance evaluation and resource allocation among different business units. This results in RAPMs that establish a link between the business and the risk decisions made (Kupper, 2000).
In summary, banks need to build management systems that provide a natural focus on risks as one of the key drivers of performance. This will promote decisiveness on the level and nature of risk that the bank is prepared to take (Kupper, 2000), hence the risk adjusted performance of the bank. Similar conclusions on the integration of risk management, capital allocation and performance measurement into the overall management of financial institutions were also drawn in other notable papers (Ishikawa et al., 2003; Merton & Perold, 1993; Nakada et al., 1999; Stoughton & Zechner, 2007; Uyemura et al., 1996; Ward & Lee, 2002). Another notable paper defines and discusses business risk in more detail within the Economic Capital and risk management frameworks (Doff, 2008).
2.3.3 Implications of DiversificationDiversification takes various forms, including by geography, products or markets. The impact of diversifying into businesses or activities that are not strongly correlated is to reduce the bank’s risks, defined as volatility in market value, hence reducing overall capital requirements (Kupper, 2000; Zaik et al., 1996). Diversification removes the ex-tremes from both ends i.e. downside risks and upside potential. Performance is essen-tially smoothed as the performance of the individual business units is not correlated.
258 | MICHAEL TICHAREVA RISK ADJUSTED PERFORMANCE MEASURES IN A PROPERTY FINANCE BUSINESS IN SA
ASSA CONVENTION 2012, CAPE TOWN, 16–17 OCTOBER 2012
If a bank is viewed as a portfolio of businesses with risks of the businesses being positively but imperfectly correlated, then the overall risk of the bank will be reduced by the imperfect correlation of the individual businesses’ risks and the required capital of the bank will be less than the sum of the capital allocations of the stand-alone businesses without taking into account the impact of diversification (Kimball, 1997).
With less than perfectly positively correlated risks and returns of various busi-ness units, it is expected that the overall risks of the bank will be less than the risks of the individual businesses (James, 1996). The result is that the required capital of the overall business is reduced due to diversification. This means that the capital allocated to individual business units must take into account the impact of diversification on their risk profiles. Businesses that would otherwise have been allocated higher capital will benefit from this diversification by being allocated less capital, thereby improving their RAPMs.
Over the last two decades, there has been considerable consolidation of financial institutions in the US and Europe (Landskroner et al., 2005). If we look at South Africa, ABSA Bank was born out of the consolidation of 4 banks in the late 1990s and some divisions of BOE were absorbed into Nedbank.
One of the main motives for consolidation was the potential efficiency gains from risk reduction that results from diversification (Landskroner et al., 2005). Possible gains from consolidation and diversification were identified by Landskroner et al. (2005) as managerial economies of scale, increased debt capacity, increased efficiency of resource allocation in internal markets and the exploitation of the firm’s specific assets in different business units. On the contrary, the possible costs of diversification include the inefficient allocation of capital among the different segments and the difficulty in designing optimal compensation schemes for managers.
Realising the benefits of diversification largely depends on the portfolios held by banks. Where efficient portfolios or efficient frontiers were constructed in terms of the mean-variance portfolio theory, the benefits of diversification were found to outweigh the costs (Geyfman, 2005; Landskroner et al., 2005). It would, therefore, be expected that well-diversified businesses would produce better RAPMs.
2.3.4 Use of Single or Multiple Hurdle RatesIn order to calculate RAROC and Economic Profit, the cost of equity capital or a hurdle rate needs to be assigned. This can be a single company-wide hurdle rate or a business unit specific hurdle rate to take into account the riskiness of that business or activity (Kimball, 1997) as well as business strategy such as loss leading. A measure such as ROE, or more sophisticated models such as the Capital Asset Pricing Model, could be used to derive the rate.
The use of a single hurdle rate is inconsistent with CAPM that requires that the cost of capital for each activity or project be adjusted for the specific or systematic risks of that project (Zaik et al., 1996). This implies that each business unit must be assigned a hurdle rate specific to it. Systematic risk indicated above is measured by the beta of
MICHAEL TICHAREVA RISK ADJUSTED PERFORMANCE MEASURES IN A PROPERTY FINANCE BUSINESS IN SA | 259
ASSA CONVENTION 2012, CAPE TOWN, 16–17 OCTOBER 2012
that business unit, which is the covariance of returns from or value of that business unit, with the returns from or value of a well-diversified market portfolio of similar stand-alone businesses divided by the variance of returns from or value of the market portfolio.
However, Bank of America, for example, used a single hurdle rate (James, 1996; Zaik et al., 1996) for the following reasons:
— It was considered difficult to estimate betas for individual business units with few stand-alone competitors as proxies for market portfolio.
— Given the lack of objective data, the “influence costs” of managing disputes between different managers’ assessed costs of capital for their units were consid-ered likely to be significant.
— They applied judgement and concluded that the more theoretical precise use of CAPM would not lead to materially different results.
The importance of determining an appropriate hurdle rate is reflected in the conclusions that are drawn when RAPMs are calculated for business units. A hurdle rate represents shareholders’ minimum required return. Therefore, if a business unit produces RAROC higher than the hurdle rate, then it is creating value for shareholders. If the RAROC is below the hurdle rate, then the unit is reducing shareholder value (James, 1996; Zaik et al., 1996). If the hurdle rate is incorrect or inappropriate, the risk adjusted performance measurement will be misleading.
It was noted in the study by Kimball (1997) that initially banks designed single hurdle rates. These reflected management’s overall objective of ROE and had no relation-ship with the riskiness of the business undertaken. Over time, bank executives realised that a single hurdle rate discriminated against low-risk businesses in favour of high-risk businesses. Low-risk businesses would have difficulty meeting the bank-wide hurdle rate. This was because low-risk businesses, by their nature, require lower equity risk pre-miums so tend to generate lower returns relative to high-risk businesses. This meant that if resources and strategic decisions were based on returns relative to bank-wide single hurdle rates, the high-risk business would receive a disproportionate share of resources being written. This would lead to a high proportion of high-risk businesses, which would be disastrous if the high-risk businesses, although exceeding the bank’s hurdle rate, were underperforming competitors in similar type business (Kimball, 1997).
Banks then began to apply hurdle rates that reflected the riskiness of the business. The bank-wide hurdle rate was calculated as a weighted average of the risk-adjusted hurdle rates for each of the businesses using the Economic Capital allocated to each business as the weights. This results in hurdle rates for risky businesses being substantially higher than the bank’s target hurdle rate and that for low-risk businesses substantially lower. The resultant decisions based on risk-adjusted hurdle rates would tilt the business towards strategic decisions that favour relatively lower risk businesses since it becomes difficult for high-risk businesses to meet their higher hurdle rates (Kimball, 1997).
260 | MICHAEL TICHAREVA RISK ADJUSTED PERFORMANCE MEASURES IN A PROPERTY FINANCE BUSINESS IN SA
ASSA CONVENTION 2012, CAPE TOWN, 16–17 OCTOBER 2012
Apart from Kimball (1997), other notable papers (Froot & Stein, 1998; Milne & Onorato, 2009) also highlighted the inappropriateness of using a single hurdle rate as a weakness of RAROC based systems. However, other papers (Nakada et al., 1999), although drawing similar conclusions that activities with RAROCs above an equity hurdle rate for that activity increase shareholder value while activities with RAROCs below the equity hurdle rate diminish shareholder value, fell short of discussing in detail the appropriateness of choosing single or multiple hurdle rates.
2.3.5 Economic ProfitEconomic Profit is a RAPM calculated as earnings less opportunity cost of capital (Geyfman, 2005; Kimball, 1998; Landskroner et al., 2005; Zaik et al., 1996). Also known as Economic Value Added (EVA), it is considered the ultimate measure of shareholder value (Kimball, 1998; Uyemura et al., 1996). EVA was developed by and is a registered trademark of Stern Stewart and Company (Stoughton & Zechner, 2007; Uyemura et al., 1996)
In most analysis performed in a company or business unit, of interest is maximising shareholder value. It, therefore, follows that a manager who maximises earnings or growth in earnings rather than Economic Profit will not be maximising shareholder value. Such a manager will invest additional units of equity as long as the marginal contribution to earnings is positive. However, by following that approach, the contribution of the last unit of equity will be zero and less than its opportunity cost. This means that the average return on equity will be less than its opportunity cost and the manager should ideally not be investing further into that activity once the average return on equity becomes less than its opportunity cost (Kimball, 1998).
On the contrary, maximising Economic Profit will add units of equity capital only until marginal contribution of capital is equal to its opportunity cost, and the average return on equity will equal or exceed its opportunity cost (Kimball, 1998). As a result, companies that make business decisions without explicitly incorporating the opportunity cost of capital will be inefficient users of capital, engaging in investments that generate low returns for shareholders (Kimball, 1998).
While RAROC is an important RAPM, the analysis of rates of return (whether RAROC or ROE) should not be the last step in the analysis. These measures do not provide a measure of how much value is being created or destroyed in a business unit. It, therefore, follows that the use of RAROC, or any rate of return, to evaluate performance can lead to company-wide underinvestment (James, 1996).
If we accept the view that maximising shareholder wealth requires that business managers undertake all new projects that exceed the hurdle rate, then managers must be rewarded based on Economic Profit and not solely based on RAROC or ROE. If they are rewarded on the basis of RAROC only for example, they are likely to reject value-increasing projects that will lower their average returns even if such projects exceed the hurdle rate (Zaik et al., 1996) or generate a positive Economic Profit (Kimball, 1998).
MICHAEL TICHAREVA RISK ADJUSTED PERFORMANCE MEASURES IN A PROPERTY FINANCE BUSINESS IN SA | 261
ASSA CONVENTION 2012, CAPE TOWN, 16–17 OCTOBER 2012
Economic Profit allows the operating performance of non-fee based off balance sheet activities to be compared with that of traditional asset based activities. The value add associated with each activity is then used as a basis for managerial incentive compensation as well as to guide managers on decisions of whether to expand that activity through additional investment or curtail operations (James, 1996).
Having discussed the above, it is important to note that Economic Profit as a measure of performance is misleading when it is not possible to allocate capital and earnings to business units in a way that isolates economic revenue and costs (Kimball, 1998). This means that each business unit must have its own profit and loss account and balance sheet. The allocation of costs for shared services and overheads must be equitable and a true reflection of the costs actually incurred by the specific business unit.
2.3.6 Analyses of RAPMs in Israel and the US Banking SectorsThe studies in Israel (Landskroner et al., 2005) and the US (Geyfman, 2005) looked at deriving RAPM in banking that are applications of performance measures in finance: the Treynor, Sharpe and Jensen measures. The studies used two approaches of measuring performance, the stand-alone approach and the portfolio approach.
The stand-alone approach is where assets are considered in isolation and risk is measured in terms of volatility of returns without accounting for the correlation between a bank’s activities. The key model for this approach is the one-factor CAPM. One of the problems with the stand-alone approach is that the assumption made under the one factor CAPM, that all tradable risks can be diversified away at little cost, does not hold in practice since the bulk of the assets of a bank such as loans are not easily tradable (Froot & Stein, 1998). The authors then suggested a two-factor pricing model and built a model that is rooted in the objective of maximising shareholder value in an efficient market, similar to the classical approach to finance. However, the model also incorporates two other key features, that there is a well-founded concern with risk management and that not all risks can be hedged in the market (Froot & Stein, 1998).
The portfolio approach is where correlations between components of the banking activity are taken into account.
The main objective of the studies was to overcome what the authors viewed as the methodology and data deficiencies of previous studies that had used simulations and hypothetical data. These previous studies had found different results, especially on the gains on diversification. The authors, therefore, used actual data from the banks’ financial statements over 10-year periods. In addition to deriving RAPMs, they also derived efficient frontiers and optimal portfolios and compared the results of these with the strategic decisions arising from RAPMs. They found these to be consistent. However, this second element of their study is not the focus of this study.
The main findings of the Israel study (Landskroner et al., 2005) were that RAPMs yield performance ranking results that differ from those obtained using traditional measures such as ROE, that there were gains in diversification and that the results of risk adjusted performance were consistent with optimal portfolio choice.
262 | MICHAEL TICHAREVA RISK ADJUSTED PERFORMANCE MEASURES IN A PROPERTY FINANCE BUSINESS IN SA
ASSA CONVENTION 2012, CAPE TOWN, 16–17 OCTOBER 2012
Geyfman (2005) applied a similar approach and arrived at similar results for US banks. The Israel study (Landskroner et al., 2005) concluded that despite the small size of their sample and the case study nature of the study, the results were meaningful and have important implications for other banking systems in similar countries such as South Africa, which is included in Israel’s reference group in terms of GDP and the structure of the banking system.
In their study, Landskroner et al. (2005) defined indices discussed below that they collectively referred to as RAROC indices.
Return on Risk Adjusted Capital (RORAC)RORAC is calculated by dividing the return in excess of a risk-free rate (financing costs) by the Economic Capital needed to cover losses that are expected during the given period at a stated probability. Economic Capital is measured using the concept of Value at Risk (VaR) (Duffie & Pan, 1997; Fallon, 1996). The authors note that this is a widely used measure especially for assessing market risks but the main flaw of VaR is that it generally understates losses in the tail, unless returns are normally distributed, which is not always the case in practice. For RORAC, risk adjustment is in the denominator and risk is measured in terms of the standard deviation of returns. This index was regarded as an application of the Sharpe ratio. The Sharpe measure, which is a stand-alone approach, does not incorporate the effects of diversification and is referred to as reward to variability. According to CAPM, such a measure of risk is considered appropriate for a well-diversified portfolio.
Risk Adjusted Return on Capital (RAROC)RAROC is calculated by dividing the risk adjusted return i.e. the return in excess of a hurdle rate by the required capital or regulatory capital. Risk adjustment is in the numerator and the risk adjusted return is based on what they called the equilibrium model for pricing of capital assets. This index may be regarded as an application of the Treynor measure. The Treynor measure, which is a portfolio-based approach, incorporates the effects of diversification and is referred to as reward to volatility. This measure is considered appropriate for individual assets within a well-diversified portfolio.
Risk Adjusted Return on Risk Adjusted Capital (RARORAC)RARORAC is calculated by dividing the risk adjusted return by Economic Capital. In this index, a double risk adjustment is made in both the numerator and the denominator. The numerator can be considered an application of the Jensen measure, which is what they called an abnormal earnings index based on an internal risk measure. The Jensen alpha is another portfolio-type risk measure. It indicates if the earnings of an activity are above the benchmark portfolio based on an internal CAPM. This can be considered a measure of the EVA of an activity, which has many uses in banking as already noted.
MICHAEL TICHAREVA RISK ADJUSTED PERFORMANCE MEASURES IN A PROPERTY FINANCE BUSINESS IN SA | 263
ASSA CONVENTION 2012, CAPE TOWN, 16–17 OCTOBER 2012
Geyfman (2005) notes that both the reward to variability, the Sharpe measure, and the reward to volatility, the Treynor measure, are modifications of RAROC and provide a comparable index by which several portfolios can be assessed and ranked. In terms of EVA, he notes that the proponents of EVA contend that by incorporating the opportunity cost of equity capital into performance measurement and incentive systems, an EVA-based system makes explicit each bank manager’s increased focus and commitment.
In performing the analysis of RAROCs, two key questions were asked. The first was how a specific activity performed relative to the bank portfolio as a whole. The second was how a specific activity or banking group performed relative to other activities of the bank or groups. In examining performance of a specific activity, the authors compared activities in the different banks and in the banking system as a whole. They also compared activities at each bank. They used Israel’s five largest banking entities and the banking system as a whole, which is an aggregate of data for the five banks, was considered as a sixth bank.
In their analysis, the focus was on comparing results of RAPMs with those of ROE. The authors made similar conclusions on the importance of RAROC and Economic Profit or EVA to the other literature already discussed above. In particular, they concluded that a positive EVA implies that an activity must be undertaken because it has a superior risk adjusted performance compared with the benchmark portfolio. On RAROC, they concluded that the higher the risk adjusted return, the better the portfolio’s performance and the more likely it is to be included as a candidate for increased investment (Geyfman, 2005).
2.3.7 PropositionRisk adjusted performance measures when compared with traditional non-risk based performance measures such as return on equity and return on assets, lead to different results on performance ranking of business units or activities within a business unit.
2.4 Conclusion of Literature Review2.4.1 Summary of Literature ReviewWith RAPMs such as Economic Profit and RAROC frameworks, a financial institution can measure where capital is invested, how much the capital invested is earning relative to a hurdle rate and other performance measures, and how much capital the company needs to hold to maintain a given level of solvency, hence a given debt rating (Ward & Lee, 2002). Similar questions were asked by Nakada et al. (1999).
RAROC also helps with making risk-return trade-off decisions as well as many other strategic decisions such as pricing, performance measurement and mergers and acquisition decisions. Ward and Lee (2002) note that true insight into the economic performance of a company comes only through linking risk and capital. While quantifying the overall risk of the company is important, it is the allocation of overall Economic Capital back to the individual business units that enables the linking of
264 | MICHAEL TICHAREVA RISK ADJUSTED PERFORMANCE MEASURES IN A PROPERTY FINANCE BUSINESS IN SA
ASSA CONVENTION 2012, CAPE TOWN, 16–17 OCTOBER 2012
tactical decisions with strategic goals, such as hurdle rates (Ward & Lee, 2002). It is then possible to calculate RAPMs and make strategic decisions.
Application of RAROC alongside appropriately determined hurdle rates and the strategic decisions on pricing and capital allocation that arise could lead to the business shrinking as unprofitable products or businesses on a risk-adjusted basis are discarded. Although the business shrinks, there is more efficient use of capital, increased return and shareholder value creation. Excess capital could then be returned to shareholders or invested in more profitable businesses or products.
A business that consumes less Economic Capital is likely to give a desirable RAROC. Overcapitalising a company drags actual ROE because of the inefficient use of surplus capital. This destroys shareholder value. Capital deployment may be necessary between product lines or business units to improve efficient use of capital, hence increasing RAROC (Ward & Lee, 2002). Decisions to redeploy capital could include redeploying capital from less profitable to more profitable products and business units, returning capital to shareholders in the form of share buy backs or increased dividends and expanding into new businesses or products that will earn an adequate return.
Risk management is an important element of a RAROC-based system. Diversification as part of risk management reduces risks and the amount of capital required for a particular business (Kimball, 1997). This in turn has implications on the resulting RAROCs.
Most importantly, the literature review concludes that RAPMs when compared with traditional non-risk based performance measures such as ROE and ROA, lead to different results on performance ranking of business units and the strategic decisions that follow. In particular, results of the Israel study (Landskroner et al., 2005) and US study (Geyfman, 2005) indicate that RAPMs:
— are different from traditional performance measurement metrics such as ROE especially when correlations between banks’ activities are non-zero,
— are consistent with optimal allocation of capital derived from the mean variance portfolio theory or optimal portfolio theory, and
— reflect gains from diversification.
The performance rankings under ROE were different from the rankings under RAROC. An analysis of RAROC based on Sharpe, Treynor and Jensen measures borrowed from finance to ascertain this conclusion in a Property Finance Business in South Africa is the subject of this study.
2.4.2 PropositionRisk adjusted performance measures when compared with traditional non-risk based performance measures such as return on equity and return on assets, lead to different results on performance ranking of business units or activities within a business unit.
MICHAEL TICHAREVA RISK ADJUSTED PERFORMANCE MEASURES IN A PROPERTY FINANCE BUSINESS IN SA | 265
ASSA CONVENTION 2012, CAPE TOWN, 16–17 OCTOBER 2012
3. RESEARCh METhODOLOGY3.1 IntroductionThis section describes the research methodology that was followed to address the proposition that has been put forward in the Literature Review section above.
The section starts with a discussion of the research methodology followed by a discussion of the population sample and the sampling method used. It then discusses the research instrument that was used for data collection and the procedure for data collection. A discussion on the method of analysis for the data then follows. The section finishes with a discussion on the limitations, the validity and reliability of the study.
3.2 Research MethodologyA mixed approach to this research was followed. This combines both qualitative and quantitative data collection and analysis research methods (Cresswell, 2003; Tashakkori & Teddlie, 1998). A mixed method assumes that collecting a diverse range of data provides a better understanding of the research problem (Cresswell, 2003). This assumption is consistent with the objective of this research, which aims to reconcile theory with practice. The research discusses how the RAPMs could affect strategic decisions such as resource allocation compared with traditional ROE and ROA methods. It is therefore believed that a mixed research method is more appropriate for this study in order to reconcile theory with practice. Triangulation of methods helps in combining qualitative and quantitative approaches, thus providing a richer understanding of an issue and overcoming limitations of any one method (Kalof, Dan & Dietz, 2008).
Data collection began with collection of quantitative financial data from Nedbank Corporate Property Finance. It was then followed by semi-structured open-ended face-to-face and telephonic interviews to collect detailed views of the executives of the business unit on RAPMs. The interview qualitative data augmented the quantitative data and assisted with interpretation and reconciliation of the results of the quantitative data analysis with the views of the executives.
3.3 Research DesignA case-study approach combined with mathematical and statistical modelling and open ended interviews was followed.
The case study chosen was Nedbank Corporate Property Finance. It is the largest Commercial Property Finance division of a bank in South Africa measured in terms of size of loan book, with a loan book in excess of R80 billion as at 31 December 2011. It is, therefore, considered a good representative of the Commercial Property Finance businesses within banking institutions in South Africa.
Analysis of the quantitative data to calculate RAPMs was undertaken through the application of mathematical models based on studies by Landskroner et al. (2005) and Geyfman (2005) in Israel and the US respectively. The mathematical models are an application of finance-based RAPMs to banking. These RAPMs are the Sharpe,
266 | MICHAEL TICHAREVA RISK ADJUSTED PERFORMANCE MEASURES IN A PROPERTY FINANCE BUSINESS IN SA
ASSA CONVENTION 2012, CAPE TOWN, 16–17 OCTOBER 2012
Treynor and Jensen measures which were modified to use internal data as opposed to market data.
Statistical modelling in the form of Spearman Rank Correlation calculations and hypothesis testing on the performance rankings of the different performance measures were also performed as part of the quantitative data analysis.
The semi-structured open-ended face-to-face and telephonic interviews assisted in explaining the quantitative results. Data was collected and analysed in stages although the results of one method were not dependent on the other.
The advantages of this approach as it relates to this research included the following:
— Nedbank Corporate Property Finance being large was considered a good repre-sentative of the commercial property finance businesses in South Africa.
— Financial data collection was simplified since it did not involve many organisa-tions.
— Use of more than one organisation could have introduced inconsistencies depending on how the data were recorded, unless such data were published on a standardised basis.
— The mathematical models applied already exist from previous studies and finance theory for the analysis of the RAPMs, so there were no new models derived.
— Interviews assisted in reconciling theory with practice. — Triangulation of methods increased the validity of results and led to greater con-
fidence (Kalof et al., 2008). — The researcher has knowledge of Nedbank Corporate Property Finance, which
made data collection easier and it was also easier to convince interviewees to participate.
The following disadvantages also existed: — There was potential that Nedbank Corporate Property Finance may not be
viewed as a true representative of Commercial Property Finance divisions of banking institutions in South Africa. This may affect external validity of the results.
— There was potential that it could take time to analyse and interpret both quantitative and qualitative data. However, this was mitigated by the fact that more emphasis was being placed on the quantitative element of the research for which similar research and analysis has already been undertaken. This helped speed up the process.
— The choice of Nedbank Corporate Property Finance as a convenience sample- based case study could be viewed as potentially introducing researcher bias. However, the advantages of the convenience of this method and the fact that quantitative data is factual seem to outweigh the fears of perceived researcher bias.
MICHAEL TICHAREVA RISK ADJUSTED PERFORMANCE MEASURES IN A PROPERTY FINANCE BUSINESS IN SA | 267
ASSA CONVENTION 2012, CAPE TOWN, 16–17 OCTOBER 2012
3.4 Population and sample3.4.1 Case SiteNedbank Corporate Property Finance was chosen as a case study for this research because of the simplicity for the researcher to access financial data and interviewees. This could be considered a convenient sample. In addition, the size of the division’s loan book, in excess of R80 billion as at 31 December 2011, can be considered large enough to yield credible results and to be representative of the other smaller commercial property finance divisions within the industry that could have been included in the study. The sample population is, therefore, the commercial property finance industry.
Nedbank Corporate Property Finance engages in the funding of large commercial and industrial properties as well as large residential developments. It is organised into three regional divisions: Cape Town, Gauteng and KZN, each managed by a divisional executive. This division is based largely on the geographic location of the properties that are funded, but also on where the relationships with clients lie. The funding of property developments and investments takes the form of both debt and equity. Approval of debt funding is undertaken by a regional credit committee together with a head office credit committee and a divisional credit committee where the deal sizes are larger. Equity funding is approved by an investment committee chaired by the Managing Executive of the whole business.
3.4.2 Sample and Sampling MethodAs mentioned above, Nedbank Corporate Property Finance can be considered a case study chosen based on convenience sampling. This choice was influenced largely by the relatively large size of the book and the researcher’s knowledge of this business. In addition, banks are usually reluctant to release certain information unless it is to be used discretely. The researcher, being employed in this division, was given approval by the relevant executives of the division. They were willing to support the research with any quantitative and qualitative data that was requested.
3.4.2.1 Quantitative data sample and sampling methodThe quantitative data was extracted from management accounts over a sample period of seven years from 2005 to 2011. This represents the period when the available data was recorded consistently. Longer-term data recorded consistently for periods before 2005 was not available. While longer term data, such as 10 years, would be expected to yield more credible results as the sample period is longer, in this case it was considered outdated given changes that have taken place such as the merger of the property finance divisions of Nedbank Investment Bank and BOE to become Nedbank Corporate Property Finance in 2003 and, in particular, the changes in accounting standards, and the manner in which the data are now recorded. Shorter-term data over seven years was, therefore, preferable to avoid these distortions. For consistency with previous years’ data over the sample period, the data for 2010 and 2011 excludes results of the Imperial Bank’s property finance business taken over by Nedbank in 2010.
268 | MICHAEL TICHAREVA RISK ADJUSTED PERFORMANCE MEASURES IN A PROPERTY FINANCE BUSINESS IN SA
ASSA CONVENTION 2012, CAPE TOWN, 16–17 OCTOBER 2012
3.4.2.2 Qualitative data sample and sampling methodFor the qualitative data, a semi-structured open-ended interview was performed with 15 key respondents. These are executives employed in the business. They were chosen because of their expert knowledge in the strategic management of the division’s operations as well as their extensive knowledge of banking operations in general. The wide list of respondents from credit risk managers to finance managers and business managers in different geographical regions ensured a diverse range of views. This was expected to reduce potential bias. The respondents are listed in the table below. Suitable representatives nominated by these respondents were interviewed in their place where the respondents were not available.
Table 1 Profile of respondents
Description of respondent type Number sampledManaging Executive, Nedbank Corporate 1Managing Executive, Nedbank Corporate Property Finance 1Divisional Executives for Nedbank Corporate Property Finance Gauteng, KZN and Cape Town 3Regional Credit Risk Managers for Nedbank Corporate Property Finance Gauteng, KZN and Cape Town
3
Head of Credit/Risk: Nedbank Corporate Property Finance 1Chairman: Nedbank Corporate Property Finance Divisional Credit Committee 1Head of Capital and Liquidity: Nedbank Corporate Property Finance 1Head of Finance: Nedbank Corporate Property Finance 1Head of Basel II Team: Nedbank Corporate Property Finance 1Representative of Nedbank Group Credit Risk Committee 1Representative of Investment Committee: Nedbank Corporate Property Finance 1
3.5 The research instrument3.5.1 Quantitative dataA letter for the collection of quantitative data addressed to the Head of Finance for Nedbank Corporate Property Finance is included as Appendix A. The data requested was slightly different from that provided in that some fields could not be provided. The researcher also subsequently increased the period of data from 5 years to 7 years for greater credibility with most recent data. This data was used for the calculation of RAPMs and comparison with traditional ROE and ROA performance measures.
3.5.2 Qualitative dataA letter to the respondents together with the questions for the semi-structured open-ended face-to-face and telephonic interviews is included as Appendix B. These questions were sent in advance of the interview to allow respondents time to prepare.
MICHAEL TICHAREVA RISK ADJUSTED PERFORMANCE MEASURES IN A PROPERTY FINANCE BUSINESS IN SA | 269
ASSA CONVENTION 2012, CAPE TOWN, 16–17 OCTOBER 2012
The data collected was used in reconciling theory with practice by getting insight from the views of the executives.
3.6 Procedure for data collectionData was collected in two phases. This is the triangulation of methods approach discussed above.
3.6.1 First phase: Quantitative Data CollectionThe first phase was the collection of financial data (quantitative) that was requested from Nedbank Corporate Property Finance in March 2010. The quantitative data was in Excel format and was sent through emails. This data was received originally in August 2010 for the financial years from 2005 to 2009. After initial analysis of the data, it was considered that the data for 2005 and 2006 was incomplete due to inconsistencies in data recording for these earlier years compared with the later years. The researcher then decided to increase the time period of the data by another two years for greater credibility of results with emphasis being placed on more recent data that had been recorded consistently. The data for 2010 and 2011 was then received in February 2011 and February 2012 respectively as financial results became available. The data was analysed in February 2012. Results of the analysis of this data were then fed into the second phase of data collection.
3.6.2 Second phase: Qualitative Data CollectionThe second phase was the face-to-face and telephonic interviews to collect the qualitative data. A series of 30-minute interviews were set up with the respondents. The researcher took notes to record the discussions during the interview. Some interviewees preferred to send their responses in writing. There were follow-ups through email and telephone where there was need for clarity on the interviewee’s responses. This data was collected in January and February 2012 and analysed in February 2012.
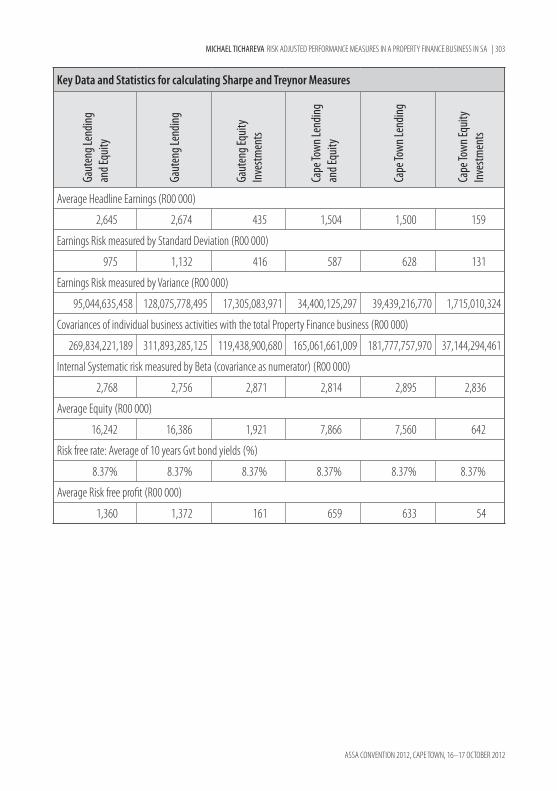
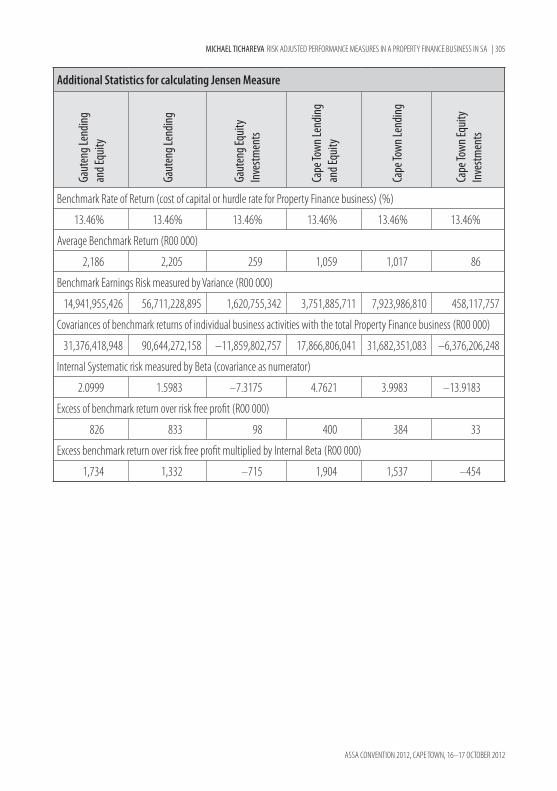
3.7 Data analysis and interpretation3.7.1 Quantitative DataThe analysis and interpretation of the quantitative financial data was the most important part of this research. The key analysis involved the calculation of key RAPMs commonly applied in the field of finance. These are the Treynor, the Sharpe and the Jensen measures now applied to banking. The formulae for calculating these measures are summarised in Appendix C. They use internal data as opposed to market data that is traditionally applied to these measures.
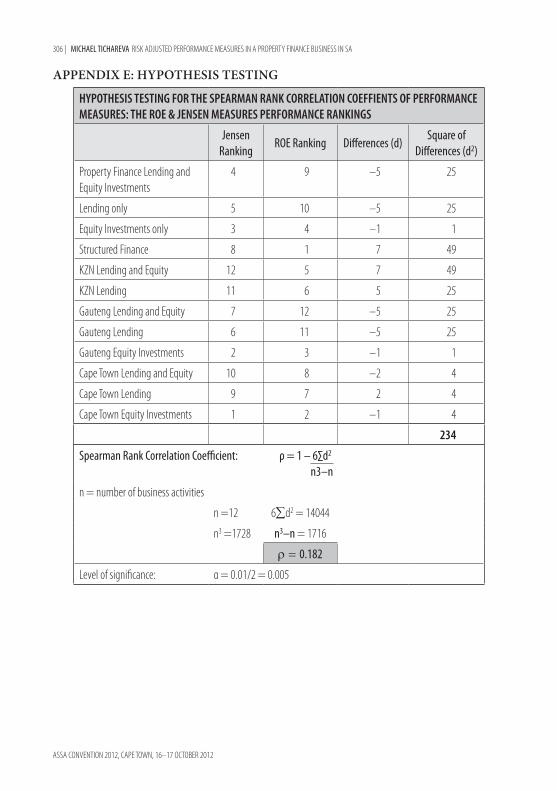
These measures were then compared with the traditional measures of performance, which are the ROE and the ROA. The performance rankings based on RAPMs and traditional measures were compared. The differences in rankings were then tested for statistical significance through hypothesis testing of the Spearman Rank Correlation Coefficient. The effect of diversification was also assessed through the
270 | MICHAEL TICHAREVA RISK ADJUSTED PERFORMANCE MEASURES IN A PROPERTY FINANCE BUSINESS IN SA
ASSA CONVENTION 2012, CAPE TOWN, 16–17 OCTOBER 2012
observation of the performance rankings for individual business activities compared with the whole business.
In summary, quantitative data analysis involved the following: — Calculation of ROEs and ROAs over each period for the sample period. — Calculation of the Sharpe, Treynor and Jensen measures (RAPMs). This required
the calculation of means, variances, co-variances and betas of headline earnings from the financial statements over the chosen sample period. Standard formulae as provided for the Israel study (Landskroner et al., 2005) and the US study (Geyfman, 2005) was then applied to calculate the RAPMs.
— Comparisons of ROE and RAPMs by observation. — Calculation of Spearman Rank Correlation coefficient. A significance test or
hypothesis test of differences in performance rankings arising from the use of ROEs and RAROCs was performed to confirm the results statistically. Since this is a non-parametric test applied to ordinal data, the performance rankings, the assumption of normality was irrelevant.
Conclusions were drawn from the results and strategic decisions that could have arisen from the results were outlined.
3.7.2 Qualitative DataThe qualitative data from the interviews was summarised and discussed. The insights drawn from the data was then compared with the results of the quantitative analysis of RAPMs. Comments were given with explanations of any inconsistencies or deviations of theory from practice in strategic decisions taken. Conclusions were drawn by combining both quantitative and qualitative analysis.
3.8 Limitations of the Study — The validity of the study was dependent on the applicability of the assumptions
outlined in section 1.7 above. — The study may not necessarily be generalised to the banking industry because
Property Finance Business is specialised. In addition, the chosen sample may not be sufficiently large enough for general conclusions to be drawn.
— The study was dependent on the accuracy of the financial data provided. The use of 7-year data imposes both advantages and disadvantages. The key advantage is that it excludes earlier data that was recorded inconsistently. The key disadvantage is that it may not be a sufficiently long enough period to be conclusive on the results.
— The responses to the interview represent largely personal views of the executives and may have been inconsistent from one executive to the other. These may not necessarily represent industry practice due to the subjectivity involved.
— The study did not seek to investigate in great detail the actual strategic decisions taken based on RAPMs instead of the traditional ROE and ROA measures.
MICHAEL TICHAREVA RISK ADJUSTED PERFORMANCE MEASURES IN A PROPERTY FINANCE BUSINESS IN SA | 271
ASSA CONVENTION 2012, CAPE TOWN, 16–17 OCTOBER 2012
Instead, it sought to draw conclusions on the strategic decisions that could have been taken had RAPMs been used compared with the traditional ROE and ROA.
— A case-study approach based on convenience sampling has been taken. While a case-study approach allows understanding of a particular case very well and an understanding of how and why it came to what it is, it is not as good at providing a panoramic view of a phenomenon or identifying similarities and patterns across wider contexts (Willig, 2008). It is believed that this applies to this study as well.
— Triangulation of methods was relatively expensive and time-consuming (Kalof et al., 2008).
— The application of the Spearman Rank Correlation coefficient hypothesis test, a non-parametric test that does not make assumptions about the underlying population, introduces the following disadvantages (Henke & Reitsch 1994):
— Information may be ignored, wasted or lost. — There is a greater probability of not rejecting a false null hypothesis,
commonly known as a type II error (Albright, Winston & Zappe, 2006).
3.9 Validity and Reliability3.9.1 ValidityOne definition says that validity is concerned with congruency or a “goodness of fit” between the details of the research, the evidence, and conclusions drawn (Kalof et al., 2008). The two types of validity are external and internal. These are discussed below.
3.9.2 External ValidityExternal validity refers to the ability to generalise the results of a study based on a sample to a larger population (Kalof et al., 2008). While the results of the study may be generalised in the context of property finance businesses within banking institutions, the case-study nature and the relatively small sample size of the study in the context of the whole South African banking industry makes it difficult to generalise the results. In particular, the non-probability sample for the qualitative element of the study means that these cannot be generalised. However, with application of the principles of banking to the quantitative data for the study, the results of the quantitative element of the study were found to be consistent with results of previous studies, which implies that they can be generalised to the wider banking industry. This is subject to confirmation through a more comprehensive study across various banks.
3.9.3 Internal ValidityInternal validity refers to the ability of the study to draw appropriate conclusions from the data at hand (Kalof et al., 2008). For this study, the main source of this problem was likely to arise from incorrect quantitative data being provided. However, the study ensured that the quantitative data provided represented what it was intended to represent. In addition, the interview questions were designed and asked in a way
272 | MICHAEL TICHAREVA RISK ADJUSTED PERFORMANCE MEASURES IN A PROPERTY FINANCE BUSINESS IN SA
ASSA CONVENTION 2012, CAPE TOWN, 16–17 OCTOBER 2012
that ensured that the responses were valid to the research problem at hand. Kalof et al (2008) note that in the absence of random selection of a sample for a study, we must always have some concern with alternative explanations of what was observed as a threat to the internal validity of our conclusions from the study. This applies to this study to a large extent. A cautious approach was, therefore, followed in both the analysis and interpretation of the results.
3.9.4 ReliabilityOne definition says that reliability is concerned with consistency. This means that research findings are considered reliable if similar findings are revealed over time in repeated applications of the research (Kalof et al., 2008).
As indicated earlier, the quantitative part of this research was based on a methodology applied at two previous studies in Israel (Landskroner et al., 2005) and the US (Geyfman, 2005). These studies produced similar results, which confirmed consistency. This research also produced similar results, which confirmed consistency. Despite the size of the sample for the study being small in the context of the banking industry, it did not lead to results inconsistent with previous studies.
The qualitative element of the research could potentially introduce inconsistency due to the subjectivity of the respondents’ responses. The five questions designed for the interview helped to achieve consistency to an extent in that the questions were closely related. In addition, the respondents chosen were experienced bankers and property finance practitioners. This helped to achieve consistency despite the subjectivity that might have been contained in their answers. Respondents were asked to be as objective as possible. It was expected that the impact of any subjectivity would be limited since the qualitative element of the research was not the main focus of this research. It was only complementary.
4. PRESENTATION Of RESULTS4.1 IntroductionThe results for the quantitative research are presented in the form of tables summarising the results. Formulae used in the calculations and the various definitions are also presented. The results are then described in paragraphs that follow the tables.
The results for the qualitative section of the research are presented in the form of descriptive paragraphs summarising the views of the executives interviewed.
Section 4.2 sets out the results of the quantitative research and section 4.3 sets out the results of the qualitative research. Section 4.4 provides a brief summary of the whole section on presentation of results.
4.2 Results pertaining to the quantitative research4.2.1 Performance RankingsThe table below summarises the various measures of performance for the Property Finance business activities that were analysed and the performance rankings that
MICHAEL TICHAREVA RISK ADJUSTED PERFORMANCE MEASURES IN A PROPERTY FINANCE BUSINESS IN SA | 273
ASSA CONVENTION 2012, CAPE TOWN, 16–17 OCTOBER 2012
result from these performance measures. Appendix C summarises the definitions of the performance measures and how they were calculated. The summary data and assumptions used in the calculations and key statistics calculated are summarised as Appendix D.
Table 2 Performance Measures and the Performance Rankings
Traditional Performance
Measures of ReturnRisk Adjusted Performance Measures of Return
Business Activity
ROA M
easu
re
ROA R
ankin
g
ROE M
easu
re
ROE R
ankin
g
Shar
pe M
easu
re
Shar
pe Ra
nking
Treyn
or M
easu
re
Treyn
or Ra
nking
Jens
en M
easu
re
Jens
en Ra
nking
Property Finance Lending and Equity Investments
1.27% 6 18.72% 9 105.67% 8 123.28% 1 6.01% 4
Lending only 1.00% 11 16.66% 10 156.37% 3 80.34% 2 2.06% 5Equity Investments only
Cape Town Lending 1.32% 5 19.64% 7 138.13% 5 29.97% 6 –8.85% 9Cape Town Equity Investments
6.36% 3 62.09% 2 80.26% 9 3.71% 12 87.14% 1
4.2.1.1 Description of resultsThe first column shows the business activities that were analysed for the Nedbank Cor-porate Property Finance business. This excludes the equity investments for the KZN region as a separate activity since this business is very small and analysis of such small numbers could distort results. The rest of the columns show the five performance meas-ures that were analysed alongside their performance rankings for each business activity.
274 | MICHAEL TICHAREVA RISK ADJUSTED PERFORMANCE MEASURES IN A PROPERTY FINANCE BUSINESS IN SA
ASSA CONVENTION 2012, CAPE TOWN, 16–17 OCTOBER 2012
The business activity labelled “Property Finance Lending and Equity Invest-ments” represents the combined activities of the whole Property Finance business. The results show that the non-risk adjusted measures of performance, the ROA and ROE measures, rank the performance of the whole business as number 6 and 9 respectively. The RAPMs, the Sharpe, Treynor and Jensen measures, rank the performance as num-bers 8, 1 and 4 respectively.
The activity labelled “lending only” represents the debt financing business across all regions. The results show that the ROA and ROE measures rank the performance of this activity as number 11 and 10 respectively. The Sharpe, Treynor and Jensen measures rank the performance as numbers 3, 2 and 5 respectively. The lending business activity performs better on a risk adjusted basis.
Then the “equity investments only” activity represents the high-risk equity investments. The ROA and ROE measures rank the performance of this activity as number 1 and 4 respectively. The Sharpe, Treynor and Jensen measures rank the performance as numbers 12, 7 and 3 respectively. Overall, the equity investments business activity performs worse on a risk adjusted basis.
Looking at the regions, the Gauteng region is ranked on the ROA and ROE performance measures as number 12 on both measures. The Gauteng equity investments business performs relatively better, ranked 4 and 3 on ROA and ROE respectively compared with the Gauteng lending business that is ranked 10 and 11 on the ROA and ROE performance measures.
On a risk adjusted basis, the Sharpe, Treynor and Jensen measures rank the Gauteng region as 6, 4 and 7 respectively. The Gauteng equity business is ranked 10, 10 and 2 on the same measures respectively. The Gauteng lending business is ranked 7, 3 and 6 on the Sharpe, Treynor and Jensen measures respectively. The Gauteng equity business performed worse than the Gauteng lending business on a risk adjusted Sharpe and Treynor measures but much better on the Jensen measure that ranks number 2. The overall performance of the Gauteng business compared with Gauteng equity and Gauteng lending on a risk adjusted basis is not clear cut due to the different risk adjusted performance measures giving varied rankings.
The overall results show that the Gauteng region performs better on a risk adjusted basis compared with the non-risk adjusted performance measures.
The Cape Town region is ranked 9 and 8 on the ROA and ROE measures respectively. Once again, the Cape Town equity business performs better, ranking 3 and 2 on the ROA and ROE respectively. This compares to the Cape Town lending business that is ranked 5 and 7 on the ROA and ROE measures respectively.
On a risk adjusted basis, the Sharpe, Treynor and Jensen measures rank the Cape Town region as 4, 5 and 10 respectively. The Cape Town equity business is ranked 9, 12 and 1 on the same measures respectively. The Cape Town lending business is ranked 5, 6 and 9 on the Sharpe, Treynor and Jensen measures respectively. On the Sharpe and Jensen measures, the lending business performs better than the equity business. On the Treynor measure, the equity business performs better. The overall performance of
MICHAEL TICHAREVA RISK ADJUSTED PERFORMANCE MEASURES IN A PROPERTY FINANCE BUSINESS IN SA | 275
ASSA CONVENTION 2012, CAPE TOWN, 16–17 OCTOBER 2012
the Cape Town business compared with Cape Town equity and Cape Town lending is better on the Sharpe and Treynor measures but worse on the Jensen measure.
The overall results show that the Cape Town region performs better on a risk adjusted basis compared with the non-risk adjusted performance measures despite the Jensen measure ranking the equity business number 1.
The ROA and ROE performance measures rank KZN as number 7 and 5 respec-tively. The Sharpe, Treynor and Jensen measures rank the performance as numbers 2, 8 and 12 respectively. The KZN lending business is ranked 8 and 6 on the ROA and ROE respectively and 1, 9 and 11 on the Sharpe, Treynor and Jensen measures respectively. The KZN equity investments activity has not been analysed separately due to the small size of the business that could introduce distortions in the analysis.
The overall results show that the KZN region performs relatively worse on a risk adjusted basis compared with the non-risk adjusted performance measures despite the Sharpe measure ranking the performance as number 2.
Finally, the structured finance loan book was analysed separately despite the fact that structured deals are no longer a separate business activity being written in recent years. The ROA and ROE performance measures rank the structured finance loan book as number 2 and 1 respectively. The Sharpe, Treynor and Jensen measures rank the performance as numbers 11, 11 and 8 respectively. It performs worse on a risk adjusted basis, possibly reflecting the risky nature of this business activity.
4.2.1.2 ConclusionThese results show that RAPMs when compared with traditional non-risk based performance measures such as ROA and ROE, lead to different results on performance ranking of business units or activities within a business unit, leading to different strategic decisions on investment and capital allocation.
4.2.2 Hypothesis TestingThe table below summarises the results of the hypothesis testing for the Spearman Rank Correlation Coefficients of the performance measures for the Property Finance business activities that were analysed.
Firstly, the Spearman Rank Correlation Coefficients were calculated for the rankings of the different pairs of risk adjusted and non-risk adjusted performance measures. These are shown in the second column of the table below.
The Null Hypothesis and Alternative Hypothesis were then stated as in the table. These represented both a one-tailed test reflecting an assumed positive relationship between the rankings of the performance measures, and a two-tailed test suggesting either a positive or negative relationship between the rankings since it was not clear from the outset. The Null Hypothesis was that there was no association between the rankings. The Alternative Hypothesis was that there was an association for the two-tailed test and that there was a positive association for the one-tailed test. The results for both one-tailed and two-tailed tests were consistent.
276 | MICHAEL TICHAREVA RISK ADJUSTED PERFORMANCE MEASURES IN A PROPERTY FINANCE BUSINESS IN SA
ASSA CONVENTION 2012, CAPE TOWN, 16–17 OCTOBER 2012
Table 3 Hypothesis Testing Results for the Spearman Rank Correlation Coefficients of Performance Measures
SUMMARY OF RESULTS: HYPOTHESIS TESTING AT 1% LEVEL OF SIGNIFICANCE
Null Hypothesis
Hο: ρο = 0 (two-tailed test) There is no association between the performance measures, hence there is a significant difference in performance rankings
Hο: ρο = 0 (one-tailed test) There is no association between the performance measures, hence there is a significant difference in performance rankings
Alternative HypothesisHa: ρο≠ 0 (two-tailed test) There is an association between the performance measures, hence there is
no significant difference in performance rankingsHa: ρο> 0 (one-tailed test) There is a positive association between the performance measures, hence
there is no significant difference in performance rankings
Test
ROA a
nd Je
nsen
M
easu
res
ROA a
nd Tr
eyno
r M
easu
res
ROA a
nd Sh
arpe
M
easu
res
ROE a
nd Je
nsen
M
easu
res
ROE a
nd Tr
eyno
r M
easu
res
ROE a
nd Sh
arpe
M
easu
res
ROA a
nd RO
E M
easu
res
Spearman Rank Correlation Coefficient 0.371 –0.650 –0.699 0.182 –0.895 –0.462 0.874Standard Error of ρο 0.294 0.240 0.226 0.311 0.141 0.281 0.154Critical Value of t at α/2 = 0.005 level 3.169 3.169 3.169 3.169 3.169 3.169 3.169Calculated Test Statistic: t-value 1.262 –2.707 –3.094 –0.585 –6.349 –1.645 5.691Do not Reject or Reject Null Hypothesis
Do not Reject
Do not Reject
Do not Reject
Do not Reject
Do not Reject
Do not Reject
Reject
p-Value two-tailed test: Reject Null Hypothesis for p-value<0.01
0.2356 0.0220 0.0114 0.5715 0.0001 0.1310 0.0002
Two-tailed test: Do not Reject or Reject Null Hypothesis
Do not Reject
Do not Reject
Do not Reject
Do not Reject
Reject Do not Reject
Reject
p-Value one-tailed test: Reject Null Hypothesis for p-value<0.01
0.1178 0.9890 0.9943 0.2858 1.000 0.9345 0.0001
One-tailed test: Do not Reject or Reject Null Hypothesis
Do not Reject
Do not Reject
Do not Reject
Do not Reject
Do not Reject
Do not Reject
Reject
Note: The p-value of a sample is the probability of seeing a sample with at least as much evidence in favour of the alternative hypothesis as the sample actually observed. The smaller the p-value, the more evidence there is in favour of the alternative hypothesis. So the p-value measures how unlikely the observed sample results would be, given that the null hypothesis is true. Sample evidence is statistically significant at the α level of significance only if the p-value is less than α (Albright et al., 2006; Hopkins, Khorasance & Scott, 2002; Soper, 2006, 2012)
MICHAEL TICHAREVA RISK ADJUSTED PERFORMANCE MEASURES IN A PROPERTY FINANCE BUSINESS IN SA | 277
ASSA CONVENTION 2012, CAPE TOWN, 16–17 OCTOBER 2012
Test statistics and p-values were calculated at the 1% level of significance and conclusions reached for each test. Except in one instance, the results were consistent between the use of p-values and test statistics at the 1% level of significance to define the rejection regions for the two-tailed tests. The results were consistent throughout for the one-tailed tests.
In total, seven hypothesis tests were performed. The results of each test are outlined in the table above and described below. Appendix E summarises the process followed for the hypothesis tests. This process was repeated for all the seven hypothesis tests performed in this
The Spearman Rank CorrelationsThe ROA and the Jensen measures as well as the ROE and Jensen measures showed a positive Spearman Rank Correlation suggesting a positive relationship or association between the measures. The ROA and ROE measures show a positive Spearman Rank Correlation close to 1 suggesting a strong positive association between the two measures. All the other rankings have shown negative Spearman Rank Correlations suggesting negative associations ranging from semi strong to strong.
ROA and Jensen MeasuresThis ranked performance on the ROA and the Jensen performance measures. The calculated test statistic was much less than the critical value of t, so there was no statistically significant evidence to reject the Null Hypothesis that there is no association between the rankings of the two performance measures. We concluded that there is no association between rankings of the risk adjusted performance measures and the non-risk adjusted performance measures at the 1% significance level on both the one-tailed and two-tailed tests. This was supported by the p-values for the one and two-tailed tests that were much higher than the 1% level of significance and did not provide convincing statistical evidence to reject the Null Hypothesis.
ROA and Treynor MeasuresThis ranked performance on the ROA and the Treynor performance measures. We arrived at the same conclusion of lack of statistically significant evidence to reject the Null Hypothesis on both the one-tailed and two-tailed tests using both test statistics and p-values.
ROA and Sharpe MeasuresThis ranked performance on the ROA and the Sharpe performance measures. We arrived at the same conclusion of lack of statistically significant evidence to reject the Null Hypothesis on both the one-tailed and two-tailed tests using both test statistics and p-values.
278 | MICHAEL TICHAREVA RISK ADJUSTED PERFORMANCE MEASURES IN A PROPERTY FINANCE BUSINESS IN SA
ASSA CONVENTION 2012, CAPE TOWN, 16–17 OCTOBER 2012
ROE and Jensen MeasuresThis ranked performance on the ROE and the Jensen performance measures. We arrived at the same conclusion of lack of statistically significant evidence to reject the Null Hypothesis on both the one-tailed and two-tailed tests using both test statistics and p-values.
ROE and Treynor MeasuresThis ranked performance on the ROE and the Treynor performance measures. We arrived at the same conclusion of lack of statistically significant evidence to reject the Null Hypothesis on both the one-tailed and two-tailed tests when using test statistic values. However, p-value for the two-tailed test was lower than the 1% significance level. There was, therefore, statistically significant evidence to reject the Null Hypothesis in favour of the Alternative Hypothesis that there is an association between the performance rankings of these two measures. The one-tailed test p-value, however, was much higher than the 1% significant level suggesting lack of statistically significant evidence to reject the Null Hypothesis. This was a somewhat interesting result that will be discussed in the Discussion of the Results section below.
ROE and Sharpe MeasuresThis ranked performance on the ROE and the Sharpe performance measures. We arrived at the same conclusion of lack of statistically significant evidence to reject the Null Hypothesis on both the one-tailed and two-tailed tests using both test statistics and p-values.
ROA and ROE MeasuresThis ranked performance on the ROE and the ROA performance measures, both non-risk adjusted performance measures. The calculated test statistic was much higher than the critical value of t, so there was statistically significant evidence to reject the Null Hypothesis that there is no association between the rankings of the two performance measures. We concluded that there is an association between the rankings of the ROE and ROA performance measures at the 1% significance level on both the one-tailed and two-tailed tests. This was supported by the p-values for both the one and two-tailed tests that were much lower than the 1% level of significance and provided convincing evidence to reject the Null Hypothesis. This showed consistency that non-risk adjusted performance measures are expected to yield relatively similar results of performance rankings.
ConclusionIt was found that there is no association between performance rankings of risk adjusted performance measures and non-risk adjusted performance measures. There is no statistically significant evidence to support that the rankings are not materially different. It was also found that there is an association between performance rankings
MICHAEL TICHAREVA RISK ADJUSTED PERFORMANCE MEASURES IN A PROPERTY FINANCE BUSINESS IN SA | 279
ASSA CONVENTION 2012, CAPE TOWN, 16–17 OCTOBER 2012
of non-risk adjusted performance measures. There is statistically significant evidence that support that the rankings are not materially different.
These results, therefore, show that RAPMs when compared with traditional non-risk based performance measures such as ROA and ROE, lead to different results on performance ranking of business units or activities within a business unit, leading to different strategic decisions on investment and capital allocation.
4.2.3 ConclusionThe results on performance rankings show that there is a difference in performance of business activities when the returns are adjusted for risk. A business activity that performs better on a non-risk adjusted basis may not necessarily be the best performing on a risk adjusted basis.
Hypothesis testing on whether there is an association or correlation between the performance rankings of the performance measures was aimed at establishing the statistical significance of the differences in performance rankings arising from the pairing of risk adjusted and non-risk adjusted performance measures. Where there was no association as stated in the Null Hypothesis, this suggested independence in the performance measures and it was evidence that the performance rankings are materially different.
Hypothesis testing of the rankings for the non-risk adjusted performance measures of ROA and ROE also showed that these are not materially different. This showed consistency that non-risk adjusted performance measures are expected to yield relatively similar results of performance rankings.
4.3 Results pertaining to the qualitative researchFifteen senior executives in Nedbank Corporate were interviewed either face-to-face or telephonically. The five questions that were asked are:
— Question 1: What is your understanding of Risk Adjusted Performance Measures (RAPMs) such as RAROC, RORAC and Economic Profit as applied to banking institutions and to Nedbank Corporate Property Finance in particular?
— Question 2: To what extent do you believe that these measures have influenced strategic decisions taken within banking institutions and in Nedbank Corporate Property Finance in particular over the past few years compared with the use of Return on Equity (ROE) and Return on Assets (ROA) metrics?
— Question 3: Would you explain to what extent Nedbank Group Limited considers RAPMs in allocating Capital among its businesses?
— Question 4: Do you feel that the allocation of Capital to Nedbank Corporate Property Finance over the past few years has been appropriate given the risks the business assumes compared with other businesses within the Group?
— Question 5: What would you use as the bank’s hurdle rate or cost of capital: a Return on Equity (ROE) measure or a RAPM and why?
280 | MICHAEL TICHAREVA RISK ADJUSTED PERFORMANCE MEASURES IN A PROPERTY FINANCE BUSINESS IN SA
ASSA CONVENTION 2012, CAPE TOWN, 16–17 OCTOBER 2012
The results of the interviews were consistent across all the executives interviewed. The executives showed in-depth understanding of all the five questions asked. The responses by all the executives can best be summarised through a response from one of the key executives who responded comprehensively, in writing, as follows:
The elements (levers) of the RAROC calculation is Net Interest Income (NII), Lending spread and Funding spread. By selling or lending money at a higher interest rate than what the Bank ‘buys’ or borrows it at, we make a profit. This profit is called the Net Interest Income (NII) of the Bank. The NII is calculated by subtracting the interest paid to customers from the interest charged to customers. In this way, Nedbank Treasury is responsible for balancing the Bank’s balance sheet on a daily basis and also determining the funds transfer pricing (FTP) rate at which they will lend to operating business units like Property Finance. Economic Profit elaborates on RAROC by incorporating the cost of equity capital, which is based on the market required rate of return expected from holding a company’s equity instruments, to assess whether shareholder wealth is being created. Economic Profit measures the return generated by each business unit in excess of the Bank’s cost of equity capital. Shareholder wealth is increased if capital can be employed at a return in excess of the Bank’s cost of equity capital. Similarly, when returns do not exceed the cost of equity capital, shareholder wealth is diminished and a more effective deployment of that capital is sought. The Bank’s approach to risk will now embrace risk management as a core competency that allows us to optimise risk taking, is objective and transparent and ensures that the Bank and entities like Property Finance price for risk appropriately, linking risk to return. This approach has materially changed the way that the division looks at its assets (loans to clients) where the profitability of such loans becomes the key growth objective and where book growth alone is not the driving force anymore. In order to steer the organisation in a direction that creates shareholder value, bottom-up measures of shareholder value were developed, hence the movement towards RAPM, which implies a number of changes from the traditional profit and loss. This has now happened to a large extent where the group can allocate expensive capital to units where the best returns are being achieved. The long term nature of Property Finance loans puts a strain on the bank in that it has to match short term funding with long term lending. So it is not a question if whether the allocation of capital is appropriate, but more of the cost of such capital, which cost has increased over the last number of years with the application of RAPM. The application of RAPM has the overriding advantage that grow/shrink decisions can now be scientifically achieved where risk-adjusted return measures are a primary indicator in evaluating the capital attribution to different business units. This allows the target growth or reduction in specific areas of a group’s
MICHAEL TICHAREVA RISK ADJUSTED PERFORMANCE MEASURES IN A PROPERTY FINANCE BUSINESS IN SA | 281
ASSA CONVENTION 2012, CAPE TOWN, 16–17 OCTOBER 2012
portfolio and also different recognition or reward for each such business to drive their behaviour, depending on the value they add/destroy
This response captured the views aired by all the executives who were interviewed. They were all consistent in their responses, confirming that reliance on risk adjusted performance measures is the most appropriate and efficient way of allocating the Bank’s resources. They all concluded that strategic decisions should ideally be based on risk adjusted performance measures. These views are, indeed, consistent with results of the quantitative element of this research that concludes that RAPMs are superior to traditional measures.
Some executives commented that RAPMs, depending on the definition used, are forward looking as opposed to being point in time or backward looking historical measures. They are also viewed as the most appropriate way to incorporate the effects of diversification into capital allocation. They are, therefore, considered more useful as a sustainable measure in steering the business forward.
The complexity of RAPMs was the main reason that was noted for the lack of understanding by investors. They have, therefore, not yet been embraced fully by the market with investors still preferring traditional market measures such as price to book value, return on equity, dividend yield, return on assets, cashflows and growth in headline earnings. One executive noted the need for adequate training for both internal and external stakeholders on RAPMs for these to be fully understood and embraced in decision-making.
Another executive demonstrated their understanding of RAROC and RORAC as they are used in Nedbank by giving the following formulae as defined in the Nedbank RAPM Framework (Nedbank, 2009c):
Nedbank DefinitionsRORAC = Net Interest Revenue less Costs less Tax less Impairments
Economic CapitalRORAC is applied for performance measurement in the Nedbank Group’s Economic Capital Framework. It uses impairments which are a historical measure, so it is viewed as a point in time or backward looking measure of performance.
RAROC = Net Interest Revenue less Costs less Tax less Expected Loss Economic Capital
RAROC is applied in pricing decisions and strategic planning for the Group. It uses a through-the-cycle expected loss, which is a forward looking measure, so it gives a forward looking view.
One executive also cited the Nedbank Group Economic Capital Framework that states as follows (Nedbank, 2009a):
Economic Capital is an integral component of Nedbank Group’s Capital Management Framework, and essential for the achievement of world class “risk quantification
282 | MICHAEL TICHAREVA RISK ADJUSTED PERFORMANCE MEASURES IN A PROPERTY FINANCE BUSINESS IN SA
ASSA CONVENTION 2012, CAPE TOWN, 16–17 OCTOBER 2012
and assessment”, “internal capital adequacy assessment”, “capital allocation”, “capital optimisation” and RAPM implementation across the Nedbank Group. Basel II has essentially brought about a set of “new rules to the game of banking”, whereby Basel II has introduced proper risk-based capital requirements which are sensitive to the risk profile of a bank. For the first time, capital requirements will vary between banks with different risk profiles. The introduction of these risk sensitive measures within Basel II is driving a convergence of regulatory capital and Economic Capital requirements. This resulting change in the rules to the game of banking therefore requires, inter alia, optimisation of the risk profile of the balance sheet. In addition, in Pillar II of Basel II, a bank is required to have a comprehensive Internal Capital Adequacy Assessment Process (ICAAP). This requirement is substantially addressed by Nedbank Group’s Economic Capital Framework.
While RAPMs are being used extensively at Nedbank, there was concern by one executive that they may not yet be fully capturing liquidity risks that have now become real risks since the 2008 financial crisis.
The executives also noted the use of a single hurdle rate such as ROE as being inappropriate noting that a standard RAPM hurdle rate for the whole business should be adjusted for the riskiness of each business activity. This is consistent with literature review (Froot & Stein, 1998; Milne & Onorato, 2009).
With regard to cost of equity as a single hurdle rate, one executive pointed out the current Nedbank Group RAPM framework that notes as follows (Nedbank, 2009c):
Nedbank Group comprises different lines of business with different risk characteristics, which can be shown empirically to have different Costs of Equity. For example, investment banks typically have a much higher Cost of Equity (a much higher beta) than retail banks. Consequently, when using the cost of ordinary shares within Nedbank Group to evaluate the performance of individual business units, the Group-average rate is adjusted to reflect the business of the cluster in question.
The Nedbank Group, therefore, uses multiple hurdle rates for different business units. Business units also use a RAPM-based hurdle rate in addition to the cost of equity hurdle rate allocated by the Group.
The executives, however, also acknowledged the importance of Headline Earnings as a key measure of profitability. They noted that a business must be able to cover its expenses alongside analysing the risks taken by a business. They also noted that one cannot ignore entirely the other practical and strategic considerations in the decision-making process, such as market pressure and the need to adopt defensive strategies in some instances by accepting lower risk adjusted returns to acquire business for long-term sustainability.
MICHAEL TICHAREVA RISK ADJUSTED PERFORMANCE MEASURES IN A PROPERTY FINANCE BUSINESS IN SA | 283
ASSA CONVENTION 2012, CAPE TOWN, 16–17 OCTOBER 2012
4.4 Summary of the ResultsThere are differences in performance rankings based on the calculations of returns performed. Business activities that perform better on non-risk adjusted basis are not necessarily the best performing on a risk adjusted basis.
Results of hypothesis testing also show that there is lack of statistically significant evidence to suggest that these differences in performance rankings are not material.
We, therefore, conclude that there is significant change in performance rankings after adjusting returns for risk suggesting that the risk adjusted measures of performance lead to materially different strategic decisions on capital allocation and investment or disinvestment from a business activity compared with the non-risk adjusted performance measures.
Executives interviewed showed exceptional understanding of RAPMs and their usefulness in strategic decision-making. They were all in strong support of RAPMs compared with traditional non-risk adjusted measures of performance. This was consistent with the results of the quantitative section of the research, aligning theory with practice as was intended by the research.
The Nedbank Group uses multiple hurdle rates for different business units and they are RAPMs. A standard cost of capital hurdle rate for the whole business is used as a starting point and adjusted for the riskiness of each business activity.
Headline Earnings were still noted as a key measure of profitability. The need to continue writing business to generate sufficient revenue to cover expenses as the existing business portfolio runs off was considered critical for long-term sustainability of a business.
Finally, it is important to look at other practical and strategic considerations for the long-term sustainability of the business. These include the need to absorb market pressure and the need to adopt defensive strategies in some instances by accepting lower risk adjusted returns to acquire business for long-term sustainability.
5. DISCUSSION Of ThE RESULTS5.1 IntroductionIn this section, the results of the research are discussed and explained. Any evidence that is consistent or inconsistent with the literature review is highlighted.
Section 5.2 discusses the results pertaining to the quantitative analysis. Section 5.3 then discusses results pertaining to the interview of the managing executives. Conclusions are then drawn in section 5.4.
5.2 Discussion pertaining to Quantitative Research5.2.1 Performance RankingsThe research proposition as stated in section 2 is that risk adjusted performance measures, when compared with traditional non-risk based performance measures such as return on equity and return on assets, lead to different results on performance ranking of business units or activities within a business unit. Different performance
284 | MICHAEL TICHAREVA RISK ADJUSTED PERFORMANCE MEASURES IN A PROPERTY FINANCE BUSINESS IN SA
ASSA CONVENTION 2012, CAPE TOWN, 16–17 OCTOBER 2012
rankings mean that different strategic decisions would be arrived at in pricing of products and services, capital allocation, investment and disinvestment from certain business activities. Risk management strategies and compensation to executives would also be different.
The results presented in section 4 measure two key aspects: — performance of individual business activities compared with the rest of the
business activities; and — performance of each business activity compared with the whole Property
Finance business.
These were the same measures performed in earlier studies as noted in the literature review (Geyfman, 2005; Landskroner et al., 2005).
The results suggest evidence in support of RAPMs as superior measures of performance for basing strategic decisions in banking. It is argued that in the case where the correlations between business activities are low or negative, then ROA and ROE overestimates the required return and may lead to incorrect strategic decisions not to expand in that activity on the basis that it will be difficult to achieve the required rate of return (Geyfman, 2005).
Traditional measures ignore correlations between business activities that have the effect of either increasing overall risk if positively correlated or reducing overall risk if negatively correlated. On the contrary, RAPMs such as Treynor and Jensen measures, which have been used as proxies to RORAC and Economic Profit measures in banking, rely on internal systematic risk that takes into account the effect of internal correlations. This uses the covariances of the business activities with the whole business in the calculation of internal beta that measures systematic risk. This allows for diversification.
For example, an important result supporting this proposition is where the Treynor measure that takes into account the impact of correlations has ranked the whole of the Property Finance business number 1 in performance compared with all the other business activities individually. This suggests that the individual businesses complement each other in terms of risk such that the overall risk is reduced and the whole business performs better on a risk adjusted basis. This, arguably, shows the effects of diversification as no individual business activity has out-performed the overall business on this risk adjusted measure.
The Jensen measure, another measure that takes into account the impact of correlations, ranked the whole of the Property Finance business as number 4. The fact that it is also not number 1 suggests that the overall business might not have been exceeding the benchmark expected return based on the cost of capital as the hurdle rate despite the effects of diversification to improve risk adjusted returns of the overall business. The Jensen measure is a proxy to the measure of Economic Profit or EVA, which measures returns in excess of a hurdle rate. So this result is to be expected where actual returns are only marginally higher than the benchmark return, the cost of capital.
MICHAEL TICHAREVA RISK ADJUSTED PERFORMANCE MEASURES IN A PROPERTY FINANCE BUSINESS IN SA | 285
ASSA CONVENTION 2012, CAPE TOWN, 16–17 OCTOBER 2012
The Sharpe measure that does not take into account the effect of diversification ranks the performance of the whole business as number 8 compared with the individual business activities. This is to be expected where diversification of the various businesses is expected to reduce the overall risk of the whole business as shown by the Jensen and Treynor measures. This result is consistent with literature review. It was found that where a portfolio of businesses that are positively but imperfectly correlated, the overall risk of the business is reduced by the imperfect correlation of the individual businesses (James, 1996; Kimball, 1997; Kupper, 2000; Zaik et al., 1996).
It is, therefore, not surprising that performance rankings on the Sharpe measure, a risk adjusted performance measure, are also different from the rankings on both the Treynor and Jensen measures as is also the case for traditional measures as discussed above. This is because the Sharpe measure uses total risk as measured by standard deviation as a measure of risk. It does not take into account correlations of a business activity in relation to the other business activities to allow for diversification.
On the contrary, the Treynor and the Jensen measures, as already noted, use beta as a measure of internal systematic risk. Beta uses covariances to take into account correlations of the different business activities with the total business. This measures relative risk as opposed to total risk.
Another important business that makes up more than 50% of the whole portfolio in terms of book size is the Gauteng lending and equity investments. This has also shown interesting results. The business performs better on a risk adjusted basis as measured by Treynor and Jensen measures. The results suggest that whilst this business performs poorly on an ROA and ROE basis, it is relatively low-risk business with lower chances of losing money.
This is important in the banking context as the main objective is to minimise the Expected Loss as measured by the product of the probability of default (PD), the loss given default (LGD) and the exposure at default (EAD) on a loan portfolio. Low risk implies that the PD is low, and should default occur, the LGD is also expected to be low relative to the EAD. It suggests that impairment charges or Expected Losses in the profit and loss account are low on average.
This low-risk nature of the Gauteng business could be partly due to the large component of institutional business of large listed property funds that are generally considered lowly geared as well as very large unlisted corporate entities that are conservative in their funding strategies. These businesses rarely default and lending to them is considered low-risk due to the high credit quality. This means that they contribute relatively stable headline earnings from year to year, which is expected to produce high Economic Profit assuming the pricing strategy is appropriate.
This research provides evidence that RAPMs add value in that they provide different performance rankings from ROA and ROE that enables optimal strategic decisions to be made taking into account the risk of a business activity. This is consistent with literature review (Geyfman, 2005; Landskroner et al., 2005).
For example, executives would invest more money into business activities that
286 | MICHAEL TICHAREVA RISK ADJUSTED PERFORMANCE MEASURES IN A PROPERTY FINANCE BUSINESS IN SA
ASSA CONVENTION 2012, CAPE TOWN, 16–17 OCTOBER 2012
show high RAPMs. More capital would ideally be allocated into the Equity businesses in Gauteng and Cape Town that show high Economic Profit as measured by the Jensen measure. They would disinvest completely from the KZN equity business that is causing the overall equity business to show lower positive Economic Profit and the overall KZN business to show negative Economic Profit.
The literature review highlights this view in saying that maximising shareholder value is the key objective (Kimball, 1998). It, therefore, follows that a manager who maximises earnings or growth in earnings rather than Economic Profit will not be making optimal investment decisions. Kimball (1998) notes that maximising Economic Profit is desirable as companies that make business decisions without explicitly incorporating the opportunity cost of capital will be inefficient users of capital, engaging in investments that generate low returns for shareholders.
The negative returns for the Jensen measure for most of the business activities suggest that the overall returns are below the benchmark returns that are expected based on the hurdle rate or cost of capital for the Property Finance business. This would suggest inefficient use of capital due to the negative Economic Profit. This could be evidence of lack of conscious application of RAPMs in strategic decision-making such as pricing and capital allocation. The executives would need to pay particular attention to generating positive Economic Profit to create shareholder value across all business activities. More capital should, ideally, be invested in businesses that perform better on a risk adjusted basis, subject to other strategic considerations.
Finally, it is important to note that there are two observations that were expected in terms of previous research by Geyfman (2005) and Landskroner et al. (2005) but that are not shown by the results of this research. These are:
— The Jensen index was expected to be zero for the total property finance business since, by definition, an internal risk approach is being used. It is 6%, which is close to zero.
— The Sharpe and the Treynor measures were expected to be the same for the total Property Finance business since, by definition, the risk measures are equal for the whole business. They are 106% and 123% respectively.
This is not the case largely because of the nature of the data used. The data for the whole business includes all the support functions and the smaller business activities carried out at head office level that have been excluded in the analysis on an individual basis. This means that the sum of the risk measures for the individual business units analysed is not necessarily equal to the total risk for the whole business as would be expected. We could have stripped these out. However, we did not believe that, for the purposes of our research, such an exercise would lead to results that are materially different due to the smaller numbers involved relative to the total business.
Another important explanation also highlighted by previous studies is the use of headline earnings and internal systematic risk measures as opposed to market rates of return and market beta. Since the RAPMs applied in this research have their premise
MICHAEL TICHAREVA RISK ADJUSTED PERFORMANCE MEASURES IN A PROPERTY FINANCE BUSINESS IN SA | 287
ASSA CONVENTION 2012, CAPE TOWN, 16–17 OCTOBER 2012
on the CAPM that uses market data, the modification to use internal data and risk measures imply that the comparative results expected using strictly market data would not necessarily be achieved as the conditions required for that have been modified by using other forms of data.
In conclusion, the research reaffirms the proposition that there is significant change in performance rankings after adjusting returns for risk suggesting that the risk adjusted measures of performance lead to materially different strategic decisions on capital allocation and investment or disinvestment from a business activity compared with the non-risk adjusted performance measures. Businesses that perform better on a risk adjusted basis should, ideally, receive more attention and allocated more capital, subject to other strategic considerations.
5.2.2 Hypothesis TestingThe Spearman Rank Correlations Coefficient measures the degree of association between two variables. Either there is no association, or there is a negative or positive association. The results of the research are mixed in this regard.
The positive correlation for the rankings of the ROA and the Jensen measures and the ROE and Jensen measures suggest no association or relationship. This is as expected as confirmed by the results of the hypothesis testing. This means that the rankings are different and the ranking of one measure does not influence the other. A business activity that performs well on the ROA measure may not necessarily perform well under the Jensen measure. The same applies with the ROE measure.
The close to 1 correlation for the rankings of the ROA and ROE measures suggests a strong positive association. This is also as expected as confirmed by the results of the hypothesis testing. This means that the rankings have a close relationship and as one goes up or down the other is also expected to go up or down. So a business activity that performs well on an ROE measure is also expected to perform well on the ROA measure.
However, this result may not necessarily be true in all circumstances depending on how the equity is measured and allocated and the nature of assets held across different business activities. If equity is allocated taking into account the riskiness of a business activity, the resultant performance measure may be considered to be risk adjusted to a large extent. Similarly, a business with poor quality assets may appear performing better without adjusting for risk.
It may, therefore, not necessarily follow that a business activity that performs well on an ROE measure is also expected to perform well on the ROA measure as shown by the results of this research.
All the other performance rankings that have shown negative correlations were a bit surprising. It would have been expected that they show correlations close to zero suggesting no association as confirmed by the results of the hypothesis testing. However, it is argued that a negative correlation coefficient in this regard suggests that the rankings are very different and would lead to different strategic decisions. This
288 | MICHAEL TICHAREVA RISK ADJUSTED PERFORMANCE MEASURES IN A PROPERTY FINANCE BUSINESS IN SA
ASSA CONVENTION 2012, CAPE TOWN, 16–17 OCTOBER 2012
suggests that a business activity that performs well on a non-risk adjusted measure actually performs worse on a risk adjusted basis because of the negative relationship. The reverse is also true. It would require more tests on larger samples to be conclusive on this observation.
Hypothesis testing for the rankings of the ROE and the Treynor performance measures yielded an interesting result that is inconsistent with other results on a two-tailed test based on p-values. We arrived at the conclusion of lack of statistically significant evidence to reject the Null Hypothesis on both the one-tailed and two-tailed tests when using test statistic values. The one-tailed test using p-values also suggested lack of statistically significant evidence to reject the Null Hypothesis. However, the p-value for the two-tailed test suggested statistically significant evidence to reject the Null Hypothesis in favour of the Alternative Hypothesis that there is an association between the performance rankings of these two measures. This inconsistent result suggests that a two-tailed test was probably inappropriate for this scenario given the very high negative correlation between the ROE and the Treynor measures that is close to minus one. This result could also be due to sampling error. This suggests that a positive association is non-existent were we to consider a larger sample. Definitive conclusions on this observation can only be reached by testing further using larger sample data over a longer sample period.
Overall, the results of the hypothesis testing confirm the proposition that there is a difference in performance of business activities when the returns are adjusted for risk. We reach the same conclusion that a business activity that performs better on a non-risk adjusted basis may not necessarily be the best performing on a risk adjusted basis. The opposite is also true. Therefore, the traditional and non traditional risk adjusted performance measures lead to different strategic decisions.
5.3 Discussion pertaining to Qualitative ResearchThe literature review section confirmed that banking executives should be using RAPMs in strategic decision-making. The quantitative section of the research then also confirmed the proposition that there is a difference in performance of business activities when the returns are adjusted for risk, suggesting that the risk adjusted measures of performance lead to materially different strategic decisions on capital allocation and investment or disinvestment from a business activity compared with the non-risk adjusted performance measures.
This view is consistent with the practice at Nedbank as confirmed by the executives interviewed. The executives were strongly in favour of Economic Profit as a key measure of performance. They noted that pricing decisions, capital allocation decisions, performance measurement, risk management and performance incentives for managers must all be based on RAPMs. This has largely been influenced by the introduction of Basel II in 2007 where the Nedbank Group adopted an Economic Capital framework for the measurement and allocation of capital alongside the Risk Adjusted Performance Measurement (RAPM) framework for the Group.
MICHAEL TICHAREVA RISK ADJUSTED PERFORMANCE MEASURES IN A PROPERTY FINANCE BUSINESS IN SA | 289
ASSA CONVENTION 2012, CAPE TOWN, 16–17 OCTOBER 2012
This adoption of an Economic Capital framework and a RAPM framework at Nedbank is exemplary. It is important that all the stakeholders are trained and are aware of the implications in both strategic and tactical decision-making.
While some executives recognised that, ultimately, Headline Earnings is the key measure of profitability since distribution of dividends to shareholders is based on the actual net cashflow achieved by the business, they also acknowledged that it must not be used in isolation. It is paramount to look at how the Headline Earnings are achieved, which includes a closer look at the risks being taken by a business and how efficiently capital is deployed on a risk adjusted basis to achieve the resultant Headline Earnings. This view is consistent with the adoption of the Economic Capital and RAPM frameworks.
Following these comments by the executives interviewed, it must be noted that Headline Earnings were a key input into the analysis of the performance measures in this research. The risks taken by a business were assessed by calculating the variances, covariances and betas of the Headline Earnings of business activities as key measures of risk. It is, therefore, accepted that, in practice, Headline Earnings are a key measure of profitability since it is the actual cash distributed to shareholders that matters the most in the eyes of the shareholders. However, the risk taken in achieving the Headline Earnings must be recognised.
The executives suggested that more capital should be allocated towards business activities that perform better on a risk adjusted basis. This is consistent with the findings in the literature review.
Looking at the different property categories for example, for the same level of loan to value, executives would be expected to allocate more capital towards lending against income-producing properties that service the loan and use less risk adjusted capital compared with, say, vacant land property that does not produce income and uses disproportionately higher risk adjusted capital.
The same principle would apply to listed property funds when compared with the unlisted corporate entities where executives would be expected to invest more capital in lending to the listed funds to maximise shareholder value. The principle would also apply to development loans for new buildings that are higher risk and use more risk adjusted capital compared with the long-term loans to completed buildings that generate income and are expected to provide higher Economic Profit assuming an appropriate pricing strategy.
However, such decisions are not as clear cut as they appear, or cast in stone, due to other practical and strategic considerations that include competition and the need to adopt defensive strategies to maintain market share. For example, it may be appropriate to loss lead and secure clients who will in future generate more profitable business on a risk adjusted basis. Most businesses start small and tend to build up slowly until they list. It means that a bank would miss the opportunity to lend into the resultant low-risk business where competitors played a critical role in the success of the business when it was considered high risk. One would also miss the opportunity to
290 | MICHAEL TICHAREVA RISK ADJUSTED PERFORMANCE MEASURES IN A PROPERTY FINANCE BUSINESS IN SA
ASSA CONVENTION 2012, CAPE TOWN, 16–17 OCTOBER 2012
lend into an income-producing property if you did not participate at the vacant land stage or at the development stage of the property.
It is, therefore, important to balance these decisions to ensure appropriate risk adjusted returns whilst building a sustainable business over the long term.
In another attempt to reconcile theory with practice, one of the executives interviewed argued strongly against the use of an ROA measure for different banks or business activities. The executive considered this measure as misleading, and as inappropriate to compare it with an ROE measure where the equity component was allocated taking into account the riskiness of the business to some degree.
The executive gave an example of a bank that holds mainly unsecured personal loans compared with a bank that holds Treasury Bills as assets. These assets are of different quality with the unsecured loan business expected to be higher risk. In that case, the ROA measure does not show the riskiness of the business and would not be useful as a comparison of these two businesses.
This reasoning sounds logical. It would be more useful to use risk weighted assets in such a case, which is what the RAPMs attempt to achieve. This is consistent with the Nedbank Group RAPM framework (Nedbank, 2009c). The challenge, though, would be to arrive at the appropriate risk weights especially when comparison is across banks rather than business units or activities of an individual bank.
The argument on quality of assets and definition of equity is consistent with the argument in the quantitative section above where it is pointed out that it is not necessarily the case that the ROE and the ROA measures will give consistent results on performance ranking despite the results of the quantitative research showing a high positive correlation between ROE and ROA performance rankings. We have to take into account the quality of assets used in the ROA calculation and the definition of equity used in the ROE calculation.
5.4 ConclusionThe results of the research are supported by the literature reviewed. Any anomalies may be a result of sampling error. They confirm that risk adjusted performance measures are different from traditional non-risk adjusted measures. The performance rankings and the hypothesis testing of the rankings confirm the results statistically.
The Jensen measure as a proxy to Economic Profit is considered an important measure. It allows for cost of capital. The negative returns for the Jensen measure suggest that the overall returns are below the benchmark returns that are expected based on the hurdle rate or cost of capital. This would suggest inefficient use of capital due to the negative Economic Profit. This could be evidence of lack of conscious application of RAPMs in strategic decision-making in the earlier years.
The executives interviewed were strongly in favour of Economic Profit as a key measure of performance. They noted that pricing decisions, capital allocation decisions, performance measurement, risk management and performance incentives for managers must all be based on RAPMs. They confirmed that the adoption of
MICHAEL TICHAREVA RISK ADJUSTED PERFORMANCE MEASURES IN A PROPERTY FINANCE BUSINESS IN SA | 291
ASSA CONVENTION 2012, CAPE TOWN, 16–17 OCTOBER 2012
an Economic Capital Framework for the measurement and allocation of capital alongside the Risk Adjusted Performance Measurement (RAPM) framework were key developments over the years from 2007 to date.
The research, therefore, reaffirms the proposition that there is significant change in performance rankings after adjusting returns for risk suggesting that the risk adjusted measures of performance lead to materially different strategic decisions on capital allocation and investment or disinvestment from a business activity compared with the non-risk adjusted performance measures.
It is paramount to look at how Headline Earnings are achieved by taking a closer look at the risks being taken by a business and how efficiently capital is deployed on a risk adjusted basis to achieve the resultant Headline Earnings. It is also important to consider other practical and strategic considerations for the long term sustainability of the business.
6. CONCLUSIONS AND RECOMMENDATIONS6.1 IntroductionThis section outlines the conclusions and recommendations arising from this research.Section 6.2 summarises the findings and the conclusions. Section 6.3 summarises the recommendations. Section 6.4 then suggests areas for further research that have been identified in performing this research.
6.2 Conclusions of the StudyThe results of this research are consistent with the results published in previous research as noted in the Literature Review section. They can, therefore, be considered to be both reliable and valid.
The key findings are that there are differences in performance rankings between traditional measures of performance and risk adjusted measures. Business activities that perform better on non-risk adjusted basis are not necessarily the best performing on a risk adjusted basis. Hypothesis testing also show that there is lack of statistically significant evidence to suggest that these differences in performance rankings are not material.
We conclude that RAPMs are superior measures of performance to traditional non-risk adjusted performance measures. The use of risk adjusted performance measures in a South African Property Finance Business lead to different strategic decisions. RAPMs introduce consistency in the comparison of the performance of business activities by considering risk. The effects of diversification are also allowed for in the analysis. This has been confirmed by the results of both the quantitative and qualitative elements of this research through reconciling theory with practice.
The research, therefore, reaffirms the proposition that there is significant change in performance rankings after adjusting returns for risk suggesting that the risk adjusted measures of performance lead to materially different strategic decisions on capital allocation and investment or disinvestment from a business activity compared
292 | MICHAEL TICHAREVA RISK ADJUSTED PERFORMANCE MEASURES IN A PROPERTY FINANCE BUSINESS IN SA
ASSA CONVENTION 2012, CAPE TOWN, 16–17 OCTOBER 2012
with the non-risk adjusted performance measures. It is important to look at how Headline Earnings are achieved by taking a closer look at the risks being taken by a business to achieve the resultant Headline Earnings.
6.3 RecommendationsThis research is important to executives involved in strategic decisions affecting the performance of banking and other financial institutions. Focusing on traditional measures of performance is no longer sufficient. This is exacerbated by regulatory requirements influenced by Basel II and III in banking and Solvency II in the short-term and long-term insurance sectors.
There are many applications of RAPMs in the management of banking and other financial institutions (Geyfman, 2005; James, 1996; Kimball, 1998; Kupper, 2000; Landskroner et al., 2005; Uyemura et al., 1996; Zaik et al., 1996). RAPMs provide a means to making optimal and sustainable decisions in the following areas of business for financial institutions:
— pricing decisions, — capital allocation among business units, products and activities, — performance measurement for business units, products and activities, — risk management, — strategic decision-making such as investment and disinvestment decisions or
mergers and acquisition decisions, and — performance incentives for managers.
It is recommended that banking executives pay particular attention to RAPMs in making these strategic decisions and implement sustainable systems built on a strong governance and risk management culture for the whole organisation.
Apart from banking, it is recommended that executives in the financial services industry in general focus on RAPMs when making strategic decisions affecting the performance of their financial institutions. For example, RAROC has become the most widely applied tool of financial risk management around the world, used by financial services firms for supporting decisions on portfolio allocations, business mix, product pricing, and employee remuneration (Milne A & Onorato, 2009).
Shareholders also need to start asking critical questions about the performance of their investments relative to the risks taken by the executives. This is consistent with increased shareholder activism in Europe and the US where Zaik et al. (1996) noted that managers had to be held accountable for the investor capital they were putting at risk by being subjected to RAPMs.
Very often, prospective and current shareholders look at ROE and ROA measures without paying particular attention to the risks associated with a particular investment. On a risk adjusted basis, businesses that perform better should, ideally, receive greater attention and allocated more capital, subject to other practical and strategic considerations.
MICHAEL TICHAREVA RISK ADJUSTED PERFORMANCE MEASURES IN A PROPERTY FINANCE BUSINESS IN SA | 293
ASSA CONVENTION 2012, CAPE TOWN, 16–17 OCTOBER 2012
Whilst executives may already be implementing RAPMs internally, it will become more transparent and useful when published financial statements start to show risk adjusted performance measures alongside the non-risk adjusted performance measures for the various business activities that a company may be undertaking, together with the performance rankings. This will give sufficient information and power to shareholders to start asking relevant questions that will ultimately influence the behaviour of executives. It is even more effective when executives are remunerated on risk adjusted performance based targets such as Economic Profit and RORAC.
In the investment fraternity, investment analysts of banks and other financial institutions would be an important force to highlight and explain more effectively the importance of RAPMs in their motivations for buy or sell recommendations of stocks to prospective private investors and fund managers.
6.4 Suggestions for further ResearchMany areas require more in-depth research in the field of risk management and the application of RAPMs to financial institutions. Based on the results of this research and the insights gleaned, it is suggested that the following be considered for further research by prospective researchers:
— Similar research on analysis of RAPMs covering the South African banking sector as a whole using published financial statements, focusing more on reconciling theory with practice to identify whether executives are paying attention to risk adjusted performance measures to enhance shareholder value or whether they are sticking to traditional accounting measures of performance.
— Analysis of the optimal capital allocation structure to the business activities for the banking sector and other financial services companies by deriving efficient portfolios using the mean variance portfolio theory techniques and comparing with actual investments into the various activities of the businesses.
— Analysis of the impact of diversification on performance of banking groups by calculating and analysing correlation matrices of profits, ROE, ROA and the RAPMs of the various banking activities to assess how this could affect the RAPMs and the strategic decisions that could arise.
— One problem with RAPMs is that they only measure and allow for risk in terms of risk and return. They fail to allow for other risks such as funding liquidity risks that can potentially cause a bank or a banking system to fail. There is scope for research in this area. This was also highlighted in a paper by one author where the author proposed an integrated model for liquidity management and short-term asset allocation in commercial banks on behalf of the Central Bank of Brazil (De Alcantara, 2008).
— Investigation of how South African banks have adopted frameworks for managing liquidity risks following the global financial crisis of 2008 and the impact such liquidity risk management frameworks might have on existing RAPM, Capital Management and Economic Capital frameworks.
294 | MICHAEL TICHAREVA RISK ADJUSTED PERFORMANCE MEASURES IN A PROPERTY FINANCE BUSINESS IN SA
ASSA CONVENTION 2012, CAPE TOWN, 16–17 OCTOBER 2012
— The Mean-Variance Portfolio theory (MPT) and the Capital Asset Pricing model (CAPM) give a framework for RAPMs. The measures that interpret risk in terms of standard deviation are based on the Capital Market line equation. Measures that interpret risk in terms of beta are based on the security market equation. However, these models are regarded as flawed in some respects (Fama & French, 2004). This is due to the underlying assumptions of a perfect market that does not hold in practice where banks will incur costs of market frictions. There is scope to research the appropriateness of these models in this work and to propose more suitable models, such as the multifactor model proposed by other authors (Froot & Stein, 1998; Zaik et al., 1996).
— Investigation of the different Risk Adjusted Performance Measurement Frameworks implemented by different banks in South Africa and analysis of the differences and similarities in such frameworks.
— Investigation of the different Capital Management and Economic Capital Frameworks implemented by different banks in South Africa and analysis of the differences and similarities in such frameworks.
— It is argued in this research that in the case where correlations between business activities is low or negative, then ROA and ROE over-estimates the required return and may lead to incorrect strategic decisions not to expand in that activity on the basis that it will be difficult to achieve the required rate of return (Geyfman, 2005). There is scope to investigate whether this proposition is true when compared to RAPMs.
— Investigation of the application of RAPM in strategic decision-making for financial institutions pre and post the global financial crisis of 2008 and how the financial crisis affected the thinking of executives on this subject.
ACKNOWLEDGEMENTSI wish to acknowledge and express my gratitude to the following people (in no particular order) without whom this research would not have been possible: My family, for their love, support and encouragement during my lonely time of doing this research. My first supervisor, Mr Max Mackenzie, who provided me with guidance in the initial stages of the research before he left Wits Business School. My second supervisor, Mr Douglas Taylor, for his guidance in finally completing the research. The following people for peer reviewing this report and providing useful comments: Dr Terence Sibiya, Mr Vusi Mpofu, and Mr Pravin Burra. Mrs Monette Joshua, for proof reading this report and providing useful comments. The Wits Business School Lecturers and Fuqua School of Business Lecturers who gave me the basic educational tools throughout my MBA career that later became useful in completing this research. My colleagues at Nedbank, for their support and encouragement. The Managing Executives and Senior Managers of Nedbank Corporate and Nedbank Corporate Property Finance for their honest views during interviews. My friends, colleagues and acquaintances, who helped with
MICHAEL TICHAREVA RISK ADJUSTED PERFORMANCE MEASURES IN A PROPERTY FINANCE BUSINESS IN SA | 295
ASSA CONVENTION 2012, CAPE TOWN, 16–17 OCTOBER 2012
proof-reading the research report. Nedbank Corporate Property Finance for supplying me with the data for the research. The Institute and Faculty of Actuaries Library staff for their support and allowing me to access their database for literature review material.
REfERENCESAlbright, S, Winston, W & Zappe, C (2006). Data Analysis & Decision Making with Microsoft
Excel (Third ed.). USA: Thomson South-Western.Blundell-Wignall, A & Atkinson, P (2010). Thinking Beyond Basel III: Necessary Solutions for
Capital and Liquidity. OECD Journal: Financial Market Trends, 2010(1), 1–23.Cresswell, J (2003). Research Design: Qualitative, Quantitative and Mixed Methods Approaches
(2nd ed.). London: Sage Publications.De Alcantara, W (2008). An Integrated Model for Liquidity Management and Short-Term Asset
Allocation in Commercial Banks. SSRN eLibrary. University of Brasil and Central Bank of Brasil. Retrieved from http://ssrn.com/paper=1021381
Dermine, J (1998). Pitfalls in the Application of RAROC in Loan Management. The Arbitrageur, 1(1), 21–7.
Doff, R (2008). Defining and measuring business risk in an economic-capital framework. The Journal of Risk Finance, 9.
Duffie, D & Pan, J (1997). An overview of value at risk. The Journal of Derivatives (SPRING 1997).Eubanks, W (2010). The Status of the Basel III Capital Adequacy Accord. Congressional Research
Service. United States of America.Fallon, W (1996). Calculating value-at-risk. Working Paper No 96-49 (Vol. Working Paper No
96–49): University of Pennsylvania, Wharton Financial Institutions Centre.Fama, E & French, K (2004). The Capital Asset Pricing Model: Theory and Evidence. Journal of
Economic Perspectives, 18(3), 25–46.Froot, K & Stein, J (1998). Risk management, capital budgeting and capital structure policy for
financial institutions: An integrated approach. Journal of Financial Economics, 47, 55–82.Geyfman, V (2005). Risk-Adjusted Performance Measures at Bank Holding Companies with
Section 20 Subsidiaries. Working Paper No. 05–26 (pp. 1–40): Reserve Bank of Philadelphia, Research Department.
Hanke, JE & Reitsch, AG (1994). Understanding Business Statistics. 2nd ed. United States: Richard D. Irwin, Inc. 15–39.
Hopkins, D, Khorasance, M & Scott, W (2002). Formulae and Tables for Examinations of The Faculty of Actuaries and The Institute of Actuaries (Second ed.). United Kingdom: The Faculty of Actuaries and The Institute of Actuaries.
Ishikawa, T, Yamai, Y & Ieda, A (2003). On the risk capital framework of financial institutions. Monetary and economic studies (October 2003), 83–105.
James, C (1996). RAROC based capital budgeting and performance evaluation: A case study of bank capital allocation. Working Paper No. 96–40: University of Pennsylvania, The Wharton Financial Institutions Centre.
296 | MICHAEL TICHAREVA RISK ADJUSTED PERFORMANCE MEASURES IN A PROPERTY FINANCE BUSINESS IN SA
ASSA CONVENTION 2012, CAPE TOWN, 16–17 OCTOBER 2012
Kalof, L, Dan, A & Dietz, T (2008). Essentials of Social Research (1st ed.). Berkshire, England: Open University Press, McGraw-Hill.
Kimball, R (1997). Innovations in performance measurement in banking. New England Economic Review, 23–38.
Kimball, R (1998). Economic profit and performance measurement in banking. New England Economic Review, 35.
Kupper, E (2000). Risk management in banking. Crisis.Landskroner, Y, Ruthenberg, D & Zaken, D (2005). Diversification and performance in banking:
The Israeli case. Journal of Financial Services Research, 27(1), 27–49.Merton, R (1995). Financial innovation and the management and regulation of financial
institutions. Journal of Banking and Finance, 19(3–4), 461–81.Merton, R & Perold, A (1993). Theory of risk capital in financial firms. Journal of Applied
Corporate Finance, 6(3), 16–32.Milne, A & Onorato, M (2009). Risk-Adjusted Measures of Value Creation in Financial Institutions.
Bank of Finland Research. Bank of Finland. Helsinki.Modigliani, F & Miller, M (1958). The cost of capital, corporation finance and the theory of
investment. The American Economic Review, 261–97.Nakada, P, Shah, H, Koyluoglu, H & Collingnon, O (1999). P&C RAROC: A catalyst for
improved capital management in the property and casualty insurance industry. The Journal of Risk Finance, 1(1), 1–18.
Nedbank (2009a). Nedbank Group Economic Capital Framework. Nedbank Group Limited. Johannesburg.
Nedbank (2009b). Nedbank Group Limited Strategy. Nedbank Group Limited. Johannesburg.Nedbank (2009c). Nedbank Group Risk Adjusted Performance Measurement Framework.
Nedbank Limited. Johannesburg.Soper, D (2006, 2012). Statistics Calculators. p-Value Calculator for a Student t-Test Version
3.0. Retrieved 09 January, 2012, from http://www.danielsoper.com/statcalc3/calc.aspx?id=8Stoughton, N & Zechner, J (2007). Optimal capital allocation using RAROC™ and EVA®. Journal
of Financial Intermediation, 16(3), 312–42.Styper, P & Vosloo, P (2005). The Banker’s Guide To The Basel II Framework. Johannesburg: The
Banking Association South Africa.Tashakkori, A & Teddlie, C (1998). Mixed Methodology: Combining Qualitative and
Quantitative Approaches. Applied Social Research Methods Series, 46, 44.Uyemura, D, Kantor, C & Pettit, J (1996). EVA® for banks: Value creation, risk management, and
profitability measurement. Journal of Applied Corporate Finance, 9(2), 94–109.Ward, L & Lee, D (2002). Practical Application of the Risk-Adjusted Return on Capital Framework.
Paper presented at the Casualty Actuarial Society Forum, Summer 2002.Willig, C (2008). Introducing Qualitative Research in Psychology: Adventures in Theory and
Method (2nd ed.). Berkshire, England: Open University Press, McGraw-Hill.Zaik, E, Walter, J, Retting, G & James, C (1996). RAROC at Bank of America: from theory to
practice. Journal of Applied Corporate Finance, 9(2), 83–93.
MICHAEL TICHAREVA RISK ADJUSTED PERFORMANCE MEASURES IN A PROPERTY FINANCE BUSINESS IN SA | 297
ASSA CONVENTION 2012, CAPE TOWN, 16–17 OCTOBER 2012
APPENDIX A: DATA REQUEST LETTER
26 March 2010
Dear Grant
As you are aware, I am currently undertaking research in partial fulfilment of my MBA at Wits Business School. I chose to research on Risk Adjusted Performance Measures (RAPMs) and their application in strategic decision-making for banking institutions.
The focus of my research is on the Property Finance business within banks. I have chosen Nedbank Corporate Property Finance as a case study. I will analyse RAPMs for the business over the past 5 years from 2005 to 2009 and draw conclusions from the results of the analysis. In order to perform this, I will require the following minimum information:
— Profit and Loss accounts for Property Finance as a whole over the past 5 years. — Profit and loss accounts for each of the 3 regions, split into Property Partners
and Debt funding book, over the same period. — Balance sheets corresponding to the P & L accounts requested in 1 and 2 above. — ROE calculations for each year and for each region if these have already been
calculated (and possibly ROA calculations) — The hurdle rates of return applied to property finance businesses over these years
and whether they differed per region and whether they are risk adjusted hurdle rates. My understanding is that the Bank’s hurdle rate is currently a ROE figure. I am not sure if this single hurdle rate is applied consistently for each business unit within the Nedbank Group.
— Risk Capital or Economic Capital allocated to each of the businesses above for each year. You can provide this at property sector level as well if possible (i.e. Offices, Industrial, Retail and Vacant land & Other)
— Regulatory Capital or actual capital allocated to each of the businesses above for each year. You can provide this at property sector level as well if possible (i.e. Offices, Industrial, Retail and Vacant land & Other).
— RAROCs for each year and each region if these have already been calculated (and possibly Economic Profit)
I would have wanted the above data also split into Offices, Industrial, Retail and Vacant land & other. However, since you indicated that we were not reporting on this basis historically, I am not sure to what extent I may be able to reconstruct this data over the period. This would give me very good insight into the performance of The Property Finance book by property sector. I am happy for any other suggestions you might have on this.
I would appreciate that the data be in excel format and sent through both email and on a disc.
298 | MICHAEL TICHAREVA RISK ADJUSTED PERFORMANCE MEASURES IN A PROPERTY FINANCE BUSINESS IN SA
ASSA CONVENTION 2012, CAPE TOWN, 16–17 OCTOBER 2012
My personal deadline for submitting my research report is 31 December 2010. I, therefore, would like to have received the data by 1 June 2010.
I look forward to your help on this.
Kind RegardsMichael TicharevaWits Business School MBA StudentCell number 0824459303Email: [email protected]
MICHAEL TICHAREVA RISK ADJUSTED PERFORMANCE MEASURES IN A PROPERTY FINANCE BUSINESS IN SA | 299
ASSA CONVENTION 2012, CAPE TOWN, 16–17 OCTOBER 2012
APPENDIX B: INTERVIEW QUESTIONNAIRE
15 January 2012
Dear Participant
As you may already be aware, I am currently undertaking research in partial fulfilment of my MBA at Wits Business School. I chose to research on Risk Adjusted Performance Measures (RAPMs) and their application in strategic decision-making for banking institutions.
The focus of my research is on the Property Finance business within banks. I have chosen Nedbank Corporate Property Finance as a case study. I have analysed RAPMs for the business over the past 7 years to 31 December 2011 and drew conclusions from the results of the analysis.
As part of the process, I would like to carry out an interview with you. This will allow me to get greater insight of actual practice to reconcile with the analysis of RAPMs that I have already performed. Below are five questions that will take approximately 5 minutes each to answer.
I do appreciate that you may have time constraints. I will be setting up a 30 minute meeting with you at a time convenient for you. Alternatively, you can answer the questions and I will follow up with a short telephone interview.
I would like to thank you for your time and I look forward to your participation in this interview.
Kind Regards
Michael TicharevaWits Business School MBA StudentCell number 0824459303Email: [email protected]
Question 1What is your understanding of Risk Adjusted Performance Measures (RAPMs) such as RAROC, RORAC and Economic Profit as applied to banking institutions and to Nedbank Corporate Property Finance in particular?
Question 2To what extent do you believe that these measures have influenced strategic decisions taken within banking institutions and in Nedbank Corporate Property Finance in particular over the past few years compared with the use of Return on Equity (ROE) and Return on Assets (ROA) metrics?
300 | MICHAEL TICHAREVA RISK ADJUSTED PERFORMANCE MEASURES IN A PROPERTY FINANCE BUSINESS IN SA
ASSA CONVENTION 2012, CAPE TOWN, 16–17 OCTOBER 2012
Question 3Would you explain to what extent Nedbank Group Limited considers RAPMs in allocating Capital among its businesses?
Question 4Do you feel that the allocation of Capital to Nedbank Corporate Property Finance over the past few years has been appropriate given the risks the business assumes compared with other businesses within the Group?
Question 5What would you use as the bank’s hurdle rate or cost of capital: a Return on Equity (ROE) measure or a RAPM and why?
MICHAEL TICHAREVA RISK ADJUSTED PERFORMANCE MEASURES IN A PROPERTY FINANCE BUSINESS IN SA | 301
ASSA CONVENTION 2012, CAPE TOWN, 16–17 OCTOBER 2012
APPENDIX C: DEfINITIONS Of PERfORMANCE MEASURES
ROA = Return on Assets =Average Headline Earnings of a business activity Average Total Assets of that business activity
Measures how efficiently the business is using its assets to generate income ROE = Return on Equity = Average Headline Earnings of a business activity Average Allocated Capital (Equity) of the business activity
Measures how efficiently the business is deploying its capital to generate income. Sharpe Measure= Average Headline Earnings of a business activity less Average Risk Free Profit that could have been achieved by that business activity Standard Deviation of Average Headline Earnings of that business activity
Measures excess return of a business activity over the risk free return that could have been achieved by that business unit per unit of risk taken by that business unit.
Risk free rate has been taken as the average of the 10 year South African Government Bond yields for the seven years to December 2011.
Treynor Measure = Average Headline Earnings of a business activity less Average Risk Free Profit that could have been achieved by that business activity Internal Systematic Risk of that business activity as measured by Beta where Beta = Covariances of Average Headline Earnings of Individual Business Activities with the Average Headline Earnings of the total Property Finance business Standard Deviation of Average Headline Earnings
Measures excess return of a business activity over the risk free return per unit of risk taken by that business activity relative to the risk taken by the whole business.
Beta is the measure of internal risk taken by a business activity relative to the risk taken by the whole business, called internal systematic risk
Jensen Measure = Average Headline Earnings of a business activity plus Expected Earnings on a benchmark portfolio as measured by CAPM Average Allocated Capital (Equity) of that business activity
The numerator is called the Jensen Alpha or the Abnormal Earnings Index.It is considered a measure of Economic Profit or Economic Value Added (EVA)
The expected earnings on a benchmark portfolio is measured by the Capital Asset Pricing Model (CAPM) as follows:Average Headline Earnings on a business activity plus Average Risk Free Earnings on that business activity less Excess
Earnings on benchmark portfolio over risk free earnings multiplied by Internal Beta of benchmark earningswhere Internal Beta = Covariances of benchmark earnings of individual business activities with
the benchmark earnings of the total Property Finance business Risk of Benchmark Earnings as measured by Variance
The hurdle rate used for the benchmark earnings is the 7 year average cost of capital allocated to Property Finance for the years to 31 December 2011 (Geyfman, 2005; Hopkins et al., 2002; Landskroner et al., 2005).
302 | MICHAEL TICHAREVA RISK ADJUSTED PERFORMANCE MEASURES IN A PROPERTY FINANCE BUSINESS IN SA
ASSA CONVENTION 2012, CAPE TOWN, 16–17 OCTOBER 2012
APPENDIX D: SUMMARY STATISTICS AND ASSUMPTIONS
Key Data and Statistics for calculating Sharpe and Treynor Measures
Prop
erty
Fina
nce
Lend
ing an
d Equ
ity
Inve
stmen
ts
Lend
ing on
ly
Equit
y Inv
estm
ents
only
Stru
cture
d Fina
nce
KZN
Lend
ing an
d Eq
uity
KZN
Lend
ing
Average Headline Earnings (R00 000)
6,519 4,558 989 303 1,025 953
Earnings Risk measured by Standard Deviation (R00 000)
MICHAEL TICHAREVA RISK ADJUSTED PERFORMANCE MEASURES IN A PROPERTY FINANCE BUSINESS IN SA | 307
ASSA CONVENTION 2012, CAPE TOWN, 16–17 OCTOBER 2012
Null Hypothesis
Hο: ρο = 0
There is significant change in performance rankings after adjusting returns for risk suggesting that the risk adjusted Jensen Measure leads to materially different strategic decisions compared with the non-risk adjusted ROE measure. In other words, there is no association between risk adjusted measures and non-risk adjusted measures, hence there is a change in performance rankings after adjusting returns for risk.
Alternative Hypothesis
Ha: ρο≠ 0
There is no significant change in rankings after adjusting returns for risk suggesting that the Jensen Measure does not lead to materially different strategic decisions compared with the ROE measure. In other words, there is an association between risk adjusted performance measures and non-risk adjusted performance measures, hence no change in performance rankings.
The test statistic has a t distribution with (n–2) degrees of freedom
Standard error of ρ: sρ =
√ (1–ρ2) √ (n–2)
1–ρ2 = 0.97 √ (1–ρ2) = 0.983
n–2 = 10 √ (n–2) = 3.162
sρ = 0.311
Decision based on α and the test statistic
Critical value of t with (n–2) degrees of freedom and α/2 = 0.005
= 3.169 Source: Formulae and Tables for Examinations of the Faculty and Institute of Actuaries
Test statistic: t = ρ–ροsρ
= 0.585
Since the calculated t statistic is much less than the critical value of 3.169, we do not reject the Null Hypothesis and conclude that there is no association between risk adjusted performance measures and non-risk adjusted performance measures at the α/2 = 0.005 significance level for the two-tailed test. We would arrive at the same decision for a one-tailed test.
Decision based on a and p-value
One Tail Test p-Value = 0.2858 Source of p-value calculator: www.danielsoper.com/statca;c3/ca; c.aspx?id=8Two Tail Test p-Value = 0.5715
Since the p-values for both the one-tailed test and the two-tailed test are much higher than the significant level of a=0.01, there is insufficient evidence to reject the Null Hypothesis and we do not reject the Null Hypothesis. We conclude that there is no association between risk adjusted performance measures and non-risk adjusted performance measures at the a=0.01 significance level.
Conclusion We conclude that there is significant change in performance rankings after adjusting returns for risk suggesting that the risk adjusted Jensen Measure leads to materially different strategic decisions on capital allocations and investment or disinvestment from a business activity compared with the non-risk adjusted ROE measure.(Albright et al., 2006; Hopkins et al.; Soper, 2006, 2012)
Note: The process above was repeated for all Hypothesis tests performed in this research.
308 | MICHAEL TICHAREVA RISK ADJUSTED PERFORMANCE MEASURES IN A PROPERTY FINANCE BUSINESS IN SA
ASSA CONVENTION 2012, CAPE TOWN, 16–17 OCTOBER 2012
APPENDIX f: CONSISTENCY MATRIX
Research Problem: To determine if the use of risk adjusted performance measures in a South African Property Finance Business leads to different strategic decisions.
Literature Review
Geyfman (2005); James (1996); Kimball (1998); Kimball (1997); Kupper (2000); Landskroner et al. (2005); Uyemura et al. (1996); Ward and Lee (2002); Zaik et al. (1996)
Propositions RAPMs, in particular RAROC and Economic Profit, when compared with traditional non-risk based performance measures such as ROE and ROA, lead to different results on performance ranking of business units or activities within a business unit, and lead to different strategic decisions on capital allocation and decisions to invest in or disinvest from business units or activities.
Source of data • Data from Nedbank Corporate Property Finance Management Accounts• Nedbank Group Limited Financial Statements• Interviews with Nedbank Executives (see interview questions in Appendix A)• Financial Market data from Nedbank Capital Research Unit
Type of data • Ratio data from accounts• Qualitative data from interviews, which will be used to assist with interpretation of
quantitative results
Analysis • Calculation of ROE, ROA and RAPMs• Calculation of Spearman Rank Correlation Coefficients between ROE, ROA and the RAPMs• Hypothesis testing of Spearman Rank Correlation Coefficients