+ All Categories
Home > Documents > University of Groningen Risk-adjusted performance measures ...

University of Groningen Risk-adjusted performance measures ...

Date post: 13-Jan-2022
Category:
Upload: others
View: 2 times
Download: 0 times
Share this document with a friend
24
University of Groningen Risk-adjusted performance measures and implied risk-attitudes Plantinga, Auke; Groot, Sebastiaan de IMPORTANT NOTE: You are advised to consult the publisher's version (publisher's PDF) if you wish to cite from it. Please check the document version below. Document Version Publisher's PDF, also known as Version of record Publication date: 2001 Link to publication in University of Groningen/UMCG research database Citation for published version (APA): Plantinga, A., & Groot, S. D. (2001). Risk-adjusted performance measures and implied risk-attitudes. s.n. Copyright Other than for strictly personal use, it is not permitted to download or to forward/distribute the text or part of it without the consent of the author(s) and/or copyright holder(s), unless the work is under an open content license (like Creative Commons). The publication may also be distributed here under the terms of Article 25fa of the Dutch Copyright Act, indicated by the “Taverne” license. More information can be found on the University of Groningen website: https://www.rug.nl/library/open-access/self-archiving-pure/taverne- amendment. Take-down policy If you believe that this document breaches copyright please contact us providing details, and we will remove access to the work immediately and investigate your claim. Downloaded from the University of Groningen/UMCG research database (Pure): http://www.rug.nl/research/portal. For technical reasons the number of authors shown on this cover page is limited to 10 maximum. Download date: 13-01-2022
Transcript

University of Groningen

Risk-adjusted performance measures and implied risk-attitudesPlantinga, Auke; Groot, Sebastiaan de

IMPORTANT NOTE: You are advised to consult the publisher's version (publisher's PDF) if you wish to cite fromit. Please check the document version below.

Document VersionPublisher's PDF, also known as Version of record

Publication date:2001

Link to publication in University of Groningen/UMCG research database

Citation for published version (APA):Plantinga, A., & Groot, S. D. (2001). Risk-adjusted performance measures and implied risk-attitudes. s.n.

CopyrightOther than for strictly personal use, it is not permitted to download or to forward/distribute the text or part of it without the consent of theauthor(s) and/or copyright holder(s), unless the work is under an open content license (like Creative Commons).

The publication may also be distributed here under the terms of Article 25fa of the Dutch Copyright Act, indicated by the “Taverne” license.More information can be found on the University of Groningen website: https://www.rug.nl/library/open-access/self-archiving-pure/taverne-amendment.

Take-down policyIf you believe that this document breaches copyright please contact us providing details, and we will remove access to the work immediatelyand investigate your claim.

Downloaded from the University of Groningen/UMCG research database (Pure): http://www.rug.nl/research/portal. For technical reasons thenumber of authors shown on this cover page is limited to 10 maximum.

Download date: 13-01-2022

������������ ������������������

������ ���������������

Auke Plantinga and Sebastiaan de Groot1

November 2001

SOM-theme E: Financial markets and institutions

��������

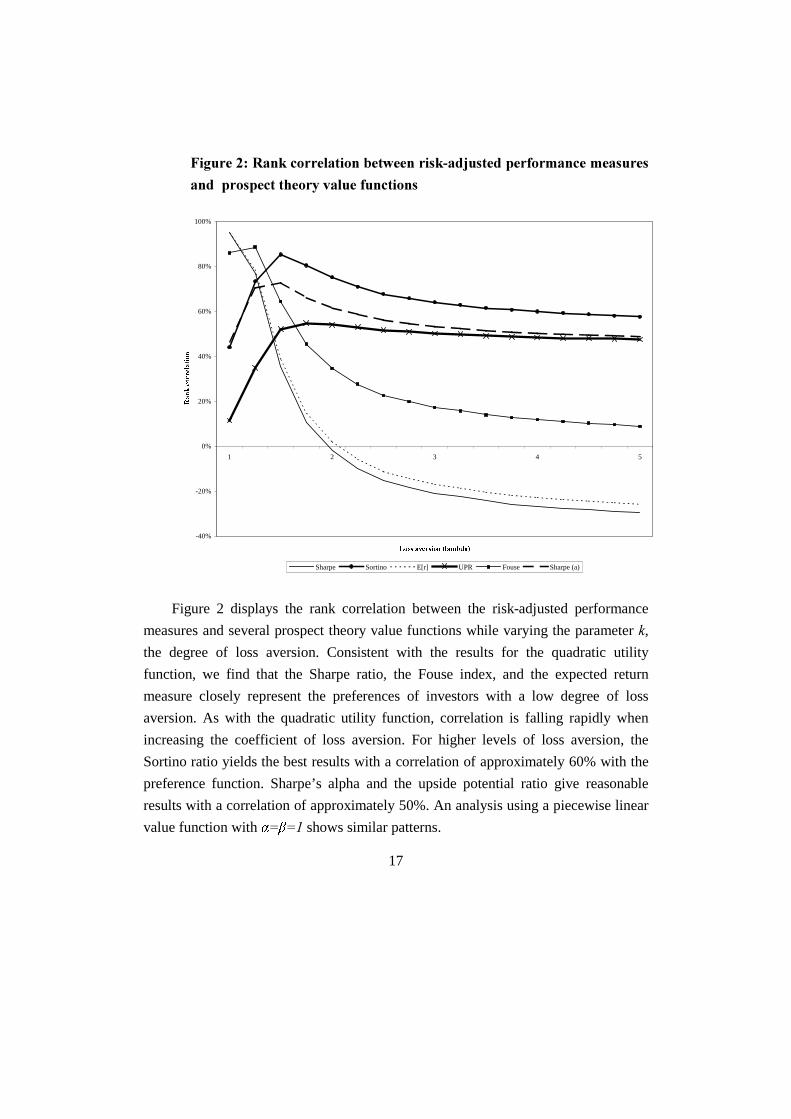
In this article we study the relation between performance measures and preferences

functions. In particular, we examine to what extent performance measures can be used as

alternatives for preference functions. We study the Sharpe ratio, Sharpe’s alpha, the expected

return measure, the Sortino ratio, the Fouse index, and the upside potential ratio. We find that

the first three measures correspond to the preferences of investors with a low degree of risk

aversion, whereas the latter three measures correspond to the preferences of investors with

intermediate and high degrees of risk aversion.

1 Auke Plantinga is associate professor of finance at the University of Groningen. Sebastiaande Groot is an investment analyst at ACAM Advisors LLC, a hedge fund of funds manager inNew York. The authors acknowledge the helpful comments from Frank Sortino and ElmerSterken. The usual disclaimer applies.

1

�� ������������

Risk-adjusted performance measures are frequently used to rank investment

opportunities. For example, ranking mutual funds is a popular tool in assisting

investors with their investment choices, and these rankings are often based on risk-

adjusted performance measures. The suggestion implicit in such a ranking is that the

first fund is the best fund. The ranking methods differ due to different choices for the

return and risk measures as well as the way of adjusting for risk. The justification of a

ranking depends on the rationale behind the ranking criterion. For example, a ranking

based on the mean geometric return ranks investment opportunities according to the

increase in wealth of the investor. Such a measure can be motivated by assuming that

the investor wants to maximize future wealth, regardless of risk as measured by

volatility. Risk-adjusted performance measures can be motivated by assuming that

investors are risk averse and need to be compensated for being exposed to risk.

Therefore, the choice of the appropriate performance measure should be determined,

at least partially, by the preference function of the investor.

The choice of a performance measure may also be justified by other

considerations. A frequently used justification of a performance measure is its ability

to identify the investment skills of portfolio managers. Two interesting contributions

to this discussion are Dybvig and Ross [1985] and Kothari and Warner [2001]. Both

studies focused on the ability of several risk-adjusted performance measures, such as

Jensen’s alpha and the Sharpe ratio, to identify investment skills. The model of

Dybvig and Ross expresses the performance measure as a function of the forecasting

skills of the portfolio manager, the standard deviation of returns, and the risk aversion

of the investor. Both studies concluded that the performance measures have

significant difficulties in detecting investment skills. In order to detect investment

skills at the usual levels of significance, the forecasting skills of the manager have to

be very significant. This leads to the interesting observation that if a risk-adjusted

performance measure is not able to detect forecasting skills in a reliable way, a

2

ranking based on such a measure is not likely to be a ranking of forecasting abilities.

Therefore, an alternative justification for the use of risk-adjusted performance

measures is necessary.

In this study, we investigate such an alternative justification. In particular, we

examine the use of a risk-adjusted performance measure as an alternative to a

preference function, such as a utility function or a prospect theory value function.

From the perspective of an individual investor, a risk-adjusted performance measure

can be regarded an attractive substitute for the preference function of the investor.

The construction of a formal preference function may be infeasible for an individual

investor due to a lack of mathematical skills or the effort needed to perform such a

task. A ranking based on a risk-adjusted performance measure, as published in

popular investment magazines or on the web-sites of data vendors such as

Morningstar or Micropal, may save the individual a lot of effort and time. However,

before a risk-adjusted performance measure can be used this way, the individual

should be aware of his risk attitudes in general terms (high or low risk aversion).

Furthermore, he should also be aware of the risk attitudes implicit in the use of the

performance measures.

Usually, individual investors do not make extensive efforts to formulate formal

preference functions of their own behavior. Often, they rely on the help of financial

planners, who assist their clients in identifying their risk attitudes. Investors may use,

for example, questionnaires focussing on their behavior in hypothetical risky choices,

life-style factors, or other factors affecting risk attitudes. However, there is a large

group of individuals that do not rely on the help of financial advisors at all. Instead,

they may seek help from popular financial magazines or other sources of information

on mutual funds, such as Morningstar or Micropal. These sources typically provide

investors with rankings of mutual funds based on risk-adjusted performance

measures. A risk-adjusted performance measure generally corrects the average return

of a mutual fund for the level of risk. The risk-adjustment procedure is an implicit

way of modeling risk attitudes. An individual using a ranking based on such a

3

measure adheres to the risk attitudes implicit in the performance measure. Therefore,

by using this risk-adjusted performance measure, the individual sacrifices the

opportunity to implement his individual risk attitudes. Consequently, it is important to

study the implied risk attitudes of these performance measures. In doing so, we try to

achieve a general classification of risk-adjusted performance measures into those that

correspond to a low degree of risk aversion and those that correspond to a high degree

of risk aversion. Using a performance measure rather than a preference function also

simplifies the problem of an investor who does not want to model his formal

preference function. Such an investor only needs to calibrate his risk preferences in

terms of a high versus a low level of risk aversion and select the appropriate ranking

device.

Summarizing, the objective of this article is to find the risk preferences implicit

in using risk-adjusted performance measures. To this end we take a pragmatic

approach. We calculate rankings motivated both by preference functions and risk-

adjusted performance measures, and we use rank-correlation coefficients to evaluate

the degree of correspondence. In an earlier study, we studied a similar question2. We

found that some performance measures, such as the Sharpe ratio, are associated with a

low level of risk aversion, whereas other performance measures, such as the upside

potential ratio and the Fouse index, are associated with a high level of risk aversion.

These results were based on a sample of Dutch mutual funds for the period March

1993 through March 1999. In this article we extend this study by using a different

data set. This allows us to investigate the sensitivity of our earlier results to changes

in the choice of the data set. In addition, we extend the set of preference functions by

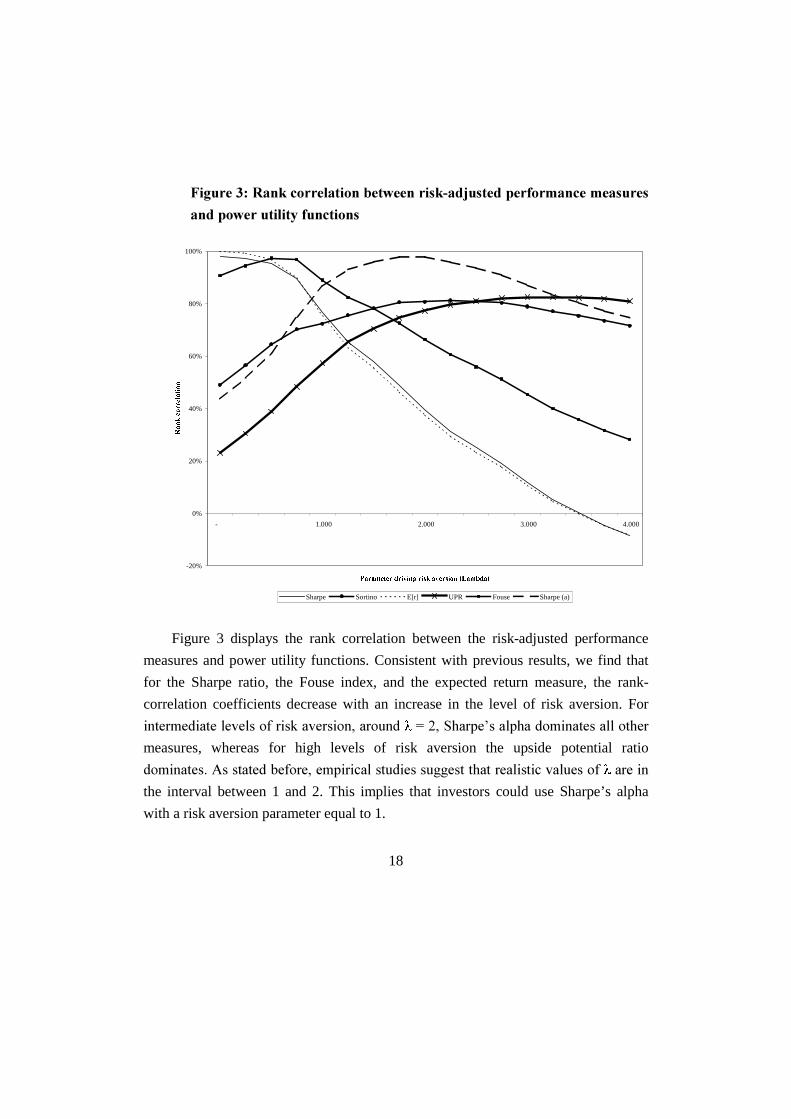
including the power utility function, which exhibits constant relative risk aversion.

This utility function is quite popular, in particular in studies of the equity premium

puzzle3.

2 See Plantinga and De Groot [2001].3 See, for example, Kocherlakota [1996].

4

� ���!���"���#��$#�%��&���#�&#����#�����#���������������#'������

As stated before, the focus of this study is on the use of risk-adjusted

performance measures as an alternative for a preference function in selecting

investment opportunities. Examples of such performance measures, which will be

discussed subsequently, are the Sharpe ratio, Sharpe’s alpha, the Sortino ratio, the

Fouse index, and the upside potential ratio.

The Sharpe ratio was introduced as the reward to variability ratio4 in order to

evaluate the performance of mutual funds. The Sharpe ratio is defined as follows:

[ ]σ

I����

−= , (1)

where �[�] is the expected rate of return, �I����������������������� �� �������� ����

deviation.

The Sharpe ratio has some attractive features that contributed to its popularity.

An important property is that the Sharpe ratio can be used as the objective function in

mean-variance optimization5, where the portfolio with the highest Sharpe ratio is the

optimal portfolio of risky assets. Consequently, the Sharpe ratio is an obvious choice

to be included in this study.

Sharpe [1994] pointed out that the Sharpe ratio can be interpreted as a t-statistic

to test the hypothesis that the return on the portfolio is equal to the risk-free return. A

higher Sharpe ratio is consistent with a higher probability that the portfolio return will

exceed the risk-free return. Consequently, the Sharpe ratio can be used by investors

who prefer a portfolio with a minimal probability of falling below the risk-free rate.

4 See Sharpe [1966].

5

Similar to mean-variance theory, the Sharpe ratio is motivated by either of the

following two assumptions:

1. Returns are normally distributed;

2. The investor has a preference function in terms of mean and variance.

Based on these assumptions, alternative performance measure can be derived.

Consider the following performance measure, which we will call Sharpe’s alpha:

[ ] 2σα ��� −= , (2)

where � is a parameter driving the level of risk aversion. This measure is often used

as an alternative representation of the quadratic utility function.

5 See Elton and Gruber [1995] and Benninga [1997].

6

(� ���!���"���#��$#�%��&���#�&#����#�����#�������)����#����!

In addition to the Sharpe ratio and Sharpe’s alpha, this study also examines

several risk-adjusted performance measures that are not based on the aforementioned

assumptions. A common characteristic of these alternative performance measures is

the use of so-called downside deviation with respect to a reference point. The

reference point, which may also be called the minimal acceptable rate of return, is

used to distinguish “risk” from “volatility”. According to Sortino and Van der Meer

[1991], realizations above the reference point imply that goals are accomplished and,

therefore, are considered “good volatility”. Realizations below the reference point

imply failure to accomplish the goals and should be considered “bad volatility” or

risk. Based on this premise, this study investigates the Sortino ratio, the Fouse-index,

and the upside-potential ratio. The Sortino ratio is probably the most well-known

measure, and it is calculated as follows:

[ ]δ

PDU���

����−

= , (3)

where �PDU is the minimal acceptable rate of return and is the downside risk with

respect to the minimal acceptable rate of return.

The Fouse index is the equivalent of Sharpe’s alpha in a mean – downside risk

environment. Sortino and Price [1994] defined the measure as follows:

2][ δ������ −= , (4)

where � is a parameter representing the degree of risk aversion of the investor.

The Sortino ratio and the Fouse index rely on the use of expected return and

downside risk. Expected return is used as a measure of the potential reward of an

7

investment opportunity. An alternative for using the expected return is the so-called

upside potential ratio, which is the probability weighted average of returns above the

reference rate. The upside potential ratio was developed by Sortino, Van der Meer,

and Plantinga [1999] and is defined as:

( )

( )∑

=

=

+

−=

�����

�����

��

��

���

1

2

1

1

1

ι

ι(5)

where is the number of periods in the sample, �W is the return of an investment in

period �, � =1 if �W��PDU, �= 0 if �W����PDU,

��1 if �W����PDU�and ��0 if �W��PDU. An

important advantage of using the upside potential ratio rather than the Sortino ratio is

the consistency in the use of the reference rate for evaluating both profits and losses.

Finally, an important difference between downside risk and standard deviation is

the use of an exogenous reference rate versus the mean return. The investor’s

objective function motivates the choice of the reference rate. As a result, a part of the

investor’s preference function is introduced into the risk calculation. Therefore, the

resulting calculation is only valid for individuals sharing the same reference rate.

Investors with different minimal acceptable rates of return will have different

rankings.

8

*� �#%#�#��#�%��������

Economists usually represent the preferences of individuals by using a

preference function, a mathematical function that enables the individual to rank

relevant choices. As all the performance measures discussed in the previous sections

are also mathematical functions that can be used to rank choices, this definition

implies that all these measures are also preference functions. Consequently, the

distinction between performance measures and preference functions is somewhat

arbitrary and is largely based on their origination in the relevant literature.

Performance measures are usually proposed in the literature on selecting investment

opportunities and mutual funds, whereas preference functions are associated with the

literature on modeling (hypothetical) choices by individuals.

Parallel to the discussion on the choice of the appropriate performance measure

is a similar discussion on the choice of the appropriate preference function. This study

focuses on the discussion regarding the choice between a normative utility function

and a descriptive preference function.

In the classical economic theory, utility functions are the favored kind of

preference functions. Utility functions model the subjective risk attitudes of the

individual investor. Consequently, individual investors may differ in their degree of

risk aversion: one investor can be extremely risk averse, whereas another can be less

risk averse. Usually, investors are assumed to be risk averse. Utility functions are a

special class of preference function that satisfy a set of axioms guaranteeing that the

individual exhibits consistent and rational behavior6. Even within the class of utility

functions, a wide variety of possible functional forms are available, each with

different characteristics. Often, the choice of the utility function in an economic

model seems to be driven by the capacity to generate analytically tractable solutions.

For example, in portfolio optimization applications, the quadratic utility function is

9

often used as it closely corresponds to this type of problem: it can be expressed

directly in terms of the parameters that reflect the expectation and standard deviation

of the return distribution of the investment opportunities. The fact that the quadratic

utility function has the undesirable property of decreasing utility at a sufficiently high

level of wealth seems to be ignored and can be considered to be the price of building

a simple model.

The quadratic utility function is defined as:

2������������ = , (6)

where � represents the wealth level, and � is a parameter driving the risk aversion of

the investor. A relevant property of a utility function is the behavior of relative risk

aversion as a function of wealth7. An investor with a quadratic utility function

displays increasing relative risk aversion, which implies that the investor tends to

invest less in risky assets as his wealth increases. Increasing relative risk aversion

does not seem to be a very plausible assumption. For example, Blume and Friend

[1975] found evidence in support of constant relative risk aversion (CRRA), which

implies that the relative allocation to risky assets is not affected by the level of

wealth. The following power utility function exhibits CRRA and is frequently used in

the literature:

( )λ

λ

−=

1

1��� , (7)

������ � ��� �� ���������� ����� �� ���� ������� �� ����� ������� � �� ���� � �������� �� �

��������������������� ������������ ������� ��������� ���� ���8.

6 See Fama and Miller [1972].7 See Pratt [1964].8 Kocherlakota [1996] ����� ��������������� �� ������ ��������������� �

10

Empirical studies showed that the behavior implied in using utility functions may

be inconsistent with real behavior. For example, Tversky and Kahneman [1992]

found that investors display risk-seeking behavior in choices involving losses and

risk-averse behavior in choices involving gains. Tversky and Kahneman developed

the so-called prospect theory value function that facilitates both risk-seeking and risk-

averse behavior. The prospect theory value function is a descriptive preference

function that does not satisfy the axioms of rational behavior and, therefore, is not a

utility function. Descriptive preference functions are evaluated based on their ability

to explain actual decisions of individuals, whereas more traditional research usually

focuses on normative choice behavior in experimental settings.

A distinctive property of the prospect theory value function is that risk attitudes

change on either side of a reference point. Tversky and Kahneman suggested that the

reference point is equal to the current wealth level. In the domain of outcomes below

the current wealth level (the so-called domain of losses), the investor exhibits a

preference for risk. On the other hand, in the domain of outcomes above the current

wealth level, the so-called domain of gains, the investor exhibits risk aversion.

Tversky and Kahneman suggested the following specification of the prospect theory

value function:

( ) 0

0x)(

<≥

−−⟨=

���

��� β

α , (8)

where � is a constant reflecting the concept of loss aversion, and the parameters and

are related to risk attitudes and determine the shape of the function. Based on

empirical research, Tversky and Kahneman [1992] found the following parameter

estimates: α=β =0.88 and �=2.25. As an alternative for the coefficients suggested by

Tversky and Kahneman, this study also examined a piecewise linear version of the

����������������������� ���� �������� ��� �����

11

In order to use the prospect theory value function in a way that is consistent with

the performance measures based on downside risk, we choose a minimal acceptable

rate of return equal to 0%. More generalized versions of the prospect theory value

functions allow for reference points different from 0%9.

9 See, for example, De Groot [1998].

12

+� ��&$����,����!���"���#��$#�%��&���#�&#����#������$�#%#�#��#�%��������

This section answers the main question raised in this paper, as it evaluates the

risk preferences implicit in risk-adjusted performance measures. In addition, this

section investigates the quality of risk-adjusted performance measures as an

alternative to preference functions. To be suited as an alternative to a preference

function, a risk-adjusted performance measure should facilitate the trade-off between

risk and return. Given the concept of risk aversion, it is reasonable to expect that

funds with a high level of risk, however that may be measured, should be penalized.

A first analysis of the trade-off between risk and return is to examine the rank-

correlation coefficients between the risk-adjusted performance measure and the risk

and return measures. To this end, we collected a sample of 253 U.S. mutual funds

returns from Datastream. Each mutual fund has a return history of 312 months. In

Table 1 we present some general statistics for the funds included in our sample. We

estimated the investment styles using Sharpe’s style regressions10. We obtained data

on a bond index and IIA Style indices for U.S. Value, U.S. growth, European Value,

European Growth, Pacific Value, and Pacific Growth stocks from Micropal and used

these as explanatory variables in the style regression. A fund is classified as having a

particular style if the style coefficient for the corresponding index exceeds 50%. The

majority of the funds has only style exposure to domestic (regional) factors. Except

for 42 bond funds, all funds can be classified as either a value fund or a growth fund.

10 See Sharpe [1992].

13

��-#��.��� #�%��&���#�������/-#��0�����#���������%��0#�%����

# funds E[R] R2

All funds 253 0.56% 5.79% 53.70%

Bond style 42 0.32% 2.50% 57.12%

Value style 75 0.61% 6.06% 52.90%

Growth style 107 0.62% 7.12% 51.80%

Unclassified 29 0.58% 4.96% 57.80%

Domestic style 246 0.55% 5.45% 54.76%

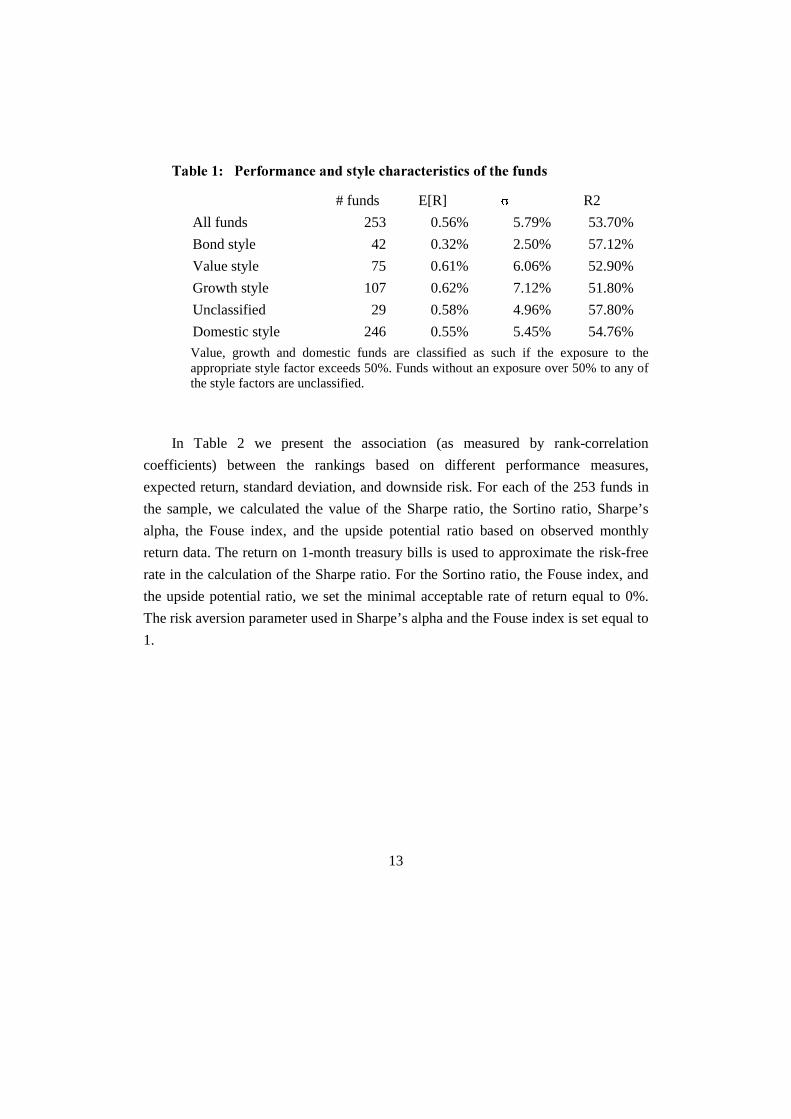
Value, growth and domestic funds are classified as such if the exposure to theappropriate style factor exceeds 50%. Funds without an exposure over 50% to any ofthe style factors are unclassified.

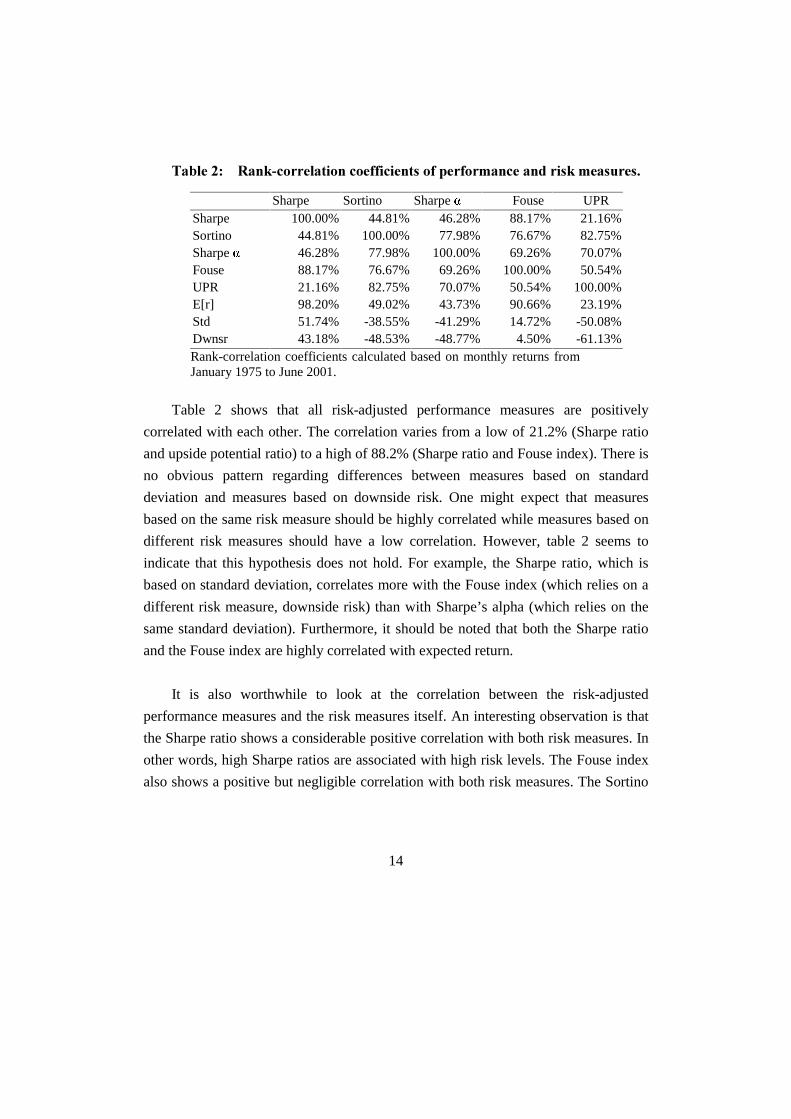
In Table 2 we present the association (as measured by rank-correlation

coefficients) between the rankings based on different performance measures,

expected return, standard deviation, and downside risk. For each of the 253 funds in

the sample, we calculated the value of the Sharpe ratio, the Sortino ratio, Sharpe’s

alpha, the Fouse index, and the upside potential ratio based on observed monthly

return data. The return on 1-month treasury bills is used to approximate the risk-free

rate in the calculation of the Sharpe ratio. For the Sortino ratio, the Fouse index, and

the upside potential ratio, we set the minimal acceptable rate of return equal to 0%.

The risk aversion parameter used in Sharpe’s alpha and the Fouse index is set equal to

1.

14

��-#� . ���!�����#-��������#%%���#�����%�$#�%��&���#��������!�&#����#�1

Sharpe Sortino Sharpe Fouse UPRSharpe 100.00% 44.81% 46.28% 88.17% 21.16%Sortino 44.81% 100.00% 77.98% 76.67% 82.75%Sharpe 46.28% 77.98% 100.00% 69.26% 70.07%Fouse 88.17% 76.67% 69.26% 100.00% 50.54%UPR 21.16% 82.75% 70.07% 50.54% 100.00%E[r] 98.20% 49.02% 43.73% 90.66% 23.19%Std 51.74% -38.55% -41.29% 14.72% -50.08%Dwnsr 43.18% -48.53% -48.77% 4.50% -61.13%Rank-correlation coefficients calculated based on monthly returns fromJanuary 1975 to June 2001.

Table 2 shows that all risk-adjusted performance measures are positively

correlated with each other. The correlation varies from a low of 21.2% (Sharpe ratio

and upside potential ratio) to a high of 88.2% (Sharpe ratio and Fouse index). There is

no obvious pattern regarding differences between measures based on standard

deviation and measures based on downside risk. One might expect that measures

based on the same risk measure should be highly correlated while measures based on

different risk measures should have a low correlation. However, table 2 seems to

indicate that this hypothesis does not hold. For example, the Sharpe ratio, which is

based on standard deviation, correlates more with the Fouse index (which relies on a

different risk measure, downside risk) than with Sharpe’s alpha (which relies on the

same standard deviation). Furthermore, it should be noted that both the Sharpe ratio

and the Fouse index are highly correlated with expected return.

It is also worthwhile to look at the correlation between the risk-adjusted

performance measures and the risk measures itself. An interesting observation is that

the Sharpe ratio shows a considerable positive correlation with both risk measures. In

other words, high Sharpe ratios are associated with high risk levels. The Fouse index

also shows a positive but negligible correlation with both risk measures. The Sortino

15

ratio, Sharpe’s alpha, and the upside potential ratio show negative correlation with the

risk measures11.

��,��#��.����!�����#-�������#�)##�����!���"���#��$#�%��&���#�&#����#�

����2������������-��/�%�������

-60%

-40%

-20%

0%

20%

40%

60%

80%

100%

0 1 2 3 4 5 6

5LVN�DYHUVLRQ��$�

5DQN�FRUUHODWLRQ

Sharpe Sortino E[r] UPR Fouse Sharpe (a)

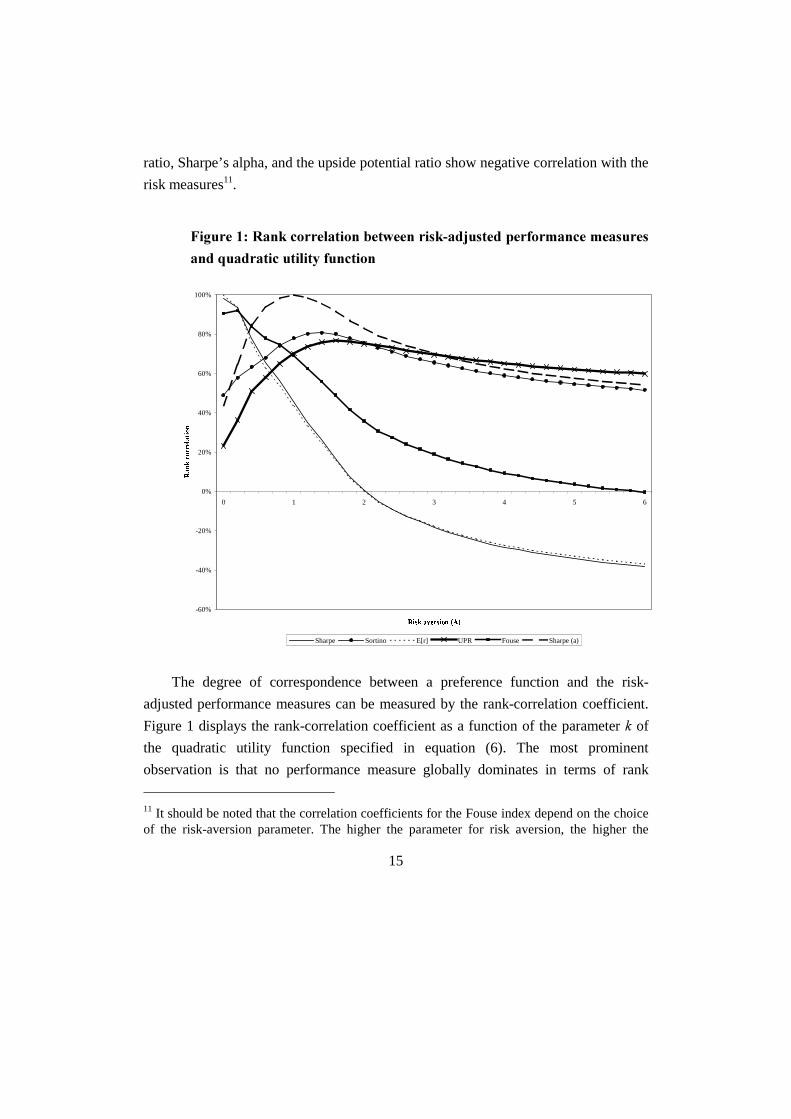
The degree of correspondence between a preference function and the risk-

adjusted performance measures can be measured by the rank-correlation coefficient.

Figure 1 displays the rank-correlation coefficient as a function of the parameter � of

the quadratic utility function specified in equation (6). The most prominent

observation is that no performance measure globally dominates in terms of rank

11 It should be noted that the correlation coefficients for the Fouse index depend on the choiceof the risk-aversion parameter. The higher the parameter for risk aversion, the higher the

16

correlation with the quadratic utility function. For low values of �, corresponding with

low levels of risk aversion, the Sharpe ratio, the Fouse index, and the expected rate of

return correlate well with the utility function. However, for higher values of �,

corresponding with high levels of risk aversion, correlation with the preference

function is falling rapidly and even becomes negative. The upside potential ratio,

Sharpe’s alpha, and the Sortino ratio display reasonable results, except for very low

values of the risk-aversion parameter �. However, the correlation between these

measures and the risk-aversion coefficient is not constant: for low values of �

correlation is low, for intermediate values (around � = 1) correlation is very high, and

for high values of � correlation is dropping slowly. Nevertheless, for high values of ��

these measures provide a far better approximation of the investor’s preferences than

the Sharpe ratio, the Sortino ratio, and the expected return measure.

These results are consistent with Jia and Dyer [1996]. Jia and Dyer showed that

the quadratic utility function is one of two classes of continuously differentiable

functions that can be represented in the form of a separable risk-value model. In other

words, the expected value of a quadratic utility function can be rewritten in terms of

return and standard deviation as follows:

( )[ ] ( ) 2][ �������� σ−= . (9)

Since Sharpe’s alpha has a form similar to equation (9), there must be a quadratic

utility function that generates the same ranking. Since none of the other performance

measures has a functional form similar to equation (9), it should not be expected that

any of these measures would correlate perfectly with the quadratic utility function.

importance of the risk measure in determining the ranking correlation.

17

��,��#� .����!�����#-�������#�)##�����!���"���#��$#�%��&���#�&#����#�

�����$���$#����0#��/�'�-�#�%��������

-40%

-20%

0%

20%

40%

60%

80%

100%

1 2 3 4 5

/RVV�DYHUVLRQ��ODPEGD�

5DQN�FRUUHODWLRQ

Sharpe Sortino E[r] UPR Fouse Sharpe (a)

Figure 2 displays the rank correlation between the risk-adjusted performance

measures and several prospect theory value functions while varying the parameter �,

the degree of loss aversion. Consistent with the results for the quadratic utility

function, we find that the Sharpe ratio, the Fouse index, and the expected return

measure closely represent the preferences of investors with a low degree of loss

aversion. As with the quadratic utility function, correlation is falling rapidly when

increasing the coefficient of loss aversion. For higher levels of loss aversion, the

Sortino ratio yields the best results with a correlation of approximately 60% with the

preference function. Sharpe’s alpha and the upside potential ratio give reasonable

results with a correlation of approximately 50%. An analysis using a piecewise linear

value function with � �� shows similar patterns.

18

��,��#�(.����!�����#-�������#�)##�����!���"���#��$#�%��&���#�&#����#�

����$�)#�����-��/�%��������

-20%

0%

20%

40%

60%

80%

100%

- 1.000 2.000 3.000 4.000

3DUDPHWHU�GULYLQJ�ULVN�DYHUVLRQ��/DPEGD�

5DQN�FRUUHODWLRQ

Sharpe Sortino E[r] UPR Fouse Sharpe (a)

Figure 3 displays the rank correlation between the risk-adjusted performance

measures and power utility functions. Consistent with previous results, we find that

for the Sharpe ratio, the Fouse index, and the expected return measure, the rank-

correlation coefficients decrease with an increase in the level of risk aversion. For

� �������������������������������� ������ �� ������������ ������������ ��������������

measures, whereas for high levels of risk aversion the upside potential ratio

���� ������!������������������������������������������������������������������ ������

the interval between 1 and 2. This implies that investors could use Sharpe’s alpha

with a risk aversion parameter equal to 1.

19

3� ����-������

In this article we investigated the risk preferences implicit in the use of risk-

adjusted performance measures. To this end, we studied mutual fund rankings from

the perspective of an individual investor who wants to invest in a mutual fund. In

particular, this investor has to select one mutual fund from a large universe of funds.

We analyze the differences between the outcomes of rankings based on performance

measures and rankings based on preference functions. Both approaches to select

investment opportunities have similar data requirements. For each investment

opportunity, both approaches require a return distribution. In addition, preference

functions need to be calibrated to reflect the proper risk attitudes of the individual.

We find that each risk-adjusted performance measure can be associated with a

different level of risk aversion. Furthermore, we find a pattern that is consistent

among several classes of preference functions. The Sharpe ratio, the Fouse index, and

the expected return measure can be associated with low levels of risk and/or loss

aversion. However, these measures display a diminishing correlation between the

preference function and the level of risk (loss) aversion. Therefore, investors

displaying a sufficiently high level of risk and/or loss aversion, should use a ranking

based on either the Sharpe ratio, the Fouse index, or the expected return measure.

The results for Sharpe’s alpha, the Sortino ratio, and the upside potential ratio

imply that for low levels of risk (loss) aversion, these measures do not represent the

preferences of investors. The best results are generated for investors with intermediate

levels of risk aversion. Nevertheless, even for high levels of risk aversion, these

measures dominate the outcomes for the Sharpe ratio, the Fouse index, and the

expected return measure. Finally, this study confirms the results of an earlier study

(Plantinga and De Groot [2001]), which was based on the returns of European mutual

funds from 1993 to 1999.

20

����������

Benninga, Simon Z., 1997, ‘Financial modeling’, MIT Press, Cambridge, MA.

Blume, Marshall and Irwin Friend, 1975, ‘The asset structure of individual

portfolios and some implications for utility functions’, ��!�"��#�$!�!%�, Vol. X,

No. 2, pp. 585 - 603.

Bollen, Nicholas P.B. and Jeffrey A. Busse, 2001, “On the timing ability of

mutual fund managers”, ��!�"��#�$!�!%�, Vol. LVI., No. 3, pp. 1075-1094.

Elton, Edwin J. and Martin J. Gruber, 1995, Modern portfolio theory and

investment analysis, John Wiley & Sons.

Fama, E.F. and M.H. Miller, 1972, The theory of finance, Holt, Rinehart and

Winston, New York, Chapter 5.

Groot, J. Sebastiaan de, 1998, Behavioral aspects of decision models in asset

management, Labyrint Publications, Capelle a/d Ijssel.

Jia, Jianmin and James S. Dyer, 1996, “A standard measure of risk and risk-

value models”, &�!�'���!���%$�!%�, Vol. 42, No. 12, pp. 1691-1705.

Kocherlakota, Narayana R., 1996, “The equity premium: it’s still a puzzle”,

��!�"��#��%�!��$%�($�������, Vol. XXXIV, March, pp. 42-71.

Kothari, S.P. and Jerold B. Warner, 2001, “Evaluating mutual fund

performance”�� ��!�"��#�$!�!%�� Vol. 56, No. 1, pp. 1985-2010.

21

Plantinga, 1999, “Performance evaluation of investment portfolios: the

measurement of forecasting abilities and the impact of liabilities”, Uitgeverij De

Marne B.V., Leens.

Plantinga, Auke and J. Sebastiaan de Groot, 2001, “Utility theory and value

functions”, )!*�&�!�'$!'�+��!�$+���$���$!�#$!�!%$�"��������, Eds. Steven Satchel and

Frank Sortino, pp. 169-193.

Pratt, John W., 1964, “Risk aversion in the small and the large”, �%�!�����$%�,

Vol. 32, pp. 122-136.

Sharpe, William F., 1966, “Mutual fund performance”, ��!�"��#���$!���, No.

1, Vol. 2, pp. 119-138.

Sharpe, William F., 1994, “The Sharpe ratio”, ��!�"��#�����#�"$��&�!�'���!�,

Vol. 21, No. 1, pp. 49-58.

Sortino, Frank A. and Robert van der Meer, 1991, “Downside risk”, ��!�"��#

����#�"$��&�!�'���!�, Vol. 18, summer, pp. 27-31.

Sortino, Frank A., Robert van der Meer, and Auke Plantinga, 1999, “The Dutch

triangle”, ��!�"��#�����#�"$����!�'���!�, Vol. 26, No. 1, pp. 50-59.

Sortino, Frank A., and Lee N. Price, 1994, “Performance measurement in a

downside risk framework”, ��!�"��#�)!����$!', Vol. 3, No. 3.

Tversky, A., and D. Kahneman, 1992, ‘Advances in prospect theory: cumulative

representation of uncertainty’, ��!�"��#��$����!+��!%����$!�,, pp. 297-323.


Recommended