34
Lec. 05 12735: Urban Systems Modeling systems 12735: Urban Systems Modeling instructor: Matteo Pozzi 1 risk assessment of systems Lec. 05 C 1 C 2 C 3 C 1 C 2 C 3 C 3 C 1 C 2

Lec. 0512735: Urban Systems Modeling systems
12735: Urban Systems Modeling
instructor: Matteo Pozzi
1
risk assessment of systems
Lec. 05
C1 C2 C3
C1
C2
C3C3
C1 C2

Lec. 0512735: Urban Systems Modeling systems
outline
2
‐ definition of system;
‐ classification and representation;
‐ two‐state systems;
‐ cut and link sets;
‐ system reliability;
‐ bounds for system probability of failure;
‐ multivariate cumulative distribution.

Lec. 0512735: Urban Systems Modeling systems
what is a system
3
http://bccprepoutdoors.files.wordpress.com/2011/11/9694359‐carbine‐and‐hook‐with‐rope‐in‐stone.jpg?w=400
F
M1
M2M3
components in a single structure
Der Kiureghian, A. (2005) "First and Second‐Order Reliability Methods", in book: The Engineering design reliability handbook, CRC Press LLC.
mechanisms components in a network
12
3
4
5
6 78 9
Google map

Lec. 0512735: Urban Systems Modeling systems
system classification and representation
4
components: single, two, multi‐states.
systems: single, two, multi‐states.
e.g. working/not working e.g. working at 0%, 25%, 50%...
representation:
http://dkv.columbia.edu/demo/medical_errors_reporting/site/module2/fault‐vs‐event‐trees.html
fault trees, event trees
C1
C2 C7
C3
C4
C5
C6
C8
C9
C10
source sink
block diagram
Lec. 0512735: Urban Systems Modeling systems
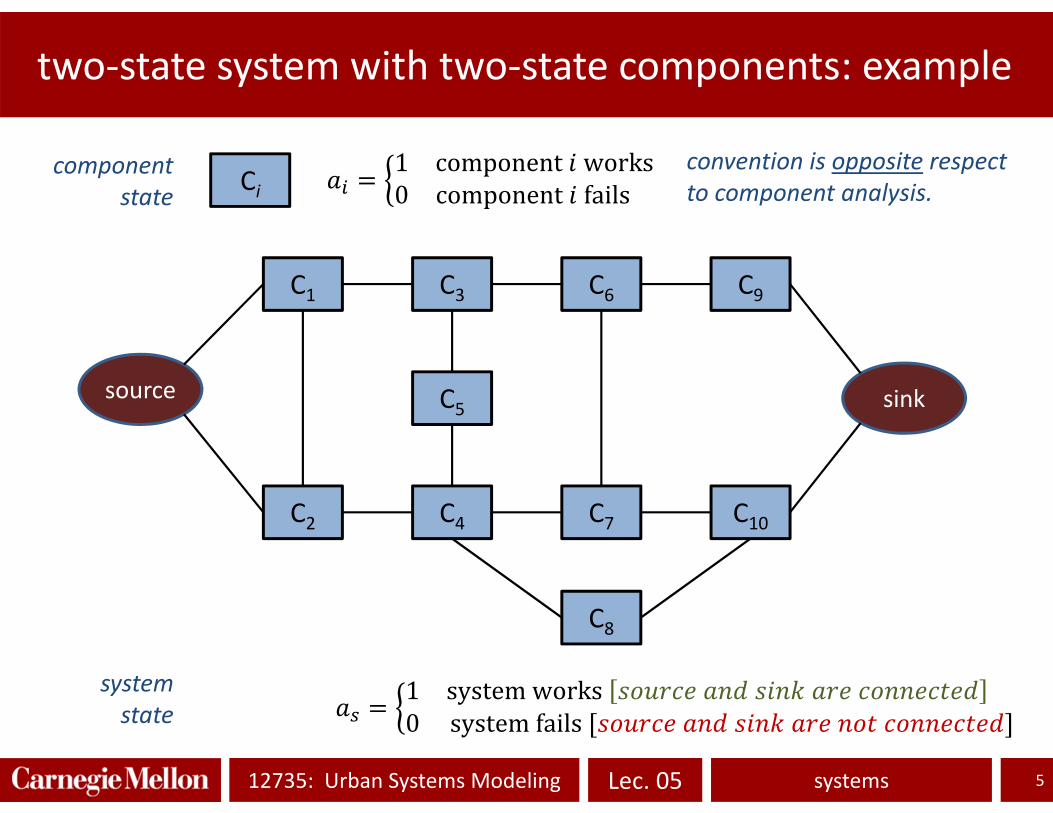
two‐state system with two‐state components: example
5
C1
1 component works0 component fails
C2 C7
C3
C4
C5
C6
C8
C9
C10
source sink
Ci
1 systemworks 0 systemfails
component state
system state
convention is opposite respect to component analysis.

Lec. 0512735: Urban Systems Modeling systems
two‐state system with two‐state components
6
vector of component
state⋮
system‐components
relation
∶ →Boolean variable
number of components
∶ 2 → 2
a1 1 1 1 1 0 0 0 0a2 1 1 0 0 1 1 0 0a3 1 0 1 0 1 0 1 0
series as 1 0 0 0 0 0 0 0parallel as 1 1 1 1 1 1 1 0
coherent as 1 1 1 0 1 0 1 0non coherent as 0 0 0 1 0 0 0 1
states of components
for components, there are 2 possible relations.
C1 C2 C3
C1
C2
C3
C3
C1 C2
2 2 256 systems
coherent system: ∀ ∶ is non‐decreasing in . That is, if goes safe, it cannot degrade system operation.

Lec. 0512735: Urban Systems Modeling systems
famous systems
7
C1 C2 … Cn
min , , … , or
series system:
max , , … ,
1 1
or
parallel system: C1
C2
…
Cn“k‐out‐of‐n” system:
indicator: true 1false 0
1 : parallel system: series system

Lec. 0512735: Urban Systems Modeling systems
general system: cut and link sets
8
cut set: a set of components whose joint failure implies failure of the system. E.g. C1,2,3,4 .
minimum cut set: a cut set with no extra component : C1,4 and C2,3,4 .
link set: a set of components whose joint survival implies survival of the system. E.g. C1,4 .
minimum link set: a link set with no extra component : C1,2 , C1,3 and C4 .
example:
C1
C4
C2
C3
C2,3, C2,4 and C3,4are NOT cut sets
C1 and C2 are NOT link sets
Algorithms are available for identifying cut sets and link sets.

Lec. 0512735: Urban Systems Modeling systems
min cut set representation
9
example:
C1
C4
C2
C3
a system can be seen a series of its cut sets.
C1
C4C3
C4
C2
1 1∈
function relation for cut set
1 1 11 1 1 1
1 1 1 1 1 1 1
2 cut sets

Lec. 0512735: Urban Systems Modeling systems
min link set representation
10
example:
C1
C4
C2
C3
a system can be seen a parallel system of its link sets.
C3
C4
C2C1
C1
1 1
∈
function relation for link set
1 1 1 1
3 link sets

Lec. 0512735: Urban Systems Modeling systems
component and system reliability
11
probability of failure: P 0reliability: 1 P 1
1
probability of failure: P 0reliability: 1 P 1
1
component:
system:
1P 1 0P 0 P 1

Lec. 0512735: Urban Systems Modeling systems
reliability of series systems of indep. comp.
12
1
1 1 1 ≅
1
≅
independent failures
1 1
C1 C2 … Cn
0 5 10 15 200
0.2
0.4
0.6
0.8
1
n
Ps
P=20%P=10%P=5%P=2%P=1%
≜equally reliable components:
≜ 1

Lec. 0512735: Urban Systems Modeling systems
1 2 3 4 5 6 7 8 9 10
10-8
10-6
10-4
10-2
100
n
Ps
P=20%P=10%P=5%P=2%P=1%
reliability of parallel systems of indep. comp.
13
1 1
≜independent failures
equally reliable components:≜ 1
C1
C2
…
Cn

Lec. 0512735: Urban Systems Modeling systems
general system: example of network of indep. comp.
14
source
sink
1
2
3
4
1
3
2
4
A B
11
, 1 1 1
reliability probability of failure C4
C3C1
C2
link set A
link set B
1 , 2 for equally reliable components
independence

Lec. 0512735: Urban Systems Modeling systems
general system: example of network of indep. comp.
15
source
sink
1
2
3
4
1
3
2
4
A B
, ⋁ 1 1 1 …
independent failures
reliability probability of failure
5
15
2
4
C D
45
31 1 11
∗ 2 2 5 2 for equally reliable components
,
⋁ : fail. prob. of C or D.

Lec. 0512735: Urban Systems Modeling systems
general system: example of network of indep. comp.
16
∗ 2 2 5 2source
sink
1
2
3
45
2
source
sink
1
2
3
4
increment of reliability after adding segment 5:
Δ 2 4 2 2 1
example:1%, 99%, 99.96%, ∗ 99.98%, Δ 0.02%
from: Kottegoda and Rosso (2008)"Applied statistics for civil and environmental engineers", Blackwell Pub.

Lec. 0512735: Urban Systems Modeling systems
two‐component series system
17
≜ 30%
equally reliable components:
≜ 1 70%C1 C2
| | ⟹ | 1 |37 1 |
independent failures∶ | ⇒ |
| 0 ⇒ |37 43%
| 1 ⇒ | 0 ;
opposite failures negative correlation
identical failures positive correlation

Lec. 0512735: Urban Systems Modeling systems
limit cases for a two‐component series system
18
independent failures
C1 C2
∶ | ⇒ | ∶
30% 70%37 60%
| 1 ⇒ | 0 ; ∶
opposite failures negative correlation
identical failures positive correlation
For series system, positive correlation decrease the probability of failure.
≜ 30%
equally reliable components:
≜ 1 70%
| 1 |37 1 | |
system failure
1 51%
30%
| 0 ⇒ |37 43% ∶
2

Lec. 0512735: Urban Systems Modeling systems
limit cases for a two‐component parallel system
19
C1
C2
≜ 30%
equally reliable components:
≜ 1 70%
independent failures
0%
opposite failures negative correlation
identical failures positive correlation
For parallel system, positive correlation increase the probability of failure.
| 1 |37 1 | |
system failure
9%
| 1 ⇒ | 0 ; ∶
| 0 ⇒ |37 43% ∶
∶ | ⇒ | ∶
30%

Lec. 0512735: Urban Systems Modeling systems
bounds for series systems
20
→→ ∨ ,
, 0,
,
, 0, min ,
max , min , 1
∀ ∈ 1,2, … , ∶ → max min , 1
two failure events (mechanisms):
many failure events (mechanisms):
when the joint probability for each pair of events, , is known, you can use Ditlevsen’sbounds (see Sørensen, J.D. (2004) "Notes in Structural Reliability Theory And Risk Analysis").
three failure events (mechanisms):
∨ ∨ , , , , ,
Ditlevsen’s bounds require second order probability ( ) and define max and min values for higher order probability (e.g. third order: ).

Lec. 0512735: Urban Systems Modeling systems
bounds for parallel systems
21
→→ ,
, 0,
,
, 0, min ,
0 min ,
two failure events (mechanisms):
∀ ∈ 1,2, … , ∶ → 0 minmany failure events (mechanisms):
second order bounds are also available (see Sørensen, J.D. (2004) "Notes in Structural Reliability Theory And Risk Analysis").

Lec. 0512735: Urban Systems Modeling systems
system reliability problem
22
0
0
0
00
00 limit state functions
, … ,
standard normal space
0 ↔ componentfailsmechanismactive
the system‐components relation defines the failure of the system, depending on the failures of the components.

Lec. 0512735: Urban Systems Modeling systems
system reliability problem: series system
23
0
000
failure domain:Ω 0 ∪ 0 ∪ 0
Ω
standard normal space
000
in a series system, the system fails if at least one component fails.
Lec. 0512735: Urban Systems Modeling systems
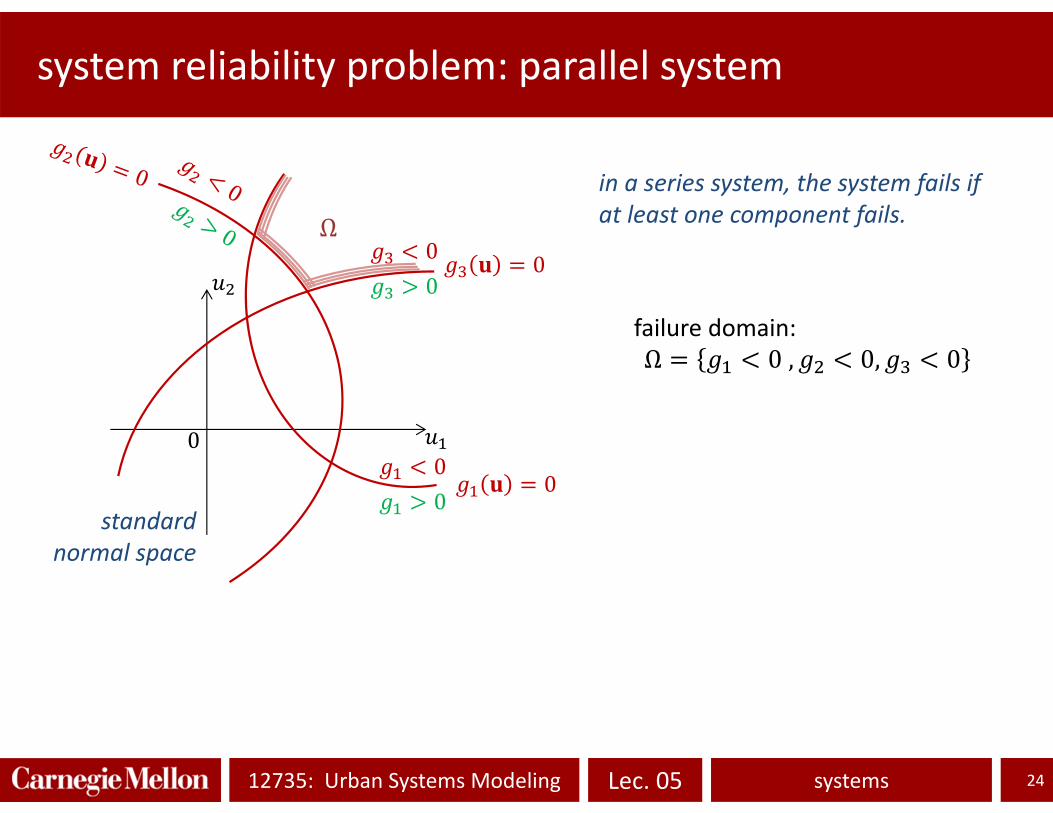
system reliability problem: parallel system
24
0
000
failure domain:Ω 0 , 0, 0
Ω
standard normal space
00
in a series system, the system fails if at least one component fails.
0

Lec. 0512735: Urban Systems Modeling systems
system reliability problem: general system
25
0
000
e.g. failure domain:Ω 0, 0 ∪ 0
Ω
standard normal space
000 C1
C3C2

Lec. 0512735: Urban Systems Modeling systems
approaches for system reliability problem
26
Monte Carlo Uniform Sampling:it can be easily implemented, it provides an unbiased estimate.
Monte Carlo Important Sampling:it is not easy to find an appropriate proposal distribution.
FORM:the design point (defined as the failure closest to the origin) may be not differentiable ⟶ no linear approximation. Newton’s method may not work. In any case, linear approximation may be not accurate.
0
000
Ω
standard normal space
000

Lec. 0512735: Urban Systems Modeling systems
FORM for series systems
27
0
standard normal space
000
P 0∗ , ∗ : design pointsfor and
∗
∗
series system
≅ 1
limit state functions approximated around the corresponding design point:
≜
≜ ⋯ ⋯≜ ⋯ ⋯
new coordinates:

Lec. 0512735: Urban Systems Modeling systems
FORM for series systems
28
0
standard normal space
000
∗ , ∗ : design pointsfor and
∗
∗
≅
≜ ⋯ ⋯
≜ ⋯ ⋯
; , → ; ,
≜∈ 1,1
1 →
; ,
limit values for each coordinate:
limit state function:
matrix of “directions”:
1 Pprobability of failure:
Lec. 0512735: Urban Systems Modeling systems
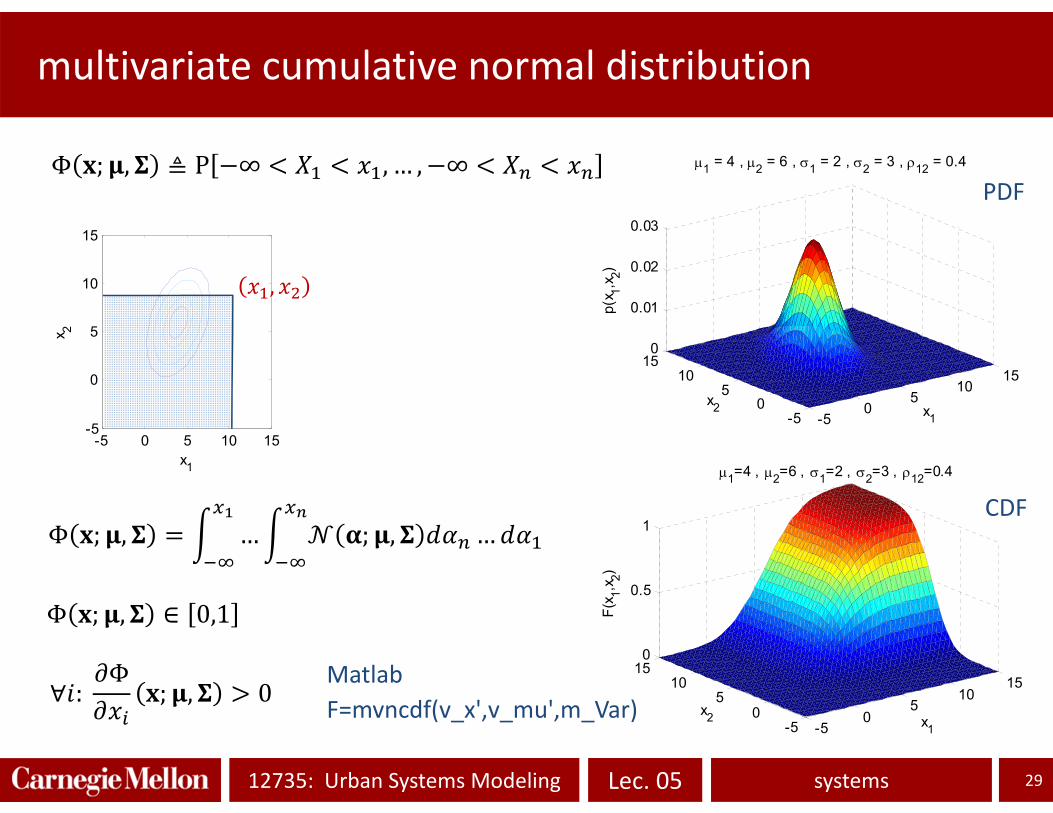
multivariate cumulative normal distribution
29
-50
510
15
-50
510
150
0.5
1
x1
1=4 , 2=6 , 1=2 , 2=3 , 12=0.4
x2
F(x 1,x
2)
-50
510
15
-50
510
150
0.01
0.02
0.03
x1
1 = 4 , 2 = 6 , 1 = 2 , 2 = 3 , 12 = 0.4
x2
p(x 1,x
2)
Φ ; , ≜ P ∞ ,… , ∞
Φ ; , … ; , …
Φ ; , ∈ 0,1
∀ :Φ
; , 0
CDF
x1
x 2
-5 0 5 10 15-5
0
5
10
15
,
F=mvncdf(v_x',v_mu',m_Var)Matlab

Lec. 0512735: Urban Systems Modeling systems
s1
s 2
-2 0 2-3
-2
-1
0
1
2
3
mult. cum. norm. for series systems
30
Φ ; , P ∞ ,… , ∞
,
P safe Φ ; ,
P failure 1 Φ ; ,
recipe:‐ solve “component” FORM for each limit state function
∗ → , ;‐ compute matrix and build ;‐ compute .
; ,
; ,1 Φ ; ,
Formulation in normal space, with linear limit state functions:
Φ ; ,

Lec. 0512735: Urban Systems Modeling systems
FORM for parallel systems
31
0
standard normal space
000
∗
∗
linearization around this point
Design points may be too far from failure domain. To improve the quality of the approximation:

Lec. 0512735: Urban Systems Modeling systems
FORM for parallel systems
32
s1
s 2
-2 0 2-3
-2
-1
0
1
2
3
,
s1
s 2
-2 0 2-3
-2
-1
0
1
2
3
,
failure domain
equal probability Φ ; ,
; ,
; , Φ ; ,
Formulation in normal space, with linear limit state functions:

Lec. 0512735: Urban Systems Modeling systems
example
33
5 10 15 205
10
15
20
x1
x 2
1 = 10 , 2 = 15 , 1 = 2 , 2 = 1.5 , 12 = 0.3 ; ,1015
4 0.90.9 2.25
1 1
0.1 0.9
3
13
; ,
Φ ; , 1.4%
20.5
4.45 1.521.52 1.70
MC : ∈ 0.67%, 1.40%

Lec. 0512735: Urban Systems Modeling systems
references
34
Ditlevsen, O. and H.O. Madsen. (1996). Structural reliability methods. J. Wiley & Sons, New York, NY. Downloadable from http://www.web.mek.dtu.dk/staff/Od/books/OD‐HOM‐StrucRelMeth‐Ed2.3.7‐June‐September.pdf. Chapter 14.
Faber, M. (2009) “Risk and Safety in Engineering, lecture notes”, Lecture 8, available at http://www.ibk.ethz.ch/emeritus/fa/education/ws_safety/Non_printable_script.pdf
Sørensen, J.D. (2004) "Notes in Structural Reliability Theory And Risk Analysis", notes 6 and 7, avail. at http://www.waterbouw.tudelft.nl/fileadmin/Faculteit/CiTG/Over_de_faculteit/Afdelingen/Afdeling_Waterbouwkunde/sectie_waterbouwkunde/people/personal/gelder/publications/citations/doc/citatie215.pdf


