1 Risk-Based Analytical Method Validation and Maintenance Strategies Stephan O. Krause, Ph.D. Principal Scientist, Regulatory Science, Development MedImmune PDA/PCMO Task Force Leader for Analytical Methods and IMP Specifications
Transcript
1
Risk-Based Analytical Method Validation and Maintenance Strategies
Stephan O. Krause, Ph.D.
Principal Scientist, Regulatory Science, Development
MedImmune
PDA/PCMO Task Force Leader for Analytical Methods and IMP Specifications
2
The Late-Stage Analytical Method Lifecycle: Risk-based Validation and Maintenance Strategies
Agenda:
Part 1 AMV - Readiness Assessment Process Risk-Based AMV Study Designs and Acceptance Criteria
Parts 2-3 Analytical Method Replacement (AMR) Analytical Method Maintenance (AMM)
Part 3 The Analytical Method Transfer (AMT) Process
Krause/PDA, 2012
3
The Analytical Method Life Cycle
Krause/PDA, 2012
An
aly
tica
l Me
tho
d D
ev
elo
pm
en
t
A
na
lytic
al M
eth
od
V
alid
atio
n
(Po
st-V
alid
atio
n) L
ife
Cy
cle
Ste
ps
Select and Design – Establish Intended Use of Analytical Procedure
Development and Optimization
Performance Review, Qualification
Validation Acceptance Criteria
Validation
Post-Validation Life Cycle Steps
Transfer of Methods
Validation Prerequisites Assessment
IdentityImpurity
LimitImpurity Quantity
Assay / Potency
Tech Transfer
Resource Assessment
Standards and Controls
StabilityVerify Product Specifications
Maintenance TransferComparability
StudyOOS/Valiation
Failures
4
SpecificityPrecisionAccuracy
QL/DLLinearityRange
Robustness Data
Regulatory Requirements
Validation Risk Assessment that method meets intended use
StandardsControls
Stability of Reagents, Samples
Existing Knowledge
(Product and Process)
AMV Protocol
No
Is Method ready for
Validation?
Collect more data
and/or optimize method
AMV Acceptance Criteria
Specification to meet
Documented Summary of
Method Performance
Characteristics (Handover Package,
Development Report)
Yes
Documented Intended Use
Example of Assessment Process of AMV Readiness
Krause/PDA, 2012
5
General AMV Risk Assessment Strategy
The purpose of risk assessment(s) for AMV studies is to provide measurable results for:
1) The desired amount of formal validation studies to be executed.
2) The level of method performance needed as manifested in the AMV protocol acceptance criteria.
Krause/PDA, 2012
6
Points to Consider in Overall Risk Assessment for Analytical Methods
Points to Consider Examples Expected Potential Risk/Impact
Method type and intended use (Identity, Safety, Purity, Quality, Potency, and Stability)
a. Safety test: Sterility test using new rapid microbial method.b. Quality test: Excipient concentration at final production stage.a. Purity/Stability test: Degradation products during storage.
a. Potential risk to patients and firm is high if sterility test provides false negative results.b. Potential risk to patients is relatively low if the quality test provides inaccurate results as excipient is quantitatively added during production.c. Potential risk to patients is high if stability test is incapable to measure all degradation products.
Surrogate and/or complementary method is routinely used
Purity/Safety test: A HPSEC method is used for quantitation of protein aggregate levels. A second electrophoresis method provides similar results for aggregate levels.
If second method routinely supports the results of the primary method, the risk to patients may be lower if the primary method provides inaccurate results.
Production Process Stage
Purity Test: Fermentation impurities are measured before purification and after purification.
Early-stage inaccurate impurity results from less reliable test method are lower risk to patients if late-stage testing provides more accurate results.
Analytical Platform Technology (APT)
Purity test: APT HPSEC method is used to test in-process samples.
Current QC experience with this method performance should lower the risk to patient and/or firm if the effect of different sample types is insignificant.
7
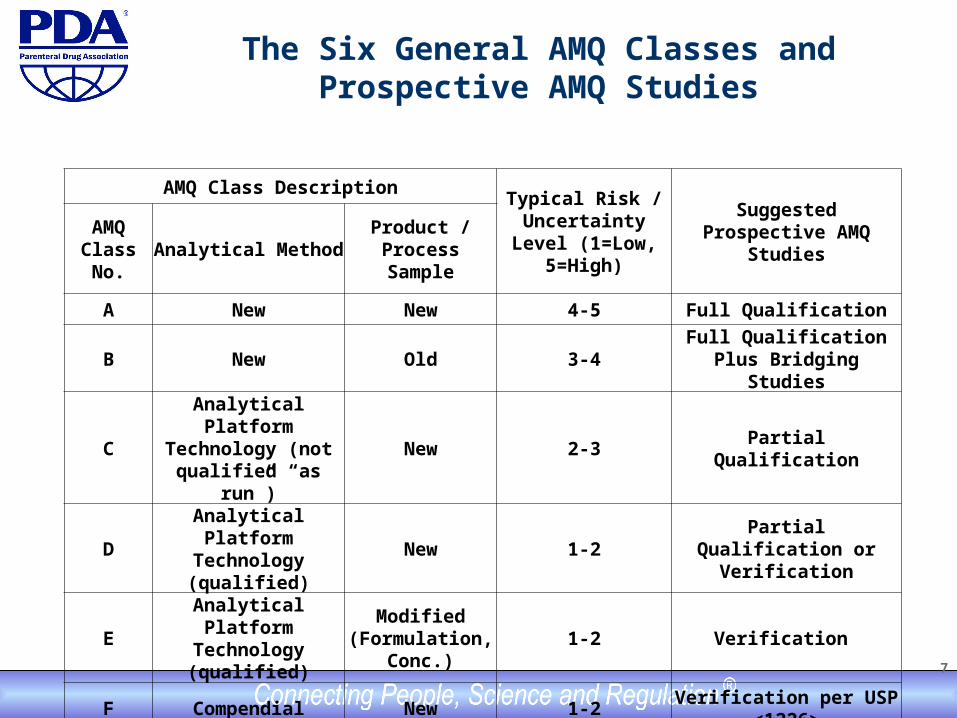
The Six General AMQ Classes and Prospective AMQ Studies
AMQ Class DescriptionTypical Risk /
Uncertainty Level (1=Low, 5=High)
Suggested Prospective AMQ StudiesAMQ
Class No.Analytical Method
Product / Process Sample
A New New 4-5 Full Qualification
B New Old 3-4Full Qualification Plus
Bridging Studies
CAnalytical Platform
Technology (not qualified “as run”)
New 2-3 Partial Qualification
DAnalytical Platform
Technology (qualified)
New 1-2Partial Qualification or
Verification
EAnalytical Platform
Technology (qualified)
Modified(Formulation,
Conc.)1-2 Verification
F Compendial New 1-2Verification per USP
<1226>
8
The Five General AMV Classes and Prospective AMV Studies
AMV Class Description Typical Risk /
Uncertainty Level (1=Low, 5=High)
Suggested Prospective AMV Studies
AMV Class No.
Analytical MethodProduct /
Process Sample
A New New 4-5 Full Validation
B New Old (Validated) 3-4(1) Full Validation Plus AMR(2) Studies
CAnalytical Platform
Technology (not validated “as run”)
New 2-3 Partial Validation
D Old (Validated) New 1-2Partial Validation or
Verification
E Compendial New 1-2Verification per USP
<1226>
(1) If a new analytical method (forced method replacement) is needed due to supply reasons, the risk level can be generally considered higherbecause no other option may exist. Unforced test method replacements can be considered to be a lower risk level as more time may be availableto optimize the method performance.
(2) AMR = Analytical Method Replacement. A study to confirm that a new analytical method can perform equally or better than the existing one.
From Krause, PDA/DHI 2007.
99
FACenter for Biologics Evaluation & ResearchCenter for Biologics Evaluation & ResearchFDAFDA
SafetyMethodsValidated
Qualified Methods
SafetyMethodsValidated
Qualified Methods
ValidatedMethods
ValidatedMethods
Re-Validation(as needed)
Replacement(Supplement)
Re-Validation(as needed)
Replacement(Supplement)
SelectionDesign
Development Optimization
SelectionDesign
Development Optimization
Life Cycle of Analytical MethodsLife Cycle of Analytical MethodsLife Cycle of Analytical MethodsLife Cycle of Analytical Methods
Phase 1Phase 1 Phase 2Phase 2Discovery/Pre-clinicalDiscovery/Pre-clinical Phase 3Phase 3 BLA BLA Post-LicensurePost-Licensure
PerformanceCharacteristics
Robustness
PerformanceCharacteristics
Robustness
10
CQA Development, CMC Changes, Specifications
11
FTIH POC BLA
Tox StudiesPhase 1
Phase 2Phase 3
Clinical ResupplyMfg/Formulation Change(s)
Specifications Revision(s)
Target Quality CriteriaCommercial
Specifications
Negotiations, Final Commercial Specifications
QTPP
Final CQAs & Control Strategy Approval
Potential CQAsProduct & Process Design
Life-CycleManagement
POST-APPROVALCHANGES
PHASE 3PHASE 1/2Pre-IND
CQ
A D
evel
op
men
t(Q
bD
Pro
cess
)S
pec
s L
ife
Cyc
le
Mg
mt
CM
C a
nd
Tec
h
Tra
nsf
er P
roce
ss Analytical
Manufacturing
Strategic or Tactical Changes
Method qualification
Dose change
Delivery Device
PQ lots
Setting of Initial Specifications
Specifications Review/Confirmation
Mfg Transfer
Method validation
Method transfer
Formulation Change
Process Verification
Method Maintenance
Global Supply
Method transfer
12
Analytical Method Lifecycle – Intended Use
Analytical Method Selection
Pharmaceutical Development Supporting Studies:Process characterizationProduct characterizationProcess validation
Because of anticipated supply problems for critical SDS-PAGE materials, it was decided to develop and validate a capillary zone electrophoresis (CZE) method that will replace the current (licensed) electrophoretic method. The method performance characteristics for a quantitative limit test, accuracy and intermediate precision, are compared. For accuracy: A delta of plus/minus 1.0% was chosen for the equivalence category between both impurity levels. The 1.0% difference limit was set because a future result difference of 1.0% is still acceptable within the existing release and stability specifications (acceptable patient and mfger’s risks). Both methods were run simultaneously (side-by-side) for each of a total of n=30 reported results were compared by two-sided matched-paired t-test statistics with pre-specified equivalence limits of plus/minus 1.0% (% = reported percent and not relative percent).
Krause/PDA, 2012
20
Demonstrating Equivalence Results
Equivalence Test Results Comparing Current Method to CZE: Sample Size (n): 30 Hypothesized Difference in Mean: 0% Minus Delta: -1.0% Plus Delta: +1.0% SDS-PAGE Mean (n=30): 3.8% CZE Mean (n=30): 5.1% 90% confidence interval of CZE results (vs. SDS-PAGE): 4.88-5.32%
Krause/PDA, 2012
21
Equivalence of New Method Not Demonstrated(New method’s result are different)
Krause/PDA, 2012
Equ
ival
ence
Lim
it
- Delta 0 + Delta
New Method “Lower Results”
New Method “Higher Results”
Equ
ival
ence
Lim
it
No difference
- 9
0% C
I
+ 9
0% C
I
- 9
0% C
I
+ 9
0% C
I
- 9
0% C
I
+ 9
0% C
I
- 9
0% C
I
+ 9
0% C
I
- 9
0% C
I
+ 9
0% C
I Passes Equivalence (stat. different)
Passes Equivalence (stat. not different)
Passes Equivalence (stat. different)
Equivalence Unclear(stat. different)
Fails Equivalence (stat. different)
22
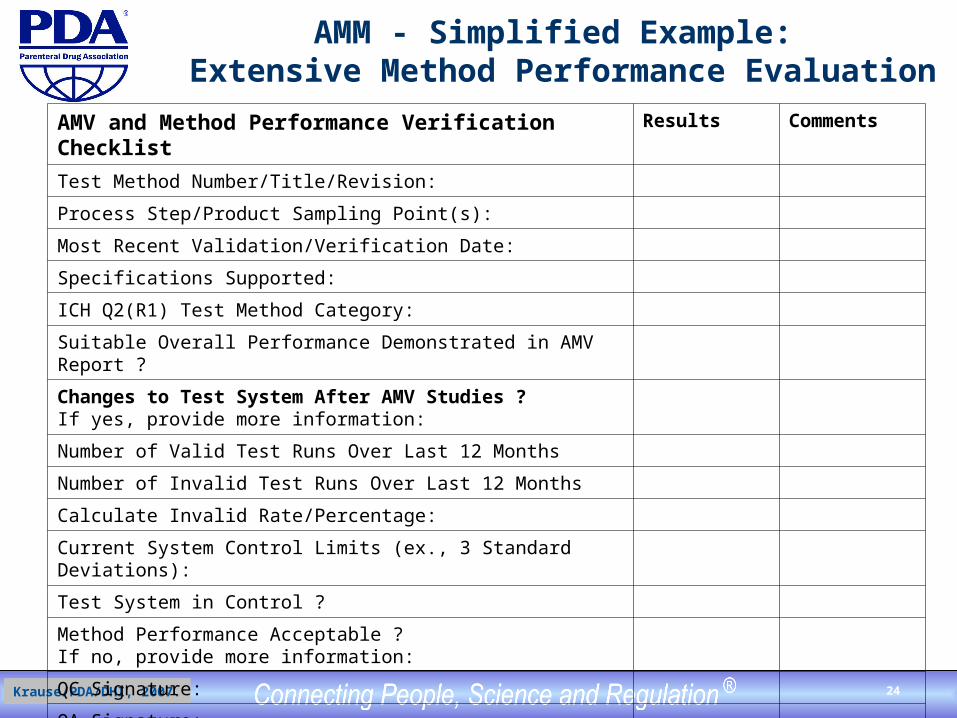
Analytical Method Maintenance (AMM)
VMP for Analytical Methods
AMC AMM
AMVProcess Map Steps
Method Modifications Method Review
Critical Method Elements
Standards and Controls Critical Reagents
Software/Computer Analytical Instrumentation
Statistical Data Reduction New/Additional Operator
Emergency Reviews(OOS, many invalids)
Periodic Reviews(Short and Long Term)
Quarterly or Annual Reviews Extensive Reviews
Prospective Retrospective
Krause, 2005.
23
AMM - Continuous Review Example: Combining Laboratory and Manufacturing Control Charts