Risk Matters: A Comment - Technical Appendix By Benjamin Born and Johannes Pfeifer * I. Technical Appendix - For Online Publication Appendix I documents the coding issues in the Matlab implementation of the model sim- ulation in more detail by showing the associated computer code of the Jes´ usFern´andez- Villaverde, Pablo A. Guerr´ on-Quintana, Juan F. Rubio-Ram´ ırez and Mart´ ın Uribe (2011) (FGRU) replication files posted at http://www.aeaweb.org/articles.php?doi=10.1257/ aer.101.6.2530. Fern´andez-Villaverde et al. (2011) (FGRU) calibrate their model at monthly frequency, perform a variable substitution to obtain a log-linearization, and use third-order perturbation techniques to simulate the model. We make use of the third order perturba- tion capacities of Dynare (St´ ephane Adjemian, Houtan Bastani, Fr´ ederic Karam´ e, Michel Juillard, Junior Maih, Ferhat Mihoubi, George Perendia, Johannes Pfeifer, Marco Ratto and S´ ebastien Villemot, 2011) to simulate the model. 1 Appendix III presents the corrected version of Figure 6 in FGRU. Appendices IV and V document the simulation and prun- ing schemes used for impulse response function (IRF) generation and moment computation. Appendix VI compares the numerical convergence behavior of the standard deviation of the Isabel Correia, Joao C. Neves and Sergio Rebelo (1995)-approximation and of the net export to output ratio. Appendix VII compares the deterministic steady state, the ergodic mean in the absence of shocks (EMAS), 2 and the ergodic mean. * Born: University of Mannheim and CESifo, E-mail: [email protected], Pfeifer: University of Mannheim, E-mail: [email protected]. 1 The resulting policy functions are identical up to the 8th digit to the ones derived from Mathematica by FGRU. 2 We use the term EMAS for FGRU’s concept of “[s]tarting from the ergodic mean and in the absence of shocks” (p. 10 in their technical appendix). The EMAS is the fixed point of the third order approximated policy functions in the absence of shocks. It can be obtained by simulating the system with all shocks set to 0 for all time periods, starting at the deterministic steady state, and iterating it forward until convergence. Sometimes, it is referred to as the “stochastic steady state” (e.g. Michel Juillard and Ondra Kamenik, 2005), because it is the point of the state space where, in absence of shocks in that period, agents would choose to remain although they are taking future volatility into account. 1
Transcript
Risk Matters: A Comment - Technical Appendix
By Benjamin Born and Johannes Pfeifer∗
I. Technical Appendix - For Online Publication
Appendix I documents the coding issues in the Matlab implementation of the model sim-
ulation in more detail by showing the associated computer code of the Jesus Fernandez-
Villaverde, Pablo A. Guerron-Quintana, Juan F. Rubio-Ramırez and Martın Uribe (2011)
(FGRU) replication files posted at http://www.aeaweb.org/articles.php?doi=10.1257/
aer.101.6.2530. Fernandez-Villaverde et al. (2011) (FGRU) calibrate their model at monthly
frequency, perform a variable substitution to obtain a log-linearization, and use third-order
perturbation techniques to simulate the model. We make use of the third order perturba-
tion capacities of Dynare (Stephane Adjemian, Houtan Bastani, Frederic Karame, Michel
Juillard, Junior Maih, Ferhat Mihoubi, George Perendia, Johannes Pfeifer, Marco Ratto
and Sebastien Villemot, 2011) to simulate the model.1 Appendix III presents the corrected
version of Figure 6 in FGRU. Appendices IV and V document the simulation and prun-
ing schemes used for impulse response function (IRF) generation and moment computation.
Appendix VI compares the numerical convergence behavior of the standard deviation of the
Isabel Correia, Joao C. Neves and Sergio Rebelo (1995)-approximation and of the net export
to output ratio. Appendix VII compares the deterministic steady state, the ergodic mean in
the absence of shocks (EMAS),2 and the ergodic mean.
1The resulting policy functions are identical up to the 8th digit to the ones derived from Mathematicaby FGRU.
2We use the term EMAS for FGRU’s concept of “[s]tarting from the ergodic mean and in the absence ofshocks” (p. 10 in their technical appendix). The EMAS is the fixed point of the third order approximatedpolicy functions in the absence of shocks. It can be obtained by simulating the system with all shocks set to0 for all time periods, starting at the deterministic steady state, and iterating it forward until convergence.Sometimes, it is referred to as the “stochastic steady state” (e.g. Michel Juillard and Ondra Kamenik, 2005),because it is the point of the state space where, in absence of shocks in that period, agents would choose toremain although they are taking future volatility into account.
Note: first and fifth column: moments reported in FGRU. Second and sixth column: moments obtainedusing the FGRU simulation, but correcting the time aggregation (TA). Third and seventh column: momentsobtained using the FGRU simulation, but correcting the time aggregation and net export computation(TA+NX). Fourth and eighth column: moments obtained from HP-filtered data. Simulations are conductedwith 200 repetitions of 96 periods using the FGRU pruning scheme. For Argentina, the same set of pseudo-random numbers as in FGRU was used, while the simulation for the other countries had to rely on a differentpseudo-random number generator seed.
4This behavior can also be seen in FGRU’s official replication code. Changing the pseudo-random numberseed from the 2 they used to 20, leaving aggregation, net export computation, simulation length, and thenumber of replications unchanged, leads to a tripling of σNX/σY from 0.48 to 1.46.
RISK MATTERS: A COMMENT 9
III. Figure FGRU6: IRFs Debt/Output, Current Account, Net Exports
Figure 6 in FGRU, reproduced here as Figure 1 due to non-availability of replication codes,
depicts the responses of the debt to output ratio, the current account, and net exports to a
risk shock. 2553FERnándEz-ViLLAVERdE ET AL.: Risk MATTERsVOL. 101 nO. 6
The last row in Figure 5 plots the IRFs in the M2 version of the model. In this row, we plot the IRFs after a one-standard-deviation level shock that is accompanied by a κ− standard deviation shock to volatility. The pattern of the IRFs is qualitatively the same as in the first row. The lesson from this third row is that our results are robust to the correlation between innovations.
We conclude by pointing out two features of our model. First, our results come in a model without working capital, a mechanism often added to improve the perfor-mance of international macro models. As shown in the online Appendix, working capital makes our findings even stronger. Second, we do not have any of the real-option effects of risk emphasized by the literature, for example, when we have irre-versibilities (Bloom 2009). Introducing those effects explicitly is difficult with our perturbation approach because of the nondifferentiability of threshold decision rules created by real-option environments. However, real-option effects would increase the impact of shocks to volatility on investment. Therefore, our results are likely to be a lower bound to the implications of time-varying risk. Bloom, Jaimovich, and Floetotto (2008) explore the real-option effects of volatility shocks in a model calibrated for the US economy, but a more thorough investigation of the interaction between our higher-order terms and real-option effects remains an open question.
Ecuador.—Next, we turn to Ecuador, whose IRFs are plotted in Figure 7. The IRFs are similar to those in the Argentinian case. There is a decline in economic activity with responses qualitatively similar to, although somewhat smaller than, those for Argentina. After a shock to volatility, consumption drops 0.44 percent upon impact, investment 0.66 percent, and debt 0.08 percent. Investment falls for five quarters
Figure 6. IRFs Debt/Output, Current Account, Net Exports
2 4 6 8 10 12 14 16
0.265
0.27
0.275
0.28
0.285
0.29
Debt/output
Current account Net exports
1.5
1
0.5
0
2
1.5
1
0.5
0
2 4 6 8 10 12 14 16 2 4 6 8 10 12 14 16
Figure 1. IRFs Debt/Output, Current Account, Net Exports
Note: Reproduced Figure 6 from Fernandez-Villaverde et al. (2011), p. 2553.
FGRU report the debt to output ratio IRF in that figure not in percentage deviations
from the EMAS, but as the absolute value. Figure 2 displays that the debt to output ratio
dropped from about 0.293 by about 2.9 percentage points to 0.263 after 11 periods. But
this is inconsistent with the FGRU-IRFs in Figure 3, which show that debt dropped by
3.873 percent while output dropped by 0.1907 percent. Thus, the new debt-to-output-ratio
should be up to first order (1 − 0.03873)D/((1 − 0.001907)Y ) ≈ 0.963D/Y , i.e. it should
drop by about 3.7 percent (not percentage points). The net export IRF is affected by from
the incorrect weighting used in their computation as shown in section ??. Regarding the
current account, FGRU state that it is in “percentage points of [its] ergodic mean”. But this
is not possible for it is defined as CAt = Dt −Dt−1 and thus has ergodic mean zero. Thus,
it is unclear what the lower left panel of Figure 2 depicts.
The left column of Figure 2 shows the corrected version of Figure 6 in FGRU that uses
output to normalize net exports and the current account, giving them the interpretation of
10
5 10 15 20 25 30
28.8
29
29.2
29.4
29.6
D/Y
5 10 15 20 25 30−0.05
0
0.05
0.1
0.15
CA/Y
5 10 15 20 25 30−0.1
0
0.1
NX/Y
5 10 15 20 25 30
34
36
38
40D/Y
5 10 15 20 25 30
0
0.5
1
CA/Y
5 10 15 20 25 30
−0.5
0
0.5
NX/Y
Figure 2. Debt/Output, Current Account, and Net Exports Dynamics.
Note: Left column: IRFs from the corrected FGRU model; Right column: IRFs from the recalibratedcorrected model. Row 1: Debt-to-quarterly-GDP ratio in percent of quarterly GDP. Row 2: Current accountto GDP ratio in absolute deviation from the EMAS. Row 3: Net exports to GDP ratio in absolute deviationfrom the EMAS.
being in output units. As can be seen, in the corrected model with the original calibration
the current account implications of risk shocks are rather muted.
The right column of Figure 2 displays the IRFs from the recalibrated corrected model
quantifying the central “debt reduction mechanism”. After a one standard deviation risk
shock, the debt to quarterly output ratio falls by about 6.5 percentage points after three
years, while current account and net exports increase by about 1 percent of output on impact
in order to finance the deleveraging.
RISK MATTERS: A COMMENT 11
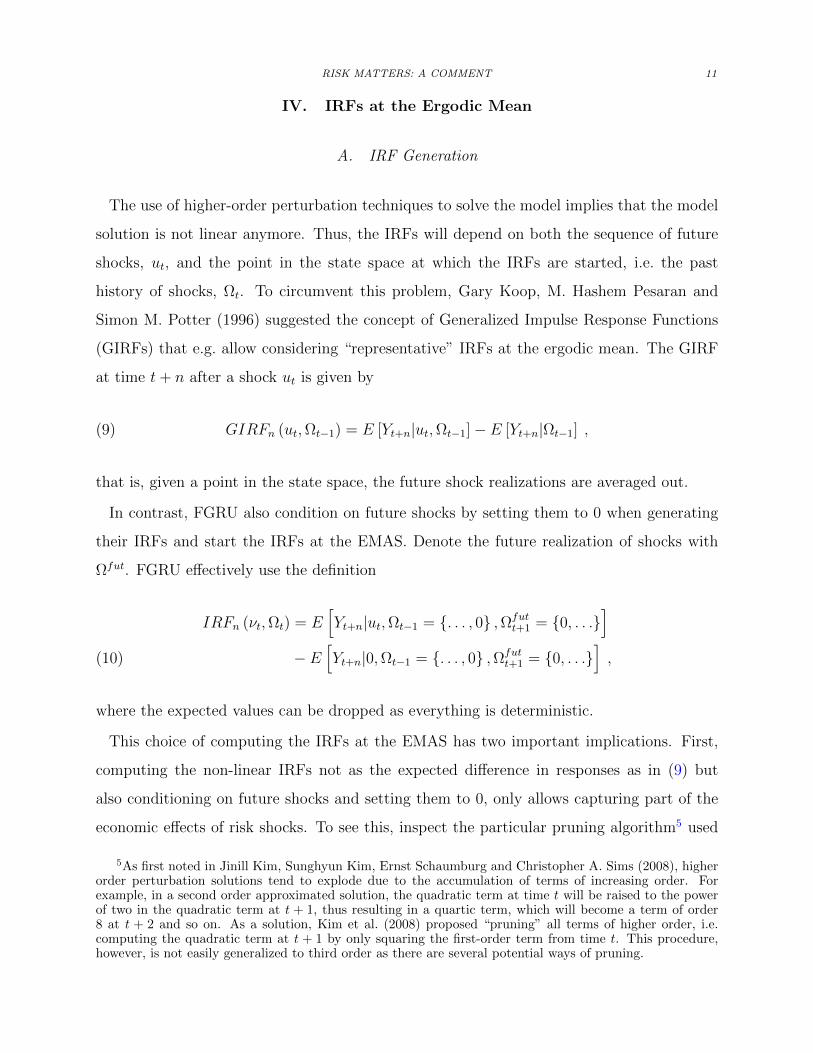
IV. IRFs at the Ergodic Mean
A. IRF Generation
The use of higher-order perturbation techniques to solve the model implies that the model
solution is not linear anymore. Thus, the IRFs will depend on both the sequence of future
shocks, ut, and the point in the state space at which the IRFs are started, i.e. the past
history of shocks, Ωt. To circumvent this problem, Gary Koop, M. Hashem Pesaran and
Simon M. Potter (1996) suggested the concept of Generalized Impulse Response Functions
(GIRFs) that e.g. allow considering “representative” IRFs at the ergodic mean. The GIRF
at time t+ n after a shock ut is given by
(9) GIRFn (ut,Ωt−1) = E [Yt+n|ut,Ωt−1]− E [Yt+n|Ωt−1] ,
that is, given a point in the state space, the future shock realizations are averaged out.
In contrast, FGRU also condition on future shocks by setting them to 0 when generating
their IRFs and start the IRFs at the EMAS. Denote the future realization of shocks with
Ωfut. FGRU effectively use the definition
IRFn (νt,Ωt) = E[Yt+n|ut,Ωt−1 = . . . , 0 ,Ωfut
t+1 = 0, . . .]
− E[Yt+n|0,Ωt−1 = . . . , 0 ,Ωfut
t+1 = 0, . . .],(10)
where the expected values can be dropped as everything is deterministic.
This choice of computing the IRFs at the EMAS has two important implications. First,
computing the non-linear IRFs not as the expected difference in responses as in (9) but
also conditioning on future shocks and setting them to 0, only allows capturing part of the
economic effects of risk shocks. To see this, inspect the particular pruning algorithm5 used
5As first noted in Jinill Kim, Sunghyun Kim, Ernst Schaumburg and Christopher A. Sims (2008), higherorder perturbation solutions tend to explode due to the accumulation of terms of increasing order. Forexample, in a second order approximated solution, the quadratic term at time t will be raised to the powerof two in the quadratic term at t + 1, thus resulting in a quartic term, which will become a term of order8 at t + 2 and so on. As a solution, Kim et al. (2008) proposed “pruning” all terms of higher order, i.e.computing the quadratic term at t + 1 by only squaring the first-order term from time t. This procedure,however, is not easily generalized to third order as there are several potential ways of pruning.
12
in FGRU for IRF-generation.6 Consider a generic model solution of the form
(11) xt = g(xstatest−1 , ut, σ
),
where xt is an nx× 1 vector of endogenous variables, xstatest−1 is the vector of states contained
in xt,7 ut is an nu × 1 vector of mean zero disturbances, and σ is the perturbation param-
eter. Denote partial derivatives with subscripts. The pruned third order solution for the
endogenous variables’ deviations from their steady state, x3rdt = x3rd
t − x, used by FGRU, is
computed from the recursion
x3rdt =gxx
3rd,statest−1 + guut
+1
2
[gxx(x1st,statest−1 ⊗ x1st,states
t−1
)+ 2gxu
(x1st,statest−1 ⊗ ut
)+ guu (ut ⊗ ut) + gσσσ
2]
+1
6
gxxx
(x1st,statest−1 ⊗ x1st,states
t−1 ⊗ x1st,statest−1
)+ guuu (ut ⊗ ut ⊗ ut)
+3gxxu(x1st,statest−1 ⊗ x1st,states
t−1 ⊗ ut)
+ 3gxuu(x1st,statest−1 ⊗ ut ⊗ ut
)+3gxσσσ
2x1st,statest−1 + 3guσσσ
2ut
(12)
x1stt =gxx
1st,statest−1 + guut .(13)
That is, all higher order terms are based on the first-order terms.8 The recursion in equations
(12)-(13) is completed by an initial condition9 of:
x3rd0 = x− x(14)
x1st0 = 0 .(15)
Because x1st0 = 0 and all higher order terms in equation (12) are based on it, the effect
6The IRF-pruning scheme differs from the scheme used for simulations, see Appendix V.7We use the Dynare notation that stacks the state transition and observation equations (see Adjemian
et al., 2011).8This choice results in an inferior performance compared to e.g. the pruning scheme by Martin M.
Andreasen, Jesus Fernandez-Villaverde and Juan F. Rubio-Ramırez (2013) that augments the state space tokeep track of first to third order terms and uses the Kronecker product of the first and second order termsto compute the third order term (see Hong Lan and Alexander Meyer-Gohde, 2013b, for more details).
9As shown in Lan and Meyer-Gohde (2013b) there are infinitely many different past shock realizationsthat can lead to being at a particular point in the state-space at time 0, all of them associated with particularvalues for x3rd0 and x1st0 . Equations (14) to (15) are consistent with the EMAS in that one particular shockcombination giving rise to these values is the total absence of past shocks.
RISK MATTERS: A COMMENT 13
of the initial condition x − x will mostly be neglected. Equation (13) effectively is a first-
order policy function, which is known not to react to risk shocks, except for the state σt−1.
Considering (12), this and the conditioning on all shocks being 0 ∀ t + i, i > 0 implies
that, in the terminology of Hong Lan and Alexander Meyer-Gohde (2013a), only the “risk
adjustment channel” is present (via the constant term 1/2× gσσ × σ2 and the time-varying
risk-adjustment 1/2 × guσσ × σ2 × ut in period t where ut 6= 0). But the difference in
“amplification effects” introduced by (risk) shocks and embedded in the other higher order
terms is totally absent. Thus, the difference in the interaction between the location in the
state space and future shocks, introduced by the risk shock, is not captured.
Second, the IRFs are computed at a particular point in the pruned state space where
agents factor in the uncertainty of the system, but where there has been an infinite absence
of shocks. Due to the absence of shocks and thus of “amplification effects” embedded in the
higher order terms, agents will dare to incur a relatively high amount of debt. As shown
in Table 3, the difference between the EMAS and the unconditional mean amounts to 20
percent.10
B. IRF Generation
Figure 3 compares the responses after a one-standard deviation interest rate risk shock
reported in FGRU (red dashed lines) with the responses when the time aggregation error
is corrected (blue solid lines). It can be seen that correcting the time aggregation error
mechanically results in the size of the shock response dropping to one third of the value
reported in FGRU. For example, instead of dropping by 0.19 percent, output falls by a 0.06
percent at its trough.
10An alternative would be to compute GIRFs at the true ergodic mean using the methods proposed inAndreasen, Fernandez-Villaverde and Rubio-Ramırez (2013).
14
5 10 15 20 25 30
−0.15
−0.1
−0.05
0
Output
5 10 15 20 25 30
−0.4
−0.2
0
Consumption
5 10 15 20 25 30−2
−1
0
Investment
5 10 15 20 25 30−1
0
1
2
x 10−3 Hours
Correct AggregationFGRU Aggregation
Figure 3. Comparison of Quarterly IRFs for Different Aggregation Schemes.
Note: IRFs to a one-standard deviation shock to interest rate risk premium uncertainty. Blue solid line: cor-rect aggregation by averaging percentage deviations of monthly flow variables; red dashed line: aggregationby summing up monthly percentage deviations of flow variables.
RISK MATTERS: A COMMENT 15
V. Starting Simulations at the Ergodic Mean in the Absence of Shocks
The simulations conducted in FGRU use a different pruning scheme than the IRF-generation.
Denote the time periods of the simulations with t = 1, . . . , 96, the simulation repetition with
i = 1, . . . , 200, and a generic variable with yt,i.
1) At time t = 1
• set the third order term of the states x3rd,states1,i to the EMAS and the non-state
elements of x3rd1,i to the deterministic steady state
If i = 1
• set the first-order term x1st1,1 to the deterministic steady state
• set the shock term used in the first-order term to u1st2,1 = 0
• draw a random shock vector u2,1
else if i 6= 1
• set the first-order state term x1st,states1,i to x1st,states
96,i−1
• set the shock term used in the first-order term to u1st2,i = u1st
97,i−1
• set u2,i = u2,1
2) for t = 2 to 96:
• Use the unpruned state space representation to compute the time t values of the
exogenous state variables
• To compute the time t values of the endogenous states, use the recursion
x3rdt,i =gxx
3rd,statest−1,i + guut,i
+1
2
[gxx(x1st,statest−1,i ⊗ x1st,states
t−1,i
)+ 2gxu
(x1st,statest−1 ⊗ u1st
t,i
)+ guu
(u1stt,i ⊗ u1st
t,i
)+ gσσσ
2]
+1
6
gxxx
(x1st,statest−1,i ⊗ x1st,states
t−1,i ⊗ x1st,statest−1,i
)+ guuu
(u1stt,i ⊗ u1st
t,i ⊗ u1stt,i
)+3gxxu
(x1st,statest−1,i ⊗ x1st,states
t−1,i ⊗ u1stt,i
)+ 3gxuu
(x1st,statest−1,i ⊗ u1st
t,i ⊗ u1stt,i
)+3gxσσσ
2x1st,statest−1,i + 3guσσσ
2u1stt,i
(16)
x1stt,i =gxx
1st,statest−1,i + guu
1stt,i
(17)
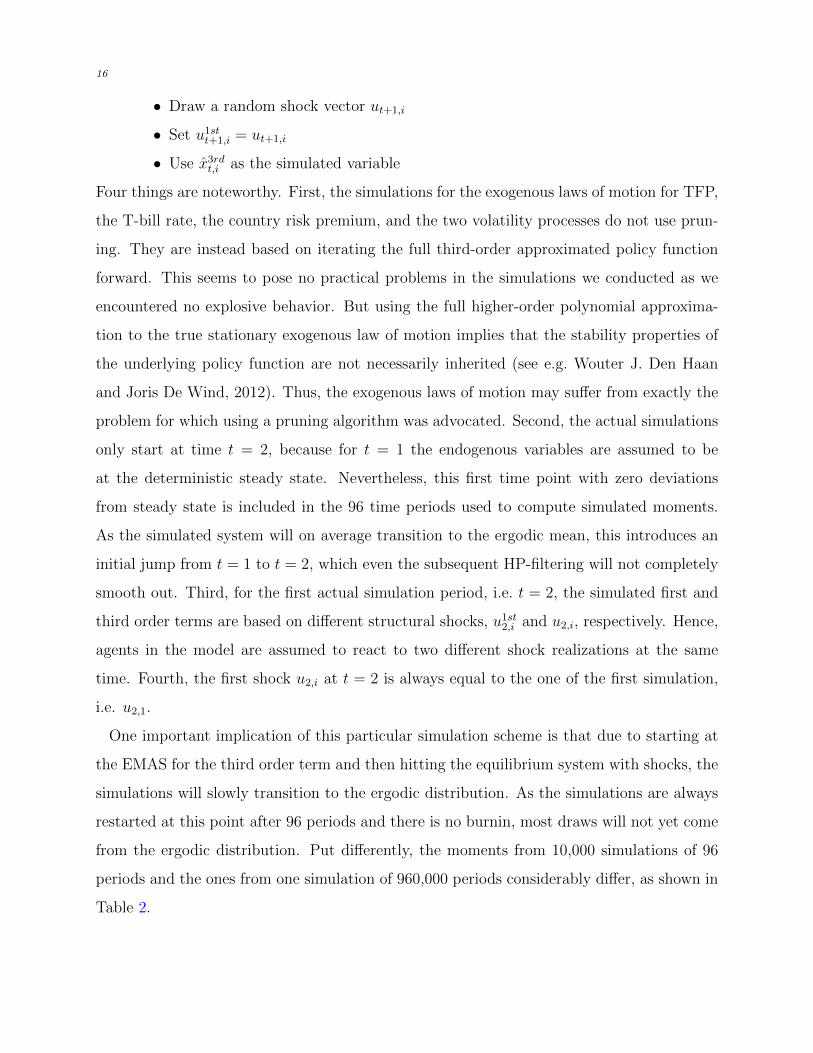
16
• Draw a random shock vector ut+1,i
• Set u1stt+1,i = ut+1,i
• Use x3rdt,i as the simulated variable
Four things are noteworthy. First, the simulations for the exogenous laws of motion for TFP,
the T-bill rate, the country risk premium, and the two volatility processes do not use prun-
ing. They are instead based on iterating the full third-order approximated policy function
forward. This seems to pose no practical problems in the simulations we conducted as we
encountered no explosive behavior. But using the full higher-order polynomial approxima-
tion to the true stationary exogenous law of motion implies that the stability properties of
the underlying policy function are not necessarily inherited (see e.g. Wouter J. Den Haan
and Joris De Wind, 2012). Thus, the exogenous laws of motion may suffer from exactly the
problem for which using a pruning algorithm was advocated. Second, the actual simulations
only start at time t = 2, because for t = 1 the endogenous variables are assumed to be
at the deterministic steady state. Nevertheless, this first time point with zero deviations
from steady state is included in the 96 time periods used to compute simulated moments.
As the simulated system will on average transition to the ergodic mean, this introduces an
initial jump from t = 1 to t = 2, which even the subsequent HP-filtering will not completely
smooth out. Third, for the first actual simulation period, i.e. t = 2, the simulated first and
third order terms are based on different structural shocks, u1st2,i and u2,i, respectively. Hence,
agents in the model are assumed to react to two different shock realizations at the same
time. Fourth, the first shock u2,i at t = 2 is always equal to the one of the first simulation,
i.e. u2,1.
One important implication of this particular simulation scheme is that due to starting at
the EMAS for the third order term and then hitting the equilibrium system with shocks, the
simulations will slowly transition to the ergodic distribution. As the simulations are always
restarted at this point after 96 periods and there is no burnin, most draws will not yet come
from the ergodic distribution. Put differently, the moments from 10,000 simulations of 96
periods and the ones from one simulation of 960,000 periods considerably differ, as shown in
Table 2.
RISK MATTERS: A COMMENT 17
Table 2—Second Moments of Long vs. Short Simulations
Argentina Ecuador
Data Short Sim. Long Sim. Data Short Sim. Long Sim.
Note: first and fourth column: moments obtained from HP-filtered data. Second and fifth column: momentsof the FGRU model with corrected aggregation and net export computation, based on 10,000 replicationsof 96 periods. Third and sixth column: moments of the FGRU model with corrected aggregation and netexport computation, based on 1 replication of 960,000 periods
18
VI. Convergence Behavior of the Net Exports to Output Ratio
Figure 4. Convergence Behavior of Different Net Export Volatility Statistics in the Re-
calibrated Model
Note: top panel: relative volatility of net exports to output σNX/σY . Net exports transformed to percentagedeviations using the Correia, Neves and Rebelo (1995)-approximation. Bottom panel: standard deviation ofthe net exports to output ratio σNX/Y . The blue solid line shows the mean standard deviation (y-axis) overthe up to 10,000 samples (x-axis) of simulating 96 months of data. The black dashed dotted line shows theactual data moments. The data are based on the corrected aggregation and net export computation. Theblack arrow indicates the value after 200 replications.
Using one long simulation for the Correia, Neves and Rebelo (1995) (CNR)-approximation
instead of averaging over many short ones is no alternative. It does not allow for capturing
small sample biases potentially present in the data and, due to the particular pruning scheme
and simulation scheme used in FGRU, leads to results that are not comparable to the short
simulations. See Appendix V for details.
RISK MATTERS: A COMMENT 19
VII. Steady State, EMAS, and Ergodic Mean
Table 3—Steady State, EMAS, and Ergodic Mean: FGRU Calibration
Note: first column: deterministic steady state, second column: ergodic mean in the absence of shocks(EMAS); third column: theoretical mean based on the third-order pruned state space of Andreasen,Fernandez-Villaverde and Rubio-Ramırez (2013). D, NX/Y , and CA are reported in levels, while all othervariables are in logs. The model is at monthly frequency.
Table 3 implies that D/Yannual = 2.09/(12 × exp(1.056)) ≈ 0.0606. In the recalibrated
Note: first column: deterministic steady state, second column: ergodic mean in the absence of shocks(EMAS); third column: theoretical mean based on the third-order pruned state space of Andreasen,Fernandez-Villaverde and Rubio-Ramırez (2013). D, NX/Y , and CA are reported in levels, while all othervariables are in logs. The model is at monthly frequency.
RISK MATTERS: A COMMENT 21
REFERENCES
Adjemian, Stephane, Houtan Bastani, Frederic Karame, Michel Juillard, Junior
Maih, Ferhat Mihoubi, George Perendia, Johannes Pfeifer, Marco Ratto, and
Sebastien Villemot. 2011. “Dynare: reference manual version 4.” CEPREMAP Dynare
Working Papers 1.
Andreasen, Martin M., Jesus Fernandez-Villaverde, and Juan F. Rubio-Ramırez.
2013. “The pruned state-space system for non-linear DSGE models: theory and empirical
applications.” NBER Working Papers 18983.
Correia, Isabel, Joao C. Neves, and Sergio Rebelo. 1995. “Business cycles in a small
open economy.” European Economic Review, 39(6): 1089–1113.
Den Haan, Wouter J., and Joris De Wind. 2012. “Nonlinear and stable perturbation-
based approximations.” Journal of Economic Dynamics and Control, 36(10): 1477–1497.
Fernandez-Villaverde, Jesus, Pablo A. Guerron-Quintana, Juan F. Rubio-
Ramırez, and Martın Uribe. 2011. “Risk matters: the real effects of volatility shocks.”
American Economic Review, 101(6): 2530–61.
Juillard, Michel, and Ondra Kamenik. 2005. “Solving SDGE models: approximation
about the stochastic steady state.” Computing in Economics and Finance 106.
Kim, Jinill, Sunghyun Kim, Ernst Schaumburg, and Christopher A. Sims. 2008.
“Calculating and using second order accurate solutions of discrete time dynamic equilib-
rium models.” Journal of Economic Dynamics and Control, 32(11): 3397 – 3414.
Koop, Gary, M. Hashem Pesaran, and Simon M. Potter. 1996. “Impulse response
analysis in nonlinear multivariate models.” Journal of Econometrics, 74(1): 119–147.
Lan, Hong, and Alexander Meyer-Gohde. 2013a. “Decomposing risk in dynamic
stochastic general equilibrium.” SFB 649 Discussion Papers 22.
Lan, Hong, and Alexander Meyer-Gohde. 2013b. “Pruning in perturbation DSGE
models - guidance from nonlinear moving average approximations.” SFB 649 Discussion