GAIL (India) Ltd. CMP* (Rs) 336 Upside/ (Downside) (%) 14 Bloomberg Ticker GAIL IN Market Cap. (Rs bn) 757 Free Float (%) 35 Shares O/S (mn) 2,255 Oil & Gas | India Institutional Equity Research Initiating Coverage | February 28, 2019 1 BUY Target Price: Rs382 Share price (%) 1 mth 3 mth 12 mth Absolute performance 0.2 (3.4) (2.1) Relative to Nifty 0.0 (4.5) (4.5) Shareholding Pattern (%) Sep’18 Dec’18 Promoter 53.5 53.3 Public 46.5 46.7 Risk - Reward Favourable to Upside; Initiate with BUY Y/E March (Rs mn) FY17 FY18 FY19E FY20E FY21E Revenues 4,85,720 5,44,964 7,04,051 7,21,355 7,44,429 EBITDA 65,942 77,790 1,05,292 1,09,408 1,17,140 EBITDA margins (%) 13.6 14.3 15.0 15.2 15.7 PBT 57,573 67,699 94,754 1,01,281 1,10,648 PAT 39,479 46,471 63,959 69,377 75,794 Net Profit margins(%) 8.1 8.5 9.1 9.6 10.2 Growth (%) 112.5 17.7 37.6 8.5 9.2 EPS 17.5 20.6 28.4 30.8 33.6 Source: Company, RSec Research We initiate coverage on GAIL (India) Ltd. with a BUY recommendation and an SOTP- based Target Price of Rs382, implying 14% upside from the CMP, which along with ~2% dividend yield would be higher than its WACC (12%). We expect GAIL to witness 9% earning CAGR through FY19-21E backed by swing in gas volume from HVJ (low tariff) to DVPL (higher tariff), as the Company will continue to swing in gas volume from HVJ to DVPL, Further the PNGRB is likely to upwardly revise HVJ and DVPL tariff in next 6-8 months. our model suggests that Every Rs2.5/mmbtu rise in tariff is 3% upside to GAIL’s FY20E-EPS. As guided by company, GAIL will be able to bring up the utilisation level of its Petrochemical plant from 74% in FY19 to 90% in FY20 and 98% in FY21. GAIL Petchem segment to benefit from sustained higher margins, we expect Petrochemical EBITDA to grow by 30%/27%/30% in FY19/FY20/FY21. Further waning concerns over lower crude oil prices. In higher crude prices scenario, gas trading segment is expected to reap margins from US LNG. As at CMP, the stock trades at 10.8x of FY20E EPS, which is a discount to its long-term average of 12.2x (last 5 years). Pipeline tariffs revision/ unification a near term positive catalyst The PNGRB is likely to upwardly revise HVJ and DVPL tariff in next 6-8 months. Post simulating the impact of final orders for HVJ and DVPL, our model suggests that the tariff for DVPL can increase by Rs11.5/MMbtu, while HVJ can witness rise by Rs31.1/MMbtu. In order to reduce higher cost to the last consumer, the government proposed single tariff (unification) across pipelines. We expect the final decision in this regard after 6-8 months (post General Elections). GAIL pleads for a flat tariff of Rs57/MMbtu for its major pipelines vs. existing average of Rs 39/ MMbtu. In case unified tariff is approved, GAIL’s EBITDA could rise by Rs 23.9bn in FY20E. Improved utilization and higher margins to lead a growth in Petrochemical Based on company guidance, GAIL will be able to bring up the utilisation level of its PE plant from 74% in FY19 to 90% in FY20 and 98% in FY21. Over FY15-18, PE margins have been very high. Despite addition of new PE production, Petrochemical margins of 9MFY19 were higher on YoY basis. GAIL Petchem segment to benefit from sustained higher Petchem margins, GAIL has introduced Metallocene a value-added product, which will improve the overall petrochemical realisation and expected to contribute 15% to the total sales volume. We expect Petrochemical EBITDA to grow by 20%/27%/30% in FY19/FY20/FY21. Outlook & Valuation We arrived at SOTP-based Target Price of Rs 382 (US$32.7 for GDRs) valuing core business at Rs 312 and the market value of investment at Rs54/share (30% discount to CMP) and adding net cash of Rs17/share. We valued GAIL’s segments using DCF, implied EV/EBITDA multiple to its gas transmission / LPG transmission / gas trading /Petrochemical /LPG & OLHC segments are 6.1x/5.9x/4.7x/7.5x/6.9x. GAIL trades at 6.4x on FY20E EBITDA, which is discount to its long-term average of 8.4 x(Last 5 years). We expect GAIL to witness a strong FCF generation of Rs80 bn over FY19-FY21. As the stock provides high earnings visibility and healthy RoE /ROCE of 13%/9% over 3 years. Ours Vs consensus (Rs bn) FY19E FY20E FY21E EBITDA -Rsec 105.3 109.4 117.1 EBITDA - Cons 104.6 108.7 113.7 Variance (%) 1 1 3 PAT -Rsec 64.0 69.4 75.8 PAT - Cons 67.6 70.2 75.4 Variance (5) (1) 1 Valuation multiple (x) FY19E FY20E FY21E P/E 11.7 10.8 9.8 P/CEPS 5.5 6.3 5.9 P/BV 1.6 1.4 1.3 Dividend yield (%) 1.9 2.2 3.0 EV/Sales 1.0 1.0 0.9 EV/EBITDA 6.7 6.4 6.0 1 Year Stock Price Performance Note: * CMP as on February 27, 2019 280 300 320 340 360 380 400 Feb-18 Mar-18 Apr-18 May-18 Jul-18 Aug-18 Sep-18 Oct-18 Nov-18 Dec-18 Jan-19 Feb-19 Research Analyst : Yogesh Patil Contact : (022) 3303 4632 Email : [email protected]
Transcript
GAIL (India) Ltd.CMP* (Rs) 336
Upside/ (Downside) (%) 14
Bloomberg Ticker GAIL IN
Market Cap. (Rs bn) 757
Free Float (%) 35
Shares O/S (mn) 2,255
Oil & Gas | India
Institutional Equity Research
Initiating Coverage | February 28, 2019
1
BUYTarget Price: Rs382
Share price (%) 1 mth 3 mth 12 mth
Absolute performance 0.2 (3.4) (2.1)
Relative to Nifty 0.0 (4.5) (4.5)
Shareholding Pattern (%) Sep’18 Dec’18
Promoter 53.5 53.3
Public 46.5 46.7
Risk - Reward Favourable to Upside; Initiate with BUY
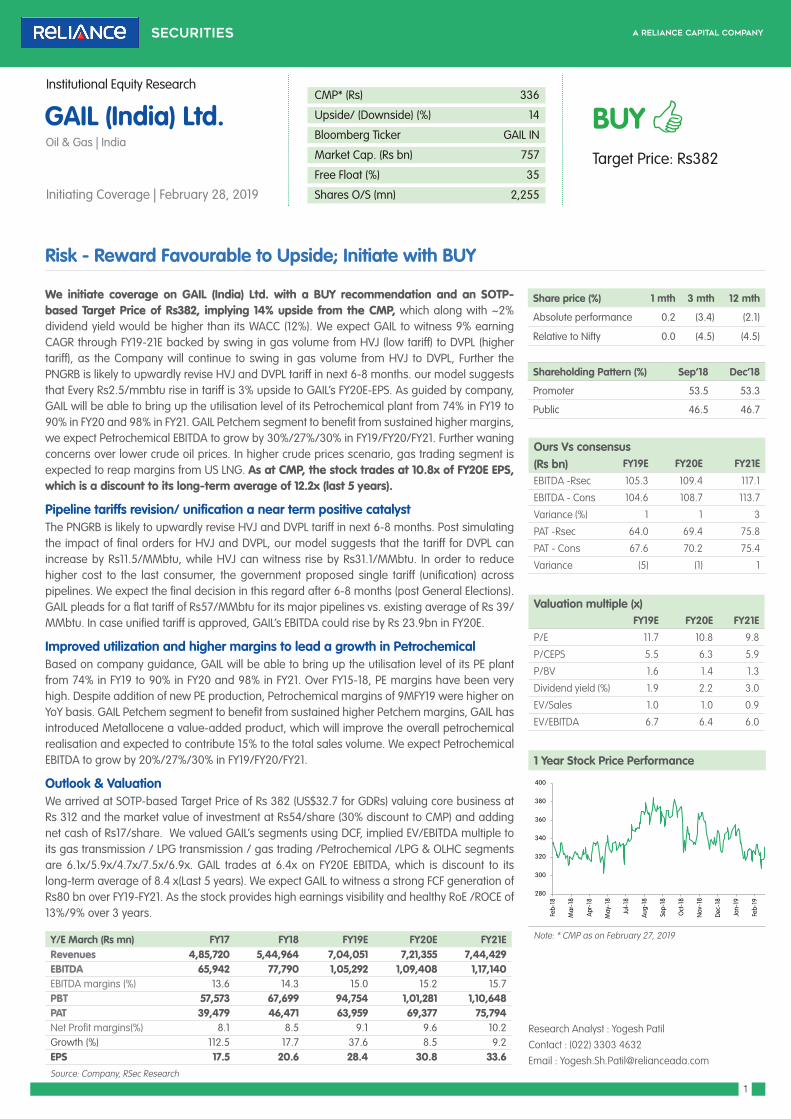
We initiate coverage on GAIL (India) Ltd. with a BUY recommendation and an SOTP-based Target Price of Rs382, implying 14% upside from the CMP, which along with ~2% dividend yield would be higher than its WACC (12%). We expect GAIL to witness 9% earning CAGR through FY19-21E backed by swing in gas volume from HVJ (low tariff) to DVPL (higher tariff), as the Company will continue to swing in gas volume from HVJ to DVPL, Further the PNGRB is likely to upwardly revise HVJ and DVPL tariff in next 6-8 months. our model suggests that Every Rs2.5/mmbtu rise in tariff is 3% upside to GAIL’s FY20E-EPS. As guided by company, GAIL will be able to bring up the utilisation level of its Petrochemical plant from 74% in FY19 to 90% in FY20 and 98% in FY21. GAIL Petchem segment to benefit from sustained higher margins, we expect Petrochemical EBITDA to grow by 30%/27%/30% in FY19/FY20/FY21. Further waning concerns over lower crude oil prices. In higher crude prices scenario, gas trading segment is expected to reap margins from US LNG. As at CMP, the stock trades at 10.8x of FY20E EPS, which is a discount to its long-term average of 12.2x (last 5 years).
Pipeline tariffs revision/ unification a near term positive catalystThe PNGRB is likely to upwardly revise HVJ and DVPL tariff in next 6-8 months. Post simulating the impact of final orders for HVJ and DVPL, our model suggests that the tariff for DVPL can increase by Rs11.5/MMbtu, while HVJ can witness rise by Rs31.1/MMbtu. In order to reduce higher cost to the last consumer, the government proposed single tariff (unification) across pipelines. We expect the final decision in this regard after 6-8 months (post General Elections). GAIL pleads for a flat tariff of Rs57/MMbtu for its major pipelines vs. existing average of Rs 39/MMbtu. In case unified tariff is approved, GAIL’s EBITDA could rise by Rs 23.9bn in FY20E.
Improved utilization and higher margins to lead a growth in Petrochemical Based on company guidance, GAIL will be able to bring up the utilisation level of its PE plant from 74% in FY19 to 90% in FY20 and 98% in FY21. Over FY15-18, PE margins have been very high. Despite addition of new PE production, Petrochemical margins of 9MFY19 were higher on YoY basis. GAIL Petchem segment to benefit from sustained higher Petchem margins, GAIL has introduced Metallocene a value-added product, which will improve the overall petrochemical realisation and expected to contribute 15% to the total sales volume. We expect Petrochemical EBITDA to grow by 20%/27%/30% in FY19/FY20/FY21.
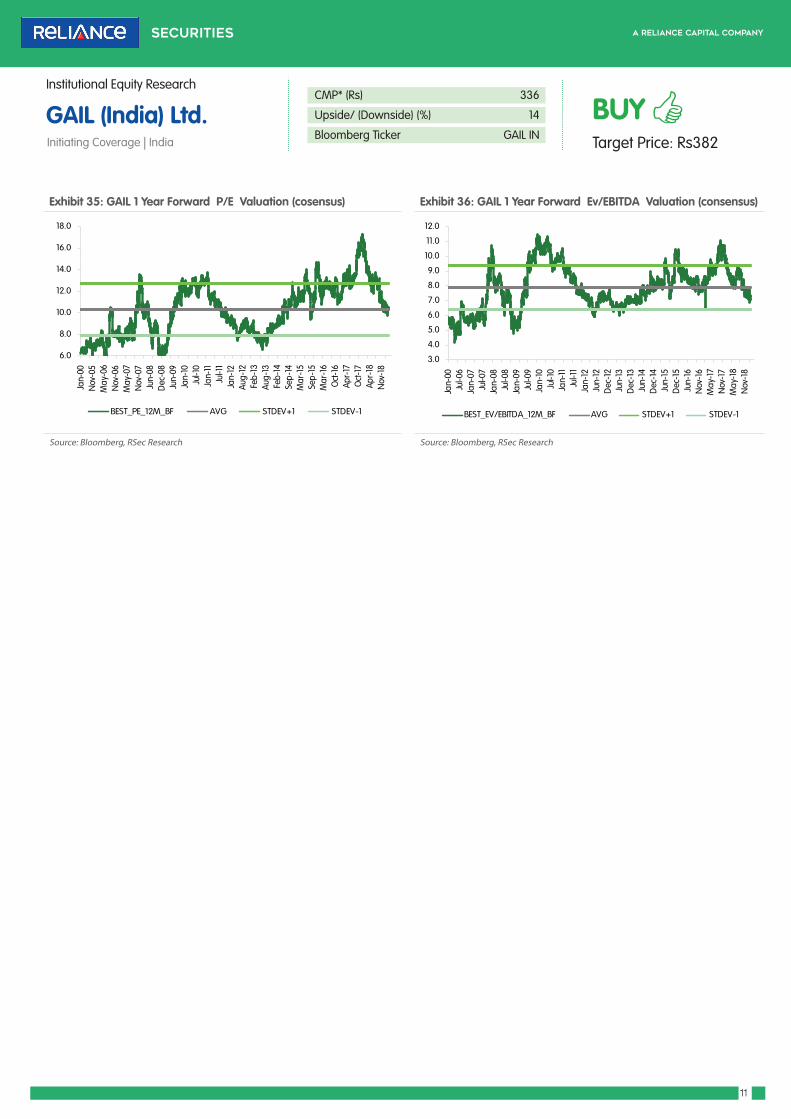
Outlook & Valuation We arrived at SOTP-based Target Price of Rs 382 (US$32.7 for GDRs) valuing core business at Rs 312 and the market value of investment at Rs54/share (30% discount to CMP) and adding net cash of Rs17/share. We valued GAIL’s segments using DCF, implied EV/EBITDA multiple to its gas transmission / LPG transmission / gas trading /Petrochemical /LPG & OLHC segments are 6.1x/5.9x/4.7x/7.5x/6.9x. GAIL trades at 6.4x on FY20E EBITDA, which is discount to its long-term average of 8.4 x(Last 5 years). We expect GAIL to witness a strong FCF generation of Rs80 bn over FY19-FY21. As the stock provides high earnings visibility and healthy RoE /ROCE of 13%/9% over 3 years.
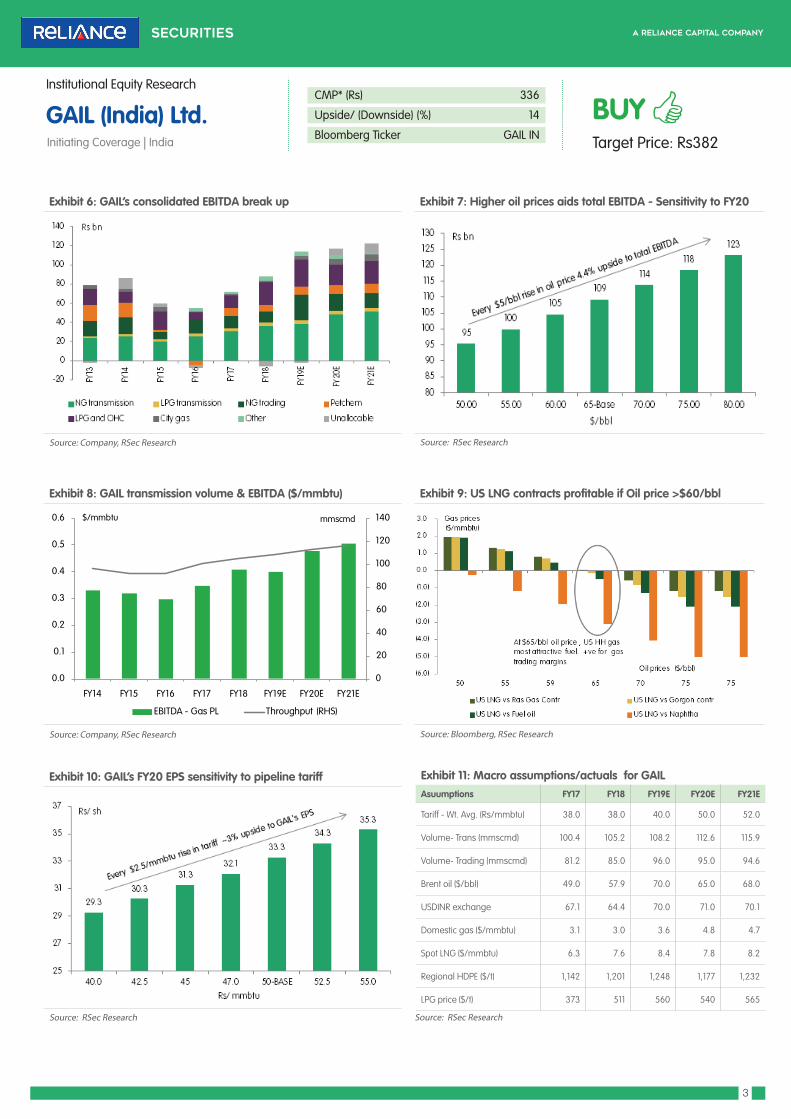
Volume- Trans (mmscmd) 100.4 105.2 108.2 112.6 115.9
Volume- Trading (mmscmd) 81.2 85.0 96.0 95.0 94.6
Brent oil ($/bbl) 49.0 57.9 70.0 65.0 68.0
USDINR exchange 67.1 64.4 70.0 71.0 70.1
Domestic gas ($/mmbtu) 3.1 3.0 3.6 4.8 4.7
Spot LNG ($/mmbtu) 6.3 7.6 8.4 7.8 8.2
Regional HDPE ($/t) 1,142 1,201 1,248 1,177 1,232
LPG price ($/t) 373 511 560 540 565
0
20
40
60
80
100
120
140
0.0
0.1
0.2
0.3
0.4
0.5
0.6
FY14 FY15 FY16 FY17 FY18 FY19E FY20E FY21E
EBITDA - Gas PL Throughput (RHS)
$/mmbtu mmscmd
Source: RSec Research
GAIL (India) Ltd.Initiating Coverage | India
Institutional Equity Research
4
CMP* (Rs) 336
Upside/ (Downside) (%) 14
Bloomberg Ticker GAIL IN
BUYTarget Price: Rs382
Exhibit 12: Swing in volume from HVJ to DVPL Exhibit 13: GAIL Major pipeline tariff chart
Source: Company, RSec Research Source: Company, RSec Research
Investment RationaleIncremental Volume to Flow thorough Higher Tariff DVPL-GREPGAIL has been able to swing gas volume from low-tariff (Rs25.5/MMbtu) in HVJ-GREP pipeline to higher tariff (Rs53.6/MMbtu) in DVPL-GREP pipeline during the last 5 years. HVJ-GREP volume fell from 47.5mmscmd in FY13 to 29.5mmscmd in FY18, while DVPL-GREP volume increased from 12.6mmscmd to 35.9mmscmd over same period. Our calculation suggests swing in volume led to incremental revenue growth of ~Rs9bn for GAIL over the last 5 years. Our FY19-21 estimates assume that all incremental volume on the HVJ/DVPL network is routed to the DVPL-GREP pipeline, which entails earnings upside. Every 5 mmscmd volume addition to DVPL -GREP is Rs5 bn upside to GAIL’s gas transmission EBITDA.
Upward Revision of HVJ & DVPL Tariffs – Near-term CatalystPetroleum and Natural Gas Regulatory Board (PNGRB) is likely to finalise the tariffs for GAIL’s HVJ-DVPL pipeline. PNGRB determines the tariffs, which in theory allows a 12% post-tax return on capital employed. The finalisation of tariff takes into account actual cost and volume data. The final tariffs apply prospectively for a period of 5 years with a provision of review in every 5 years. It is difficult to anticipate the PNGRB’s arithmetic on revision, as there are several assumptions need to feed into the models. Post simulating the impact of final orders for HVJ and DVPL, our model suggests that the tariff for DVPL can increase by Rs11.5/Mmbtu, while HVJ can witness decline by Rs 31.1/MMbtu. We assumed Weighted avg. tariffs of Rs 50/mmbtu for FY20 vs. GAIL’s pleads of Rs 57/mmbtu.
Source: RSec Research Source: Company, RSec Research
0
20
40
60
80
100
120
140
0.0
0.1
0.2
0.3
0.4
0.5
0.6
FY14 FY15 FY16 FY17 FY18 FY19E FY20E FY21E
EBITDA - Gas PL Throughput (RHS)
$/mmbtu mmscmd
GAIL (India) Ltd.Initiating Coverage | India
Institutional Equity Research
5
CMP* (Rs) 336
Upside/ (Downside) (%) 14
Bloomberg Ticker GAIL IN
BUYTarget Price: Rs382
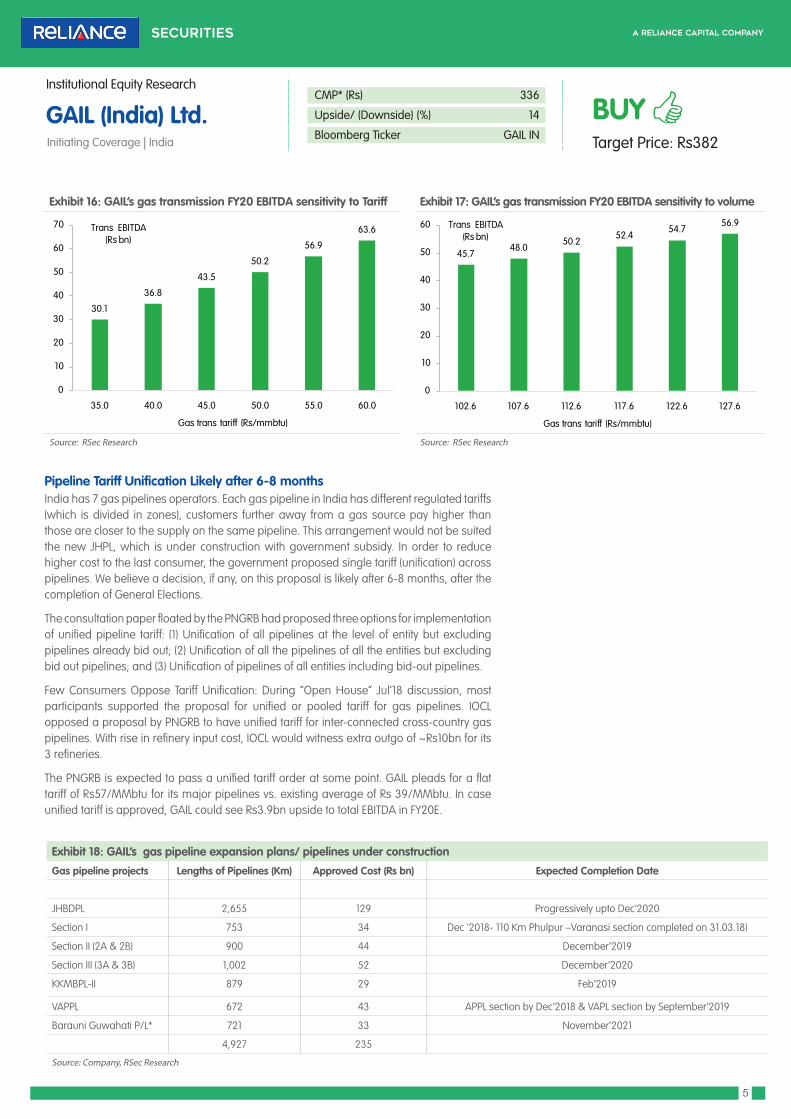
Exhibit 16: GAIL’s gas transmission FY20 EBITDA sensitivity to Tariff Exhibit 17: GAIL’s gas transmission FY20 EBITDA sensitivity to volume
Source: RSec Research Source: RSec Research
30.1
36.8
43.5
50.2
56.9
63.6
0
10
20
30
40
50
60
70
35.0 40.0 45.0 50.0 55.0 60.0
Trans EBITDA (Rs bn)
Gas trans tariff (Rs/mmbtu)
45.748.0
50.252.4
54.756.9
0
10
20
30
40
50
60
102.6 107.6 112.6 117.6 122.6 127.6
Trans EBITDA (Rs bn)
Gas trans tariff (Rs/mmbtu)
Pipeline Tariff Unification Likely after 6-8 months India has 7 gas pipelines operators. Each gas pipeline in India has different regulated tariffs (which is divided in zones), customers further away from a gas source pay higher than those are closer to the supply on the same pipeline. This arrangement would not be suited the new JHPL, which is under construction with government subsidy. In order to reduce higher cost to the last consumer, the government proposed single tariff (unification) across pipelines. We believe a decision, if any, on this proposal is likely after 6-8 months, after the completion of General Elections.
The consultation paper floated by the PNGRB had proposed three options for implementation of unified pipeline tariff: (1) Unification of all pipelines at the level of entity but excluding pipelines already bid out; (2) Unification of all the pipelines of all the entities but excluding bid out pipelines; and (3) Unification of pipelines of all entities including bid-out pipelines.
Few Consumers Oppose Tariff Unification: During “Open House” Jul’18 discussion, most participants supported the proposal for unified or pooled tariff for gas pipelines. IOCL opposed a proposal by PNGRB to have unified tariff for inter-connected cross-country gas pipelines. With rise in refinery input cost, IOCL would witness extra outgo of ~Rs10bn for its 3 refineries.
The PNGRB is expected to pass a unified tariff order at some point. GAIL pleads for a flat tariff of Rs57/MMbtu for its major pipelines vs. existing average of Rs 39/MMbtu. In case unified tariff is approved, GAIL could see Rs3.9bn upside to total EBITDA in FY20E.
Exhibit 18: GAIL’s gas pipeline expansion plans/ pipelines under construction
Gas pipeline projects Lengths of Pipelines (Km) Approved Cost (Rs bn) Expected Completion Date
JHBDPL 2,655 129 Progressively upto Dec’2020
Section I 753 34 Dec ‘2018- 110 Km Phulpur –Varanasi section completed on 31.03.18)
Section II (2A & 2B) 900 44 December’2019
Section III (3A & 3B) 1,002 52 December’2020
KKMBPL-II 879 29 Feb’2019
VAPPL 672 43 APPL section by Dec’2018 & VAPL section by September’2019
Barauni Guwahati P/L* 721 33 November’2021
4,927 235
Source: Company, RSec Research
GAIL (India) Ltd.Initiating Coverage | India
Institutional Equity Research
6
CMP* (Rs) 336
Upside/ (Downside) (%) 14
Bloomberg Ticker GAIL IN
BUYTarget Price: Rs382
Gas Pipeline Utilisation to Decline Post Completion of JHBD Pipeline GAIL planned to invest Rs 235bn over period of next 3/4 years to add gas pipeline length of 4927 km. Though this last mile connectivity is expected to increase penetration of gas in India, new pipelines could be underutilised during initial period. The dream “If we build, they will come” is not true to GAIL gas pipelines, building a pipeline does not guarantee volume growth. For example: Dabhol-Bangalore, North GJ and Assam PL are underutilised (<20%). We believe JHBD pipeline to be ready by Dec’20 with a view to supplying gas for the fertiliser and CGD projects.
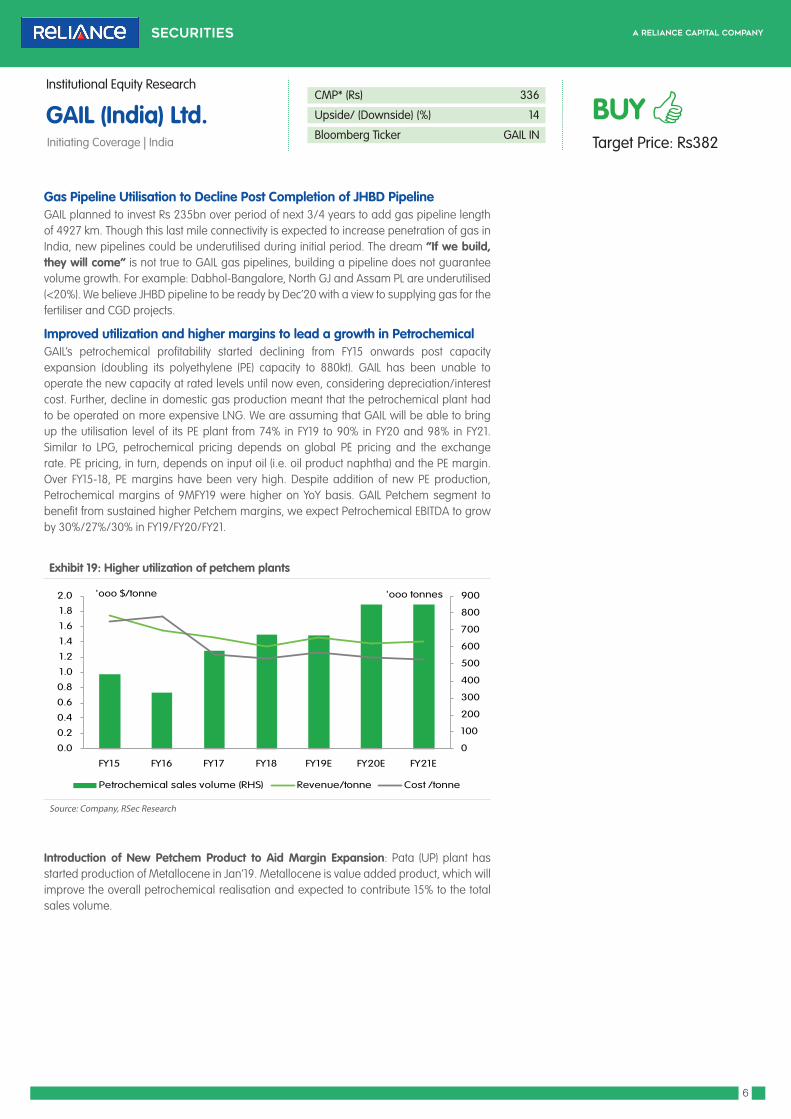
Improved utilization and higher margins to lead a growth in PetrochemicalGAIL’s petrochemical profitability started declining from FY15 onwards post capacity expansion (doubling its polyethylene (PE) capacity to 880kt). GAIL has been unable to operate the new capacity at rated levels until now even, considering depreciation/interest cost. Further, decline in domestic gas production meant that the petrochemical plant had to be operated on more expensive LNG. We are assuming that GAIL will be able to bring up the utilisation level of its PE plant from 74% in FY19 to 90% in FY20 and 98% in FY21. Similar to LPG, petrochemical pricing depends on global PE pricing and the exchange rate. PE pricing, in turn, depends on input oil (i.e. oil product naphtha) and the PE margin. Over FY15-18, PE margins have been very high. Despite addition of new PE production, Petrochemical margins of 9MFY19 were higher on YoY basis. GAIL Petchem segment to benefit from sustained higher Petchem margins, we expect Petrochemical EBITDA to grow by 30%/27%/30% in FY19/FY20/FY21.
Introduction of New Petchem Product to Aid Margin Expansion: Pata (UP) plant has started production of Metallocene in Jan’19. Metallocene is value added product, which will improve the overall petrochemical realisation and expected to contribute 15% to the total sales volume.
GAIL (India) Ltd.Initiating Coverage | India
Institutional Equity Research
7
CMP* (Rs) 336
Upside/ (Downside) (%) 14
Bloomberg Ticker GAIL IN
BUYTarget Price: Rs382
Gas Marketing Segment – One of the Major Contributors to total EBITDA in 9MFY19Gas marketing accounted for 15% of GAIL’s FY18 EBITDA on volume of 85mmscmd. GAIL makes fixed marketing margin of Rs200/tcm on gas sales (APM+PMT). This stream is likely to gradually reduce, as domestic gas production declines. As most upcoming gas is expected to be produced from deep water gas fields of East Coast, the producers are free to market new gas and need not have to go through GAIL. Gas marketing contributed 27% in GAIL’s 9MFY19 reported EBITDA.
Exhibit 20: GAIL’s gas Marketing mix Exhibit 21: GAIL’s domestic gas sales by industrywide
Source: Company, RSec Research Source: Company, RSec Research
Exhibit 22: GAIL’s RLNG sales by industrywide Exhibit 23: Annuity implied trading margins of GAIL
Source: Company, RSec Research Source: Company, RSec Research
GAIL (India) Ltd.Initiating Coverage | India
Institutional Equity Research
8
CMP* (Rs) 336
Upside/ (Downside) (%) 14
Bloomberg Ticker GAIL IN
BUYTarget Price: Rs382
Crude Price at >US$60/bbl – To Aid GAIL to Reap Margin from US LNG Sale in India GAIL has long-term commitment to purchase 14MMTPA of LNG (excluding 10.6MMTPA of TAPI contracts). Out of it, US LNG is 5.8MMTPA. Except for US LNG, all other contracts are crude-linked. In the near-term (3 to 6 months), lower oil prices do not pose any risk to US LNG trading margin, as ~90% US LNG cargoes are contracted/hedged. US LNG gas contracts at HH price of US$3/mmbtu are profitable if crude stays above US$60/bbl. GAIL performed well during crude rally in CY18, with super normal gas trading EBITDA margin of $0.67/mmbtu in 2QFY19. So every US$5/bbl rise in oil prices increases total EBITDA by Rs4.6bn (4.2% upside). Volatility in crude price makes GAIL’s gas trading earnings less predictable or implies positive surprises in the near-term. Earnings unpredictability due to crude prices is unlikely to earn high multiple.
Exhibit 24: Oil prices and GAIL’s US HH gas contracts profitability Exhibit 25: LNG consumption improves when LNG discounts to FO
Source: Company, RSec Research Source: Company, RSec Research
Exhibit 26: Availbility of gas supply in India at diversified prices. Exhibit 27: Higher oil prices aids total EBITDA-Sensitivity to FY20
Source: PPAC, MOPNG, BLOOMBERG, RSec Research Source: , RSec Research
GAIL (India) Ltd.Initiating Coverage | India
Institutional Equity Research
9
CMP* (Rs) 336
Upside/ (Downside) (%) 14
Bloomberg Ticker GAIL IN
BUYTarget Price: Rs382
LPG & OLHC - Commodity exposure, again to higher oil pricesGAIL’s LPG segment is highly profitable, as the prices of its products (LPG, Pentane and Propane etc.) are linked to the global prices, while the cost of input is domestic gas whose price hovers at ~50% discount to the free market price. Hence, lower oil prices will result in lower segmental earnings. However, we do note that the drop in LPG prices is less than the movement in Brent crude price, which lower any major downside to some extent. Further, we have raised our segmental volume estimates by 4-8% over FY19-21E. Monthly output trends indicate higher volume due to better availability of rich gas from ONGC’s new fields. We assume crude prices of $65/bbl in FY20 & $68/bbl in FY21 and APM gas prices are expected to rise from current level of $3.36/mmbtu to $3.7/mmbtu in 1HFY20.
Exhibit 28: Domestic gas price (APM) to rise ~13% in 1HFY20E Exhibit 29: LPG – Domestic gas spread ($/t)
Source: PPAC, RSec Research Source: Bloomberg, RSec Research
Exhibit 30: Sensitivity of LPG segment EBITDA to crude prices (FY20) Exhibit 31: LPG & Brent price correlation
Source: RSec Research Source: Bloomberg, RSec Research
Valuation & outlookWe arrived at SOTP-based Target Price of Rs 382 (US$32.7 for GDRs) valuing core business at Rs 312 and the market value of investment at Rs54/share (30% discount to CMP) and adding net cash of Rs17/share. This is in order to capture the long-term growth potential for various business segments and incorporate diverging trends gas transmission (which should continue to grow) and gas marketing. We valued GAIL’s segments using DCF, implied EV/EBITDA multiple to its gas transmission / LPG transmission / gas trading /Petrochemical /LPG & OLHC segments are 6.1x/5.9x/4.7x/7.5x/6.9x. GAIL trades at 6.4x on FY20E EBITDA, which is discount to its long-term average of 8.4 (Last 5 years). We expect GAIL to witness a strong FCF generation of Rs80 bn over FY19-FY21. As the stock provides high earnings visibility and healthy RoE /ROCE of 13%/9% over 3 years. At CMP, the stock trades at 10.8x on FY20E EPS, which is discount to its long-term average of 12.2x (last 5 years).
Exhibit 32: GAIL’s SOTP based valuation Overall Unit Valuation method EV FY19 EBITDA Implied x Break up (%)Natural Gas transmission INR mn FCFF @ WACC 12% & Terminal growth @ FY30 (1%) 3,05,460 39,729 7.7 44
Exhibit 40: Total LNG import capacity but utilization to come down Exhibit 41: Administered price Mechanism (APM) gas prices
Source: PPAC, MOPNG, RSec Research Source: PPAC, MOPNG, RSec Research
2.16 2.08
4.26 4.67
5.05 4.66
3.82
3.06 2.50 2.48
2.89 3.06 3.36
3.86
-
1.0
2.0
3.0
4.0
5.0
6.0
FY09
FY10
FY11
FY12
-Nov
'14
Nov
'14-M
ar'15
1HFY
16
2HFY
16
1HFY
17
2HFY
17
1HFY
18
2HFY
18
1HFY
19
2HFY
19
1HFY
20E
$/mmbtu
GAIL (India) Ltd.Initiating Coverage | India
Institutional Equity Research
13
CMP* (Rs) 336
Upside/ (Downside) (%) 14
Bloomberg Ticker GAIL IN
BUYTarget Price: Rs382
India’s gas demand evolves as the contours of gas supply in the country, which is likely to become more complex. Incremental gas supply will flow from various sources (Deepwater gas fields, CBM, marginal fields and LNG) at multiple price-points. Demand from the consumers (Power and Fertilisers accounting for 61%) are sensitive to gas prices, while the others are mostly insensitive. Therefore, total available LNG supply (higher price) cannot be consumed in toto.
During the last few years, decline in gas output from KG-D6 fields led to fall in overall domestic gas production, which is likely to recover in 2020/21. ONGC and other private players are heavily investing to commence production from the East Coast gas block (KG 98/2). As the Indian companies have invested to build LNG terminal, LNG regasification capacity is expected to double by 2022/23, with which total annual LNG regasification capacity is seen at 65bcm (180mmscmd). In our base case scenario, we see limited growth in total LNG imports to India, even after building new LNG terminals. It is likely to create pressure on utilisation.
Domestic Gas Supply to Increase Meaningfully over Next Few Years ONGC’s gas production grew by 4.3% YoY in 9MFY19. The Company has started production in few marginal fields and likely to expand production from the new fields. ONGC is investing Rs570bn (US$8.1bn), which is one of the highest investments in the world in any gas projects, in KG-DWN-98/2 project as well as towards development of other discoveries on the off-West Coast. Gas production from the KG-DWN-98/2 is targeted to commence from 2020 and peak output is envisaged at 16.56 mmscmd by 2022. Private players are heavily investing in KG-D6 East Coast block to produce additional 30-33mmscmd of gas next 2/3 years. In our gas model, we assume higher decline in rate of production from the existing gas fields and slower production ramp-up in new fields. In our base case scenario, domestic gas production is expected to increase from the current level of 90mmscmd to 128mmscmd in FY24E.
Exhibit 42: Total gas production in India with full LNG capacity available
Exhibit 43: Increase in domestic gas production from ONGC & Other private players
Source: MOPNG, PPAC, RSec Research Source: ONGC, PPAC, MOPNG, RSec Research
GAIL (India) Ltd.Initiating Coverage | India
Institutional Equity Research
14
CMP* (Rs) 336
Upside/ (Downside) (%) 14
Bloomberg Ticker GAIL IN
BUYTarget Price: Rs382
Rising Gas Supply at Diversified PriceThe gas prices in India have been relatively low led by discovery of large domestic gas. The purchase of contracted and spot LNG added to the supply at diversified price-points. The purchase of contracted LNG from the US coast, Russia and Gorgon are diversified. Upcoming new gas production from deep water gas field in India is permitted to sell gas at market rate. The gas producers will have marketing freedom for the new gas volume as well. The same is a case with CBM gas. As a result, price-wise composition of total gas available in the country will begin to look much more diversified over the next few years.
GAIL will have to manage price gas supplies differently. At times, RasGas contracts are cheaper than Henry Hub (HH) linked volumes and vice versa. So far, few consumers are willing to purchase gas on HH-linked cost. Based on the company’s guidance in 3QFY19, 90% of the HH volumes are either contracted/hedged for the next 12 to18 months.
LNG Supply Outlook: Headline LNG Re-gasification Capacity to Double by 2022/23Decline in domestic gas production over the past few years and continued success of PLNG seem to have prompted the construction of several new LNG import terminals in India. Despite the inauguration of GSPC’s LNG terminal at Mundra, we have not seen any volume so far. IOCL (Ennore: 5MMTPA) and H-Energy (Jaigarh: 4MMTPA) are expected to start LNG receiving terminals next year. Another 5MMTPA Dhamra LNG is expected to be commissioned in Mar’21. Following these, the headline India LNG regasification capacity is expected to double by 2022/23, while total annual LNG regasification capacity would be 65bcm (180mmscmd) gas.
Exhibit 44: LNG / Gas import contracts
Location Quantity (MMTPA)
Starting Period Pricing Link Destination Price ($/mmbtu)
Gorgon, Australia 0.4 Jan'17 2017-2034 Brent-linked To India, Flexible 13.9% * ( Brent Price)
GSPC 0.3
RasGas, Qatar 0.3 Jan'16 Until 2027/28 Oil/JCC-linked Dahej/Kochi 12.66% *(3M Brent Avg)+0.6Source: RSec Research
GAIL (India) Ltd.Initiating Coverage | India
Institutional Equity Research
15
CMP* (Rs) 336
Upside/ (Downside) (%) 14
Bloomberg Ticker GAIL IN
BUYTarget Price: Rs382
Exhibit 45: Add charts of LNG capacity addition (with utilization)
Source: PPAC, RSec Research
Gas Demand Outlook Based on our India natural gas demand supply model, Fertiliser and City gas Distribution (CGD) players are expected to drive gas demand, while the power plants, being price sensitive, are unlikely to consume more gas at higher prices. Refineries have been the large incremental buyers of natural gas in India irrespective of prices. This is largely driven by the conversion of more refining facilities to use gas and increasing complexities of Indian refiners. In our base case scenario, we believe, upcoming CGD areas to start consuming gas mostly for CNG and household PNG by 2022 (which will flow from domestic gas fields).
Exhibit 46: Gas Consumption of domestic gas Exhibit 47: Gas consumption of Imported gas
Source: PPAC, RSec Research Source: PPAC, RSec Research
New Capacity Addition in Fertiliser Space to Drive Gas Demand: The Government of India has encouraged to set up new/expansion of 8 fertiliser plants, which will add capacity of 9.3MMTPA (by 2023) to the extant capacity of 24MMTPA. Most plants are in Northern/Eastern parts, where GAIL is laying Jagdishpur-Haldia pipeline to supply a gas to most fertiliser plants. New fertiliser plants are expected to consume an incremental 5.6bcm (15.6mmscmd) gas. It is the most certain driver of gas demand and relatively immune to the volatility in natural gas prices, in our view.
GAIL (India) Ltd.Initiating Coverage | India
Institutional Equity Research
16
CMP* (Rs) 336
Upside/ (Downside) (%) 14
Bloomberg Ticker GAIL IN
BUYTarget Price: Rs382
Exhibit 48: Fertilizer new capacity ramp up to 33 MMTPA by 2023 ( addition of 9 MMTPA)
Exhibit 49: Rise in gas consumption by 16 mmscmd to new additional fertilizer capacity
Source: MOPNG RSec Research Source: MOPNG, RSec Research
Latest CGD Round to Drive Gas Penetration: Natural gas consumption in CGD business witnessed a momentum in FY17 and FY18 (clocking 25% CAGR over FY16-FY18), after registering relatively flat demand over FY15-FY16. We expect retail gas demand in transport and households sectors to increase with the rise in penetration level. While projecting near-term CGD growth, we assume the demand momentum will continue and an additional spurt in gas demand post commissioning of 9th round CGD project from FY21/22. We expect gas consumption to clock 10% CAGR (10mmscmd) over the next 3 years.
Exhibit 50: Sharp growth in CGD gas consumption Exhibit 51: New CGD rounds to drive growth in gas consumption, post 2022
Source: MOPNG RSec Research Source: MOPNG RSec Research
GAIL (India) Ltd.Initiating Coverage | India
Institutional Equity Research
17
CMP* (Rs) 336
Upside/ (Downside) (%) 14
Bloomberg Ticker GAIL IN
BUYTarget Price: Rs382
Gas Consumption to Revive if Domestic Gas is AllocatedIndia has 25GW of installed gas-based power capacity, most of which are built in anticipation of supplies of low-cost gas from domestic gas fields. Out of 25GW, current utilisation stands at only 25% PLF. Most projects have been affected due to non-availability of gas from domestic fields at right price. The power plants are unlikely to consume more LNG gas at higher price-points, and can consume more gas if cheap domestic gas allocated to them. Lower power tariff is attributable to oversupply of coal-based power supply. We believe gas-based power plants continue to rely on low-cost domestic gas. In low spot LNG price environment, we have seen revival of LNG demand from the power sector. While domestically produced gas cost lead to relatively lower average merchant power tariff, power generated using imported gas is likely to cost significantly more, even excluding the fixed operating cost of the power plant
Exhibit 52: Gas based power plant PLF (utilisation) Exhibit 53: Gas consumption by India’s power sectors (monthly)
Source: MOPNG RSec Research Source: MOPNG RSec Research
Refineries have consumed more gas but outlook steadyRefineries have been the large incremental buyers of natural gas in India. Their consumption has increased by four-fold 18mmscmd in FY18 (from 4mmscmd in FY11) driven by conversion of more refining facilities to use gas and increasing complexities of Indian refiners. In the near-term, MRPL and OMPL are expected to start consumption of ~2mmscmd LNG after commissioning of Kochi-Mangalore pipeline. As the production of BS-VI fuel requires higher energy consumption, gas consumption is likely to go up for the refineries. In the Medium-term commissioning of large pet-coke gasifier plant can replace up to 8.5mmscmd of LNG demand. This fall in LNG demand is likely at Shell Hazira terminal and GSPL is transmitting LNG to pet-coke project. Theoretically, it should not affect either GAIL or Petronet LNG.
Exhibit 54: Indian refineries gas consumption outlook
Source: MOPNG RSec Research
GAIL (India) Ltd.Initiating Coverage | India
Institutional Equity Research
18
CMP* (Rs) 336
Upside/ (Downside) (%) 14
Bloomberg Ticker GAIL IN
BUYTarget Price: Rs382
Exhibit 55: India’s Petrochemical plants and gas consumptionPlant Company Capacity (KTPA) Startup Feed Gas demand (mmscm)
Dibrugarh BCPL 220 2016 Dual feed 176
Pata GAIL 410 2016 Gas 414
Dahej OPAL 1,040 2019 Dual feed 263
Jamnagar RIL 1,350 2018 Off-gases NA
Hazira RIL 750 2018 Gas 379
Kakinada GAIL/HPCL 1,000 2023 Gas 505
West coast refinery HPCL/IOCL/BPCL 2025 NA NA
Bhatinda HMEL 1,250 2022 Gas 252
Source: MOPNG RSec Research
Petrochemicals to Consume more Gas despite no Gas-based Capacity Addition: Though no gas-based petrochemical plants planned in India in the near-term, the gas consumption is expected to rise. OPAL’s Dahej mixed feed ethylene cracker can start consumption of ethane from Petronet LNG terminal.
GAIL (India) Ltd.Initiating Coverage | India
Institutional Equity Research
19
CMP* (Rs) 336
Upside/ (Downside) (%) 14
Bloomberg Ticker GAIL IN
BUYTarget Price: Rs382
Company OverviewGAIL (India) Ltd. is India’s largest natural gas midstream company having presence across the gas value chain.
Natural Gas Transmission: GAIL owns and operates gas pipeline network of 11,410km with a capacity of 230mmscmd (62.4% of total India) and transmitted 107mmscmd in 9MFY19 with market share of 71% of total gas consumed in India.
LPG Transmission: GAIL has LPG pipeline network of 2,038km with a capacity of 3.8mmtpa (45.2% of total India).
Gas Trading: GAIL is the major gas marketing player in India with ~65% market share and one of the largest gas importers with long term import portfolio of ~24.6MMTPA. It owns 12.5% stakes in Petronet LNG and 25.5% stake in both Ratnagiri Gas & Power Limited and Konkan LNG Private Limited, which own 5 MMTPA Dabhol terminal.
Uncontracted US LNG – A Key Risk at Lower Oil Prices: GAIL has contracted 5.8MMTPA of LNG from the US from Cheniere Energy (3.5 MMTPA) and and Dominion’s Cove (2.3 MMTPA). LNG prices are indexed to US HH gas price (FOB price: 1.15x HH price + US$3/mmbtu fixed liquification charge, 15% of fixed fee subject to inflation adjustment). GAIL started receiving US LNG gas in Apr’18, when the oil prices were hovering above ~US$60/bbl level. At current oil price, GAIL can make sizeable trading margins on US LNG sale compared to spot LNG and RasGas LNG. Based on our model, US LNG is profitable if Brent oil >US$60/bbl.
Exhibit 56: Comparative gas prices and other fuels Exhibit 57: US LNG contracts profitable if Oil price >$60/bbl
Source: PPAC RSec Research Source: Bloomberg, RSec Research
10.0
8.6
4.3
10.4
12.4
8.7
-
2.0
4.0
6.0
8.0
10.0
12.0
14.0
LNG LT (RasGas)
LNG Spot Domestic Gas Fuel Oil Naphtha US LNG
$/mmbtu
GAIL’s Gas Customers – Fertiliser (34%), Power (27%) and CGD (16%) PlayersGAIL markets both domestic and imported gas in India. Fertiliser (34%) leads in terms of gas consumption followed by power (27%) and CGD (16%) in FY18. Power sector accounted for ~ 36% of the total domestic gas marketed by GAIL in FY18. Reallocation of domestic gas by the government led to removal of petrochemical and increased consumption of CGD (13% CAGR over FY15 toFY18).
LPG & Other Liquid Hydrocarbons (OHC): Six gas processing plants, which produce LPG, Propane, Pentane and Naphtha etc. of ~1.3MMTPA capacity. Earnings are leveraged to oil prices (LPG prices linked to oil), while feedstock gas comes from the domestic sources at cheaper rates. GAIL shared a subsidy burden of Rs10bn in FY15, which it ceased to do so now.
GAIL (India) Ltd.Initiating Coverage | India
Institutional Equity Research
20
CMP* (Rs) 336
Upside/ (Downside) (%) 14
Bloomberg Ticker GAIL IN
BUYTarget Price: Rs382
Petrochemical: Plant in Pata (UP) with capacity of 0.81 MMTPA + 0.28MMTPA in BCPL (GAIL has 70% share in BCPL). GAIL holds 49.21% stake in ONGC Petro -additions Ltd. (1.4 MMTPA) at Dahej.
City Gas Distribution (CGD): GAIL holds 100% stake in GAIL Gas, 22.5% in IGL (NCR) and 32.5% stake in MGL (Mumbai). It has also set up several JVs in various cities, which are now ramping-up their sales volume.
E&P – Myanmar, US Shale & Domestic GAIL’s upstream portfolio includes participation in 10 blocks – 8 in India and 2 in Myanmar. 2 blocks in Myanmar are currently producing are under appraisal, the company is operator in one on land block viz. CB-ONN-2010/11 in the Cambay basin, while others are under exploration.
A1/A3 Field in Myanmar – At or Near Peak Production GAIL has non-operating interest of 8.5% in A-1 and A-3 blocks in Myanmar. It started production at A-3 and A1 blocks in Jul’13 and Jan’14, respectively. Dewoo International is operator with 51% stake, while ONGC holds 17% share. Domestic market is entitled to 20% total gas production, while 80% is exported to China. Gas price is indexed to 2% sulphur fuel oil price, the US consumer price index and US oilfield Machinery and tool index. GAIL’s 8.5% stake can be worth ~xxmn, as per Bloomberg estimate.
Reliance Securities Limited (RSL), the broking arm of Reliance Capital is one of the India’s leading retail broking houses. Reliance Capital is amongst India’s leading and most valuable
financial services companies in the private sector. Reliance Capital has interests in asset management and mutual funds, life and general insurance, commercial finance, equities and
commodities broking, wealth management services, distribution of financial products, private equity, asset reconstruction, proprietary investments and other activities in financial services.
The list of associates of RSL is available on the website www.reliancecapital.co.in. RSL is registered as a Research Analyst under SEBI (Research Analyst) Regulations, 2014
General Disclaimers: This Research Report (hereinafter called ‘Report’) is prepared and distributed by RSL for information purposes only. The recommendations, if any, made herein are
expression of views and/or opinions and should not be deemed or construed to be neither advice for the purpose of purchase or sale of any security, derivatives or any other security
through RSL nor any solicitation or offering of any investment /trading opportunity on behalf of the issuer(s) of the respective security(ies) referred to herein. These information / opinions /
views are not meant to serve as a professional investment guide for the readers. No action is solicited based upon the information provided herein. Recipients of this Report should rely
on information/data arising out of their own investigations. Readers are advised to seek independent professional advice and arrive at an informed trading/investment decision before
executing any trades or making any investments. This Report has been prepared on the basis of publicly available information, internally developed data and other sources believed by
RSL to be reliable. RSL or its directors, employees, affiliates or representatives do not assume any responsibility for, or warrant the accuracy, completeness, adequacy and reliability of such
information / opinions / views. While due care has been taken to ensure that the disclosures and opinions given are fair and reasonable, none of the directors, employees, affiliates or
representatives of RSL shall be liable for any direct, indirect, special, incidental, consequential, punitive or exemplary damages, including lost profits arising in any way whatsoever from the
information / opinions / views contained in this Report.
Risks: Trading and investment in securities are subject to market risks. There are no assurances or guarantees that the objectives of any of trading / investment in securities will be achieved.
The trades/ investments referred to herein may not be suitable to all categories of traders/investors. The names of securities mentioned herein do not in any manner indicate their prospects
or returns. The value of securities referred to herein may be adversely affected by the performance or otherwise of the respective issuer companies, changes in the market conditions,
micro and macro factors and forces affecting capital markets like interest rate risk, credit risk, liquidity risk and reinvestment risk. Derivative products may also be affected by various risks
including but not limited to counter party risk, market risk, valuation risk, liquidity risk and other risks. Besides the price of the underlying asset, volatility, tenor and interest rates may affect
the pricing of derivatives.
Disclaimers in respect of jurisdiction: The possession, circulation and/or distribution of this Report may be restricted or regulated in certain jurisdictions by appropriate laws. No action
has been or will be taken by RSL in any jurisdiction (other than India), where any action for such purpose(s) is required. Accordingly, this Report shall not be possessed, circulated and/
or distributed in any such country or jurisdiction unless such action is in compliance with all applicable laws and regulations of such country or jurisdiction. RSL requires such recipient to
inform himself about and to observe any restrictions at his own expense, without any liability to RSL. Any dispute arising out of this Report shall be subject to the exclusive jurisdiction of the
Courts in India.
Disclosure of Interest: The research analysts who have prepared this Report hereby certify that the views /opinions expressed in this Report are their personal independent views/opinions
in respect of the securities and their respective issuers. None of RSL, research analysts, or their relatives had any known direct /indirect material conflict of interest including any long/short
position(s) in any specific security on which views/opinions have been made in this Report, during its preparation. RSL’s Associates may have other potential/material conflict of interest
with respect to any recommendation and related information and opinions at the time of publication of research report. RSL, its Associates, the research analysts, or their relatives might
have financial interest in the issuer company(ies) of the said securities. RSL or its Associates may have received a compensation from the said issuer company(ies) in last 12 months for the
brokerage or non brokerage services.RSL, its Associates, the research analysts or their relatives have not received any compensation or other benefits directly or indirectly from the said
issuer company(ies) or any third party in last 12 months in any respect whatsoever for preparation of this report.
The research analysts has served as an officer, director or employee of the said issuer company(ies)?: No
RSL, its Associates, the research analysts or their relatives holds ownership of 1% or more, in respect of the said issuer company(ies).?: No
Copyright: The copyright in this Report belongs exclusively to RSL. This Report shall only be read by those persons to whom it has been delivered. No reprinting, reproduction, copying,
distribution of this Report in any manner whatsoever, in whole or in part, is permitted without the prior express written consent of RSL.
RSL’s activities were neither suspended nor have defaulted with any stock exchange with whom RSL is registered. Further, there does not exist any material adverse order/judgments/
strictures assessed by any regulatory, government or public authority or agency or any law enforcing agency in last three years. Further, there does not exist any material enquiry of
whatsoever nature instituted or pending against RSL as on the date of this Report.
Important These disclaimers, risks and other disclosures must be read in conjunction with the information / opinions / views of which they form part of.
RSL CIN: U65990MH2005PLC154052. SEBI registration no. (Stock Broker: INZ000172433, Depository Participants: CDSL IN-DP-257-2016 IN-DP-NSDL-363-2013, Research Analyst:
INH000002384); AMFI ARN No.29889.
Rating GuidesRating Expected absolute returns (%) over 12 monthsBUY >10%