49

• The information contained in this presentation, including all forward-looking statements, is subject to change without notice, whether as a result of new information, future events or otherwise, and Test-Rite Int’l Ltd. (the “Company”) undertakes no obligation to update or revise the information contained in this presentation.
• Actual results may differ materially from those expressed or implied in these forward-looking statements and no representation or warranty, either expressed or implied, is provided in relation to the accuracy, completeness or reliability of the information contained herein, nor is the information intended to be a complete statement of the Company, markets or developments referred to in this presentation.
• Beginning on January 1, 2013, the Company has adopted International Financial Reporting Standards (IFRS) as issued by International Accounting Standards Board and endorsed by ROC Financial Supervisory Commission (FSC). Reporting for our annual and interim consolidated financial statements follow Taiwan IFRS requirements, however, given that there exist material differences between Taiwan IFRS and generally accepted accounting principle in the Republic of China (ROC GAAP), selected comparison of financial results in 2013 may have material differences versus previously released financial information under ROC GAAP. 1
Legal Disclaimer

• Group Introduction………………………………3
• Financial Highlights 1H14…………………..…7
• Retail Sector………………………….…………...16
• Trading Sector……………………...…………….27
• Appendix………………………….…...…………..39
Index
2

Tony Ho, Group Chairman; Co Founder of Test-Rite Group. Tony played a critical role in Test-Rite’s expansion into retail business and was instrumental in leading the company’s IPO efforts. Tony recently completed the two-year Joint Executive MBA Program between Taiwan University and Fudan University and is currently working on his graduation thesis: “How to pursue further growth by organization transformation-take large retail group for example.”
Judy Lee, Chairwoman, Test-Rite Int’l (2908 TT/2908 TW); Co Founder of Test-Rite Group. Best know as the “Queen of Hardline”, Judy is a seasoned veteran of the import/export trading business. With Judy at the helm, Test-Rite Trading consistently provides outstanding services to retail customers globally and has received multiple recognitions as “Best Partner/Supplier”.
Sophia Tong, Group CEO. Sophia joined Test-Rite in March 2009 to lead both Trading and Retail businesses. Prior to Test-Rite Sophia was the General Manager of IBM Taiwan from 2006 to 2009 and the Director of China Banking Cluster for IBM Greater China Group. Sophia was previously with IBM for over 25 years.
Key Management Team
3

Note: store numbers updated on July 31th , 2014 4
Group Structure
HOLA Taiwan (23)
Test Rite Retail Business Group
(1H14 Revenue: NTD$ 10.5 bn)
Test Rite Trading Business Group
(1H14 Shipment Value: NTD$ 9.29 bn)
Hardline & Auto
Home Improvement
Mattresses & Bedding
Comprehensive home integration services
HOLA特力和樂
TLW 特力屋 (26)、 特力屋PLUS宅修便利購 (3)
HOLA CASA 和樂名品傢俱 (21)、HOLA Petite(10) WEDGWOOD(11)、FRETTE(6)
TR Home Service、DÉCOR House
HOLA China (35) Home Furnishing
Bath & Storage Seasonal
Stationery
Agency
Home decoration
Hand tools, Hardware, Auto accessories, Auto parts, New business development
Storage, Bathroom products, Suitcase, Traveling utilities
Indoor furniture, Office supplies , Stationery, PC peripherals
Consumer electronics, Lighting, Kitchenware, Decoration, Christmas decoration, Sport equipments
Outdoor furniture, BBQ rack/hearth, Gardening, North-East Asia projects
Taiwan
Market deployment Market deployment
China America
Europe
New Zealand & Australia
Southeast Asia
India
Other spin-off investments
Creative Design/ Product Development
Theme Trend & Product Concept; Product Design;; VI & Graphic Design;
Packaging& Purchasing
Chung Cin Corp.
Shopping mall construction; Office building construction; Booth
recruitment
China Taiwan
USA Europe
Logistics/ warehousing services
Brand licensing
Crete&Barrel
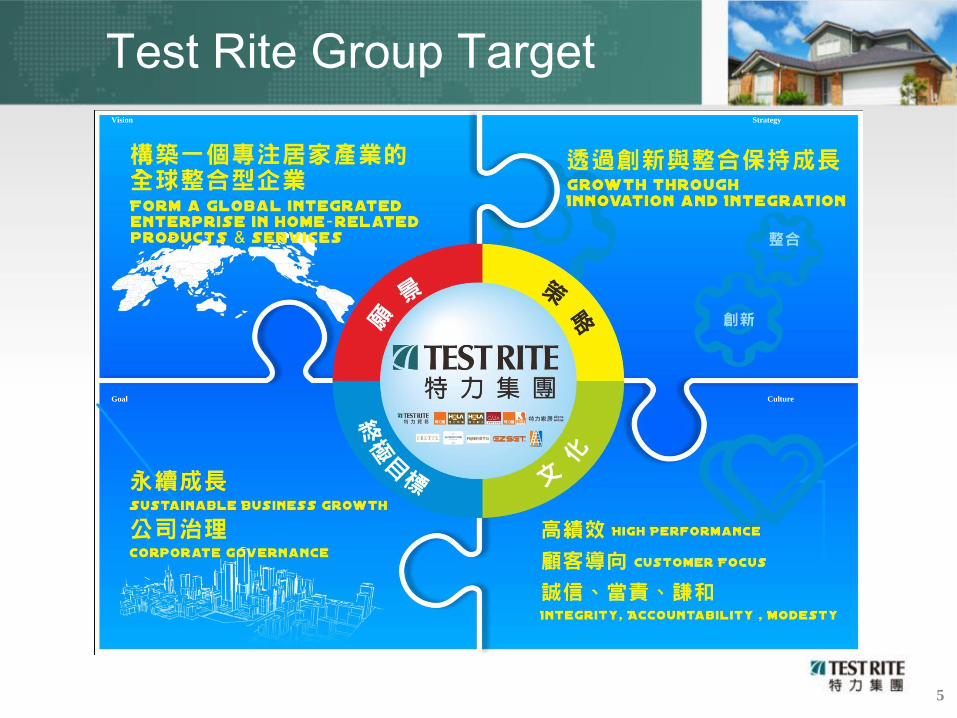
Test Rite Group Target Vision Strategy
Culture Goal
5
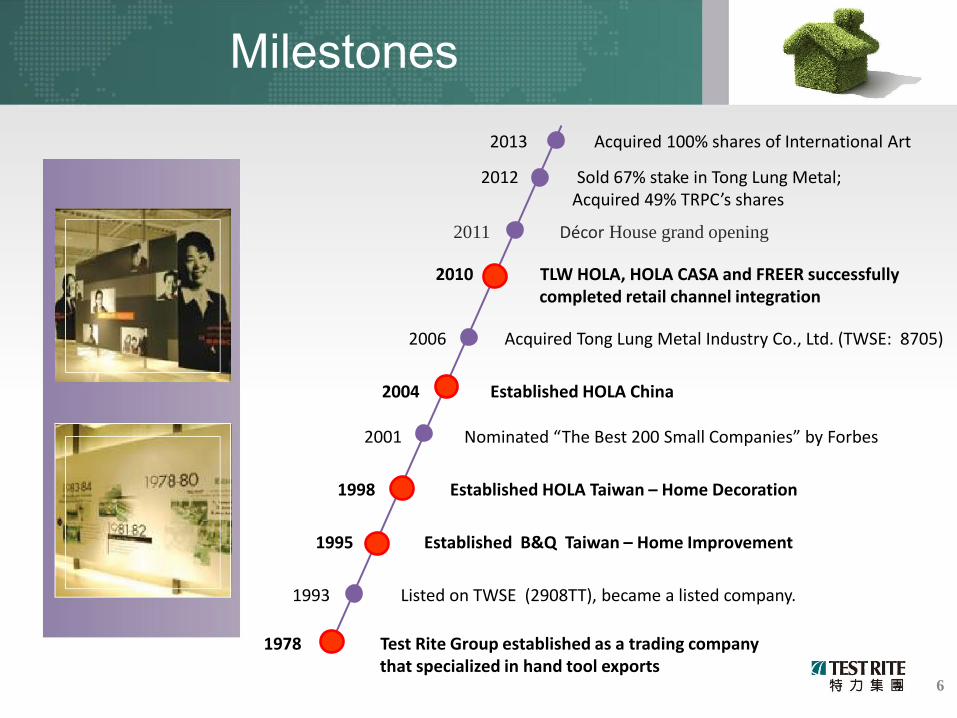
2011 Décor House grand opening
2004 Established HOLA China
2006 Acquired Tong Lung Metal Industry Co., Ltd. (TWSE: 8705)
2010 TLW HOLA, HOLA CASA and FREER successfully completed retail channel integration
1978 Test Rite Group established as a trading company that specialized in hand tool exports
1993 Listed on TWSE (2908TT), became a listed company.
1995 Established B&Q Taiwan – Home Improvement
1998 Established HOLA Taiwan – Home Decoration
2001 Nominated “The Best 200 Small Companies” by Forbes
2012 Sold 67% stake in Tong Lung Metal; Acquired 49% TRPC’s shares
Milestones
2013 Acquired 100% shares of International Art
6
FINANCIAL HIGHTLIGHT IN 1H14
7

• Taiwan retail businesses net profit soared 64.3% to NT$ 85.5 mn in 2Q14, driven by continued improvement in both average sales per ticket and margin expansion
• Gross margin of Taiwan retail business increased 0.4 ppt in 2Q14, which was attributable to higher sales contribution from private label products, particularly for Hola Taiwan
• Opened 2 HOLA stores in April 2014 (Suzhou and Chengdu, China)
• Opened 1 HOLA store in May 2014 (Hualien, TW)
• Opened online store on T-mall in June, 2014
• Gain new agency customer - Fred’s
• Sign a franchise agreement with Crate&Barrel, expect to open new store before year end of 2015
1H14 Highlights
8
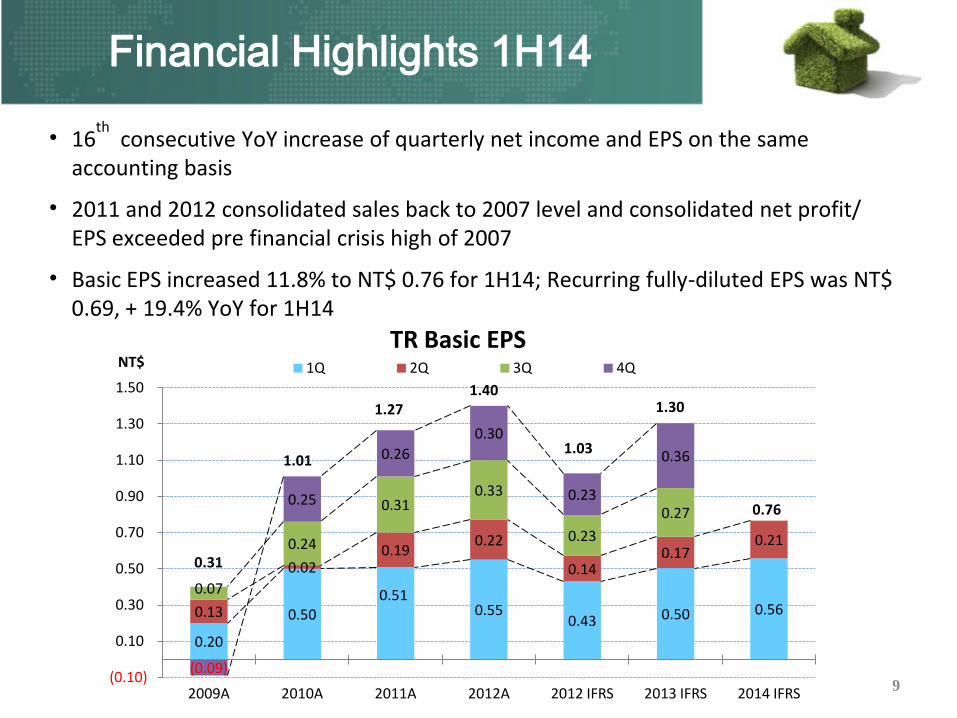
• 16th
consecutive YoY increase of quarterly net income and EPS on the same accounting basis
• 2011 and 2012 consolidated sales back to 2007 level and consolidated net profit/ EPS exceeded pre financial crisis high of 2007
• Basic EPS increased 11.8% to NT$ 0.76 for 1H14; Recurring fully-diluted EPS was NT$ 0.69, + 19.4% YoY for 1H14
Financial Highlights 1H14
0.20
0.50 0.51
0.55 0.43 0.50 0.56 0.13
0.02 0.19
0.22
0.14 0.17
0.21
0.07
0.24
0.31 0.33
0.23
0.27
(0.09)
0.25
0.26
0.30
0.23
0.36
(0.10)
0.10
0.30
0.50
0.70
0.90
1.10
1.30
1.50
2009A 2010A 2011A 2012A 2012 IFRS 2013 IFRS 2014 IFRS
NT$ TR Basic EPS
1Q 2Q 3Q 4Q
0.31
1.01
1.27 1.40
1.03
1.30
0.76
9

10
Financial Highlights 1H14
• Consolidated sales was NT$ 17.9 bn, increased 2.6% YoY for 1H14, and consolidated net profit increased by 13.5% YoY to NT$ 374.6 mn for 1H14
• The catalyst for earnings growth can be attributed to loss reduction in China retail operation and the strong shipments driven by improving demand from retailers in North America and Europe
29.0 32.6
35.9 35.2 35.3 35.2
17.5 17.9
136.8
486.8
636.1 689.5
509.2
635.1
329.9 374.6
0
100
200
300
400
500
600
700
800
0
5
10
15
20
25
30
35
40
2009A 2010A 2011A 2012A 2012AIFRS
2013AIFRS
1H13IFRS
1H14IFRS
NT$mnNT$bn
TR Group Sales & ProfitSales(LHS) Net profit(RHS)
TLM33.3

11
Financial Highlights 1H14
• ROE continues to improve since 2009, mainly driven by higher margin and falling net debt ratio
• The decreased in net debt ratio is the result of
– Disposal of Tong Lung Metal
– Reduction of working capital
182
832 727
425
577
285
137
487
636 690
509 635
330 375 3.5%
15.1%
11.3%
5.6%
7.1%
4.0%
2.2%
7.4%
9.1% 9.9%
7.3%
9.5%
7.8%
10.1%
0.0%
2.0%
4.0%
6.0%
8.0%
10.0%
12.0%
14.0%
16.0%
18.0%
-
100
200
300
400
500
600
700
800
900
2003 2004 2005 2006 2007 2008 2009 2010 2011 2012 2012 IFRS
2013 IFRS
1H13 IFRS
1H14 IFRS
NTD$mn
TR Group ROE & Net profit
Net profit ROE
*ROE is defined as Net income/Average shareholders equity; for the trailing 4-quarters

12
Financial Highlights 1H14
• The decline in working capital is the result of inventory control and payment extension in both trading (30 to 90 days) and retail (90 to 120 days)
• CCC shortened to 26.8 days in 2013, and 21.2 days in 1H14
• Net debt ratio decreased 40.1 ppt to 73.8% from 2011 to 2013. Interest expense decreased by 29.9% in 2013 versus 20111
NT$ bn 2010A 2011A 2012A 2013A 1H13A 1H14A Accounts receivables 2,186.4 2,961.8 2,413.5 2,759.4 2,864.6 3,130.3
Inventory 4,735.7 5,928.5 4,840.9 5,154.3 4,243.6 4,748.5
Accounts payable 3,212.7 4,471.9 4,531.4 5,467.0 4,735.1 5,550.0
Working Capital 3,709.4 4,418.4 2,723.0 2,446.7 2,373.1 2,328.8
YoY% 19.1% -38.4% -10.1% -1.9%
(40.4) (56.0) (66.6) (66.1) (74.2) (66.2) (73.8)
58.4 77.7 79.7 79.1 74.2 68.6 64.5
21.3 26.2 27.8 27.8 26.8 33.2 30.5
39.3 47.9 40.9 40.8 26.8 35.6 21.2
-100
-50
0
50
100
150
2010 2011 2012 2012 IFRS 2013 IFRS 1H13 IFRS 1H14 IFRS
TR Group Cash Conversion Cycle
AR Days
Inventory Days
AP Days

Test Rite Int’l Co., Ltd. (2908) Consolidated sales breakdown (IFRS Based)
13
2Q14 & 1H14 Consol. Revenue by BU
(NT$ ‘000) 2Q13A 2Q14A YoY% 1H13A 1H14A YoY%
Trading sales 3,364.7 3,406.0 1.2% 6,358.0 6,660.4 4.8%
Taiwan retail sales 3,912.6 4,163.3 6.4% 8,403.2 8,546.8 1.7%
HOLA China sales 871.9 906.6 4.0% 1,901.1 1,959.5 3.1%
Total retail sales 4,784.5 5,069.9 6.0% 10,304.3 10,506.3 2.0%
Other sales 453.0 401.2 -11.4% 808.7 762.9 -5.7%
Consolidated Sales 8,602.1 8,877.1 3.2% 17,471.0 17,929.6 2.6%
• Consolidated sales for 1H14 totaled NT$ 17.9 bn, increased 2.6% YoY
• Sales growth can be attributed to higher sales per ticket and new store openings in Taiwan and China, as well as strong shipments from our agency business, driven by improving demand from global retailers in Europe and North America
14
Consolidated Sales for Jan.- Aug. 2014
Consolidated Revenue (NT$ ‘000) 2013 2014 YoY % chg Accumulated trading sales 8,533,363 8,849,103 3.7%
Accumulated Taiwan retail sales 11,126,462 11,490,934 3.3%
Accumulated HOLA China sales 2,481,767 2,580,913 4.0%
Accumulated total retail sales 13,608,228 14,071,847 3.4%
Accumulated other sales 965,028 900,654 -6.7%
Accumulated consolidated Sales 23,106,619 23,821,603 3.1%
Revenue (NT$ '000) 2013 2014 YoY % chg Accumulated shipments- Principal trading 8,381,063 8,666,508 3.4%
Accumulated shipments- Agency 3,304,318 4,044,951 22.4%
Accumulated shipments 11,685,381 12,711,459 8.8%
Accumulated commission revenue 28,742 31,505 9.6%
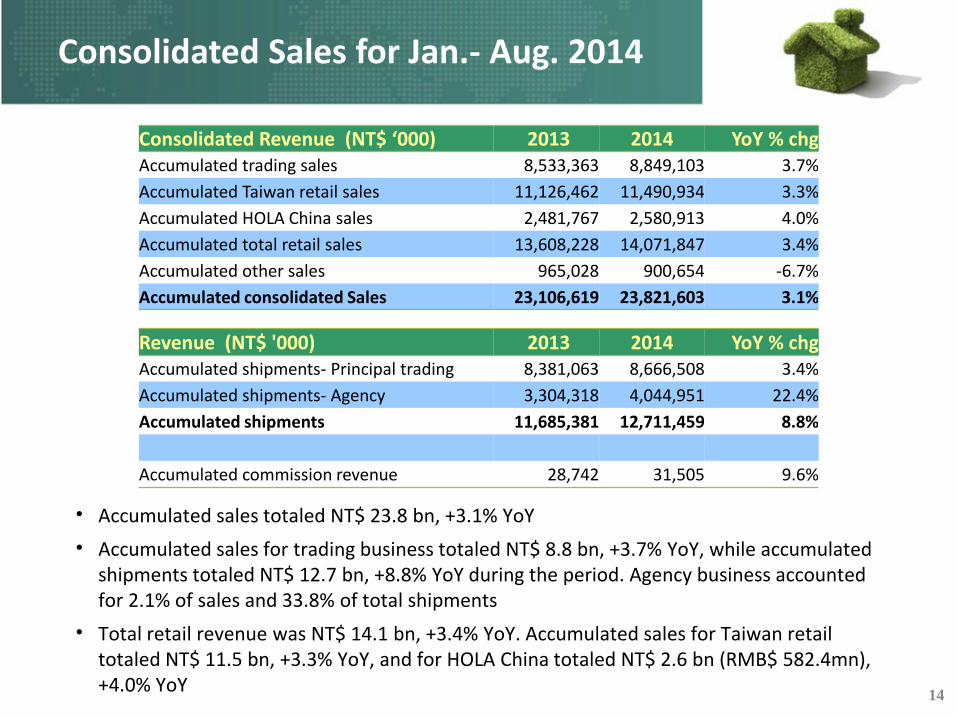
• Accumulated sales totaled NT$ 23.8 bn, +3.1% YoY
• Accumulated sales for trading business totaled NT$ 8.8 bn, +3.7% YoY, while accumulated shipments totaled NT$ 12.7 bn, +8.8% YoY during the period. Agency business accounted for 2.1% of sales and 33.8% of total shipments
• Total retail revenue was NT$ 14.1 bn, +3.4% YoY. Accumulated sales for Taiwan retail totaled NT$ 11.5 bn, +3.3% YoY, and for HOLA China totaled NT$ 2.6 bn (RMB$ 582.4mn), +4.0% YoY

15
2014 Guidance
Trading Business – Expect total shipment to see 6~10% growth
TW Retail Business – Expect sales growth of 3~7%
– Plan to open 2~4 new TLW and HOLA stores respectively
HOLA China – Expect sales growth of 4~10%
– Target breakeven in 2014
– Opened 2 new stores in April 2014
– Plan to open 2~4 new stores in 4Q14 (2 will be opened during the end of December to the beginning of January)

RETAIL SECTOR 零售事業
16

17
Taiwan Retail Business Strategy
TLW 特力屋
Alternate DIY channel services (TLW Plus and TLW 好幫手)
Open TLW Plus targeting neighborhood market
HOLA TW
Open 1-2 stores per year
Develop small HOLA stores “ HOLA Petite”
Revitalize HOLA TW brand
Develop private labels and private brands
Driven by style and fashion
Establish Omni-channel platform

TW Retail Business update
Store Locations
HOLA TW:
• No. 1 home décor chain in Taiwan with totaled 23 stores; open small HOLA stores named “ HOLA Petite” totaled 10 stores.
• Add 1 store in Jan. 2013 (Sanxia), and +1 store in May 2014 (Hualien)
• Revenue totaled NT$ 1.39 bn, 10.4%YoY for 2Q14 and totaled NT$ 2.97 bn, +6.7%YoY for 1H14
• P/L as a % of sales increased 6.7 ppt to 12.3% in 1H14, GM% improved by 0.9 ppt to 51.9% in 1H14
HOLA
TLW
18
TLW:
• Leading DIY player with ~30% market share and new business opportunities with TLW Plus and TLW 好幫手
• +1 store in Jan. 2013 (Sanxia), and +1 store in Sep. 2013 (Taichung), totaled 26 stores
• Revenue totaled NT$ 2.78 bn, +4.5%YoY for 2Q14 and totaled NT$ 5.58bn, -0.8%YoY for 1H14
TW Retail Business update
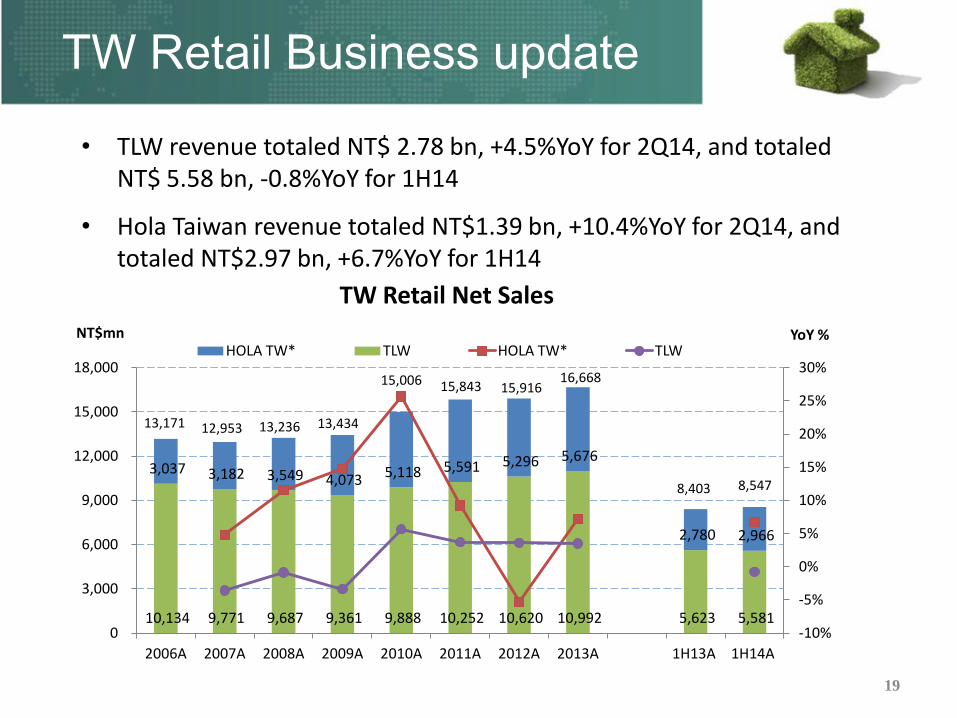
• TLW revenue totaled NT$ 2.78 bn, +4.5%YoY for 2Q14, and totaled NT$ 5.58 bn, -0.8%YoY for 1H14
• Hola Taiwan revenue totaled NT$1.39 bn, +10.4%YoY for 2Q14, and totaled NT$2.97 bn, +6.7%YoY for 1H14
19
10,134 9,771 9,687 9,361 9,888 10,252 10,620 10,992 5,623 5,581
3,037 3,182 3,549 4,073 5,118 5,591 5,296 5,676
2,780 2,966
-10%
-5%
0%
5%
10%
15%
20%
25%
30%
0
3,000
6,000
9,000
12,000
15,000
18,000
2006A 2007A 2008A 2009A 2010A 2011A 2012A 2013A 1H13A 1H14A
YoY % NT$mn
TW Retail Net Sales
HOLA TW* TLW HOLA TW* TLW
13,171 12,953
15,843 15,916 15,006
13,434 13,236
16,668
8,403 8,547
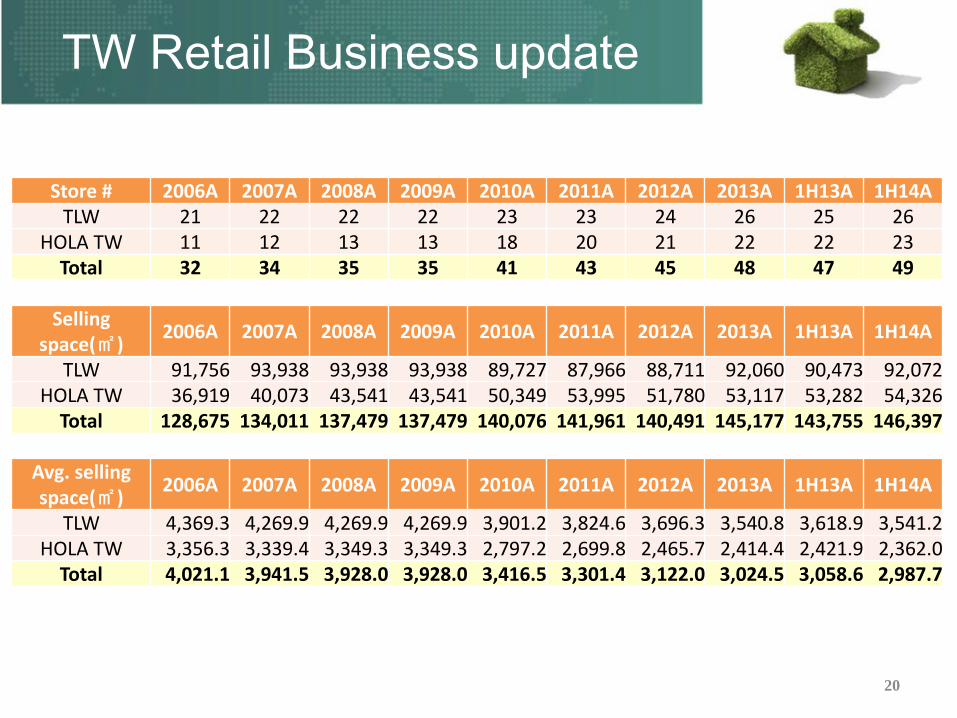
Store # 2006A 2007A 2008A 2009A 2010A 2011A 2012A 2013A 1H13A 1H14A TLW 21 22 22 22 23 23 24 26 25 26
HOLA TW 11 12 13 13 18 20 21 22 22 23 Total 32 34 35 35 41 43 45 48 47 49
Selling space(㎡)
2006A 2007A 2008A 2009A 2010A 2011A 2012A 2013A 1H13A 1H14A
TLW 91,756 93,938 93,938 93,938 89,727 87,966 88,711 92,060 90,473 92,072 HOLA TW 36,919 40,073 43,541 43,541 50,349 53,995 51,780 53,117 53,282 54,326
Total 128,675 134,011 137,479 137,479 140,076 141,961 140,491 145,177 143,755 146,397
Avg. selling space(㎡)
2006A 2007A 2008A 2009A 2010A 2011A 2012A 2013A 1H13A 1H14A
TLW 4,369.3 4,269.9 4,269.9 4,269.9 3,901.2 3,824.6 3,696.3 3,540.8 3,618.9 3,541.2 HOLA TW 3,356.3 3,339.4 3,349.3 3,349.3 2,797.2 2,699.8 2,465.7 2,414.4 2,421.9 2,362.0
Total 4,021.1 3,941.5 3,928.0 3,928.0 3,416.5 3,301.4 3,122.0 3,024.5 3,058.6 2,987.7
TW Retail Business update
20
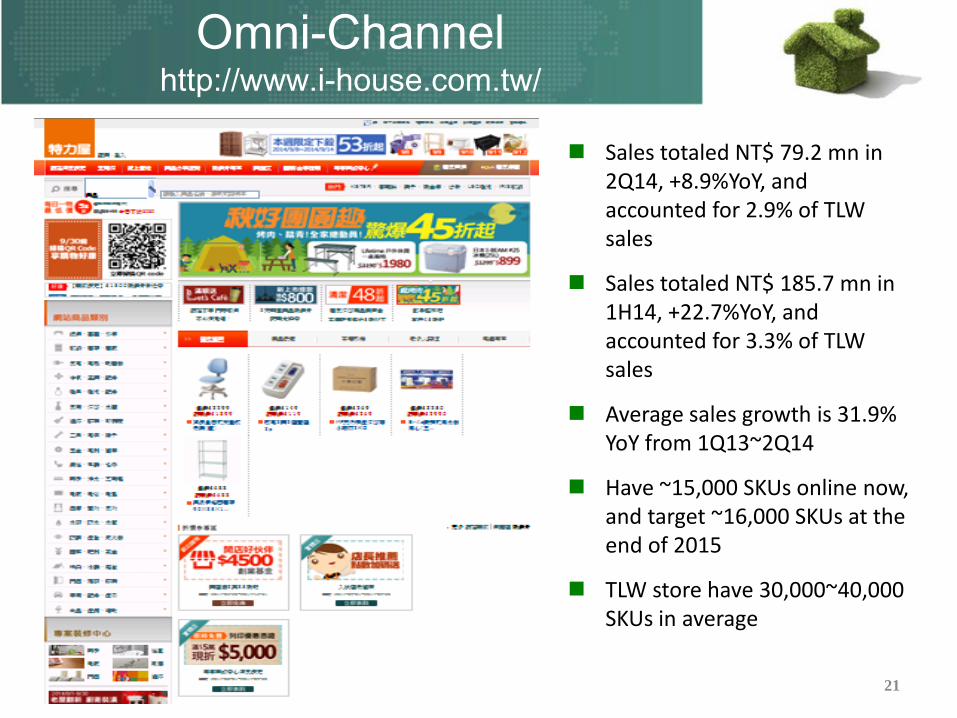
Sales totaled NT$ 79.2 mn in 2Q14, +8.9%YoY, and accounted for 2.9% of TLW sales
Sales totaled NT$ 185.7 mn in 1H14, +22.7%YoY, and accounted for 3.3% of TLW sales
Average sales growth is 31.9% YoY from 1Q13~2Q14
Have ~15,000 SKUs online now, and target ~16,000 SKUs at the end of 2015
TLW store have 30,000~40,000 SKUs in average
21
Omni-Channel http://www.i-house.com.tw/
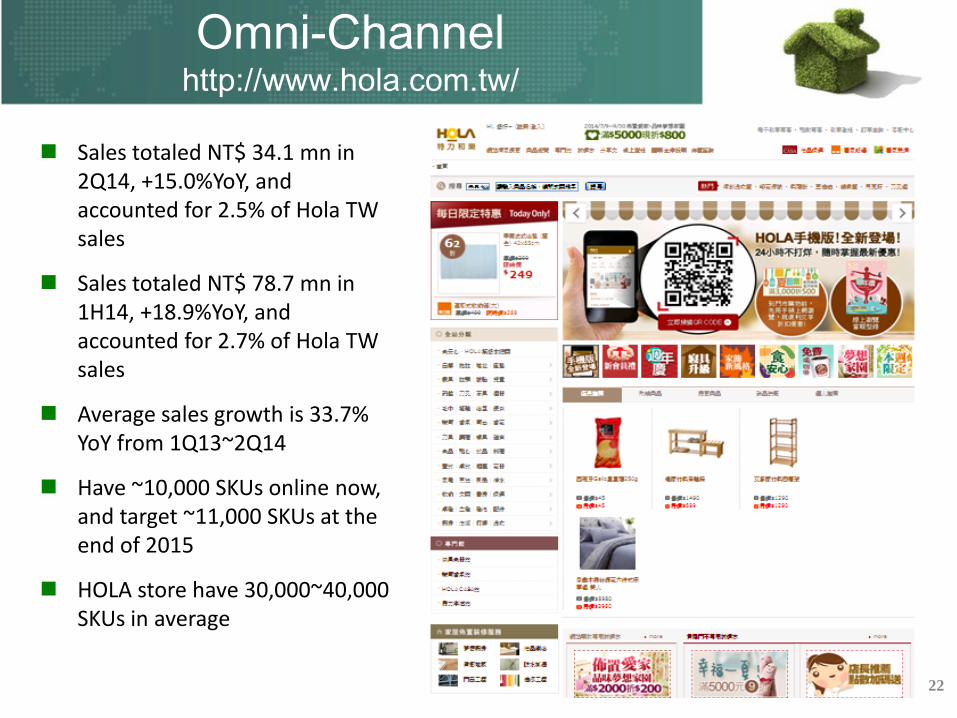
Sales totaled NT$ 34.1 mn in 2Q14, +15.0%YoY, and accounted for 2.5% of Hola TW sales
Sales totaled NT$ 78.7 mn in 1H14, +18.9%YoY, and accounted for 2.7% of Hola TW sales
Average sales growth is 33.7% YoY from 1Q13~2Q14
Have ~10,000 SKUs online now, and target ~11,000 SKUs at the end of 2015
HOLA store have 30,000~40,000 SKUs in average
22
Omni-Channel http://www.hola.com.tw/

HOLA CN Business Strategy
Turn profitable: single quarter/ annual
HOLA CN loss reduced 7.2% to NT$ 50.5 mn in 1H14 (1H13 loss of NT$ 54.4 mn)
Target breakeven in 2014 (FY2013 loss of NT$ 45.4 mn)
Plan to open 4 – 6 stores in 2014 (Already opened 2 in April)
Leverage Taiwan product design
Develop private labels and private brands, become a “Style Leader” as our target
Adjust operation strategy
store location、logistics、smart retail、Omni-channel
adjust store size and scale, target to set in shopping mall and department store
Upgrade our service
CRM、people and consultative selling and accountable corporate culture 23
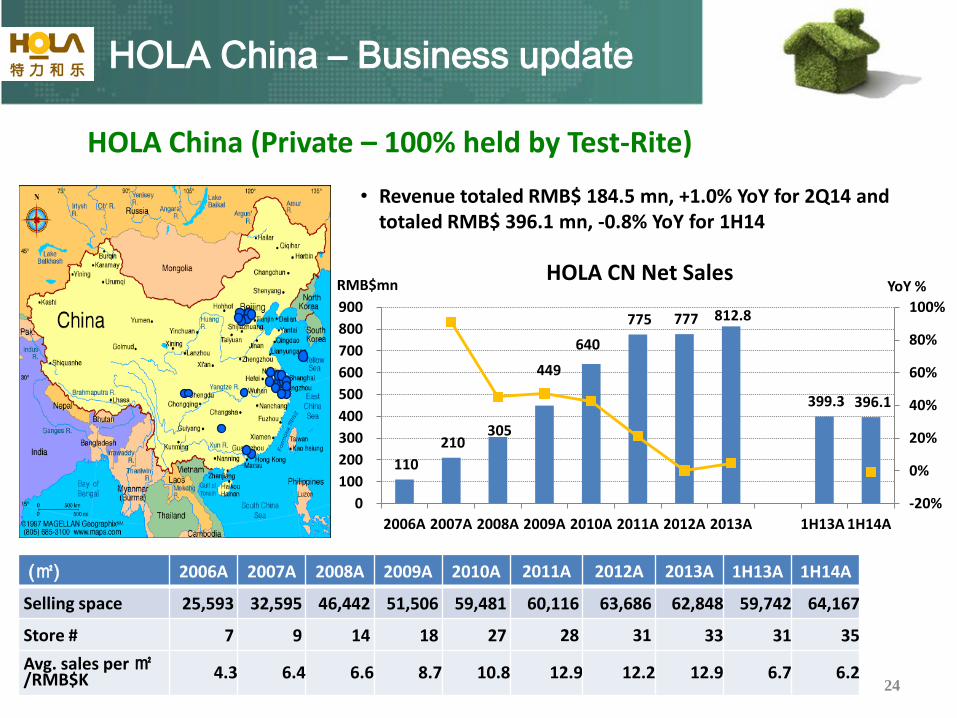
• Revenue totaled RMB$ 184.5 mn, +1.0% YoY for 2Q14 and totaled RMB$ 396.1 mn, -0.8% YoY for 1H14
HOLA China (Private – 100% held by Test-Rite)
HOLA China – Business update
(㎡) 2006A 2007A 2008A 2009A 2010A 2011A 2012A 2013A 1H13A 1H14A
Selling space 25,593 32,595 46,442 51,506 59,481 60,116 63,686 62,848 59,742 64,167
Store # 7 9 14 18 27 28 31 33 31 35
Avg. sales per ㎡/RMB$K 4.3 6.4 6.6 8.7 10.8 12.9 12.2 12.9 6.7 6.2
110
210 305
449
640
775 777 812.8
399.3 396.1
-20%
0%
20%
40%
60%
80%
100%
0
100
200
300
400
500
600
700
800
900
2006A 2007A 2008A 2009A 2010A 2011A 2012A 2013A 1H13A 1H14A
YoY % RMB$mn HOLA CN Net Sales
24

• Loss reduced by 7.2% YoY to net loss NT$ 50.5 mn for 1H14 , versus a loss of NT$ 54.4 mn in 1H13
• 18 out of 35 stores were at breakeven for 2Q14, versus 19 out of 31 stores in 2Q13
• Same-store-sales, calculated for stores opened for more than one year, was 4.8% for 2Q14 and 2.3% for 1H14
• Opened 2 new stores in Suzhou and Chengdu in April 2014, totaled 35 stores at the end of 2Q14
-246 -277
-208
-257
-165
-45.4 -54.4 -50.5
-300
-250
-200
-150
-100
-50
0
2008 2009 2010 2011 2012 2013 1H13 1H14
NT$mn HOLA China P&L Performance
10
6
3
11 10
6 4
11
14
10
15 17 17
19 20
24
19 18
0
5
10
15
20
25
30
1Q
10
2Q
10
3Q
10
4Q
10
1Q
11
2Q
11
3Q
11
4Q
11
1Q
12
2Q
12
3Q
12
4Q
12
1Q
13
2Q
13
3Q
13
4Q
13
1Q
14
2Q
14
HOLA CN Breakeven store numbers
25
HOLA China – Business update

Communicate promotional events and with customers by WeChat every week
Open online store on T-mall in June, 2014
August revenues totaled $66.3K RMB, +64.9%MoM, and accounted for 0.1% of sales
Have ~300 SKUs online now
Prepare to launch additional platform and micropayment services in 4Q14~1Q15
26
HOLA CN Omni-Channel http://holahome.taiwan.tmall.com/
TRADING SECTOR
27
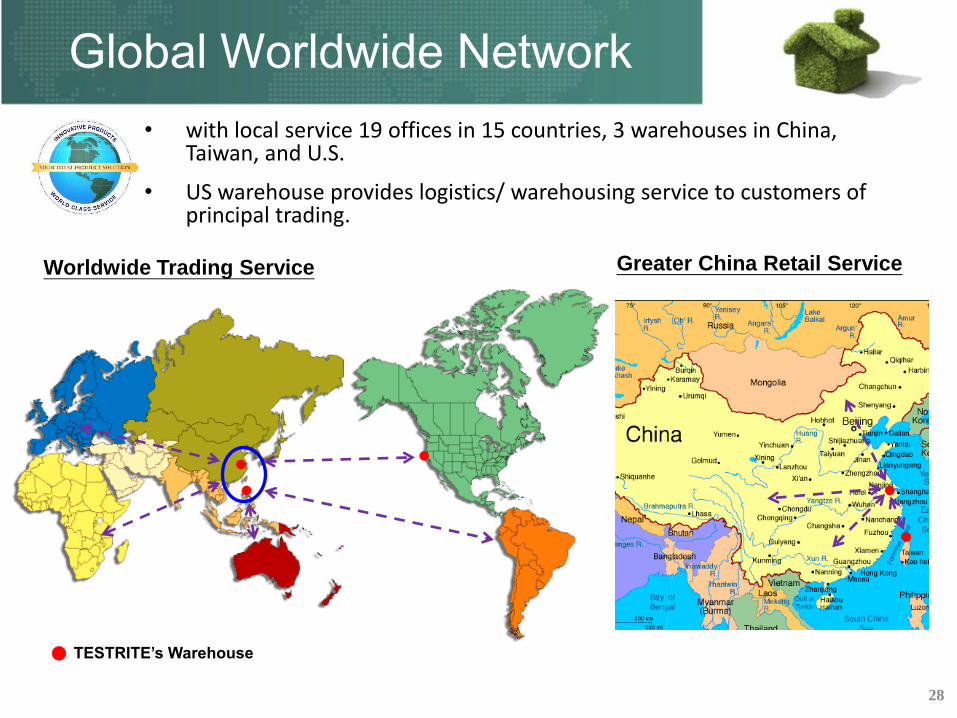
Global Worldwide Network
• with local service 19 offices in 15 countries, 3 warehouses in China, Taiwan, and U.S.
• US warehouse provides logistics/ warehousing service to customers of principal trading.
28
Greater China Retail Service
● TESTRITE’s Warehouse
●
●
Worldwide Trading Service
●
●
●

Trading Sourcing Ability
29
Solution Consolidation
Market Research
Product Sourcing
Product Design
& Development Packaging
Factory Audit/Quality Control
Fulfillment Management
After Service
Experienced global sourcing and partnership with renowned retailers
Offer end-to-end sourcing/logistics/warehousing solutions
Sourcing Solutions
Strategy of Trading Business
30
Develop push program and private label through new product design development
Focus on key customers
Expand agency business
Potential M & A
Integration
ASEAN and India resources office
SOP hub
Domestic sourcing team
Overseas operation
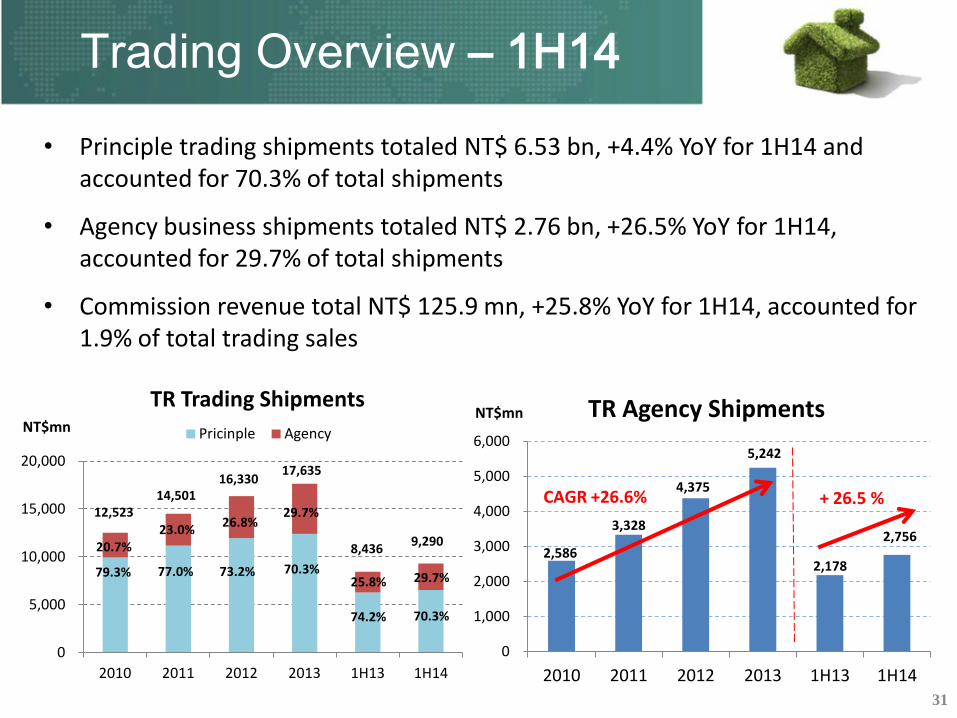
• Principle trading shipments totaled NT$ 6.53 bn, +4.4% YoY for 1H14 and accounted for 70.3% of total shipments
• Agency business shipments totaled NT$ 2.76 bn, +26.5% YoY for 1H14, accounted for 29.7% of total shipments
• Commission revenue total NT$ 125.9 mn, +25.8% YoY for 1H14, accounted for 1.9% of total trading sales
31
Trading Overview – 1H14
0
5,000
10,000
15,000
20,000
2010 2011 2012 2013 1H13 1H14
NT$mn
TR Trading Shipments
Pricinple Agency
79.3%
20.7% 23.0%
77.0%
26.8%
73.2%
29.7%
70.3%
12,523 14,501
16,330 17,635
25.8%
74.2%
8,436 9,290
29.7%
70.3%
2,586
3,328
4,375
5,242
2,178
2,756
0
1,000
2,000
3,000
4,000
5,000
6,000
2010 2011 2012 2013 1H13 1H14
NT$mn TR Agency Shipments
CAGR +26.6% + 26.5 %
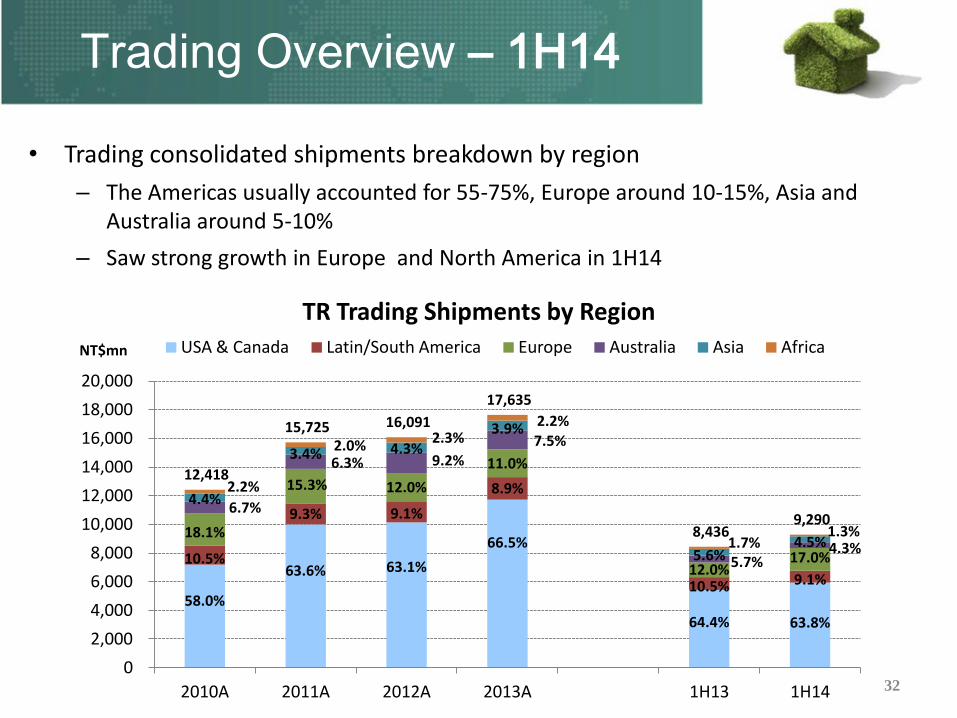
• Trading consolidated shipments breakdown by region
– The Americas usually accounted for 55-75%, Europe around 10-15%, Asia and Australia around 5-10%
– Saw strong growth in Europe and North America in 1H14
32
Trading Overview – 1H14
12,418
15,725 16,091
17,635
8,436 9,290
58.0%
63.6% 63.1%
66.5%
64.4% 63.8%
10.5%
9.3% 9.1%
8.9%
10.5% 9.1%
18.1%
15.3% 12.0%
11.0%
12.0% 17.0%
6.7%
6.3% 9.2% 7.5%
5.7% 4.3%
4.4%
3.4% 4.3%
3.9%
5.6% 4.5%
2.2%
2.0% 2.3% 2.2%
1.7% 1.3%
0
2,000
4,000
6,000
8,000
10,000
12,000
14,000
16,000
18,000
20,000
2010A 2011A 2012A 2013A 1H13 1H14
NT$mn
TR Trading Shipments by Region USA & Canada Latin/South America Europe Australia Asia Africa
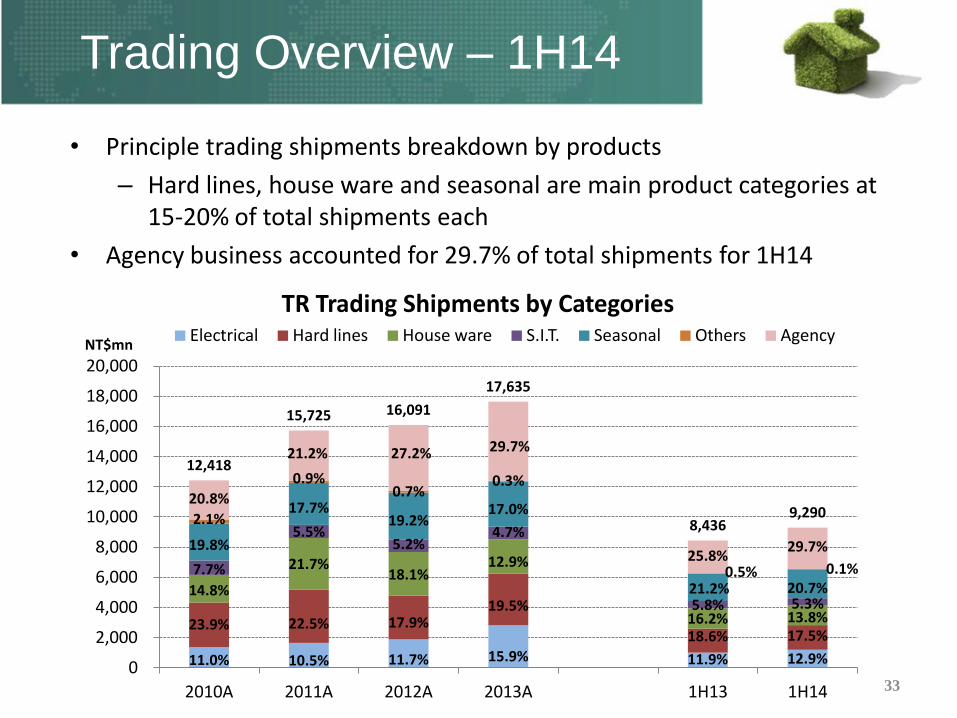
• Principle trading shipments breakdown by products
– Hard lines, house ware and seasonal are main product categories at 15-20% of total shipments each
• Agency business accounted for 29.7% of total shipments for 1H14
33
Trading Overview – 1H14
12,418
15,725 16,091
17,635
8,436 9,290
11.0% 10.5% 11.7% 15.9% 11.9% 12.9%
23.9% 22.5% 17.9% 19.5%
18.6% 17.5%
14.8%
21.7% 18.1%
12.9%
16.2% 13.8%
7.7%
5.5% 5.2%
4.7%
5.8% 5.3%
19.8%
17.7% 19.2%
17.0%
21.2% 20.7%
2.1%
0.9% 0.7%
0.3%
0.5% 0.1%
20.8%
21.2% 27.2% 29.7%
25.8% 29.7%
0
2,000
4,000
6,000
8,000
10,000
12,000
14,000
16,000
18,000
20,000
2010A 2011A 2012A 2013A 1H13 1H14
NT$mn
TR Trading Shipments by Categories Electrical Hard lines House ware S.I.T. Seasonal Others Agency
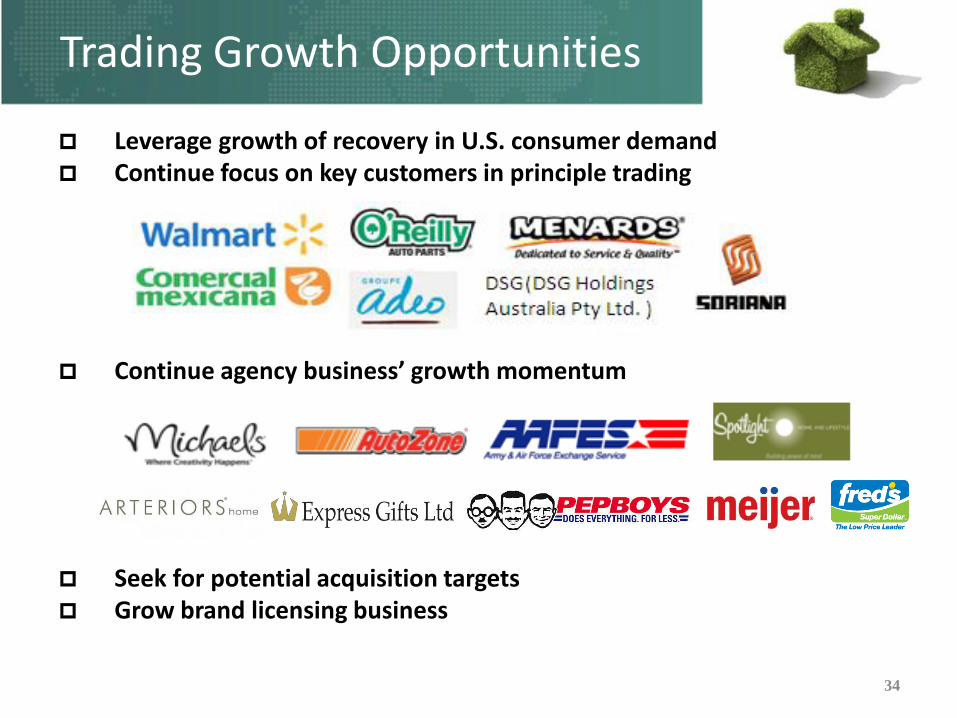
Trading Growth Opportunities
Leverage growth of recovery in U.S. consumer demand Continue focus on key customers in principle trading
Continue agency business’ growth momentum
Seek for potential acquisition targets Grow brand licensing business
34

Trading Growth Opportunities - Brand licensing
Brand licensing partners for Greater China markets
Channel Brand / product licensing partners for TW
Develop diversified product items of our brands and expand sales channels
35
(new)

• National Hardware Show
36
Principal Trading Programs
• COSTCO USA project- Motion sensor light
37
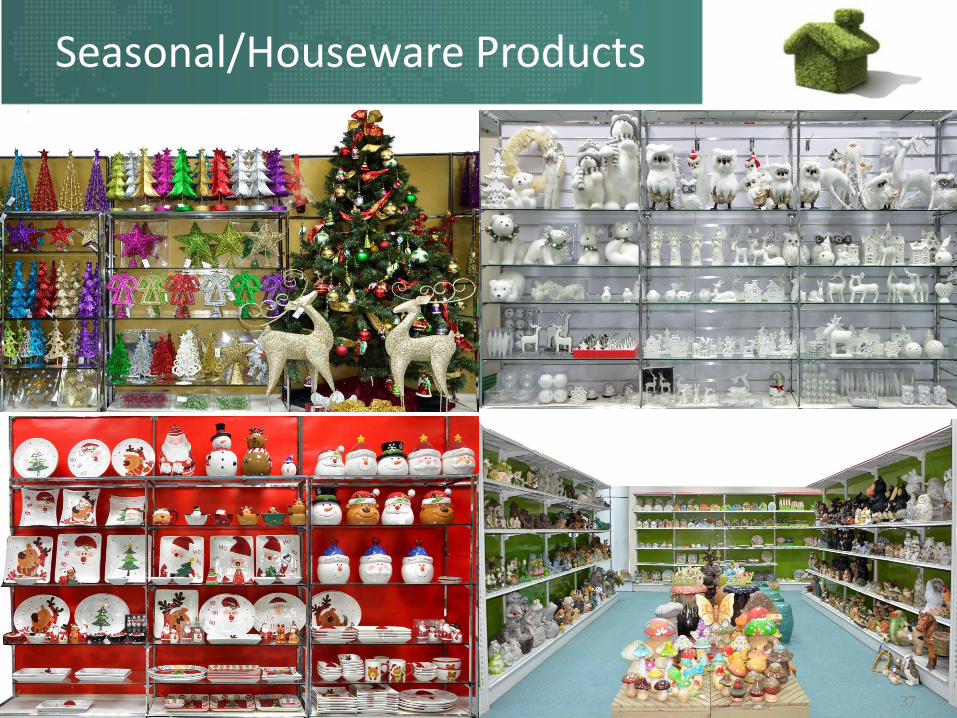
Seasonal/Houseware Products
37

謝謝各位 Q & A
38

APPENDIX: RECENT FINANCIAL RESULTS
39
100%
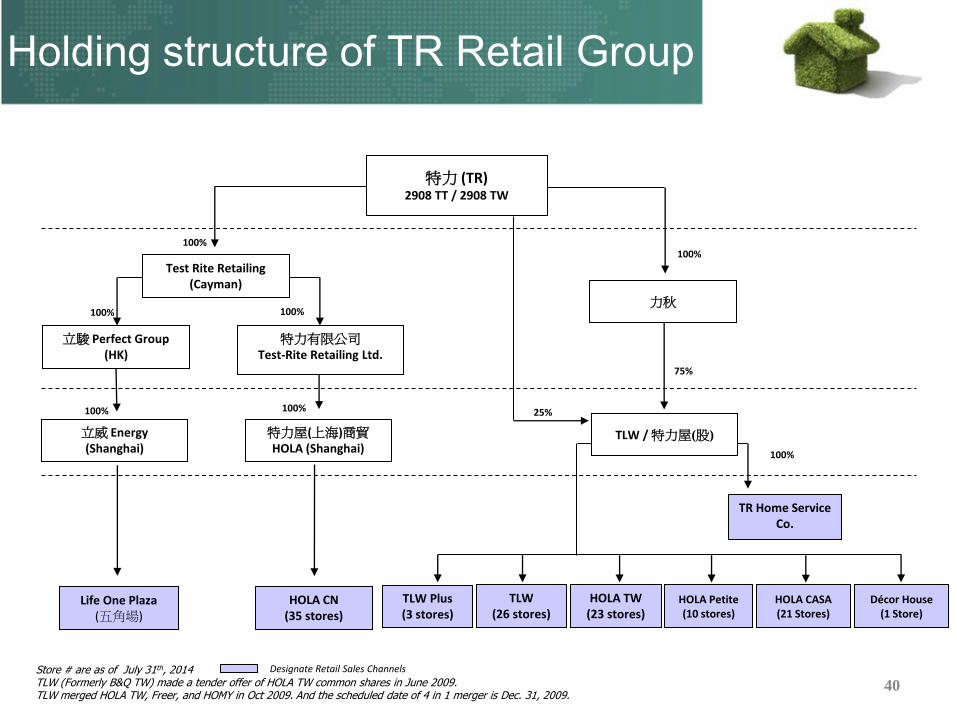
HOLA Petite (10 stores)
HOLA CASA (21 Stores)
HOLA CN (35 stores)
100%
100%
75%
25%
100%
100%
Store # are as of July 31th, 2014 TLW (Formerly B&Q TW) made a tender offer of HOLA TW common shares in June 2009. TLW merged HOLA TW, Freer, and HOMY in Oct 2009. And the scheduled date of 4 in 1 merger is Dec. 31, 2009.
特力 (TR) 2908 TT / 2908 TW
Test Rite Retailing (Cayman)
力秋
HOLA TW (23 stores)
TR Home Service Co.
100%
特力有限公司 Test-Rite Retailing Ltd.
TLW (26 stores)
100%
立駿 Perfect Group (HK)
Life One Plaza (五角場)
特力屋(上海)商貿 HOLA (Shanghai)
立威 Energy (Shanghai)
Designate Retail Sales Channels
TLW / 特力屋(股)
Holding structure of TR Retail Group
TLW Plus (3 stores)
Décor House (1 Store)
40

41
Consolidated P&L for 2Q14 & 1H14 (IFRS Based)
Test Rite 2Q14/1H14 Consolidated P&L
(NT$ mn) 2Q13A 2Q14A YoY% 1H13 1H14 YoY%
Turnover 8,602.1 8,877.1 3.2% 17,471.0 17,929.6 2.6% Gross profit 2,462.1 2,520.8 2.4% 5,142.1 5,204.2 1.2%
Gross margin % 28.6% 28.4% 29.4% 29.0%
Operating Expense -2,390.3 -2,381.9 -0.3% -4,795.3 -4,730.0 -1.4%
Operating profit 71.8 138.8 93.4% 346.8 474.2 36.7%
Operating margin % 0.8% 1.6% 0.7% 2.0% 2.6% 0.7%
Non-operating income/loss 7.3 8.0 9.9% 8.6 -3.9 NA
Pre-tax profit 79.1 146.9 85.7% 355.4 470.3 32.3%
Net profit 86.3 108.3 25.6% 334.8 385.7 15.2%
Other comprehensive income -14.7 -13.9 -6.0% 11.0 -5.5 -149.7%
Total net profit 71.6 94.5 32.0% 345.7 380.3 10.0%
Net profit attribute to TRIC 84.6 103.1 22.0% 329.9 374.6 13.5%
Recurring Net profit attribute to TRIC *
81.5 97.6 19.8% 302.8 361.5 19.4%
Basic EPS(attributed to TRIC)(NT$) 0.17 0.21 20.1% 0.68 0.76 11.8% Recurring Fully-diluted EPS(Aft-tax)* 0.16 0.19 19.8% 0.58 0.69 19.4%
* Recurring net profit exclude FOREX. FOREX contribution for 2Q14 and 2Q13 was NT$ 5.50 mn and NT$ 3.06 mn; 1H14 and 1H13 was
NT$ 13.07 mn and NT$ 27.13 mn, respectively.
Test Rite International Co., Ltd. (2908) – Consolidated (IFRS Based)
42
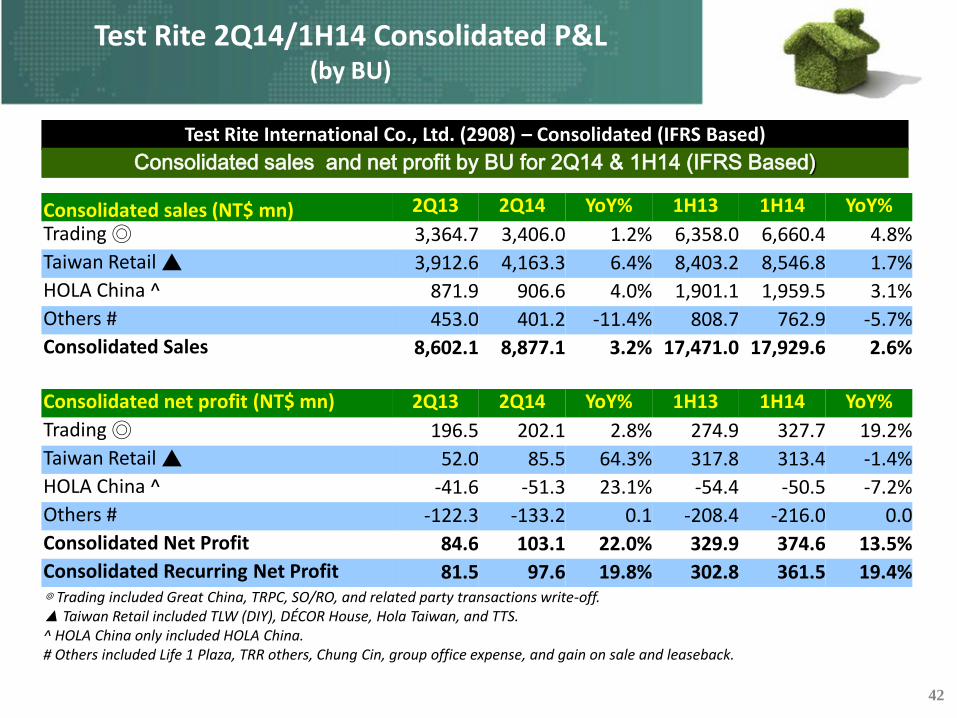
Test Rite International Co., Ltd. (2908) – Consolidated (IFRS Based)
Consolidated sales and net profit by BU for 2Q14 & 1H14 (IFRS Based)
Test Rite 2Q14/1H14 Consolidated P&L (by BU)
Consolidated sales (NT$ mn) 2Q13 2Q14 YoY% 1H13 1H14 YoY%
Trading ◎ 3,364.7 3,406.0 1.2% 6,358.0 6,660.4 4.8%
Taiwan Retail ▲ 3,912.6 4,163.3 6.4% 8,403.2 8,546.8 1.7%
HOLA China ^ 871.9 906.6 4.0% 1,901.1 1,959.5 3.1%
Others # 453.0 401.2 -11.4% 808.7 762.9 -5.7%
Consolidated Sales 8,602.1 8,877.1 3.2% 17,471.0 17,929.6 2.6%
Consolidated net profit (NT$ mn) 2Q13 2Q14 YoY% 1H13 1H14 YoY%
Trading ◎ 196.5 202.1 2.8% 274.9 327.7 19.2%
Taiwan Retail ▲ 52.0 85.5 64.3% 317.8 313.4 -1.4%
HOLA China ^ -41.6 -51.3 23.1% -54.4 -50.5 -7.2%
Others # -122.3 -133.2 0.1 -208.4 -216.0 0.0
Consolidated Net Profit 84.6 103.1 22.0% 329.9 374.6 13.5%
Consolidated Recurring Net Profit 81.5 97.6 19.8% 302.8 361.5 19.4% ◎ Trading included Great China, TRPC, SO/RO, and related party transactions write-off. ▲ Taiwan Retail included TLW (DIY), DÉCOR House, Hola Taiwan, and TTS. ^ HOLA China only included HOLA China. # Others included Life 1 Plaza, TRR others, Chung Cin, group office expense, and gain on sale and leaseback.

Test Rite 2Q14 Consolidated Balance Sheet
43
(NT$ mn) 2Q13A 2Q14A 2Q13A 2Q14A Total cash and cash equivalents 1,519.5 2,746.0 Short-term borrowings 1,697.1 2,089.2 Total current financial assets at fair value through profit or loss
268.7 473.4 Short-term notes and bills payable
40.0 50.0
Current bond investment without active market, net
185.6 197.2 Total current financial liabilities at fair value through profit or loss
6.0 6.1
Accounts & Notes Receivable 2,864.6 3,130.3 Accounts and Notes Payable 4,735.1 5,550.0 Other Receivable 568.3 576.3 Other Payable 2,306.7 1,852.4 Total inventories 4,243.6 4,748.5 Current tax liabilities 149.4 109.8 Total prepayments 697.1 542.4 Total advance receipts 788.5 919.3
Other current financial assets 1.8 0.4 Total long-term liabilities, current portion
200.0 400.0
Other Current Assets 119.7 56.2 Other Current Liability 323.2 272.1
Total current assets 10,468.8 12,470.6 Total Current Liabilities 10,219.4 11,248.8
Test Rite International Co., Ltd. (2908) – Consolidated (IFRS Based)
Consolidated Balance Sheet for 2Q14 (IFRS Based )

44
(NT$ mn) 2Q13A 2Q14A 2Q13A 2Q14A Non-current financial assets at cost, net
74.2 71.8 Long-term bank loans 4,777.7 5,357.3
Non-current bond investment without active market, net
50.0 50.0 Accrued pension liabilities 133.1 122.6
Total property, plant and equipment
6,294.6 6,057.0 Other Non-Current Liability 425.6 394.7
Goodwill And Intangible Assets 2,375.3 2,480.7 Total non-current liabilities 5,336.4 5,874.6 Deferred Assets 1,117.1 1,152.5 Total liabilities 15,555.8 17,123.4 Total other non-current assets 1,677.4 1,829.5 Total Non-Current Assets 11,555.6 11,641.5 Capital 5,219.6 5,219.6
Total capital surplus 694.5 711.8 Total retained earnings 1,272.3 1,450.3 Total other equity interest -17.9 -7.4 Treasury shares -729.1 -415.5 Total equity attributable to owners of parent
6,439.3 6,958.8
Non-controlling interests 29.2 30.0 Total equity 6,468.6 6,988.8
Total assets 22,024.3 24,112.1 Total Liabilities & Equity 22,024.3 24,112.1
Test Rite International Co., Ltd. (2908) – Consolidated (IFRS Based)
Consolidated Balance Sheet for 2Q14 (IFRS Based )
Test Rite 2Q14 Consolidated Balance Sheet

45
TLW Business
45
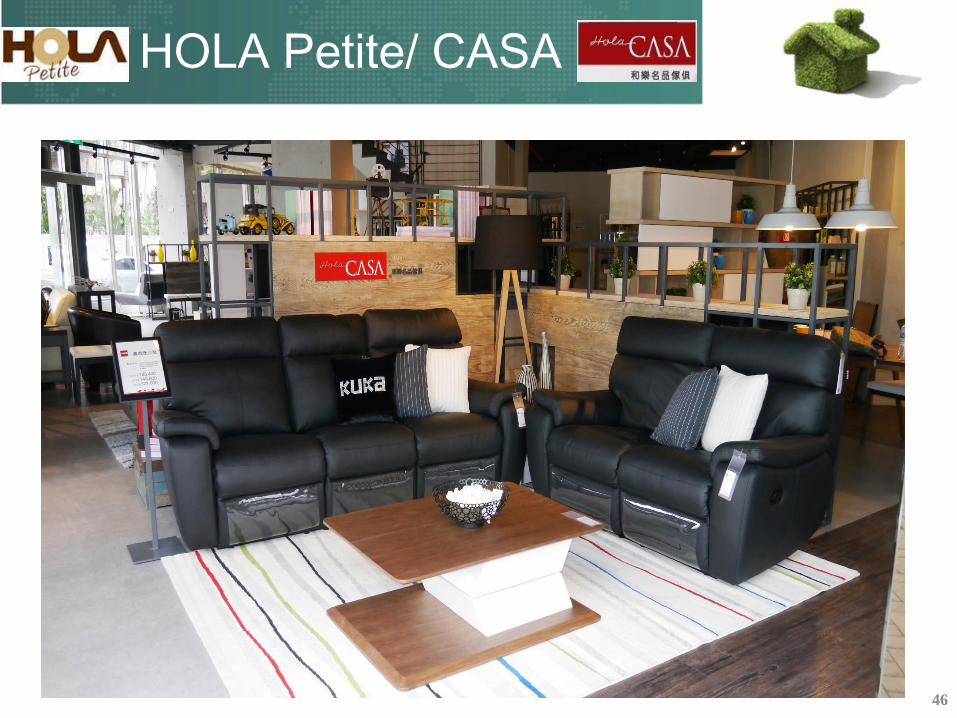
46
HOLA Petite/ CASA

47
HOLA China Product Layouts

Thank you!
48


