ABSTRACT Bangladesh has a very high road accident fatality rate with official figures indicating more than 60 deaths per 10,000 motor vehicles. Everyday around twelve persons die in road accidents. The actual rate of fatality is likely to be even higher. The problems related to the accident reporting system and the data derived from it, as reported by Quium1, have not been resolved and official statistics are prone to under reporting. The number of accidents has increased by 43% between 1982 and 2010, while the number of fatalities has increased by around 400% within the same period2. This indicates that not only the occurrence of accidents is on the rise, the severity of accidents is also increasing. As the population, total road length and modal share of road 1
Transcript
ABSTRACT
Bangladesh has a very high road accident fatality rate with official figures
indicating more than 60 deaths per 10,000 motor vehicles. Everyday around
twelve persons die in road accidents. The actual rate of fatality is likely to be
even higher. The problems related to the accident reporting system and the data
derived from it, as reported by Quium1, have not been resolved and official
statistics are prone to under reporting. The number of accidents has increased by
43% between 1982 and 2010, while the number of fatalities has increased by
around 400% within the same period2. This indicates that not only the
occurrence of accidents is on the rise, the severity of accidents is also
increasing. As the population, total road length and modal share of road
transport continue to grow in the country, the number of casualties from road
accidents is expected to maintain its rising trend.
1
INTRODUCTION
Road accidents have been increasing countywide for years, killing 12,000 people and leaving 25,000 injured every year.
According to the statistics of government of Bangladesh, on an average 12 people die in road accidents everyday, totaling 5,000 every year, as opposed to a figure of 12,000 according to non-government sources.
World Bank conducted a countrywide survey on 90,000 families in 2003 explicating damages of road accidents, which reveals dire consequences of 12,000 people’s deaths averaging 34 per day and leaving 25,000 injured and damages worth $1 billion.
That is about the same amount that Bangladesh receives same from donors every year. In the last three months, some 445 people including two secretaries (Razia Begum and Siddikur Rahaman) died after being run over. Of them, 245 died in head-on collision, 60 in motorbike accidents, and 155 died in other accidents. Some 1,454 people have been wounded after being rammed by vehicles.
Normally, buses, trucks, microbuses, CNG taxis, three wheelers and motorcycles are engaged more in road mishaps.
The countryside people — almost 75 per cent of the 12,000 figure — are mostly victims of road accidents.
A recent survey of ARI reveals that 80 per cent of people who died of road accidents are aged from 5 to 45 years, 53 per cent are pedestrians and 21 per cent are under 16, having impacts economically and socially.
According to the ARI survey, 50 per cent of the victims died on the spot within 15 minutes, receiving injuries to the head and chest leading to hemorrhaging. Almost 35 per cent died from chest and head injuries within the next 2 hours and others die of putrefying or cutting the parts of the body within the next 30
2
days. ARI have made the report flicking through police and media reports and accidents of the last 5 years.
Road accidents take away 1 to 5 percentage points from the national GDP of every country. If measures are not taken immediately, the quantity of road smashes would double in developing countries like Bangladesh.
Experts viewed that due to unplanned and uncertain roads, use of old and unfit vehicles, unskilled and reckless driving, and deficiencies in and poor enforcement of traffic rules and regulations are leading to an unbridled increase in the number of road accidents.
On the other hand, Bangladesh Road Transport Authority, vehicles fitness certificate and driving licence providing authorities, are supplying driving licences out of personal relations to the incompetent and unskilled drivers and unfit vehicles. Reducing the number of unfit vehicles on highways would also lessen the number of incidents.
Stern implementation of traffic rules and regulations and laws relating to road accidents would reduce the incidents but right now that is impossible due to labour movements.
Although laws of road accidents exist to jail offenders having connection to accidents, in reality they are hardly enforced.
Experts are of the opinion that only bringing change to laws to punish the guilty drivers is of no use, action should also be taken against those who are providing licences to unskilled drivers and unfit vehicles in exchange for money.
3
Causes of Road Accident
1. Reckless driving;
2. Over- speeding;
3. Over- Loading;
4. Vehicular defects;
5. Lack of Knowledge and consciousness of the road users;
6. Hazardous roads & road environments;
7. Lack of Training to the drivers;
8. Lack of training of maintenance of vehicles;
9. Poor implementation of Traffic rules & regulations;
10.Driving under influence of alcohol, drugs etc.;
11.Unutilization of helmets, seat belts etc.;
12.To walk on the roads instead of using the footpath;
13.To cross the road without using the foot over bridge;
14.To drive the vehicles by helpers instead of Drivers;
15.Illegal competition to overtake the vehicle.
4
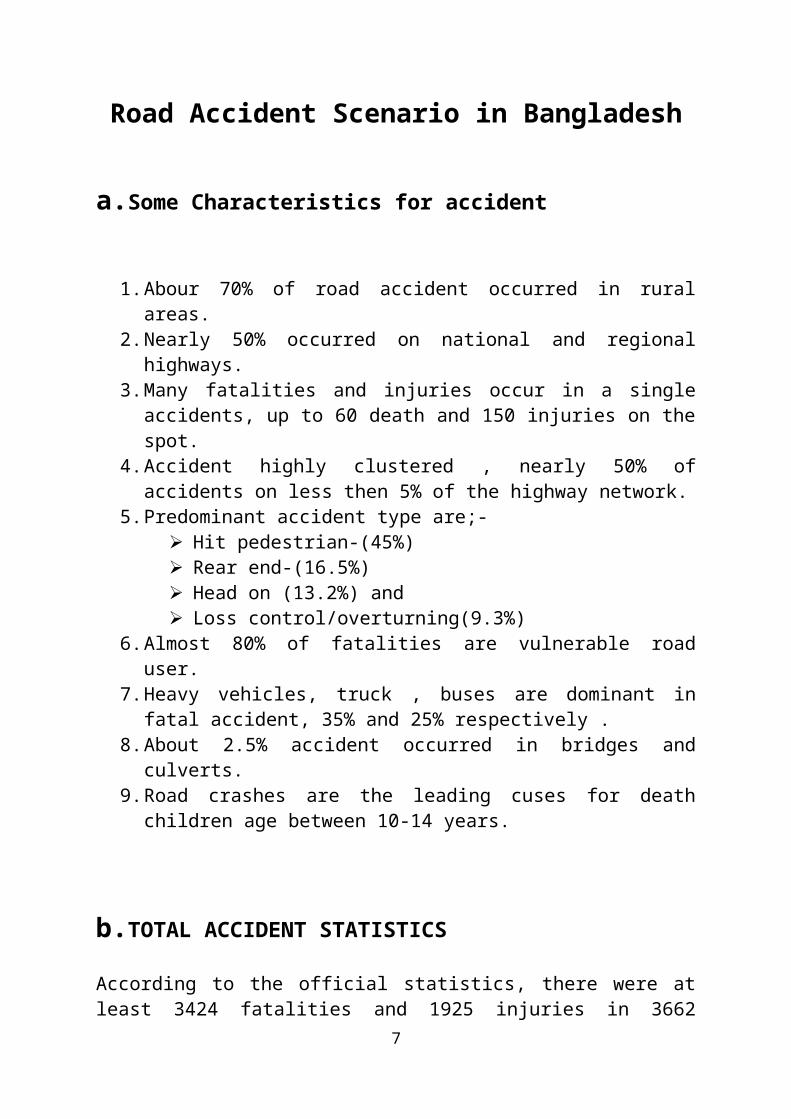
Road Accident Scenario in Bangladesh
a.Some Characteristics for accident
1. Abour 70% of road accident occurred in rural areas.2. Nearly 50% occurred on national and regional highways.3. Many fatalities and injuries occur in a single accidents, up to 60 death and
150 injuries on the spot.4. Accident highly clustered , nearly 50% of accidents on less then 5% of the
highway network.5. Predominant accident type are;-
Hit pedestrian-(45%) Rear end-(16.5%) Head on (13.2%) and Loss control/overturning(9.3%)
6. Almost 80% of fatalities are vulnerable road user.7. Heavy vehicles, truck , buses are dominant in fatal accident, 35% and 25%
respectively .8. About 2.5% accident occurred in bridges and culverts.9. Road crashes are the leading cuses for death children age between 10-14
years.
b.TOTAL ACCIDENT STATISTICS
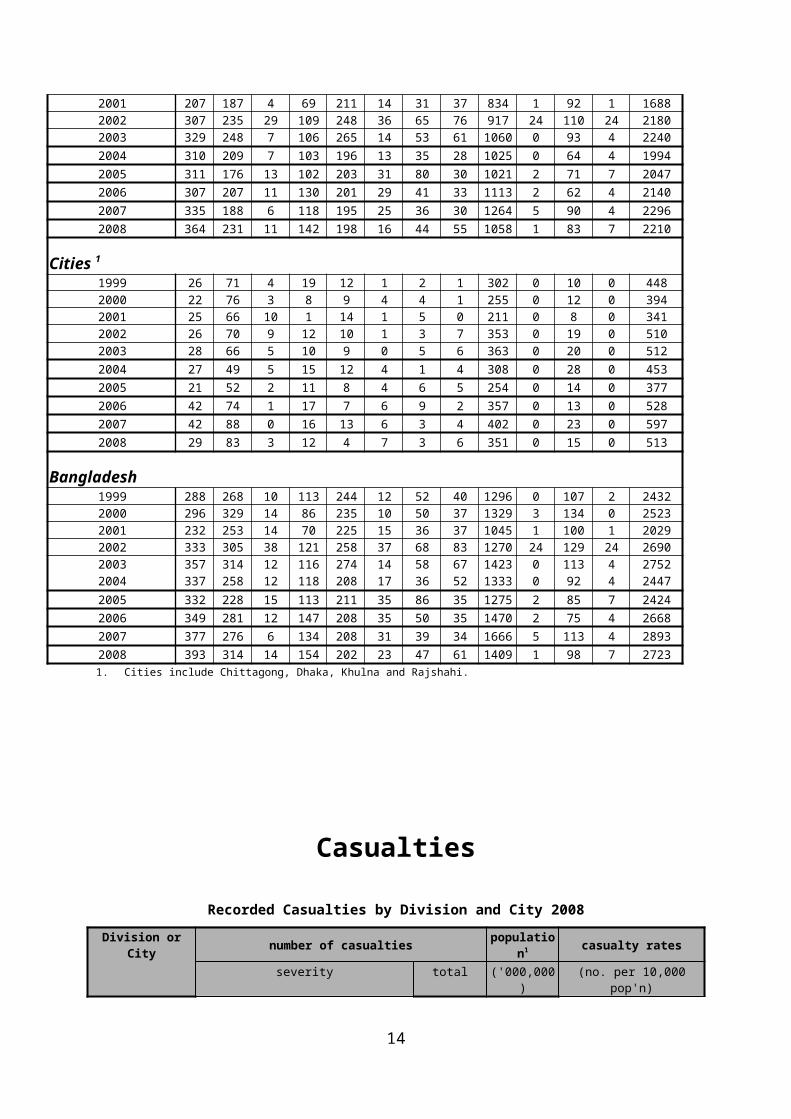
According to the official statistics, there were at least 3424 fatalities and 1925 injuries in 3662 reported accidents in 2008.Trends of reported road traffic accidents are given Police Reported Accidents and BRTA 2009. It is estimated that the actual fatalities could well be 10000-12000 each year. Significant fluctuations in the numbers of fatalities and injuries as reported by police clearly reflect the problems of reporting and recording inconsistencies. The number of fatalities has been increasing from 1009 in 1982 to 3424 in 2008, nearly 3.5 times in 27 years period. The statistics revealed that Bangladesh has one of the highest fatality rates in road accidents, over 100 deaths per 10,000 motor vehicles. About 70 percent of road accident fatalities occurred in rural areas including rural sections of national highways.
5
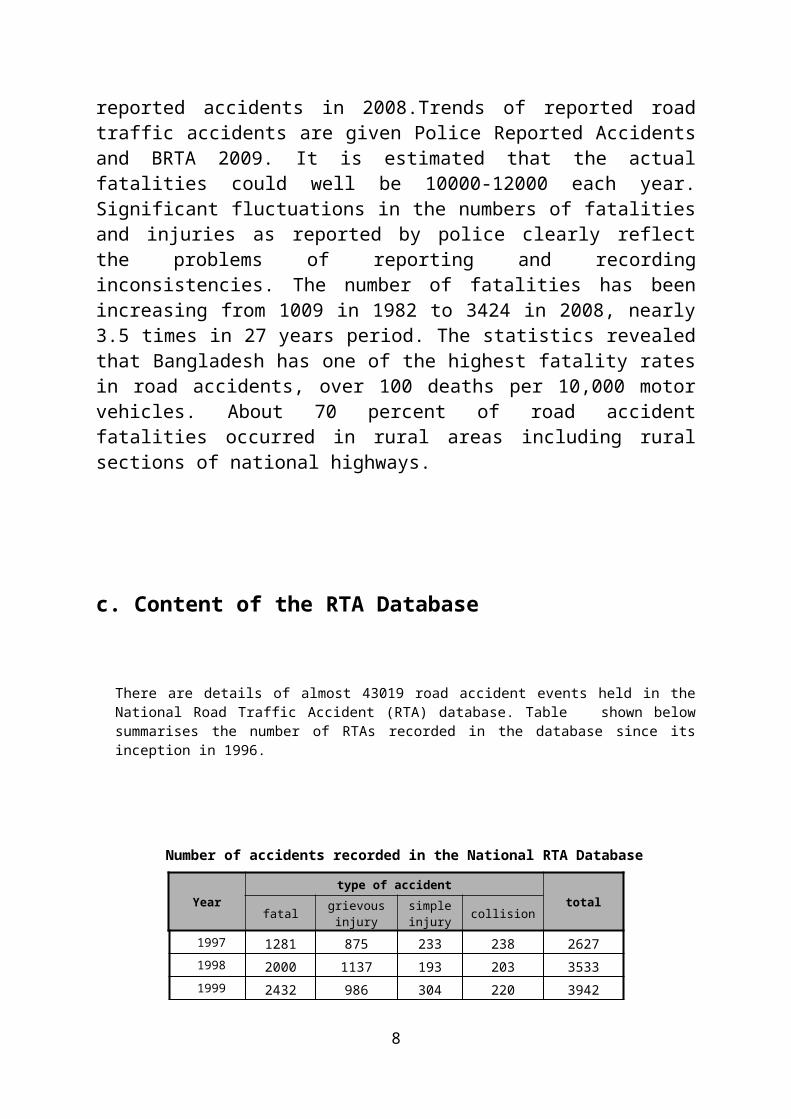
c. Content of the RTA Database
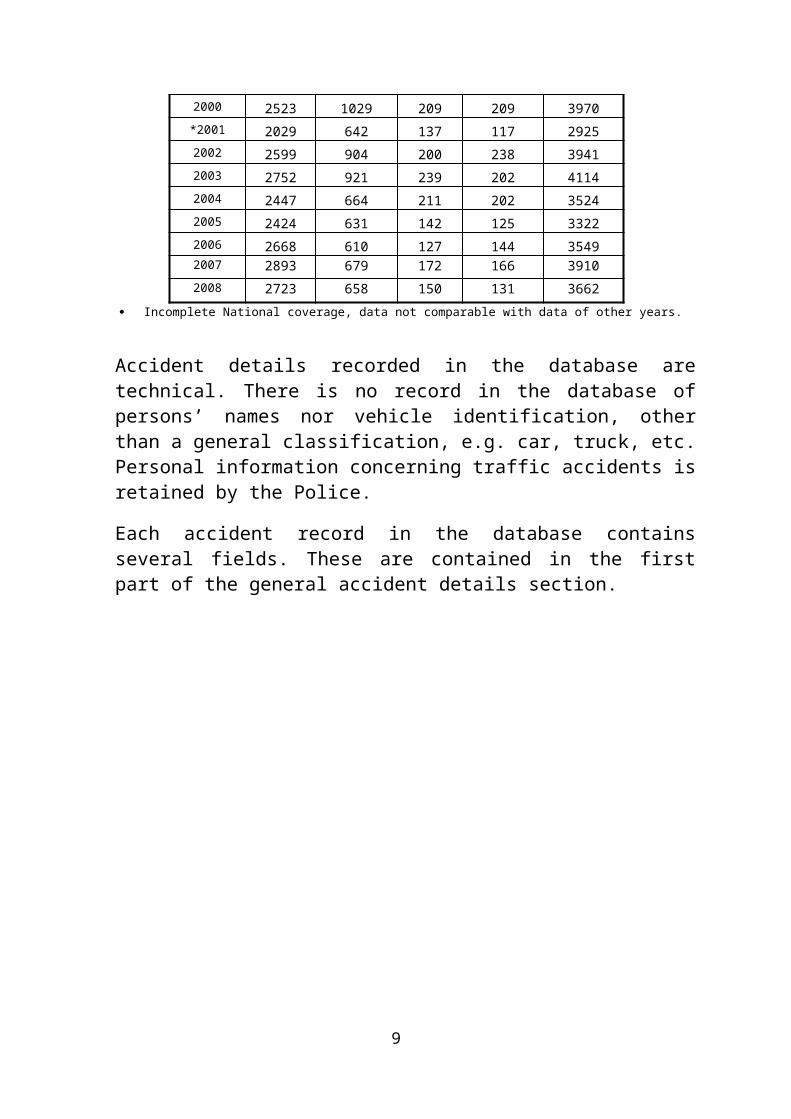
There are details of almost 43019 road accident events held in the National Road Traffic Accident (RTA) database. Table shown below summarises the number of RTAs recorded in the database since its inception in 1996.
Number of accidents recorded in the National RTA Database
Incomplete National coverage, data not comparable with data of other years.
Accident details recorded in the database are technical. There is no record in the database of persons’ names nor vehicle identification, other than a general classification, e.g. car, truck, etc. Personal information concerning traffic accidents is retained by the Police.
Each accident record in the database contains several fields. These are contained in the first part of the general accident details section.
6
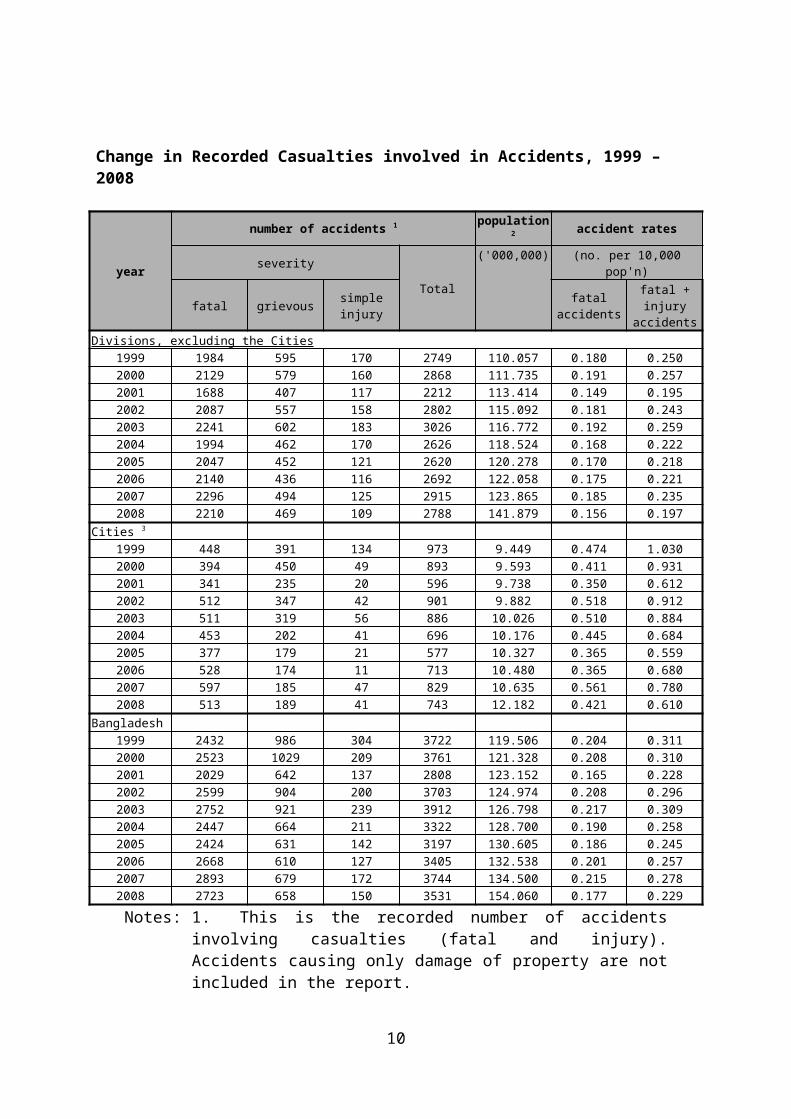
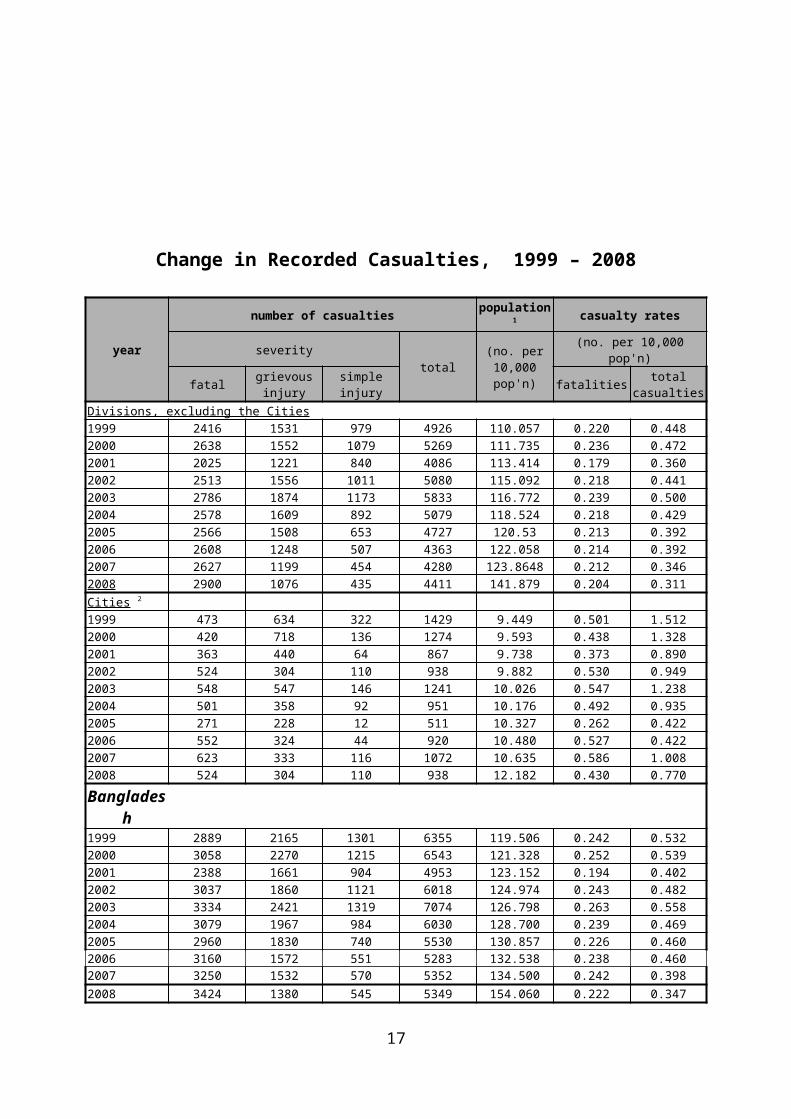
Change in Recorded Casualties involved in Accidents, 1999 – 2008
year
number of accidents 1 population2 accident ratesseverity
Notes: 1. This is the recorded number of accidents involving casualties (fatal and injury). Accidents causing only damage of property are not included in the report.
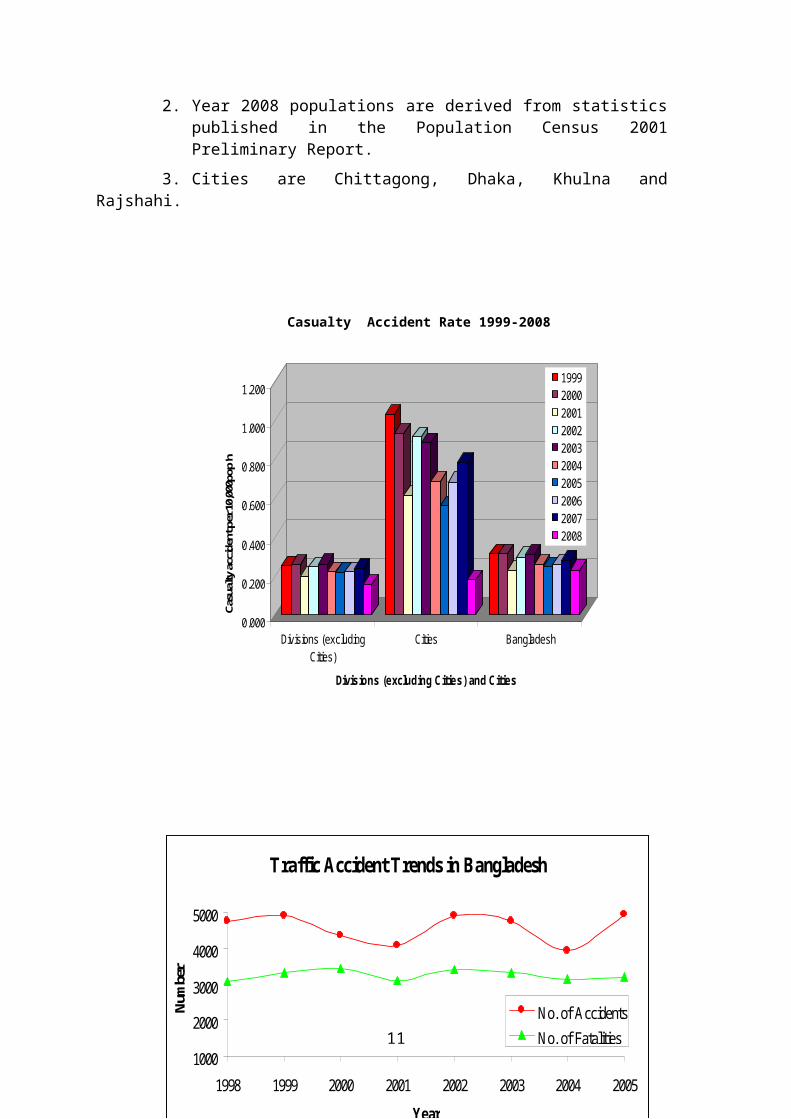
2. Year 2008 populations are derived from statistics published in the Population Census 2001 Preliminary Report.
3. Cities are Chittagong, Dhaka, Khulna and Rajshahi.
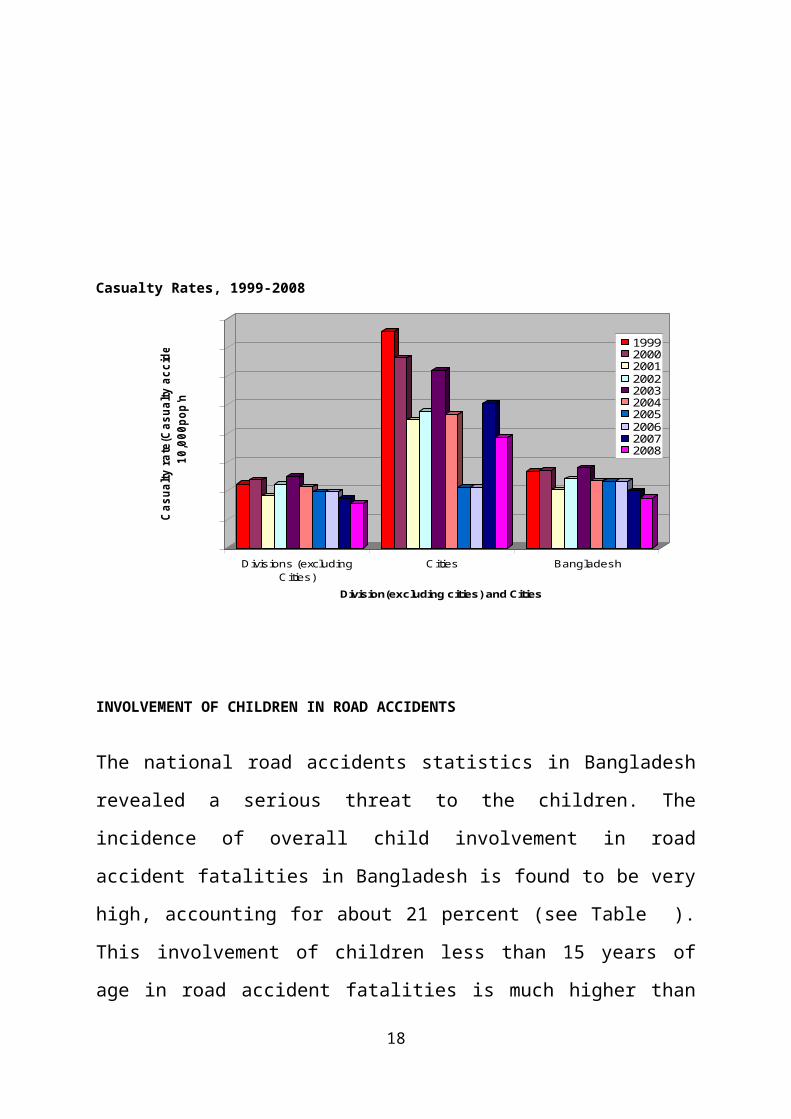
Casualty Accident Rate 1999-2008
7
Traffic Accident Trends in Bangladesh
1000
2000
3000
4000
5000
1998 1999 2000 2001 2002 2003 2004 2005
Year
Num
ber
No. of Accidents
No. of Fatalities
0.000
0.200
0.400
0.600
0.800
1.000
1.200
Casu
alty
acc
iden
t per
10,
000p
op'n
Divisions (excludingCities)
Cities Bangladesh
Divisions (excluding Cities) and Cities
1999200020012002200320042005200620072008
8
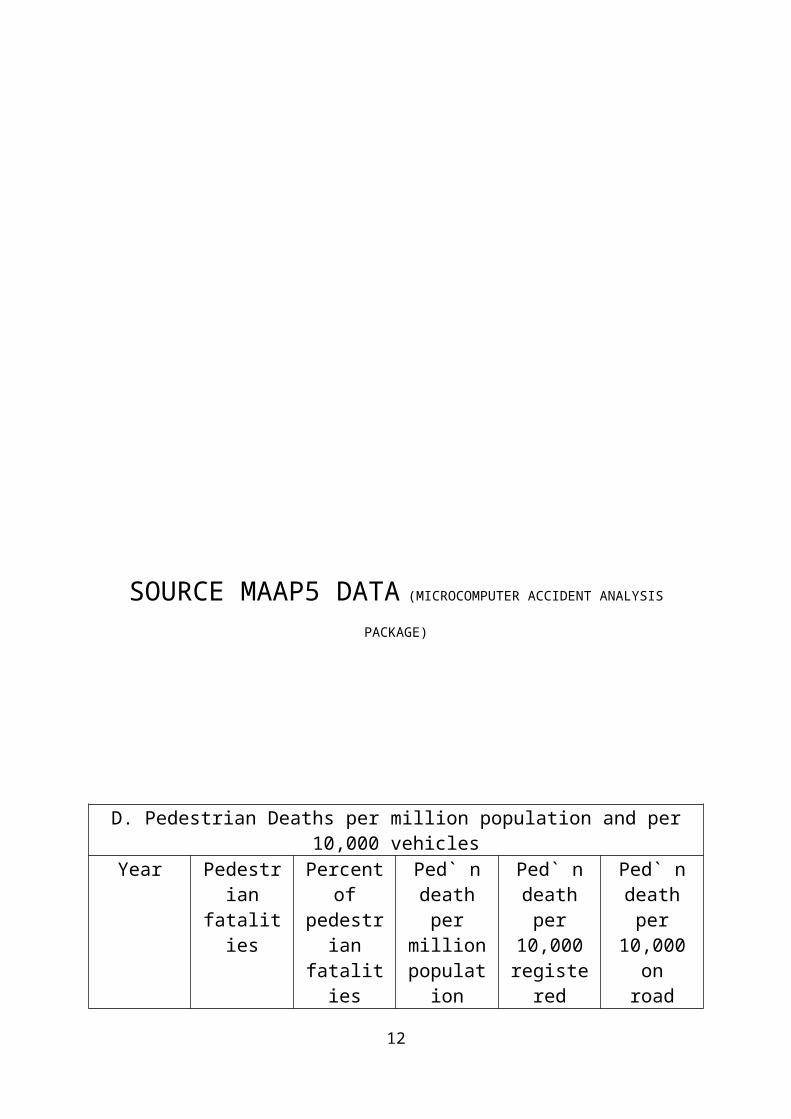
SOURCE MAAP5 DATA (MICROCOMPUTER ACCIDENT ANALYSIS
PACKAGE)
D. Pedestrian Deaths per million population and per 10,000 vehicles
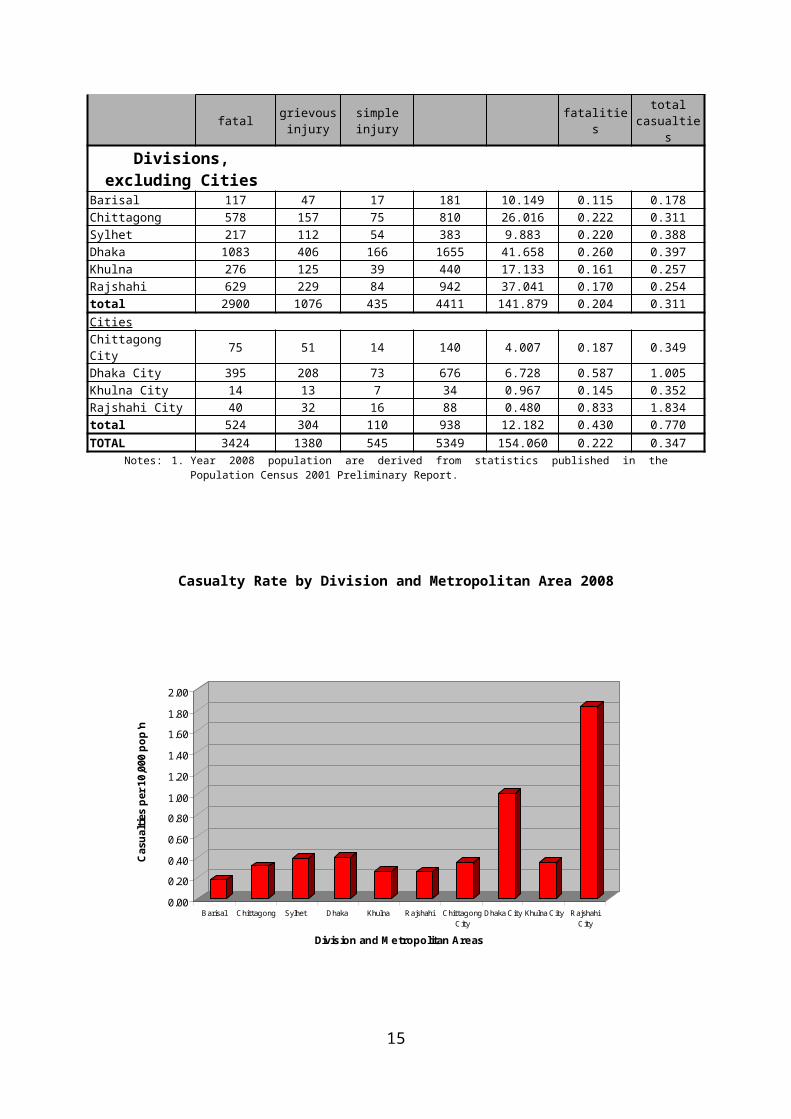
CitiesChittagong City 75 51 14 140 4.007 0.187 0.349Dhaka City 395 208 73 676 6.728 0.587 1.005Khulna City 14 13 7 34 0.967 0.145 0.352Rajshahi City 40 32 16 88 0.480 0.833 1.834total 524 304 110 938 12.182 0.430 0.770
TOTAL 3424 1380 545 5349 154.060 0.222 0.347Notes: 1. Year 2008 population are derived from statistics published in the Population Census 2001 Preliminary Report.
Casualty Rate by Division and Metropolitan Area 2008
11
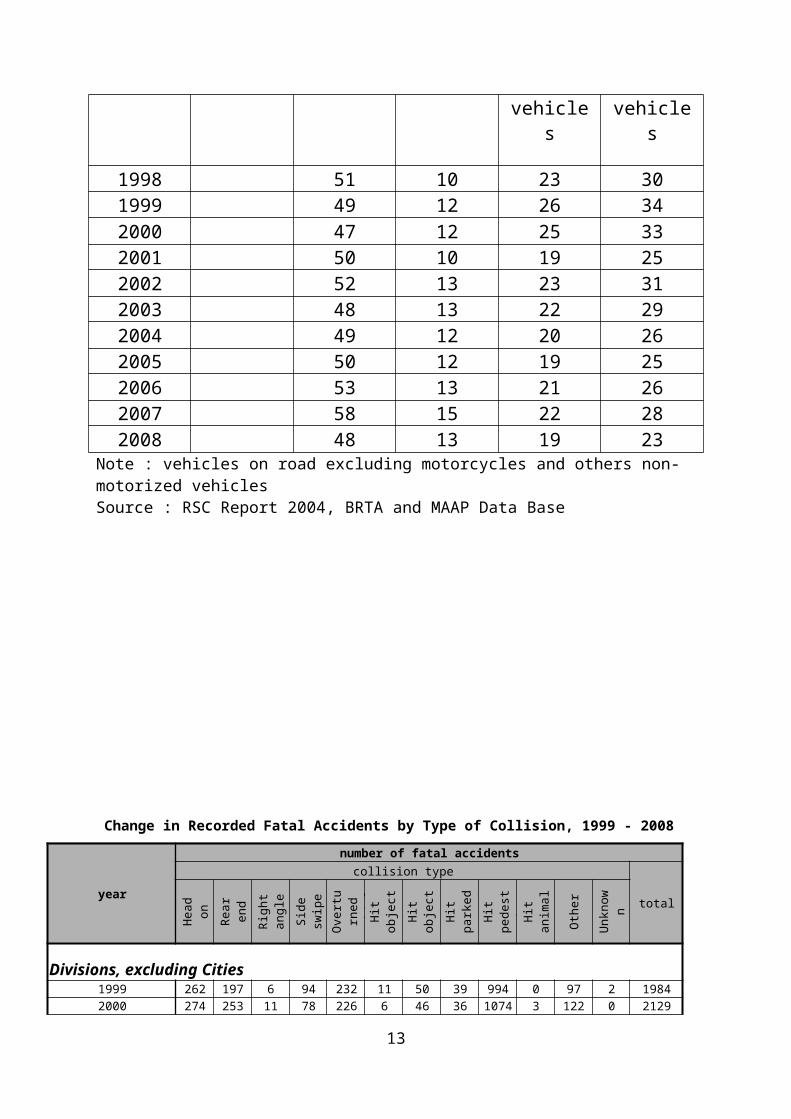
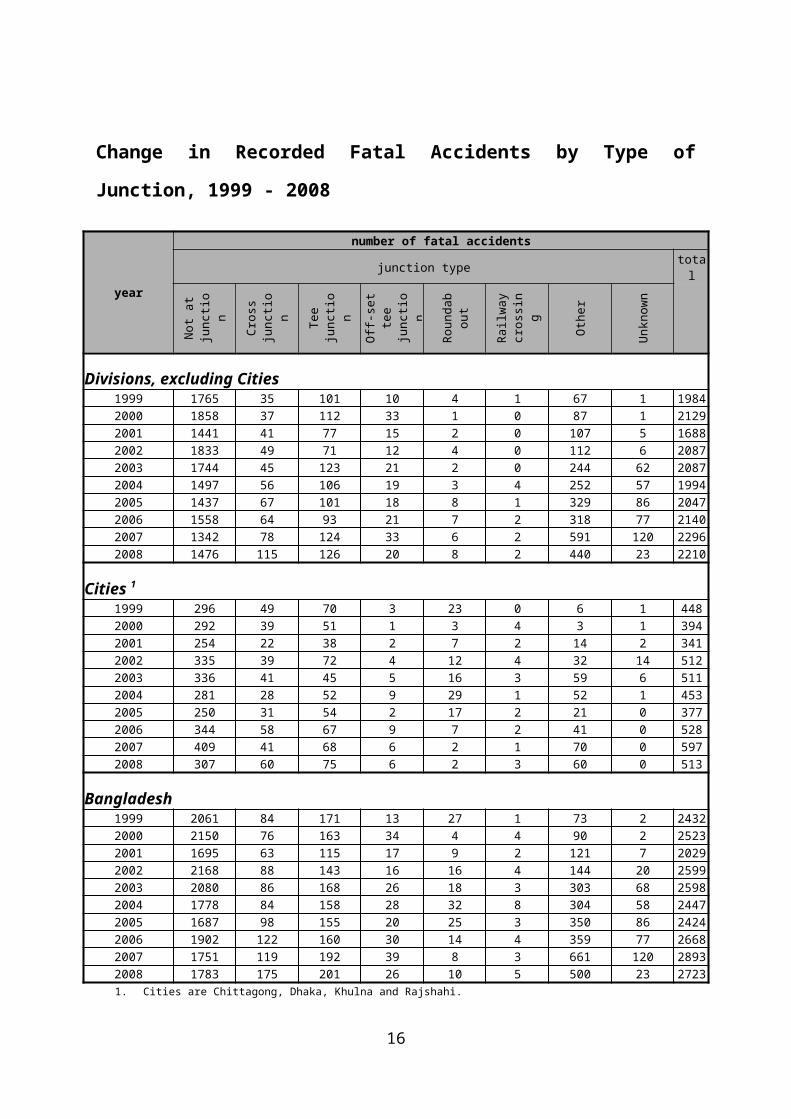
Change in Recorded Fatal Accidents by Type of Junction, 1999 - 2008
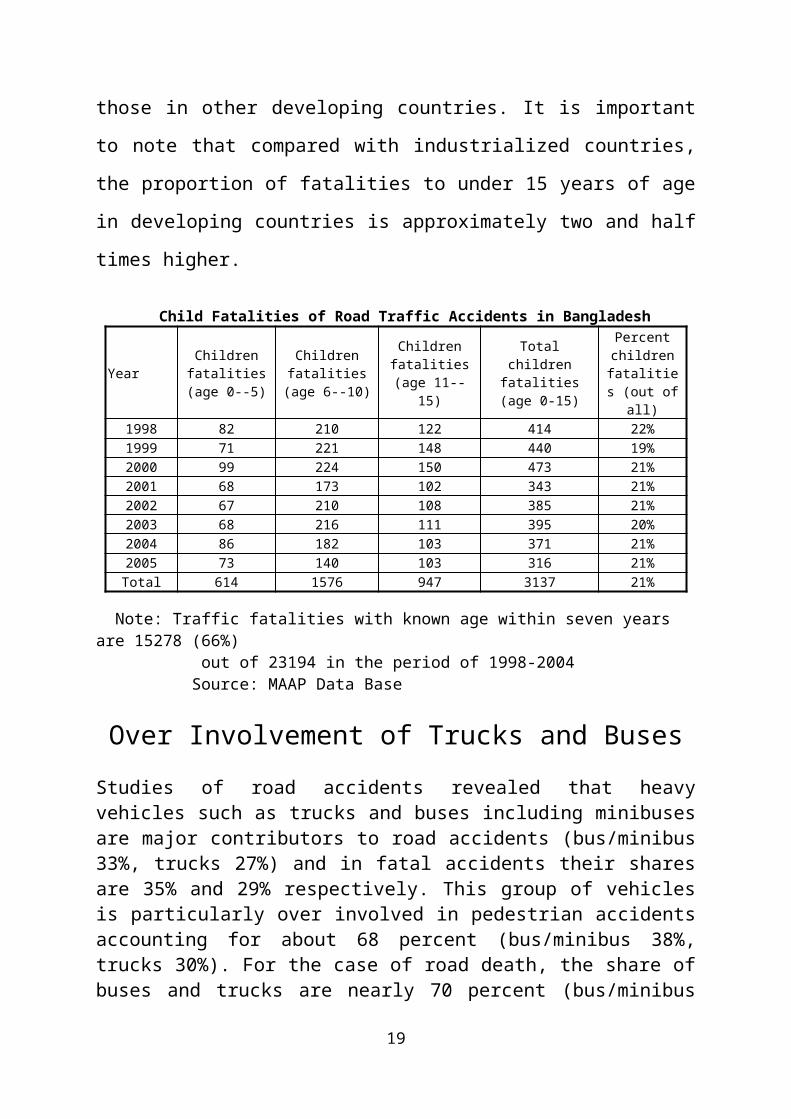
Note: Traffic fatalities with known age within seven years are 15278 (66%) out of 23194 in the period of 1998-2004 Source: MAAP Data Base
14
Over Involvement of Trucks and Buses
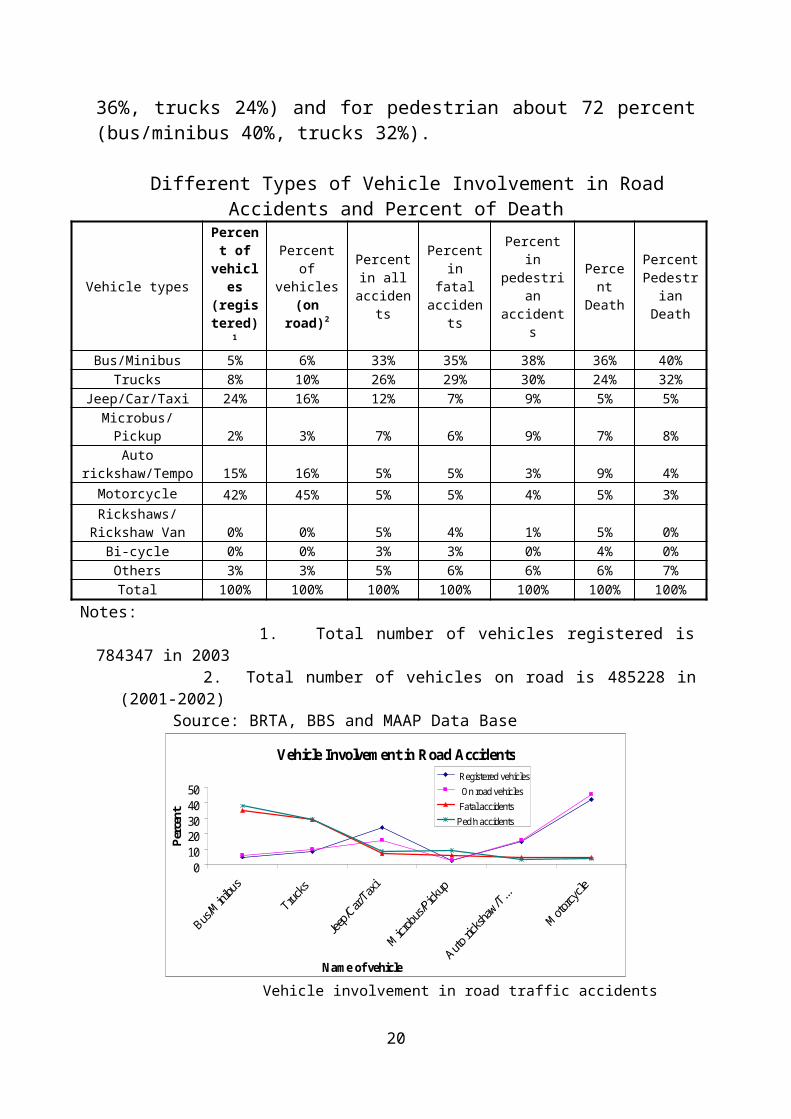
Studies of road accidents revealed that heavy vehicles such as trucks and buses including minibuses are major contributors to road accidents (bus/minibus 33%, trucks 27%) and in fatal accidents their shares are 35% and 29% respectively. This group of vehicles is particularly over involved in pedestrian accidents accounting for about 68 percent (bus/minibus 38%, trucks 30%). For the case of road death, the share of buses and trucks are nearly 70 percent (bus/minibus 36%, trucks 24%) and for pedestrian about 72 percent (bus/minibus 40%, trucks 32%).
Different Types of Vehicle Involvement in Road Accidents and Percent of Death
Notes: 1. Total number of vehicles registered is 784347 in 2003
2. Total number of vehicles on road is 485228 in (2001-2002) Source: BRTA, BBS and MAAP Data Base
Vehicle Involvement in Road Accidents
01020304050
Name of vehicle
Per
cent
Registered vehicles
On road vehicles
Fatal accidents
Ped'n accidents
Vehicle involvement in road traffic accidents
15
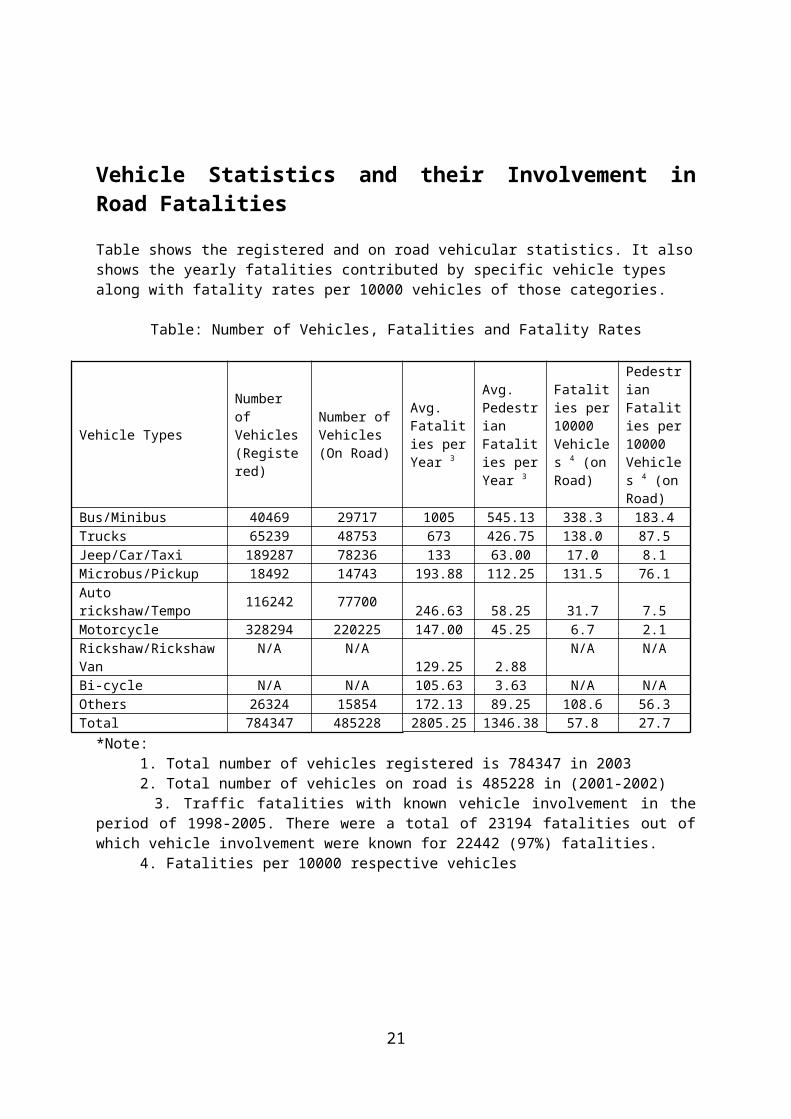
Vehicle Statistics and their Involvement in Road Fatalities
Table shows the registered and on road vehicular statistics. It also shows the yearly fatalities contributed by specific vehicle types along with fatality rates per 10000 vehicles of those categories.
Table: Number of Vehicles, Fatalities and Fatality Rates
Vehicle TypesNumber of Vehicles (Registered)
Number of Vehicles (On Road)
Avg. Fatalities per Year 3
Avg. Pedestrian Fatalities per Year 3
Fatalities per 10000 Vehicles 4 (on Road)
Pedestrian Fatalities per 10000 Vehicles 4 (on Road)
*Note: 1. Total number of vehicles registered is 784347 in 2003 2. Total number of vehicles on road is 485228 in (2001-2002) 3. Traffic fatalities with known vehicle involvement in the period of 1998-2005. There were a total of 23194 fatalities out of which vehicle involvement were known for 22442 (97%) fatalities. 4. Fatalities per 10000 respective vehicles
National Highways
With 51% of all fatal accidents occurring on National Highways, these roads continue to be the principal target of recommendations for road safety initiatives. The recommendations are listed in table 8.2.These initiatives may be auctioned independently but preferably they should be auctioned in combination with each other on selected sections of national highway of some length (typically lengths between 10 km and 50 km).
Dhaka Division and Rajshahi Division, outside the city areas of Dhaka and Rajshahi, account for the majority of fatal accidents and should be the principal target areas for these initiatives.
16
Steps to be taken for preventing Road Accidents
Most important method to bring down accidents is strict enforcement of speed limits.
90 % of accidents can be avoided by strict enforcement of speed limits. Existing speed limits should be brought down further. Heavy Penalty should be imposed on ALL those who cross speed limits.
If this is strictly implemented, nobody will dare to go at high speed. Heavy penalty should be imposed for those who cause accidents. Tamper proof speed controllers should be made mandatory for all heavy
vehicles. New heavy vehicles should have built in tamper proof speed controllers.
Two wheeler manufacturers should be asked to design two wheelers with a designed maximum speed of (say) 50/60 kmph.( Suitable speed limit may be selected for each country.)
New gadgets are to be developed for collision prevention and should be fitted on all vehicle. Research organizations should be asked to develop such gadgets on a war footing. For example, gadgets can be developed to automatically slow down the vehicle, if safe distance commensurate with the speed of the vehicle in front is not maintained.
Diving tests for issue of Driving license is to be made more stringent and foolproof.
Raising of lower age limit for two wheeler and Heavy Vehicle license to 21.
Helmet should be made compulsory by law in all states, OR impose a lower speed limit for those who do not use helmet.
Helmet should be made compulsory for back seat riders also. Ensure that all Helmet users are fixing the Chinstrap of Helmet.
Otherwise it will not help during an accident. Ensure that ONLY good quality Helmets are available in the market. Strict enforcement of existing traffic rules. Law should be modified such that the person who made the accident has
to bear (say) 0 to 10 % of the insurance claims, depending on severity of negligence. Also the compensations should be made very huge, making accidents unaffordable so that everyone will be very vigilant.
17
All those who do not maintain the safe distance for the speed should be punished.
Safety awareness should begin from childhood, as it is difficult to impart awareness to a grown up a human. If safety awareness is imparted at childhood, safety will be a habit.
Video / Computer Games that simulate Racing should be banned by Government OR discouraged by parents as it will develop racing habit in children.
All sorts of Motor sports especially racing should be banned by government. Telecast of Motor Sports and Racing also should be banned.
Children below a certain age should not be permitted to do cycling in busy roads / roads where heavy vehicles are plying.
Refreshment parlors should be made available at (say) every 50 / 100 k.m. on all national highways and truck / heavy vehicle drivers should be forced to refresh by having a face wash or by having a cup of tea / coffee.
Advertisement boards and other items that may obstruct visibility at junctions, curvatures and other parts of the roads should be removed immediately.
Ensure that the money recovered as Road Tax is fully utilised for the construction /maintenance of roads.
TV and other media should be effectively used for Public safety awareness.
Scientific analysis of major accidents / accident prone areas. Restriction of speed at accident prone areas. Enactment of stringent traffic rules. Immediate suspension of license of those who are involved the accidents,
at least until they prove that they are not guilty. Cancellation of license of those who make serious accidents. Strict enforcement of health of vehicles. Periodic eye testing of old aged driving license holders. Immediate cancellation of license of drunkard drivers / riders. Setting up of Judicial Commissions to monitor steps taken to control road
accidents. Straightening / Widening of roads, Implementation of one way traffic and
construction of medians. Footpaths and medians should be made mandatory for important roads. Zebra crossings should be provided for pedestrians for safe road crossings
at appropriate places. Signals for road crossings at important busy places where a large number
of people have to cross the road everyday. Proper marking of roads and signals. Humps should be provided at all important places, accident prone areas.
18
Construction, size and shape of the Humps be scientific. All the Contractors of the Public Works / Other departments should be provided with the details of scientific Hump construction
Humps should be clearly marked, to avoid accidents. Methods of permanent nature should be followed in Hump marking. For example white marble pieces / white color / fluorescent pigment can be included in the mixture ( if scientifically correct).
Provision of small pilot humps few meters before humps can also be considered to ensure that humps are not left unnoticed.
Elimination of obstructions on road sides, caused by unauthorised construction / road side sales.
Increasing visibility near curvatures. Sometimes even cutting of grass to increase visibility can help save many lives.
Road Safety Day / Road Safety Week should be observed in all Schools, every year. Competitions on Road Safety Tips, Slogans, Essay, Painting etc should be conducted for various categories of students.
School Buses should be painted with Bright Yellow color. Let ‘Road Safety’ be a mandatory topic for School Projects for all
classes, every year. Front and Back of Lorries and Trucks should be painted with bright
Yellow color to increase visibility. This will help to prevent collisions while Lorries and Trucks are parked on roadside without parking lights switched on.
Reflectors should be fixed on Front and Back of Trucks and Lorries.
Table: Recommendations for Road Safety Initiatives
Road Safety Attribute
Recommended Road Safety Initiatives Comment
Safer People
a. Education of pedestrians, particularly children, women, aged on safe practices when near the road
An education program should focus in road side communities near the national highways whose are the frequent users.
b. Education of drivers, particularly heavy vehicle (buses and trucks) drivers, on road rules and safe driving practices
Sustainable education requires introduction of a highway code in a format appropriate for all road users.
c. Increased enforcement of Regulations regarding excessive speed (especially in speed limit zones) and reckless or dangerous driving
Sections 142 (Driving at excessive speed) and 143 (Driving recklessly or dangerously) of MVO 1983 apply.
Safer Roads d. Rationalization of inappropriate activities on, adjacent to or near the road
Different parts of the road are designed for different purposes. Inappropriate activities are those which reduce the capacity of any part of the road to serve its design purpose.
19
e. Provision of facility where appropriate for conflicting road uses
Conflicting road uses are, turn and through traffic; stopped and through traffic; non-motorized and motorized traffic; slow and faster traffic; pedestrians and vehicles.
f. Establishment of speed limit zones where warranted
Speed limit zones can only be established where the nature and extent of adjacent activities warrants reduced vehicle speed. In other cases, initiative (a) applies.
g. Provision of road signs and pavement markings throughout the network, and removal of any obstruction to the placement and effective visibility of signs
The BRTA Traffic Signs Manual contains the standards for road signs and pavement markings.
Safer Vehicles
h. Increased enforcement of Regulations regarding unsafe vehicle condition and overloading.
Sections 86 (Limits of weight) and 149 (Using vehicle in unsafe condition) of MVO 1983 apply.
CURRENT NATIONAL GOVERNMENT POLICY FOR ROAD SAFTY
a. Overall road safety target for our government :50% reduction in road traffic accident fatalities within 25 years. Source “draft national roadsafety strategic action plan 2008-2010”.
b. National road safety policy, strategy; plan ofaction and/or priority areas :
S1 no. Sectors Objectives1. National road safety
council Reduction of road accident and casualties by implementation of adequately resourced national and district multisectoral road safety plans under the guidance of NRSC and monitored by BRTA
2. Accident data system To establish an accurate and comprehensive national
20
accident and casualty database, to ensure that the data is disseminated and use to identify problems and design remedial measures.
3. Road engineering To prevent road accidents through more safety conscious planning, design construction and maintenance of roads andimprove hazardous locations using low cost.
4. traffic legislation Revise and extract traffic legislation promoting roaduser compliance with regulations intended tomaintain a safe and efficient traffic flow
5. traffic enforcement To develop a more effective and efficient traffic policecapable of instilling safer road user attitudes and behavior through the use of modern training, increasedmobility, equipment and expanded power.
6. Driver training and testing To improve road safety by ensuring minimum standardsfor driver competence through improved drivertraining and testing procedures.
7. Vehicle safety To improve the road worthiness of vehicle usingroads by ensuring that minimum safety standardsare met and to reduce the negative effects of transporton the environment, particularly in terms of air pollution.
8. Education and publicity To implement road safety education and publicityprogrammers in order to improve the knowledge,attitude and behaviors of all road users, through a combination of formal education, non-formal education, adult program me and mass communication.
9. Medical services . To improve the emergency assistance, hospital care andrehabilitation available for road traffic accident victimsin addition to having the medical professionalsactively promotes road safety and help identify thetrue incidence of road accident casualties.
Source : “ draft national road safety strategic action plan 2008-2010”, BNRSC
c. National road safety awareness campaigns andtraining programs carried out :To implement road safety education and publicity programs in order to improve theknowledge, attitudes and behavior of all road users through a combination of formaleducation, non-formal education, adult programs and mass communication.
Sub-sectors Agency responsibleFormal education Ministry of education
National curriculum and text book boardNon formal education Department of non formal education
Non government organizationMaterials Ministry of education
Bangladesh road transport authorityAccident research institute( BUET )
Community programs Department of non formal educationNon government organizationBangladesh road transport authorityAccident research institute( BUET )
21
Publicity Ministry of communicationMass communication departmentBangladesh road transport authority
Training of BRTA staff Bangladesh road transport authorityAccident research institute ( BUET)
Source : “draft national road safety strategic action plan 2008-2010”, BNSRCD. DESIGNATED NATIONAL LEAD AGENCYFOR ROAD SAFRTY :Bangladesh national road safety council ( NSRC)E. Resources allocated to road safety issues. Sourcesof financing road safety(i.c road funds, road safety levies on insurance premiums )
Bangladesh 2009 Road Safety Country Status ReportAdditional Information (23/9/10)
Current national government policy for road safety:1. Government has taken initiatives with a vision to achieve a target of 50% reduction inroad accident fatalities within 15 years. Against which for the next three years roadsafety action plan chalked out to set a goal towards achieving a 10-12% reduction in road accident fatalities by the end of the year 2010.
2. National road safety strategic action plan 2008-2010 was approved by national roadsafety council (NRSC). The priority areas are accident data system; road engineeringtraffic legislation; traffic enforcement; driver training and testing; vehicle safetyeducation and publicity; and medical services.3. Bangladesh Road Transport Authority (BRTA) under the Ministry of Communicationhas taken publicity programme to ensure road safety through daily newspaper, radio-television, leaflet, posters, stickers etc. BRTA already arranged 81 trainingprogrammes for professional drivers to develop skill and awareness on safe drivingwhich covers 8500 drivers by the end of year 2010.4. Government allocates funds for holding training programmes, seminars, conferencescarrying out awareness campaigns and advertisement on road safety in electronic andprint media.5. Bangladesh Road Transport Authority (BRTA) under the Ministry of Communicationpublishes National Road Traffic Accident Report every year. The report is based ondata provided by the policy department based on road accidents across the country.*** Ministry of communication has taken a remarkable decision that all 2 lane singlecarriageway national and regional highways will be constructed in 4 lane dualcarriageway.
22
CONCLUSION
The high rate of fatal accidents in Bangladesh is cause for alarm and
unacceptable. The creation of NRSC and adoption of Road Safety Strategic
Action Plans are welcome moves towards improving road safety. However, not
many tangible results have been achieved so far. It is imperative to review the
measures adopted to identify the problems of implementation and improve or
modify them so that they can be more effective.
23
REFERENCES
National Road Traffic Accident (RTA) report 2008
Police Reported Accidents and BRTA 2009
RSC Report 2004, BRTA and MAAP Data Base
NATIONAL ROAD SAFETY TRATEGIC ACTION PLAN 2008-2010
Accident Research institute (ARI), BUET
Accident and casualties police reported FIR and MAAP Database vehicle
km : RHD Road user cost annual report (1999, 2001, 2003, 2005 )
draft national road safety strategic action plan 2008-2010”, BNRSC
Alam, M. Status of Accident Database Management in Bangladesh. inHoque, M.M. (ed.). Handout of Road Safety Training Course onUnderstanding Road Accident Problems and Their Remedies. AccidentResearch Centre, Bangladesh University of Engineering andTechnology. (2003).
Our concern topic is road safety in Bangladesh 2009 The Bangladesh country paper,
Rowshan ara begum, Deputy secretary,Ministry of communication Bangladesh