<XX> 50 Road safety of older Australians: recent statistics 1 Summary Demographic and economic changes in Australia are disproportionately impacting road safety fatality outcomes for older people. While the growth in population and numbers of licence-holders exceeds the growth in fatalities for all ages, there have been consistent reductions in deaths of younger people but flat trends and recent increases in deaths of older people. These recent increases appear mainly in driver and motorcyclist fatalities. Hospitalisation statistics (to 2009) show increasing trends for all age groups. The types of fatal crashes involving an older operator differ from fatal crashes which do not. The aggregated data presented here confirm previous findings that intersections are over-represented, as are multiple vehicle crashes. Run-off-the-road (often high-speed) crashes are under-represented. These and other related results are explored in greater depth in the list of references provided. Introduction This BITRE Information Sheet collates the latest available national data on casualty road crashes involving older Australians. Each year in Australia 250 people aged 65 and over die from road crashes and approximately 4,000 more are hospitalised. There is evidence of recent increasing annual trends in these age groups. The structure of the paper is as follows: firstly an overview of fatality and hospitalisation data over the last decade is given. This is followed by recent exposure statistics and standardised rates, including population changes, driver licensing statistics and estimated vehicle-kilometres-travelled. A number of tables are then presented that compare characteristics of fatal crashes on the basis of the age of the vehicle operators. A Suggested Reading section is also included as a guide to previous research in the area.
Transcript
<XX
> 50
Road safety of older Australians: recent statistics
1
Summary Demographic and economic changes in Australia are disproportionately impacting road safety fatality outcomes for older people. While the growth in population and numbers of licence-holders exceeds the growth in fatalities for all ages, there have been consistent reductions in deaths of younger people but flat trends and recent increases in deaths of older people. These recent increases appear mainly in driver and motorcyclist fatalities. Hospitalisation statistics (to 2009) show increasing trends for all age groups.
The types of fatal crashes involving an older operator differ from fatal crashes which do not. The aggregated data presented here confirm previous findings that intersections are over-represented, as are multiple vehicle crashes. Run-off-the-road (often high-speed) crashes are under-represented. These and other related results are explored in greater depth in the list of references provided.
Introduction
This BITRE Information Sheet collates the latest available national data on casualty road crashes involving older Australians. Each year in Australia 250 people aged 65 and over die from road crashes and approximately 4,000 more are hospitalised. There is evidence of recent increasing annual trends in these age groups.
The structure of the paper is as follows: firstly an overview of fatality and hospitalisation data over the last decade is given. This is followed by recent exposure statistics and standardised rates, including population changes, driver licensing statistics and estimated vehicle-kilometres-travelled. A number of tables are then presented that compare characteristics of fatal crashes on the basis of the age of the vehicle operators. A Suggested Reading section is also included as a guide to previous research in the area.
50
2
2
The tables presented include an overview of the problem in Australia and overseas, as well as more detailed analysis of crashes involving older operators. The results corroborate those from recent literature, but provide an Australia-wide compilation of data.
The age groups used to compare ‘older’ road users with others vary depending on the availability of data. Australian fatality data is available with any age groups, and in this report, the main age groups used are 65-74 years, 65+ and 75+. Rakotonirainy et al. (2012), using crash data from Queensland, included age groups of 60-69, 70-79 and 80+, and Koppel et al. (2012), studying Victorian crash data, used 65+ years. The National Road Safety Strategy 2011–2020 defines an ‘older driver’ as aged 65+ years (ATC 2011).
The crash data used has been extracted firstly from the Australian Road Deaths Database (ARDD)—a basic fatality resource based on the states and territories’ road safety databases (Sections 2 and 3), and secondly, the National Crash database (NCD)— a database containing a greater depth of data but current to 2012, also from the states and territories (Section 4). Non-fatal (hospitalisation) data has been sourced from the Australian Institute of Health and Welfare (AIHW) National Injury Surveillance Unit.
An overview of recent fatality and hospitalisation data
This section presents raw fatality and hospitalisation counts for the last ten years. The trends in annual deaths over time are compared between age groups. Of particular note are the differences between the trends in road crash fatalities and those in road crash hospitalisation data.
2.1 Data
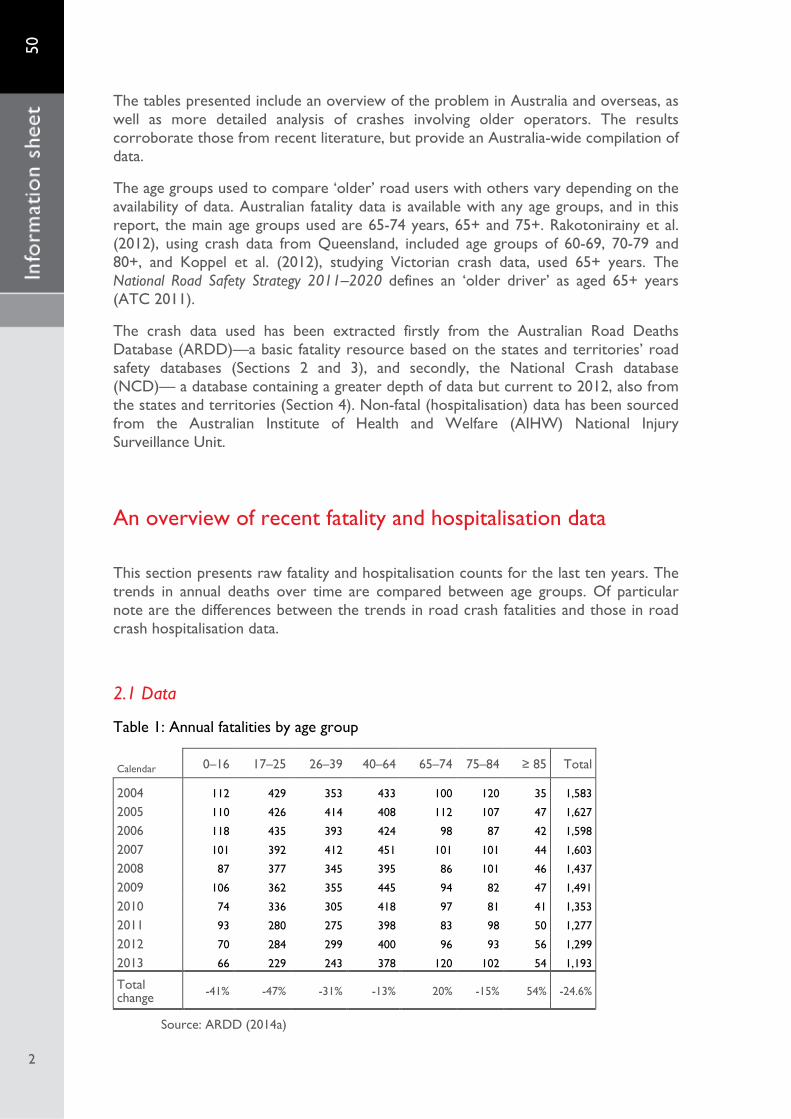
Table 1: Annual fatalities by age group
Calendar 0–16 17–25 26–39 40–64 65–74 75–84 ≥ 85 Total
2004 112 429 353 433 100 120 35 1,583
2005 110 426 414 408 112 107 47 1,627
2006 118 435 393 424 98 87 42 1,598
2007 101 392 412 451 101 101 44 1,603
2008 87 377 345 395 86 101 46 1,437
2009 106 362 355 445 94 82 47 1,491
2010 74 336 305 418 97 81 41 1,353
2011 93 280 275 398 83 98 50 1,277
2012 70 284 299 400 96 93 56 1,299
2013 66 229 243 378 120 102 54 1,193
Total change -41% -47% -31% -13% 20% -15% 54% -24.6%
Source: ARDD (2014a)
50
3
3
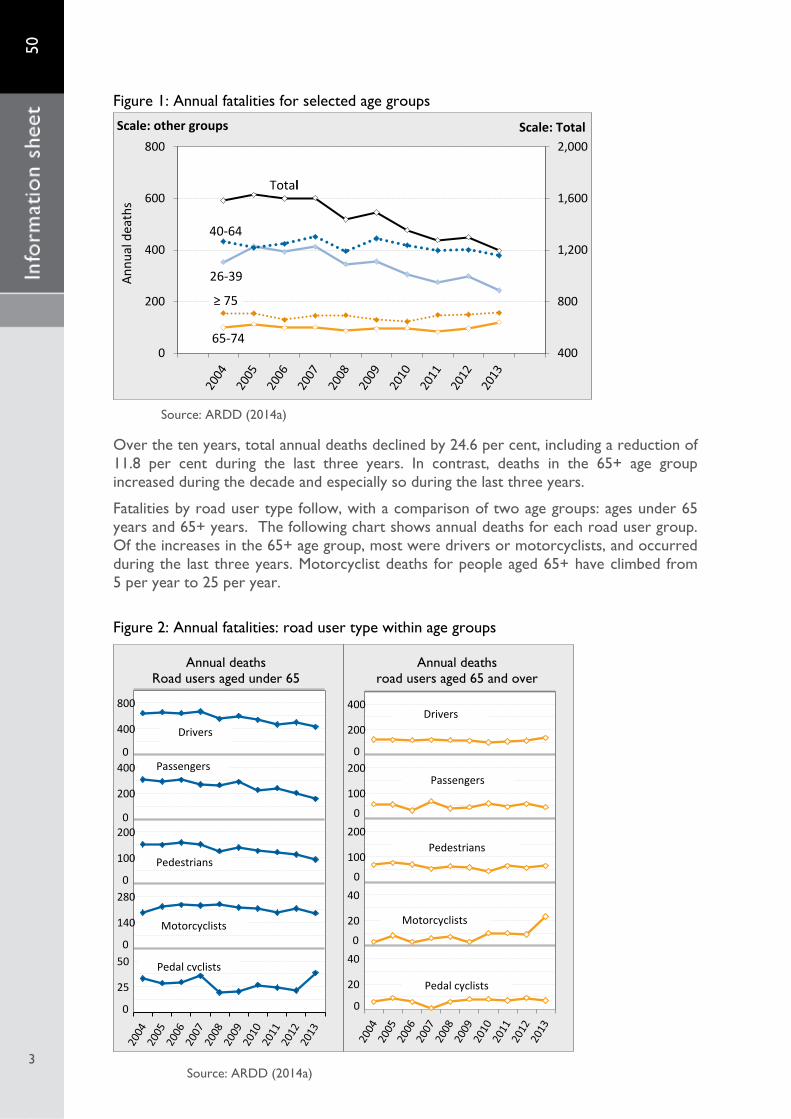
Figure 1: Annual fatalities for selected age groups
Source: ARDD (2014a)
Over the ten years, total annual deaths declined by 24.6 per cent, including a reduction of 11.8 per cent during the last three years. In contrast, deaths in the 65+ age group increased during the decade and especially so during the last three years.
Fatalities by road user type follow, with a comparison of two age groups: ages under 65 years and 65+ years. The following chart shows annual deaths for each road user group. Of the increases in the 65+ age group, most were drivers or motorcyclists, and occurred during the last three years. Motorcyclist deaths for people aged 65+ have climbed from 5 per year to 25 per year.
Figure 2: Annual fatalities: road user type within age groups
400
800
1,200
1,600
2,000
0
200
400
600
800
40-64
26-39
≥ 75
Annu
al d
eath
s
65-74
Total
Scale: Total Scale: other groups
0
20
40 0
20
40 0
100
200 0
100
200 0
200
400
0
25
50 0
140
280 0
100
200 0
200
400 0
400
800
Annual deaths road users aged 65 and over
Annual deaths Road users aged under 65
Motorcyclists
Pedal cyclists
Passengers
Pedestrians
Motorcyclists
Passengers
Drivers
Pedestrians
Drivers
Pedal cyclists
Source: ARDD (2014a)
50
4
4
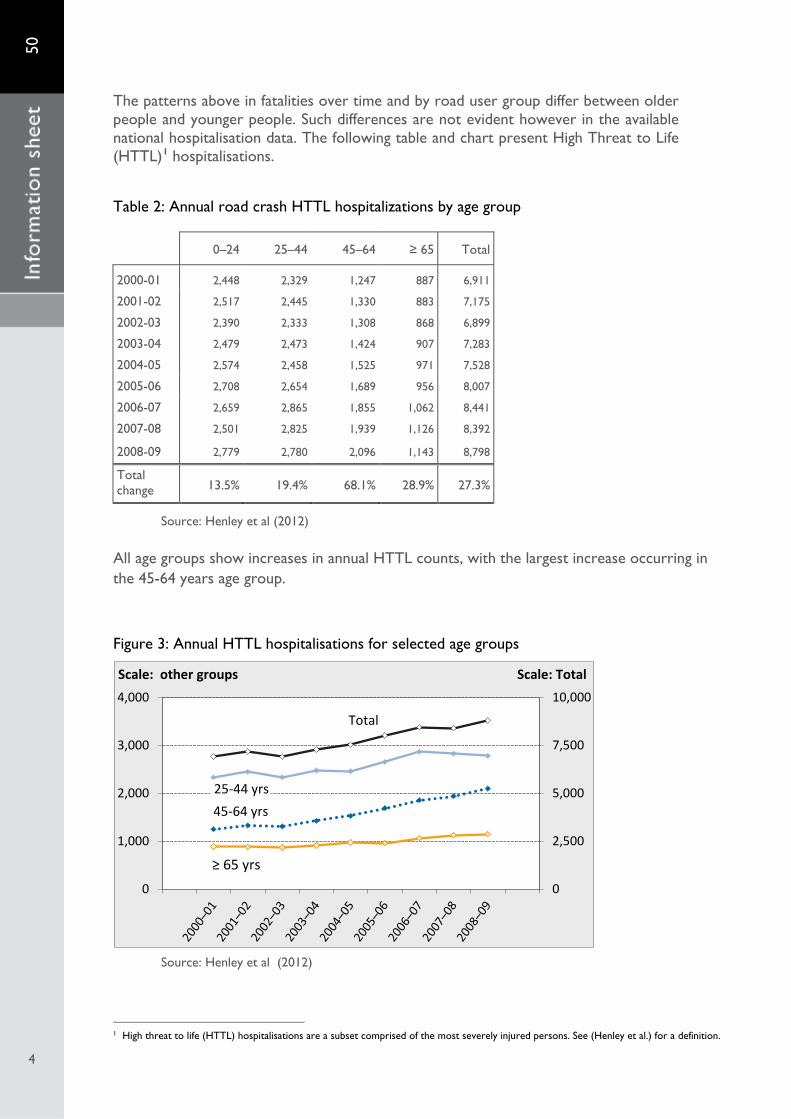
The patterns above in fatalities over time and by road user group differ between older people and younger people. Such differences are not evident however in the available national hospitalisation data. The following table and chart present High Threat to Life (HTTL)1 hospitalisations.
Table 2: Annual road crash HTTL hospitalizations by age group
Source: Henley et al (2012)
All age groups show increases in annual HTTL counts, with the largest increase occurring in the 45-64 years age group.
Figure 3: Annual HTTL hospitalisations for selected age groups
Source: Henley et al (2012)
1 High threat to life (HTTL) hospitalisations are a subset comprised of the most severely injured persons. See (Henley et al.) for a definition.
0–24 25–44 45–64 ≥ 65 Total
2000-01 2,448 2,329 1,247 887 6,911
2001-02 2,517 2,445 1,330 883 7,175
2002-03 2,390 2,333 1,308 868 6,899
2003-04 2,479 2,473 1,424 907 7,283
2004-05 2,574 2,458 1,525 971 7,528
2005-06 2,708 2,654 1,689 956 8,007
2006-07 2,659 2,865 1,855 1,062 8,441
2007-08 2,501 2,825 1,939 1,126 8,392
2008-09 2,779 2,780 2,096 1,143 8,798
Total change 13.5% 19.4% 68.1% 28.9% 27.3%
0
2,500
5,000
7,500
10,000
0
1,000
2,000
3,000
4,000
25-44 yrs 45-64 yrs
≥ 65 yrs
Total
Scale: Total Scale: other groups
50
5
5
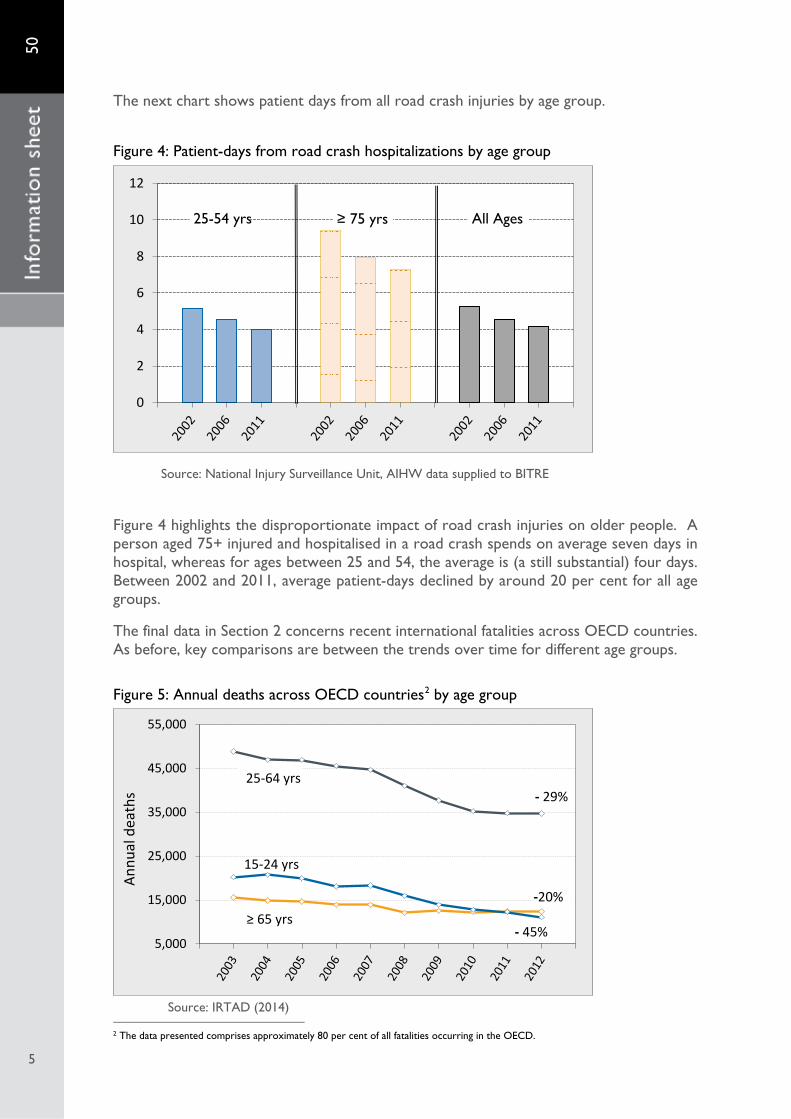
The next chart shows patient days from all road crash injuries by age group.
Figure 4: Patient-days from road crash hospitalizations by age group
Source: National Injury Surveillance Unit, AIHW data supplied to BITRE
Figure 4 highlights the disproportionate impact of road crash injuries on older people. A person aged 75+ injured and hospitalised in a road crash spends on average seven days in hospital, whereas for ages between 25 and 54, the average is (a still substantial) four days. Between 2002 and 2011, average patient-days declined by around 20 per cent for all age groups.
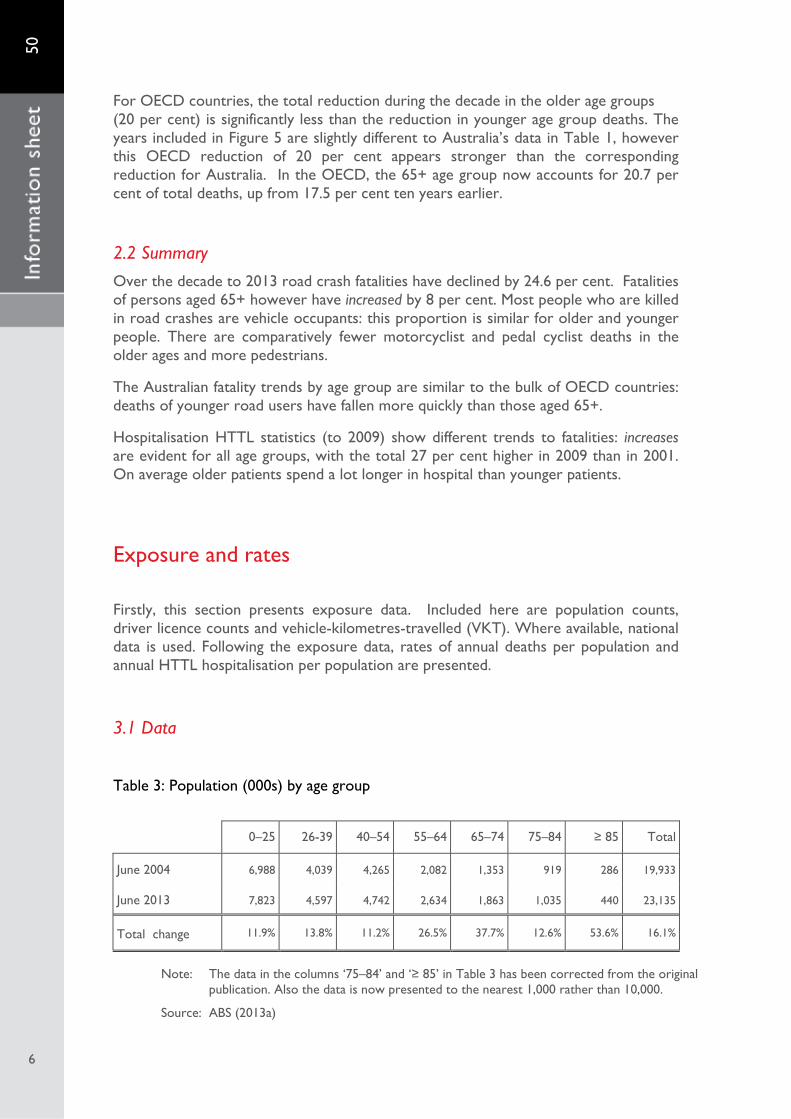
The final data in Section 2 concerns recent international fatalities across OECD countries. As before, key comparisons are between the trends over time for different age groups.
Figure 5: Annual deaths across OECD countries2 by age group
2 The data presented comprises approximately 80 per cent of all fatalities occurring in the OECD.
0
2
4
6
8
10
12
25-54 yrs ≥ 75 yrs All Ages
5,000
15,000
25,000
35,000
45,000
55,000
25-64 yrs
15-24 yrs
≥ 65 yrs
Annu
al d
eath
s - 29%
- 45%
-20%
Source: IRTAD (2014)
50
6
6
For OECD countries, the total reduction during the decade in the older age groups (20 per cent) is significantly less than the reduction in younger age group deaths. The years included in Figure 5 are slightly different to Australia’s data in Table 1, however this OECD reduction of 20 per cent appears stronger than the corresponding reduction for Australia. In the OECD, the 65+ age group now accounts for 20.7 per cent of total deaths, up from 17.5 per cent ten years earlier.
2.2 Summary Over the decade to 2013 road crash fatalities have declined by 24.6 per cent. Fatalities of persons aged 65+ however have increased by 8 per cent. Most people who are killed in road crashes are vehicle occupants: this proportion is similar for older and younger people. There are comparatively fewer motorcyclist and pedal cyclist deaths in the older ages and more pedestrians.
The Australian fatality trends by age group are similar to the bulk of OECD countries: deaths of younger road users have fallen more quickly than those aged 65+.
Hospitalisation HTTL statistics (to 2009) show different trends to fatalities: increases are evident for all age groups, with the total 27 per cent higher in 2009 than in 2001. On average older patients spend a lot longer in hospital than younger patients.
Exposure and rates
Firstly, this section presents exposure data. Included here are population counts, driver licence counts and vehicle-kilometres-travelled (VKT). Where available, national data is used. Following the exposure data, rates of annual deaths per population and annual HTTL hospitalisation per population are presented.
3.1 Data
Table 3: Population (000s) by age group
Note: The data in the columns ‘75–84’ and ‘≥ 85’ in Table 3 has been corrected from the original publication. Also the data is now presented to the nearest 1,000 rather than 10,000.
Source: ABS (2013a)
0–25 26-39 40–54 55–64 65–74 75–84 ≥ 85 Total
June 2004 6,988 4,039 4,265 2,082 1,353 919 286 19,933
June 2013 7,823 4,597 4,742 2,634 1,863 1,035 440 23,135
Total change 11.9% 13.8% 11.2% 26.5% 37.7% 12.6% 53.6% 16.1%
50
7
7
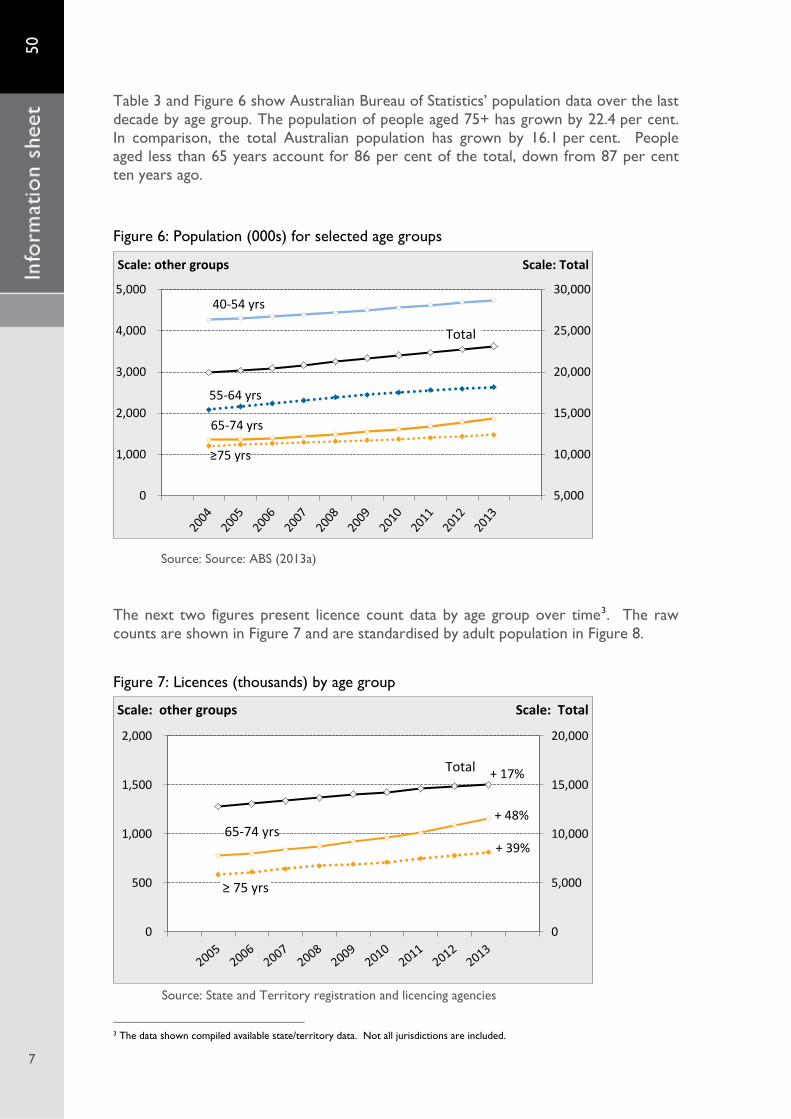
Table 3 and Figure 6 show Australian Bureau of Statistics’ population data over the last decade by age group. The population of people aged 75+ has grown by 22.4 per cent. In comparison, the total Australian population has grown by 16.1 per cent. People aged less than 65 years account for 86 per cent of the total, down from 87 per cent ten years ago.
Figure 6: Population (000s) for selected age groups
Source: Source: ABS (2013a)
The next two figures present licence count data by age group over time3. The raw counts are shown in Figure 7 and are standardised by adult population in Figure 8.
Figure 7: Licences (thousands) by age group
3 The data shown compiled available state/territory data. Not all jurisdictions are included.
5,000
10,000
15,000
20,000
25,000
30,000
0
1,000
2,000
3,000
4,000
5,000
≥75 yrs
55-64 yrs
65-74 yrs
40-54 yrs
Total
Scale: Total Scale: other groups
0
5,000
10,000
15,000
20,000
0
500
1,000
1,500
2,000
≥ 75 yrs
65-74 yrs
Total
Scale: Total Scale: other groups
+ 17%
+ 48%
+ 39%
Source: State and Territory registration and licencing agencies
50
8
8
Total licence counts have increased by 17 per cent over the last decade, and for the 65+ age group, the increase was 44 per cent. There has been an acceleration over the last two years in the 65-74 age group, an effect which is also seen in the population counts.
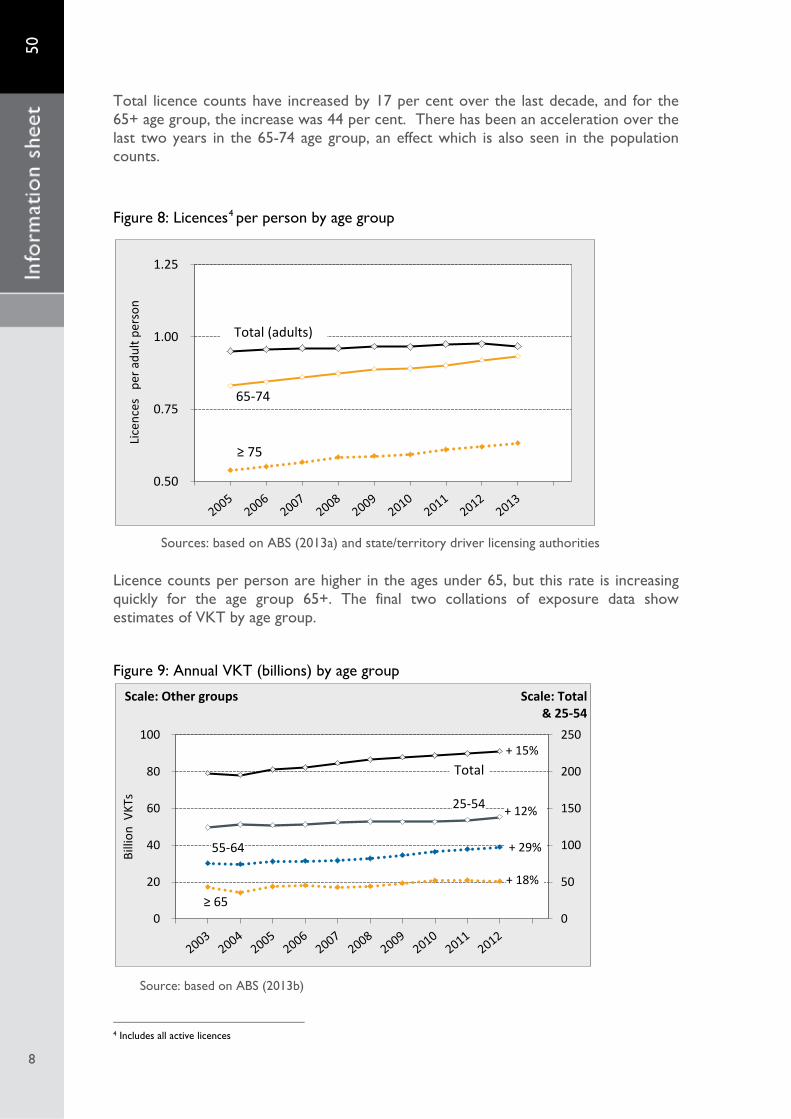
Figure 8: Licences4 per person by age group
Sources: based on ABS (2013a) and state/territory driver licensing authorities
Licence counts per person are higher in the ages under 65, but this rate is increasing quickly for the age group 65+. The final two collations of exposure data show estimates of VKT by age group. Figure 9: Annual VKT (billions) by age group
4 Includes all active licences
0.50
0.75
1.00
1.25
Lice
nces
pe
r adu
lt pe
rson
≥ 75
65-74
Total (adults)
0
50
100
150
200
250
0
20
40
60
80
100
Billi
on V
KTs
≥ 65
55-64
Total
25-54
+ 18%
+ 29%
+ 12%
+ 15%
Scale: Total & 25-54
Scale: Other groups
Source: based on ABS (2013b)
50
9
9
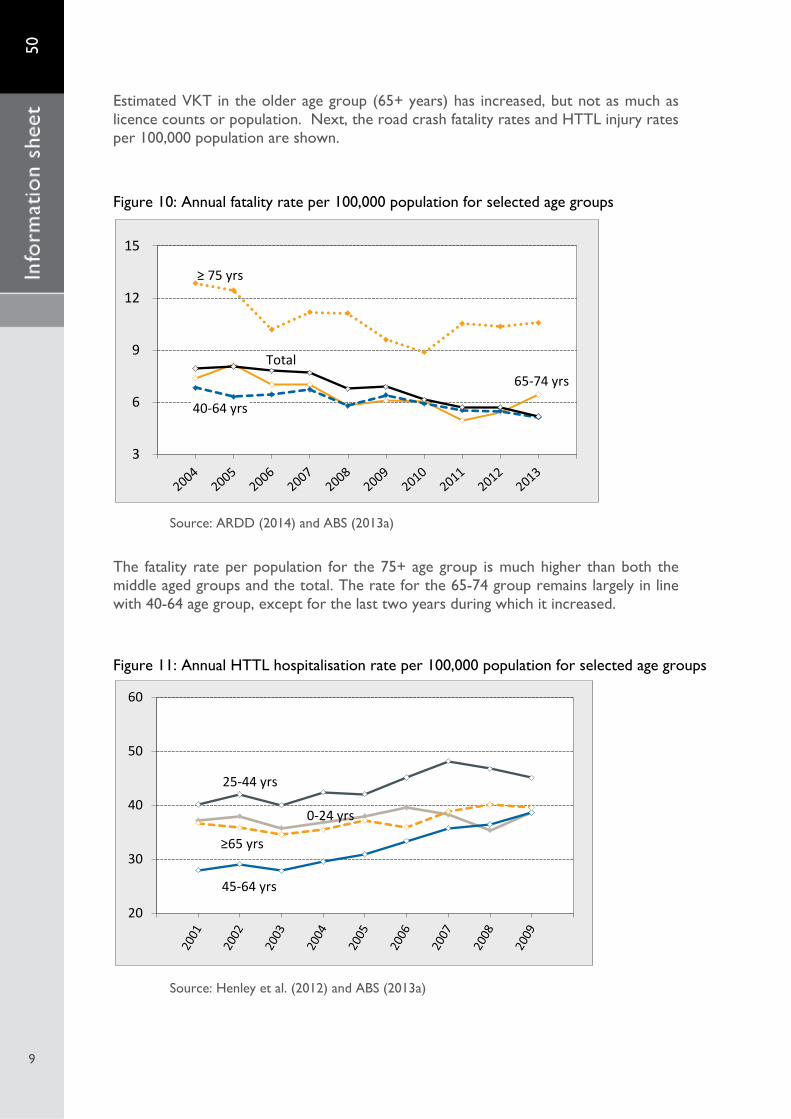
Estimated VKT in the older age group (65+ years) has increased, but not as much as licence counts or population. Next, the road crash fatality rates and HTTL injury rates per 100,000 population are shown.
Figure 10: Annual fatality rate per 100,000 population for selected age groups
Source: ARDD (2014) and ABS (2013a)
The fatality rate per population for the 75+ age group is much higher than both the middle aged groups and the total. The rate for the 65-74 group remains largely in line with 40-64 age group, except for the last two years during which it increased.
Figure 11: Annual HTTL hospitalisation rate per 100,000 population for selected age groups
Source: Henley et al. (2012) and ABS (2013a)
3
6
9
12
15
≥ 75 yrs
65-74 yrs
40-64 yrs
Total
20
30
40
50
60
0-24 yrs
25-44 yrs
45-64 yrs
≥65 yrs
50
10
10
As seen in Figure 11, the trend in HTTL hospitalisations per population increases most strongly in the 45-64 years age group.
3.2 Summary The population for groups 65–74 years and 85+ are growing faster than that of other age groups. Counts of drivers’ licences in the 65+ age group are growing more strongly than population growth. Over 60 per cent of people aged 75 years and over have a drivers licence, up from 54 per cent ten years ago.
Over the decade, the rates of annual fatalities per population have fallen for all age groups. More recently for older people however they have increased. For HTTL injuries the rates per population have increased for all age groups above 24 years.
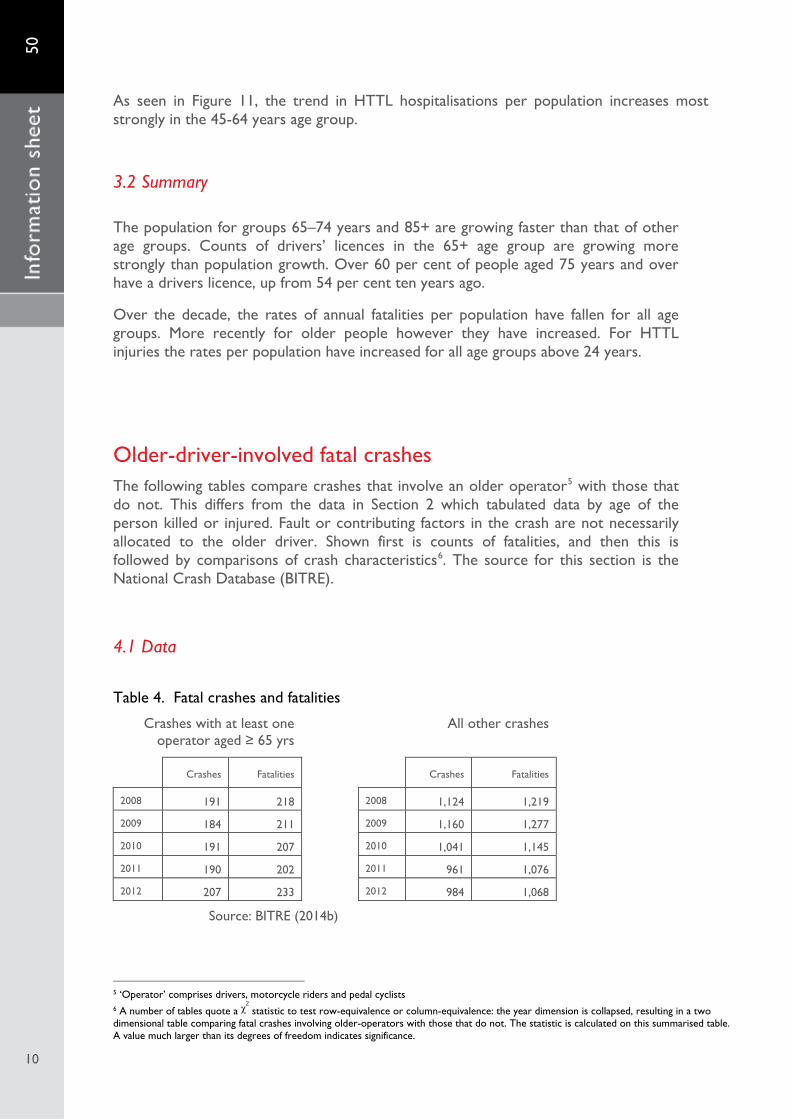
Older-driver-involved fatal crashes The following tables compare crashes that involve an older operator5 with those that do not. This differs from the data in Section 2 which tabulated data by age of the person killed or injured. Fault or contributing factors in the crash are not necessarily allocated to the older driver. Shown first is counts of fatalities, and then this is followed by comparisons of crash characteristics6. The source for this section is the National Crash Database (BITRE).
4.1 Data
Table 4. Fatal crashes and fatalities
Crashes with at least one operator aged ≥ 65 yrs
All other crashes
Crashes Fatalities Crashes Fatalities
2008 191 218 2008 1,124 1,219
2009 184 211 2009 1,160 1,277
2010 191 207 2010 1,041 1,145
2011 190 202 2011 961 1,076
2012 207 233 2012 984 1,068
Source: BITRE (2014b)
5 ‘Operator’ comprises drivers, motorcycle riders and pedal cyclists 6 A number of tables quote a χ
2 statistic to test row-equivalence or column-equivalence: the year dimension is collapsed, resulting in a two
dimensional table comparing fatal crashes involving older-operators with those that do not. The statistic is calculated on this summarised table. A value much larger than its degrees of freedom indicates significance.
50
11
11
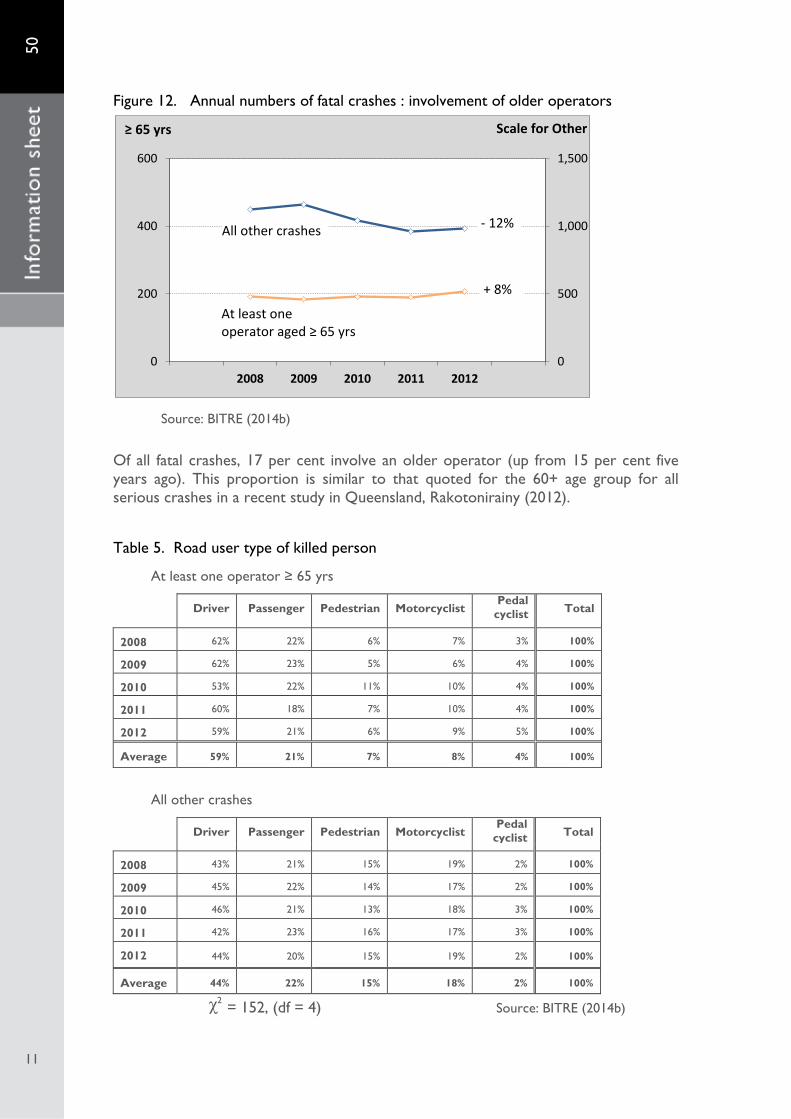
Figure 12. Annual numbers of fatal crashes : involvement of older operators
Source: BITRE (2014b)
Of all fatal crashes, 17 per cent involve an older operator (up from 15 per cent five years ago). This proportion is similar to that quoted for the 60+ age group for all serious crashes in a recent study in Queensland, Rakotonirainy (2012).
Table 5. Road user type of killed person
At least one operator ≥ 65 yrs
Driver Passenger Pedestrian Motorcyclist Pedal
cyclist Total
2008 62% 22% 6% 7% 3% 100%
2009 62% 23% 5% 6% 4% 100%
2010 53% 22% 11% 10% 4% 100%
2011 60% 18% 7% 10% 4% 100%
2012 59% 21% 6% 9% 5% 100%
Average 59% 21% 7% 8% 4% 100%
All other crashes
Driver Passenger Pedestrian Motorcyclist Pedal
cyclist Total
2008 43% 21% 15% 19% 2% 100%
2009 45% 22% 14% 17% 2% 100%
2010 46% 21% 13% 18% 3% 100%
2011 42% 23% 16% 17% 3% 100%
2012 44% 20% 15% 19% 2% 100%
Average 44% 22% 15% 18% 2% 100%
χ2 = 152, (df = 4) Source: BITRE (2014b)
0
500
1,000
1,500
0
200
400
600
2008 2009 2010 2011 2012
At least one operator aged ≥ 65 yrs
All other crashes - 12%
+ 8%
≥ 65 yrs Scale for Other
50
12
12
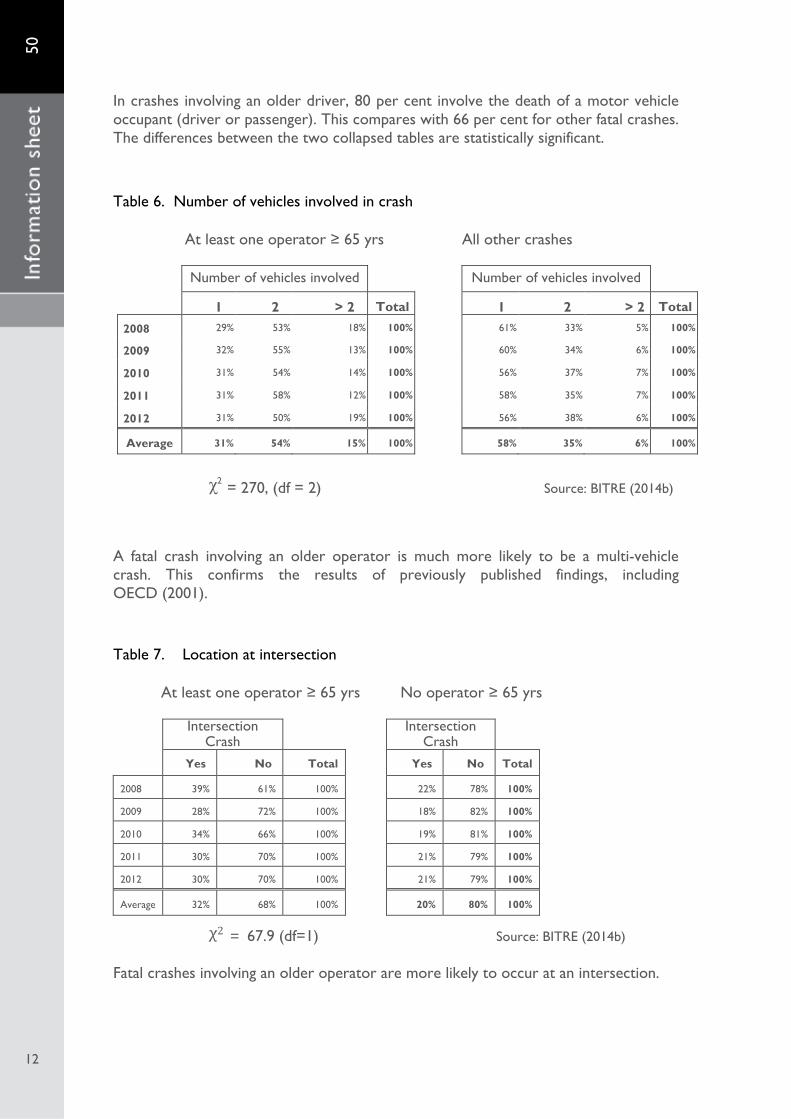
In crashes involving an older driver, 80 per cent involve the death of a motor vehicle occupant (driver or passenger). This compares with 66 per cent for other fatal crashes. The differences between the two collapsed tables are statistically significant.
Table 6. Number of vehicles involved in crash At least one operator ≥ 65 yrs All other crashes
Number of vehicles involved Number of vehicles involved
1 2 > 2 Total 1 2 > 2 Total
2008 29% 53% 18% 100% 61% 33% 5% 100%
2009 32% 55% 13% 100% 60% 34% 6% 100%
2010 31% 54% 14% 100% 56% 37% 7% 100%
2011 31% 58% 12% 100% 58% 35% 7% 100%
2012 31% 50% 19% 100% 56% 38% 6% 100%
Average 31% 54% 15% 100% 58% 35% 6% 100%
χ2 = 270, (df = 2) Source: BITRE (2014b)
A fatal crash involving an older operator is much more likely to be a multi-vehicle crash. This confirms the results of previously published findings, including OECD (2001).
Table 7. Location at intersection
At least one operator ≥ 65 yrs No operator ≥ 65 yrs
Intersection
Crash Intersection
Crash
Yes No Total Yes No Total
2008 39% 61% 100% 22% 78% 100%
2009 28% 72% 100% 18% 82% 100%
2010 34% 66% 100% 19% 81% 100%
2011 30% 70% 100% 21% 79% 100%
2012 30% 70% 100% 21% 79% 100%
Average 32% 68% 100% 20% 80% 100%
χ2 = 67.9 (df=1) Source: BITRE (2014b)
Fatal crashes involving an older operator are more likely to occur at an intersection.
50
13
13
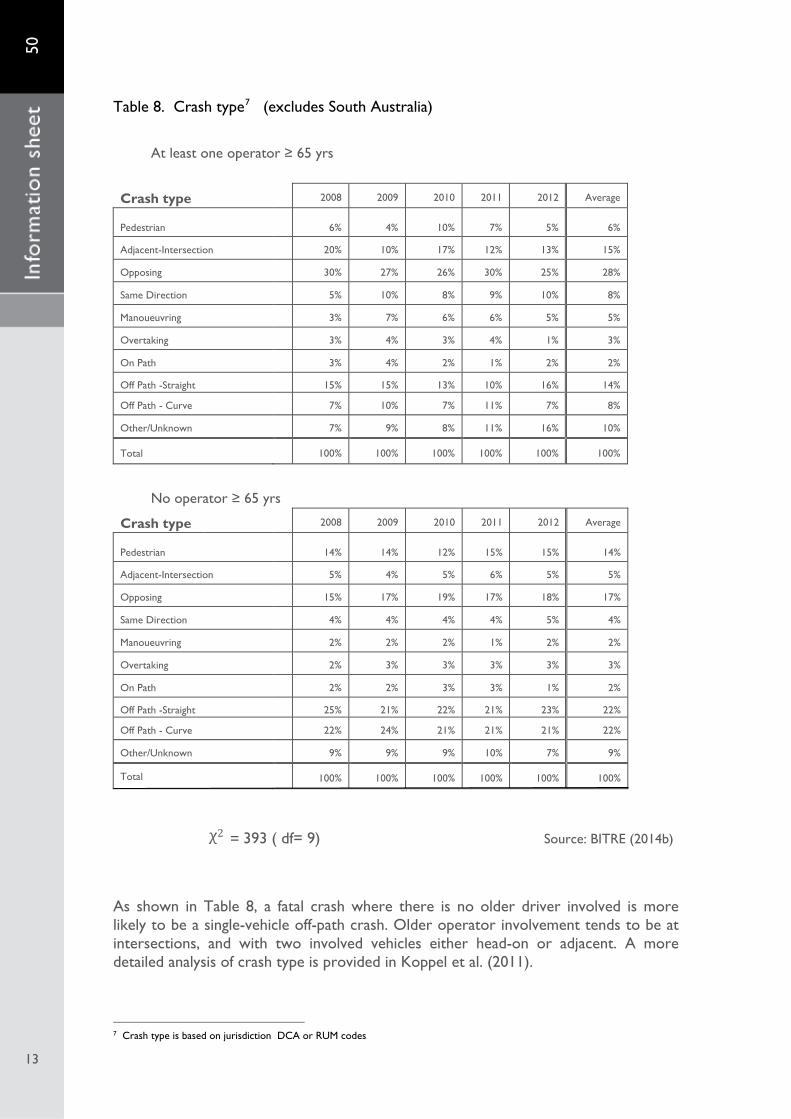
Table 8. Crash type7 (excludes South Australia)
At least one operator ≥ 65 yrs
Crash type
2008 2009 2010 2011 2012 Average
Pedestrian 6% 4% 10% 7% 5% 6%
Adjacent-Intersection 20% 10% 17% 12% 13% 15%
Opposing 30% 27% 26% 30% 25% 28%
Same Direction 5% 10% 8% 9% 10% 8%
Manoueuvring 3% 7% 6% 6% 5% 5%
Overtaking 3% 4% 3% 4% 1% 3%
On Path 3% 4% 2% 1% 2% 2%
Off Path -Straight 15% 15% 13% 10% 16% 14%
Off Path - Curve 7% 10% 7% 11% 7% 8%
Other/Unknown
7% 9% 8% 11% 16% 10%
Total
100% 100% 100% 100% 100% 100%
No operator ≥ 65 yrs Crash type
2008 2009 2010 2011 2012 Average
Pedestrian 14% 14% 12% 15% 15% 14%
Adjacent-Intersection 5% 4% 5% 6% 5% 5%
Opposing 15% 17% 19% 17% 18% 17%
Same Direction 4% 4% 4% 4% 5% 4%
Manoueuvring 2% 2% 2% 1% 2% 2%
Overtaking 2% 3% 3% 3% 3% 3%
On Path 2% 2% 3% 3% 1% 2%
Off Path -Straight 25% 21% 22% 21% 23% 22%
Off Path - Curve 22% 24% 21% 21% 21% 22%
Other/Unknown
9% 9% 9% 10% 7% 9%
Total
100% 100% 100% 100% 100% 100%
χ2 = 393 ( df= 9) Source: BITRE (2014b)
As shown in Table 8, a fatal crash where there is no older driver involved is more likely to be a single-vehicle off-path crash. Older operator involvement tends to be at intersections, and with two involved vehicles either head-on or adjacent. A more detailed analysis of crash type is provided in Koppel et al. (2011).
7 Crash type is based on jurisdiction DCA or RUM codes
50
14
14
4.2 Summary
There are qualitative differences between crashes involving older operators with those that do not: a greater proportion of the former occur at intersections and also, on average, involve more than one vehicle. In older operator-involved crashes, 80 per cent of the killed people are vehicle occupants, which is a significantly higher proportion than found in other crashes. This could however be explained by there being fewer motorcyclists and pedal cyclists in the older age groups.
50
15
15
References and suggested reading
Australian Bureau of Statistics 2013a, Australian Demographic Statistics, September 2013, Cat no 3101.0, ABS Canberra.
Australian Bureau of Statistics 2013b, Survey Of Motor Vehicle Use 12 months ended June 2012, Cat no 9208.0, ABS Canberra.
BITRE 2014a, Australian Road Deaths Database, BITRE Canberra < http://www.bitre.gov.au/statistics/safety/fatal_road_crash_database.aspx > accessed April 2014.
BITRE 2014b, National Crash Database, BITRE Canberra.
Clarke D, Ward P, Bartle C and Truman W, ‘Older drivers’ road traffic crashes in the UK’, Accident Analysis and Prevention Vol 42 (2010), 1018–1024 , DOI :10.1016/j.aap.2009.12.005.
Catchpole J, Styles T, Pyta V and Imberger K (2005) ‘Exposure and accident risk among
older drivers’, Research Report ARR 366, ARRB Group Ltd, Vermont South, Victoria, Australia.
Henley G & Harrison JE, 2012, ‘Trends in serious injury due to land transport accidents,
Australia, 2000-01 to 2008–09’. Injury Research and Statistics Series no. 66. Cat. no. INJCAT 142. Canberra: AIHW.
International Road Traffic and Accident Database,
< http://internationaltransportforum.org/irtadpublic/index.html > accessed April 2014 Koppel S, Bohensky M, Langford J and Taranto D, 2011 ‘Older Drivers, Crashes and
Injuries’, Traffic Injury Prevention, 12:5, 459-467, DOI: 10.1080/15389588.2011.580802. National Road Safety Strategy, 2011, Australian Transport Council Organisation for Economic Co-operation and Development. ‘Ageing and Transport:
Mobility Needs and Safety Issues’, OECD Publications; 2001Paris, France. Rakotonirainy A, Steinhardt D, Delhomme P, Darvell M, and Schramm A, 2012, ‘Older
drivers’ crashes in Queensland, Australia’, Accident Analysis and Prevention Vol 48, 423–429 , DOI:10.1016/j.aap.2012.02.016.
Tefft, B, 2008, ‘Risks older drivers pose to themselves and to other road users’
Journal of Safety Research Vol 39, 577–582, DOI:10.1016/j.jsr.2008.10.002.
Creative Commons Attribution 3.0 Australia Licence is a standard form licence agreement that allows you to copy, communicate and adapt this publication provided that you attribute the work to the Commonwealth and abide by the other licence terms. A summary of the licence terms is available from http://creativecommons.org/licenses/by/3.0/au/deed.en.
The full licence terms are available from http://creativecommons.org/licenses/by/3.0/au/legalcode.
This publication should be attributed in the following way; Bureau of Infrastructure, Transport and Regional Economics (BITRE), Road Safety of Older Australians —Recent Statistics, Information Sheet 50, BITRE, Canberra.
Acknowledgement BITRE gratefully acknowledges the supply of crash and licencing data from the following agencies:
Transport for NSW Vicroads Department of Transport and Main Roads, Queensland Department for Transport, Energy and Infrastructure, South Australia. Western Australia Police Department Transport, Western Australia Department of Infrastructure, Energy and Resources, Tasmania Department of Transport, Northern Territory Department of Territory and Municipal Services, ACT Australian Bureau of Statistics Australian Institute of Health and Welfare, National Injury Surveillance Unit
Use of the Coat of Arms The Department of the Prime Minister and Cabinet sets the terms under which the Coat of Arms is used. Please refer to the Department’s Commonwealth Coat of Arms and Government Branding web page http://www.dpmc.gov.au/guidelines/index.cfm#brand and in particular, the Guidelines on the use of the Commonwealth Coat of Arms publication.
Contact us This publication is available in PDF format. All other rights are reserved, including in relation to any Departmental logos or trade marks which may exist. For enquiries regarding the licence and any use of this publication, please contact:
Department of Infrastructure and Regional Development Bureau of Infrastructure, Transport and Regional Economics (BITRE) GPO Box 501, Canberra ACT 2601, Australia