55
University of Toronto Department of Economics March 08, 2013 By Gilles Duranton, Peter Morrow and Matthew Turner Roads and Trade: Evidence from the U.S. Working Paper 479

University of Toronto Department of Economics
March 08, 2013
By Gilles Duranton, Peter Morrow and Matthew Turner
Roads and Trade: Evidence from the U.S.
Working Paper 479

Roads and Trade: Evidence from the US§
Gilles Duranton∗University of Pennsylvania
Peter M. Morrow‡
University of Toronto
Matthew A. Turner‡
University of Toronto
Revised: 26 February 2013
Abstract: We estimate the effect of interstate highways on the leveland composition of trade for us cities. Highways within cities have alarge effect on the weight of city exports with an elasticity of approxi-mately 0.5. We find little effect of highways on the total value of exports.Consistent with this, we find that cities with more highways specializein sectors producing heavy goods.
Keywords: interstate highways, transportation costs, trade and specialization.
jel classification: f14, r41, r49
§Thanks to Kristian Behrens, Ig Horstmann, Steve Redding, Rosa Sanchis, Aloysius Siow, Dan Trefler, the anonymousreferees, the editor Imran Rasul, and seminar and conference participants for comments and suggestions. Financialsupport from the Canadian Social Science and Humanities Research Council is gratefully acknowledged. We are alsograteful to Magda Biesiada and Christian Dippel for their assistance in preparing the data used in this project, and toNathaniel Baum-Snow for sharing his data with us.∗Wharton School, University of Pennsylvania, 3620 Locust Walk, Philadelphia, pa 19104, usa (e-mail: duran-
[email protected]; website: https://real-estate.wharton.upenn.edu/profile/21470/). Also affiliated withthe Centre for Economic Policy Research, the Rimini Centre for Economic Analysis, and the Spatial Economic Centre atthe London School of Economics.
‡Department of Economics, University of Toronto, 150 Saint George Street, Toronto, Ontario m5s 3g7, Canada (e-mail:[email protected]; website: http://www.economics.utoronto.ca/morrow/).
‡Department of Economics, University of Toronto, 150 Saint George Street, Toronto, Ontario m5s 3g7, Canada (e-mail:[email protected]; website: http://www.economics.utoronto.ca/mturner/index.htm).

1. Introduction
We investigate the effect of highways between and within cities on the weight and value of bilateraltrade between large us cities. We base our investigation on data describing trade flows, theinterstate highway network, city employment by sector since 1956, and other city characteristics.Identifying the causal effect of highways on trade is difficult. Regressing a measure of trade atthe city level on a measure of city roads may not isolate the causal effect of roads on trade sincehighway construction may be more prevalent in cities that trade more (if highways are built tosupport trade) or, alternatively, in cities that trade less (if highways are built to foster trade). Weresolve this inference problem by exploiting exogenous variation in exploration routes between1528 and 1850, in railroad routes circa 1898, and in a 1947 plan of the interstate highway network.We find that a 10% increase in highways within a city causes about a 5% increase in the weight ofits exports. We find weak evidence of a small effect on the value of these exports. It follows thathighways within cities cause them to specialize in sectors that have high weight to value ratios. Wecorroborate this conclusion with city level employment data. Finally, we also find that variationsin highways between cities cause large variations in the weight and value of trade as they reducetravel distances between cities.
Understanding the effect of highways on trade is important for a number of reasons. First, tradeand specialization play a central role in the process of economic growth. Consequently, under-standing the forces that promote trade is among the most fundamental problems that economistsface. Second, the construction and maintenance of transportation infrastructure is among ourmost costly policy endeavors and our understanding of the effects of such investments remainsrudimentary.1
Our analysis of how highways change trade flows consists of three components: a theoreti-cal framework which allows us to understand the effects of highways on trade, motivates oureconometric specification, and highlights some identification issues; high quality data describinghighways, trade flows, and relevant covariates; and a strategy for resolving the possible endo-geneity of highways to trade flows. The theoretical model which forms the basis for our analysisis an extension of Anderson and van Wincoop’s (2003) framework to an economy with multipleproductive sectors. This model leads to a gravity equation describing the effects of distance onequilibrium trade flows. The model also implies that cities with a relative abundance of highwaysspecialize in sectors that are relatively intensive in their use of city highways. Taken together, wehave a logically consistent framework to examine the effect of within- and between-city highwayson the weight and value of inter-city trade, and to assess the effect of highways on the compositionof production and trade for a given city. Our theoretical model leads to a two-step estimationstrategy resembling Redding and Venables (2004). In the first step we estimate gravity models forthe value and weight of trade flows, each as a function of distance and exporter- and importer-specific fixed effects. These fixed effects measure a city’s propensity to export or import value or
1According to Couture, Duranton, and Turner (2012), the us spends nearly 200 billion dollars a year on roadconstruction and maintenance; the value of capital stock associated with road transportation in the us tops 5 trilliondollars; the average driver spent about 72 minutes a day driving; and the median household devotes 18% of its budgetto road travel.
1

weight conditional on distance and trading partner characteristics. In the second step, we explainthese fixed effects as functions of within-city highways and other city characteristics. In a separateempirical exercise, we examine the sectoral composition of exporter employment as a function ofwithin-city highways.
Our three primary data sources are the us Commodity Flow Survey (cfs), the Highway Per-formance Monitoring System (hpms), and the County Business Patterns (cbp). From the cfs wecalculate bilateral domestic trade flows for a cross-section of major us cities. From the hpms wecalculate the interstate highway distance between cities. This distance reflects the cost of travelingbetween cities. From the hpms we also calculate the stock of interstate highway kilometers withineach city’s boundaries. This stock of city highways measures the city’s capacity to move trucksthrough the congested portion of the city onto the inter-city portion of the highway network.We use the cbp to construct control variables for employment in our main empirical exerciseand use historical employment data going back to 1956 to analyse the effect of highways on cityspecialisation. Our data also describe a rich set of city level control variables.
It is possible that the desire to trade will cause cities to build highways, or that some unobservedcity characteristics cause both road building and trade. Such endogeneity and missing variableproblems may confound estimates of the relationship between highways and trade. Resolvingthese inference problems is the third part of our analysis. We rely on instrumental variablesestimation using instruments based on maps of the routes of major expeditions of explorationbetween 1528 and 1850, a map of major railroad routes in 1898, and a preliminary plan of theinterstate highway system from 1947.
Our theoretical model requires that the cost of trading heavy goods be more sensitive totransportation costs than trade in light goods. Thus, changes to a city’s highways should affectcomparative advantage in heavy goods. Our data confirm this qualitative conclusion and suggestthat the effect of roads on trade and specialization is economically important. Our main results arethat a 10% increase in highways at the city of departure causes a near 5% increase in tons exported,and that a change in highways causes at best a small change in the value of a city’s exports. In aseparate analysis we investigate the relationship between city sectoral employment and the stockof within-city highways. This investigation shows that cities with more highways employ morepeople in sectors producing heavy goods.
While the literature on trade investigates the effect of trade barriers and the role of transporta-tion costs, infrastructure receives less attention. Limão and Venables (2001) find a strong positiveassociation between an index of infrastructure quality and trade costs. In a similar vein, Clark,Dollar, and Micco (2004) also uncover a strong positive correlation between port efficiency andexports. This type of finding has been confirmed by more recent research (see Behar and Venables,2011, for a review).2 However, there are very few papers which can claim to identify the causal
2There is also a small literature that examines direct measures of transportation costs (Glaeser and Kohlhase, 2003,Combes and Lafourcade, 2005, Hummels, 2007) and one that focuses on the time costs associated with trade (Hummels,2001, Evans and Harrigan, 2005, Djankov, Freund, and Pham, 2010). Harrigan (2010) considers the role of goodscharacteristics in determining transportation costs and whether shipments arrive by air, sea, or ground. Finally theliterature in urban economics that looks at patterns of economic activity in cities only pays scant attention to trade(Duranton and Puga, 2000).
2

effects of infrastructure on trade.3 As a rare exception, Michaels (2008) examines the effect of accessto the interstate highway network on rural counties in the us.
In a recent paper closely related to our work, Donaldson (2012) examines the historical effectsof railroads in India on price differentials across regions, trade flows, and incomes. He findsstrong evidence that railroads decreased trade costs and the price gaps between regions, andincreased the value of trade between these regions. Interestingly he also finds that railroads led tohigher incomes in real terms and that most of these gains can be accounted for by the gains fromtrade. Our findings differ since we find a small and often insignificant effect of roads on trade invalue whereas we find strong effects on the specialization of economic activity. We think thesecontrasting results reflect contextual differences between railroads in colonial India and the us
interstate network in 2007. Colonial India relied mostly on agriculture and agricultural goods werenearly impossible to trade before the railroads were built. While we do not deny the importance ofthe us interstate network, we note that there are some feasible alternatives to road trade in the us
such as rail, airplane, or water transportation. We also note that workers are more freely mobile inmodern America than they were in colonial India, and so respond more rapidly to regional wagedifferences.
Our work and Donaldson’s (2012) also differ in their methodologies. Donaldson’s empiricalresults rely strongly on his model. Given data limitations, he can only compare the rail networkthat was built to placebo networks that were never built. Our approach is less reliant on aparticular model. To some extent, we are less confident that the greater complexity of today’stransportation networks and economic activity can be fully captured by a tractable model. On theother hand, we face fewer data limitations and can assess the empirical robustness of our findingsmore thoroughly.
Our work is also related to a small emerging literature that assesses the effects of investments intransportation infrastructure on the evolution of cities and countries. Fernald (1999) examines therelationship between infrastructure spending and productivity for us states, Baum-Snow (2007)examines the role of the interstate highway system in the suburbanization of us cities, and Duran-ton and Turner (2012) examines how city populations depend on the interstate highway system.While the particular questions addressed in these papers differ from ours, like them we worktowards a better understanding of the effects that transportation infrastructure has on economicdevelopment.
2. Data
We conduct two main empirical exercises. In one, we examine the relationship between roads andpairwise trade flows in a cross-section of cities. In the other, we consider a panel of cities andexamine the effect of roads on city level employment patterns in traded sectors. We here describethe data on which the two exercises are based. Appendix A provides more detail.
3Like us, Feyrer (2009) also uses an iv approach. His focus nonetheless differs radically from ours. He uses theclosure of the Suez Canal as a shock on trade costs to assess the effect of trade on growth. His estimation strategy relieson the exclusion restriction that, for countries, nothing correlated with the increase in trade distances during the eightyear closure of the Suez Canal also affected economic growth.
3

Table 1: Weight and value of all 2007 CFS trade for 66 CFS cities
Sector NAICS Value Weight WeightValue log(Weight
Value ) Count2007 Nk
i > 0Apparel 315 24,381 1,463 0.06 -2.81 66Beverages and Tobacco 312 129,804 143,530 1.11 0.10 66Chemicals 325 713,674 594,262 0.83 -0.18 66Computers and Electronics 334 389,399 5,416 0.01 -4.28 66Electrical Equipment, Appliances 335 128,868 18,771 0.15 -1.93 65Fabricated Metal 332 338,290 118,350 0.35 -1.05 66Food 311 585,676 568,950 0.97 -0.03 66Furniture and Related 337 83,494 18,700 0.22 -1.50 66Leather and Allied Products 316 5,441 636 0.12 -2.15 63Machinery 333 343,262 40,523 0.12 -2.14 66Mining (except Oil and Gas) 212 85,730 3,638,118 42.44 3.75 66Miscellaneous 339 144,279 10,941 0.08 -2.58 66Nonmetallic Mineral Products 327 124,713 1,060,926 8.51 2.14 66Paper 322 174,780 166,472 0.95 -0.05 66Petroleum and Coal Products 324 608,090 1,415,099 2.33 0.84 66Plastics and Rubber Products 326 209,268 66,753 0.32 -1.14 66Primary Metals 331 251,412 201,339 0.80 -0.22 65Printing and Related Activities 323 98,848 33,661 0.34 -1.08 66Textile Mills 313 35,936 8,989 0.25 -1.39 66Textile Product Mills 314 28,448 7,022 0.25 -1.40 66Transportation Equipment 336 715,294 94,023 0.13 -2.03 66Wood Products 321 100,923 218,834 2.17 0.77 66Mean 241,818 383,308 2.84 -0.83 65.8
Notes: Totals from 2007 CFS for all pairwise trade between 66 CFS regions for all variables. Unit values arefor aggregate U.S. shipments. Import and export values are given in millions of nominal dollars. Weightsare in thousands of tons. The last column reports count of cities with positive sectoral employment in 2007county business patterns.
2.1 Trade data for 2007
We rely on the 2007 Commodity Flow Survey (cfs) to measure trade flows and we base our sampleon the geography of this survey. The cfs divides the continental us into 121 cfs regions, each anaggregation of adjacent counties. Our sample consists of the 66 such regions organized around thecore county of a us metropolitan area. We discard cfs regions like “Rest of Texas” which mix ruraland small urban areas, and cfs regions that comprise an entire state (e.g., Idaho).4 We refer to our66 regions as cfs cities. Figures 1 to 3 below illustrate our sample of cfs cities as shaded polygonswith dots representing employment centroids.
4cfs cities are often larger than the corresponding (consolidated) metropolitan statistical areas. For instance, Miami-
Fort Lauderdale and West Palm Beach-Boca Raton in Florida are two separate metropolitan areas according to the 1999
us Census Bureau definitions but they are part of the same cfs region. On the other hand, a small metropolitan area likeGainesville (fl) is not part of a well identified cfs region. We exclude Washington dc, which the cfs defines as only theDistrict of Columbia without the rest of its metropolitan region.
4

The cfs reports bilateral sectoral trade flows in both value (us dollar) and weight (tons) betweencfs regions aggregated across sectors for 2007. Bilateral trade flows are also disaggregated by modeof transport: road(trucks); railroad, and all modes. Bilateral trade flows are not available by sector.5
The cfs nonetheless reports shipments from and to each region disaggregated by sector. Table1 describes the weight and value of trade between our 66 cities by sector as well as the weightper value, here tons per million dollars, of an average shipment by sector. This table highlightsconsiderable heterogeneity across sectors.
There is some censoring of trade flows in the cfs, more often of weight data than value. Suchcensoring reflects disclosure rules and mostly affects small values. In section 7, as a robustnesscheck we generalize our econometric model to explicitly model censoring. This exercise suggeststhat censoring is not important econometrically. Given this, we generally ignore censored tradeflows.
2.2 Roads, 1956-2007
We rely on several sources to construct data describing roads between and within cfs cities. Tocalculate interstate highway distances between cities, we first find the employment weightedcentroid of each cfs region. Next, we calculate the pairwise distance between cfs cities as theinterstate highway network distance between centroids using the 2005 National Highway Perfor-mance Network (nhpn) map of the interstate highway system.6 Remarkably, with only a handfulof exceptions, the centroids of all cfs cities are within a few kilometers of an interstate highway. Wealso calculate pairwise Euclidean distance between the same centroids. To measure the ‘distance ofa city to itself’, we approximate the distance of within-city trade by 0.66(area/π)0.5, as in Reddingand Venables (2004). Since interstate highways in rural areas are generally uncongested, we donot attempt to measure the capacity of the inter-city road connection. Absent congestion, theavailability of extra lanes or alternate routes has little effect on transportation costs. Moreover,the preponderance of rural interstate highways have exactly two lanes in each direction so thatthere is little econometrically useful variation in capacity.
To describe contemporaneous roads within the boundaries of cfs regions, we mainly rely on the2007 Highway Performance Monitoring System (hpms). The us federal government administersthe hpms through the Federal Highway Administration in the Department of Transportation. Thisannual survey, which is used for planning purposes and to apportion federal highway money,collects data about the entire interstate highway system. The 2007 hpms allows us to calculate thekilometers of interstate highways within the boundaries of each cfs city in 2007. It also reports thenumber of lanes on each segment of interstate highway, the lane kilometers of major urban roadsand the lane kilometers of urban interstate highway.7 This allows us to calculate the correspondingcfs city totals. As a robustness check, and to learn about the role of network configuration, we
5In fact, the 2007 cfs does report bilateral trade flows by sector, but these data are too heavily censored to be usefulfor our analysis.
6This map is only available for 2005.7The hpms gives us two pieces of information about the location of each segment; the county in which it lies, and
whether or not it is in an urbanized area within that county.
5

construct an index of radial road capacity for each city. We construct this radial road index usingthe algorithm developed in Baum-Snow, Brandt, Henderson, Turner, and Zhang (2012) to countthe number of highway rays on the 2005 nhpn map.8
We also construct a panel of road data with a less detailed description of the transportationnetwork than is available in our 2005/2007 cross-section. This panel covers the period from about1956 until about 2007, loosely, from the first construction of the us interstate highway system tothe present.
For the years 1957, 1967, 1977, and 1987, we base our roads data on the pr-511 data used inBaum-Snow (2007). These are administrative data describing the construction of the interstatehighway system. In particular, they assign each segment of the interstate highway system to acounty and report its length and date of opening. For the years 1987, 1997 and 2007, our roadsdata are based on the Highway Performance Monitoring System (hpms) from which the sameinformation about segment length is available. Our hpms and pr-511 data overlap in 1987 and in1993 (not used) and agree almost exactly in both years.
2.3 Employment, 1956-2007
Since cfs cities are aggregations of counties, we can construct employment data from the CountyBusiness Patterns (cbp) data. These data are constructed from social security payroll tax recordsand enumerate establishments and employment by county and sector. Our panel of employmentdata is based on cbp data from 1956, 1970-1, 1977-8, 1987-8, 1996-7, and 2006-7. Assembling thesedata into a panel requires that we solve four problems.
First, some county/sector level employment values are censored. Since establishment countsare not censored, we impute censored employment values from establishment counts.9 To furtherreduce measurement error, we average over pairs of adjacent cbp years for all years but 1956.The resulting panel describes employment in nominal years 1956, 1970, 1977, 1987, 1996, 2006.Second, the industrial classification system changes several times over the course of this 50 yearperiod. We construct correspondence tables that map contemporaneous industrial classificationsinto 2007 naics, the classification used in the 2007 cfs. Third, the 1956, 1970 and 1971 cbp identifycounties using a social security administration code rather than the now pervasive fips codes.This requires the construction of an additional correspondence table. Finally, the cbp data areavailable in electronic form only as far back as 1970. To extend our panel of employment data backto the earliest days of the interstate highway system, we convert the 1956 cbp from microprintimages of the original paper books to electronic form. This process is sufficiently difficult that
8For a given city, this algorithm operates as follows. First, draw two circles, one of radius 20km and one of radius40km, both centered on the city centroid. Second count the number of intersections of each circle with the road network.Third, calculate the smaller of these two numbers. This is our index of radial road capacity. More detail and illustrationsare available in Baum-Snow et al. (2012).
9While the details of this imputation vary slightly by year as the details of the establishment count data vary, thebasic idea is to regress county sectoral employment on establishment counts, which are sometimes available by size ofestablishment, and to use the resulting regression to impute employment on the basis establishment counts. The R2 ofthe regressions used for these imputations is often as high as 0.99.
6

we base this ‘year’ of data on a single year of the cbp rather than the average of adjacent years.10
The resulting employment data describe employment in each cfs city at approximately 10 yearincrements. Deviations from this uniform time increment either reflect electronic data availabilityor allow us to use pairs of adjacent years based on the same industrial classification system.
2.4 Historical and planned networks
In both of our econometric exercises we are concerned that roads are assigned to cities on the basisof their propensity to trade. To address this possibility, we construct instruments from a 1947 planof the interstate highway network, from an 1898 map of railroad routes and from a map of routes ofexpeditions of exploration. We now describe these data, but postpone a discussion of instrumentvalidity.
Our 1898 railroad data is based on a digital image of a map of major railroad lines (Gray, c.1898). We convert this image to a digital map with the same format and projection as the mapof 2005 interstate highways, as in Duranton and Turner (2011). We then calculate 1898 railroaddistance between cities, kilometers of 1898 railroad in each cfs city, and an index of radial capacityfor 1898 railroads in each cfs city. Figure 1 shows 1898 railroad routes and cfs cities.
Our map of the 1947 plan of the interstate highway system is based on a digital image of thepaper record of this plan. We create a digital map of the 1947 highway plan from this paper record(United States House of Representatives, 1947). We then calculate kilometers of 1947 plannedinterstate highway in each cfs city and compute planned distance between cities. Figure 2 showsthe planned highway network.
Our data on exploration routes is derived from maps in United States Geological Survey (1970).The National Atlas of the United States of America (1970) describes the routes of major expeditionsof exploration that occurred during each of five available time periods; 1528–1675, 1675–1800,1800–1820, 1820–1835, and 1835–1850. We digitize each map and count 1 km by 1 km pixels crossedby an exploration route in each cfs city. We then compute our index by summing these countsacross all maps. Following this procedure, routes used throughout the 1528-1850 period receivemore weight than those used for a shorter period of time. Note that the electronic representationof the exploration routes data does not allow us to calculate network distances along historicalexploration routes. Figure 3 shows exploration routes between 1528 and 1850 and cfs cities.
2.5 Other data
We obtain past and contemporaneous populations for each cfs city from county population datain the 1920, 1950, and 2000 censuses for reasons we discuss below. We also use the 2000 censusto compute a variety of other controls such as the share of adult population with at least a college
10As far as we know, this is the first use of the complete 1956 cbp data in the economics literature. We also note that1956 is the first year for which the geographical coverage of the cbp is comprehensive and that the next year of availabledata is 1959.
7

Figure 1: 1898 railroads
Source: Map based on Gray (c. 1898).Notes: The lines are 1898 railroads. The shaded polygons are the cfs regions in our sample. The small dotsindicate cfs region centroids.
degree and a measure of income per capita. We also use a several geographical characteristicscollected from various sources.
In an extension of our cross-sectional investigation, we also consider the effect of railroads ontrade flows. We rely on gis railroad maps from the North American Atlas and from the NationalAtlas. We compute kilometers of railroad track within each cfs city in 2004 and an index of radialrail capacity that mirrors the radial road index. Finally, we use these railroad maps to compute railnetwork distance between the centroids of cfs cities.
Table 2 and figure 4 provide descriptive statistics for our trade, road and rail data. Table 2
shows that road is the dominant mode of transportation, while railroads play a minor role. Table2 also shows that exports to other cities represent only 62% of all shipments in value and 31% inweight. Figure 4 refines this second point and shows that the weight and value of trade flowsdecays rapidly with distance.
3. Model
We require an econometric strategy that allows us to make inferences about the effect on trade ofroads within and between cities. This strategy must respond to three problems. First, patterns of
8

Figure 2: 1947 planned highways
Source: Map based on United States House of Representatives (1947).Notes: The lines are planned 1947 interstate highways. The shaded polygons are the cfs regions in oursample.The small dots indicate cfs region centroids.
Figure 3: 1528-1850 exploration routes
Source: Map based on United States Geological Survey (1970).Notes: The lines are exploration routes between 1528 and 1850. The shaded polygons are the cfs regions inour sample. The small dots indicate cfs region centroids.
9

Table 2: City infrastructure endowments and trade flows by weight, value and mode
Variable Mean Std. Dev. Minimum Maximum
Value of exported shipments, road 50,552 62,810 1,295 406,851(log) Value of exported shipments, road 10.35 0.99 7.17 12.92Value of imported shipments, road 50,552 57,213 6,182 360,004(log) Value of imported shipments, road 10.45 0.83 8.73 12.79Weight of exported shipments, road 52,615 49,855 1,512 297,702(log) Weight of exported shipments, road 10.52 0.89 7.32 12.60% Road in exported value 70.7% 14.4% 17.1% 90.1%% Rail in exported value 1.1% 2.2% 0% 10.0%% Road in exported weight 86.2% 16.2% 23.5% 100%% Rail in exported weight 1.5% 2.4% 0% 13.8%% export in all shipments, value 62.1% 11.3% 40.6% 91.8%% export in all shipment, weight 31.3% 15.3% 7.3% 78.2%Employment, 2007 1,129,117 1,180,287 66,006 6,759,481Section km of interstate highway, 2007 381 247 61 1,661Railroad km, 2004 335 228 65 1304Planned highway km, 1947 252 162 56 1,016Railway km, 1898 619 405 91 2,104Exploration routes index, 1518-1850 6,329 5,386 225 36,049
Notes: means across 66 CFS regions for all variables. All trade figures are for 2007. Import and export valuesare given in millions of nominal dollars. Weights are in thousands of tons.
Figure 4: Exports and distance
0.4
0.6
0.8
1
or cum
ulative trad
e,share
0
0.2
3.6 4.6 5.6 6.6 7.6 8.6
Share o
log distance
Source: Computed from the 2007 Commodity Flow Survey.Notes: The plain line represents the cumulative distribution function of exports in weight. The (long)dashed line represents the cumulative distribution function of exports in value. The (short) dashed linerepresents the share exported tons by railroad (relative to all exports by road or rail).
10

trade between any pair of cities may depend on the availability of alternative trading partners foreach member of the pair. Second, roads may affect the composition as well as the level of trade, ascities specialize (or not) in transportation intensive production. Third, roads may be endogenouslyassigned to cities (or city pairs) on the basis of trade patterns.
To address these problems, we develop a simple theory of roads and trade. Since our goal isa tractable econometric specification, we consistently make the strongest simplifying assumptionsconsistent with our data: making the model more detailed than our data adds complexity withoutinforming our estimation. Specifically, we suppose that each city produces a unique set of dif-ferentiated goods as in Anderson and van Wincoop (2003). We note, however, that the results ofArkolakis, Costinot, and Rodríguez-Clare (2012) suggest that our analysis is robust to alternativemicrofoundations, such as the Ricardian model of Eaton and Kortum (2002).
We analyze trade between a large but finite set of cities, indexed by i ∈ {1, . . . ,I}. City i housesNi ∈ R++ identical consumers, each of whom purchases goods and supplies a single unit of laborin their home city. Consumers are mobile across sectors but, to begin, immobile across cities. Asa stylized description of the fact that city employment in most sectors is small relative to total cityemployment, we consider a continuum of sectors k, for k ∈ [0,1].
Firms in each city and sector produce the same city-specific variety with a constant returns toscale technology,
Qki = Ai Nk
i , (1)
where Ai is the productivity of labor in city i and Nki is the endogenously determined employment
in city i’s sector k. Consumers in all cities have identical preferences. A consumer in city j choosesconsumption qk
ij from all cities i in all sectors k to maximize the utility function,
Uj =
[I
∑i=1
∫ 1
0(qk
ij)σ−1
σ dk
] σσ−1
, (2)
where σ > 1. The consumer’s budget constraint is
Wj ≥I
∑i=1
∫ 1
0Pk
ij qkijdk , (3)
where Wj is the unit wage in city j and Pkij is the price of the variety from city i in sector k when
consumed in city j. In equilibrium, consumers maximize utility, price-taking firms maximize profit,there is free entry in all sectors and cities, the labor market clears in all cities, and output marketsclear for all varieties.
The fact that each city produces its own variety in each sector k, together with our assumptionthat the elasticity of substitution is finite and constant, implies positive employment in all sectorsin all cities. As we see in table 1, this a good approximation to our aggregated data and eliminatescorner solutions. It is possible, but cumbersome and uninformative, to extend our model to morerealistic substitution patterns. Equation (1) allows for cities to have different levels of aggregateproductivity but abstracts from Ricardian comparative advantage in the production technology.We investigate other sources of comparative advantage, e.g., a city’s endowment of human capital,in our empirical work.
11

Let Xkij denote expenditure in city j for the variety produced by city i in sector k. That is, Xk
ij
describes the value of pairwise trade in a particular good and is one the main objects of study. Wepostpone a consideration of the weight of pairwise trade, which derives from our analysis of value.
Maximizing utility (2) subject to the budget constraint (3) and aggregating across consumersimplies that
Xkij = Pk
ij Qkij =
(Pj
Pkij
)σ−1
Nj Wj , (4)
where
Pj ≡[
I
∑i=1
∫ 1
0(Pk
ij)1−σ dk
] 11−σ
(5)
is the price index for city j. Equation (4) gives city j’s demand for imports from city i in sectork. To arrive at the corresponding equilibrium quantity we must specify trade costs and derive therelevant supply relationship.
To describe transportation costs we assume that for one unit of output from city i’s sector k toreach importer city j, the exporter must ship τk
ij ≥ 1 units. Thus, the cost to produce the varietyfrom sector k and city i is multiplied by τk
ij at destination j. Competitive production of each varietyimplies marginal cost pricing so that,
Pkij = τk
ijWi
Ai, (6)
Inserting equation (6) into (4) and aggregating the resulting pairwise sector flows across sectorsyields the aggregate value of equilibrium shipments from i to j,
Xij =
(Ai
Wi
)σ−1 [∫ 1
0
(τk
ij
)1−σdk]
Pσ−1j Nj Wj . (7)
Finally, the equilibrium for city i is such that its labor market clears. Using the productionfunction (1), the demand for labor in city i and sector k is Nk
i = Qki /Ai. Recalling that τk
ij Qkij units
must be shipped from city i for Qkij units to be consumed in city j, inserting equation (6) into (4),
aggregating across importers, and using the resulting expression to substitute for the quantitiesimported by the destination cities yields employment in each city and sector
Nki =
I
∑j=1
τkij Qk
ij
Ai=
I
∑j=1
τkij Xk
ij
Ai Pkij
=Aσ−1
iWσ
i
I
∑j=1
Pσ−1j
(τkij)
σ−1Nj Wj . (8)
Aggregate labor supply in city i, Ni, equals the sum of labor demand for all sectors in city i. Thus,using equation (8)
Ni =Aσ−1
iWσ
i
(I
∑j=1
Nj Wj
∫ 1
0
Pσ−1j
(τkij)
σ−1dk
). (9)
Given an equilibrium in all cities but i, we can solve for the equilibrium in city i. Knowingpopulation in this city, labor productivity, and transportation costs in all sectors, equation (9) yieldsthe wage Wi. We can the use this wage in equations (7) and (8) to compute the value of exportsfrom i to j, and city i employment in any sector k.11
11Inserting equation (6) into (5) and substituting into (9) shows that the wage in city i can be written as increasing andstrictly concave function of wages in other cities. This can be used to show the existence and uniqueness of the generalequilibrium of the model.
12

We so far rely on a description of transportation costs that abstracts from the role of roadsand from intrinsic differences in the difficulty of moving different commodities, both of whichare central to our inquiry. To proceed, let Ri be a measure of the road capacity in city i, mostoften ‘kilometers of interstate highways within city boundaries,’ and let Rij describe the roadsconnecting city i to city j, usually ‘distance between i and j along the interstate highway network.’To allow transportation costs to differ across commodities, let Vk denote the weight of one unit ofsector k output. Without loss of generality, rank sectors by Vk where sector 0 produces the lightestgoods and sector 1 the heaviest: V0 ≤ ... ≤ Vk ≤ ... ≤ V1.
With this notation in place, we can allow transportation costs to vary with; sector, between-cityroads and within-city roads, according to
τkij ≡ τk(Ri,Rij,Rj) = τk
x (Ri)× τxm(Rij)× τm(Rj) . (10)
Thus, we decompose the cost of shipping a unit of output from city i and sector k to city j into threecomponents; the cost of leaving exporter city i in sector k, the cost of going from exporter city i toimporter city j and the cost of entering importer city j.12,13 To lighten notation, where possible weuse τk
i ≡ τkx (Ri), τij ≡ τxm(Rij), and τj ≡ τm(Rj).
The cost of transportation between cities, τxm(Rij), increases with the network distance betweencities, so that ∂τxm(Rij)/∂ log Rij > 0. The cost of entering city j, τm(Rj), decreases in with its stockof roads, so that ∂τm(Rj)/∂ log Rj < 0. Note that this restricts the cost of between-city travel andthe cost of entering a city to be the same across sectors.
The cost of shipping goods out of city i, τkx (Ri), also declines with the stock city highway
kilometers, i.e., ∂τkx (Ri)/∂ log Ri < 0. However, we allow the effect of roads on transportation
costs to vary by sector and we assume that sectors producing heavier goods are more sensitive toroads. More specifically, assume that the elasticity of the cost to exit city i with respect to city roads,i.e., ρτ,k
R ≡ ∂ log τkx (Ri)/∂ log Ri, is larger in absolute value for sectors producing heavier goods. It
follows that the ranking of sectors by weight induces a corresponding ranking of these elasticities,|ρτ,0
R | ≤ ... ≤ |ρτ,kR | ≤ ... ≤ |ρτ,1
R |.The description of transportation costs given in equation (10) is central to our analysis. As in
much of the literature, transportation costs affect destinations costs multiplicatively. In fact, wecan imagine that some transportation costs may be additive. To preserve clarity we maintain themultiplicative assumption in our theory, but investigate alternatives in our empirical work. Theassumption that the cost of shipping goods is more sensitive to city roads in sectors producingheavier goods is a natural consequence of our prior that bulky goods are more ‘road intensive’ andbenefit more from the presence of highways. While the opposite assumption is defensible, as wewill see, our assumption is consistent with our empirical results. While we allow the cost of leavinga city to vary by sector, we restrict the cost of travelling between cities to be the same for all sectors.
12The multiplicative formulation of transportation costs between τxm(Rij) and τm(Rj) is not needed to derive thetheoretical predictions presented below. We impose it only because it leads to a simple empirical specification.
13Although we introduce more structure on shipping costs than the previous literature, we nonetheless refrain froma full modeling of a shipping sector. This would be beyond the scope of this paper and require us to make modelingdecisions about the location of this sector, the wages it pays, the fact that for any city trade will balance in value but notin weight making some trucks run empty, etc. See Behrens and Picard (2011) for a model exploring the implications ofsome of these issues.
13

Since bilateral trade flows in the cfs are not available at the sector level, allowing τxm(Rij) to varyby sector would add complexity without informing our estimations. We also assume that the costof entering a city is constant across sectors. This implies that cities choose patterns of sectoralspecialization according to how many roads they have and not how many roads their neighborshave. Allowing the cost of entering a city to differ across sectors would cause specialization to bedetermined in part by demand from other cities, and would complicate our analysis enormously.Again, we investigate this issue in our empirical work and find no evidence that city roads affectthe weight of imports.
While this relationship is not explicit in our model, we do not preclude highways from havingan effect on the quality of goods in the spirit of Alchian and Allen (1964). It would be straight-forward to relabel ‘weight’ as ‘quality’ and to associate heavier goods with lower quality. It isalso possible that highways affect productivity directly. While our model considers only alloca-tive gains from trade, it could be extended to consider efficiency gains from trade by allowingproductivity Ai to depend on highways Ri. In this case, highways would affect trade directly bydetermining transportation costs and indirectly through their effect on city productivity. We donot pursue this line of inquiry because we do not have good measures of city productivity. Ourestimates generally reflect the sum of these two effects. Our specialization results nonetheless showthat the specialization channel between sectors emphasized by our model is empirically important.
4. Roads and equilibrium trade
We now turn to a characterization of the equilibrium relationship between roads and trade. Char-acterizing the equilibrium relationship between roads and trade allows us to evaluate severalcomparative statics. Empirical testing of these comparative statics is the principal object of thepaper. Our analysis also leads naturally to the econometric model which forms the basis of ourmain empirical exercise.
To begin, insert (10) into (7) and take logs to get,
log Xij = δXi + (1− σ) log τij + δM
j . (11)
In this equation δXi and δM
j are expressions, defined below, involving the economic fundamentalsof importer and exporter cities. We can describe δX
i as the ‘propensity to export’, or when necessary‘propensity to export value’. Similarly, δM
j is the ‘propensity to import’ or the ‘propensity to importvalue’. In the context of the empirical model developed below, we often call δX
i an ‘exporter fixedeffect’ or an ‘exporter value fixed effect’ and δM
j an ‘importer fixed effect’. We use analogouslanguage to describe cities’ propensities to trade weight.
We can now state the first of our comparative statics about equilibrium trade flows.
Comparative Static 1 A reduction in road distance between two cities increases the value of trade betweenthese two cities but does not affect its composition
A formal proof of this result (and those that follow) is given in Appendix B. A reduction in thedistance between two cities reduces trade costs which then increases trade in all sectors. Since the
14

cost of intercity distance is the same for all sectors by equation (10), a reduction in the distancebetween two cities also leaves the composition of trade unchanged.
From equations (7), (10), and (11) and then making use of equation (9) to eliminate the endoge-nous wage Wi, we can write the propensity to export as,
δXi = log(Ni Wi)−MAX
i
= S(Ri) +σ− 1
σlog Ai +
σ− 1σ
log Ni −σ− 1
σMAX
i . (12)
Equation (12) involves both a function of within-city roads, S(Ri), and an export market accessterm, MAX
i . The first of these depends on the cost of exporting from city i and is defined as,
S(Ri) ≡1σ
log∫ 1
0
(τk
i
)1−σdk . (13)
For city i, MAXi is an export market access term, a form of market potential, and it is given by,
MAXi ≡ log
I
∑j=1
Pσ−1j
(τij τj)σ−1 Nj Wj
= logI
∑j=1
e(1−σ) log τij+δMj , (14)
where the second line results from substituting equations (7), (10), and (11) into the first. Becausepairwise transportation costs (1− σ) log τij and propensity to import δM
j appear in equation (11),we can use an estimate of equation (11) to calculate MAX
i for cities in our sample.Our next comparative static follows.
Comparative Static 2 Export market potential, MAXi , negatively affects city i’s propensity to ex-
port, δXi .
This apparently counter-intuitive prediction follows from the fact that equation (11), which de-scribes δX
i , already accounts for distance to importers and their propensity to import. Equation(12) then only captures a negative indirect wage effect. To see this, note that by equation (7) wehave δX
i = (Ai/Wi)σ−1, that is higher wages reduce the propensity to export. To obtain our final
expression in equation (12) we substitute market potential for wages. Since wages and marketaccess are positively related as per equation (9), we must thus obtain a negative effect of marketpotential on propensity to export.
Our third comparative static also follows from equation (12).
Comparative Static 3 The effect of within-city roads on the propensity to export value should bepositive but small.
Expression (12) shows that within-city roads affect the value exports only to the extent that theyaffect wages. The literature suggests that the elasticity of the value of exports with respect towithin-city roads should be small, perhaps of the order of 0.05.14 Given the size of our sample,such a small effect is probably undetectable.
14Duranton and Turner (2012) find that the elasticity of city population with respect to within-city interstate highwaysis about 0.10 after 10 years. Beaudry, Green, and Sand (2012) find that the elasticity of city population with respect to citywages is about 2 after 10 years. This suggests an elasticity of city wages with respect to within-city interstate highwaysof 0.10/2=0.05. Assuming a more mobile labour force would lead to even smaller numbers.
15
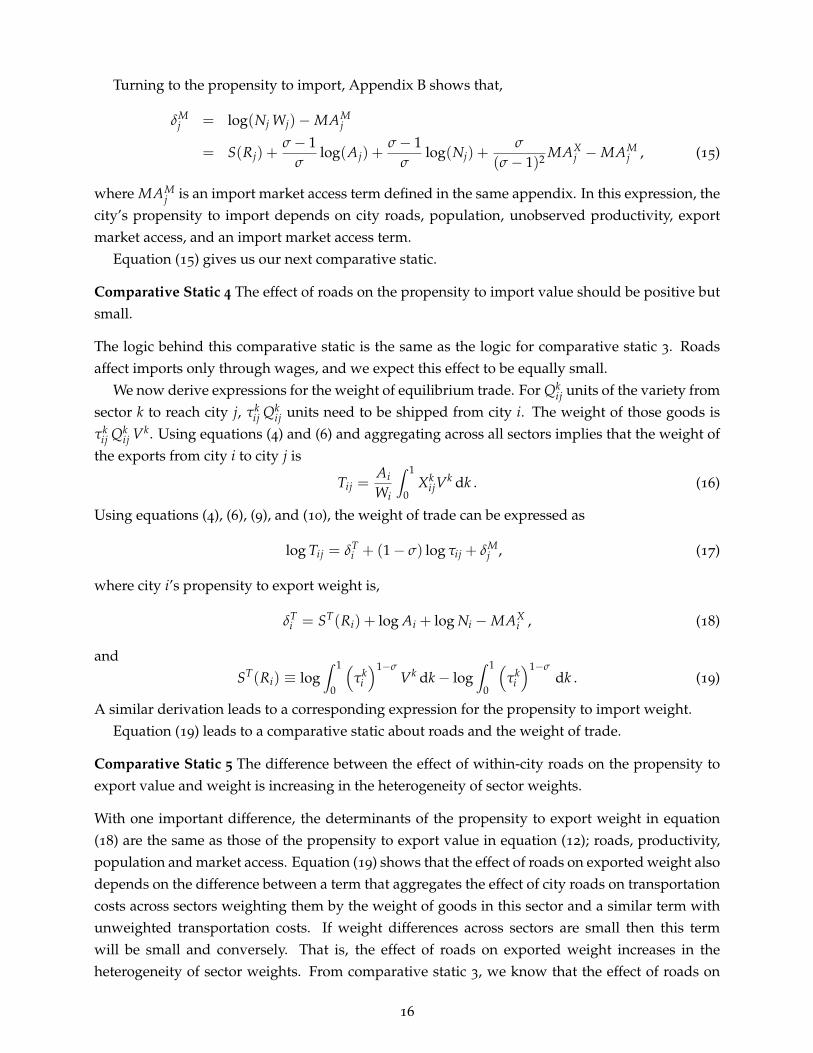
Turning to the propensity to import, Appendix B shows that,
δMj = log(Nj Wj)−MAM
j
= S(Rj) +σ− 1
σlog(Aj) +
σ− 1σ
log(Nj) +σ
(σ− 1)2 MAXj −MAM
j , (15)
where MAMj is an import market access term defined in the same appendix. In this expression, the
city’s propensity to import depends on city roads, population, unobserved productivity, exportmarket access, and an import market access term.
Equation (15) gives us our next comparative static.
Comparative Static 4 The effect of roads on the propensity to import value should be positive butsmall.
The logic behind this comparative static is the same as the logic for comparative static 3. Roadsaffect imports only through wages, and we expect this effect to be equally small.
We now derive expressions for the weight of equilibrium trade. For Qkij units of the variety from
sector k to reach city j, τkij Qk
ij units need to be shipped from city i. The weight of those goods isτk
ij Qkij Vk. Using equations (4) and (6) and aggregating across all sectors implies that the weight of
the exports from city i to city j is
Tij =Ai
Wi
∫ 1
0Xk
ijVk dk . (16)
Using equations (4), (6), (9), and (10), the weight of trade can be expressed as
log Tij = δTi + (1− σ) log τij + δM
j , (17)
where city i’s propensity to export weight is,
δTi = ST(Ri) + log Ai + log Ni −MAX
i , (18)
andST(Ri) ≡ log
∫ 1
0
(τk
i
)1−σVk dk− log
∫ 1
0
(τk
i
)1−σdk . (19)
A similar derivation leads to a corresponding expression for the propensity to import weight.Equation (19) leads to a comparative static about roads and the weight of trade.
Comparative Static 5 The difference between the effect of within-city roads on the propensity toexport value and weight is increasing in the heterogeneity of sector weights.
With one important difference, the determinants of the propensity to export weight in equation(18) are the same as those of the propensity to export value in equation (12); roads, productivity,population and market access. Equation (19) shows that the effect of roads on exported weight alsodepends on the difference between a term that aggregates the effect of city roads on transportationcosts across sectors weighting them by the weight of goods in this sector and a similar term withunweighted transportation costs. If weight differences across sectors are small then this termwill be small and conversely. That is, the effect of roads on exported weight increases in theheterogeneity of sector weights. From comparative static 3, we know that the effect of roads on
16

exported value is small. Comparative static 5 follows immediately. From table 2, we see that theweight to value ratio varies across sectors by about a factor of 42,000.
Our final and most important comparative static is intuitively obvious, but follows less imme-diately from the analysis.
Comparative Static 6 An increase in roads within a city causes a decrease in employment bysectors producing light goods and an increase in employment by sectors producing heavy goods.
An increase in city roads makes exporting less costly. Lower export costs lead to an increase in thedemand for the varieties produced by this city, which in turn leads to a greater value of exportedoutput. Thus, an increase in city roads is actually an increase in productivity that affects sectorsproducing heavy goods more than sectors producing light goods. This means that an increase incity roads alters the patterns of comparative advantage and causes greater specialization in theproduction and export of heavier goods.
Remarkably, we find that the data support all of the predictions of this admittedly stylizedmodel except comparative static 1 (which requires that intercity road distance affect the weightand value of trade equally). Unsurprisingly, we find that trade in value is less sensitive to theroad distance between cities than trade in weight. It appears to be straightforward to generate thisprediction in our model by allowing intercity roads to affect transportation costs more in industriesproducing heavier goods. However, this extension would come at a high price in complexity, andour lack of bilateral trade data disaggregated by sector limits our ability to explore it empirically.
We close this section by noting that the analysis above treats city population as exogenous. Weconsider the implications of labor mobility across cities in Appendix B. Endogenizing populationresults in competing expressions for the propensities to export or import value or weight that donot depend on the productivity shifter Ai and that do depend on an import market access term.Given that import and export market access have a correlation of 0.97, this does not affect theestimates of our variable of interest.
5. Econometric model
Although we focus on the determinants of trade flows rather than wages, our econometric ap-proach resembles the “new economic geography” estimations pioneered by Redding and Venables(2004). To begin, note that our theory provides little intuition about the form of the transportationcost term in equation (11), (1− σ) log τ(Rij). Given this, we let Ol(z) denote an order l polynomialin z and define
(1− σ) log τ(Rij) ≡ Ol(log Ri) + εij. (20)
That is, we write the transportation cost term of equation (11) as an arbitrary polynomial in pair-wise road distance and a residual. Substituting (20) into (11) now leads naturally to our ‘first-step’estimating equation,
log Xij = δXi + Ol(log Rij) + δM
j + εij . (21)
17

This is a “gravity” equation for trade flows with fixed effects. The error term ε has a naturalstructural interpretation: it is an approximation error that results from replacing the arbitrarybetween-city transportation cost function, τxm(Rij), with a polynomial.
A necessary condition for an unbiased ols estimate of the effect of road distance on tradeflows is that our approximation error be uncorrelated with Rij. Such a correlation might ariseif more direct highway links connect pairs of cities that trade more. We pursue three strategies toaddress this problem. First, we consider different polynomial approximations of S, of order 1,2and 4. Second, we consider estimates based on Euclidean rather than highway distance. Third,we conduct an instrumental variables estimation in which we use pairwise distance along the 1898
railroad and 1947 highway plan to predict 2005 interstate distance. Our estimates are robust to allof these variations. We discuss instrument validity below.
Within-city roads do not appear explicitly in estimating equation (21) or its theoretical precursor,equation (11). This follows immediately from the structure of transportation costs in equation (10).Roads in city i affect transportation costs to all of its trading partners equally. Thus, the effect ofwithin-city roads helps to determine a city’s propensity to trade, or, in the language of equation(21), its importer and exporter fixed effects. To determine the effect of within-city roads on trade,we conduct second-step regressions which predict importer and exporter fixed effects as a functionof within-city roads.
Equation (12) suggests regressing the exporter fixed effect δXi on within-city highways, produc-
tivity, population and market access. However, our model does not suggest a functional formfor the relationship between roads and propensities to trade. Specifically, we see in equation (13)that the relationship between roads and the propensity to trade is determined by, S(Ri) whichdepends on the unknown functions τk(Ri). While we experiment with other possibilities in ourrobustness checks, we usually use the logarithm of kilometers of interstate highway within a cityas our measure of capacity of a city’s road network. Hence, from equation (12) our second-stepregression is,
δ̂Xi = β0 + ρX
R log Ri + β′Ci + µi , (22)
where Ci is a vector of city i characteristics. Consistent with equation (12), in our baseline speci-fication Ci contains log 2007 employment and a measure of market access computed according toequation (14) using the results of the first-step estimation of equation (21).
Inspection of equations (22) and (12) suggests a structural interpretation of the error term in thisequation. Specifically, this error term consists of two components. The first reflects the differencebetween S(Ri) and our approximation of this term, here ρX
R log Ri. The second reflects unmeasuredcity productivity, Ai, which occurs explicitly in (12) but not in (22).
Our estimates of equation (22) must respond to four inference problems. First, the propensityto export may cause highway development in cities: more highways may be built in cities thatexport intensively (or more highways may be built to help cities that do not export much). Second,missing variables which affect both the propensity of cities to export value and the provision ofcity roads may confound our estimates. Third, the error arising from our approximation of S(Ri)
by ρXR log Ri may be correlated with the propensity to export and Ri, and hence confound our
estimates. Finally, our market access controls may themselves be endogenous.
18

We pursue three strategies to deal with these problems. To investigate the role of approximationerror, we consider a variety of measures of the road network. To consider the role of omittedvariables we experiment widely with control variables that may be correlated with city productiv-ity. Finally, to address both reverse causation and omitted variable we instrument for within-cityroads with instruments derived from our data on exploration routes, 1898 railroads and the 1947
highway plan. We consider a number of possible solutions to the issues raised by market accessbelow.
We close this discussion with three final comments on our model. First, we expect that sectorswith high transportation costs locate close to their markets. Thus, patterns of trade reflect boththe direct effect of high transport costs and their indirect effect on the location of production.Separating these two effects is an open question in the literature, and would require a source ofexogenous variation in firm location, as well as a source of exogenous variation in transportationinfrastructure. The fact that firm locations may reflect transportation costs affects the interpretationof our estimates but does not affect the validity of our estimates, provided that our instruments arenot correlated with firm location choices. In our robustness checks, we investigate this possibilityand fail to find evidence to support it.
Second, in equation (11), all else equal, a one unit increase in the propensity to export δXi causes
a one unit increase in the log value exported to each of i’s trading partners. In this sense, changes inδX
i directly reflect changes in the log of exports. Thus, a change in δXi resulting from a log change in
another variable is an elasticity of export value. An analogous intuition applies to the propensity toimport δM
i . Also, note that the dependent variable in the second step is an estimate of the exporterfixed effect, δ̂X
i , which is equal to its true value plus an error term. This affects the estimation of thestandard errors for the coefficients estimated in equation (22). We follow a simple fgls procedureto recover corrected standard errors.
Finally, equation (22) describes the relationship between within-city roads and a city’s propen-sity to export value. We can derive a corresponding equation to describe a city’s propensity toimport value from equation (15). The main difference between the resulting expression and ourexpression for the exporter effect, equation (22), is that the importer effect equation also includes anexpression for import market access. To derive the corresponding two-step estimation procedurefor the effect of roads on the weight of trade, we use equations (17) and (19).
5.1 Instrument validity
Our three instruments; 1528-1850 exploration routes, 1898 railroads and 1947 planned highways,all predict the modern network of interstate highways. As a result, they also predict the numberof kilometers of interstate highways within a city. Exploration routes result from a search for aneasy route to travel on foot, horseback, or wagon. Since such a route will likely be a good routefor a car, contemporary highways often follow exploration routes. A similar argument applies to1898 railroads. In addition, building both railroad tracks and automobile roads requires levelingand grading a roadbed. Hence, an old railroad track is likely to become a modern road because oldrailroads may be converted to automobile highways without the expense of leveling and grading.Finally, the 1947 highway plan results from a prolonged effort by President Franklin D. Roosevelt,
19

who began planning for a national highway system in 1937. Many interstate highways describedby this plan were subsequently built. Building started after the 1956 Federal Aid Highway andHighway Revenue Acts and was completed by the early 1990s. More formally, table 14 in Ap-pendix C reports a number of first-stage specifications predicting log 2005 highway kilometerswhere our instruments are highly significant. In addition, we report weak instrument test statisticsdeveloped by Stock and Yogo (2005) with our tsls results. Unless otherwise mentioned, ourinstruments are not weak.
A valid instrument must also be orthogonal to the structural equation error term. We firstconsider the 1898 railroad network. A first argument for the validity of 1898 railroad kilometersrests on the fact that the us rail network was developed during and immediately after the civilwar, and during the industrial revolution. At that time, the us economy was much smaller andmore agricultural than today.15 A second argument rests on the circumstances surrounding thedevelopment of the us rail network. Early us railroads were developed mainly to transportgrain, livestock, and lumber as well as passengers over long distances (Fogel, 1964, Fishlow, 1965,Cronon, 1991). These flows of people and agricultural commodities little resemble 2007 tradeflows of (mostly) manufactured goods described by our data. Moreover, the rail network wasconstructed by private companies expecting to make a profit from railroad operations in a not toodistant future.
While the 1898 railroad network plausibly determines contemporary highways for some reasonunrelated to trade flows in 2007, 1898 rail might affect trade in 2007 through a number of otherchannels. First, larger cities in the late 19th century were more likely to receive railroads. Becausepopulation is persistent, large cities in 1898 tend to be large today and large cities trade morethan small cities. To avoid this problem, we control for contemporaneous population as well aspopulation in 1920 (the closest we can get to 1898 with existing data). Second, more productivecities might have received more kilometers of railroad tracks in 1898. These cities might still bemore productive today and, as required by our model and by common sense, export more as aresult. Controlling for population in 1920, 1950, and 2000 helps to resolve this problem since weexpect population to move to more productive cities: there is little evidence that city productivityis persistent conditional on population size (Glaeser and Gottlieb, 2009). In some regressions wealso use income per capita and the share of adult population with a college degree to captureunobserved city productivity. Third, 1898 railroads might cause an initial and persistent special-ization into manufacturing. Such a manufacturing specialization could plausibly cause more tradeindependently of modern roads. To address this possibility, we include the employment share ofmanufacturing as a control in some regressions. Finally, there may be geographical features whichare correlated with both 1898 railroads and 2007 trade flows. To condition them out we considera variety of geographical controls such as distance to the nearest body of water, slope, and censusregion fixed effects.
Our maps of exploration routes describe major expeditions of exploration ranging over three
15At the peak of railroad construction, around 1890 (United States Bureau of Statistics, 1899, pp. 151 and 362), theus population was 55 million, with 9 million employed in agriculture or nearly 40% of the workforce (United StatesBureau of Statistics, 1899, pp. 10 and 23). By 2007, the population of the us was 302 million with 2.2 million employedin agriculture, about 1.5% of the workforce (United States Bureau of the Census, 2011, pp. 18 and 399).
20

centuries. The motivations for these expeditions were as varied as the explorers and times inwhich they lived; from the search for the fountain of youth or gold, to the establishment of furtrading territories, to finding emigration routes to Oregon, or to the expansion of the us territorytowards the Pacific Ocean.
Using different instruments, for which threats to validity differ, allows for informative over-identification tests. Old explorations routes are an attractive instrument in this respect. We areconcerned that 1898 railroad routes are not a valid instrument because of the possible correlationbetween 1898 railroads, persistent population patterns, and 2007 trade flows. However, earlyexplorations of the us took place in areas that were sparsely populated by indigenous peoples.We are also concerned that a city’s stock of 1898 railroads reflects persistent productivity and 2007
trade flows. This story seems implausible for early exploration routes. While some explorers werelooking for gold and other minerals, these factors play little role in 2007 manufacturing production.
Our third instrument is 1947 planned highway miles. The 1947 plan was first drawn to “connectby routes as direct as practicable the principal metropolitan areas, cities and industrial centers, to servethe national defense and to connect suitable border points with routes of continental importance in theDominion of Canada and the Republic of Mexico” (United States Federal Works Agency, Public RoadsAdministration, 1947, cited in Michaels, 2008). Historical evidence confirms that the 1947 highwayplan was, in fact, drawn to this mandate (see Mertz, undated, and Mertz and Ritter, undated, aswell as other sources cited in Chandra and Thompson, 2000, Baum-Snow, 2007, and Michaels,2008).
Planned 1947 highways, like 1898 railroads and 1528-1850 exploration routes also face somethreats to validity. First, planned highways could be correlated with 2007 trade flows and withsome persistent determinant of population. Duranton and Turner (2012) find that 1947 plannedhighways are uncorrelated with population growth in the 1940s and 1950s. Thus, in accordancewith their mandate, planners in 1947 tried to connect population centers, not to anticipate futurepopulation levels and trade patterns. From this, it follows that controlling for 1950 and 2007
population levels should condition out persistence in population as a threat to the validity of thisinstrument.
6. The effect of highways on trade
6.1 First-step results
Table 3 reports estimates of cities’ pairwise trade in weight and value using the gravity specifica-tion (21) for the value of trade or the corresponding equation for weight. In panel a the dependentvariable is the weight of bilateral trade by road. Panel b reports corresponding results for value.Samples differ across the two sets of regressions because of the higher incidence of censoring inthe cfs weight data.
Column 1 reports an ols regression of trade flows on exporter and importer fixed effects and log2005 highway distance. Column 2 reports the corresponding tsls regression using network dis-tances from 1947 planned highways and 1898 railroads as instruments for 2005 highway distance.
21

Table 3: First-step results
(1) (2) (3) (4) (5) (6) (7) (8)OLS TSLS OLS TSLS OLS TSLS OLS OLS
Distance 2005 hwy 2005 hwy 2005 hwy 2005 hwy 2005 hwy 2005 hwy Eucl. Eucl.
Panel A. Dependent variable: (log) Weight of bilateral trade flows, road trade.
log distance -1.90∗∗∗ -1.90∗∗∗ -2.86∗∗∗ -2.87∗∗∗ -3.72 0.32 -1.91∗∗∗ -1.01(0.023) (0.022) (0.17) (0.16) (6.95) (5.89) (0.024) (6.94)
log distance2 0.077∗∗∗ 0.078∗∗∗ 0.76 -0.25 0.079(0.013) (0.013) (1.77) (1.50) (1.80)
log distance3 -0.13 -0.018 -0.055(0.19) (0.17) (0.20)
log distance4 0.0071 0.0028 0.0046(0.0078) (0.0067) (0.0083)
log(distance ratio) -1.54∗∗∗
(0.21)
Mean effect -1.90 -1.90 -1.74 -1.74 -1.63 -1.63 -1.91 -Median effect -1.90 -1.90 -1.72 -1.72 -1.73 -1.70 -1.91 -
R2 0.86 - 0.87 - 0.87 - 0.86 0.87First-stage Stat. 153,426 20,514 2,211
Panel B. Dependent variable: (log) Value of bilateral trade flows, road trade.
log distance -1.41∗∗∗ -1.41∗∗∗ -2.18∗∗∗ -2.19∗∗∗ -1.82 -0.95 -1.41∗∗∗ -0.52(0.019) (0.019) (0.14) (0.14) (5.96) (5.79) (0.020) (6.12)
log distance2 0.062∗∗∗ 0.062∗∗∗ 0.44 0.24 0.11(0.011) (0.011) (1.52) (1.48) (1.59)
log distance3 -0.092 -0.073 -0.060(0.17) (0.16) (0.18)
log distance4 0.0057 0.0051 0.0047(0.0068) (0.0067) (0.0074)
log(distance ratio) -1.08∗∗∗
(0.17)
Mean effect -1.41 -1.41 -1.28 -1.28 -1.18 -1.17 -1.41 -Median effect -1.41 -1.41 -1.27 -1.27 -1.26 -1.25 -1.41 -
R2 0.83 - 0.83 - 0.84 - 0.83 0.84First-stage Stat. 161,034 20,163 2,192
Notes: All regressions include importer and exporter fixed effects for all cities. The both panels report thesame regressions but use different dependent variables: weight of trade flows for panel A and value oftrade flows for panel B. Regressions in panel A are based on 2,476 observations and 2,705 observations inpanel B. In columns 1 to 6, distance is 2005 highway distance. Columns 7 and 8 use Euclidian distance. Incolumn 2, 4, and 6, highway distance terms are instrumented by their corresponding 1947 plannedhighway and 1898 railroad distance terms. Distance ratio is column 8 is the ratio of 2005 highway distanceto Euclidian distance. Robust standard errors in parentheses. ∗∗∗, ∗∗, ∗: significant at 1%, 5%, 10%.
22

Columns 3 and 4 add a quadratic term in log 2005 highway distance to the regressions of column1 and 2, while columns 5 and 6 include cubic and quartic terms. Column 7 returns to the simplespecification of column 1 but uses Euclidian distances. Column 8 mixes Euclidian and highwaydistances. Although we report only trade elasticities with respect to distance the regressions oftable 3 also estimate importer and exporter fixed effects. These are our propensities to importand export and are the dependent variables in our second-step regressions. We first discuss theelasticities reported in table 3 before turning to the fixed effects.
In column 1 the elasticity of trade with respect to distance is -1.90 for weight and -1.41 for value.Column 2 shows that instrumenting 2005 highway distances with 1898 railroad and planned 1947
highway distances does not change these estimates. Columns 3-6 confirm the similarity of ols andiv results. Comparing column 7 with column 1 we see that trade elasticities are about the samefor Euclidean and highway distances. That each of these specifications yields similar elasticityestimates reflects the high correlation between Euclidean distances and network distances along1898 railroads, planned 1947 highways and 2005 highways.
Our estimates of the elasticity of trade with respect to distance range between -1.63 and -1.91 forweight and between -1.17 and -1.41 for value. From equation (11), we see that a larger elasticity ofsubstitution between goods implies a greater sensitivity of trade to distance. Since the us is a highlyintegrated economy trading highly substitutable goods, this suggests that our estimates should beat least marginally larger than what is found for cross-country trade. In fact, our estimates are atthe high end of those collected by Disdier and Head (2008).
In a separate web appendix (Appendix D) we show that road trade is more sensitive to distancethan all trade (appendix table 1). Consistent with this, we also show that elasticities of trade withrespect to distance are smaller for rail trade than road trade (appendix table 2). Finally, we showthat the elasticity of trade with respect to distance is moderately sensitive to how we calculate thedistance for a trade between a city and itself (appendix table 3).
Estimates of the exporter and importer fixed effects are stable across specifications. The pairwisecorrelations between the sets of exporter effects implied by panel a are all 0.99 or above. The sameholds for importer fixed effects. The corresponding correlations for the fixed effects estimatedin panel b are at least equally strong.16 Our second-step regressions, which we report below,generally rely on importer and exporter fixed effects estimated in column 6, although in ourrobustness checks we experiment with importer and exporter fixed effects based on other firststep specifications.
Columns 1 to 7 of table 3 do not address the important question of whether highway distanceor physical remoteness affects trade. Column 8 duplicates column 5 but uses a quartic in logEuclidian rather than highway distance. In addition, column 8 includes the log of the ratio of 2005
highway to Euclidian distance as an explanatory variable. That is, column 8 controls flexibly forEuclidian distances and adds highway distance in an attempt to separately estimate both the effectsof distance and highway distance. For trade in both weight and value, the coefficient on highway
16In addition, the correlations between the weight and value fixed effects estimated from column 6 are 0.92 forexporters and 0.97 for importers. The correlations between importer and exporter fixed effects are 0.73 for weightand 0.75 for values.
23

distance is close to the mean effect of highway distance in column 5. Although the high correlationbetween highway and Euclidian distances makes a definitive conclusion impossible, these resultssuggest the common sense conclusion that highway distance is the true driver of trade.
6.2 Second-step results
We now turn to estimates of equation (22) in order to examine the effect of within-city roadson the propensity to trade. Table 4 reports results for ols regressions using the exporter fixedeffects estimated in the first step as the dependent variable. The second through the fourth rowsreport; robust standard errors, ols standard errors, and fgls standard errors. Column 2 is thesimplest specification consistent with our model (equation 12) and includes within-city highways,employment, and market access. We compute market access as suggested by equation (14), usingthe results from the same first-step specification that we use to estimate exporter fixed effects.17
Column 3 includes log population from 1920, 1950, and 2000.Column 4 also controls for the log share of manufacturing employment in 2003. Our model
assumes that all goods are tradable when the output of many service industries actually is not.This means that column 3 measures the total effect of within-city highways on the extensive margin(the production of tradable vs. non tradable goods) and the intensive margin (the production ofheavier goods within manufacturing), whereas the specification in column 4 measures only theintensive margin.
Columns 5 to 8 perform the same regressions as columns 1 to 4 but use exporter value fixedeffects rather than exporter weight fixed effects as the dependent variable.
The coefficient on city highway kilometers is large for both trade in weight and value in columns1 and 5. When we control for employment and export market access in columns 2 and 6 thehighways coefficients decreases, remaining significant for trade in weight but not for trade invalue. Adding controls for 1920, 1950, and 2000 population in columns 3 and 7 further reduces thehighways coefficient. Finally, controlling for manufacturing employment reduces the coefficienton within-city highways still further to 0.27 for trade in weight in column 4. In column 8, thiscoefficient is small and insignificant for trade in value.
Other results also merit discussion. First, the exporter value fixed effect is roughly proportionalto employment in columns 6 to 8 whereas the exporter weight fixed effect is less than proportionalto employment: bigger cities export lighter goods. This is consistent with well known facts aboutpatterns of specialization in us cities (e.g., Duranton and Puga, 2000). Second, the coefficientson market access are negative and generally significant. This confirms our third comparativestatic. Third, correcting for the sampling error associated with our use of an estimated dependentvariable affects the standard errors only slightly. Given this, we suppress corrected standard errorsin subsequent estimations.
17We do not include a city’s own importer effect when doing this computation: to do so could lead to simultaneitybiases. To see this, consider a situation where some cities import intermediate goods and export final goods. We returnto this issue in our robustness checks when we consider alternative measures of market access.
24

Table 4: Second-step results, OLS for exporter fixed effects
(1) (2) (3) (4) (5) (6) (7) (8)Exporter fixed effect weight weight weight weight value value value value
log highway km 1.17∗∗∗ 0.53∗∗∗ 0.38∗∗ 0.27∗∗ 1.26∗∗∗ 0.24 0.094 -0.037Robust s.e. (0.14) (0.18) (0.14) (0.13) (0.16) (0.19) (0.15) (0.15)Non-robust s.e. (0.12) (0.16) (0.16) (0.14) (0.14) (0.17) (0.16) (0.13)Corrected s.e. (0.12) (0.18) (0.16) (0.16) (0.14) (0.17) (0.16) (0.16)log employment 0.55∗∗∗ 0.73∗ 0.49 0.88∗∗∗ 1.19∗ 0.90∗
(0.12) (0.41) (0.36) (0.11) (0.64) (0.46)Market access (export) -0.45∗∗∗ -0.66∗∗∗ -0.65∗∗∗ -0.18 -0.38∗∗ -0.36∗∗∗
(0.14) (0.15) (0.12) (0.12) (0.15) (0.11)log 1920 population -0.38 -0.29 -0.35 -0.23
(0.27) (0.25) (0.32) (0.33)log 1950 population 1.02∗∗ 0.65 0.95∗ 0.49
(0.43) (0.42) (0.52) (0.55)log 2000 population -0.74 -0.17 -0.85 -0.13
(0.51) (0.49) (0.79) (0.64)log % manuf. emp. 0.66∗∗∗ 0.83∗∗∗
(0.13) (0.17)
R2 0.59 0.73 0.79 0.84 0.56 0.77 0.81 0.88
Notes: 66 observations per column. All regressions include a constant. Robust standard errors inparentheses unless otherwise mentioned. ∗∗∗, ∗∗, ∗: significant at 1%, 5%, 10%.
Panel a of table 15 in Appendix C replicates table 4 using importer rather than exporter fixedeffects as the dependent variable.18 The results are weaker than with exporter fixed effects in table4. Once we include a control for employment, within-city highways becomes insignificant fortrade in both weight and value. The market access term is also insignificant or only marginallysignificant.
Table 5 mirrors table 4 but uses tsls estimation and instruments 2005 kilometers of interstatehighways with 1528-1850 exploration routes, 1898 railroads, and 1947 planned highways. Thetsls and ols coefficient on instrumented lane kilometers of highways are less than one standarddeviation apart in all specifications. The coefficients of other explanatory variables are also stable.These small differences between ols and tsls estimates suggest that highways allocated to citiesat random have about the same effect on trade as highways allocated through the prevailingallocation process.
The first-stage statistics show that the instruments are strong. We pass overidentification testswhen we control for population in 1920 (shortly after the construction of railroads), in 1950 (at thetime of the design of the highway plan), and 2000 (to control implicitly for long run growth since
18Following the specification derived in Appendix B, regressions in table 15 control for both an importer and anexporter market access variable, although the 0.97 correlation between importer and exporter market access makesseparate identification of their coefficients impractical.
25

Table 5: Second-step results, TSLS for exporter fixed effects
(1) (2) (3) (4) (5) (6) (7) (8)Exporter fixed effect weight weight weight weight value value value value
log highway km 1.13∗∗∗ 0.57∗∗∗ 0.47∗∗∗ 0.39∗∗∗ 1.10∗∗∗ 0.17 0.070 -0.028(0.14) (0.16) (0.14) (0.12) (0.17) (0.16) (0.14) (0.12)
log employment 0.52∗∗∗ 0.69∗ 0.46 0.91∗∗∗ 1.20∗∗ 0.89∗∗
(0.11) (0.39) (0.34) (0.091) (0.59) (0.43)Market access (export) -0.45∗∗∗ -0.65∗∗∗ -0.63∗∗∗ -0.19 -0.38∗∗∗ -0.36∗∗∗
(0.14) (0.14) (0.11) (0.12) (0.14) (0.11)log 1920 population -0.38 -0.29 -0.35 -0.23
(0.25) (0.23) (0.31) (0.30)log 1950 population 1.00∗∗ 0.64∗ 0.95∗ 0.49
(0.40) (0.38) (0.49) (0.52)log 2000 population -0.74 -0.18 -0.85 -0.13
(0.49) (0.74)log % manuf. emp. 0.64∗∗∗ 0.83∗∗∗
(0.12) (0.16)
Overid. p-value 0.100 0.043 0.15 0.30 0.081 0.071 0.28 0.55First-stage Stat. 97.5 90.3 80.4 85.2 97.5 90.3 80.4 85.2
Notes: 66 observations per column. All regressions include a constant and use log 1947 planned highwaykm, log 1898 railroad km, and log 1528-1850 exploration routes index as instruments for log kilometers ofinterstate highways. The Stock-Yogo critical values for the first-stage statistics are 13.91 for the relative IVbias (at 5%) and 22.30 for the IV size bias (at 10%). Robust standard errors in parentheses. ∗∗∗, ∗∗, ∗:significant at 1%, 5%, 10%.
1950). That is, the decadal population variables control for persistent productivity that determinesthe assignment of highways to cities and trade flows. For this reason, column 3 in table 5 is ourpreferred specification.
In column 2, the elasticity of weight of exports with respect to lane kilometers of highwaysis 0.57 and highly significant. For the value of trade, the corresponding coefficient in column 6
is smaller at 0.17 and insignificant. In our preferred specification, column 3, the elasticity of theweight of exports with respect to lane kilometers of highways is 0.47 and significant. For the valueof trade in column 7, the coefficient is again smaller and insignificant.
Our comparative static 5 suggests that the weight of trade should be sensitive to within-cityhighways if differences in weight per unit of value are large across sectors. In fact, table 1 showsthat these differences are large for contemporary us manufacturing industries. On the other hand,comparative static 3 suggests that the elasticity of the value of trade with respect to highwaysshould be low. In table 5 we see that the coefficient on within-city highways is larger for trade inweight than for trade in value, and that this difference is statistically significant. We also see thateffect of roads on the value of trade, is statistically indistinguishable from zero with a small pointestimate. This is consistent with comparative static 3 which predicts that the effect of roads on thevalue of exports will be small.
26

In column 4 we add the share of manufacturing employment as a control, the coefficient onwithin-city highways is slightly smaller, at 0.39, than in column 3 and remains significant at 1%.The corresponding coefficient for trade in value in column 8 remains insignificant. The smalldifference in the within-city highway coefficient between columns 3 and 4 suggests that highwaysincrease the weight of trade by affecting the composition of exports rather than by promotingmore manufacturing employment. This is also consistent with the small and insignificant effect ofwithin-city highways on exported values.
The effect of within-city highways on the weight of exports is economically large. Using equa-tions (21) and (22), we calculate that multiplying the stock of within-city highways by a factor α
changes the weight exported by a factor of α0.47. Thus, doubling the stock of within-city highwayscauses a 39% increase in expected export weight. To place this magnitude in the context of oursample, we consider Milwaukee (wi) and Indianapolis (in). These two cities have roughly thesame cfs area population, 1.7 and 1.8 million. Milwaukee is in the second decile in the distributionof interstate lane kilometers whereas Indianapolis is in the ninth decile, with Indianapolis having151% more highways. Our estimates predict that Indianapolis should export 2.510.47 = 1.54 or 54%more tons than Milwaukee. This prediction slightly understates the 56% difference in exportedtons between these two cities in the cfs data. On the other hand, the values exported by the twocities are approximately equal.
Panel b of table 15 in Appendix C performs the same tsls regressions as in table 5, but usesimporter instead of exporter fixed effects as the dependent variable. The coefficient on highwaysfor the weight of imports is positive but small and insignificant. The coefficient on highways forthe value of imports is also insignificant with small point estimates. These tsls results confirm theols results of panel a of the same table. As predicted by comparative static 4, highways do notappear to affect the propensity to import weight or value differently.19
7. Robustness of main results
We now verify the robustness of our estimates. We consider the importance of: instrument choice;alternate control variables; an alternate one-step estimate strategy; alternate specifications of ourfirst-step regression, and the possible endogeneity of our market access control variables.
7.1 Instrument choice
Table 6 checks the robustness of our tsls estimations to choice of instruments and econometrictechnique. Columns 1 to 3 of panel a replicate column 3 of table 5, our preferred specification forexporter fixed effects in weight, but considers pairs of our three instruments. The different pairwisecombinations of instruments yield the same results as our three instruments taken together. Thecoefficient on within-city highways varies between 0.45 and 0.55, close to our estimate of 0.47 in
19That highways foster exports in weight but not value is an important result against the alternative hypothesis thatthe effect of highways on exports is only due to an increase in wholesale and warehousing activity (which shouldarguably affect values as well as weights. We return to this issue below.)
27

Table 6: Second-step results, robustness to choice of instruments and econometric technique
(1) (2) (3) (4) (5) (6) (7) (8)TSLS TSLS TSLS TSLS TSLS TSLS LIML GMM
Panel A. Employment, market access and past populations as controls.
log highway km 0.50∗∗∗ 0.45∗∗∗ 0.55∗∗∗ 0.49∗∗∗ 0.83∗∗∗ 0.11 0.47∗∗∗ 0.41∗∗∗
(0.15) (0.14) (0.17) (0.15) (0.25) (0.31) (0.14) (0.13)
Instrumentslog 1528-1850 exploration N Y Y N N Y Y Ylog 1898 railroad km Y N Y N Y N Y Ylog 1947 highway km Y Y N Y N N Y Y
Overid. p-value 0.061 0.24 0.089 . . . 0.043 0.15First-stage Stat. 70.1 105 46.1 139 45.4 14.9 80.4 80.4
Panel B. Employment, market access, past populations and manufacturing share ofemployment as controls.
log highway km 0.39∗∗∗ 0.38∗∗∗ 0.51∗∗∗ 0.38∗∗∗ 0.64∗∗∗ 0.34∗ 0.39∗∗∗ 0.36∗∗∗
(0.13) (0.12) (0.16) (0.13) (0.22) (0.19) (0.13) (0.12)
Overid. p-value 0.12 0.83 0.25 . . . 0.30 0.30First-stage Stat. 64.1 113 46.7 128 40.9 23.9 85.2 85.2
Notes: 66 observations per column. The dependent variable is exporter fixed effect for weight in allcolumns of both panels. Regressions in panel A use log 2007 highway kilometers, log 2007 employment,export market access, and log population for 1920, 1950, and 2000 as explanatory variables and include aconstant. Panel B also controls for the log share of 2003 manufacturing employment. Each column of panelB replicates the instrumentation strategy of the corresponding column of panel A. Robust standard errorsin parentheses. ∗∗∗, ∗∗, ∗: significant at 1%, 5%, 10%.
table 5. Columns 4 to 6 also replicate this specification, but use the instruments one at a time.While planned 1947 highways yield a coefficient close to our preferred estimate of 0.47 in table 5,the coefficient on highway kilometers obtained from 1898 railroads is larger at 0.83 whereas thatobtained from old exploration routes is smaller and insignificant at 0.12.
Panel b reports the same regressions as panel a but adds the log share of manufacturingemployment as a control variable, as in column 4 of table 5. In columns 5 and 6, the differencebetween regressions using old exploration routes and 1898 railroads as instruments decreases, asdo the p-values for overidentification tests in columns 1 to 3. Thus, the difference in estimatescaused by instrument choice in panel a reflects the fact that old exploration routes are negativelycorrelated with the share of employment in manufacturing, whereas 1898 railroads are positivelycorrelated with this variable. In turn, this is may reflect the fact that more explorations took placein areas with difficult geography and less subsequent manufacturing, whereas railroads may haveled to more manufacturing.
Finally, in columns 7 and 8 of both panels, we replicate the estimation of columns 3 and 4 of table
28

5 using liml and iv-gmm instead of tsls.20liml does not change our results, while iv-gmm leads
to a slightly smaller coefficient on within-city highways. In a separate web appendix (AppendixE, appendix table 4), we duplicate table 6 with the exporter fixed effect for trade in value insteadof weight as the dependent variable. This table confirms our finding in table 5 that point estimatesfor the effect of to sh city highway kilometers on trade in value are positive, but not statisticallydistinguishable from zero. They also show the same differences between our instruments that wesee in table 6 when we do not use the share of manufacturing employment as a control.
7.2 Alternative controls
The age of our instruments precludes reverse causation. However, the exclusion restriction maystill fail if our instruments are correlated with a variable that is not among our controls andaffects a city’s propensity to export. The share of manufacturing employment, discussed above,is an example. We now consider several other variables that might be correlated with both ourinstruments and exports. More specifically, in table 7, we experiment with including a variety ofadditional control variables to our preferred estimates of the effect of within-city highways on thepropensity to export.
It is natural to suspect that geography might affect both our instruments and productivity: ourthree instruments could be correlated with some geographical feature of cities which also affectstheir propensity to trade. In columns 1 and 2 of panel a of table 7, we duplicate our preferred ols
specification with an additional geographical control, log kilometers to the nearest Ocean, Gulf orGreat Lake (‘Water’) and an index of the average land gradient. In panel b, we repeat this for ourpreferred tsls specification. In panel c, we repeat this tsls specification but also include the logshare of manufacturing employment as a control. While the proximity to a body of water leadsto a slightly smaller coefficient for within-city highways, adding average slope makes virtually nodifference. In column 3, we take another approach to geography and introduce dummy variablesfor each census region. This leads to slightly smaller coefficients for within-city highways in allthree panels relative to the corresponding estimates in table 4 or 5.
Another possibility is that our three instruments also affect socio-economic characteristics ofcities and that these characteristics in turn affect trade. To investigate this possibility, in columns4 and 5, we control for the log of the share of college population with at least a college degreeand log income per capita. Including either of these variables leads to slightly smaller coefficientson within-city highways, however the change is not statistically significant. It is also possiblethat cities with more highways export more weight because they serve as logistical centres forthe trucking and warehousing industries (although it would be odd to observe such an effect onthe weight but not value of trade). In column 6, we introduce the log share of employment in
20Limited information maximum likelihood (liml) is a one-stage iv estimator. Compared to tsls, it provides morereliable point estimates and test statistics with weak instruments. As for estimating instrumental variable regressionswith the generalized method of moments, it has a clear advantage in the presence of heteroskedasticity of unknownform.
29

Table 7: Second-step results for weight exporter fixed effects with extra controls
(1) (2) (3) (4) (5) (6) (7) (8)Added Water Slope Census % Income % Traffic Allvar. div. college p.c. wholesale
Panel A. OLS estimations.
log highway km 0.30∗ 0.38∗∗ 0.28∗ 0.26∗ 0.31∗∗ 0.42∗∗∗ 0.37∗ 0.19(0.15) (0.15) (0.16) (0.14) (0.15) (0.14) (0.19) (0.17)
R2 0.79 0.79 0.81 0.81 0.80 0.82 0.79 0.90
Panel B. TSLS estimations.
log highway km 0.37∗∗ 0.47∗∗∗ 0.39∗∗∗ 0.36∗∗∗ 0.42∗∗∗ 0.51∗∗∗ 0.49∗∗ 0.45∗∗∗
(0.16) (0.14) (0.15) (0.13) (0.14) (0.13) (0.19) (0.17)
Overid. p-value 0.11 0.20 0.13 0.19 0.14 0.36 0.12 0.46First-stage Stat. 70.9 86.6 65.5 83.9 81.0 78.5 56.9 27.5
Panel C. TSLS estimations with controls for manufacturing employment.
log highway km 0.34∗∗ 0.41∗∗∗ 0.35∗∗∗ 0.33∗∗∗ 0.36∗∗∗ 0.43∗∗∗ 0.42∗∗ 0.45∗∗∗
(0.15) (0.13) (0.13) (0.12) (0.13) (0.11) (0.16) (0.17)
Overid. p-value 0.27 0.46 0.10 0.25 0.25 0.49 0.27 0.46First-stage Stat. 79.9 90.3 70.0 87.0 82.7 83.6 62.3 27.5
Notes: 66 observations per column. All regressions include a constant, log 2007 employment, export marketaccess, and log population for 1920, 1950, and 2000. All TSLS regressions in panel B use log 1947 plannedhighway km, log 1898 railroad km, and log 1528-1850 exploration routes index as instruments for logkilometers of interstate highways. Robust standard errors in parentheses. The TSLS regressions in panel Calso include the log of the share of manufacturing employment in 2003.As extra controls, column 1 includes average distance to the nearest body of water. Column 2 includesaverage land gradient. Column 3 includes dummy variables for census regions. Column 4 includes the logshare of the fraction of adult population with a college degree or more. Column 5 includes the log ofaverage income per capita. Column 6 includes the log of the share of employment in wholesale trade.Column 7 includes the log of average daily traffic on the interstate highways in 2005. Column 8 adds allthe extra variables of columns 1 to 7 together. ∗∗∗, ∗∗, ∗: significant at 1%, 5%, 10%.
wholesale trade as a control. Relative to the results of tables 4 and 5, we find that this extra controlleads to slightly larger coefficients for within-city highways.
In column 7, we control for congestion on city highways by introducing a control that measuresthe log of average daily traffic on these roads. The coefficients on within-city highways are almostthe same in all three panels. In column 8, we consider all of these extra variables together. Whilethe coefficient on within-city highways in the ols specification of panel a is smaller and becomesinsignificant, the tsls coefficient estimates of panels b and c remain highly significant and closeto their corresponding values in columns 3 and 4 of table 5 without the extra controls. Theseregressions pass overidentification tests easily and the instruments are not weak. In a separate webappendix (Appendix E, appendix table 5), we perform an even more demanding exercise wherewe replicate panel c of table 7 using just one instrument at a time. We find that in the specificationwith all the added controls, each and every instrument remains strong and leads to a positive and
30

significant coefficient between 0.4 and 0.7 for within-city highways.In light of these robustness checks, if our instrumental variables estimates are confounded by a
missing variable, then this missing variable would need to be correlated in the same way with allthree instruments and not be related to any of the variables we consider above.
7.3 One-step specification
While our theoretical model maps naturally into a two-step estimation procedure, we can alsoestimate of the effects of highways on trade in one step with the following regression,
log Xij = λ0 + ρXR log Ri + λX′Ci + α′Ol(log Rij) + ρM
R log Rj + λM′Cj + υij . (23)
As previously, Ci and Cj are city level controls, Ol(log Rij) is an order l polynomial in pairwisehighway distance, and Ri and Rj are within-city highways in the exporting and importing city.In our two-step estimation strategy, we estimate our theoretically derived measure of marketaccess from the first-step gravity equation for use in the second-step estimation. By construction,this approach is not immediately possible in a one-step estimation. Instead, we use an ad-hocmeasure of market access, which is defined as the sum of aggregate income in other cities with thecontribution of each city weighted by distance elevated to the power -0.9.21
When estimating equation (23), we need to account for the fact that the error term υij has threecomponents: one associated with city i, another associated with city j, and one associated with thepair ij. This suggests two-way clustering and we follow the procedure developed by Cameron,Gelbach, and Miller (2010) to implement this error structure. In addition, we try to keep ourinstrumentation strategy simple. In our tsls estimations of equation (23) we only instrumentwithin-city highways but not highway distances between cities.
Table 16 in Appendix C presents results for one-step estimations. Panel a corresponds to theols results of table 4 and those of table 15 panel a in Appendix C. Panel b of table 16 correspondsto the tsls results of table 5 and those of table 15 panel b in Appendix C. In all cases the one-stepestimates are within one standard error of their two-step counterparts and often differ from themonly in the second decimal place. The coefficient on exporter highways using the one-step versionof our preferred specification is 0.41 instead of 0.47 in the two-step estimation. The similarity ofthese estimates is remarkable given the differences in the underlying methodology.
7.4 Alternative specifications for the first step
A separate web appendix (Appendix E, appendix tables 6, 7, and 8) reports checks of the robustnessof our results to changes in the details of the first-step specification. This appendix first reproducesour main tables, tables 4 and 5, when the exporter effect, the dependent variable, results from afirst-step regression which weights observations. The resulting second-step coefficients are nevermore than a standard deviation apart from their corresponding coefficients in tables 4 and 5. Wealso repeat the same exercise using a heckit (a.k.a., type 2 tobit) specification to explicitly accountfor censoring of pairwise trade flows. The resulting second-step highway coefficients are also well
21-0.9 is the mean of all distance decay rates for trade in Disdier and Head’s (2008) meta analysis.
31

within a standard deviation of the corresponding coefficient in tables 4 and 5. Finally, we replicateour preferred ols and tsls second-step regressions, columns 3 of table 3 and 4, using the exportereffects implied by each first-step variant reported in table 2. The resulting changes in our coefficientof interest are small and not statistically significant.
We also check the robustness of our estimates to changes in the way that we impute the distanceof internal trade flows. We first assign all within-city trades a pairwise distance of 1km, so that thelog distance of a city to itself to zero. The resulting second-step coefficient for within-city highwaysare barely affected by this change. We obtain similar results if we simply drop all internal tradesfrom our sample. Our estimates of the effect of city highways on exports are not affected by ourtreatment of internal trade.
7.5 Market access
We now focus on two problems posed by the export market access variables. First, the calculationof the market access for city i in equation (14) sums the importer effect of all cities including i. Sinceexporter and importer market access are strongly correlated, this raises an obvious endogeneityconcern. Second, market access for city i depends on the importer effect of city j, which is itselfaffected by city i. Ignoring own-city effects in the construction of market access is an imperfectsolution.
We investigate these issues in a separate web appendix (Appendix E, appendix table 9). First,we show that ignoring market access altogether increases the coefficient on within-city highwaysby about one standard deviation. Replacing our preferred measure of market access by ad-hocmeasures constructed from 2000 city incomes or 1920 population weighted by inverse distanceyields a slightly smaller coefficient on within-city highways. Using a ‘full’ market access that takesinto account a city’s own importer effect increases the coefficient on within-city highways and also,unsurprisingly, makes the coefficient on market access positive.
We also experiment with tsls specifications which instrument for our preferred measure ofmarket access using our ad-hoc measures. Relative to the results of our preferred specification,the coefficient of within-city highways is about the same, while the coefficient for market access isbetween -0.7 and -0.8.
Overall, we find that our treatment of the market access variable has little effect on the estimateof the effect of within-city highways.
8. Extensions
8.1 Alternate highway measures
Our analysis of within-city highways has so far relied exclusively on a single measure of within-city roads, the log of within-city interstate highway kilometers. This choice is convenient because,as we point out in section 3, it allows us to treat second-step coefficients as elasticities. However,convenience aside, nothing in our theory suggests either this particular measure or our choice of
32

Table 8: Second-step results for weight exporter fixed effects with alternative measures of cityhighways
(1) (2) (3) (4) (5) (6) (7) (8)Measure of log highway log highway log highway log highwaycity roads rays lane km, 2007 urban km, 2007 km, 1987
Panel A. OLS estimations.
Road var. 0.30∗∗∗ 0.33∗∗∗ 0.25∗∗ 0.21∗ 0.25 0.27∗ 0.11∗ 0.11∗∗
(0.11) (0.094) (0.12) (0.11) (0.16) (0.15) (0.057) (0.050)% manuf. emp. N Y N Y N Y N Y
R2 0.79 0.86 0.78 0.84 0.77 0.84 0.78 0.84
Panel B. TSLS estimations.
Road var. 0.41∗∗∗ 0.40∗∗∗ 0.55∗∗∗ 0.44∗∗∗ 0.95∗∗∗ 0.77∗∗∗ 0.41∗∗∗ 0.32∗∗∗
(0.15) (0.12) (0.17) (0.15) (0.34) (0.29) (0.13) (0.12)% manuf. emp. N Y N Y N Y N Y
Overid. p-value 0.63 0.14 0.47 0.68 0.20 0.32 0.18 0.20First-stage Stat. 74.8 73.5 21.4 20.4 5.09 4.99 19.2 17.7
Notes: 66 observations per column. All regressions include a constant and log 2007 employment, logmarket access, and log past populations in 1920, 1950, and 2000 as controls. The TSLS regressions ofcolumns 1 and 2 in panel B use log rays of 1947 planned highway km and log rays of 1898 railroad km asinstruments for log rays of interstate highways. The other TSLS regressions use log 1947 planned highwaykm, log 1898 railroad km, and log 1528-1850 exploration routes index as instruments. Robust standarderrors in parentheses. ∗∗∗, ∗∗, ∗: significant at 1%, 5%, 10%.
functional form. We here investigate the effects of alternative functional forms and alternativemeasures for within-city highways.
If we add higher order terms for within-city highways in the ols and tsls specifications oftable 4 and 5 (not reported) we find higher order terms are sometimes significant. In the separateweb appendix (Appendix E), we plot the residuals of the first four columns of table 4 (appendixfigure 1, panels a to d) and the first four columns of table 5 (appendix figure 2, panels a to d)and the component associated with log kilometers of city highways against log kilometers ofcity highways. These plots indicate that the relationship between exports and kilometers of cityhighways is well approximated by a log-log specification.
In table 8 we investigate the effects of alternative measures of within-city roads on trade. Incolumn 1, we duplicate our preferred specifications but use the log of the number of radial raysof interstate highways to measure within-city roads. The ols coefficient in panel a is slightlysmaller than its corresponding coefficient in table 4, which uses our benchmark measure of roads.To estimate the tsls coefficient in panel b, we use the number of rays of 1898 railroads and 1947
planned interstate highways as instruments. This tsls coefficient is also slightly smaller than itscounterpart in table 5. In column 2, we retain the same road variable and add the log share ofmanufacturing employment as a control. The ols and tsls results are close to the correspondingresults of tables 4 and 5, which use kilometers of highways instead of rays to measure within-city
33
roads.In columns 3 and 4, we use lane kilometers of within-city highway (instead of highway kilo-
meters) as our measure of roads. While the ols coefficients in panel a are smaller than the corre-sponding coefficients in tables 4 and 5, the tsls coefficients are close to our preferred estimates. Incolumns 5 and 6, our measure of roads is the log of within-city interstate kilometers in urbanizedareas within the city. While the ols coefficients are smaller than the corresponding coefficientsin table 4 and marginally significant, the tsls results are much larger than in table 5. Since ourinstruments are weak for highways in urbanized areas, no conclusion should be drawn from theseestimates. Finally, in columns 7 and 8 we lag our preferred measure of roads by 20 years. Asexpected, ols coefficients are smaller than for contemporaneous highways. tsls results are muchcloser, since tsls corrects for mismeasurement.
Table 8 shows that our main results do not depend on a specific road variable or on the exactfunctional form specification we use. We obtain similar results for several different measures ofwithin-city highways. Experiments with specifications which jointly estimate the effect of morethan one road measure were inconclusive due to strong collinearity between the two variables.Thus, our data provide strong evidence that expansions of the within-city highway networkincreases the weight of exports, but cannot shed light on the precise aspect of the road networkthat causes this increase.
8.2 Short- and long-distance trade
Our description of trade costs, equation (10), requires that the cost of exiting a city is proportionalto a fixed fraction of a shipment regardless of the final destination. Alternatively, common sensesuggests that within-city roads may matter less for shipments over longer distances.
To investigate this conjecture, we construct subsamples of shipments travelling less than 1,000
kilometers and more than 1,000 kilometers, and repeat our two-step estimation for each subsample.Shipments travelling less than 1,000 kilometers account for more than 90% of all trade in weightin our data. Panels a and b of table 9 report results. Columns 1 and 2 reproduce the two ols
specifications of columns 3 and 4 of table 4 for trade in weight. Columns 3 and 4 reproduce thetwo corresponding tsls specifications of columns 3 and 4 of table 5. Finally, columns 5 to 8 repeatthe same exercise for trade in value.
Panel a reports coefficient estimates based on shipments travelling less than 1,000 km. Inter-estingly, we see that the elasticity of exports with respect to roads is larger for trading distancesbelow 1,000 km than for all trade. For our preferred specification, the coefficient on within-cityhighways is 0.81 for trading distances less than 1,000 kilometers, instead of 0.47 for all trade. Onthe other hand, for shipments travelling more than 1,000 kilometers, in panel b, the coefficient onwithin-city highways is 0.23 and insignificant. Hence, within-city highways have a larger effect onshipments travelling shorter distances. We note that less than 6% of tons trade over distances fatherthan 1,000 kilometers.22 In panel c of table 9 we also consider trade over long distances, but here
22From the figure, 1000 km is at the 82nd percentile of exports to other cities and from table 1 that only 31% of tonsare exported to other cities. Thus, we have 0.31× 0.18 = 0.06.
34
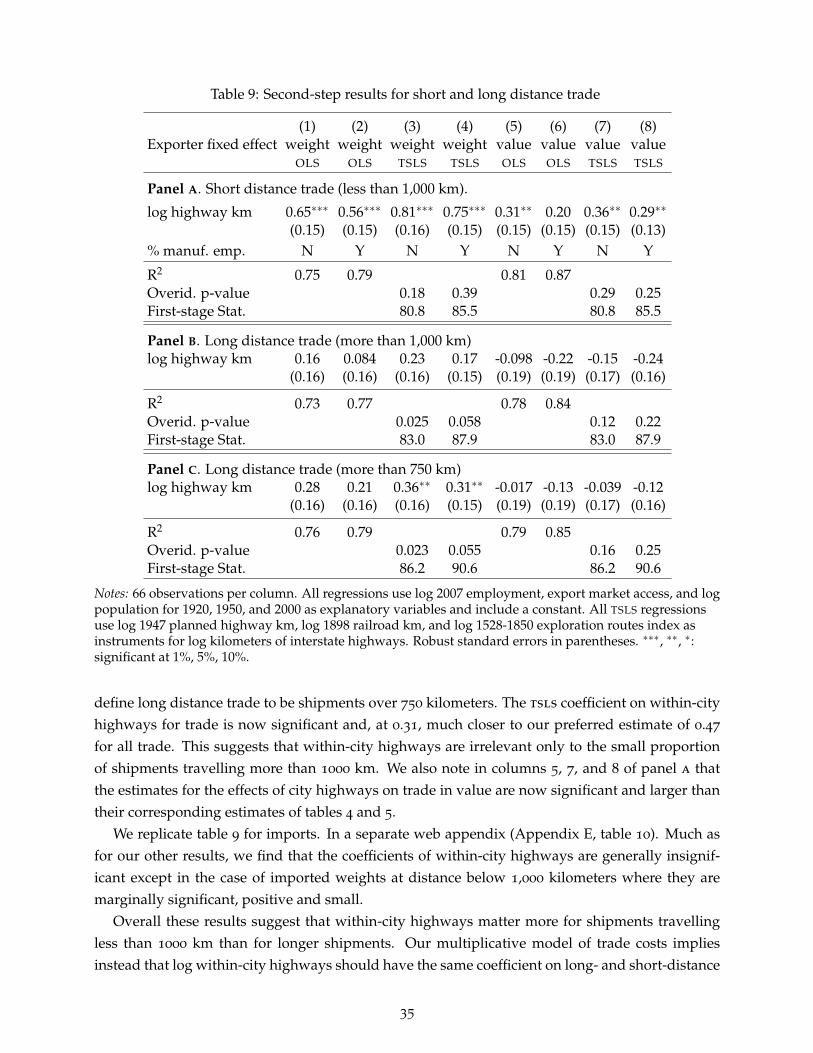
Table 9: Second-step results for short and long distance trade
(1) (2) (3) (4) (5) (6) (7) (8)Exporter fixed effect weight weight weight weight value value value value
OLS OLS TSLS TSLS OLS OLS TSLS TSLS
Panel A. Short distance trade (less than 1,000 km).
log highway km 0.65∗∗∗ 0.56∗∗∗ 0.81∗∗∗ 0.75∗∗∗ 0.31∗∗ 0.20 0.36∗∗ 0.29∗∗
(0.15) (0.15) (0.16) (0.15) (0.15) (0.15) (0.15) (0.13)% manuf. emp. N Y N Y N Y N Y
R2 0.75 0.79 0.81 0.87Overid. p-value 0.18 0.39 0.29 0.25First-stage Stat. 80.8 85.5 80.8 85.5
Panel B. Long distance trade (more than 1,000 km)log highway km 0.16 0.084 0.23 0.17 -0.098 -0.22 -0.15 -0.24
(0.16) (0.16) (0.16) (0.15) (0.19) (0.19) (0.17) (0.16)
R2 0.73 0.77 0.78 0.84Overid. p-value 0.025 0.058 0.12 0.22First-stage Stat. 83.0 87.9 83.0 87.9
Panel C. Long distance trade (more than 750 km)log highway km 0.28 0.21 0.36∗∗ 0.31∗∗ -0.017 -0.13 -0.039 -0.12
(0.16) (0.16) (0.16) (0.15) (0.19) (0.19) (0.17) (0.16)
R2 0.76 0.79 0.79 0.85Overid. p-value 0.023 0.055 0.16 0.25First-stage Stat. 86.2 90.6 86.2 90.6
Notes: 66 observations per column. All regressions use log 2007 employment, export market access, and logpopulation for 1920, 1950, and 2000 as explanatory variables and include a constant. All TSLS regressionsuse log 1947 planned highway km, log 1898 railroad km, and log 1528-1850 exploration routes index asinstruments for log kilometers of interstate highways. Robust standard errors in parentheses. ∗∗∗, ∗∗, ∗:significant at 1%, 5%, 10%.
define long distance trade to be shipments over 750 kilometers. The tsls coefficient on within-cityhighways for trade is now significant and, at 0.31, much closer to our preferred estimate of 0.47
for all trade. This suggests that within-city highways are irrelevant only to the small proportionof shipments travelling more than 1000 km. We also note in columns 5, 7, and 8 of panel a thatthe estimates for the effects of city highways on trade in value are now significant and larger thantheir corresponding estimates of tables 4 and 5.
We replicate table 9 for imports. In a separate web appendix (Appendix E, table 10). Much asfor our other results, we find that the coefficients of within-city highways are generally insignif-icant except in the case of imported weights at distance below 1,000 kilometers where they aremarginally significant, positive and small.
Overall these results suggest that within-city highways matter more for shipments travellingless than 1000 km than for longer shipments. Our multiplicative model of trade costs impliesinstead that log within-city highways should have the same coefficient on long- and short-distance
35

shipments. It is natural to suspect that an additive specification would imply that city roadsmatter more for short distance trade. With additive transportation costs, the cost of exiting a cityrepresents a larger fraction of the total cost of trade.
The case for such a model is ambiguous. An additive specification of trade costs would makeour model intractable and represents a long standing challenge in the international trade literature.More importantly, additive specifications for trade costs imply that aggregate trade flows no longerfollow the standard gravity specification we use in the first step of our analysis. The results of table3 show that a simple gravity specification is an excellent first approximation for bilateral tradeflows.23 While we leave a definitive resolution of this puzzle to future research, in a separate webappendix (Appendix F) we explore possible biases in our estimates if the true effect of within-cityroads is purely additive. In a simplified partial equilibrium version of our model, we find that,unless the cost of exiting a city represents an implausibly large fraction of the total cost of trade,we are likely to underestimate the true elasticity of transportation costs with respect to city roads.
8.3 Trade internal to cities
Trade within cities is an important component of trade. From table 2 we see that internal tradeaccounts for about 69% of the weight and 38% of the value of all trade in our sample. In thissection we investigate the effect of within-city highways on internal trade.
We note that our model delivers some predictions for the log share of internal trade. We developthese in a separate web appendix (Appendix G). A caveat is that the exact specification dependson the details of how we model transportation cost for trade within cities. To avoid having resultsthat rely on arbitrary choices made about this issue in the theoretical model, we experiment with avariety of specifications in table 10.
Panel a of table 10 reproduces the same ols regressions as table 4 but uses the log weight and thelog value of shipments internal to the city. That is, it conducts estimates of equation (22) with thelog of internal trade, by weight or value, as the dependent variable. Panel b of table 10 replicatesthe same exercise for the tsls regressions of table 5.
Comparing the results of panels a and b to those of tables 4 and 5, we find that the coefficientson within-city highways are slightly larger than their corresponding estimates in table 4 or 5
but that the difference is less than one standard deviation. Although underlying regressions arequite different, these coefficients are comparable: in table 10, within-city highway coefficients areelasticities of internal trade, while in tables 4 and 5 coefficients are also elasticities of inter-citytrade.
Interestingly, if we compare the estimates of panels a and b of table 10 to those obtained inpanel a of table 9, which focuses on short distance trade, the effects are smaller. Hence, althoughwithin-city highways have a slightly larger effect on internal trade than on all trade, this effect issmaller than that on trade taking place at distances below 1,000 km.
23To be precise,with a constant elasticity for the cost of distance, an additive specification for the cost of exiting a citywould no longer imply a gravity specification since log trade would no longer be proportional to log distance except insome extremely specific cases.
36

Table 10: Trade internal to cities
(1) (2) (3) (4) (5) (6) (7) (8)Exporter fixed effect weight weight weight weight value value value value
Panel A. Dependent variable: log internal trade, OLS.
log highway km 1.26∗∗∗ 0.38∗∗ 0.41∗∗ 0.38∗∗ 1.45∗∗∗ 0.33∗∗∗ 0.26∗∗ 0.20∗
(0.14) (0.17) (0.16) (0.17) (0.12) (0.12) (0.12) (0.11)Controls. 0 1 2 3 0 1 2 3
R2 0.63 0.82 0.82 0.83 0.66 0.90 0.91 0.92
Panel B. Dependent variable: log internal trade, TSLS.log highway km 1.22∗∗∗ 0.54∗∗∗ 0.56∗∗∗ 0.54∗∗∗ 1.31∗∗∗ 0.31∗∗∗ 0.27∗∗ 0.22∗
(0.13) (0.15) (0.16) (0.16) (0.13) (0.12) (0.12) (0.11)
Overid. p-value 0.72 0.77 0.67 0.84 0.26 0.21 0.25 0.65First-stage Stat. 97.5 90.3 80.4 85.2 97.5 90.3 80.4 85.2
Panel C. Dependent variable: log share of internal trade, TSLS
log highway km 0.043 -0.035 -0.030 -0.024 0.13∗ 0.064 0.084 0.10(0.030) (0.035) (0.034) (0.034) (0.068) (0.081) (0.078) (0.074)
Overid. p-value 0.13 0.20 0.098 0.14 0.073 0.098 0.28 0.42First-stage Stat. 97.5 90.3 80.4 85.2 97.5 90.3 80.4 85.2
Panel D. Dependent variable: log internal trade, TSLS controlling for internal distances.log highway km 0.95∗∗∗ 0.33 0.33 0.32 1.09∗∗∗ 0.36∗∗ 0.16 0.13
(0.24) (0.22) (0.24) (0.22) (0.24) (0.17) (0.20) (0.20)log internal distance 0.61∗ 0.40 0.40 0.39 0.49 -0.081 0.20 0.16
(0.35) (0.26) (0.30) (0.28) (0.40) (0.22) (0.29) (0.26)
Overid. p-value 0.37 0.57 0.54 0.75 0.093 0.21 0.20 0.58First-stage Stat. 34.9 42.8 31.7 34.9 34.9 42.8 31.7 34.9
Notes: 66 observations per column. The set controls 0 is a constant; 1 adds log 2007 employment and exportmarket access; 2 further adds log population for 1920, 1950, and 2000; 3 also consider log share ofmanufacturing employment. All TSLS regressions use log 1947 planned highway km, log 1898 railroad km,and log 1528-1850 exploration routes index as instruments for log kilometers of interstate highways.Robust standard errors in parentheses. ∗∗∗, ∗∗, ∗: significant at 1%, 5%, 10%.
Panel c of table 10 reproduces the regressions of panels a and b, but uses the log share of internalshipments as the dependent variable. Panel d adds log internal distance to the specifications usedin panel c. These regressions allow us to check whether within-city highways cause cities to changetheir trading patterns in favor of internal trade. These two sets of regressions do not producerobust estimates. To the extent that within-city highways do shift a city’s trade patterns in favorof internal trade, this effect is too small to measure in our sample. This is consistent with panels a
and b, which suggest that the effect of within-city highways on trade is about the same as the effectof within-city highways on external trade.
37

Table 11: Second-step results for rail trade
(1) (2) (3) (4) (5) (6) (7) (8)Exporter fixed effect weight weight weight weight value value value value
Panel A. OLS estimations.
log railroad km 0.45 0.83∗∗∗ 0.93∗∗∗ 1.00∗∗∗ 0.13 0.074 -0.072 -0.034(0.32) (0.26) (0.27) (0.25) (0.27) (0.31) (0.31) (0.33)
Controls. 0 1 2 3 0 1 2 3
Observations 40 34 34 34 39 39 39 39R2 0.09 0.25 0.28 0.38 0.00 0.02 0.21 0.22
Panel B. TSLS estimations.
log railroad km 0.070 0.79∗∗ 0.74∗∗ 1.10∗∗∗ -0.040 -0.34 -0.34 -0.22(0.35) (0.32) (0.30) (0.29) (0.39) (0.48) (0.42) (0.42)
Controls. 0 1 2 3 0 1 2 3
Observations 40 34 34 34 39 39 39 39First-stage Stat. 43.7 22.8 17.1 17.4 62.9 36.4 33.6 31.1
Notes: The set controls 0 is a constant; 1 adds log 2007 employment and export market access; 2 furtheradds log population for 1920, 1950, and 2000; 3 also consider log share of manufacturing employment. AllTSLS regressions use log 1898 railroad km as instrument for log kilometers of rail tracks. Robust standarderrors in parentheses. ∗∗∗, ∗∗, ∗: significant at 1%, 5%, 10%.
8.4 Rail
Although railroads carry only a small fraction of all trade, it is interesting to ask if railroads incities foster rail trade.24 To assess the effect of railroad tracks on trade, we replicate our mainanalysis using rail variables. In the first step, we regress bilateral rail trade between cities on aquartic of track distance between them, and importer and exporter fixed effects. We report resultsthe separate web appendix (Appendix D, table 2). Unsurprisingly, rail trade is far less sensitive todistance than road trade. The coefficient on distance for rail trade in weight is -0.57 instead of -1.90
for road trade.Panel a of table 11 duplicates our main set of second step ols results, i.e., table 4, for railroads.
Panel b repeats our main tsls results of table 5 for railroads using 1898 railroads as an instrumentfor 2004 kilometers of within-city railroad track. The main result from table 11 is the strong effectof railroads on rail trade in weight. In column 3 of panel b, the coefficient on railroad kilometersis 0.74 whereas the corresponding estimate for the effect of interstate highways on road trade is0.47. Controlling for the manufacturing share of employment in column 4 yields an even largerestimate. Otherwise, the results for rail trade are similar to those for road trade. We see no effectof city rail tracks on the value of rail trade and the difference between ols and tsls coefficients issmall. We note that these rail results rely on much smaller trade volumes and a smaller number ofcities than do the results for road trade, and so should be regarded as somewhat speculative.
24We also investigated possible patterns of complementarities and substitution between road and rail for overall trade.The strong correlation between railroad kilometers and interstate highway kilometers leads unfortunately to unstableresults. In addition, we could not find strong enough instruments for the rail-road interaction terms.
38

9. Roads and employment specialization
Our results so far show that within-city highways cause an increase in the weight of a city’s trade,but not its value. A natural corollary of this finding is that highways should have a positive effecton the weight per unit value of exports (tons per dollar), and indeed, regression results verify thisrelationship (not reported). That within-city highways cause an increase in the weight but notvalue of a city’s trade also implies that an increase in within-city highways causes cities to becomemore specialized in the production of heavy sectors according to comparative static 6. We nowconduct our second main empirical exercise and examine city level sectoral employment data tocheck this implication directly.
We use our panel of road and employment data to search for a systematic relationship betweenthe extent of a city’s highway network and employment in sectors producing heavy goods. Aspreviously, let Nk
i denote employment in sector k and city i, Ri the kilometers of interstate highwaywithin a city, and Ci a vector of control variables such as log employment, log population in 1920,1950, and 2000, and market access.
Our estimations proceed in two steps. First, we predict city level employment in each sector asa function of the city’s highways. For each sector, we estimate
ln Nki = βk
0 + ρN,kR ln Ri + βk′Ci + εk
i , (24)
where εki is a mean zero error. The coefficient of interest is ρN,k
R , the elasticity of sector k employmentwith respect to within-city highways. As in our model, Vk is the average tons per dollar of outputfor sector k. Table 1 enumerates the sectors in the cfs and reports weight per dollar for tradein these sectors. We next use ρ̂N,k
R as the dependent variable in a regression where Vk is theexplanatory variable of interest,
ρ̂N,kR = γ0 + γ1 ln Vk + υk. (25)
If γ1 > 0 then cities specialize in sectors producing heavier goods when they have more within-cityhighways, and we confirm comparative static 6.
Table 12 reports estimates of equation (25). In column 1 of panel a, the dependent variable isthe highway elasticity of sector employment from ols estimates of equation (24). We find thatcities with more roads specialise in the production of heavier goods. The remaining columns oftable 12 check the robustness of this finding by varying the specification used to estimate ρN,k
R inequation (24). In column 2, our dependent variable is a tsls estimate of ρN,k
R where we use allthree of our instruments. In column 3, we include log distance to the nearest body of water andlog average land gradient as control variables in estimates of ρN,k
R . In column 4, we include censusregion indicators. Column 5 includes the log share of adult population with a college degree.To control for natural resource abundance, column 6 includes the proportion of employment inmining. In columns 7 and 8, we include log income per capita and wholesale employment ascontrols, respectively.
As we move down the panels of table 12, we vary the control variables included in our estimatesof the second-step equation (25). Panel b repeats the estimates of panel a while controlling for
39

Table 12: Main specialization results
(1) (2) (3) (4) (5) (6) (7) (8)Dependent variable: industry specific coefficient on interstate highwaysestimated with: OLS TSLS TSLS TSLS TSLS TSLS TSLS TSLS
using additional controls: - - Water & Census % Mining Income WholesaleSlope Div. College pc.
Panel A: Baseline
log weight per 0.13∗∗ 0.16∗∗∗ 0.22∗∗ 0.12∗∗ 0.16∗∗∗ 0.14∗∗ 0.17∗∗∗ 0.16∗∗∗
unit value (0.047) (0.051) (0.082) (0.055) (0.048) (0.049) (0.053) (0.050)
R2 0.28 0.33 0.26 0.18 0.34 0.29 0.34 0.32
Panel B: With 2007 manufacturing employment
log weight per 0.16∗∗∗ 0.18∗∗∗ 0.22∗∗ 0.13∗∗ 0.16∗∗∗ 0.16∗∗∗ 0.18∗∗∗ 0.17∗∗∗
unit value (0.038) (0.044) (0.079) (0.050) (0.045) (0.043) (0.048) (0.043)
R2 0.46 0.44 0.28 0.24 0.39 0.40 0.41 0.45
Panel C: With 1956 sectoral employment
log weight per 0.12∗∗ 0.16∗∗∗ 0.11∗∗ 0.10∗∗ 0.18∗∗∗ 0.17∗∗∗ 0.19∗∗∗ 0.16∗∗∗
unit value (0.045) (0.042) (0.043) (0.044) (0.037) (0.048) (0.039) (0.043)
R2 0.26 0.42 0.26 0.22 0.54 0.39 0.54 0.42
Panel D: With 1956 sectoral and 2007 manufacturing employment
log weight per 0.14∗∗∗ 0.17∗∗∗ 0.13∗∗∗ 0.12∗∗ 0.13∗∗∗ 0.18∗∗∗ 0.17∗∗∗ 0.17∗∗∗
unit value (0.041) (0.041) (0.039) (0.047) (0.033) (0.043) (0.040) (0.041)R2 0.37 0.47 0.35 0.23 0.45 0.47 0.49 0.47
Notes: 22 observations per column for each panel. Standard errors in parentheses. The dependent variableis the industry specific coefficient on interstate highways estimated from regression (24) using logkilometers of interstate highways, log 2007 employment, log 1920, 1950, and 2000 population and logmarket access. Column 1 is estimated with OLS whereas columns 2-7 are estimated with TSLS using log1947 planned highway km, log 1898 railroad km, and log 1528-1850 exploration routes index asinstruments for log kilometers of interstate highways. The regression estimating the highways elasticity ofemployment also includes log distance to water and log slope (column 3), census region dummies (column4), log share college graduates (column 5), log share mining employment (column 6), log sharemanufacturing employment (column 7), and log share employment in wholesale (column 8). Robuststandard errors in parentheses. ∗∗∗, ∗∗, ∗: significant at 1%, 5%, 10%.
manufacturing employment in the second step. In all columns of panels a and b, we find thatγ1 > 0. This suggests that cities specialize employment in heavy industries when they have morehighways. Long-lived, but omitted variables may be correlated with sectoral specialization andthe development of the interstate highway system and precede their construction. If sothen theresults reported in table 12 may reflect patterns of industrial specialization prior to the constructionof the highway system. Panels c and d address this concern. Panel c replicates panel a with aslightly different dependent variable. In particular, it uses estimates of ρN,k
R based on a variant ofequation (24) which also controls for 1956 employment in industry k in city i. Since within-cityhighways were zero for all cities in 1956, this year marks the beginning of interstate construction,
40

Figure 5: Specialization
‐1
‐0.6
‐0.2
0.2
0.6
1
‐4 ‐3 ‐2 ‐1 0 1 2 3 4 5
Sector elasticity of city employ
men
t with re
spect to
city ro
ads
Industry log unit weight
Notes: The horizontal axis plots log weight unit per dollar by sector. The vertical axis plots the elasticity ofindustry employment with respect to city kilometers of interstate highways estimated in column 2 of table12.
this first step regression is equivalent to a regression in first differences. Panel d also includesthe share of manufacturing employment in city i as a control variable in equation (24).25 Figure5 plots the data underlying column 2 of Panel d. This figure shows that in sectors producingheavy goods, employment increases with city highways whereas in sectors producing light goods,it decreases with city highways.26 More generally, the results reported in all the panels of table 12
show a complementarity between within-city highways and employment in heavy sectors exactlyas comparative static 6 predicts.
The results reported in table 12 are based on the two-step approach described by equations (24)and (25). We can also estimate the complementarity between roads and employment in heavysectors in a single step. To conduct this estimation we regress log employment in each industry onlog highways and log highways interacted with log unit weight. We report results correspondingto panel a of table 12 based on a single step econometric procedure in a separate web appendix(Appendix H, appendix table 11). These results are close to those of table 12.
Our data also allow us to track the way that the development of the us interstate highwaysystem gradually led us cities to specialize. A simple way to do this is to estimate equation (24)in first differences between 1956 and 1970, 1977, 1987, 1997, and 2007. In this regression, thedependent variable is a change in sectoral employment and the explanatory variable of interest
25We include the initial level of employment in industry k in city i on the right-hand side as opposed to constraining itscoefficient to one and the placing it on the left hand side due to evidence that mean reversion in city-sector employmentis a major feature of the data as found by Simon (2004) and Duranton (2007). Duranton and Turner (2012) also find thataggregate city employment only adjusts gradually with city highways. This requires controlling for initial levels.
26 Results are robust to the exclusion of the point in the lower left hand corner which is naics industry 334 which is“Computer and Electronic Product Manufacturing."
41

Table 13: Specialization results, dynamics
(1) (2) (3) (4) (5)1956-1970 1956-1977 1956-1987 1956-1997 1956-2007
Panel A. Dependent variable: industry specific coefficient on interstate highways
in first-difference, OLS
log weight per unit value 0.0057 -0.0082 0.093∗∗ 0.15∗∗∗ 0.15∗∗∗
(0.038) (0.026) (0.042) (0.036) (0.045)
R2 0.00 0.01 0.19 0.46 0.36
Panel B. Dependent variable: industry specific coefficient on interstate highways
in first-difference, TSLS
log weight per unit value 0.096∗ 0.037 0.15∗∗∗ 0.21∗∗∗ 0.20∗∗∗
(0.050) (0.031) (0.044) (0.040) (0.045)
R2 0.16 0.07 0.37 0.57 0.50
Notes: 22 observations per column for each panel. Standard errors in parentheses. The dependent variableis the industry specific coefficient on interstate highways estimated from a first-differenced version ofregression (24) using log kilometers of interstate highways. The regressions in panel A are estimated withOLS whereas those of panel B are estimated with TSLS. Robust standard errors in parentheses. ∗∗∗, ∗∗, ∗:significant at 1%, 5%, 10%.
is the corresponding change in within-city highway kilometers. We can estimate this equationwith ols. We can also use tsls to correct for the probable endogeneity of within-city highways.
Table 13 reports results for increasingly long first differences, all of which take 1956 as theirinitial year. In panel a, we estimate the sensitivity of changes in sectoral employment to changes inwithin-city highways using ols in the first step. In panel b we estimate the first step with tsls usingplanned 1947 highways, 1898 railroads, and old exploration routes as instruments. The results oftable 13 show that the effects of changes in interstate highways on sectoral employment is notcorrelated (or only weakly correlated) with weight per unit value in 2007 for the earlier periods,1956-1970 and 1956-1977. Increasing specialisation in heavier sectors in cities with more roadsbecomes more apparent over 1956-1987 and 1956-1997. The results for 1956-2007 are the same asthose for 1956-1997 and suggest no further effects after 1997, many years after the substantive com-pletion of the us interstate highway system. To confirm these results, we further explore the timingof sectoral specialization in relation to roads by replicating panel c of table 12 while controlling foremployment in increasingly recent years. In a web appendix (Appendix H, appendix table 12),we report results showing again that most of the changes in employment specialization caused bythe within-city highways took place between 1977 and 1997. Overall, these results are suggestivethat changes in sectoral employment followed the development of the interstate highway systemwhich mostly took place during the 1960s and 1970s with a lag of 10 to 20 years.
42

10. Conclusion
This paper examines the causal effect of highway infrastructure on the level and composition oftrade in U.S. cities. We find that the weight and value of bilateral trade decrease rapidly with thehighway distance between cities, with the weight of trade decreasing more rapidly than its value.A 1% reduction in the travel distance between to trading partners increases the value of tradebetween them by 1.4% and the total weight by 1.9%. These large effects imply that reducing thesepairwise distances through expanding the highway system is likely to have large effects on tradeand welfare. While a high correlation between Euclidean and highway network distance makesit difficult to untangle econometrically their separate roles, we note that the median highwaynetwork distance is 20% further than the median Euclidean distance leaving open the possibilityfor further improvements.
We also find that within-city highways affect trade. A 10% increase in a city’s stock of highwayscauses approximately a 5% increase in the weight of exports, but does not cause a measurablechange in the value of exports. While we do find an effect of highways on the value of trade atshort distances including within the city, the effect on trade in weight is also larger than at longerdistances. Consequently, an increase in within city highways causes a city to specialize in theexport of heavy goods.
Using independent data on county-level employment, we find evidence of specialization inresponse to differences in within-city roads as suggested by our results using trade data. Both timeseries and cross-section variation in these data suggest that improvements to the within-city roadnetwork cause cities to specialize in employing workers in sectors with heavy output. These datafurther suggest that this specialization takes about 10 or 20 years to complete: the effect of theinterstate highway system on employment specialization seems to have been completely realizedby the late 1990s, about 20 years after the bulk of construction was completed.
To assess the relevant cost-benefit tradeoff involved in the construction of new roads, recallthat an average city in our sample has 381 kilometers of interstate highway within its boundaries.Increasing the extent of this network by 1% requires the construction of about 4 kilometers ofnew highways. This results in about a 0.29% increase in the value of short distance trade and nodiscernable increase in the total value of trade. Given that trade below 1000 kilometers accountsfor about 43 billion dollars per year for an average city, these new 4 km of within-city highwayscause about 125 million dollars per year in new trade at short distances and cost approximately 12
million dollars per year (Duranton and Turner, 2012).In sum, our results provide an important new insight into the way transportation infrastructure
affects trade and the organization of economic activity. Better transportation encourages trade ingeneral, and in particular, encourages the production and trade of things that are hard to move. Wealso estimate the magnitude of these effects. In addition to their academic interest, these estimateshelp to inform policy makers as they make infrastructure policy. Our results suggest that, at themargin, a dollar of roads will have a larger effect on trading within cities and at short distancesthan between cities.
43

References
Alchian, Armen A. and William R. Allen. 1964. University Economics. Belmont, ca: Wadsworth.
Anderson, James E. and Eric van Wincoop. 2003. Gravity with gravitas: A solution to the borderpuzzle. American Economic Review 93(1):170–192.
Arkolakis, Costas, Arnaud Costinot, and Andrés Rodríguez-Clare. 2012. New trade models, sameold gains? American Economic Review 102(1):94–130.
Baum-Snow, Nathaniel. 2007. Did highways cause suburbanization? Quarterly Journal of Economics122(2):775–805.
Baum-Snow, Nathaniel, Loren Brandt, J. Vernon Henderson, Matthew A. Turner, and QinghuaZhang. 2012. Roads, railroads and decentralization of chinese cities. Processed, University ofToronto.
Beaudry, Paul, David A. Green, and Ben Sand. 2012. Spatial equilibrium with unemployment andwage bargaining: Theory and estimation. Processed, University of British Columbia.
Behar, Alberto and Anthony J. Venables. 2011. Transport costs and international trade. In Andréde Palma, Robin Lindsey, Emile Quinet, and Roger Vickerman (eds.) A Handbook Of TransportEconomics. Cheltenham: Edward Elgar, 97–115.
Behrens, Kristian and Pierre M. Picard. 2011. Transportation, freight rates, and economic geogra-phy. Journal of International Economics 85(2):280–291.
Cameron, A. Colin, Jonah B. Gelbach, and Douglas L. Miller. 2010. Robust inference with multi-way clustering. Journal of Business and Economic Statistics 29(2):238–249.
Chandra, Amitabh and Eric Thompson. 2000. Does public infractsructure affect economic activ-ity? Evidence from the rural interstate highway system. Regional Science and Urban Economics30(4):457–490.
Clark, Ximena, David Dollar, and Alejandro Micco. 2004. Port efficiency, maritime transport costs,and bilateral trade. Journal of Development Economics 75(2):417–450.
Combes, Pierre-Philippe and Miren Lafourcade. 2005. Transport costs: Measures, determinants,and regional policy implications for France. Journal of Economic Geography 5(3):319–349.
Couture, Victor, Gilles Duranton, and Matthew A. Turner. 2012. Speed. Processed, University ofToronto.
Cronon, William. 1991. Nature’s Metropolis: Chicago and the Great West. New York: W. W. Norton &Co.
Disdier, Anne-Célia and Keith Head. 2008. The puzzling persistence of the distance effect onbilateral trade. Review of Economics and Statistics 90(1):37–48.
Djankov, Simeon, Caroline Freund, and Cong S. Pham. 2010. Trading on time. Review of Economicsand Statistics 92(1):193–204.
Donaldson, David. 2012. Railroads of the Raj: Estimating the impact of transportation infrastruc-ture. Processed, mit.
Duranton, Gilles. 2007. Urban evolutions: The fast, the slow, and the still. American EconomicReview 97(1):197–221.
44

Duranton, Gilles and Diego Puga. 2000. Diversity and specialisation in cities: Why, where andwhen does it matter? Urban Studies 37(3):533–555.
Duranton, Gilles and Matthew A. Turner. 2011. The fundamental law of road congestion: Evidencefrom US cities. American Economic Review 101(6):2616–2652.
Duranton, Gilles and Matthew A. Turner. 2012. Urban growth and transportation. Review ofEconomic Studies 79(4):1407–1440.
Eaton, Jonathan and Samuel Kortum. 2002. Technology, geography, and trade. Econometrica70(5):1741–1780.
Evans, Carolyn and James Harrigan. 2005. Distance, time, and specialization: Lean retailing ingeneral equilibrium. American Economic Review 95(1):292–313.
Fernald, John G. 1999. Roads to prosperity? Assessing the link between public capital andproductivity. American Economic Review 89(3):619–638.
Feyrer, James. 2009. Distance, trade, and income — The 1967 to 1975 closing of the suez canal as anatural experiment. Processed, Darthmouth College.
Fishlow, Albert. 1965. American Railroads and the Transformation of the Ante-Bellum Economy. Cam-bridge (ma): Harvard University Press.
Fogel, Robert. 1964. Railroads and American Economic Growth: Essays in Econometric History. Balti-more (md): Johns Hopkins University Press.
Glaeser, Edward L. and Joshua D. Gottlieb. 2009. The wealth of cities: Agglomeration economiesand spatial equilibrium in the United States. Journal of Economic Literature 47(4):983–1028.
Glaeser, Edward L. and Janet E. Kohlhase. 2003. Cities, regions and the decline of transport costs.Papers in Regional Science 83(1):197–228.
Gray, Charles P. c. 1898. Gray’s New Trunk Railway Map of the United States, Dom. of Canada andPortion of Mexico. Compiled from latest official sources, showing carefully selected list of cities & townsin readable type for quick reference. New York, NY. Library of congress catalogue # G3701.P3 1898
G7 RR 67.
Harrigan, James. 2010. Airplanes and comparative advantage. Journal of International Economics82(2):181–194.
Hummels, David. 2001. Time as a trade barrier. Processed, Purdue University.
Hummels, David. 2007. Transportation costs and international trade in the second era of global-ization. Journal of Economic Perspectives 21(3):131–154.
Limão, Nuno and Anthony J. Venables. 2001. Infrastructure, geographical disadvantage, transportcosts and trade. World Bank Economic Review 15(3):451–479.
Mertz, W. Lee. Undated. Origins of the Interstate. Processed, Federal Highway Administration(United States Department of Transportation).
Mertz, W. Lee and Joyce Ritter. Undated. Building the Interstate. Processed, Federal HighwayAdministration (United States Department of Transportation).
Michaels, Guy. 2008. The effect of trade on the demand for skill - Evidence from the InterstateHighway System. Review of Economics and Statistics 90(4):683–701.
45

Redding, Stephen and Anthony J. Venables. 2004. Economic geography and international inequal-ity. Journal of International Economics 62(1):63–82.
Simon, Curtis J. 2004. Industrial reallocation across US cities, 1977-1997. Journal of Urban Economics56(1):119–143.
Stock, James H. and Motohiro Yogo. 2005. Testing for weak instruments in linear IV regression.In Donald W.K. Andrews and James H. Stock (eds.) Identification and Inference for EconometricModels: Essays in Honor of Thomas Rothenberg. Cambridge: Cambridge University Press, 80–108.
United States Bureau of Statistics. 1899. Statistical abstract of the United States: Twenty-First Number1898. Washington, dc: us Government printing office.
United States Bureau of the Census. 2011. Statistical abstract of the United States 2011. Washington,dc: us Government printing office.
United States Bureau of Transportation Statistics. 2010. Transportation. 2007 Commodity Flow Survey.Washington, dc: us Government printing office.
United States Department of Transportation, Federal Highway Administration. 2005. hpms FieldManual. Washington, dc.
United States Federal Works Agency, Public Roads Administration. 1947. Press release.
United States Geological Survey. 1970. The National Atlas of the United States of America. Washington,dc.
United States House of Representatives. 1947. A Report on the National Interregional HighwayCommittee, Outlining and Recommending a National System of Interregional Highways. Washington,dc: us Government printing office.
46

Appendix A. Data
Definition of the cfs regions: In the cfs, there are 174 areas within the United States. Dropping50 aggregate states, the District of Columbia, 49 “remainder” regions, and Honolulu leaves 73
areas. Restricting attention to cfs regions with at least one non-zero realization of the instrumentalvariables leaves us with a sample of 66 cfs areas. See United States Bureau of TransportationStatistics (2010) for details about the cfs.
Road infrastructure: We rely on three distinct data sources to describe the road network. Tocalculate the number of kilometers of interstate highway in each cfs region we use the us HighwayPerformance and Monitoring System (hpms) “Universe” data for 1987, 1997, and 2007. These dataare described in United States Department of Transportation, Federal Highway Administration(2005) and Duranton and Turner (2011). hpms data are not available prior to 1983. To calculate thenumber of kilometers of interstate highway in each cfs region in earlier years, we rely on ‘pr511’data obtained from Nathaniel Baum-Snow. These are administrative data collected in the course ofconstructing the interstate highway system. They record the length of interstate highway sectionsin each county annually from 1957 to 1993. We make use of the years 1957, 1967, 1977, and 1987.Details about these data are available in Baum-Snow (2007).The hpms and pr511 are tabular data sets and so do not provide information about network config-uration. To calculate network distance between cfs centers and our radial road index, we rely onthe 2005 National Highway Performance Network (nhpn) map of the interstate highway system.This map contains the necessary network information to allow the calculation of pairwise networkdistances and also allows us to calculate our radial road index. We note that this map is notavailable for 2007. This map is available for download from the Federal Highway Administrationat http://www.fhwa.dot.gov/planning/processes/tools/nhpn/.
To calculate interstate highway distances between cities we first identify the centroid of eachcfs region. To do this, we find the area weighted centroid of the urbanized portions of each countycomprising the cfs. We then calculate the centroid of the cfs city as the employment weightedaverage of the centroids of the component counties. In this calculation we rely on census shapefilesdescribing county and urbanized area boundaries in 2000. Next, we calculate the pairwise distancebetween cfs cities as the interstate highway network distance between centroids, relying on themap of the interstate highway system contained in the nhpn map of the us road network for 2005.We note that the algorithm we use to find pairwise distances includes the minimum distance froma centroid to the interstate highway network as part of the bilateral travel distance. With very fewexceptions the centroids of cfs cities are within a few kilometers of an interstate highway.
An analogous procedure allows us to find distances between cities along the 1947 highway plan,along 1898 railroad routes, and along both of our maps of modern railroad networks.
Contemporary Rail infrastructure: We rely on two maps to describe the modern railroad net-work. The first is the 2004 railroad map from the North American Atlas. This is a joint pub-lication of the us, Canadian and Mexican Geological services, and describes rail links betweenmajor cities or rail lines servicing resource extraction. This map is available for download at:http://nationalatlas.gov/atlasftp.html. Our second map of railroad networks is from the
47

us National Atlas and provides a much more detailed description of us railroads. In particular, itdoes not restrict attention to lines linking major cities but includes many smaller lines and evencommuter rail lines. This second map results from a compilation of several railroads maps bythe usgs, all of them circa 2004. These usgs railroad maps are also available for download at:http://nationalatlas.gov/atlasftp.html. These two maps form the basis for our calculationof the kilometers of railroad track within each cfs region, for our calculation of the rail networkdistance between cfs centroids, and for our index of radial rail capacity.
Employment data: We use the County Business Patterns (cbp) to construct a panel of employmentdata by county and industry for the years, 1956, 1970, 1977, 1987, 1997 and 2007. To reducemeasurement error, our ‘1970’ cbp data is based on the county level mean of 1970 and 1971 cbp,our ‘1977’ cbp data is based on the county level mean of 1976 and 1977, our ‘1987’ data is based onthe mean of 1987 and 1988, our ‘1997’ data on the mean of 1996 and 1997, and our ‘2007’ data onthe mean of 2006 and 2007. Our 1956 data is based only on 1956 cbp
Organizing these employment data into a panel consistent with our data for roads presentsseveral challenges. First, county business patterns are organized by contemporaneous counties.Thus, aggregating these data to constant boundary 2007 cfs regions requires that we track all ofchanges in county boundaries.
Second, our cfs data is organized on the basis of 22 cfs industrial classification codes. Countybusiness patterns, however, is organized by different versions of sic and naics classifications indifferent years. We reconcile these various classification systems into classifications consistent withthe 2007 cfs. Our choice of pairs of cbp years, e.g., ‘1970’ is 1970 and 1971 but ‘1977’ is 1976 and1977, is driven by efforts to keep industrial classification systems constant within pairs.
The various years of cbp data area available in different formats and from differentsources. Data are available in electronic form from the census for the years 1986-2010 fromthe us census at http://www.census.gov/econ/cbp/download/index.htm. Data are avail-able in electronic form from the University of Virginia library for the years 1977-2001 athttp://fisher.lib.virginia.edu/collections/stats/cbp/, although only at the level of twodigit classification. Data are available in electronic form from the National Archives as far back as1970 and can be accessed through this link http://www.census.gov/econ/cbp/historical.htm.cbp data does not appear to be available in electronic form prior to 1970. Our 1956 cbp datais digitized from ‘microprint’ images of the original hardcopy, available from the University ofToronto library. Because of the difficulty of this process, our 1956 cross-section of cbp data is basedon just a single year’s survey.
Since cfs cities are defined as aggregations of counties, these data allow us to construct mea-sures of aggregate employment for 1956, 1970, 1977, 1987, 1997, and 2007. To our knowledge, this isthe first time that such a long panel of county-sector level employment data has been constructed.
Population and demographics: We use decennial censuses from 1920, 1950, and 2000. 1920 is earliestyear for which we can construct population numbers for the whole country on the basis of the1999 county boundaries that form the basis for cfs regions. To measure cfs socio-demographicswe use aggregated county level data from the 2000 us census. These data record a wide variety ofcharacteristics such as educational attainment, income, etc.
48

Appendix B. Theory
Derivation of the importer effect
We can use equations (7), (10) and (11) to write,
δMj = (σ− 1)(log Pj − log τj) + log(Nj Wj) . (b1)
From equation (b1), a city’s propensity to import depends on its price index Pj, the cost of entry,τj, and its total income Nj Wj. From equations (7), (10), and (11), we can also write,
e δXi +(1−σ) log τij =
∫ 1
0
(τk
i τij Wi
Ai
)1−σ
dk . (b2)
Summing both sides of (b2) across all cities i; using equations (5), (6), and (10) again; and takinglogs yields
MAMj ≡ log
I
∑i=1
e δXi +(1−σ) log τij di = (1− σ)(log Pj − log τj). (b3)
Following Redding and Venables (2004), the term on the left-hand-side can be naturally interpretedas an import market access. Next, we can insert (b3) into (b1) to obtain
δMj = log(Nj Wj)−MAM
j . (b4)
This expression is interesting because it shows that city j’s propensity to import, δMj , depends only
on its income, Nj Wj, and its import market access, MAMj , which in turn depends on the distance to
other cities and the propensity to export of the latter. Roads in city j do not appear directly in thisexpression. As a result, regardless of how much of a shipment disappears when entering city j, thevalue of this shipment when it leaves exporting city i is not directly affected. There is nonethelessan indirect effect. Roads in j will affect imports through their effect on the income of that city andthrough its propensity to export. To see this, we can use equation (b5) into (b4) to eliminate city j’swage and obtain equation (15) in the main text.
Proof of comparative statics results
cs1. We can insert equation (6) into (4) and use the fact that the cost of distance τij between any twocities i and j is the same for all sectors by equation (10) to show that the ratio of exports betweenany two sectors Xk′
ij /Xkij does not depend on τij. Hence the composition of trade between i and j is
not affected by τij.
cs2. This follows directly from equation (12).
cs3. The fact that exports in value should increase with within-city roads conditionally on marketpotential is again obvious from equation (12). This results also holds unconditionally. To see this,we can set the numéraire to be Wi and focus on equation (7). By equation (10) an increase in τij
has direct negative effect on Xij. It can only lead to an increase in Xij if the general equilibriumterm Pσ−1
j NjWj increases so much as to more than offset the direct effect of the increase in pricesthrough τij. This would then imply an increase in the imports of city j from all other cities. As
49

shown by the equation (b5) below, this increase in imports in j should increase the wages of allother cities. In turn, this increase in wages should increase the demand for the goods produced bycity i. Such an increase would violate the labour market clearing condition in this city. Hence, thedirect negative effect of an increase in τij on Xij must dominate the indirect general equilibriumeffects.
cs4. Given that trade in value is balanced, this result follows directly from cs3.
cs5. This result follows directly from equation (19).
cs6. To demonstrate this result, we first introduce a number of notations. Let ρXR = ∂ log Xi/∂ log Ri
denote the elasticity of the value of exports with respect to city roads, ρWR = ∂ log Wi/∂ log Ri the
elasticity of wages with respect to city roads, and ρQ,kR = ∂ log Qk
i /∂ log Ri the elasticity of outputin sector k with respect to city roads.
Then, note that the aggregate value of goods from city i is Xi = Wi Ni. Constant populationthen implies ρX
R = ρWR . Inserting equation (10) into (9) and rearranging yields,
Wi =
[Aσ−1
iNi
[∫ 1
0
(τk
i
)1−σdk] [ I
∑j=1
Pσ−1j
(τij τj)σ−1 Wj Nj
]]1/σ
. (b5)
Using this equation to compute ρWR we have,
ρXR = ρW
R =1− σ
σ
∫ 10 ρτ,k
R (τki )
1−σdk∫ 10 (τ
ki )
1−σdk. (b6)
Together with our assumptions that σ > 1 and ρτ,kR < 0 for all k, equation (b6) implies that the
aggregate value of a city’s exports increase with its roads. Thus, ρXR > 0.
Next, we insert equation (1) into (8) to obtain an expression for output in sector k and city i, Qki .
Differentiating this expression with respect to Ri, using (10), and rearranging leads to,
ρQ,kR = (1− σ) ρτ,k
R − σ ρWR . (b7)
Because ρWR > 0 and ρτ,k
R < 0, the sign of ρQ,kR is ambiguous. However, total output in city i is given
by Qi =∫ 1
0 Qki dk = AiNi and is therefore constant. This implies that not all sectors can contract
or expand with city roads. Since k ranks sectors by both weight and by ρτ,kR , it follows that output
contracts in sectors producing light goods and expands in sectors producing heavy goods.Finally, because sectors producing heavy goods expand and sectors producing light goods
contract while total quantities produced remains constant, it follows that the weight of goods froma city increases as roads in that city increase.
Worker mobility
We now explore the effect of worker mobility on our estimation strategy. First, from (4) individualconsumption in city i of the variety from sector k and city i is
qkji =
Pσ−1i
(Pkji)
σWi . (b8)
50

Inserting this expression into the utility function (2) and making use of equation (5) implies thefollowing indirect utility: Ui = Wi/Pi. Then, worker mobility implies that in equilibrium utilityin city i must be equal to the common utility achieved in the other cities. Taking logs, this implieslog Ui = log Wi − log Pi = u. Combining this expression with (b3) leads to
log(Wi) = u + log τi −MAM
iσ− 1
. (b9)
After using equation (b9) into the first part of equation (12) we write the propensity to exportvalue under perfect labor mobility as,
δXi = u + log τi + log Ni −MAX
i −MAM
iσ− 1
, (b10)
where MAMi is an import market access term defined in Appendix B and u is the log of the reserva-
tion level of utility for mobile workers. A comparison with equation (12) shows immediately thatthe exporter effect under full labor mobility does not contain any productivity term but adds animport market access term. The coefficient on population and export market access also changesslightly. In addition, the transportation term directly measures the effect of city roads on the costof exiting a city. In the same spirit, we can also express cities’ propensity to export weight underperfect labor mobility as
δTi =
σ
σ− 1u + ST
2 (Ri) +σ
σ− 1log Ni −
σ
σ− 1MAX
i −σ
(σ− 1)2 MAMi , (b11)
where ST2 (Ri) = ST(Ri) +
σσ−1 (log τi − S(Ri)). It is easy to see that labor mobility has very similar
effects on the propensity to import value and weight.
Appendix C. Other first stage and second-step results
Table 14: First-stage results, OLS for log highway km
(1) (2) (3) (4) (5) (6) (7) (8)
log 1947 highway km 0.67∗∗∗ 0.55∗∗∗ 0.63∗∗∗ 0.58∗∗∗ 0.64∗∗∗
(0.084) (0.074) (0.070) (0.059) (0.057)log 1898 railroad km 0.17∗∗∗ 0.050 0.019 0.35∗∗∗ 0.39∗∗∗
(0.062) (0.045) (0.049) (0.053) (0.061)log 1528 explorations 0.12∗∗∗ 0.100∗∗∗ 0.095∗∗∗ 0.20∗∗∗ 0.23∗∗∗
(0.034) (0.019) (0.019) (0.033) (0.047)log employment 0.19 0.23 0.21 0.078 0.23 0.14 0.24
(0.18) (0.19) (0.19) (0.25) (0.19) (0.29) (0.37)Controls N Y Y Y Y Y Y Y
R2 0.86 0.94 0.92 0.94 0.84 0.92 0.77 0.76
Notes: 66 observations per column. The dependent variable is log 2005 highway kilometers. All regressionsinclude a constant. The controls are log 2007 employment, export market access, log population for 1920,1950, 2000, and log share of 2003 manufacturing employment. Robust standard errors in parentheses. ∗∗∗,∗∗, ∗: significant at 1%, 5%, 10%.
51
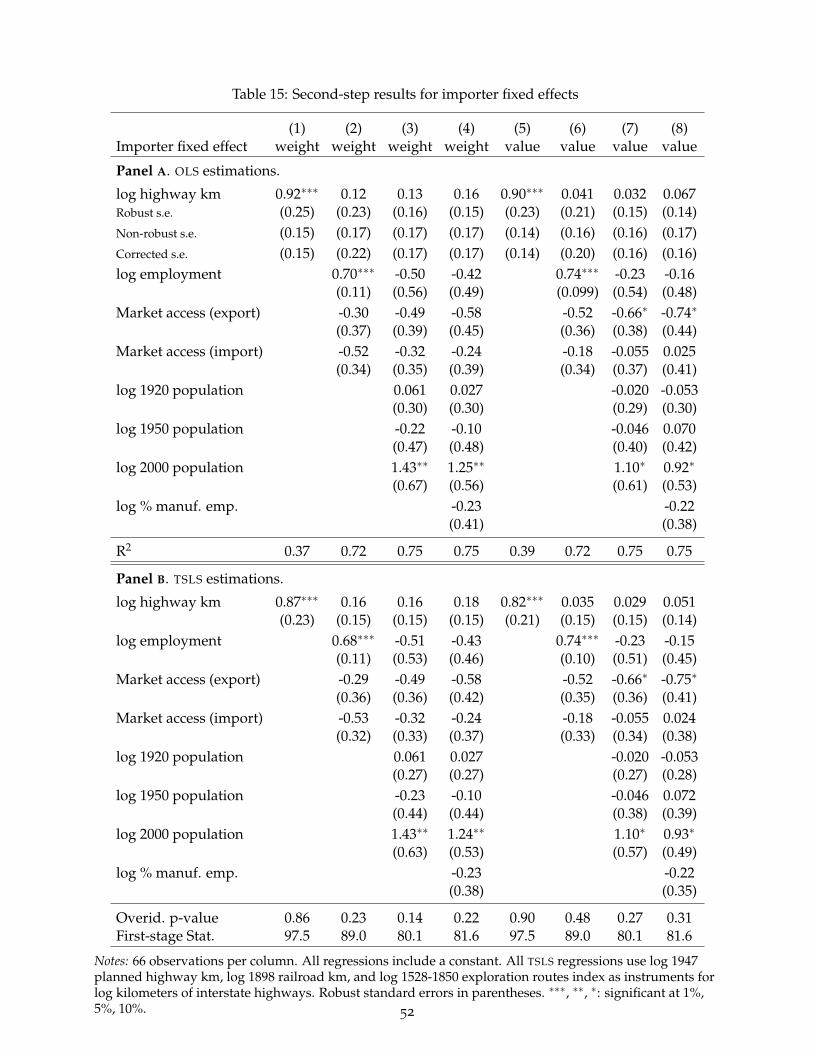
Table 15: Second-step results for importer fixed effects
(1) (2) (3) (4) (5) (6) (7) (8)Importer fixed effect weight weight weight weight value value value value
Panel A. OLS estimations.
log highway km 0.92∗∗∗ 0.12 0.13 0.16 0.90∗∗∗ 0.041 0.032 0.067Robust s.e. (0.25) (0.23) (0.16) (0.15) (0.23) (0.21) (0.15) (0.14)Non-robust s.e. (0.15) (0.17) (0.17) (0.17) (0.14) (0.16) (0.16) (0.17)Corrected s.e. (0.15) (0.22) (0.17) (0.17) (0.14) (0.20) (0.16) (0.16)log employment 0.70∗∗∗ -0.50 -0.42 0.74∗∗∗ -0.23 -0.16
(0.11) (0.56) (0.49) (0.099) (0.54) (0.48)Market access (export) -0.30 -0.49 -0.58 -0.52 -0.66∗ -0.74∗
(0.37) (0.39) (0.45) (0.36) (0.38) (0.44)Market access (import) -0.52 -0.32 -0.24 -0.18 -0.055 0.025
(0.34) (0.35) (0.39) (0.34) (0.37) (0.41)log 1920 population 0.061 0.027 -0.020 -0.053
(0.30) (0.30) (0.29) (0.30)log 1950 population -0.22 -0.10 -0.046 0.070
(0.47) (0.48) (0.40) (0.42)log 2000 population 1.43∗∗ 1.25∗∗ 1.10∗ 0.92∗
(0.67) (0.56) (0.61) (0.53)log % manuf. emp. -0.23 -0.22
(0.41) (0.38)
R2 0.37 0.72 0.75 0.75 0.39 0.72 0.75 0.75
Panel B. TSLS estimations.
log highway km 0.87∗∗∗ 0.16 0.16 0.18 0.82∗∗∗ 0.035 0.029 0.051(0.23) (0.15) (0.15) (0.15) (0.21) (0.15) (0.15) (0.14)
log employment 0.68∗∗∗ -0.51 -0.43 0.74∗∗∗ -0.23 -0.15(0.11) (0.53) (0.46) (0.10) (0.51) (0.45)
Market access (export) -0.29 -0.49 -0.58 -0.52 -0.66∗ -0.75∗
(0.36) (0.36) (0.42) (0.35) (0.36) (0.41)Market access (import) -0.53 -0.32 -0.24 -0.18 -0.055 0.024
(0.32) (0.33) (0.37) (0.33) (0.34) (0.38)log 1920 population 0.061 0.027 -0.020 -0.053
(0.27) (0.27) (0.27) (0.28)log 1950 population -0.23 -0.10 -0.046 0.072
(0.44) (0.44) (0.38) (0.39)log 2000 population 1.43∗∗ 1.24∗∗ 1.10∗ 0.93∗
(0.63) (0.53) (0.57) (0.49)log % manuf. emp. -0.23 -0.22
(0.38) (0.35)
Overid. p-value 0.86 0.23 0.14 0.22 0.90 0.48 0.27 0.31First-stage Stat. 97.5 89.0 80.1 81.6 97.5 89.0 80.1 81.6
Notes: 66 observations per column. All regressions include a constant. All TSLS regressions use log 1947planned highway km, log 1898 railroad km, and log 1528-1850 exploration routes index as instruments forlog kilometers of interstate highways. Robust standard errors in parentheses. ∗∗∗, ∗∗, ∗: significant at 1%,5%, 10%. 52

Table 16: Results for one-step estimations
(1) (2) (3) (4) (5) (6) (7) (8)Bilateral trade flows weight weight weight weight value value value value
Panel A. OLS estimations.
log highway km 1.10∗∗∗ 0.43∗∗∗ 0.31∗∗ 0.21 1.18∗∗∗ 0.18 0.091 -0.030for exporter (0.13) (0.15) (0.13) (0.14) (0.13) (0.15) (0.14) (0.12)
log highway km 0.83∗∗∗ 0.091 0.054 0.13 0.84∗∗∗ 0.064 0.019 0.052for importer (0.23) (0.15) (0.14) (0.13) (0.19) (0.13) (0.12) (0.11)
log employment 0.64∗∗∗ -0.66 -0.51 0.69∗∗∗ -0.36 -0.27for exporter (0.10) (0.35) (0.32) (0.10) (0.48) (0.37)
log employment 0.51∗∗∗ 0.64∗∗∗ -0.69 0.58∗∗∗ 0.69∗∗∗ -0.38for importer (0.12) (0.61) (0.47) (0.11) (0.52) (0.45)
Market access -0.47∗∗∗ -0.82∗∗∗ -0.75∗∗∗ -0.12 -0.38∗ -0.28∗
for exporter (0.16) (0.21) (0.19) (0.15) (0.20) (0.17)Market access -1.12∗∗∗ -1.12∗∗∗ -1.17∗∗∗ -0.89∗∗∗ -0.98∗∗∗ -1.02∗∗∗
for importer (0.19) (0.19) (0.22) (0.17) (0.17) (0.20)log populations 20, 50, 00 N N Y Y N N Y Ylog % manuf. emp. N N N Y N N N Y
R2 0.70 0.77 0.78 0.80 0.59 0.71 0.72 0.75
Panel B. TSLS estimations.
log highway km 1.08∗∗∗ 0.51∗∗∗ 0.41∗∗∗ 0.35∗∗∗ 1.04∗∗∗ 0.17 0.095 0.026for exporter (0.13) (0.14) (0.13) (0.12) (0.15) (0.15) (0.14) (0.11)
log highway km 0.81∗∗∗ 0.13 0.092 0.14 0.78∗∗∗ 0.058 0.020 0.034for importer (0.21) (0.14) (0.14) (0.15) (0.17) (0.13) (0.13) (0.13)
log employment 0.56∗∗∗ 0.47 0.35 0.89∗∗∗ 0.96∗∗ 0.72∗
for exporter (0.095) (0.36) (0.33) (0.096) (0.48) (0.38)log employment 0.62∗∗∗ -0.67 -0.50 0.69∗∗∗ -0.36 -0.26
for importer (0.13) (0.61) (0.46) (0.12) (0.52) (0.45)Market access -0.46∗∗∗ -0.79∗∗∗ -0.72∗∗∗ -0.13 -0.38∗ -0.26
for exporter (0.16) (0.21) (0.19) (0.15) (0.21) (0.16)Market access -1.11∗∗∗ -1.15∗∗∗ -1.22∗∗∗ -0.89∗∗∗ -0.98∗∗∗ -1.02∗∗∗
for importer (0.19) (0.19) (0.21) (0.16) (0.17) (0.20)log populations 20, 50, 00 N N Y Y N N Y Ylog % manuf. emp. N N N Y N N N Y
Overid. p-value 0.24 0.11 0.23 0.37 . 0.18 0.39 .First-stage Stat. 69.3 47.6 58.6 55.8 70.3 45.4 44.1 53.1
Notes: 2,476 observation for columns 1 to 4 and 2,705 for columns 5 to 8. All regressions include a constantand quartic function of 2005 highway distance between i and j. Columns 3-4 and 7-8 include logpopulation in 1920, 1950, and 2000 for both exporters and importers. Columns 4 and 8 include log of 2003manufacturing employment for both exporters and importers. In panel B, we use (same city) log 1947planned highway km, log 1898 railroad km, and log 1528-1850 exploration routes index as instruments forlog kilometers of interstate highways for both the importer and exporter cities. Robust standard errors inparentheses. ∗∗∗, ∗∗, ∗: significant at 1%, 5%, 10%. In some cases, the overidentification statistics is notproduced because the estimated covariance matrix of moment conditions is not of full rank due to aninsufficient number of clusters using the procedure of Cameron et al. (2010).
53


