MARKETVIEW
Figure 1: Development Pipeline and Net Absorption
Robust absorption pushes
market toward equilibrium
Houston Multifamily, Q4 2017
Q4 2017 CBRE Research © 2018 CBRE, Inc. | 1
*Arrows indicate trend from previous quarter.
89.4% $1.15 PSF 9,010 Units 9,751 Units 2,499 Units
DECADE-HIGH NET ABSORPTION PUSHES RATES
AND OCCUPANCY HIGHER
FALLING CONSTRUCTION WILL CONSTRAIN
SUPPLY IN THE NEAR-TERM
Source: CBRE Research, Apartment Data Services, Q4 2017.
0
5
10
15
20
25
2011 2012 2013 2014 2015 2016 2017
Units (000)
Deliveries Absorptions
MARKETVIEW
Q4 2017 CBRE Research © 2018 CBRE, Inc. | 2
Source: CBRE Research, Apartment Data Services, Q4 2017.
Figure 2: Key Indicators
HOUSTON MULTIFAMILY
Submarket Property CountUnit
CountRental Rate ($/SF/Mth)
Occupancy Rate (%)
Net Absorption Units
Under Constructio
n Units
Delivered Construction
Units
Proposed Construction
Units
CENTRAL Montrose/ Museum/ Midtown 50 12,501 1.83 90.0 396 1,771 0 3,122
Highland Village/ Upper Kirby/ West U 63 16,619 1.76 91.2 343 0 199 598
Med Center/ Braes Bayou 79 23,361 1.46 88.2 173 652 270 0
Heights/ Washington Ave 46 10,625 1.71 90.7 595 931 0 1,423
Downtown 23 5,951 2.05 67.1 281 220 886 1,800
TOTALS 261 69,057 1.76 85.4 1,788 3,574 1,355 6,943
SOUTHWEST Galleria/Uptown 102 24,306 1.45 88.2 489 281 357 356
Woodlake/ Westheimer 37 12,233 1.12 90.7 331 0 0 0
Energy Corridor/CityCentre/Briar Forest 100 31,554 1.25 86.7 470 1,383 0 920
Westchase 50 14,922 1.16 91.6 361 0 0 0
Alief 110 26,897 0.98 92.5 315 0 0 0
Sharpstown/ Westwood 106 25,538 0.88 91.5 157 0 0 0
Westpark/Bissonnet 57 16,900 0.91 91.6 (234) 0 0 0
Braeswood/ Fondren SW 82 21,786 0.92 87.7 (11) 0 0 0
Almeda/ South Main 26 4,770 1.01 88.1 99 0 0 0
Sugar Land/Stafford/Sienna 51 12,896 1.24 90.0 136 0 132 417
Richmond/ Rosenberg 29 4,766 1.11 92.0 (12) 0 0 0
TOTALS 750 196,568 1.09 90.1 2,101 1,664 489 1,693
NORTHWEST Brookhollow/Northwest Crossing 90 19,711 1.01 90.7 237 293 121 0
Memorial/Spring Branch 108 21,771 1.02 92.6 143 133 0 758
Inwood/ Highway 249 31 5,828 0.89 95.7 74 0 0 0
Willowbrook/Champions/Ella 157 38,963 1.02 90.4 458 0 0 0
Jersey Village/Cypress 62 15,281 1.08 92.8 254 0 0 443
Bear Creek/Copperfield/Fairfield 59 16,240 1.16 90.7 403 0 0 0
Katy/Cinco Ranch/Waterside 90 24,753 1.24 88.0 351 713 0 1,326
Tomball/ Spring 55 12,959 1.21 84.2 385 292 150 701
Woodlands/ Conroe South 67 19,364 1.22 89.7 239 340 0 900
Conroe North/Montgomery 47 8,649 1.00 86.5 159 0 0 680
TOTALS 766 183,519 1.09 90.1 2,703 1,771 271 4,808
NORTHEAST I-10 East/ Woodforest/ Channelview 57 11,651 1.02 81.7 191 546 0 0
I-69 North 27 3,605 0.91 94.8 46 350 0 0
Northline 47 6,294 0.90 91.2 (44) 154 0 0
Greenspoint/Northborough/Aldine 67 17,349 0.89 84.2 586 0 0 0
FM 1960 East/ IAH Airport 46 8,778 0.97 95.0 96 0 0 0
Lake Houston/ Kingwood 49 12,674 1.18 85.7 160 320 0 1,100
Northeast Houston/Crosby 21 3,278 0.88 81.7 16 0 0 0
TOTALS 314 63,629 0.96 87.8 1,051 1,370 0 1,100
SOUTHEAST Hwy 288 South/ Pearland West 46 11,844 1.17 86.4 168 571 0 400
U of H/I-45 South 107 17,554 0.91 89.2 113 0 0 191
Beltway 8/I-45 South 47 13,204 1.00 90.6 146 0 0 0
Pasadena/Deer Park/La Porte 120 23,205 0.97 91.0 281 135 0 0
Friendswood/ Pearland East 28 5,458 1.15 93.6 13 108 0 126
Clear Lake/Webster/League City 95 24,030 1.21 91.8 289 558 0 0
Baytown 54 10,056 1.04 87.3 198 0 384 480
Dickinson/Galveston 74 11,330 1.04 91.8 60 0 0 0
Alvin/Angleton/Lake Jackson 66 10,525 1.06 85.6 99 0 0 0
TOTALS 637 127,206 1.06 89.7 1,367 1,372 384 1,197
HOUSTON TOTALS 2,728 639,979 1.15 88.6 9,010 9,751 2,499 15,741
MARKETVIEW HOUSTON MULTIFAMILY
Q4 2017 CBRE Research © 2018 CBRE, Inc. | 3
Figure 3: Deliveries and Occupancy
Source: CBRE Research, Apartment Data Services, Q4 2017.
Source: CBRE Research, Real Capital Analytics, Q4 2017.
Figure 4: Sales By total ($)
82
83
84
85
86
87
88
89
90
91
92
0
1
2
3
4
5
6
7
8
Q2'10 Q4'10 Q2'11 Q4'11 Q2'12 Q4'12 Q2'13 Q4'13 Q2'14 Q4'14 Q2'15 Q4'15 Q2'16 Q4'16 Q2'17 Q4'17
(%)Units (000s)
Deliveries Occupancy
0
1
2
3
4
5
6
7
Q1 '13 Q2 '13 Q3 '13 Q4 '13 Q1 '14 Q2 '14 Q3 '14 Q4 '14 Q1 '15 Q2 '15 Q3 '15 Q4 '15 Q1 '16 Q2 '16 Q3 '16 Q4 '16 Q1 '17 Q2 '17 Q3 '17 Q4 '17
Billions ($)
Quarterly Vol Rolling 12-mo. Total
MARKETVIEW
Disclaimer: Information contained herein, including projections, has been obtained from sources believed to be reliable. While we do not doubt its accuracy, we have not verified it and make no guarantee, warranty or representation about it. It is your responsibility to confirm independently its accuracy and completeness. This information is presented exclusively for use by CBRE clients and professionals and all rights to the material are reserved and cannot be reproduced without prior written permission of CBRE.
CONTACTS
CBRE OFFICES
CENTRAL SOUTHWEST NORTHWEST NORTHEAST SOUTHEAST
C1 Montrose/Museum/Midtown SW1 Galleria/Uptown NW1 Brookhollow/Northwest Crossing NE1 I-10 East/Woodforest/Channelview SE1 Hwy 288 South/ Pearland West
C2 Highland Village/Upper Kirby/West U SW2 Woodlake/Westheimer NW2 Memorial/Spring Branch NE2 I-69 North SE2 U of H/I-45 South
C3 Med Center/Braes Bayou SW3 Energy Corridor/CityCentre/Briar Forest NW3 Inwood/Highway 249 NE3 Northline SE3 Beltway 8/I-45 South
C4 Heights/Washington Ave SW4 Westchase NW4 Willowbrook/Champions/Ella NE4 Greenspoint/Northborough/Aldine SE4 Pasadena/Deer Park/La Porte
C5 Downtown SW5 Alief NW5 Jersey Village/Cypress NE5 FM 1960 East/IAH Airport SE5 Friendswood/Pearland East
SW6 Sharpstown/Westwood NW6 Bear Creek/Copperfield/Fairfield NE6 Lake Houston/Kingwood SE6 Clear Lake/Webster/League City
SW7 Westpark/Bissonnet NW7 Katy/Cinco Ranch/Waterside NE7 Northeast Houston/Crosby SE7 Baytown
SW8 Braeswood/Fondren SW NW8 Tomball/Spring SE8 Dickinson/Galveston
SW9 Almeda/South Main NW9 Woodlands/Conroe South SE9 Alvin/Angleton/Lake Jackson
SW10 Sugar Land/Stafford/Sienna NW10 Conroe North/Montgomery
SW11 Richmond/Rosenberg
HOUSTON MULTIFAMILY
MARKETVIEW
Figure 1: Occupancy and Rental Rates Spike in Respond to Hurricane
Dramatic apartment demand swing in post-Harvey Houston
Houston Multifamily, Q3 2017
Q3 2017 CBRE Research © 2017 CBRE, Inc. | 1
*Arrows indicate trend from previous quarter.
Total Occupancy
88.3%Avg. Rental Rate
$1.13 PSFNet Absorption
(4,170) UnitsCompletionsUnder Construction
12,105 Units 2,487 Units
Throughout the first half of the year, the
multifamily market experienced improving leasing
activity and dwindling concessions. While other
commercial sectors saw minimal impact from
Hurricane Harvey, damage to multifamily units and
demand from the single-family market has thrust
Houston into a landlord market 18 months earlier
than anticipated.
Approximately 15,600 units within 215 properties
reported damage, according to a survey completed
by Apartment Data Services. When these properties
were removed from operating inventory, the
occupancy rate spiked to 90.2%, up from 88.9% at
the beginning of August. Additionally, year-to-date
net absorption through Q3 2017 stood at more than
22,000 units when excluding damaged properties
from operating inventory. Responding to the
heightened demand, effective rents climbed 1.5%
in a single month as apartment operators ended
hefty concessions and lease-up specials. It is
important to note, Figure 2 includes down units in
the inventory resulting in negative absorption and a
significant drop in occupancy.
LASTING DEMAND WILL SUPPORT MARKET FOR 36 MONTHS
Although some renters will return to their homes in
the next six to nine months, demand from recovery
efforts and new permanent renters will
complement organic growth, which was already
forecasted to pick up in 2019.
Source: CBRE Research, Apartment Data Services, Q3 2017.*Damaged units are removed from operating inventory reflecting increase in occupancy.
1.08
1.09
1.10
1.11
1.12
1.13
1.14
87.0
87.5
88.0
88.5
89.0
89.5
90.0
90.5
91.0
Oct-1
5
Nov-1
5
Dec-1
5
Jan-
16
Feb-
16
Mar-1
6
Apr-1
6
May-1
6
Jun-
16
Jul-1
6
Aug-
16
Sep-
16
Oct-1
6
Nov-1
6
Dec-1
6
Jan-
17
Feb-
17
Mar-1
7
Apr-1
7
May-1
7
Jun-
17
Jul-1
7
Aug-
17
Sep-
17
$%
Occupancy Effective Rental Rate*
MARKETVIEW
Q3 2017 CBRE Research © 2017 CBRE, Inc. | 2
Figure 2: Key Indicators
HOUSTON MULTIFAMILY
SubmarketProperty
CountUnit Count
Rental Rate ($/SF/Mth)
Occupancy Rate (%)
Net Absorption
Units
Under Construction
Units
Delivered Construction
Units
Proposed Construction
Units
CENTRAL Montrose/ Museum/ Midtown 50 12,501 1.82 86.7 559 1,771 0 3,122
Highland Village/ Upper Kirby/ West U 63 16,619 1.75 89.2 520 199 0 598
Med Center/ Braes Bayou 79 23,361 1.44 85.7 119 922 281 0
Heights/ Washington Ave 46 10,625 1.72 89.0 (146) 435 0 1,919
Downtown 23 5,951 2.03 62.3 266 1,106 274 1,800
TOTALS 261 69,057 1.75 82.6 1,318 4,433 555 7,439
SOUTHWEST Galleria/Uptown 102 24,306 1.42 86.1 179 638 246 356
Woodlake/ Westheimer 37 12,233 1.16 88.0 39 0 0 0
Energy Corridor/CityCentre/Briar Forest 99 31,175 1.20 87.4 (1,120) 1,762 0 920
Westchase 50 14,922 1.13 88.7 115 0 0 0
Alief 110 26,897 0.96 91.4 (20) 0 0 0
Sharpstown/ Westwood 106 25,538 0.87 90.9 (44) 0 0 0
Westpark/Bissonnet 57 16,900 0.91 92.9 (72) 0 0 0
Braeswood/ Fondren SW 82 21,786 0.91 87.8 (625) 0 0 0
Almeda/ South Main 25 4,646 0.99 86.7 (183) 124 0 0
Sugar Land/Stafford/Sienna 51 12,896 1.24 88.9 162 0 483 417
Richmond/ Rosenberg 29 4,766 1.09 92.3 (11) 0 0 0
TOTALS 748 196,065 1.08 89.2 (1,580) 2,524 729 1,693
NORTHWEST Brookhollow/Northwest Crossing 90 19,712 1.00 90.0 (206) 121 0 330
Memorial/Spring Branch 107 21,642 1.01 92.5 205 133 0 608
Inwood/ Highway 249 31 5,828 0.85 94.5 (31) 0 0 0
Willowbrook/Champions/Ella 158 39,001 1.00 89.3 (368) 0 0 0
Jersey Village/Cypress 61 15,131 1.06 91.4 (227) 0 0 443
Bear Creek/Copperfield/Fairfield 59 16,240 1.12 88.1 (8) 0 0 0
Katy/Cinco Ranch/Waterside 90 24,753 1.23 86.2 (222) 207 0 2,039
Tomball/ Spring 53 12,566 1.20 82.5 478 788 408 701
Woodlands/ Conroe South 66 18,983 1.17 90.1 20 724 170 900
Conroe North/Montgomery 47 8,649 1.00 84.6 255 0 222 680
TOTALS 762 182,505 1.06 88.9 (104) 1,973 800 5,701
NORTHEAST I-10 East/ Woodforest/ Channelview 56 11,353 1.00 82.5 (857) 546 0 0
I-69 North 27 3,605 0.89 93.6 (2) 350 0 0
Northline 47 6,294 0.90 91.8 (98) 154 0 0
Greenspoint/Northborough/Aldine 67 17,120 0.88 80.5 (1,081) 0 0 0
FM 1960 East/ IAH Airport 46 8,778 0.96 93.8 (42) 0 0 0
Lake Houston/ Kingwood 48 12,356 1.14 86.2 (288) 300 0 1,100
Northeast Houston/Crosby 21 3,278 0.88 83.3 (312) 0 0 0
TOTALS 312 62,784 0.95 87.4 (2,680) 1,350 0 1,100
SOUTHEAST Hwy 288 South/ Pearland West 45 11,599 1.15 86.6 (61) 400 0 400
U of H/I-45 South 105 17,257 0.89 88.4 (316) 240 0 191
Beltway 8/I-45 South 47 13,204 1.00 89.6 (149) 0 200 0
Pasadena/Deer Park/La Porte 120 23,205 0.97 89.6 (395) 135 0 0
Friendswood/ Pearland East 28 5,458 1.15 93.3 (10) 108 0 126
Clear Lake/Webster/League City 95 24,032 1.18 90.8 (90) 558 203 0
Baytown 53 9,678 1.00 88.6 (227) 384 0 480
Dickinson/Galveston 74 11,330 1.03 91.3 88 0 0 0
Alvin/Angleton/Lake Jackson 66 10,525 1.08 84.8 36 0 0 0
TOTALS 633 126,288 1.05 89.2 (1,124) 1,825 403 1,197
HOUSTON TOTALS 2,716 636,699 1.13 88.3 (4,170) 12,105 2,487 17,130
Source: CBRE Research, Apartment Data Services, Q3 2017.Damaged units are not removed from inventory and contribute to negative absorption.
MARKETVIEW
ESTIMATED DAMAGED UNITS
• 15,662 units reported damage—40% were Class B
• 2 properties totaling 309 units will likely be condemned and removed permanently from stock
HEAVILY IMPACTED SUBMARKETS
Energy Corridor/CityCentre/Briar Forest | 2,743 units
Greenspoint/Northborough/Aldine | 1,696 units
Katy/Cinco Ranch/Waterside | 1,379 units
Braeswood/Fondren SW | 1,110 units
HOUSTON MULTIFAMILY
Q3 2017 CBRE Research © 2017 CBRE, Inc. | 3
Figure 4: Development Pipeline and Forecasted Absorption Trend
Source: CBRE Research, Apartment Data Services, Q3 2017.
0
5
10
15
20
25
2008 2009 2010 2011 2012 2013 2014 2015 2016 2017 2018 2019
Units (000s)
Deliveries Projected Deliveries Net Absorption
Source: CBRE Research, Apartment Data Services, Q3 2017.
Figure 3: Post-Harvey Key Takeaways
DEMAND RESPONSE
• 10,926 units absorbed since Hurricane Harvey
• More than 22,000 units absorbed year-to-date
FUNDAMENTALS SHIFT POST-HARVEY
• Occupancy at 90.2% when damaged units are removed from operating inventory
• Effective rent increased by $15 per month
• Effective rental rate increased 1.7 cents per sq. ft.
MARKETVIEW
Disclaimer: Information contained herein, including projections, has been obtained from sources believed to be reliable. While we do not doubt its accuracy, we have not verified it and make no guarantee, warranty or representation about it. It is your responsibility to confirm independently its accuracy and completeness. This information is presented exclusively for use by CBRE clients and professionals and all rights to the material are reserved and cannot be reproduced without prior written permission of CBRE.
CONTACTS
Robert C. Kramp
Director, Research & Analysis–
Texas-Oklahoma Division
+1 713 5771715
E. Michelle Miller
Research Operations Manager–
Texas-Oklahoma Division
+1 214 9796584
CBRE OFFICES
CBRE Houston
2800 Post Oak Blvd, Suite 2300
Houston, TX 77056
To learn more about CBRE Research,
or to access additional research
reports, please visit the Global
Research Gateway at
www.cbre.com/researchgateway.
CENTRAL SOUTHWEST NORTHWEST NORTHEAST SOUTHEAST
C1 Montrose/Museum/Midtown SW1 Galleria/Uptown NW1 Brookhollow/Northwest Crossing NE1 I-10 East/Woodforest/Channelview SE1 Hwy 288 South/ Pearland West
C2 Highland Village/Upper Kirby/West U SW2 Woodlake/Westheimer NW2 Memorial/Spring Branch NE2 I-69 North SE2 U of H/I-45 South
C3 Med Center/Braes Bayou SW3 Energy Corridor/CityCentre/Briar Forest NW3 Inwood/Highway 249 NE3 Northline SE3 Beltway 8/I-45 South
C4 Heights/Washington Ave SW4 Westchase NW4 Willowbrook/Champions/Ella NE4 Greenspoint/Northborough/Aldine SE4 Pasadena/Deer Park/La Porte
C5 Downtown SW5 Alief NW5 Jersey Village/Cypress NE5 FM 1960 East/IAH Airport SE5 Friendswood/Pearland East
SW6 Sharpstown/Westwood NW6 Bear Creek/Copperfield/Fairfield NE6 Lake Houston/Kingwood SE6 Clear Lake/Webster/League City
SW7 Westpark/Bissonnet NW7 Katy/Cinco Ranch/Waterside NE7 Northeast Houston/Crosby SE7 Baytown
SW8 Braeswood/Fondren SW NW8 Tomball/Spring SE8 Dickinson/Galveston
SW9 Almeda/South Main NW9 Woodlands/Conroe South SE9 Alvin/Angleton/Lake Jackson
SW10 Sugar Land/Stafford/Sienna NW10 Conroe North/Montgomery
SW11 Richmond/Rosenberg
HOUSTON MULTIFAMILY
MARKETVIEW
Figure 1: Development Pipeline and Occupancy
Absorption rallies as deliveries
continue to decline
Houston Multifamily, Q2 2017
Q2 2017 CBRE Research © 2017 CBRE, Inc. | 1
*Arrows indicate trend from previous quarter.
Occupancy
88.9%Avg. Rental Rate
$1.11 PSFNet Absorption
6,773 UnitsCompletionsUnder Construction
11,054 Units 4,493 Units
NET ABSORPTION RATES RISE ACROSS THE
MARKET
Houston is showing signs that its new supply surge
is burning off. Recent data show occupancy has
risen by 60 basis points to 88.9% and deliveries
have dropped by 1,182 units. The completion of
4,493 units in the Q2 2017 is the fewest units
delivered since the beginning of 2016. Further
balancing the scale, net absorption increased 38%
since the Q1 2017. Houston absorbed 6,773 units—
the most since the Q2 2013. Incentives have
boosted the allure of the new product as 5,320 out
of the 6,773 units absorbed were within the Class A
category.
Construction is slowing in Houston with 3,000
fewer units under construction this quarter in
comparison from the start of the year.
Although nearly 8,000 units are projected to be
delivered for the second half of 2017, absorption
rates are forecast to be more than 22,000 units
during 2018 and 2019.
Along with having the highest net absorption, the
Northwest cluster also holds the three top demand
submarkets: Woodlands/Conroe South,
Tomball/Spring, and Katy/Cinco Ranch/Waterside,
for a combined absorption of 1,861 units.
Additional strong markets include Energy
Corridor/City Centre/Briar in Southwest Houston
and Montrose/Museum/Midtown which is
centrally located.
In the longer view, by 2020, Houston is forecasted
to multiply by over 200,000 payrolls and with these
additions, multifamily demand will quickly fill the
recent expansion cycle that started in 2014.
Source: CBRE Research, Apartment Data Services, Q2 2017.
80
82
84
86
88
90
92
0
1
2
3
4
5
6
Q2 2009 Q2 2010 Q2 2011 Q2 2012 Q2 2013 Q2 2014 Q2 2015 Q2 2016 Q2 2017
Deliveries Occupancy
000’s Units %
MARKETVIEW
Q2 2017 CBRE Research © 2017 CBRE, Inc. | 2
Source: CBRE Research, Apartment Data Services, Q2 2017.
Figure 2: Key Indicators
HOUSTON MULTIFAMILY
SubmarketProperty
CountUnit
CountRental Rate ($/SF/Mth)
Occupancy Rate (%)
Net Absorption
Units
Under Construction
Units
Delivered Construction
Units
Proposed Construction
Units
CENTRAL
Montrose/ Museum/ Midtown 51 12,702 1.79 80.4 434 1,513 365 3,380
Highland Village/ Upper Kirby/ West U 61 16,213 1.67 85.5 412 199 297 598
Med Center/ Braes Bayou 77 22,813 1.41 87.2 165 1,202 659 Heights/ Washington Ave 48 11,030 1.68 88.9 398 435 1,919 Downtown 21 5,448 2.06 63.2 267 1,120 242 1,800
TOTALS 258 68,206 1.72 81.0 1,676 4,469 1,563 7,949 SOUTHWEST
Galleria/Uptown 100 23,613 1.36 85.4 231 1,266 277 356 Woodlake/ Westheimer 37 12,235 1.14 87.6 58
Energy Corridor/CityCentre/Briar Forest 104 32,688 1.17 86.6 492 242 640 920
Westchase 50 14,922 1.11 87.9 35 266Alief 110 26,894 0.95 91.5 37Sharpstown/ Westwood 106 25,538 0.88 91.0 -4Westpark/Bissonnet 57 16,900 0.89 93.4 -157Braeswood/ Fondren SW 82 21,787 0.90 90.7 76Almeda/ South Main 24 4,422 1.00 90.6 53 124 Sugar Land/Stafford/Sienna 48 12,217 1.22 88.6 72 483 200 273 Richmond/ Rosenberg 29 4,766 1.07 92.4 25
TOTALS 747 195,982 1.06 89.6 918 2,115 1,383 1,549 NORTHWEST
Brookhollow/Northwest Crossing 89 19,593 0.99 91.1 149 121 330 Memorial/Spring Branch 108 21,714 1.00 91.6 100 133 608 Inwood/ Highway 249 32 5,854 0.85 95.3 70Willowbrook/Champions/Ella 158 39,013 0.99 90.3 213Jersey Village/Cypress 61 15,131 1.05 92.9 25 443 Bear Creek/Copperfield/Fairfield 59 16,216 1.13 88.0 145Katy/Cinco Ranch/Waterside 89 24,487 1.16 87.1 580 207 300 2,039 Tomball/ Spring 52 12,426 1.15 78.0 599 946 354 1,051 Woodlands/ Conroe South 65 18,815 1.16 89.9 682 170 900 Conroe North/Montgomery 44 8,032 0.98 81.5 208 222 396 680
TOTALS 757 181,281 1.05 88.6 2,771 1,629 1,220 6,051 NORTHEAST
I-10 East/ Woodforest/ Channelview 56 11,353 0.99 90.0 70 246 300 I-69 North 27 3,646 0.89 93.3 48 350 Northline 47 6,290 0.87 93.4 57Greenspoint/Northborough/Aldine 67 16,853 0.87 86.3 279FM 1960 East/ IAH Airport 45 8,681 0.95 94.3 73Lake Houston/ Kingwood 47 12,031 1.12 88.6 266 604 550 Northeast Houston/Crosby 21 3,278 0.87 92.9 -12
TOTALS 310 62,132 0.94 91.3 781 954 246 850 SOUTHEAST
Hwy 288 South/ Pearland West 45 11,599 1.12 87.2 280 540 400 U of H/I-45 South 105 17,199 0.90 89.6 -316 191 Beltway 8/I-45 South 46 13,004 0.97 90.8 58 200 Pasadena/Deer Park/La Porte 118 22,839 0.96 92.1 276 294 Friendswood/ Pearland East 28 5,458 1.13 93.5 -26 108 126 Clear Lake/Webster/League City 95 23,868 1.16 91.1 161 410 350 Baytown 53 9,678 1.01 90.9 12 384 480 Dickinson/Galveston 74 11,330 1.02 90.5 73Alvin/Angleton/Lake Jackson 66 10,533 1.06 84.6 109
TOTALS 630 125,508 1.04 90.0 627 1,936 0 1,547
HOUSTON TOTALS 2,702 633,109 1.11 88.9 6,773 11,054 4,493 17,694
MARKETVIEW HOUSTON MULTIFAMILY
Q2 2017 CBRE Research © 2017 CBRE, Inc. | 3
Figure 3: Deliveries and Absorption
Source: CBRE Research, Apartment Data Services, Q2 2017.
Name Address Units Submarket
1 Westchase Ranch Resort 2101 Hayes Rd 776 Westchase
2 City West 2828 Hayes Rd 510 Westchase
3 Modera at Spring Town Center Kuykendahl 396 Tomball/Spring
4 Watermark at Walker Commons 2205 W Walker St 368 Clear Lake/Webster/League City
5 Mason Park 222 Mason Creek Dr 312 Katy/Cinco Ranch/Waterside
6 SYNC at Harmony 3530 Discovery Creek Blvd 308 Woodlands/Conroe South
7 Residences at Cinco Ranch 20900 Farm to Market 1093 300 Katy/Cinco Ranch/Waterside
8 La Esencia 300 N Vista Dr 296 Willowbrook/Champions/Ella
9 Pine Forest 406 Deats Rd 286 Dickinson/Galveston
10 Westborough Crossing 2031 Westborough Crossing 274 Katy/Cinco Ranch/Waterside
Source: CBRE Research, Real Capital Analytics, Q2 2017.
Figure 4: Top Sales Transactions
0
5
10
15
20
25
2008 2009 2010 2011 2012 2013 2014 2015 2016 2017 2018 2019
Units (000s)
Projected Deliveries Deliveries Net Absorption
MARKETVIEW
Disclaimer: Information contained herein, including projections, has been obtained from sources believed to be reliable. While we do not doubt its accuracy, we have not verified it and make no guarantee, warranty or representation about it. It is your responsibility to confirm independently its accuracy and completeness. This information is presented exclusively for use by CBRE clients and professionals and all rights to the material are reserved and cannot be reproduced without prior written permission of CBRE.
CONTACTS
Robert C. Kramp
Director, Research & Analysis–
Texas-Oklahoma Division
+1 713 5771715
E. Michelle Miller
Research Operations Manager–
Texas-Oklahoma Division
+1 214 9796584
Albert J. Spiers
Researcher
+1 713 5771717
CBRE OFFICES
CBRE Houston
2800 Post Oak Blvd, Suite 2300
Houston, TX 77056
To learn more about CBRE Research,
or to access additional research
reports, please visit the Global
Research Gateway at
www.cbre.com/researchgateway.
CENTRAL SOUTHWEST NORTHWEST NORTHEAST SOUTHEAST
C1 Montrose/Museum/Midtown SW1 Galleria/Uptown NW1 Brookhollow/Northwest Crossing NE1 I-10 East/Woodforest/Channelview SE1 Hwy 288 South/ Pearland West
C2 Highland Village/Upper Kirby/West U SW2 Woodlake/Westheimer NW2 Memorial/Spring Branch NE2 I-69 North SE2 U of H/I-45 South
C3 Med Center/Braes Bayou SW3 Energy Corridor/CityCentre/Briar Forest NW3 Inwood/Highway 249 NE3 Northline SE3 Beltway 8/I-45 South
C4 Heights/Washington Ave SW4 Westchase NW4 Willowbrook/Champions/Ella NE4 Greenspoint/Northborough/Aldine SE4 Pasadena/Deer Park/La Porte
C5 Downtown SW5 Alief NW5 Jersey Village/Cypress NE5 FM 1960 East/IAH Airport SE5 Friendswood/Pearland East
SW6 Sharpstown/Westwood NW6 Bear Creek/Copperfield/Fairfield NE6 Lake Houston/Kingwood SE6 Clear Lake/Webster/League City
SW7 Westpark/Bissonnet NW7 Katy/Cinco Ranch/Waterside NE7 Northeast Houston/Crosby SE7 Baytown
SW8 Braeswood/Fondren SW NW8 Tomball/Spring SE8 Dickinson/Galveston
SW9 Almeda/South Main NW9 Woodlands/Conroe South SE9 Alvin/Angleton/Lake Jackson
SW10 Sugar Land/Stafford/Sienna NW10 Conroe North/Montgomery
SW11 Richmond/Rosenberg
HOUSTON MULTIFAMILY
MARKETVIEW
Figure 1: Development Pipeline and Net Absorption
Emptying pipeline leads to improved net absorption rates
Houston Multifamily, Q1 2017
Q1 2017 CBRE Research © 2017 CBRE, Inc. | 1
*Arrows indicate trend from previous quarter.
Total Occupancy
88.3%Avg. Rental Rate
$1.11 PSFNet Absorption
4,916 UnitsCompletionsUnder Construction
14,451 Units 5,675 Units
NET ABSORPTION RATES DOUBLE YEAR-OVER-
YEAR
Improving metrics indicate the Houston
multifamily market is stabilizing. As new units were
leased in Q1 2017, occupancy decreased slightly
from 88.5% in Q4 2016. Year-over-year Q1 2017 net
absorption rates are nearly double demand levels
from this time last year. Net absorption increased
from 3,545 units in Q4 2016 to 4,916 units in Q1
2017.
Houston delivered 5,765 units in Q1 2017 with the
Central cluster adding 2,120 units, leading all other
submarkets in completion activity. Central also had
the heaviest development pipeline with 5,937 units
under construction. Due to increasing inventory,
occupancy in Central Houston dropped 80 basis
points from 79.1% to 78.3%. Central had the
strongest demand in the city following the
Northwest, absorbing 1,247 units in Q1 2017.
Within the individual submarkets, the Energy
Corridor/CityCentre/Briar Forest submarket had
the highest demand with 502 units absorbed,
mostly in Class A product. In the Tomball/Spring
submarket, Class A properties saw the second
highest net absorption at 438 units.
Owners continue to utilize aggressive concessions
to gain a competitive edge and fill their
apartments. Most developments are continuing to
offer an average of three months free rent.
Houston’s new class of “Prime Class A”
apartments are differentiating themselves through
lavish amenities that are successfully attracting
new residents in addition to free rent incentives.
Source: CBRE Research, Apartment Data Services, Q1 2017.
0
5
10
15
20
25
2008 2009 2010 2011 2012 2013 2014 2015 2016 2017
Units (000s)
Projected Deliveries Deliveries Net Absorption
MARKETVIEW
Q1 2017 CBRE Research © 2017 CBRE, Inc. | 2
Source: CBRE Research, Apartment Data Services, Q1 2017.
Figure 2: Key Indicators
HOUSTON MULTIFAMILY
SubmarketProperty
CountUnit
CountRental Rate ($/SF/Mth)
Occupancy Rate (%)
Net Absorption
Units
Under Construction
Units
Delivered Construction
Units
Proposed Construction
Units
CENTRALMontrose/ Museum/ Midtown 52 12,736 1.74 77.0 268 1,779 859 3,313
Highland Village/ Upper Kirby/ West U 61 16,213 1.66 85.6 76 500 719
Med Center/ Braes Bayou 77 22,813 1.40 86.5 305 1,861 256 Heights/ Washington Ave 48 11,030 1.67 84.1 319 435 2,136 Downtown 21 5,448 2.07 58.5 279 1,362 286 1,500
TOTALS 259 68,240 1.71 78.3 1,247 5,937 2,120 6,949 SOUTHWEST
Galleria/Uptown 100 23,613 1.36 86.6 80 1,267 277 356 Woodlake/ Westheimer 37 12,235 1.16 87.2 130 387 Energy Corridor/CityCentre/Briar Forest 104 32,688 1.19 85.1 502 882 230 920 Westchase 50 14,922 1.13 87.7 3 266 Alief 110 26,894 0.95 91.4 25Sharpstown/ Westwood 106 25,538 0.87 91.0 -80Westpark/Bissonnet 57 16,900 0.91 94.3 -13Braeswood/ Fondren SW 82 21,787 0.91 90.4 132Almeda/ South Main 24 4,422 0.99 88.9 -1 124 Sugar Land/Stafford/Sienna 48 12,217 1.20 91.9 133 551 273 Richmond/ Rosenberg 29 4,766 1.07 91.9 53
TOTALS 747 195,982 1.07 89.7 964 3,090 894 1,549 NORTHWEST
Brookhollow/Northwest Crossing 89 19,593 0.97 90.8 136 120 330 Memorial/Spring Branch 108 21,714 1.00 91.4 17 133 608 Inwood/ Highway 249 32 5,854 0.85 94.2 -7Willowbrook/Champions/Ella 158 39,013 0.98 89.7 35Jersey Village/Cypress 61 15,131 1.05 92.8 124 152 443 Bear Creek/Copperfield/Fairfield 59 16,216 1.11 86.8 268 417 Katy/Cinco Ranch/Waterside 89 24,487 1.17 85.5 492 753 746 2,039 Tomball/ Spring 52 12,426 1.14 74.0 474 946 1,051 Woodlands/ Conroe South 65 18,815 1.16 87.5 454 900 Conroe North/Montgomery 44 8,032 0.98 85.1 21 619 168 520
TOTALS 757 181,281 1.04 87.8 2,014 2,723 1,331 5,891 NORTHEAST
I-10 East/ Woodforest/ Channelview 56 11,353 0.97 89.5 -39 246 300 I-69 North 27 3,646 0.88 91.8 -20 350 Northline 47 6,290 0.87 92.7 11Greenspoint/Northborough/Aldine 67 16,853 0.86 88.1 -75FM 1960 East/ IAH Airport 45 8,681 0.93 94.0 47Lake Houston/ Kingwood 47 12,031 1.10 88.8 110 627 250 Northeast Houston/Crosby 21 3,278 0.86 93.1 -42
TOTALS 310 62,132 0.92 91.1 -8 1,223 0 550 SOUTHEAST
Hwy 288 South/ Pearland West 45 11,599 1.14 84.7 57 540 550 400 U of H/I-45 South 105 17,199 0.90 91.5 332 191 Beltway 8/I-45 South 46 13,004 0.97 91.7 -31 152 Pasadena/Deer Park/La Porte 118 22,839 0.94 90.8 260 294 Friendswood/ Pearland East 28 5,458 1.12 94.0 25 108 126 Clear Lake/Webster/League City 95 23,868 1.15 90.6 144 550 557 Baytown 53 9,678 1.00 90.7 -56 384 480 Dickinson/Galveston 74 11,330 1.01 89.7 -78 230 Alvin/Angleton/Lake Jackson 66 10,533 1.04 83.5 46
TOTALS 630 125,508 1.03 89.7 699 1,478 1,330 1,754 HOUSTON TOTALS 2,703 633,143 1.11 88.3 4,916 14,451 5,675 16,693
MARKETVIEW HOUSTON MULTIFAMILY
Q1 2017 CBRE Research © 2017 CBRE, Inc. | 3
Figure 3: Expected Deliveries by Quarter
Source: CBRE Research, Apartment Data Services, Q1 2017.
5,675
8,729
2,376
1,0071,234
537281
640
0
2,000
4,000
6,000
8,000
10,000
Q1 2017 Q2 2017 Q3 2017 Q4 2017 Q1 2018 Q2 2018 Q3 2018 Q4 2018
Units
Name Address Units Submarket
1 Connection at Buffalo Pointe 10201 Buffalo Speedway 352 Med Center/Braes Bayou
2 Vista at Grand Crossing 302 Cobia Dr 351 Katy/Cinco Ranch/Waterside
3 Broadstone Grand Parkway 1111 Falcon Dr 342 Katy/Cinco Ranch/Waterside
4 North Park Crossing 310 Parramatta Ln 336 Willowbrook/Champions/Ella
5 Oak Forest 1370 Afton St 321 Memorial/Spring Branch
6 Equinox 2950 Old Spanish Trl 304 Med Center/Braes Bayou
7 Normandy Woods 695 Normandy St 268 I-10 East/Woodforest/Channelview
8 Hollister Place Apartments 6565 Hollister Rd 260 Brookhollow/Northwest Crossing
9 London Park Apartments 14545 Bammel N Houston Rd 257 Willowbrook/Champions/Ella
10 The Meritage 4550 N Braeswood Blvd 240 Med Center/Braes Bayou
Source: CBRE Research, Real Capital Analytics, Q1 2017.
Figure 4: Top Sales Transactions
MARKETVIEW
Disclaimer: Information contained herein, including projections, has been obtained from sources believed to be reliable. While we do not doubt its accuracy, we have not verified it and make no guarantee, warranty or representation about it. It is your responsibility to confirm independently its accuracy and completeness. This information is presented exclusively for use by CBRE clients and professionals and all rights to the material are reserved and cannot be reproduced without prior written permission of CBRE.
CONTACTS
Robert C. Kramp
Director, Research & Analysis–
Texas-Oklahoma Division
+1 713 5771715
E. Michelle Miller
Research Operations Manager–
Texas-Oklahoma Division
+1 214 9796584
Albert J. Spiers
Researcher
+1 713 5771717
CBRE OFFICES
CBRE Houston
2800 Post Oak Blvd, Suite 2300
Houston, TX 77056
To learn more about CBRE Research,
or to access additional research
reports, please visit the Global
Research Gateway at
www.cbre.com/researchgateway.
CENTRAL SOUTHWEST NORTHWEST NORTHEAST SOUTHEAST
C1 Montrose/Museum/Midtown SW1 Galleria/Uptown NW1 Brookhollow/Northwest Crossing NE1 I-10 East/Woodforest/Channelview SE1 Hwy 288 South/ Pearland West
C2 Highland Village/Upper Kirby/West U SW2 Woodlake/Westheimer NW2 Memorial/Spring Branch NE2 I-69 North SE2 U of H/I-45 South
C3 Med Center/Braes Bayou SW3 Energy Corridor/CityCentre/Briar Forest NW3 Inwood/Highway 249 NE3 Northline SE3 Beltway 8/I-45 South
C4 Heights/Washington Ave SW4 Westchase NW4 Willowbrook/Champions/Ella NE4 Greenspoint/Northborough/Aldine SE4 Pasadena/Deer Park/La Porte
C5 Downtown SW5 Alief NW5 Jersey Village/Cypress NE5 FM 1960 East/IAH Airport SE5 Friendswood/Pearland East
SW6 Sharpstown/Westwood NW6 Bear Creek/Copperfield/Fairfield NE6 Lake Houston/Kingwood SE6 Clear Lake/Webster/League City
SW7 Westpark/Bissonnet NW7 Katy/Cinco Ranch/Waterside NE7 Northeast Houston/Crosby SE7 Baytown
SW8 Braeswood/Fondren SW NW8 Tomball/Spring SE8 Dickinson/Galveston
SW9 Almeda/South Main NW9 Woodlands/Conroe South SE9 Alvin/Angleton/Lake Jackson
SW10 Sugar Land/Stafford/Sienna NW10 Conroe North/Montgomery
SW11 Richmond/Rosenberg
HOUSTON MULTIFAMILY
MARKETVIEW
Figure 1: Development Pipeline and Occupancy
Historic deliveries blanket the market
Houston Multifamily, Q4 2016
Q4 2016 CBRE Research © 2017 CBRE, Inc. | 1
*Arrows indicate change from previous quarter.
Total Occupancy
88.5%Avg. Rental Rate
$1.10 PSFNet Absorption
(3,545) UnitsCompletionsUnder Construction
15,713 Units 5,350 Units
TYPICAL SEASONAL TRENDS RESULT IN
DROPPING NET ABSORPTION
Slowing employment and net migrations,
combined with a lengthy, active construction cycle
have led to weakening multifamily demand
throughout the year. Although the fourth quarter
typically sees lower than average demand, Q4 2016
registered the most negative net absorption since
2006. The year closed with negative 2,960 units
absorbed. The only market to see a decline yet still
maintain positive net absorption was the Central
Houston cluster which slid to 269 units absorbed.
The most negative net absorption was in the
Southeast cluster at negative 1,248 units and the
individual submarket with the most negative net
absorption was Willowbrook/Champion/Fairfield at
negative 598 units.
Development continued to soar through the end
of 2016, topping out at 22,549 units delivered,
which is the most units deliveries in a single year
on record for the Houston Market. The fourth
quarter of 2016 also had the highest amount of
deliveries compared to any other fourth quarter.
With the abundance of new development,
occupancy levels decreased slightly due to the
concentrated supply in several submarkets.
Looking forward, Houston has 15,713 additional
units under construction that will deliver
throughout 2017 and 2018. The first quarter of
2017 is set to deliver 7,353 units followed by 2,282
units in Q2 2017. The second half of the year will
finally see a sharp drop in delivered construction.
The supply imbalance should level out towards
the end of 2017 just as demand begins to
increase.
Source: CBRE Research, CBRE Econometric Advisors Q4 2016.
82
84
86
88
90
92
94
96
0
5
10
15
20
25
2008 2009 2010 2011 2012 2013 2014 2015 2016 2017 2018
Occupancy (%)000’s Units
Projected Deliveries Deliveries Occupancy
MARKETVIEW
Q4 2016 CBRE Research © 2017 CBRE, Inc. | 2
Source: CBRE Research, Apartment Data Services, Q4 2016.
Figure 2: Key Indicators
HOUSTON MULTIFAMILY
SubmarketProperty
CountUnit
CountRental Rate ($/SF/Mth)
Occupancy Rate (%)
Net Absorption
Units
Under Construction
Units
Delivered Construction
Units
Proposed Construction
Units
CENTRALMontrose/ Museum/ Midtown 49 11,901 1.75 80.1 (74) 1,800 662 3,273 Highland Village/ Upper Kirby/ West U 61 16,206 1.69 85.2 106 500 270 598
Med Center/ Braes Bayou 74 21,813 1.37 89.0 (47) 2,117 301 0
Heights/ Washington Ave 48 11,030 1.69 81.0 68 435 378 1,538 Downtown 19 4,819 1.97 60.3 216 1,122 611 1,500
TOTALS 251 65,769 1.69 79.1 269 5,974 2,222 6,909 SOUTHWEST
Galleria/Uptown 99 23,369 1.36 87.2 (127) 986 388 0 Woodlake/ Westheimer 37 12,235 1.12 85.9 142 0 387 0
Energy Corridor/CityCentre/Briar Forest 102 31,848 1.16 86.0 353 1,126 280 1,170
Westchase 49 14,653 1.15 89.1 (153) 266 0 Alief 110 26,895 0.94 91.2 (430) 0 0 Sharpstown/ Westwood 106 25,538 0.86 91.5 (292) 0 0 Westpark/Bissonnet 57 16,900 0.90 93.4 (158) 0 0 Braeswood/ Fondren SW 83 21,907 0.89 89.8 (164) 0 0 Almeda/ South Main 24 4,422 0.97 89.3 (113) 124 0 Sugar Land/Stafford/Sienna 48 12,217 1.21 90.9 (175) 0 273 Richmond/ Rosenberg 29 4,766 1.06 90.8 (102) 0 0
TOTALS 744 194,750 1.06 89.6 (1,219) 2,502 1,055 1,443 NORTHWEST
Brookhollow/Northwest Crossing 89 19,593 0.97 90.1 (191) 120 330 Memorial/Spring Branch 107 21,527 0.98 90.9 (184) 0 281 Inwood/ Highway 249 33 6,030 0.83 94.3 4 551 0 Willowbrook/Champions/Ella 158 39,013 0.98 89.6 (598) 0 0 Jersey Village/Cypress 60 14,961 1.03 92.3 (147) 322 443 Bear Creek/Copperfield/Fairfield 57 15,799 1.08 89.9 (198) 417 0 Katy/Cinco Ranch/Waterside 87 23,800 1.15 85.9 296 925 130 2,246 Tomball/ Spring 49 11,468 1.12 76.0 266 1,348 979 1,051 Woodlands/ Conroe South 65 18,815 1.15 85.2 367 0 900 Conroe North/Montgomery 44 8,014 0.99 84.9 (52) 619 472 150
TOTALS 749 179,020 1.03 87.9 (437) 4,302 1,581 5,401 NORTHEAST
I-10 East/ Woodforest/ Channelview 56 11,353 0.97 89.8 (135) 246 300
I-69 North 26 3,503 0.87 92.1 (9) 350 0 Northline 47 6,290 0.86 92.7 1 0 78 0 Greenspoint/Northborough/Aldine 67 16,686 0.86 85.9 (153) 0 0 FM 1960 East/ IAH Airport 45 8,681 0.93 93.5 25 0 0 Lake Houston/ Kingwood 47 12,031 1.13 87.9 (114) 327 250 Northeast Houston/Crosby 21 3,278 0.83 94.4 60 0
TOTALS 309 61,822 0.92 90.9 (325) 923 78 550 SOUTHEAST
Hwy 288 South/ Pearland West 45 11,612 1.15 84.2 25 240 400 U of H/I-45 South 105 17,259 0.89 89.6 (311) 0 222 191 Beltway 8/I-45 South 46 13,004 0.99 92.0 (139) 152 0 Pasadena/Deer Park/La Porte 118 22,838 0.94 89.8 (267) 294 192 0 Friendswood/ Pearland East 28 5,458 1.11 93.7 (60) 0 126 Clear Lake/Webster/League City 94 23,690 1.14 90.9 (117) 203 557 Baytown 53 9,678 1.00 91.3 (41) 384 480 Dickinson/Galveston 73 11,100 0.99 92.3 (181) 230 878 Alvin/Angleton/Lake Jackson 64 10,027 1.03 86.0 (157) 509 0
TOTALS 626 124,666 1.03 90.0 (1,248) 2,012 414 2,632 HOUSTON TOTALS 2,679 626,027 1.10 88.5 (2,960) 15,713 5,350 16,935
MARKETVIEW
CENTRAL HOUSTON REMAINS THE MOST
EXPENSIVE AREA DESPITE RATE REDUCTIONS
For the past two quarters, rental rates have
continued to drop. Q4 2016 overall rental rates
ended the year at $1.10 per sq. ft. Class A properties
saw the most significant drop from $1.52 to $1.49
per sq. ft. year-over-year. The Class B market rental
rates declined by a modest $0.01 per sq. ft., while
the Class C market increased by $0.01 per sq. ft.
year-over-year. Deliveries remain strong, and the
new supply in lease-up is pushing these rental rates
down. Heavy discounts are still available on most
Class A properties, which are offering 1-2 months
free rent on top of reduced rates.
Even with declining rental rates, the Central
Houston submarkets maintained the highest rates
with an average of $1.69 per sq. ft., which dropped
from $1.74 per sq. ft. in Q3 2016 but are still above
the market average of $1.10 per sq. ft
OCCUPANCY CONTINUES DOWNWARD TREND
Across the board, Class A, B, and C properties all
saw a drop in occupancy. Average occupancy
dropped 90 basis points (bps) from 89.4% in Q3
2016. At year-end 2016, market-wide occupancy has
not been this low since 2012. Although still above
90% occupancy, Class B and C properties saw the
largest drop in this metric, at 110 bps and 140 bps,
respectively.
Class A saw a small increase in demand last quarter,
but due to the large amount of deliveries, however,
occupancy dropped in Q4 2016 from 80.1% to
79.6%.
SLOWING DOWN AT THE END OF THE YEAR
Houston finally saw development activity slow in Q4
2016. Although there were 19,509 units under
construction at year-end, it is the lowest amount of
projects underway since 2014 when 24,290 units
were delivered. Additionally, 2016 has 7,000 less
units under construction than Q4 2015.
The wave of construction underway will take time to
deliver and be absorbed. Q4 2016 has the highest
amount of fourth quarter deliveries on record at
5,350 units. With the strong deliveries and
construction activity, occupancy will continue to
struggle in Class A properties and it will take a shift
in demand to see a change in this key indicator.
Q4 2016 CBRE Research © 2017 CBRE, Inc. | 3
Figure 3: Avg. Rental Rate by Class
Figure 4: Avg. Occupancy Rate by Class
Source: CBRE Research, Apartment Data Services, Q4 2016.
Figure 5: Development Activity
Source: CBRE Research, Apartment Data Services, Q4 2016.
0.5
0.7
0.9
1.1
1.3
1.5
Q4 2015 Q1 2016 Q2 2016 Q3 2016 Q4 2016
$/SF
Class A Class B Class C
70
75
80
85
90
95
Q4 2015 Q1 2016 Q2 2016 Q3 2016 Q4 2016
Occupancy (%)
Class A Class B Class C
0
5
10
15
20
25
30
35
2009 2010 2011 2012 2013 2014 2015 2016
Units (000s)
Under Construction Deliveries
HOUSTON MULTIFAMILY
MARKETVIEW
Disclaimer: Information contained herein, including projections, has been obtained from sources believed to be reliable. While we do not doubt its accuracy, we have not verified it and make no guarantee, warranty or representation about it. It is your responsibility to confirm independently its accuracy and completeness. This information is presented exclusively for use by CBRE clients and professionals and all rights to the material are reserved and cannot be reproduced without prior written permission of CBRE.
CONTACTS
Robert C. Kramp
Director, Research & Analysis–
Texas-Oklahoma Division
+1 713 5771715
E. Michelle Miller
Research Operations Manager–
Texas-Oklahoma Division
+1 214 9796584
CBRE OFFICES
CBRE Houston
2800 Post Oak Blvd, Suite 2300
Houston, TX 77056
To learn more about CBRE Research,
or to access additional research
reports, please visit the Global
Research Gateway at
www.cbre.com/researchgateway.
CENTRAL SOUTHWEST NORTHWEST NORTHEAST SOUTHEAST
C1 Montrose/Museum/Midtown SW1 Galleria/Uptown NW1 Brookhollow/Northwest Crossing NE1 I-10 East/Woodforest/Channelview SE1 Hwy 288 South/ Pearland West
C2 Highland Village/Upper Kirby/West U SW2 Woodlake/Westheimer NW2 Memorial/Spring Branch NE2 I-69 North SE2 U of H/I-45 South
C3 Med Center/Braes Bayou SW3 Energy Corridor/CityCentre/Briar Forest NW3 Inwood/Highway 249 NE3 Northline SE3 Beltway 8/I-45 South
C4 Heights/Washington Ave SW4 Westchase NW4 Willowbrook/Champions/Ella NE4 Greenspoint/Northborough/Aldine SE4 Pasadena/Deer Park/La Porte
C5 Downtown SW5 Alief NW5 Jersey Village/Cypress NE5 FM 1960 East/IAH Airport SE5 Friendswood/Pearland East
SW6 Sharpstown/Westwood NW6 Bear Creek/Copperfield/Fairfield NE6 Lake Houston/Kingwood SE6 Clear Lake/Webster/League City
SW7 Westpark/Bissonnet NW7 Katy/Cinco Ranch/Waterside NE7 Northeast Houston/Crosby SE7 Baytown
SW8 Braeswood/Fondren SW NW8 Tomball/Spring SE8 Dickinson/Galveston
SW9 Almeda/South Main NW9 Woodlands/Conroe South SE9 Alvin/Angleton/Lake Jackson
SW10 Sugar Land/Stafford/Sienna NW10 Conroe North/Montgomery
SW11 Richmond/Rosenberg
HOUSTON MULTIFAMILY
MARKETVIEW
Figure 1: Overall Net Absorption and Construction
Central and NW capture bulk of leasing demand
Houston Multifamily, Q3 2016
Q3 2016 CBRE Research © 2016 CBRE, Inc. | 1
*Arrows indicate change from previous quarter.
Total Occupancy
89.4%Avg. Rental Rate
$1.12 PSFNet Absorption
1,947 UnitsCompletionsUnder Construction
17,572 Units 6,859 Units
LEASING CONTINUES TO DECLINE EXCEPT IN
NEW PRODUCT
Demand has struggled to keep up with increasing
supply all year and the trend continues in Q3 2016.
Occupancy dropped slightly and the market
experiences the largest decline in net absorption
since Q4 2015. Historically the second half of the
year sees a significant seasonal drop in leasing, so
an overall decline is not out of the ordinary.
However, the seasonal slowdown combined with a
softer first half of the year will result in lower than
average year end absorption numbers.
Although net absorption has waned throughout
the city, submarkets with the largest concentration
of recent construction are now capturing a large
share of Class A leasing due to pent up demand.
The urban Central submarkets experienced its
best performing quarter with a record net
absorption of 1,170 units in the Med Center/Braes
Bayou, Heights/Washington and Downtown
areas. Additionally in the suburbs, the Northwest
submarket showed signs of healthy demand as
residents absorbed 1,643 units, the highest since
Q1 2015. New product has driven demand in the
Northwest, which delivered the highest number
of units for three consecutive quarters, 9,219
units thus far in 2016.
Although the construction cycle has begun to
slow, there are an additional 6,695 units projected
to be delivered by the end of the year. The supply
imbalance continues to put pressure on
properties in a lease-up as owners attempt to
stabilize occupancy through enticing
concessions. The result is higher demand in Class
A product around the city.
0
5
10
15
20
25
30
2008 2009 2010 2011 2012 2013 2014 2015 2016
Units (000s)
Projected Deliveries Deliveries Net Absorption
Source: CBRE Research, Apartment Data Services, Q3 2016.
MARKETVIEW
Q3 2016 CBRE Research © 2016 CBRE, Inc. | 2
Source: CBRE Research, Apartment Data Services, Q3 2016.
Figure 2: Key Indicators
HOUSTON MULTIFAMILY
SubmarketProperty
CountUnit
CountRental Rate ($/SF/Mth)
Occupancy Rate (%)
Net Absorption
Units
Under Construction
Units
Delivered Construction
Units
Proposed Construction
Units
CENTRALMontrose/ Museum/ Midtown 49 11,901 1.81 80.7 24 1,800 327 3,273Highland Village/ Upper Kirby/ West U 60 15,759 1.73 86.9 227 949 0 598Med Center/ Braes Bayou 74 21,813 1.43 89.2 346 2,117 224 Heights/ Washington Ave 48 11,030 1.75 80.4 349 435 198 664Downtown 18 4,581 2.00 58.4 224 1,678 338 1,186
TOTALS 249 65,084 1.74 79.1 1,170 6,979 1,087 5,721 SOUTHWEST
Galleria/Uptown 98 2,283 1.39 89.4 56 1,376 431 856Woodlake/ Westheimer 36 11,848 1.15 87.6 (72) 387 336 Energy Corridor/CityCentre/Briar Forest 102 31,848 1.18 84.8 330 884 728 1,170Westchase 49 14,653 1.13 90.3 (36) 266 Alief 110 26,895 0.96 92.8 (230)Sharpstown/ Westwood 106 25,538 0.87 92.6 (121)Westpark/Bissonnet 57 16,900 0.90 94.3 11 Braeswood/ Fondren SW 83 21,907 0.90 90.6 (220)Almeda/ South Main 24 4,422 0.98 92.8 50 124 Sugar Land/Stafford/Sienna 48 12,217 1.23 92.4 246 551 273Richmond/ Rosenberg 29 4,766 1.08 93.0 (39)
TOTALS 742 173,277 1.07 91.0 (25) 3,588 1,495 2,299 NORTHWEST
Brookhollow/Northwest Crossing 89 19,593 0.97 91.5 (145) 120 330Memorial/Spring Branch 107 21,527 1.01 91.8 115 281Inwood/ Highway 249 33 6,030 0.82 93.7 (32)Willowbrook/Champions/Ella 158 39,013 1.00 91.2 (185) 250 241 Jersey Village/Cypress 60 14,961 1.06 93.3 3 170 443Bear Creek/Copperfield/Fairfield 56 15,657 1.12 91.1 (22) 417 Katy/Cinco Ranch/Waterside 86 23,688 1.18 84.9 990 1,053 635 2,246Tomball/ Spring 48 11,215 1.15 74.9 437 1,601 748 1,051Woodlands/ Conroe South 65 18,815 1.18 83.0 396 924 900Conroe North/Montgomery 45 8,022 1.00 85.4 86 759 448 150
TOTALS 747 178,521 1.05 88.1 1,643 4,370 2,996 5,401 NORTHEAST
I-10 East/ Woodforest/ Channelview 56 11,353 0.95 91.0 (222) 246 300I-69 North 26 3,503 0.88 92.3 (54) 350 Northline 47 6,290 0.86 92.7 33 Greenspoint/Northborough/Aldine 67 16,694 0.86 87.2 (394)FM 1960 East/ IAH Airport 45 8,681 0.94 93.0 48 Lake Houston/ Kingwood 47 12,031 1.14 88.5 (62) 327 584 Northeast Houston/Crosby 21 3,278 0.82 92.6 (12)
TOTALS 309 61,830 0.92 91.0 (663) 923 584 300 SOUTHEAST
Hwy 288 South/ Pearland West 43 11,062 1.14 88.1 75 329 638U of H/I-45 South 405 17,264 0.89 91.4 (207) 222 191Beltway 8/I-45 South 46 13,004 0.98 93.1 (123)Pasadena/Deer Park/La Porte 118 22,838 0.94 91.0 21 294 192 Friendswood/ Pearland East 28 5,458 1.14 94.8 (55) 126Clear Lake/Webster/League City 93 23,345 1.16 92.8 133 550 557Baytown 53 9,678 1.01 91.8 (34) 283 480Dickinson/Galveston 73 11,100 1.00 94.0 42 230 Alvin/Angleton/Lake Jackson 64 10,027 1.03 87.7 (30) 309
TOTALS 923 123,776 1.03 91.6 (178) 1,712 697 1,992 HOUSTON TOTALS 2,970 602,488 1.12 89.4 1,947 17,572 6,859 15,713
MARKETVIEW
STABLE RATES KEEP CONCESSIONS COMPETITIVE
As owners seek to gain a competitive edge,
aggressive concessions seen in the previous two
quarters continued through Q3 2016. Depending on
the lease term, properties are offering 1-3 months
free rent prorated across the course of a one-year
lease. With generous concessions being offered on
every corner, owners are also seeking to hold on to
their current residents. Typical concessions
available for renewals include $100-$200 off of their
current monthly rent depending on unit size.
Rates metro wide across all classes remained stable
with little changed over the previous quarter. The
Central Houston submarkets maintained the
highest rates with an average of $1.74 per sq. ft.
compared to the market average of $1.10 per sq. ft.
CLASS A SEES UPTICK IN OCCUPANCY
Even though average occupancy for the city dropped
an additional 30 basis points (bps) to 89.4%, Class A
occupancy climbed to 80.1% due to an increase in
four of the five submarkets. Class B did not fare as
well in Q3 2016 as occupancy in this segment
declined in all five metro submarkets, down 180 bps
to 91.3%.
Demand for Class A product grew this quarter, likely
due to seasonal leasing trends. Notable Katy/Cinco
Ranch/Waterside properties absorbed 1,036 units-
the most Class A net absorption in the city.
PERMITTING AT LOWEST LEVEL IN 10 MONTHS
The Houston market experienced the delivery of
6,859 units during Q3 2016. Year-to-date 17,199
units have delivered, surpassing this period in 2015
by more than 3,000 units. At its current pace, 2016
will be another record breaking year for multifamily
construction in Houston as 23,894 units will have
delivered by year-end.
However, the pipeline has begun to shrink as 2,000
fewer units are in the expected delivery pipeline
than in Q2 2016. Multifamily permitting has also
declined significantly, down 63% off its high in Q3
2014.
Q3 2016 CBRE Research © 2016 CBRE, Inc. | 3
Figure 3: Avg. Rental Rate by Class
Figure 4: Avg. Occupancy Rate by Class
Source: CBRE Research, Apartment Data Services, Q3 2016.
Figure 5: Development Activity
Source: CBRE Research, Apartment Data Services, Q3 2016.
0.50
0.70
0.90
1.10
1.30
1.50
Q3 2015 Q4 2015 Q1 2016 Q2 2016 Q3 2016
$/SF
Class A Class B Class C
70
75
80
85
90
95
100
Q3 2015 Q4 2015 Q1 2016 Q2 2016 Q3 2016
Occupancy (%)
Class A Class B Class C
0
5
10
15
20
25
30
35
2009 2010 2011 2012 2013 2014 2015 2016 YTD
Units (000s)
Under Construction Deliveries
HOUSTON MULTIFAMILY
MARKETVIEW
Q3 2016 CBRE Research © 2016 CBRE, Inc. | 4
HOUSTON MULTIFAMILY
Figure 6: Top 10 Key Sales Transactions
0
2
4
6
8
10
2010 2011 2012 2013 2014 2015 2016
Unemployment (%)
U.S. Texas Houston MSA
Figure 7: Unemployment Rates
Source: U.S. Bureau of Labor Statistics, August 2016.
Source: Real Capital Analytics, Q3 2016.
Name Address Units Submarket
1 The Aberdeen 3400 Woodchase Dr 656 Westchase
2 Waterford Place 3125 Crestdale Dr 552 Memorial/Spring Branch
3 The Pointe 4101 S Shaver 517 Pasadena/Deer Park/La Porte
4 Wallingford Apartments 2750 Wallingford 462 Westchase
5 City Station 905 Cypress Station 448 Willowbrook/Champions/Ella
6 Lynn at Country Club 2200 W Baker Rd 432 Baytown
7 Maxey Village 666 Maxey Rd 409 I-10 East/Woodforest/Channelview
8 Foundations at Woodland 541 Farm to Market Rd 1488 384 Woodlands/Conroe South
9 Cole’s Crossing 12500 Barker Cypress 370 Bear Creek/Copperfield/Fairfield
10 The Belvedere At Westchase Apts 10936 Meadowglen Ln 367 Westchase
EMPLOYMENT SLUGGISH DESPITE AUGUST
GAINS
Houston's unemployment rate has risen above
the U.S. average for the first time to 5.8%, 80
bps above the national average. Even with
industries like the Port of Houston being the
second largest in the U.S. by tonnage and the
Texas Medical Center, the combined
employment gains still struggle to make up for
the lost business in oil and gas. August
employment grew by 500 jobs, which although
not robust, indicates energy and professional
and business services sectors are stabilizing.
INVESTMENT SALES MARKET SEES ACTIVE
THIRD QUARTER, BUT DOWN YEAR-TO-DATE
The investment sales market in Houston is
down 29% in total properties sold year-to-date.
However, Q3 2016 was an active quarter with
35% more properties sold compared to Q2
2016. Year-to-date volume totals $2.9 billion,
down 27% from the same period in 2015.
Investors active in the Houston market
continues to be Private buyers as they make up
81% of total acquisitions. REITS and Publicly
Listed Securities made up 7%, institutional
buyers made up 7%, and international buyers
made up 5% of acquisitions in the Houston
market.
MARKETVIEW
Disclaimer: Information contained herein, including projections, has been obtained from sources believed to be reliable. While we do not doubt its accuracy, we have not verified it and make no guarantee, warranty or representation about it. It is your responsibility to confirm independently its accuracy and completeness. This information is presented exclusively for use by CBRE clients and professionals and all rights to the material are reserved and cannot be reproduced without prior written permission of CBRE.
CONTACTS
Robert C. Kramp
Director, Research & Analysis
Texas-Oklahoma Division
E. Michelle Miller
Research Operations Manager
Texas-Oklahoma Division
CBRE OFFICES
CBRE Houston
2800 Post Oak Blvd, Suite 2300
Houston, TX 77056
To learn more about CBRE Research,
or to access additional research
reports, please visit the Global
Research Gateway at
www.cbre.com/researchgateway.
CENTRAL SOUTHWEST NORTHWEST NORTHEAST SOUTHEAST
C1 Montrose/Museum/Midtown SW1 Galleria/Uptown NW1 Brookhollow/Northwest Crossing NE1 I-10 East/Woodforest/Channelview SE1 Hwy 288 South/ Pearland West
C2 Highland Village/Upper Kirby/West U SW2 Woodlake/Westheimer NW2 Memorial/Spring Branch NE2 I-69 North SE2 U of H/I-45 South
C3 Med Center/Braes Bayou SW3 Energy Corridor/CityCentre/Briar Forest NW3 Inwood/Highway 249 NE3 Northline SE3 Beltway 8/I-45 South
C4 Heights/Washington Ave SW4 Westchase NW4 Willowbrook/Champions/Ella NE4 Greenspoint/Northborough/Aldine SE4 Pasadena/Deer Park/La Porte
C5 Downtown SW5 Alief NW5 Jersey Village/Cypress NE5 FM 1960 East/IAH Airport SE5 Friendswood/Pearland East
SW6 Sharpstown/Westwood NW6 Bear Creek/Copperfield/Fairfield NE6 Lake Houston/Kingwood SE6 Clear Lake/Webster/League City
SW7 Westpark/Bissonnet NW7 Katy/Cinco Ranch/Waterside NE7 Northeast Houston/Crosby SE7 Baytown
SW8 Braeswood/Fondren SW NW8 Tomball/Spring SE8 Dickinson/Galveston
SW9 Almeda/South Main NW9 Woodlands/Conroe South SE9 Alvin/Angleton/Lake Jackson
SW10 Sugar Land/Stafford/Sienna NW10 Conroe North/Montgomery
SW11 Richmond/Rosenberg
HOUSTON MULTIFAMILY
MARKETVIEW
Figure 1: Multifamily Demand Slows After Strong Cycle
Renters Have the Upper Hand; First Since 2009
Houston Multifamily, Q2 2016
Q2 2016 CBRE Research © 2016 CBRE, Inc. | 1
*Arrows indicate change from previous quarter.
Total Occupancy
89.7%Avg. Rental Rate
$1.12 PSFNet Absorption
2,964 UnitsCompletionsUnder Construction
19,861 Units 5,106 Units
NEW ADDITIONS OUTPACING NEW DEMAND -
INDUSTRY KNEW THIS DYNAMIC WAS COMING
As expected, Houston’s multifamily demand
throughout the first half of the year remains
below recent record leasing trends. Net
absorption in the first two quarters of 2016
dropped 45% from the first six months of 2015.
Over the last decade, the second half of the year is
strongly affected by seasonal leasing trends
resulting in 30% less net absorption than the first
six months of the year. This suggests this year
Houston will see the lightest demand since 2009.
In addition to slowing demand, there is an
additional 18,000 units projected to deliver by the
end of 2016. Given this supply dynamic, newly
delivered projects are offering substantial
concessions to maintain leasing and quickly
stabilize new properties. For example, Inner
Loop, The Woodlands, and Katy communities are
offering up to three months prorated free rent on
one year leases. Some properties are even
advertising hold periods to allow renters to take
advantage of leasing specials and not face early
termination penalties at their current rental.
TALES OF THE CITY: SPOT DEMAND/SOFTNESS
FORM WEST BY NORTHEAST
Three of the four strongest demand markets are
located in the Northwest Submarkets. Despite
layoffs in the energy industry, Katy/Cinco Ranch
experienced the strongest demand followed by
the Energy Corridor absorbing 678 and 493 units
respectively. Devastating spring floods continue
to impact the Greenspoint and Aldine apartment
markets, which saw negative net absorption of
1,217 units.
0
5
10
15
20
2008 2009 2010 2011 2012 2013 2014 2015 2016
Units (000s)
Projected Deliveries Deliveries Net Absorption
Source: CBRE Research, Apartment Data Services, Q2 2016.
MARKETVIEW
Q2 2016 CBRE Research © 2016 CBRE, Inc. | 2
Source: CBRE Research, Apartment Data Services, Q2 2016.
Figure 2: Key Indicators
HOUSTON MULTIFAMILY
SubmarketProperty
CountUnit
Count
Rental Rate
($/SF/Mth)
Occupancy Rate (%)
Net Absorption
Units
Under Construction
Units
Delivered Construction
Units
Proposed Construction
Units
CENTRALMontrose/ Museum/ Midtown 48 11,670 1.85 82.0 (61) 2,064 196 2,058 Highland Village/ Upper Kirby/ West U 60 15,756 1.76 85.5 300 925 300 Med Center/ Braes Bayou 73 21,514 1.48 88.7 69 2,042 378 375 Heights/ Washington Ave 48 10,658 1.71 79.6 282 570 623 900 Downtown 17 4,291 1.99 56.2 142 1,987 207 1,186
TOTALS 246 63,889 1.76 78.4 732 7,588 1,404 4,819 SOUTHWEST
Galleria/Uptown 98 22,983 1.40 89.0 (6) 1,376 878 Woodlake/ Westheimer 36 11,848 1.15 88.3 145 387 Energy Corridor/CityCentre/Briar Forest 100 31,264 1.18 85.2 493 1,176 459 1,420 Westchase 49 14,653 1.16 92.3 106 266 Alief 111 27,036 0.98 93.5 9 Sharpstown/ Westwood 106 25,538 0.85 93.3 53 Westpark/Bissonnet 57 16,900 0.89 94.8 (77)Braeswood/ Fondren SW 83 21,907 0.88 91.5 68 Almeda/ South Main 24 4,422 0.95 91.7 (29)Sugar Land/Stafford/Sienna 48 12,217 1.22 90.4 101 200 624 Richmond/ Rosenberg 29 4,766 1.00 93.8 (28)
TOTALS 741 193,534 1.06 91.3 835 3,405 459 2,922 NORTHWEST
Brookhollow/Northwest Crossing 89 19,593 0.97 92.2 (12) 120 120 330 Memorial/Spring Branch 107 21,523 1.00 91.4 126 247 281 Inwood/ Highway 249 33 6,030 0.81 94.2 (23)Willowbrook/Champions/Ella 158 39,013 1.01 91.5 (103) 250 80 Jersey Village/Cypress 60 14,961 1.06 93.3 (69) 613 Bear Creek/Copperfield/Fairfield 56 15,657 1.12 91.4 362 417 Katy/Cinco Ranch/Waterside 84 53,295 1.18 81.8 678 3,382 948 2,039 Tomball/ Spring 47 10,884 1.14 73.0 354 1,879 965 1,051 Woodlands/ Conroe South 65 18,815 1.19 80.9 98 273 900 Conroe North/Montgomery 44 7,870 1.00 85.8 94 927 372 150
TOTALS 743 207,641 1.05 87.6 1,505 6,975 3,005 5,364 NORTHEAST
I-10 East/ Woodforest/ Channelview 56 11,353 0.94 93.0 68 246 300 I-69 North 26 3,503 0.87 93.9 29 350 Northline 46 6,212 0.86 93.5 13 Greenspoint/Northborough/Aldine 67 16,694 0.84 90.7 (1,217)FM 1960 East/ IAH Airport 44 8,454 0.92 94.8 33 228 Lake Houston/ Kingwood 46 11,751 1.13 91.1 10 607 Northeast Houston/Crosby 21 3,278 0.82 93.0 8
TOTALS 306 61,245 0.91 92.9 (1,056) 824 0 907 SOUTHEAST
Hwy 288 South/ Pearland West 43 11,062 1.12 86.7 94 300 638 U of H/I-45 South 105 17,264 0.87 92.7 142 191 Beltway 8/I-45 South 46 13,004 0.97 94.0 91 Pasadena/Deer Park/La Porte 117 22,646 0.94 91.7 122 192 Friendswood/ Pearland East 28 5,458 1.14 95.8 11 126 Clear Lake/Webster/League City 93 23,345 1.16 92.2 214 347 553 Baytown 53 9,678 1.00 92.2 46 480 Dickinson/Galveston 73 11,100 0.98 93.6 (14) 230 Alvin/Angleton/Lake Jackson 63 9,867 1.03 93.4 242 238
TOTALS 621 123,424 1.02 92.5 948 1,069 238 1,988 HOUSTON TOTALS 2,657 649,733 1.12 89.7 2,964 19,861 5,106 16,000
MARKETVIEW
SUSTAINED HIGH ASKING RENTS
UNDERWRITING CONCESSIONS
Rental rates have seen little change over the last
year. Houston rental rates are $1.12 per sq. ft.
which is only a $0.02 increase from 2015. Class A
rental rates have likely peaked seeing little
movement throughout the last five quarters.
However, Class B and C properties have been able
to increase rents as demand for more affordable
apartments is on the rise. The average Class B
property will cost renters $941 per month—a $15
increase in a single year. The highest rents in
Houston are all located in the Central submarkets
with the most expensive being Downtown at $1.99
per sq. ft. While most apartments are employing
concessions to spur leasing activity, some
properties in saturated areas like Cinco Ranch are
offering rent reductions up to 15% on certain floor
plans.
LEASE-UPS WEIGH DOWN OCCUPANCY
As the multifamily market delivers more new
product, the saturation of apartments in lease-up
continues to drag down the overall occupancy. The
city’s overall occupancy dropped an additional 50
basis points (bps) to 89.7%, the lowest since Q1
2013. The steady decline in Class A occupancy is
not as indicative of softness as it might seem; the
stabilized Class A occupancy is still above 90%,
and concessions are attracting savvy renters on the
hunt for a deal. Although concessions make new
properties affordable for some renters, Class B
product remains the most desirable product in
Houston. Class B occupancy climbed to 93.3%
from 93.0% in Q1 2016.
BUILDING PERMITS RIGHTFULLY SHRINK 60%
After a heavy construction cycle, development is
beginning to slow. Permits have declined by 60%
since Q3 2014, thus under construction activity
slowed to 19,861 units under construction.
Deliveries continue to decelerate as well with only
5,106 units delivered this quarter bringing the 2016
total to 10,300 new units. An additional 18,000
units are anticipated to deliver this year with
slowing net absorption occupancy expected to
increase.
Q2 2016 CBRE Research © 2016 CBRE, Inc. | 3
Figure 3: Avg. Rental Rate by Class
Figure 4: Avg. Occupancy Rate by Class
Source: CBRE Research, Apartment Data Services, Q2 2016.
Figure 5: Development Activity
Source: CBRE Research, Apartment Data Services, Q2 2016.
0.50
0.70
0.90
1.10
1.30
1.50
Q2 2015 Q3 2015 Q4 2015 Q1 2016 Q2 2016
$/SF
Class A Class B Class C
70
75
80
85
90
95
100
Q2 2015 Q3 2015 Q4 2015 Q1 2016 Q2 2016
Occupancy (%)
Class A Class B Class C
05
101520253035
2009 2010 2011 2012 2013 2014 2015 2016 YTD
Units (000s)
Under Construction Deliveries
HOUSTON MULTIFAMILY
MARKETVIEW
Q2 2016 CBRE Research © 2016 CBRE, Inc. | 4
HOUSTON MULTIFAMILY
Figure 6: Top 10 Key Sales Transactions
0
2
4
6
8
10
2010 2011 2012 2013 2014 2015 2016
Unemployment (%)
U.S. Texas Houston MSA
Figure 7: Unemployment Rates
Source: U.S. Bureau of Labor Statistics, June 2016.
Source: Real Capital Analytics, June 2016.
Name Address Units Submarket
1 Villas de Palmas 8701 Town Park Dr 659 Shaprstown/Westwood
2 Victoria Village 1705 Jenkins Rd 612 Pasadena/Deer Park/ La Porte
3 Park Texas 11911 Martin Luther King Jr 596 Hwy 288 South/ Pearland West
4 Trails of Ashford 12710 Brant Rock Dr 544 Westchase
5 The Preserve Apartments 600 E Medical Center Blvd 530 Clear Lake/Webster/League City
6 Sandridge 4025 Burke Rd 504 Pasadena/Deer Park/La Porte
7 The Steeples 2151 S Kirkwood 408 Energy Corridor/CityCentre/Briar Forest
8 Lakes at Madera 305 W Baker Rd 392 Baytown
9 Raveneaux 14500 Cuteen Rd 382 Willowbrook/Champions/Ella
10 Emerald Pointe 920 Houston Ave 363 Heights/Washington Ave
NEW JOB GAINS REFLECT SLOW GROWTH
YEAR
Houston’s unemployment rate surpassed the
U.S. rate as local unemployment continues to
climb to 5.5% in June. While employment
growth is stagnant, job losses are relatively
isolated to the exploration and production
sectors, primarily oil field services and oil field
equipment manufacturing. However, the losses
in E&P are balanced by job gains throughout the
retail and healthcare sectors. Yet, job gains have
not been robust enough to balance out losses.
The short term outlook contains flat
employment yet, long term forecasts show
improvement in 2018 and 2019.
CAPITAL MARKETS
Year to date, the Houston multifamily market is
continuing to see a major rise in private buyers
and conversely a drop in institutional buyers.
From Q2 2015 to Q2 2016, Houston saw an 11%
increase in private buyers, which is 21% higher
in comparison to the private buyers in the rest of
the U.S.
Despite this rise in private investments, sales
continue to decline throughout the city year-
over-year. Houston’s average price per unit
declined significantly compared to the rest of
the U.S. with a gap roughly from $7.60 a unit to
$14.50 per unit.
MARKETVIEW
Disclaimer: Information contained herein, including projections, has been obtained from sources believed to be reliable. While we do not doubt its accuracy, we have not verified it and make no guarantee, warranty or representation about it. It is your responsibility to confirm independently its accuracy and completeness. This information is presented exclusively for use by CBRE clients and professionals and all rights to the material are reserved and cannot be reproduced without prior written permission of CBRE.
CONTACTS
Robert C. Kramp
Director, Research & Analysis
Texas-Oklahoma Division
E. Michelle Miller
Research Operations Manager
Texas-Oklahoma Division
CBRE OFFICES
CBRE Houston
2800 Post Oak Blvd, Suite 2300
Houston, TX 77056
To learn more about CBRE Research,
or to access additional research
reports, please visit the Global
Research Gateway at
www.cbre.com/researchgateway.
CENTRAL SOUTHWEST NORTHWEST NORTHEAST SOUTHEAST
C1 Montrose/Museum/Midtown SW1 Galleria/Uptown NW1 Brookhollow/Northwest Crossing NE1 I-10 East/Woodforest/Channelview SE1 Hwy 288 South/ Pearland West
C2 Highland Village/Upper Kirby/West U SW2 Woodlake/Westheimer NW2 Memorial/Spring Branch NE2 I-69 North SE2 U of H/I-45 South
C3 Med Center/Braes Bayou SW3 Energy Corridor/CityCentre/Briar Forest NW3 Inwood/Highway 249 NE3 Northline SE3 Beltway 8/I-45 South
C4 Heights/Washington Ave SW4 Westchase NW4 Willowbrook/Champions/Ella NE4 Greenspoint/Northborough/Aldine SE4 Pasadena/Deer Park/La Porte
C5 Downtown SW5 Alief NW5 Jersey Village/Cypress NE5 FM 1960 East/IAH Airport SE5 Friendswood/Pearland East
SW6 Sharpstown/Westwood NW6 Bear Creek/Copperfield/Fairfield NE6 Lake Houston/Kingwood SE6 Clear Lake/Webster/League City
SW7 Westpark/Bissonnet NW7 Katy/Cinco Ranch/Waterside NE7 Northeast Houston/Crosby SE7 Baytown
SW8 Braeswood/Fondren SW NW8 Tomball/Spring SE8 Dickinson/Galveston
SW9 Almeda/South Main NW9 Woodlands/Conroe South SE9 Alvin/Angleton/Lake Jackson
SW10 Sugar Land/Stafford/Sienna NW10 Conroe North/Montgomery
SW11 Richmond/Rosenberg
HOUSTON MULTIFAMILY
MARKETVIEW
Figure 1: Permit Activity by Month
0
1
2
3
4
Jan Feb Mar Apr May Jun Jul Aug Sep Oct Nov Dec
000s
2014 2015 2016
Building permits slow as market calibrates supply pipeline
Houston Multifamily, Q1 2016
Q1 2016 CBRE Research © 2016 CBRE, Inc. | 1
*Arrows indicate change from previous quarter.
Total Occupancy 90.2%
Avg. Rental Rate $1.10 PSF
Net Absorption 2,803 Units
Completions Under Construction 24,889 Units 5,234 Units
Source: CBRE Research, Apartment Data Services, Q1 2016.
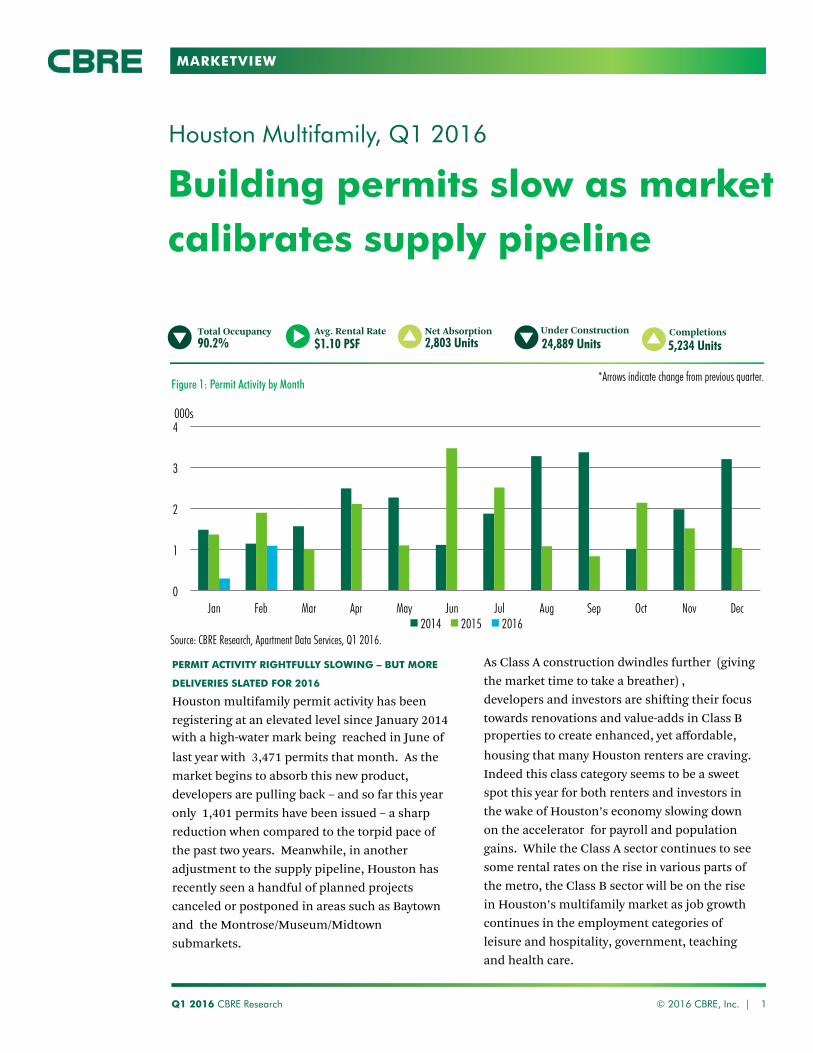
PERMIT ACTIVITY RIGHTFULLY SLOWING – BUT MORE
DELIVERIES SLATED FOR 2016
Houston multifamily permit activity has been registering at an elevated level since January 2014 with a high-water mark being reached in June of last year with 3,471 permits that month. As the market begins to absorb this new product, developers are pulling back – and so far this year only 1,401 permits have been issued – a sharp reduction when compared to the torpid pace of the past two years. Meanwhile, in another adjustment to the supply pipeline, Houston has recently seen a handful of planned projects canceled or postponed in areas such as Baytown and the Montrose/Museum/Midtown submarkets.
As Class A construction dwindles further (giving the market time to take a breather) , developers and investors are shifting their focus towards renovations and value-adds in Class B properties to create enhanced, yet affordable, housing that many Houston renters are craving. Indeed this class category seems to be a sweet spot this year for both renters and investors in the wake of Houston’s economy slowing down on the accelerator for payroll and population gains. While the Class A sector continues to see some rental rates on the rise in various parts of the metro, the Class B sector will be on the rise in Houston’s multifamily market as job growth continues in the employment categories of leisure and hospitality, government, teaching and health care.
MARKETVIEW
Q1 2016 CBRE Research © 2016 CBRE, Inc. | 2
Source: CBRE Research, Apartment Data Services, Q1 2016.
Figure 2: Key Indicators
Submarket Property
Count Unit Count Rental
Rate ($/SF/Mth)
Occupancy Rate (%)
Net Absorption
Units
Under Construction Units
Delivered Construction
Units
Proposed Construction
Units CENTRAL Montrose/ Museum/ Midtown 46 11,018 1.78 88.2 (143) 3,059 - 2,058 Highland Village/ Upper Kirby/ West U 59 15,486 1.75 84.9 202 1,195 279 300 Med Center/ Braes Bayou 72 21,376 1.48 88.8 (17) 2,266 193 375 Heights/ Washington Ave 46 10,450 1.71 78.5 110 578 283 956 Downtown 14 3,345 1.93 68.0 56 2,667 400 1,396 TOTALS 237 61,675 1.73 81.7 208 9,765 1,155 5,085 SOUTHWEST Galleria/Uptown 98 22,983 1.42 89.0 74 1,376 - 578 Woodlake/ Westheimer 35 11,513 1.15 89.7 (40) 725 - - Energy Corridor/CityCentre/Briar Forest 99 30,848 1.19 84.8 621 1,592 1,243 2,044 Westchase 49 14,653 1.15 91.8 142 266 - - Alief 110 26,895 0.95 94.0 115 - - - Sharpstown/ Westwood 106 25,538 0.85 93.3 (45) - - - Westpark/Bissonnet 58 16,900 0.90 95.4 11 - - - Braeswood/ Fondren SW 83 21,906 0.88 91.3 (170) - - - Almeda/ South Main 24 4,438 0.98 92.3 (69) - - - Sugar Land/Stafford/Sienna 48 12,217 1.24 89.6 58 200 312 - Richmond/ Rosenberg 29 4,766 1.10 94.4 9 - - - TOTALS 739 192,657 1.07 91.4 706 4,159 1,555 2,622 NORTHWEST Brookhollow/Northwest Crossing 88 19,473 0.97 93.1 (133) 240 - 330 Memorial/Spring Branch 107 21,523 1.00 90.8 132 - - 281 Inwood/ Highway 249 33 6,030 0.82 94.6 1 - - - Willowbrook/Champions/Ella 156 38,773 0.99 92.4 32 241 - - Jersey Village/Cypress 60 14,961 1.06 93.7 (71) - - 613 Bear Creek/Copperfield/Fairfield 58 15,677 1.12 88.7 214 288 - - Katy/Cinco Ranch/Waterside 83 23,059 1.20 79.7 424 1,819 775 2,039 Tomball/ Spring 42 9,194 1.14 82.4 293 3,418 - 1,051 Woodlands/ Conroe South 62 17,891 1.19 84.6 185 924 989 900 Conroe North/Montgomery 42 7,422 0.97 89.7 21 1,375 80 450 TOTALS 731 174,003 1.04 89.0 1,098 8,305 1,844 5,664 NORTHEAST I-10 East/ Woodforest/ Channelview 56 11,352 0.93 92.4 (5) 246 - 300 I-69 North 26 3,503 0.87 93.2 60 - - - Northline 46 6,212 0.84 93.3 (90) - - - Greenspoint/Northborough/Aldine 67 17,475 0.83 93.6 43 - - - FM 1960 East/ IAH Airport 44 8,454 0.92 94.4 116 228 - - Lake Houston/ Kingwood 45 11,447 1.14 93.4 88 304 - 607 Northeast Houston/Crosby 21 3,278 0.81 93.3 (2) - - - TOTALS 305 61,721 0.91 93.4 210 778 0 907 SOUTHEAST Hwy 288 South/ Pearland West 43 11,062 1.12 95.9 (76) 300 - 400 U of H/I-45 South 104 17,042 0.88 93.1 122 222 - 191 Beltway 8/I-45 South 46 13,004 0.97 93.5 (11) - - - Pasadena/Deer Park/La Porte 117 22,646 0.90 91.0 93 192 264 - Friendswood/ Pearland East 28 5,458 1.11 95.3 52 - - 126 Clear Lake/Webster/League City 93 23,345 1.15 91.3 93 347 416 553 Baytown 52 9,397 0.98 94.3 61 283 - 480 Dickinson/Galveston 73 11,100 0.98 93.8 68 230 - - Alvin/Angleton/Lake Jackson 62 9,629 1.01 90.5 179 308 - - TOTALS 618 122,683 1.01 93.2 581 1,882 680 1,750
HOUSTON TOTALS 2,630 612,739 1.10 90.2 2,803 24,889 5,234 16,028
HOUSTON MULTIFAMILY
MARKETVIEW
RENTS SUSTAIN HIGH ASKING RATES
Although Houston rents have steadily increased over the last few years, signs are pointing towards stable to sideways rent growth, as Q1 2016 saw rents at $1.10 per sq. ft., where they remained for the last six months. Strengthening demand in Class B properties resulted in a slight increase in overall rates; average rental rates are $1.09 per sq. ft. Concessions rather than softening rates are on the rise in Class A product due to a surplus in inventory. Average rental rates for top tier product remain above $1.50 per. sq. ft., with some properties, such as 2929 Weslayan, asking upwards of $2.80 per sq. ft. in the Highland Village/Upper Kirby/West U submarket. NEW SUPPLY PUTS A SMALL DENT IN OCCUPANCY
Houston’s overall occupancy dropped 40 basis points (bps) to 90.2%, the lowest since Q1 2013. Whereas, Class A occupancy has steadily declined from 84.3% to 80.5% year-over-year. Again, this due to the dramatic increase in units delivered over the past two years, approximately 41,000 units and thus an increase in price per. sq. ft. On the other hand, Class B and Class C properties occupancy held steady above 93.0% for the last 12 months. Total net absorption for Q1 2016 was 2,803 units, which in historical terms is in line with the total units absorbed for the year in 2009. While Class A occupancy remains on the low end, absorption was positive at 2,831 units, on the other hand, Class B absorption was a negative (678) units due to seasonal adjustments.
CONSTRUCTION TAPERING. FINALLY.
After several quarters of strong construction activity, Q1 2016 construction slowed to 24,889 units under construction. The majority, approximately 21,000, of these units will deliver throughout 2016. The number of completions this quarter totaled 5,234 units, with the majority in the northwest submarkets. These include the high-end Class A properties, District at Memorial opening with 324 units, and 311-unit Pearl Citycentre.
Q1 2016 CBRE Research © 2016 CBRE, Inc. | 3
Figure 3: Avg. Rental Rate by Class
Figure 4: Avg. Occupancy Rate by Class
Source: CBRE Research, Apartment Data Services, Q1 2016.
Figure 5: Construction Activity and Net Absorption
Source: CBRE Research, Apartment Data Services, Q1 2016.
0.50
0.70
0.90
1.10
1.30
1.50
Q1 2015 Q2 2015 Q3 2015 Q4 2015 Q1 2016
$/SF
Class A Class B Class C
70
75
80
85
90
95
100
Q1 2015 Q2 2015 Q3 2015 Q4 2015 Q1 2016
%
Class A Class B Class C
0 5
10 15 20 25 30 35
2009 2010 2011 2012 2013 2014 2015 2016 YTD
Units (000s)
Under Construction Deliveries Net Absorption
HOUSTON MULTIFAMILY
MARKETVIEW
Q1 2016 CBRE Research © 2016 CBRE, Inc. | 4
HOUSTON MULTIFAMILY
NEW JOB GAINS REFLECT SLOW GROWTH YEAR
Houston is already halfway through expected job losses in the wake of low crude oil prices and according to the Bureau of Labor Statistics, the Houston MSA job growth numbers showed 10,100 jobs gained in February, a year-over-year growth of 0.3%. These are the most sluggish job growth numbers since the recession in 2009. Still, job gains were due in part to seasonal hiring in restaurants and retail stores. Deepest declines of the industry sectors year-over-year have been in mining and logging (-16.5%), manufacturing (-9.0%), and professional and business services (-2.6%). A major blow to mining and logging is due to the continuous drop in oil prices as well as the major oil and gas companies announcing recent layoffs. While employment growth will be slow, payroll forecasts generally agree on a continuing oil price recovery throughout the year, while at the same time, modest job gains are expected throughout the retail and other service sectors. For example, the healthcare sector has played a significant role in the growth of the Houston MSA, especially with the continued expansion of the Texas Medical Center and area hospital systems. The completion of the Panama expansion project in June--in concert
with ongoing infrastructure improvements in the Houston Ship Channel--will be critical to Houston's future economic prosperity as a global trade and logistics hub. For the 14th consecutive month, the Houston Purchasing Managers Index (PMI) registered below the neutral point of 50, steadily declining in February to 44.5, continuing to show the Houston economy contracting.
Figure 6: Top 10 Key Transactions
0
2
4
6
8
10
2010 2011 2012 2013 2014 2015 2016
%
U.S. Texas Houston MSA
Figure 7: Unemployment Rates
Source: U.S. Bureau of Labor Statistics, February 2016.
Source: Real Capital Analytics, April 2016.
Name Address Units Submarket
1 Wilshire Place Apartments 6000 Hollister St. 536 Brookhollow/Northwest Crossing
2 Advenir at Stone Park 6160 E. Sam Houston Pkwy. 480 I-10 East/Woodforest/Channelview
3 Pines of Northwest Crossing 7200 Pinemont 412 Brookhollow/Northwest Crossing
4 Monterra Park 4000 Watonga 392 Brookhollow/Northwest Crossing
5 Retreat on Rosslyn 5801 N. Houston Rosslyn 364 Brookhollow/Northwest Crossing
6 Emerson Park 1799 FM 528 354 Beltway 8/I-45 South
7 Radius at Shadow Creek Ranch 2400 Business Center 350 Hwy 288 South/ Pearland West
8 Avana Cypress Estates 10802 Legacy Park Dr. 336 Jersey Village/Cypress
9 Dolce Living Grand Harbor 24758 Grand Harbor 324 Katy/Cinco Ranch/Waterside
10 Fountains at Katy 1007 S. Mason Rd. 316 Katy/Cinco Ranch/Waterside
MARKETVIEW
Disclaimer: Information contained herein, including projections, has been obtained from sources believed to be reliable. While we do not doubt its accuracy, we have not verified it and make no guarantee, warranty or representation about it. It is your responsibility to confirm independently its accuracy and completeness. This information is presented exclusively for use by CBRE clients and professionals and all rights to the material are reserved and cannot be reproduced without prior written permission of CBRE.
CONTACTS
Robert C. Kramp Director, Research & Analysis Texas-Oklahoma Division [email protected] E. Michelle Miller Research Operations Manager Texas-Oklahoma Division [email protected]
CBRE OFFICES
CBRE Houston 2800 Post Oak Blvd, Suite 2300 Houston, TX 77056
To learn more about CBRE Research, or to access additional research reports, please visit the Global Research Gateway at www.cbre.com/researchgateway.
CENTRAL SOUTHWEST NORTHWEST NORTHEAST SOUTHEAST C1 Montrose/Museum/Midtown SW1 Galleria/Uptown NW1 Brookhollow/Northwest Crossing NE1 I-10 East/Woodforest/Channelview SE1 Hwy 288 South/ Pearland West
C2 Highland Village/Upper Kirby/West U SW2 Woodlake/Westheimer NW2 Memorial/Spring Branch NE2 I-69 North SE2 U of H/I-45 South
C3 Med Center/Braes Bayou SW3 Energy Corridor/CityCentre/Briar Forest NW3 Inwood/Highway 249 NE3 Northline SE3 Beltway 8/I-45 South
C4 Heights/Washington Ave SW4 Westchase NW4 Willowbrook/Champions/Ella NE4 Greenspoint/Northborough/Aldine SE4 Pasadena/Deer Park/La Porte
C5 Downtown SW5 Alief NW5 Jersey Village/Cypress NE5 FM 1960 East/IAH Airport SE5 Friendswood/Pearland East
SW6 Sharpstown/Westwood NW6 Bear Creek/Copperfield/Fairfield NE6 Lake Houston/Kingwood SE6 Clear Lake/Webster/League City
SW7 Westpark/Bissonnet NW7 Katy/Cinco Ranch/Waterside NE7 Northeast Houston/Crosby SE7 Baytown
SW8 Braeswood/Fondren SW NW8 Tomball/Spring SE8 Dickinson/Galveston
SW9 Almeda/South Main NW9 Woodlands/Conroe South SE9 Alvin/Angleton/Lake Jackson
SW10 Sugar Land/Stafford/Sienna NW10 Conroe North/Montgomery
SW11 Richmond/Rosenberg
HOUSTON MULTIFAMILY
MARKETVIEW
New Construction Peaks in 2016, Units Online Just as Jobs Pick Up
Houston Multifamily, Q4 2015
Q4 2015 CBRE Research © 2016 CBRE, Inc. | 1
*Arrows indicate change from previous quarter.
Figure 1: Supply and Demand
Source: CBRE Research, Apartment Data Services, Q4 2015.
Total Occupancy
90.6%Avg. Rental Rate
$1.10 PSFNet Absorption
(131) UnitsCompletionsUnder Construction
29,005 Units 4,198 Units
RENTS, CONCESSIONS UP AGAIN THIS QUARTER
Houston’s multifamily market is cooling as some
area vacancies rise and the new normal of slower job
growth settles into the economy, brought by the
downturn in the oil and gas sector. And yet
multifamily demand ended 2015 higher than
expected, with 13,013 units absorbed, the majority
being in newly built Class A product. Rents
expanded year-over-year another 5.0%. One favoring
factor is the dwindling affordable housing as home
prices creep higher and area demand for rental units
are buttressed by new industrial construction on the
east side of town.
An imbalance of supply and demand is starting to
creep into the analytics, specifically Class A
properties. Apartments are functionally full at 95%
occupancy, although Houston’s overall occupancy
isn’t quite there ending the year at 90.6% due to
corporate units and temporary, short-term leases
making the difference.
Conversely, Class B and Class C properties continue
to gain renters at a steady pace, and can almost be
classified as completely full at 93.6% and we expect
that to be seen in the year ahead as affordable
housing becomes more than a topic of conversation.
Multifamily completions have not slowed down,
delivering 4,198 units in Q4 2015; bringing the 2015
total to 18,327units delivered. In 2016, expected
deliveries will total approximately 17,000 units,
foreshadowing the end of the construction boom
Houston has maintained the last five years. This is a
much needed breather and just in time to calibrate
with the pace of the jobs market, which is expected
to have another slow year in 2016 before gaining
steam gain during 2017 and 2018.
01234567
75
80
85
90
95
100
Q4 20
12
Q1 20
13
Q2 20
13
Q3 20
13
Q4 20
13
Q1 20
14
Q2 20
14
Q3 20
14
Q4 20
14
Q1 20
15
Q2 20
15
Q3 20
15
Q4 20
15Completions
(000’s)Occupancy (%)
Completions CLASS A CLASS B CLASS C
0
1
2
3
4
5
6
7
Q4 20
12
Q1 20
13
Q2 20
13
Q3 20
13
Q4 20
13
Q1 20
14
Q2 20
14
Q3 20
14
Q4 20
14
Q1 20
15
Q2 20
15
Q3 20
15
Q4 20
15
Units (000’s)
Class A Absorption Completions
Figure 2: Supply and Occupancy
Source: CBRE Research, Apartment Data Services, Q4 2015.
MARKETVIEW
Q4 2015 CBRE Research © 2016 CBRE, Inc. | 2
HOUSTON MULTIFAMILY
Source: CBRE Research, Apartment Data Services, Q4 2015.
Figure 3: Key Indicators
SubmarketProperty Unit
Rental Rate
OccupancyRate
NetAbsorption
Under Construction
Units
DeliveredConstruction
Units
Proposed Construction
Count Count ($/SF/Mth) (%) Units UnitsCENTRAL
Montrose/ Museum/ Midtown 45 10,822 1.82 92.1 122 3,623 251 1,690 Highland Village/ Upper Kirby/ West U 58 15,209 1.76 85.2 14 1,474 550 300 Med Center/ Braes Bayou 71 20,998 1.47 90.4 (219) 2,644 564 376 Heights/ Washington Ave 42 9,466 1.73 85.3 119 1,485 - 956 Downtown 11 2,428 1.94 90.6 27 3,437 - 1,396
TOTALS 227 58,923 1.74 88.7 63 12,663 1,365 4,718
SOUTHWESTGalleria/Uptown 98 22,983 1.44 88.7 10 1,184 - 578 Woodlake/ Westheimer 35 11,513 1.19 89.9 62 338 - -
Energy Corridor/CityCentre/Briar Forest 99 30,700 1.19 83.1 304 1,740 293 1,420
Westchase 49 14,653 1.16 89.3 (181) 266 265 -Alief 110 26,895 0.94 93.5 (209) - - -Sharpstown/ Westwood 106 25,538 0.84 93.5 132 - - -Westpark/Bissonnet 58 16,900 0.88 95.4 38 - - -Braeswood/ Fondren SW 83 21,906 0.86 91.9 353 - - -Almeda/ South Main 24 4,438 0.97 94.0 24 - - -Sugar Land/Stafford/Sienna 47 11,905 1.23 91.4 (88) - - 940 Richmond/ Rosenberg 29 4,766 1.08 94.2 1 - - -
TOTALS 738 192,197 1.07 91.4 446 3,528 558 2,938
NORTHWEST Brookhollow/Northwest Crossing 88 19,421 0.95 93.8 32 240 - 330 Memorial/Spring Branch 106 21,276 1.00 91.0 (204) 247 394 281 Inwood/ Highway 249 34 6,030 0.81 94.7 (30) - - -Willowbrook/Champions/Ella 156 38,773 1.00 92.2 (456) - - 239 Jersey Village/Cypress 60 14,961 1.08 94.2 (119) - - 613
Bear Creek/Copperfield/Fairfield 58 15,677 1.11 87.1 217 288 520 -
Katy/Cinco Ranch/Waterside 80 22,311 1.20 80.7 237 2,729 2,014 Tomball/ Spring 41 8,864 1.11 82.2 284 3,442 360 1,051 Woodlands/ Conroe South 59 16,804 1.21 88.9 (72) 2,015 - 900 Conroe North/Montgomery 40 7,114 0.98 93.9 (42) 1,147 - 658
TOTALS 722 171,231 1.04 89.9 (153) 10,108 1,274 6,086
NORTHEAST -I-10 East/ Woodforest/ Channelview 56 11,352 0.92 92.5 (50) 246 - 300 I-69 North 26 3,503 0.86 91.5 (43) - - -Northline 46 6,212 0.84 94.7 37 - - -Greenspoint/Northborough/Aldine 67 17,475 0.81 93.4 92 - - -FM 1960 East/ IAH Airport 44 8,454 0.91 93.0 33 228 - -Lake Houston/ Kingwood 45 11,447 1.13 92.7 (72) 304 - 607 Northeast Houston/Crosby 21 3,278 0.80 93.1 63 - - -
TOTALS 305 61,721 0.89 93.0 60 778 - 907
SOUTHEAST Hwy 288 South/ Pearland West 42 10,786 1.12 88.4 (67) 576 382 400 U of H/I-45 South 103 17,014 0.86 92.4 (98) 222 - -Beltway 8/I-45 South 46 13,004 0.97 93.6 (39) - - -Pasadena/Deer Park/La Porte 117 22,646 0.91 90.6 (26) 192 180 -Friendswood/ Pearland East 28 5,458 1.13 94.1 (22) - 63 126 Clear Lake/Webster/League City 93 23,345 1.14 90.9 (259) 347 376 553 Baytown 52 9,397 0.96 93.7 77 283 - 480 Dickinson/Galveston 73 11,100 0.95 93.1 36 - - -Alvin/Angleton/Lake Jackson 61 9,609 0.99 88.4 (149) 308 - -
TOTALS 615 122,359 1.00 91.7 (547) 1,928 1,001 1,559
HOUSTON TOTAL 2,607 606,431 1.10 90.6 (131) 29,005 4,198 16,208
MARKETVIEW
RENTAL RATES
Although Houston rents remained stable this quarter
at $1.10 per sq. ft., overall rental rate growth has
continued to see an increase of 5.0% year-over-year.
Class A apartments, 2010 and newer, show rental
rates trending higher along with lower occupancy
resulting in less stability. As a result, 44% of Class A
properties offer generous concessions compared with
only 22% of the overall inventory offers discounts.
Class A properties built prior to 2010 are relatively
safe from those trends.
OCCUPANCY
Overall occupancy dropped 50 basis points (bps) to
90.6% in the fourth quarter. This is where the shift in
property class demand is happening. Class A
occupancy rates dipped 20 bps to 84.3%, including
properties in lease-up. Whereas, leading the way
again from last quarter, Class B occupancy recorded
93.6%, remaining above 93.0% for the last six
quarters.
With a continued tight home supply and an
increased average price of $280,290, up 3.7% year-
over- year, multifamily occupancy will remain above
90%. According to Moody’s Analytics, the Houston
metro area population is forecast to reach 10.9
million by 2045. All of which point to a vast reservoir
of renters.
CONSTRUCTION
The number of units under construction remains a
robust 29,005 in Q4 2015, an increase of 2,300 units
from last quarter. The top three urban submarkets
with the most units under construction are
Montrose/Museum/Midtown, Downtown, and Med
Center/Braes Bayou totaling 9,704 units. The
revitalization of Downtown is a major contributing
factor for continued growth of development.
The number of completions year-to date is a
phenomenal 18,327 units. In 2016, estimated
delivered construction will total approximately
17,100 units, majority expected in Q1 2016.
Q4 2015 CBRE Research © 2016 CBRE, Inc. | 3
HOUSTON MULTIFAMILY
Figure 4: Avg. Rental Rate by Class
Figure 5: Avg. Occupancy Rate by Class
Source: CBRE Research, Apartment Data Services, Q4 2015.
Figure 6: Construction Activity and Net Absorption
Source: CBRE Research, Apartment Data Services, Q4 2015.
0.00
0.50
1.00
1.50
2.00
Q4 2014 Q1 2015 Q2 2015 Q3 2015 Q4 2015
$/SF
Class A Class B Class C
80
85
90
95
Q4 2014 Q1 2015 Q2 2015 Q3 2015 Q4 2015
%
Class A Class B Class C
05
101520253035
2008
2009
2010
2011
2012
2013
2014
2015
000’s Units
Under Construction Deliveries Net Absorption
MARKETVIEW
Q4 2015 CBRE Research © 2016 CBRE, Inc. | 4
HOUSTON MULTIFAMILY
EMPLOYMENT
Houston is already halfway through expected job
losses, according to the Bureau of Labor Statistics,
the Houston MSA job growth numbers showed
4,800 jobs gained in November, a year-over-year
growth of 23,700 jobs. Job gains were due in part
to seasonal hiring in restaurants and retail stores.
Deepest declines of the industry sectors year-over-
year have been in manufacturing (-6.0%), mining
and logging (-4.9%), and financial activities (-
2.6%). A major blow to manufacturing is due to
the continuous drop in oil prices.
While employment growth will slow, employment
losses are unlikely. Job losses could occur in
exploration and production, oil field services, and
oil field equipment manufacturing. However,
modest job gains are expected throughout the
retail sector. The healthcare sector has played a
significant role in the growth of the Houston MSA,
especially with the continued growth of the Texas
Medical Center that employee an estimated
106,000 people. Additionally, the ongoing
investment in the improvement of the Houston
Ship Channel is critical to ensure this region
continues to capture its share of economic
prosperity delivered because of maritime
commerce.
For the last eleven months, the Houston
Purchasing Managers Index (PMI) registered
below the neutral point of 50, steadily declining in
November to 44.9, showing the Houston economy
continues to contract.
Figure 7: Top 10 Key Transactions
0
2
4
6
8
10
2007 2008 2009 2010 2011 2012 2013 2014 2015
%
U.S. Texas Houston MSA
Figure 7: Unemployment Rates
Source: U.S. Bureau of Labor Statistics, November 2015.
Source: Real Capital Analytics, January 2016.
Name Address Units Submarket
1 Sands Point Apartments 8300 Sands Point Dr 495 Sharpstown/Westwood
2 Central Park 3230 S Gessner 424 Westchase
3 The Falls at Clear Lakes 801 E NASA Rd 1 400 Clear Lake/Webster/League City
4 Sorrel Grand Parkway 1660 Katy Gap Rd 380 Katy/Cinco Ranch/Waterside
5 Abbey at Grant Road 9611 Grant Rd 372 Willowbrook/Champions/Ella
6 Skytop & Oakcreek 2213 N Frazier St 368 Conroe North/Montgomery
7 Calais Midtown 3210 Louisiana St 356 Montrose/Museum/Midtown
8 Emerson Park 1799 FM 528 354 Friendswood/Pearland East
9 Avana Cypress Estates 10802 Legacy Park Dr 336 Jersey Village/Cypress
10 23806 Colonial Pkwy 23806 Colonial Pkwy 324 Katy/Cinco Ranch/Waterside
The Houston-The Woodlands- Sugar Land MSA added 4,800 jobs in November, with a year-over-year growth of 23,700 jobs.
MARKETVIEW
Disclaimer: Information contained herein, including projections, has been obtained from sources believed to be reliable. While we do not doubt its accuracy, we have not verified it and make no guarantee, warranty or representation about it. It is your responsibility to confirm independently its accuracy and completeness. This information is presented exclusively for use by CBRE clients and professionals and all rights to the material are reserved and cannot be reproduced without prior written permission of CBRE.
CONTACTS
Robert C. Kramp
Director, Research & Analysis –South Central [email protected]
E. Michelle Miller
Research Operations [email protected]
Kindell Villarreal
Researcher+1 713 577 1894
CBRE OFFICES
CBRE Houston
2800 Post Oak Blvd, Suite 2300
Houston, TX 77056
To learn more about CBRE Research,
or to access additional research
reports, please visit the Global
Research Gateway at
www.cbre.com/researchgateway.
HOUSTON MULTIFAMILY
CENTRAL SOUTHWEST NORTHWEST NORTHEAST SOUTHEAST
C1 Montrose/Museum/Midtown SW1 Galleria/Uptown NW1 Brookhollow/Northwest Crossing NE1 I-10 East/Woodforest/Channelview SE1 Hwy 288 South/ Pearland West
C2 Highland Village/Upper Kirby/West U SW2 Woodlake/Westheimer NW2 Memorial/Spring Branch NE2 I-69 North SE2 U of H/I-45 South
C3 Med Center/Braes Bayou SW3 Energy Corridor/CityCentre/Briar Forest NW3 Inwood/Highway 249 NE3 Northline SE3 Beltway 8/I-45 South
C4 Heights/Washington Ave SW4 Westchase NW4 Willowbrook/Champions/Ella NE4 Greenspoint/Northborough/Aldine SE4 Pasadena/Deer Park/La Porte
C5 Downtown SW5 Alief NW5 Jersey Village/Cypress NE5 FM 1960 East/IAH Airport SE5 Friendswood/Pearland East
SW6 Sharpstown/Westwood NW6 Bear Creek/Copperfield/Fairfield NE6 Lake Houston/Kingwood SE6 Clear Lake/Webster/League City
SW7 Westpark/Bissonnet NW7 Katy/Cinco Ranch/Waterside NE7 Northeast Houston/Crosby SE7 Baytown
SW8 Braeswood/Fondren SW NW8 Tomball/Spring SE8 Dickinson/Galveston
SW9 Almeda/South Main NW9 Woodlands/Conroe South SE9 Alvin/Angleton/Lake Jackson
SW10 Sugar Land/Stafford/Sienna NW10 Conroe North/Montgomery
SW11 Richmond/Rosenberg
MARKETVIEW
Deliveries stretch past demand; construction to taper in 2016
Houston Multifamily, Q3 2015
Q3 2015 CBRE Research © 2015 CBRE, Inc. | 1
*Arrows indicate change from previous quarter. Figure 1: Supply and Demand
Source: CBRE Research, Apartment Data Services, Q3 2015.
Total Occupancy 91.1%
Avg. Rental Rate $1.10 PSF
Net Absorption 2,485 Units
Completions Under Construction 26,667 Units 4,319 Units
OVERVIEW Robust demand over the past several years created an urban
renaissance for Class A renters as developers aimed to keep pace with new product – and Houston is now seeing the result
as these deliveries arrive on-line – just in time as job growth has slowed, albeit only for the time being. Houston saw an
additional 3,000 units break ground in Q3 2015, up from Q2 2015 and 56% of the units presently under construction
are expected to deliver within six months and in 2016, Houston will continue to see a high number of deliveries with
approximately 17,000 units slated to deliver. Consequently, Houston is cresting its multifamily Class A construction cycle
this year and into next, giving the market just the right amount of time to catch-up as population and job gains rebound later
in the coming year.
During the recovery and into the recent expansion, Houston’s
evolving renter demographic saw demand cut across age groups which saw lifestyle preferences converge for the
appeal Class A urban product for Inner Loop, Galleria and mixed-use projects on the city’s west side. One example is
located within the official boundaries of Houston’s Downtown District. There are approximately 2,800 existing units, 2,700
units under construction and 2,500 units proposed, with an additional 7,000 residents projected; this means that, with the
cresting of the construction pipeline today, the urban Class A product now under development will see demand rally no
later than 2017.
Meanwhile, the consensus is that the multifamily and single-
family housing markets are generally holding their own even in light of recent cooling in single family home sales
(townhomes and condos of the most) and Class B and C sector demand has not been higher. The Houston housing
inventory, currently at 3.6 months, continues to show how strong the demand is for single-family and is well below the
state average of 4.0 months. Absorption finishing out the year will reflect the seasonal downturn, though, Houston will
naturally see a lower absorption than the go-go pace of the past 2 or 3 years as the market takes a needed breather.
0
1
2
3
4
5
6
7
75
80
85
90
95
100
Q3 20
12
Q4 20
12
Q1 20
13
Q2 20
13
Q3 20
13
Q4 20
13
Q1 20
14
Q2 20
14
Q3 20
14
Q4 20
14
Q1 20
15
Q2 20
15
Q3 20
15
Completions (000’s)
Thou
sand
s
Occupancy (%)
Completions CLASS A CLASS B CLASS C
0
1
2
3
4
5
6
7
Q3 20
12
Q4 20
12
Q1 20
13
Q2 20
13
Q3 20
13
Q4 20
13
Q1 20
14
Q2 20
14
Q3 20
14
Q4 20
14
Q1 20
15
Q2 20
15
Q3 20
15
Units (000’s)
Class A Absorption Completions
Figure 2: Supply and Occupancy
Source: CBRE Research, Apartment Data Services, Q3 2015.
MARKETVIEW
Q3 2015 CBRE Research © 2015 CBRE, Inc. | 2
HOUSTON MULTIFAMILY
Source: CBRE Research, Apartment Data Services, Q3 2015.
Figure 3: Key Indicators
*Annualized
Submarket Property Unit Rental Rate
Rental Rate Growth (%)
Y-o-Y* Occupancy Rate
Net Absorption Under Construction
Units
Delivered Construction
Units
Proposed Construction
Count Count ($/SF/Mth) (%) Units Units
CENTRAL
Montrose/ Museum District 54 13,784 1.82 3.7 93 223 3,687 36 1,690
Inner Loop West/ Greenway Plaza 65 16,567 1.81 2.9 85 551 1,108 541 1,216
Medical Center/ Bellaire 72 21,080 1.49 4.6 92 (17) 2,267 265 670
Heights 23 4,414 1.75 8.0 80 127 1,312 634 664
Inner Loop East 56 8,424 1.28 5.3 94 44 3,461 2,130
TOTALS 270 64,269 1.63 4.9 89 928 11,835 1,476 6,370
SOUTHWEST
Galleria 101 24,346 1.45 3.5 90 323 1,063 - 976
Woodlake/ Westheimer 39 12,293 1.18 4.2 90 84 338 - -
West Memorial/ Briar Forest 88 27,194 1.20 3.9 86 175 2,645 1,025 1,170
Westchase 49 14,653 1.17 6.1 91 86 266 - -
Alief 112 27,276 0.94 5.4 94 108 - - -
Sharpstown/ Westwood 106 25,538 0.84 9.7 93 3 - - -
Gulfton/ Bissonnet 58 16,900 0.88 8.1 95 (46) - - -
Braeswood/ Fondren SW 84 21,937 0.84 6.6 89 (1) - - -
Almeda/ South Main 22 4,283 0.96 8.6 93 17 301 - -
Fort Bend 55 14,488 1.24 3.6 88 446 599 - 1,320
Richmond/ Rosenberg 28 4,536 1.09 7.8 94 (22) - - -
TOTALS 742 193,444 1.07 6.1 91 1,173 5,212 1,025 3,466
NORTHWEST
Brookhollow 92 20,518 0.97 7.7 92 - 240 - 330
Spring Branch 95 18,319 0.91 6.5 94 (87) 573 - 281
Inwood/ Northwest 40 7,383 0.84 4.9 95 (2) - - -
FM 1960 West/ Champions 153 37,600 0.98 7.0 92 (85) - - 539
FM 1960 West/ Steeplechase 73 19,323 1.09 3.8 95 (90) - - 353
Bear Creek/ Copperfield 51 13,903 1.13 6.1 89 31 - - 510
Katy/Far West 73 20,171 1.20 0.7 82 588 1,944 1,120 1,603
Tomball/ Far Northwest 27 5,871 1.21 2.5 79 352 1,459 - 1,297
Woodlands/ Far North 55 16,495 1.23 2.3 90 435 444 - 1,666
Conroe/ Montgomery 44 7,598 0.98 4.0 94 9 1,768 - 508
TOTALS 703 167,181 1.05 4.6 90 1,151 6,428 1,120 7,087
NORTHEAST
Northshore/ Wood Forest 40 8,646 0.91 6.8 92 (1) - - -
Eastex Frwy/ Near Northeast 30 5,503 0.84 4.3 94 (36) - - -
Northline/ Aldine 62 10,110 0.83 6.6 95 13 - - -
Greenspoint 37 9,473 0.81 5.9 93 (46) - - -
FM 1960 East/ IAH Airport 47 8,930 0.95 8.1 92 (8) 534 330 -
Lake Houston/ Kingwood 45 11,446 1.14 6.5 93 (71) 304 - 591
Far East 29 4,833 0.87 3.6 91 58 246 - 300
TOTALS 290 58,941 0.91 5.9 93 (91) 1,084 330 891
SOUTHEAST
Hwy 288/ South 59 13,577 1.07 8.2 90 (98) 798 - -
Gulfgate/ Almeda Mall 98 22,083 0.91 10.9 93 (337) - - -
Galena Park/ Jacinto City 3 362 0.89 (10.8) 97 (6) - - -
Pasadena/ Deer Park 114 22,121 0.90 6.2 92 (81) 372 - -
Friendswood/ Pearland 30 5,909 1.31 9.6 90 (44) - 368 729
Clear Lake 98 24,936 1.16 9.8 94 (86) 347 - 350
Baytown 52 9,397 0.94 10.3 93 65 283 - 240
Galveston/ Brazoria 134 20,709 0.95 8.5 91 (89) 308 - -
TOTALS 588 119,094 1.02 6.6 92 (676) 2,108 368 1,319
HOUSTON TOTAL 2,593 602,929 1.10 6.1 91 2,485 26,667 4,319 19,133
MARKETVIEW
RENTAL RATES
Although Houston rents remained stable this quarter at $1.10 per sq. ft., overall rental rate growth has continued to see an increase of 6.6% year-over-year. The Montrose/Museum District submarket is recording the highest average rental rate in Houston at $1.82 per sq. ft., followed by the Inner Loop West/Greenway Plaza submarket at $1.81 per sq. ft. Shifting outside the central markets, Houston continues to see multifamily growth in the eastern submarkets. Gulfgate/Almeda Mall and Baytown are the two submarkets with exponential rent growth, 10.9% and 10.3% year-over-year, respectively. Contributing factors are the ongoing strength of Houston’s Ship Channel and the April 2016 opening of the Panama Canal. OCCUPANCY
Overall occupancy dropped 30 basis points (bps) to 91.1% in the third quarter. Leading the way again from last quarter, Class B occupancy recorded 94.2%, remaining above 93.0% for the last five quarters. This is where the shift in property class demand is happening. Whereas Class A occupancy rates dipped 20 bps to 84.3%, including properties in lease-up. With a continued tight home supply and an increased average price, up 3.7% year-over- year, multifamily occupancy should continue to remain above the 90% mark. Population and job growth will continue to impact the housing market in a positive light, mainly in the eastern sections of Houston. CONSTRUCTION
The number of units under construction remains a robust 26,667 in Q3 2015, an increase of 3,000 units from last quarter. The top three suburban markets with the most units under construction are West Memorial/Briar Forest, Katy/ Far West, and Conroe/Montgomery, totaling 6,357 units. The number of units delivered this quarter totals 4,319 units, bringing the year-to-date total to 14,129 units. Next year, estimated delivered construction will be similar to 2015, but taper off at the beginning of 2017.
Q3 2015 CBRE Research © 2015 CBRE, Inc. | 3
HOUSTON MULTIFAMILY
Figure 4: Rental Rates, Avg. Monthly
Figure 5: Occupancy Rate by Class
Source: CBRE Research, Apartment Data Services, Q3 2015.
Figure 6: Construction Activity and Net Absorption
Source: CBRE Research, Apartment Data Services, Q3 2015.
0.00
0.50
1.00
1.50
2.00
Q3 2014 Q4 2014 Q1 2015 Q2 2015 Q3 2015
$/SF
Class A Class B Class C
Class D Market Average
80
85
90
95
Q3 2014 Q4 2014 Q1 2015 Q2 2015 Q3 2015
%
Class A Class B Class C Class D Market Average
0
5
10
15
20
25
30
2008
2009
2010
2011
2012
2013
2014
2015
YTD
000’s Units
Under Construction Deliveries Net Absorption
MARKETVIEW
Q3 2015 CBRE Research © 2015 CBRE, Inc. | 4
HOUSTON MULTIFAMILY
EMPLOYMENT
Although Houston’s job growth numbers showed a loss in August, they were regained in September, with 6,400 jobs added and the forecast is that Houston will end the year in the black with a net new jobs total eclipsing 14,500 payrolls. However, despite some job losses in the energy sector, a significant increase in job growth was in the government sector with 21,200 jobs, followed by education and health with 6,000 jobs. The Texas Medical Center continues to be a major employer in the Houston area, with an estimate of 106,000 employees. The Houston Purchasing Managers Index for September lies at 47.6, a smidge below the neutral point of 50, which shows the Houston economy is slightly contracting.
Figure 8: Top 10 Key Transactions
0
2
4
6
8
10
2005
2006
2007
2008
2009
2010
2011
2012
2013
2014
2015
%
U.S. Texas Houston MSA
Figure 7: Unemployment Rates
Source: U.S. Bureau of Labor Statistics, September 2015.
Source: Real Capital Analytics, October 2015.
CAPITAL MARKETS
Q3 2015 Houston’s multifamily sales volume totaled $867 million, a 27% drop from Q2 2015 sales volume according to per Real Capital Analytics. The average price per unit in Q3 2015 is $82,420. On a national level, the multifamily average price per unit was 11.0% higher year-over-year, at $135,513 per unit for Q3 2015.
Name Address Units Submarket
1 The Palms on Westheimer 6425 Westheimer Rd 798 Galleria
2 Villages at Meyerland 8900 Chimney Rock Rd 714 Braeswood/Fondren SW
3 Monte Carlo 10950 Briar Forest 592 West Memorial/ Briar Forest
4 Boardwalk at Town Center 2203 Riva Row 450 Woodlands/Far North
5 El Sol Del Rio 14405 Rio Bonito Rd 424 Alief
6 Mira Bella 22921 Imperial Valley Dr 394 FM 1960 East/ IAH Airport
7 Reserve at Windmill Lakes 9988 Windmill Lakes Blvd 392 Gulfgate/ Almeda Mall
8 IMT Uptown Post Oak 1111 Post Oak Blvd 392 Galleria
9 Westmount at Summer Cove 725 FM 1959 376 Clear Lake
10 Parkside Grand Parkway 1226 W Grand Pkwy S 354 Katy/ Far West
The Houston-The Woodlands- Sugar Land MSA added 6,400 jobs in September, with a year-over-year growth of 36,200 jobs.
MARKETVIEW
Disclaimer: Information contained herein, including projections, has been obtained from sources believed to be reliable. While we do not doubt its accuracy, we have not verified it and make no guarantee, warranty or representation about it. It is your responsibility to confirm independently its accuracy and completeness. This information is presented exclusively for use by CBRE clients and professionals and all rights to the material are reserved and cannot be reproduced without prior written permission of CBRE.
CONTACTS
Robert C. Kramp Director, Research & Analysis – South Central U.S. [email protected] E. Michelle Miller Research Operations Manager [email protected]
Kindell Villarreal Researcher +1 713 577 1894 [email protected]
CBRE OFFICES
CBRE Houston 2800 Post Oak Blvd, Suite 2300 Houston, TX 77056
To learn more about CBRE Research, or to access additional research reports, please visit the Global Research Gateway at www.cbre.com/researchgateway.
HOUSTON MULTIFAMILY
CENTRAL SOUTHWEST NORTHWEST NORTHEAST SOUTHEAST
C1 Montrose/ Museum District SW1 Galleria NW1 Brookhollow NE1 Northshore/ Wood Forest SE1 Hwy 288/ South
C2 Inner Loop West/ Greenway Plaza SW2 Woodlake/ Westheimer NW2 Spring Branch NE2 Eastex Frwy/ Near Northeast SE2 Gulfgate/ Almeda Mall
C3 Medical Center/ Bellaire SW3 West Memorial/ Briar Forest NW3 Inwood/ Northwest NE3 Northline/ Aldine SE3 Galena Park/ Jacinto City
C4 Heights SW4 Westchase NW4 FM 1960 West/ Champions NE4 Greenspoint SE4 Pasadena/ Deer Park
C5 Inner Loop East SW5 Alief NW5 FM 1960 West/ Steeplechase NE5 FM 1960 East/ IAH Airport SE5 Friendswood/ Pearland
SW6 Sharpstown/ Westwood NW6 Bear Creek/ Copperfield NE6 Lake Houston/ Kingwood SE6 Clear Lake
SW7 Gulfton/ Bissonnet NW7 Katy/Far West NE7 Far East SE7 Baytown
SW8 Braeswood/ Fondren SW NW8 Tomball/ Far Northwest SE8 Galveston/ Brazoria
SW9 Almeda/ South Main NW9 Woodlands/ Far North
SW10 Fort Bend NW10 Conroe/ Montgomery
SW11 Richmond/ Rosenberg
MARKETVIEW
Houston CBD multifamily pipeline will light up the skyline
Houston Multifamily, Q2 2015
Q2 2015 CBRE Research © 2015 CBRE, Inc. | 1
*Arrows indicate change from previous quarter.
Figure 1: Net Absorption and Occupancy Rate
Source: CBRE Research, Apartment Data Services, Q2 2015.
CRUDE: UP, DOWN OR SIDEWAYS
Crude oil prices stabilized throughout the second quarter,
after bottoming out below $50 in March. The Federal
Reserve Bank of Dallas reports the West Texas Intermediate
price is 40% lower than last year and recent fluctuations
could spawn energy job cuts overseas. However, lower oil
prices fuel the thriving downstream sector which will
continue to boost east Houston, specifically Baytown.
However, despite some job losses in the energy sector,
Houston has created 41,400 jobs (not seasonally adjusted)
in 2015. Stable employment coupled with growing home
prices and a static single family supply benefit the Houston
multifamily market. The month of June saw an increase in
home sales, but this will not deter the multifamily market.
As home prices increase, some consumers may struggle
with housing affordability and as a result they turn to
apartment living.
86
88
90
92
94
96
0
500
1,000
1,500
2,000
Central Southwest Northwest Northeast Southeast
Occupancy Rate (%)
Absorption (Units)
Q2 2015 Occupancy Rate
Total Occupancy91.4%
Avg. Rental Rate$1.10 PSF
Net Absorption4,875 Units
CompletionsUnder Construction
23,776 Units 5,628 Units
DOWNTOWN LIVING
The Houston CBD pipeline is a major indicator of how
the multifamily sector is performing. According to the
Downtown District, there are nine multifamily
properties under construction, which will add roughly
2,700 units to the existing 8,424 units in the Inner
Loop East submarket.
The growth of new developments in the CBD was
spurred by the fact that there are 150,000 daytime
employees in downtown, but also by the Downtown
Living Initiative (TIRZ #3) agreement. Developers were
provided a tax abatement of $15,000 per unit built to
make projects more feasible.
DEVELOPMENT STAYING ON TRACK
Labor and construction material costs are on the rise,
up 0.1% from May 2015 to June 2015, and 0.4%
since March 2015. Is this slowing down development?
Development will not slow down due to costs as
multifamily construction is peaking, and will begin to
decline over the next year naturally as fewer projects
are being capitalized. There are 23,776 units
currently under construction, and 9,810 units have
delivered year-to-date. The Houston market is
estimated to deliver 24,000 units in 2015.
Future development is following suit along the
recently opened sections of the Grand Parkway.
Opportunity arises for single-family, multifamily and
retail developments. Sections of the Grand Parkway
opening later this year will connect Hwy 249 to I-
45N, and I-45N to Hwy 59N. The increased
connectivity in these suburban areas will continue to
spur new multifamily opportunities, as the case has
been for the urban markets in the last few years.
Due to Houston’s rapid population growth,the multifamily market has added onaverage, 10,000 units per year since 2005.
MARKETVIEW
SubmarketPropertyCount
UnitCount
Rental Rate($/SF/Mth)
Rental Rate Growth (%)
Y-o-Y*
Occupancy Rate(%)
Net Absorption
Units
Under Construction
Units
Delivered Construction
Units
Proposed Construction
UnitsCENTRAL
Montrose/ Museum District 53 13,569 1.82 1.2 92.2 264 3,537 396 1,690 Inner Loop West/ Greenway Plaza 64 16,361 1.80 0.6 82.4 518 1,315 - 1,216 Medical Center/ Bellaire 72 21,080 1.50 2.6 92.1 12 1,707 - 670 Heights 22 4,132 1.80 4.2 82.3 150 1,594 - 664 Inner Loop East 56 8,424 1.29 5.3 92.9 63 2,289 - 3,063 TOTALS 267 63,566 1.64 2.8 88.4 1,007 10,442 396 7,303
SOUTHWESTGalleria 100 23,916 1.46 4.4 90.4 276 1,248 262 976 Woodlake/ Westheimer 38 11,917 1.12 3.4 91.9 115 714 - -West Memorial/ Briar Forest 87 26,780 1.21 2.9 86.8 395 2,830 333 1,170 Westchase 49 14,357 1.14 6.7 91.8 16 566 - -Alief 112 27,276 0.94 7.4 94 2 - - -Sharpstown/ Westwood 106 25,536 0.82 8.2 92.3 197 - 122 -Gulfton/ Bissonnet 58 16,900 0.87 4.5 95.4 42 - - -Braeswood/ Fondren SW 84 21,937 0.83 5.5 88.9 (217) - - -Almeda/ South Main 22 4,280 0.95 6.3 93.9 (35) - - -Fort Bend 51 13,520 1.24 1.7 88.2 302 77 464 1,382 Richmond/ Rosenberg 28 4,536 1.06 7.0 94.8 2 - - -TOTALS 735 190,955 1.06 5.3 91.7 1,095 5,435 1,181 3,528
NORTHWEST Brookhollow 92 20,302 0.96 5.3 93.6 64 634 - 330 Spring Branch 95 18,313 0.90 5.1 94.1 50 573 - 281 Inwood/ Northwest 40 7,383 0.84 4.9 95.3 45 - - -FM 1960 West/ Champions 153 37,600 0.97 7.1 92.5 51 - 288 539 FM 1960 West/ Steeplechase 73 19,323 1.08 4.4 95.2 230 - - 353 Bear Creek/ Copperfield 50 13,573 1.14 8.0 90.1 (57) 260 342 250 Katy/Far West 76 21,016 1.20 2.1 77.7 333 1,883 1,917 1,893 Tomball/ Far Northwest 26 5,511 1.22 2.1 77.4 446 540 384 1,604 Woodlands/ Far North 55 16,497 1.26 2.5 86.4 664 660 698 1,666 Conroe/ Montgomery 44 7,598 0.96 2.1 93.6 19 708 - 300 TOTALS 704 167,116 1.05 4.4 89.6 1,845 5,258 3,629 7,216
NORTHEAST Northshore/ Wood Forest 40 8,646 0.90 6.3 92.1 (27) - - -Eastex Frwy/ Near Northeast 30 5,503 0.84 3.3 95.0 6 - - -Northline/ Aldine 61 9,944 0.80 5.8 94.4 (11) - - -Greenspoint 37 9,473 0.80 4.8 93.4 98 - - -FM 1960 East/ IAH Airport 47 8,930 0.95 8.0 92.1 4 306 - -Lake Houston/ Kingwood 45 11,446 1.14 8.1 93.7 24 - 264 591 Far East 29 4,833 0.86 4.0 88.7 18 - 80 -TOTALS 289 58,775 0.90 5.8 92.8 112 306 344 591
SOUTHEAST Hwy 288/ South 58 13,192 1.06 4.4 92.9 207 880 - 300 Gulfgate/ Almeda Mall 97 22,083 0.90 8.9 95.1 69 - 78 -Galena Park/ Jacinto City 3 362 0.85 (3.1) 98.9 10 - - -Pasadena/ Deer Park 113 21,858 0.89 5.7 93.3 104 180 - 264 Friendswood/ Pearland 29 5,541 1.10 6.0 96.8 27 476 - 729 Clear Lake 97 24,520 1.13 7.5 95.5 232 416 - 347 Baytown 52 9,397 0.94 12.9 92.2 (42) - - -Galveston/ Brazoria 134 20,709 0.85 8.3 92.1 209 383 - -TOTALS 583 117,662 0.96 6.3 94.6 816 2,335 78 1,640 HOUSTON TOTAL 2,578 598,074 1.10 5.5 91.4 4,875 23,776 5,628 20,278
Q2 2015 CBRE Research © 2015 CBRE, Inc. | 2
HOUSTON MULTIFAMILY
Source: CBRE Research, Apartment Data Services, Q2 2015.
Figure 2: Key Indicators
*Annualized
MARKETVIEW
RENTAL RATES
Houston rental rates rose a very strong 6.8% from
this time last year and are up 2.5% since Q1 2015.
The Baytown and Friendswood/Pearland
submarkets continue to follow the pace that the
central submarkets have been seeing. Class A
properties are at a going rate of $1.31 per. sq. ft. in
Baytown, a rise from $1.28 per sq. ft. in Q1 2015,
and $1.25 per sq. ft. in Q4 2014.
Where Friendswood/Pearland Class A rents are
continuing upwards at $1.32 per sq. ft. for Q2 2015,
and have grown from $1.29 per sq. ft. in Q1 2015,
and $1.25 per sq. ft. in Q4 2014. The rise in demand
and rental rates for Class A properties is due in part
to the expansion of the Grand Parkway, but the
focus on multifamily is slowly shifting towards the
eastern suburban markets, and away from the west
and central area markets. The growth of Houston’s
Ship Channel and the future opening of the Panama
Canal in April 2016 are two contributing factors.
OCCUPANCY
Houston’s overall occupancy continues to hold
strong with occupancy at 91.4% in the second
quarter, an increase of 30 basis points (bps) quarter-
over-quarter. Class B occupancy rates continue to
dominate at 94.7%, whereas Class A occupancy
rates are steady at 84.5%, including properties in
lease-up.
Home prices are increasing, which may not be
affordable to some consumers who are choosing
not to own. As a result, they turn to apartment living.
The month of June saw a 4.1% increase in home
sales year-over-year, but this will not deter the
multifamily market from gaining renters.
CONSTRUCTION
The number of units under construction remains a
robust 23,776 in Q2 2015, slightly down from
25,766 in Q1 2015,. The Montrose/Museum District
submarket leads the urban submarkets with 3,537
units currently under construction, and the West
Memorial/Briar Forest submarket tops the suburban
submarkets with 2,830 units under construction.
Units delivered this quarter totaled 5,628, a 34.6%
bump from Q1 2015 deliveries.
Q2 2015 CBRE Research © 2015 CBRE, Inc. | 3
HOUSTON MULTIFAMILY
Figure 3: Rental Rates, Avg. Monthly
Figure 4: Occupancy Rate by Class
Source: CBRE Research, Apartment Data Services, Q2 2015.
Figure 5: Construction Activity and Net Absorption
Source: CBRE Research, Apartment Data Services, Q2 2015.
0.50
1.00
1.50
Q2 2014 Q3 2014 Q4 2014 Q1 2015 Q2 2015
$/SF
Class A Class B Class CClass D Market Average
8082848688909294
Q2 2014 Q3 2014 Q4 2014 Q1 2015 Q2 2015
%
Class A Class B Class CClass D Market Average
0
5
10
15
20
25
30
2007
2008
2009
2010
2011
2012
2013
2014
2015
YTD
000’s Units
Under Construction Deliveries Net Absorption
The Katy/Far West submarket delivered 1,917
units, the most of the suburban submarkets. The
Montrose/Museum District submarket added 396
units, the largest of the central submarkets.
MARKETVIEW
Q2 2015 CBRE Research © 2015 CBRE, Inc. | 4
HOUSTON MULTIFAMILY
EMPLOYMENT
The Greater Houston Partnership has revised
their expected job growth from 62,900, to
20,000-30,000 new payrolls. Yet, the Houston
MSA unemployment picture continues to
outshine the national economy. Since 2008,
Houston continues to show a low unemployment
rate at 4.5%. The Texas and U.S.
unemployment rates have remained steady at
4.4% and 5.5%, respectively.
The healthcare sector has played a significant
role in the growth of the Houston MSA,
especially with the continued growth of the
Texas Medical Center. Additionally, the ongoing
investment in the improvement of the Houston
Ship Channel is critical to ensure this region
continues to capture its share of economic
prosperity delivered because of maritime
commerce.
Figure 7: Key Transactions
0
2
4
6
8
10
2002
2003
2004
2005
2006
2007
2008
2009
2010
2011
2012
2013
2014
2015
%
U.S. Texas Houston MSA
Figure 6: Unemployment Rates
Source: U.S. Bureau of Labor Statistics, May 2015.
Source: Real Capital Analytics, July 2015.
CAPITAL MARKETS
Per Real Capital Analytics, Q2 2015 Houston’s
multifamily sales volume totaled a phenomenal
$1.19 billion. With an inventory of 16,999 units,
spread amongst 52 properties, the average
price per unit was $82,478. On a national level,
the multifamily average price per unit was
significantly higher than Houston's, at $127,391
per unit for Q2 2015.
Name Address Units Submarket
1 Broadway Square 8751 Broadway Blvd 2,469 Gulfgate/Almeda Mall
2 El Sol Brillante 6403 Sierra Blanca Dr 792 Alief
3 Baybrook Village I & II 2702 W Bay Area Blvd 776 Friendswood/Pearland
4 Morgan West Oaks 2400 Briarwest Blvd 671 West Memorial/Briar Forest
5 Renaissance Village at Shadow Lake 2920 Shadowbriar Dr 624 Alief
6 Braesridge 11100 Braesridge Dr 542 Braeswood/Fondren SW
7 Preserve at Colony Lakes 1000 Farrah Lane 420 Ft. Bend
8 The Mandolin 10325 Cypresswood Dr 384 FM 1960 West/Steeplechase
9 Casa Verde 2 Goodson Dr 384 Northline/Aldine
10 Broadstone Post Oak 3100 Post Oak Blvd 272 Galleria
The Houston-The Woodlands- Sugar Land MSA added 4,300 jobs in June, with a year-over-year growth of 55,700 jobs.
The Houston market sold a staggering $5.58 billion in multifamily assets for the rolling 12 month total in Q2 2015.
MARKETVIEW
Disclaimer: Information contained herein, including projections, has been obtained from sources believed to be reliable. While we do not doubt its accuracy, we have not verified it and make no guarantee, warranty or representation about it. It is your responsibility to confirm independently its accuracy and completeness. This information is presented exclusively for use by CBRE clients and professionals and all rights to the material are reserved and cannot be reproduced without prior written permission of CBRE.
CONTACTS
Robert C. KrampDirector, Research & Analysis –South Central [email protected]
E. Michelle MillerResearch Operations [email protected]
Kindell Villarreal
Researcher
+1 713 577 1894
CBRE OFFICES
CBRE Houston
2800 Post Oak Blvd, Suite 2300
Houston, TX 77056
To learn more about CBRE
Research,
or to access additional research
reports, please visit the Global
Research Gateway at
www.cbre.com/researchgateway.
HOUSTON MULTIFAMILY
CENTRAL SOUTHWEST NORTHWEST NORTHEAST SOUTHEAST
C1 Montrose/ Museum District SW1 Galleria NW1 Brookhollow NE1 Northshore/ Wood Forest SE1 Hwy 288/ South
C2 Inner Loop West/ Greenway Plaza SW2 Woodlake/ Westheimer NW2 Spring Branch NE2 Eastex Frwy/ Near Northeast SE2 Gulfgate/ Almeda Mall
C3 Medical Center/ Bellaire SW3 West Memorial/ Briar Forest NW3 Inwood/ Northwest NE3 Northline/ Aldine SE3 Galena Park/ Jacinto City
C4 Heights SW4 Westchase NW4 FM 1960 West/ Champions NE4 Greenspoint SE4 Pasadena/ Deer Park
C5 Inner Loop East SW5 Alief NW5 FM 1960 West/ Steeplechase NE5 FM 1960 East/ IAH Airport SE5 Friendswood/ Pearland
SW6 Sharpstown/ Westwood NW6 Bear Creek/ Copperfield NE6 Lake Houston/ Kingwood SE6 Clear Lake
SW7 Gulfton/ Bissonnet NW7 Katy/Far West NE7 Far East SE7 Baytown
SW8 Braeswood/ Fondren SW NW8 Tomball/ Far Northwest SE8 Galveston/ Brazoria
SW9 Almeda/ South Main NW9 Woodlands/ Far North
SW10 Fort Bend NW10 Conroe/ Montgomery
SW11 Richmond/ Rosenberg
MARKETVIEW
Multifamily ends 2014 with a bang
Houston Multifamily, Q4 2014
OVERVIEW
Houston’s overall occupancy rate returned to its peak of 91.1% in Q4 2014, which was last achieved in Q3 2013. Rental rates remained at a record high of $1.05 per sq. ft.
Houston’s net absorption dropped from 3,655 units in Q3 2014, to 1,483 units absorbed this quarter. This brings 2014 year-end to a total of 16,084 units absorbed, only slightly down from 2013 when 16,412 units were absorbed.
Q4 2014 CBRE Research © 2015 CBRE, Inc. | 1
*Arrows indicate change from previous quarter.
Figure 1: Net Absorption and Occupancy Rate
Source: CBRE Research, Apartment Data Services, Q4 2014.
Supported by rapid population growth, Houston’s
multifamily market has been a major highlight of 2014.
Also notable was the amount of jobs created in the
Houston Market, totaling 122,900 over the 12 months
ending October 2014.
Net absorption is positive for the eighth consecutive
quarter and ended 2014 with a total of 16,084 units
absorbed.
Multifamily construction permits increased by 65% from
a year ago.
84
86
88
90
92
94
(1)
0
1
2
3
4
5
6
7
Centr
al
South
west
North
west
North
east
South
east
Occupancy Rate (%)Absorption (000’s Units)
Q1 Q2 Q3 Q4 2014 Total Units Absorbed Occupancy Rate
Total Occupancy91.1%
Avg. Rent Rate1.05 $/SF
Net Absorption1,483 Units
CompletionsUnder Construction
26,630 Units 3,814 Units
MARKETVIEW
Q4 2014 CBRE Research © 2015 CBRE, Inc. | 2
HOUSTON MULTIFAMILY
Source: CBRE Research, Apartment Data Services, Q4 2014.
Figure 2: Key Indicators
SubmarketProperty
CountUnit
Count
Avg. Rent Rate
($/SF/Mth)
Rental Rate Growth
Y-o-Y (%)
Occupancy Rate(%)
NetAbsorption
Units
Under Construction
Units
Delivered Construction
Units
Proposed Construction
UnitsCENTRAL
Montrose/ Museum District 52 13,344 1.77 3.2 90.5 248 3,476 - 1,268 Inner Loop West/ Greenway Plaza 65 15,826 1.74 8.3 80.6 178 2,011 1,093 1,202 Medical Center/ Bellaire 70 20,516 1.44 3.9 93.9 (76) 1,616 - 1,549 Heights 20 3,744 1.66 (0.6) 85.3 100 1,663 - 664 Inner Loop East 56 8,424 1.25 4.9 91.7 50 2,015 - 2,531 TOTALS 263 61,854 1.57 3.9 88.4 500 10,781 1,093 7,214
SOUTHWESTGalleria 101 23,463 1.43 6.7 90.5 (59) 1,791 355 556 Woodlake/ Westheimer 37 11,989 1.13 12.1 91.5 146 714 276 -West Memorial/ Briar Forest 84 25,775 1.17 9.2 87.8 306 3,758 464 1,170 Westchase 48 14,092 1.11 8.8 92.2 (250) 828 - -Alief 113 27,276 0.91 10.9 93.7 (144) - - -Sharpstown/ Westwood 105 25,194 0.78 7.9 91.2 151 - - -Gulfton/ Bissonnet 58 16,901 0.83 3.2 95.1 7 - - -Braeswood/ Fondren SW 84 21,937 0.80 9.1 89.2 (13) - - -Almeda/ South Main 22 4,280 0.90 4.8 94.5 8 - - -Fort Bend 49 13,056 1.20 9.5 87.3 55 850 249 720 Richmond/ Rosenberg 28 4,536 1.02 6.7 93.8 2 - - -TOTALS 729 188,499 1.02 8.1 91.5 209 7,941 1,344 2,446
NORTHWEST Brookhollow 93 20,432 0.92 8.0 92.3 (86) 240 - 330 Spring Branch 98 18,466 0.88 6.8 92.8 (235) 573 - -Inwood/ Northwest 39 7,256 0.82 5.5 94.6 63 - - -FM 1960 West/ Champions 152 37,294 0.93 6.1 92.6 181 384 - 539 FM 1960 West/ Steeplechase 73 19,332 1.07 8.7 93.1 88 - - 260 Bear Creek/ Copperfield 48 13,021 1.08 8.4 94.8 (61) 342 - 250 Katy/Far West 69 18,332 1.20 7.6 86.6 140 2,859 502 2,125 Tomball/ Far Northwest 25 5,127 1.20 7.8 69.0 274 180 396 568 Woodlands/ Far North 53 15,799 1.21 6.9 83.9 248 869 341 1,939 Conroe/ Montgomery 44 7,598 0.95 4.7 92.5 12 380 300 TOTALS 694 162,657 1.02 7.1 89.2 624 5,827 1,239 6,311
NORTHEAST Northshore/ Wood Forest 40 8,646 0.86 4.0 91.1 (5) - - -Eastex Frwy/ Near Northeast 30 5,503 0.82 5.6 95.0 44 - - -Northline/ Aldine 61 9,956 0.78 5.9 94.1 (41) - - -Greenspoint 37 9,473 0.77 10.1 89.1 (17) - - -FM 1960 East/ IAH Airport 46 8,600 0.90 8.0 94.6 79 306 - 330 Lake Houston/ Kingwood 45 11,586 1.10 9.2 93.7 (135) 264 - 264 Far East 28 4,743 0.85 2.3 89.2 41 80 138 -TOTALS 287 58,507 0.87 6.4 92.4 (34) 650 138 594
SOUTHEAST Hwy 288/ South 58 13,216 1.00 5.9 89.6 78 382 - 222 Gulfgate/ Almeda Mall 95 21,956 0.84 8.5 94 (4) 78 - -Galena Park/ Jacinto City 3 362 0.97 10.9 96.4 (7) - - -Pasadena/ Deer Park 113 21,862 0.86 7.9 91.9 (11) 180 - 264 Friendswood/ Pearland 29 5,541 1.04 5.4 95.8 22 476 - 729 Clear Lake 97 24,520 1.08 7.9 93.7 (16) - - 763 Baytown 51 9,157 0.89 9.4 92.5 74 240 - -Galveston/ Brazoria 134 20,715 0.90 8.6 89.9 48 75 - 238 TOTALS 580 117,329 0.94 8.1 93.0 184 1,431 - 2,216
HOUSTON TOTAL 2,553 588,846 1.05 8.1 91.1 1,483 26,630 3,814 18,781
MARKETVIEW
RENTAL RATES
Although Houston’s overall rental rate remained at a record level of $1.05 per sq. ft, Class A rental rates decreased because of properties in lease-up. The Central submarkets average rates are still the highest in the Houston metro area, ranging from $1.25- $1.77 per sq. ft. Inner Loop East has the highest Class A rental rate at $1.89 per sq. ft.
OCCUPANCY
Houston’s overall occupancy increased by 10 basis points (bps) from the previous quarter. Class A and Class B rates are up from 82.8% and 93.3% in Q3 2014, to 86.4% and 94.4% for Q4 2014, respectively. On a geographic basis, occupancy was the highest at 93.0% in the Southeast submarkets, while the lowest occupancy rate was 88.4% in the Central submarkets. Renters will notice the positive side of lower occupancy rates in Class A product, seeing moderating rent growth and an increase in concessions. Additionally, this will allow Class A product to catch up with Class B and Class C occupancy rates.
CONSTRUCTION
The number of units under construction increased from 24,562 in Q3 2014, to 26,630 in Q4 2014. The West Memorial/Briar Forest submarket leads the way with 3,758 units currently under construction.
Delivered units for Q4 2014 totaled 3,814, bringing 2014 to a grand total of 17,628 units completed. Inner Loop West/Greenway Plaza had 1,093 units delivered in Q4 2014. Multifamily permit activity continues to stay strong, and Houston will continue to see a steady number of deliveries throughout 2015.
Q4 2014 CBRE Research © 2015 CBRE, Inc. | 3
HOUSTON MULTIFAMILY
Figure 3: Rent Rates, Avg. Monthly
Figure 4: Occupancy Rate by Class
Source: CBRE Research, Apartment Data Services, Q4 2014.
Figure 5: Construction Activity and Net Absorption
Source: CBRE Research, Apartment Data Services, Q4 2014.
0.50
0.70
0.90
1.10
1.30
1.50
1.70
Q4 2013 Q1 2014 Q2 2014 Q3 2014 Q4 2014
$/SF
Class A Class B Class C Class D Market Average
80
82
84
86
88
90
92
94
96
Q4 2013 Q1 2014 Q2 2014 Q3 2014 Q4 2014
%
Class A Class B Class C Class D Market Average
0
5
10
15
20
25
30
2007
2008
2009
2010
2011
2012
2013
2014
000’s Units
Under Construction MF Permit ActivityDeliveries Net Absorption
MARKETVIEW
Q4 2014 CBRE Research © 2015 CBRE, Inc. | 4
HOUSTON MULTIFAMILY
Name Address Units Submarket
1 Trails at Dominion Park 200 Dominion Park 843 FM 1960 West/Champions
2 Village in the Woods 11800 Grant Road 530 FM 1960 West/Steeplechase
3 Villas at Hermann Park 6301 Almeda 320 Medical Center/Bellaire
4 Township Apartments 401 S. Bender Avenue 300 FM 1960 East/IAH Airport
5 Oaks of Cypress Station 1000 Cypress Station Drive 294 FM 1960 West/Champions
6 Alta Heights 145 Heights Blvd 256 Inner Loop West/Greenway Plaza
7 San Melia Apartments 6383 El Mundo Street 252 Medical Center/Bellaire
8 Parque Del Oro Apartments 8380 El Mundo Street 224 Medical Center/Bellaire
9 Versailles Park Apartments 7200 Almeda 224 Medical Center/Bellaire
10 Mirage Apartments 2100 Bering Drive 200 Galleria
The Houston MSA unemployment rate continues to drop, and has reached a new low of 4.9%. The Texas and U.S. unemployment rates have dropped as well to 5.1% and 5.8%, respectively. These are the lowest rates we have seen since 2009.
Houston is diversified and prepared to handle a drop in oil prices. The market has experienced tremendous absorption, job growth and rent growth in recent years, at a pace that is not
Rank Submarkets % of Mkt Absorbed Rent Rate Growth (last 3 months) (%)
1 Woodlake/Westheimer 1.2 6.02 Baytown 0.8 13.43 Far East 0.9 9.14 Inwood/Northwest 0.9 4.95 Inner Loop East 0.6 7.6
Figure 7: Hottest Submarkets
Figure 8: Key Transactions
0
2
4
6
8
10
2000
2001
2002
2003
2004
2005
2006
2007
2008
2009
2010
2011
2012
2013
2014
%
US Texas Houston MSA
Figure 6: Unemployment Rates
Source: Apartment Data Services, January 2015.
Source: U.S. Bureau of Labor Statistics, December 2014.
maintainable in the long-term. The recent decrease in oil prices may slow down future developments, especially in the multifamily sector.
Despite the drop in oil prices, Houston’s economy is poised for modest growth with support from healthcare, downstream energy, and business/consumer services to support a growing population.
MARKETVIEW
Disclaimer: Information contained herein, including projections, has been obtained from sources believed to be reliable. While we do not doubt its accuracy, we have not verified it and make no guarantee, warranty or representation about it. It is your responsibility to confirm independently its accuracy and completeness. This information is presented exclusively for use by CBRE clients and professionals and all rights to the material are reserved and cannot be reproduced without prior written permission of CBRE.
CONTACTS
Lynn CirilloResearch Operations [email protected]
Kindell VillarrealResearcher713 577 [email protected]
CBRE OFFICES
CBRE Houston 2800 Post Oak Blvd, Suite 2300Houston, TX 77056
To learn more about CBRE Research,or to access additional research reports, please visit the Global Research Gateway atwww.cbre.com/researchgateway.
HOUSTON MULTIFAMILY
CENTRAL SOUTHWEST NORTHWEST NORTHEAST SOUTHEAST
C1 Montrose/ Museum District SW1 Galleria NW1 Brookhollow NE1 Northshore/ Wood Forest SE1 Hwy 288/ South
C2 Inner Loop West/ Greenway Plaza SW2 Woodlake/ Westheimer NW2 Spring Branch NE2 Eastex Frwy/ Near Northeast SE2 Gulfgate/ Almeda Mall
C3 Medical Center/ Bellaire SW3 West Memorial/ Briar Forest NW3 Inwood/ Northwest NE3 Northline/ Aldine SE3 Galena Park/ Jacinto City
C4 Heights SW4 Westchase NW4 FM 1960 West/ Champions NE4 Greenspoint SE4 Pasadena/ Deer Park
C5 Inner Loop East SW5 Alief NW5 FM 1960 West/ Steeplechase NE5 FM 1960 East/ IAH Airport SE5 Friendswood/ Pearland
SW6 Sharpstown/ Westwood NW6 Bear Creek/ Copperfield NE6 Lake Houston/ Kingwood SE6 Clear Lake
SW7 Gulfton/ Bissonnet NW7 Katy/Far West NE7 Far East SE7 Baytown
SW8 Braeswood/ Fondren SW NW8 Tomball/ Far Northwest SE8 Galveston/ Brazoria
SW9 Almeda/ South Main NW9 Woodlands/ Far North
SW10 Fort Bend NW10 Conroe/ Montgomery
SW11 Richmond/ Rosenberg
CBRE Global Research and Consulting
Houston MultifamilyMarketView Q3 2014
NET ABSORPTION WAS POSITIVE FOR THE SEVENTH CONSECUTIVE QUARTERHouston multifamily market fundamentals continued their positive trend in the third quarter of 2014, with occupancy remaining steady. Apartment demand continued to increase in the third quarter due to Houston’s growing job market and population. Net absorption for Q3 2014 totaled 3,539 units, which keeps 2014 on pace with 2013, during which Houston had 16,189 units of net absorption for the calendar year.
OCCUPANCY REMAINS STEADY AT 91.0%Houston’s proposed and under construction projects show the ever expanding market is not slowing down, continuing to push the market upward while the occupancy rate remained steady at 91%. Houston’s suburban submarkets will continue to see an increase in construction as the central submarkets remain steady. Despite a large number of new deliveries expected in 2014, occupancy rates should remain steady or increase slightly in the central and suburban submarkets.
HIGHEST RENTS ACHIEVED Q3 2014 average rental rates have continued to push upward to an all-time high of $1.05 per sq. ft., from $1.03 per sq. ft. in Q2 2014. Rental rates in Houston are at an all-time high after a couple of years of rapid growth with a 7.8% year-over-year increase for Q3 2014. The $1.00 per sq. ft. barrier was passed in Q1 2014 for
RENTAL RATES CONTINUE STRONG GAINS
AVG. RENT$1.05 Per Sq. Ft.
NET ABSORPTION3,539 Units
UNDER CONSTRUCTION25,462 Units
DELIVERIES5,949 Units
PROPOSED CONSTRUCTION18,282 Units
TOTAL OCCUPANCY91.0%
Figure 1: Net Absorption and Occupancy Rate
Source: Apartment Data Services, October 2014. CBRE Research, Q3 2014.
the first time; rents have continued to increase with occupancy following in its path. New, Class A product in the Inner Loop East submarket is commanding high rental rates at $1.97 per sq. ft., and following close behind is the Montrose/Museum District submarket at $1.85 per sq. ft. With these high rental rates and more deliveries in the Inner Loop submarkets, occupancy is decreasing due to the low demand.
DELIVERED UNITS UP 11% FROM PREVIOUS QUARTER Multifamily construction activity remained strong in Q3 2014, delivering 5,949 apartment units to the market. This activity is up 11.0% from Q2 2014 when 3,722 units delivered. At the end of Q3 2014, 24,562 units remained under construction across the Houston metro area. Proposed construction in Houston reached 18,282 units in Q3 2014, a slight increase of 320 units more than in Q2 2014, significantly less than growth in recent years.
Directional arrows based on change from the previous quarter. Data reflects market totals.
86%
87%
88%
89%
90%
91%
92%
93%
94%
(1,000)
0
1,000
2,000
3,000
4,000
5,000
6,000
Central Southwest Northwest Northeast Southeast
Q1 Q2 Q3 2014 YTD Total Units Absorbed Occupancy Rate
© 2014, CBRE, Inc.
Hou
ston
Mu
ltifam
ily | MarketV
iewQ
3 2
014
2
Figure 2: Key Indicators
Submarket Property Count
Unit Count
Rents $/Sq. Ft./
Mth.
Occupancy %
Absorption Units
Under Construction
Units
Delivered Construction
Units
Proposed Construction
UnitsCentral
Montrose/ Museum District 54 13,434 1.77 87.8 260 3,476 763 1,268 Inner Loop West/ Greenway Plaza 66 15,881 1.79 79.4 392 2,158 780 904
Medical Center/ Bellaire 71 20,516 1.45 94.2 398 1,392 0 1,549 Heights 20 3,744 1.68 83.2 181 1,283 0 1,044
Inner Loop East 56 8,424 1.22 91.1 166 1,654 336 2,895 Central Total 267 61,999 1.58 87.1 1,397 9,963 1,879 7,660
SouthwestGalleria 101 23,463 1.42 90.8 220 1,791 0 556
Woodlake/ Westheimer 37 11,989 1.12 90.0 29 714 133 0 West Memorial/ Briar Forest 83 25,487 1.17 87.5 14 3,134 586 928
Westchase 48 14,092 1.11 94.0 (75) 562 0 268 Alief 113 27,276 0.89 94.3 142 0 0 0
Sharpstown/ Westwood 105 25,194 0.77 90.5 (89) 0 0 0 Gulfton/ Bissonnet 58 16,901 0.83 95.1 80 0 0 0
Braeswood/ Fondren SW 84 21,937 0.79 89.3 6 0 0 0 Almeda/ South Main 22 4,280 0.89 94.3 24 0 0 0
Fort Bend 47 12,577 1.21 89.7 87 1,329 843 720 Richmond/ Rosenberg 28 4,536 1.01 93.7 (5) 0 0 0
Southwest Total 726 187,732 1.02 91.7 433 7,530 1,562 2,472 Northwest
Brookhollow 94 20,492 0.91 92.8 122 0 0 240 Spring Branch 98 18,466 0.87 94.1 (30) 573 0 0
Inwood/ Northwest 39 7,256 0.81 93.7 21 0 0 0 FM 1960 West/ Champions 152 37,294 0.92 92.2 259 384 0 539
FM 1960 West/ Steeplechase 73 19,332 1.06 92.2 81 0 336 260 Bear Creek/ Copperfield 48 13,021 1.08 95.2 (56) 342 0 250
Katy/Far West 67 17,677 1.19 89.0 494 3,192 0 2,125 Tomball/ Far Northwest 25 5,131 1.21 63.4 382 180 746 568 Woodlands/ Far North 53 15,799 1.22 82.2 423 698 1,076 1,316 Conroe/ Montgomery 43 7,546 0.94 92.5 91 0 0 0
Northwest Total 692 162,014 1.02 88.7 1,787 5,369 2,158 5,298 Northeast
Northshore/ Wood Forest 40 8,646 0.84 91.1 (87) 0 0 0 Eastex Frwy/ Near Northeast 30 5,503 0.81 94.2 (20) 0 0 0
Northline/ Aldine 61 9,956 0.77 94.4 35 0 0 0 Greenspoint 37 9,473 0.78 89.3 (10) 0 0 0
FM 1960 East/ IAH Airport 46 8,600 0.90 93.7 47 0 0 636 Lake Houston/ Kingwood 45 11,588 1.10 94.9 (76) 264 0 264
Far East 28 4,743 0.83 88.4 0 80 0 0 Northeast Total 287 58,509 0.86 92.3 (111) 344 0 900
SoutheastHwy 288/ South 58 13,216 1.00 88.3 (38) 382 350 222
Gulfgate/ Almeda Mall 95 21,956 0.84 94.0 0 78 0 0 Galena Park/ Jacinto City 3 362 0.97 98.4 (3) 0 0 0
Pasadena/ Deer Park 113 21,862 0.85 92.0 (103) 180 0 0 Friendswood/ Pearland 29 5,541 1.04 95.4 (66) 476 0 729
Clear Lake 97 24,520 1.06 93.8 116 0 0 763 Baytown 51 9,158 0.86 91.8 42 240 0 0
Galveston/ Brazoria 134 20,715 0.89 89.7 85 0 0 238 Southeast Total 580 117,330 0.94 92.9 33 1,356 350 1,952
Houston Total 2,552 587,584 1.05 91.0 3,539 24,562 5,949 18,282
MULTIFAMILY THIRD QUARTERMARKETVIEW
Source: Apartment Data Services, October 2014. CBRE Research, Q3 2014.
© 2014, CBRE, Inc.
Hou
ston
Mu
ltifam
ily | MarketV
iewQ
3 2
014
3
MULTIFAMILY THIRD QUARTERMARKETVIEW
Source: Bureau of Labor Statistics, October 2014. CBRE Research, Q3 2014.
Source: Apartment Data Services, October 2014. CBRE Research, Q3 2014.
MULTIFAMILY RENTSOne major noticeable change happening in 2014, is the increasing rent growth in Houston’s suburban markets, and decreasing rent growth in the urban core. Houston rents continued their upward climb in Q3 2014, reaching $1.05 per sq. ft. for the first time. Overall rental rates increased 7.8% over the past 12 months, while Class A, B, C and D rental rates each increased 5.8%, 8.0%, 6.9% and 6.3% year-over-year, respectively. Leading the suburban submarkets in rent is the Woodlands/Far North submarket at $1.22 per. sq. ft., followed by the Tomball/Far Northwest and Fort Bend submarkets with rents at $1.21 per sq. ft. The highest overall Q2 2014 rents can be found in the Inner Loop West/Greenway Plaza submarket at $1.79 per sq. ft., led by the Montrose/Museum District submarket at $1.77 per sq. ft. and the Heights submarket at $1.68 per sq. ft. This is a decrease in rent from Q2 2014 for the Montrose/Museum District and Heights submarket by $0.02 and $0.03 respectively.
MULTIFAMILY OCCUPANCYThe Q3 2014 overall occupancy rate is 91%, which stands even from last quarter and 10 basis points decrease from Q3 2013. Occupancy in the suburban submarkets stands much higher than the urban submarkets due to the lower overall rental rates. For example, the Friendswood/Pearland submarket leads the way with a 95.4% occupancy rate, and the Bear Creek/Copperfield submarket follows closely behind with a 95.2% occupancy rate.
MULTIFAMILY CONSTRUCTIONThe number of units under construction increased from 23,722 in Q2 2014 up to 24,562 in Q3 2014. The Montrose/Museum submarket leads the Houston area with 3,476 units under construction, followed by the West Memorial/Briar Forest submarket with 3,134 units. These two submarkets combined total 26.9% of the market’s hottest areas for new development. Despite the amount under construction, the increasing demand for apartments is not keeping up with supply, which we are seeing higher rental rates and lower occupancy rates as a result.
UNEMPLOYMENTThe Houston economy continues to outshine the national economy. National unemployment dropped 10 basis points this quarter to 6.2%. In September 2014, the Texas unemployment rate fell to 5.1%, while Houston unemployment dropped to 5.0%. With the exceptional employment growth and population growth, we will continue to see an increase in apartment demand.
Figure 3: Average Rents, $/Sq. Ft./Mth.
Figure 4: Occupancy Rates by Class
Figure 5: Construction Activity and Net Absorption
Figure 6: Unemployment Rates
Source: Apartment Data Services, October 2014. CBRE Research, Q3 2014.
3%
4%
5%
6%
7%
8%
9%
10%
2000
2001
2002
2003
2004
2005
2006
2007
2008
2009
2010
2011
2012
2013
2014
US Texas Houston MSA
$0.50
$0.70
$0.90
$1.10
$1.30
$1.50
$1.70
Q3 2013 Q4 2013 Q1 2014 Q2 2014 Q3 2014
Class A Class B Class C Class D Market Average
80%
83%
86%
89%
92%
95%
Q3 2013 Q4 2013 Q1 2014 Q2 2014 Q3 2014
Class A Class B Class C Class D Market Average
3%
4%
5%
6%
7%
8%
9%
10%
2000
2001
2002
2003
2004
2005
2006
2007
2008
2009
2010
2011
2012
2013
2014
US Texas Houston MSA
0 2 4 6 8
10 12 14 16 18 20 22 24 26
2007 2008 2009 2010 2011 2012 2013 2014 YTD
Units
000'
s
Under Construction MF Permit Activity
© 2014, CBRE, Inc.
Hou
ston
Mu
ltifam
ily | MarketV
iewQ
3 2
014
4
CENTRAL SOUTHWEST NORTHWEST NORTHEAST SOUTHEASTC1 Montrose/Museum District SW1 Galleria NW1 Brookhollow NE1 Northshore/Wood Forest SE1 Hwy 288/South
C2 Inner Loop West/Greenway Plaza SW2 Woodlake/Westheimer NW2 Spring Branch NE2 Eastex Frwy/Near Northeast SE2 Gulfgate/Almeda Mall
C3 Medical Center/Bellaire SW3 West Memorial/Briar Forest NW3 Inwood/Northwest NE3 Northline/Aldine SE3 Galena Park/Jacinto City
C4 Heights SW4 Westchase NW4 FM 1960 West/Champions NE4 Greenspoint SE4 Pasadena/Deer Park
C5 Inner Loop East SW5 Alief NW5 FM 1960 West/Steeplechase NE5 FM 1960 East/IAH Airport SE5 Friendswood/Pearland
SW6 Sharpstown/Westwood NW6 Bear Creek/Copperfield NE6 Lake Houston/Kingwood SE6 Clear Lake
SW7 Gulfton/Bissonnet NW7 Katy/Far West NE7 Far East SE7 Baytown
SW8 Braeswood/Fondren SW NW8 Tomball/Far Northwest SE8 Galveston/Brazoria
SW9 Almeda/South Main NW9 Woodlands/Far North
SW10 Fort Bend NW10 Conroe/Montgomery
SW11 Richmond/Rosenberg
Lynn CirilloResearch Operations ManagerCBRE Americas Research2800 Post Oak, Suite 2300Houston, TX 77056 e: [email protected]
Kindell Villarreal ResearcherCBRE Houston Research2800 Post Oak, Suite 2300Houston, TX 77056t: +1 713 577 1894e: [email protected]
CONTACTSFor more information about this Houston Multifamily MarketView, please contact:
TEXAS RESEARCH
FOLLOW CBRE
GLOBAL RESEARCH AND CONSULTING This report was prepared by the CBRE U.S. Research Team which forms part of CBRE Global Research and Consulting – a network of preeminent researchers and consultants who collaborate to provide real estate market research, econometric forecasting and consulting solutions to real estate investors and occupiers around the globe. Additional U.S. research produced by Global Research and Consulting can be found at www.cbre.us/research.
DISCLAIMER
Information contained herein, including projections, has been obtained from sources believed to be reliable. While we do not doubt its accuracy, we
have not verified it and make no guarantee, warranty or representation about it. It is your responsibility to confirm independently its accuracy and
completeness. This information is presented exclusively for use by CBRE clients and professionals and all rights to the material are reserved and cannot be
reproduced without prior written permission of CBRE.
© 2014, CBRE, Inc.
CBRE Global Research and Consulting
Houston MultifamilyMarketView Q2 2014
Houston’s job and population growth continued to drive apartment demand. Rental rates and occupancy pushed upward as average rents reached $1.03 per sq. ft. for the first time ever in Houston and overall occupancy climbed to 91%. Net absorption for Q2 2014 totaled 5,221 units, which keeps 2014 on pace with 2012 and 2013, during which Houston averaged 16,300 units of net absorption per year.
Multifamily construction activity remained strong in Q2 2014 delivering 3,722 apartment units to the market. This was down slightly from Q1 2014 when 4,143 units delivered. At the end of Q2 2014, 23,722 units remained under construction across the Houston metro area.
In Houston’s CBD, several new projects are underway, spurred in part by the city’s Downtown Living Initiative, which offers developers a $15,000-per-unit subsidy for apartments built downtown. SkyHouse Houston, a 24-story, 336-unit complex recently broke ground in April. There are 880 units currently under construction in the Inner Loop East submarket, including 500 Crawford expected delivery in March 2015. Proposed construction in the CBD includes the Camden Downtown Towers and Market Square Tower with 560 units and 463 units, respectively. The city hopes to encourage downtown apartment development in order to increase population and revitalize the area.
Suburban development has steadily increased over the past few months in certain areas. Most notably, the West
HOUSTON APARTMENT MARKET STILL CLIMBING.
AVG. RENT$1.03 Per Sq. Ft.
NET ABSORPTION5,221 Units
UNDER CONSTRUCTION23,722 Units
DELIVERIES3,722 Units
PROPOSED CONSTRUCTION17,962 Units
TOTAL OCCUPANCY91.1%
Figure 1: Net Absorption and Occupancy
Source: Apartment Data Services, July 2014. CBRE Research, Q2 2014.
Memorial/Briar Forest submarket has experienced a continued increase in new projects and closed Q2 2014 with 3,374 units under construction. High levels of office development in the nearby Energy Corridor is driving the apartment development in West Memorial/Briar Forest. The Katy/Far West submarket follows with 2,820 units under construction. The Tomball/Far Northwest follows and Woodlands/Far North submarkets are also experiencing a boom in apartment construction driven primarily by the expansion of the Grand Parkway and the development of the ExxonMobil campus near Spring with a combined total of 1,969 units under construction. Adding to this boom is the start of phase one of CityPlace located just south of The Woodlands, which will expand the office market by 4 million sq. ft. when completed.
Q2 2014 average rental rates increased to $1.03 per sq. ft., from $1.00 per sq. ft. in Q1 2014. Rental rates in Houston are at an all time high after a couple of years of
rapid growth. Rental rates increased 7.6% year-over-year in Q2 2014, which is an increase of 90 basis points from Q1 2014’s year-over-year rental rates.
New, Class A product in the Montrose/Museum District submarket is commanding high rental rates at $1.89 per. sq. ft. Suburban submarkets have a lower trend, with rental rates as low as $1.36 per sq. ft. in the Katy/Far West submarket, and $1.29 in the Bear Creek/Copperfield submarket.
Houston’s proposed and under construction projects show the ever expanding market is not slowing down, and continues to push the market upward. Houston’s suburban submarkets will continue to see an increase in construction as the central submarkets remain at pace. Despite a large number of new deliveries expected in 2014, occupancy rates should remain steady or increase slightly in the central and suburban submarkets.
Directional arrows based on change from the previous quarter. Data reflects market totals.
86%
87%
88%
89%
90%
91%
92%
93%
94%
0
500
1,000
1,500
2,000
2,500
3,000
3,500
4,000
Central Southwest Northwest Northeast Southeast
Occupancy Rate Units Absorbed
Q1 Q2 2014 YTD Total Units Absorbed Occupancy
© 2014, CBRE, Inc.
Hou
ston
Mu
ltifam
ily | MarketV
iewQ
2 2
014
2
Figure 2: Key Indicators
Submarket Property Count
Unit Count
Rents $/Sq. Ft./
Mth.Occupancy Absorption
Units
Under Construction
Units
Delivered Construction
Units
Proposed Construction
UnitsCentral
Montrose/ Museum District 54 13,231 $1.80 87.0% 254 3,214 154 1,338 Inner Loop West/ Greenway Plaza 62 14,950 $1.75 81.9% 59 2,847 383 862
Medical Center/ Bellaire 71 20,516 $1.44 92.2% 66 1,136 281 550 Heights 21 3,804 $1.71 80.8% 190 634 0 1,604
Inner Loop East 56 8,424 $1.22 89.1% (17) 880 0 3,348 Central Total 264 60,925 $1.58 86.2% 552 8,711 818 7,702
SouthwestGalleria 99 22,870 $1.39 92.1% 234 1,994 272 640
Woodlake/ Westheimer 37 11,989 $1.11 89.8% 70 714 0 0 West Memorial/ Briar Forest 82 25,255 $1.17 87.9% 277 3,374 520 838
Westchase 48 14,092 $1.07 94.6% (1) 562 0 268 Alief 113 27,276 $0.87 93.7% 176 0 0 0
Sharpstown/ Westwood 105 25,194 $0.75 90.5% 238 0 0 0 Gulfton/ Bissonnet 57 16,877 $0.81 94.7% 273 0 0 0
Braeswood/ Fondren SW 84 21,937 $0.78 89.3% 192 0 0 0 Almeda/ South Main 22 4,280 $0.88 93.9% 19 0 0 0
Fort Bend 46 12,241 $1.21 91.5% 2 1,069 0 720 Richmond/ Rosenberg 28 4,536 $0.99 93.9% 60 0 0 0
Southwest Total 721 186,547 $1.00 92.0% 1,540 7,713 792 2,466 Northwest
Brookhollow 94 20,492 $0.91 91.5% 132 0 0 240 Spring Branch 98 18,465 $0.92 94.1% 176 573 0 0
Inwood/ Northwest 38 7,118 $0.80 93.3% 116 0 0 0 FM 1960 West/ Champions 152 37,293 $0.90 91.3% 362 0 0 239
FM 1960 West/ Steeplechase 73 19,332 $1.04 91.8% 272 384 162 300 Bear Creek/ Copperfield 48 13,021 $1.06 95.6% 61 342 0 250
Katy/Far West 66 17,192 $1.16 79.1% 417 2,820 370 2,099 Tomball/ Far Northwest 23 4,441 $1.19 63.7% 215 930 342 568 Woodlands/ Far North 53 15,458 $1.21 81.1% 100 1,039 1,238 1,116 Conroe/ Montgomery 43 7,424 $0.94 91.2% (19) 0 0 0
Northwest Total 688 160,236 $1.01 87.3% 1,832 6,088 2,112 4,812 Northeast
Northshore/ Wood Forest 40 8,646 $0.84 92.2% 170 0 0 0 Eastex Frwy/ Near Northeast 30 5,503 $0.82 94.6% 4 0 0 0
Northline/ Aldine 60 9,850 $0.76 94.0% 49 0 0 0 Greenspoint 37 9,473 $0.77 89.4% 77 0 0 0
FM 1960 East/ IAH Airport 46 8,600 $0.88 93.4% 83 0 0 636 Lake Houston/ Kingwood 45 11,588 $1.05 95.6% 117 264 0 514
Far East 27 4,605 $0.84 89.6% 18 248 0 0 Northeast Total 285 58,265 $0.85 92.7% 518 512 0 1,150
SoutheastHwy 288/ South 57 12,866 $0.98 91.1% 0 350 0 222
Gulfgate/ Almeda Mall 95 21,956 $0.82 93.8% (30) 0 0 0 Galena Park/ Jacinto City 3 362 $0.91 99.2% 1 0 0 0
Pasadena/ Deer Park 113 21,862 $0.83 92.5% 218 0 0 0 Friendswood/ Pearland 29 5,541 $1.04 96.6% 41 108 0 697
Clear Lake 97 24,520 $1.05 93.3% 54 0 0 763 Baytown 54 9,348 $0.82 91.2% 183 240 0 0
Galveston/ Brazoria 132 20,532 $0.94 89.1% 312 0 0 150 Southeast Total 580 116,987 $0.92 93.3% 779 698 0 1,832
Houston Total 2,538 582,960 $1.03 91.1% 5,221 23,722 3,722 17,962
MULTIFAMILY SECOND QUARTERMARKETVIEW
Source: Apartment Data Services, July 2014. CBRE Research, Q2 2014.
© 2014, CBRE, Inc.
Hou
ston
Mu
ltifam
ily | MarketV
iewQ
2 2
014
3
MULTIFAMILY SECOND QUARTERMARKETVIEW
Source: Bureau of Labor Statistics, July 2014. CBRE Research, Q2 2014.
Source: Apartment Data Services, July 2014 CBRE Research, Q2 2014.
MULTIFAMILY RENTSHouston rents continued their upward climb in Q2 2014, reaching $1.03 per sq. ft. for the first time. Overall rental rates remained steady at 7.6% over the past 12 months, while Class A, B and C rental rates each increased 6.7%, 6.6% and 7.3%, respectively. Class D rates decreased by 4% since Q2 2013. Rent growth was strong in most of the 41 submarkets. The highest overall Q2 2014 rents can be found in the Montrose/Museum District submarkets at $1.80 per sq. ft., led by the Inner Loop West/ Greenway Plaza submarkets at $1.75 per sq. ft. and the Heights submarket at $1.71 per sq. ft. The highest rents in suburban markets were found in Fort Bend and the Woodlands/Far North areas, at an average of $1.21 per sq. ft.
MULTIFAMILY OCCUPANCYThe Q2 2014 overall occupancy rate stands at 91%, up 10 basis points (bps) from last quarter and 20 bps from Q2 2013. Class C and D projects led improvement over the quarter with Class C occupancy up 60 bps in Q2 2014, to 93.3%, and Class D occupancy up 140 bps, to 87.5%. Class A occupancy dropped to 82.8%. This number is skewed downward because the data includes many new apartments that are still in the process of leasing up. Class B occupancy was 93.3%, down from 93.6% in Q1 2014.
MULTIFAMILY CONSTRUCTIONThe number of units under construction increased from 22,246 in Q1 2014 up to 23,722 in Q2 2014. The West Memorial/Briar Forest submarket remains one of the market’s hottest areas for new development. Units under construction increased by 8% in Q2 2014 from Q1 2014. The booming office development in the area is driving apartment demand.
UNEMPLOYMENTThe Houston economy continues to outshine the national economy. National unemployment held steady throughout the quarter at 6.3%. In May 2014, the Texas unemployment rate fell to 5.2%, while Houston unemployment dropped to 5.1%.
Figure 3: Average Rates ($/Sq. Ft./Mth.)
Figure 4: Occupancy Rates by Class
Figure 5: Construction Activity and Absorption
Figure 6: Unemployment
Source: Apartment Data Services, July 2014. CBRE Research, Q2 2014.
3%
4%
5%
6%
7%
8%
9%
10%
2000
2001
2002
2003
2004
2005
2006
2007
2008
2009
2010
2011
2012
2013
2014
US Texas Houston MSA
0
2
4
6
8
10
12
14
16
18
20
17,015 16,103 5,872 2,015 4,552 10,387 16,965 23,722
Units
000'
s
Under Construction MF Permit Activity Deliveries Net Absorption
80%
83%
86%
89%
92%
95%
Q3 2013 Q4 2013 Q1 2014 Q2 2014
Class A Class B Class C Class D Market Average
$0.50
$0.70
$0.90
$1.10
$1.30
$1.50
$1.70
Q3 2013 Q4 2013 Q1 2014 Q2 2014
Class A Class B Class C Class D Market Average
© 2014, CBRE, Inc.
Hou
ston
Mu
ltifam
ily | MarketV
iewQ
2 2
014
4
CENTRAL SOUTHWEST NORTHWEST NORTHEAST SOUTHEASTC1 Montrose/Museum District SW1 Galleria NW1 Brookhollow NE1 Northshore/Wood Forest SE1 Hwy 288/South
C2 Inner Loop West/Greenway Plaza SW2 Woodlake/Westheimer NW2 Spring Branch NE2 Eastex Frwy/Near Northeast SE2 Gulfgate/Almeda Mall
C3 Medical Center/Bellaire SW3 West Memorial/Briar Forest NW3 Inwood/Northwest NE3 Northline/Aldine SE3 Galena Park/Jacinto City
C4 Heights SW4 Westchase NW4 FM 1960 West/Champions NE4 Greenspoint SE4 Pasadena/Deer Park
C5 Inner Loop East SW5 Alief NW5 FM 1960 West/Steeplechase NE5 FM 1960 East/IAH Airport SE5 Friendswood/Pearland
SW6 Sharpstown/Westwood NW6 Bear Creek/Copperfield NE6 Lake Houston/Kingwood SE6 Clear Lake
SW7 Gulfton/Bissonnet NW7 Katy/Far West NE7 Far East SE7 Baytown
SW8 Braeswood/Fondren SW NW8 Tomball/Far Northwest SE8 Galveston/Brazoria
SW9 Almeda/South Main NW9 Woodlands/Far North
SW10 Fort Bend NW10 Conroe/Montgomery
SW11 Richmond/Rosenberg
Lynn CirilloResearch Operations ManagerCBRE Americas Research2800 Post Oak, Suite 2300Houston, TX 77056 e: [email protected]
Kindell Villarreal ResearcherCBRE Houston Research2800 Post Oak, Suite 2300Houston, TX 77056t: +1 713 577 1894e: [email protected]
CONTACTSFor more information about this Houston Multifamily MarketView, please contact:
TEXAS RESEARCH
FOLLOW CBRE
GLOBAL RESEARCH AND CONSULTING This report was prepared by the CBRE U.S. Research Team which forms part of CBRE Global Research and Consulting – a network of preeminent researchers and consultants who collaborate to provide real estate market research, econometric forecasting and consulting solutions to real estate investors and occupiers around the globe. Additional U.S. research produced by Global Research and Consulting can be found at www.cbre.us/research.
DISCLAIMER
Information contained herein, including projections, has been obtained from sources believed to be reliable. While we do not doubt its accuracy, we
have not verified it and make no guarantee, warranty or representation about it. It is your responsibility to confirm independently its accuracy and
completeness. This information is presented exclusively for use by CBRE clients and professionals and all rights to the material are reserved and cannot be
reproduced without prior written permission of CBRE.
© 2014, CBRE, Inc.
CBRE Global Research and Consulting
Houston Multi-HousingMarketView Q1 2014
Houston’s job and population growth continued to drive apartment demand. Rental rates and occupancy continued their upward trend as average rents reached $1.00 per sq. ft. for the first time ever in Houston and occupancy climbed to 90.9%. Q1 2014 net absorption was 5,538 units - roughly 1% of the market - which puts this year on pace with 2012 and 2013, during which Houston averaged 16,300 units of net absorption per year.
In Q1 2014, 4,199 new apartment units were delivered, up slightly from the Q4 2013 when 4,060 units delivered. 22,246 units remained under construction across the Houston metro at the end of Q1 2014.
Construction activity remained strong in the inner loop as it has since the start of this development cycle. 8,342 units were under construction in the loop, with the development concentrated in the area bounded on the north by I-10 and by US-59 to the south. Several new projects were underway in the CBD, spurred in part by the city’s Downtown Living Initiative, which offers developers a $15,000-per-unit subsidy for apartments built downtown. The city hopes to encourage downtown apartment development in order to increase population and revitalize the area.
Suburban development has increased over the past few months in certain areas. Notably, the West Memorial/Briar Forest submarket saw a large increase in new projects and ended Q1 2014 with 3,122 units under construction, compared to only 832 units in Q1 2013. High levels of office
HOUSTON APARTMENT MARKET STILL CLIMBING.
AVG. RENT$1.00 Per Sq. Ft.
NET ABSORPTION5,538 Units
UNDER CONSTRUCTION22,246 Units
DELIVERIES4,199 Units
PROPOSED CONSTRUCTION17,678 Units
TOTAL OCCUPANCY90.9%
Figure 1: Net Absorption and Occupancy
Source: Apartment Data Services, April 2014. CBRE Research, Q1 2014.
development in the nearby Energy Corridor is driving the apartment development in West Memorial/Briar Forest. The Tomball/Far Northwest and Woodlands/Far North submarkets are also experiencing a boom in apartment construction driven primarily by the development of the Exxon campus near Spring and the expansion of the Grand Parkway. Roughly 3,500 combined units are under construction in those submarkets.
Q1 2014 average rental rates increased to $1.00 per sq. ft., from $0.98 per sq. ft. in Q4 2013. Rental rates in Houston are at an all time high after a couple of years of rapid growth. However, the pace of growth is slowing. Rental rates increased 7.0% year-over-year in Q1 2014, whereas, over the previous 5 quarters, rental rates grew at an average of 7.7% year-over-year. With strong leasing activity and development anticipated to continue, rental rates should continue to trend upward, albeit not at the rapid pace seen in recent quarters.
New Class A product in the Inner Loop is commanding high rental rates. In the Montrose/Museum District submarket, Class A average rental rates are $1.83 per sq. ft. with some properties asking over $2.20 per sq. ft. for a 1 bedroom unit. The newest Rental rates for Class A product in the suburban submarkets can range from $1.20 to $1.50 per sq. ft.
Developers and investors are confident in the Houston market, which continued to expand in Q1 2014. Quality development projects, along with a strong and diversified local economy, should continue to push the market upward throughout 2014. Despite a large number of number of new deliveries expected in 2014, occupancy rates should remain steady or increase slightly. Rental rates should continue to increase throughout 2014, although the rate of growth will be slower than it has been the past few quarters.
Directional arrows based on change from the previous quarter. Data reflects market totals.
85%
86%
87%
88%
89%
90%
91%
92%
93%
0
200
400
600
800
1,000
1,200
1,400
1,600
1,800
2,000
Central Southwest Northwest Northeast Southeast
Occupancy Units Absorbed
Q1 2014 YTD Total Units Absorbed Occupancy
© 2014, CBRE, Inc.
Hou
ston
Mu
lti-Hou
sing
| MarketV
iewQ
1 2
014
2
Figure 2: Key Indicators
Submarket Property Count
Unit Count
Rents $/Sq. Ft./
Mth.Occupancy Absorption
Units
Under Construction
Units
Delivered Construction
Units
Proposed Construction
UnitsCentral
Montrose/ Museum District 52 12,202 $1.75 91.0% 256 2,407 338 3,150 Inner Loop West/ Greenway Plaza 58 14,066 $1.68 84.8% 43 3,573 231 1,422
Medical Center/ Bellaire 71 20,753 $1.41 91.7% 88 1,130 246 550 Heights 21 3,728 $1.67 74.2% 27 352 714 1,002
Inner Loop East 53 7,765 $1.22 91.4% 67 880 1,125 Central Total 255 58,514 $1.55 86.6% 481 8,342 1,529 7,249
SouthwestGalleria 99 22,866 $1.38 91.1% 271 1,994 390
Woodlake/ Westheimer 35 11,580 $1.05 92.4% 78 785 300 West Memorial/ Briar Forest 78 24,073 $1.12 88.9% (159) 3,122 764 1,246
Westchase 48 14,092 $1.05 94.6% 97 262 571 Alief 114 27,284 $0.85 93.1% 472
Sharpstown/ Westwood 105 24,973 $0.74 89.6% 294 Gulfton/ Bissonnet 56 16,786 $0.81 92.9% 196
Braeswood/ Fondren SW 84 21,937 $0.75 88.3% 348 Almeda/ South Main 22 4,280 $0.87 93.5% 45
Fort Bend 43 11,524 $1.16 95.3% 95 1,576 278 Richmond/ Rosenberg 28 4,536 $0.97 92.5% 73
Southwest Total 712 183,931 $0.98 92.0% 1,810 7,739 764 2,785 Northwest
Brookhollow 94 20,447 $0.88 90.3% 268 120 Spring Branch 95 18,063 $0.83 93.1% 194 247
Inwood/ Northwest 38 7,118 $0.78 91.7% 102 FM 1960 West/ Champions 152 37,293 $0.89 90.4% 434 239
FM 1960 West/ Steeplechase 71 18,834 $1.00 92.9% 47 504 120 300 Bear Creek/ Copperfield 48 13,021 $1.02 95.1% 118 342
Katy/Far West 65 16,703 $1.14 86.8% 210 1,068 1,064 2,566 Tomball/ Far Northwest 19 3,407 $1.16 65.3% 158 1,378 240 550 Woodlands/ Far North 49 14,286 $1.16 86.4% 106 2,115 1,116 Conroe/ Montgomery 42 7,346 $0.92 92.3% (34)
Northwest Total 673 156,518 $0.98 88.4% 1,603 5,407 1,424 5,138 Northeast
Northshore/ Wood Forest 40 8,644 $0.83 90.2% (43)Eastex Frwy/ Near Northeast 31 5,651 $0.79 94.5% 73
Northline/ Aldine 61 10,142 $0.75 93.5% 73 Greenspoint 37 9,473 $0.73 88.6% 218
FM 1960 East/ IAH Airport 44 8,436 $0.85 92.4% 82 180 636 Lake Houston/ Kingwood 44 11,498 $1.03 94.6% 104 778
Far East 26 4,478 $0.82 89.3% 51 168 Northeast Total 283 58,322 $0.83 91.9% 558 168 180 1,414
SoutheastHwy 288/ South 61 13,087 $0.97 90.9% 170 350
Gulfgate/ Almeda Mall 95 21,956 $0.80 94.0% 339 Galena Park/ Jacinto City 3 362 $0.90 98.9% 8
Pasadena/ Deer Park 116 21,998 $0.82 91.4% 283 Friendswood/ Pearland 29 5,541 $1.02 95.9% 2 329
Clear Lake 97 24,257 $1.02 93.0% 135 302 763 Baytown 54 9,348 $0.81 89.1% 94 240
Galveston/ Brazoria 134 20,465 $0.84 88.3% 55 Southeast Total 589 117,014 $0.90 92.7% 1,086 590 302 1,092
Houston Total 2,512 574,299 $0.97 91.1% 5,538 22,246 4,199 17,678
MULTI-HOUSING FIRST QUARTERMARKETVIEW
Source: Apartment Data Services, April 2014. CBRE Research, Q1 2014.
© 2014, CBRE, Inc.
Hou
ston
Mu
lti-Hou
sing
| MarketV
iewQ
1 2
014
3
MULTI-HOUSING FIRST QUARTERMARKETVIEW
Source: Bureau of Labor Statistics, April 2014. CBRE Research, Q1 2014.
Source: Apartment Data Services, April 2014 CBRE Research, Q1 2014.
MULTI-HOUSING RENTSHouston rents continued their upward climb in Q1 2014, reaching $1.00 per sq. ft. for the first time. Overall rental rates increased 7.0% over the past year while Class A, B and C rental rates each increased 6.4%. Class D rates increased 4.9% since Q1 2013. Rent growth was strong in most of the 41 submarkets. The highest overall Q1 2013 rents can still be found in the Central (Inner Loop) submarkets, led by Montrose/Museum District again at $1.75 per sq. ft. and Inner Loop West/Greenway Plaza at $1.68 per sq. ft. The highest rents in suburban markets were $1.16, in Woodlands/Far North, Tomball/Northwest, and Fort Bend.
MULTI-HOUSING OCCUPANCYQ1 2014 occupancy rates stood at 90.9%, up 40 basis points (bps) from last quarter and 70 bps from Q1 2013. Class A occupancy was 85%. This number is skewed downward because the data includes many new apartments that are still in the process of leasing up. Class B occupancy was 93.6%, up from 93.5% in Q4 2013. Class C occupancy increased 10 bps as well in Q1 2014, reaching 92.7%.
MULTI-HOUSING CONSTRUCTIONThe number of units under construction at the end of Q1 2014 was 22,246 up from 17,614 in Q4 2013. The Central (Inner Loop) region accounts for the highest share of construction, with about 4 out of every 10 units under construction in Houston being built there. The West Memorial/Briar Forest submarket has become one of the market’s hottest areas for new development. In Q1 2014, there were 3,122 units under construction within that submarket while last year at this time only 822 units were underway. The booming office development in the area is driving apartment demand.
UNEMPLOYMENTThe Houston economy continues to outshine the national economy. National unemployment held steady throughout the quarter at 6.7%. In March 2014, the Texas unemployment rate fell to 5.5%, while Houston unemployment dropped to 5.2%. Economic growth slowed in March 2014 as Houston’s economy grew 2.9% year-over-year.
Figure 3: Average Rates ($/Sq. Ft./Mth.)
Figure 4: Occupancy Rates by Class
Figure 5: Construction Activity and Absorption
Figure 6: Unemployment
Source: Apartment Data Services, April 2014. CBRE Research, Q1 2014.
3%
4%
5%
6%
7%
8%
9%
10%
2000
2001
2002
2003
2004
2005
2006
2007
2008
2009
2010
2011
2012
2013
2014
US Texas Houston MSA
0
2
4
6
8
10
12
14
16
18
20
2007 2008 2009 2010 2011 2012 2013 2014
Units
000s
Under Construction MH Permit Activity Deliveries Net Absorption
78%
81%
84%
87%
90%
93%
96%
Q1 2013 Q2 2013 Q3 2013 Q4 2013 Q1 2014
Class A Class B Class C Class D Market Average
$0.40
$0.60
$0.80
$1.00
$1.20
$1.40
$1.60
Q1 2013 Q2 2013 Q3 2013 Q4 2013 Q1 2014
Class A Class B Class C Class D Market Average
© 2014, CBRE, Inc.
Hou
ston
Mu
lti-Hou
sing
| MarketV
iewQ
1 2
014
4
CENTRAL SOUTHWEST NORTHWEST NORTHEAST SOUTHEASTC1 Montrose/Museum District SW1 Galleria NW1 Brookhollow NE1 Northshore/Wood Forest SE1 Hwy 288/South
C2 Inner Loop West/Greenway Plaza SW2 Woodlake/Westheimer NW2 Spring Branch NE2 Eastex Frwy/Near Northeast SE2 Gulfgate/Almeda Mall
C3 Medical Center/Bellaire SW3 West Memorial/Briar Forest NW3 Inwood/Northwest NE3 Northline/Aldine SE3 Galena Park/Jacinto City
C4 Heights SW4 Westchase NW4 FM 1960 West/Champions NE4 Greenspoint SE4 Pasadena/Deer Park
C5 Inner Loop East SW5 Alief NW5 FM 1960 West/Steeplechase NE5 FM 1960 East/IAH Airport SE5 Friendswood/Pearland
SW6 Sharpstown/Westwood NW6 Bear Creek/Copperfield NE6 Lake Houston/Kingwood SE6 Clear Lake
SW7 Gulfton/Bissonnet NW7 Katy/Far West NE7 Far East SE7 Baytown
SW8 Braeswood/Fondren SW NW8 Tomball/Far Northwest SE8 Galveston/Brazoria
SW9 Almeda/South Main NW9 Woodlands/Far North
SW10 Fort Bend NW10 Conroe/Montgomery
SW11 Richmond/Rosenberg
Lynn CirilloResearch Operations ManagerCBRE Americas Research e: [email protected]
Eric Himarios Research AnalystCBRE Houston Research2800 Post Oak, Suite 2300Houston, TX 77056t: +1 713 577 1792e: [email protected]
CONTACTSFor more information about this Houston Multi-Housing MarketView, please contact:
TEXAS RESEARCH
FOLLOW CBRE
GLOBAL RESEARCH AND CONSULTING This report was prepared by the CBRE U.S. Research Team which forms part of CBRE Global Research and Consulting – a network of preeminent researchers and consultants who collaborate to provide real estate market research, econometric forecasting and consulting solutions to real estate investors and occupiers around the globe. Additional U.S. research produced by Global Research and Consulting can be found at www.cbre.us/research.
DISCLAIMER
Information contained herein, including projections, has been obtained from sources believed to be reliable. While we do not doubt its accuracy, we
have not verified it and make no guarantee, warranty or representation about it. It is your responsibility to confirm independently its accuracy and
completeness. This information is presented exclusively for use by CBRE clients and professionals and all rights to the material are reserved and cannot be
reproduced without prior written permission of the CBRE Global Chief Economist.
© 2014, CBRE, Inc.
CBRE Global Research and Consulting
Houston Multi-HousingMarketView Q4 2013
NET ABSORPTION EXCEEDS 16,000 UNITS IN 2013The number of units absorbed in 2013 reached 16,678. Not only is net absorption outpacing the three-year average of approximately 14,000 units, but this marks the sixth consecutive year with positive annual net absorption. Due to increased new supply delivered in Q4 2013 creating new options for renters, absorption compressed to 510 units, down from 3,794 units in Q3 2013. All five submarkets in the greater Houston area had positive net absorption in each quarter of 2013, except the Northwest which experienced negative net absorption of 202 units in Q4 2013. The Southwest recorded the highest net absorption, with 5,191 units, while the Inner Loop posted the lowest, at 1,645 units. Although the horizon for new deliveries suggests further increases in absorption, the Houston MSA is on course to remain positive in Q1 2014 due in large part to continued job growth. OCCUPANCY REACHED 90.5% in Q4 2013.Q4 2013 occupancy outperformed both Q4 2011 and Q4 2012 occupancy, by 280 basis points (bps) and 90 bps, respectively. Although occupancy fell 60 bps from Q3 2013, Houston still experiences occupancy over 90%. Per the Houston Association of Realtors, home sales increased 19.4% year-over-year in November with trailing year volume up 31.9%, to $20.8 billion, which is the highest 12-month total on record. With robust home sales bringing months of supply to historic lows and strong housing demand in general, multifamily fundamentals are tight, especially as more millennials opt for Class A rentals in the Inner Loop. RENTS ACHIEVED $0.98 PER SQ. FT. IN Q4 2013. Rent growth continued in Q4 2013 and Houston average rental rates are on track to reach $1.00 per sq. ft. soon. Rents reached $0.98 per sq. ft. in Q4 2013, continuing the upward pattern for all four quarters of 2013. Occupancy dipped this quarter, as did some of the Class A rents, with deliveries up significantly over the quarter. The pace of rent growth may moderate until this new product is fully leased up. Class B, C, and D all saw $0.01 per sq. ft. gains demonstrating growing demand for these units. Moody’s Analytics’ placed net migration for the Houston MSA in 2013 at 55,700 persons due to rapid growth in the energy and healthcare sectors and the relatively low cost of living. This trend should continue in 2014, supporting rents and construction.
RENTAL RATES AND CONSTRUCTION ACTIVITY CONTINUE STRONG GAINS IN Q4 2013.
AVG. RENT$0.98 Per Sq. Ft.
NET ABSORPTION510 Units
CONSTRUCTION17,614 Units
DELIVERIES4,060 Units
PROPOSED CONSTRUCTION20,820 Units
TOTAL OCCUPANCY90.5%
Figure 1: Market Net Absorption and Occupancy
Source: Apartment Data Services, January 2014. CBRE Research, Q4 2013.
DELIVERED UNITS INCREASE TO 4,060 WHILE UNITS UNDER CONSTRUCTION DIP TO 17,614.Multi-housing construction cooled slightly in Q4 2013. As a persistent trend from Q3 2013, most of the units under construction are concentrated in the Central (or Inner Loop region). Inner Loop West/Greenway Plaza leads the pack with a grand total of 3,055 units currently under construction. Montrose/Museum District was not far behind with 2,509 units. The Southwest region is also active with 5,297 units under construction, where the largest share of activity is in the West Memorial/Briar Forest submarket with 2,251 units under construction. With another 1,425 units in the pipeline, this Energy Corridor-area market should soon catch up to the high demand created from that growing sector. The Northwest Region posted strong construction numbers again, totaling 5,001 units. The most heated submarket for the Northwest Region is Katy/Far West, with 1,551 units under construction and another 2,870 delivered. As expected, the ExxonMobil campus has driven Woodlands/Far North and Tomball/Far Northwest
construction numbers up with these submarkets reporting 1,487 and 1,327 units underway, respectively.
Q4 2013 saw the most construction deliveries of any single quarter since Q2 2009. An impressive 4,060 units were delivered this quarter, bumping the annual total to a staggering 11,472 units. This is a positive for the growing multi-housing sector in Houston as the total is closely aligned with demand and has not surpassed its previous peak of over 14,000 units delivered per year in 2008 and 2009.
The Houston MSA is currently experiencing a single family housing shortage and, with 69,800 new jobs forecasted for 2014 by the Greater Houston Partnership, the multi-housing sector can expect another strong year. In anticipation of 2014, 20,820 multifamily units are currently proposed. 35.3% of this proposed construction is slated for the Central region, with a slew of high profile mid- and high-rise properties expected to begin construction next year.
Directional arrows based on change from the previous quarter. Data reflects market totals.
87%
88%
89%
90%
91%
92%
93%
0
1,000
2,000
3,000
4,000
5,000
6,000
Central Southwest Northwest Northeast SoutheastUnits
Q1 Q2 Q3 Q4 2013 Total Units Absorbed Occupancy
© 2014, CBRE, Inc.
Hou
ston
Mu
lti-Hou
sing
| MarketV
iewQ
4 2
013
2
Figure 2: Key Indicators
Submarket Property Count
Unit Count
Rents Per Sq. Ft./
MthOccupancy Absorption
Units
Under Construction
Units
Delivered Construction
Units
Proposed Construction
by UnitsCentral
Montrose/ Museum District 52 12,202 $1.71 90.8% 61 2,509 430 2,668 Inner Loop West/ Greenway Plaza 58 14,066 $1.64 87.2% 157 3,055 302 1,227
Medical Center/ Bellaire 71 20,753 $1.39 91.2% (105) 1,115 Heights 21 3,728 $1.67 73.3% 46 352 396 1,002
Inner Loop East 53 7,765 $1.16 94.6% (40) 700 1,330 Central Total 255 58,514 $1.51 87.4% 119 6,616 1,128 7,342
SouthwestGalleria 99 22,866 $1.34 89.9% 203 1,282 322 706
Woodlake/ Westheimer 35 11,580 $1.01 91.6% (45) 409 676 West Memorial/ Briar Forest 78 24,073 $1.07 92.1% 16 2,251 1,425
Westchase 48 14,092 $1.02 93.9% (75) 571 Alief 114 27,284 $0.83 91.5% 36
Sharpstown/ Westwood 105 24,973 $0.72 89.0% 196 Gulfton/ Bissonnet 56 16,786 $0.79 91.4% 11
Braeswood/ Fondren SW 84 21,937 $0.73 87.1% 68 Almeda/ South Main 22 4,280 $0.86 92.3% (41)
Fort Bend 43 11,524 $1.12 94.1% (44) 1,337 527 Richmond/ Rosenberg 28 4,536 $0.96 90.9% (37)
Southwest Total 712 183,931 $0.95 91.3% 288 5,279 322 3,905 Northwest
Brookhollow 94 20,447 $0.86 89.2% 64 132 Spring Branch 95 18,063 $0.82 92.1% (54) 247
Inwood/ Northwest 38 7,118 $0.78 89.6% 17 FM 1960 West/ Champions 152 37,293 $0.88 89.3% (258) 323 239
FM 1960 West/ Steeplechase 71 18,834 $0.99 92.9% (31) 504 300 Bear Creek/ Copperfield 48 13,021 $1.02 94.2% (64) 271
Katy/Far West 65 16,703 $1.13 87.5% 92 1,551 643 2,870 Tomball/ Far Northwest 19 3,407 $1.09 72.5% 69 1,327 660 1,620 Woodlands/ Far North 49 14,286 $1.15 86.3% (1) 1,487 832 1,840 Conroe/ Montgomery 42 7,346 $0.91 93.3% (36) 152
Northwest Total 673 156,518 $0.96 88.7% (202) 5,001 2,610 7,387 Northeast
Northshore/ Wood Forest 40 8,644 $0.83 90.7% 6 Eastex Frwy/ Near Northeast 31 5,651 $0.77 92.5% (13)
Northline/ Aldine 61 10,142 $0.73 92.3% 6 Greenspoint 37 9,473 $0.71 86.3% 68
FM 1960 East/ IAH Airport 44 8,436 $0.84 93.4% (3) 180 636 Lake Houston/ Kingwood 44 11,498 $1.02 93.7% 39 236 514
Far East 26 4,478 $0.82 88.3% 42 Northeast Total 283 58,322 $0.82 91.0% 145 416 0 1,150
SoutheastHwy 288/ South 61 13,087 $0.95 89.4% 46
Gulfgate/ Almeda Mall 95 21,956 $0.78 92.4% 249 Galena Park/ Jacinto City 3 362 $0.89 96.7% 1
Pasadena/ Deer Park 116 21,998 $0.80 90.2% (15)Friendswood/ Pearland 29 5,541 $0.98 95.8% (50) 329
Clear Lake 97 24,257 $1.00 93.7% (92) 302 647 Baytown 54 9,348 $0.79 88.2% 33
Galveston/ Brazoria 134 20,465 $0.82 88.0% (12) 60 Southeast Total 589 117,014 $0.88 91.8% 160 302 0 1,036
Houston Total 2,512 574,299 $0.97 91.1% 510 17,614 4,060 20,820
MULTI-HOUSING FOURTH QUARTERMARKETVIEW
Source: Apartment Data Services, January 2014. CBRE Research, Q4 2013.
© 2014, CBRE, Inc.
Hou
ston
Mu
lti-Hou
sing
| MarketV
iewQ
4 2
013
3
MULTI-HOUSING FOURTH QUARTERMARKETVIEW
Source: Bureau of Labor Statistics, January 2014. CBRE Research, Q4 2013.
Source: Apartment Data Services, January 2014 CBRE Research, Q4 2013.
MULTI-HOUSING RENTSHouston rents continued their upward climb in Q4 2013, reaching $0.98 per sq. ft. for the first time. In 2013, all classes experienced positive rent growth: Both Class A and B rents increased by 6.6% over the year and Class C rents rose by 5.1%. Rents on average, from Q3 2013 to Q4 2013, grew in three out of the five regions with the Northwest and Southeast remaining the same. Rent growth was strong in most of the 41 submarkets. The highest overall Q4 2013 rents can still be found in the Central (Inner Loop) submarkets, led by Montrose/Museum District again at $1.71 per sq. ft. and Inner Loop West/Greenway Plaza at $1.64 per sq. ft. Heights showed the most impressive gains with a market average at $1.67 for Q4 2013, up from $1.57 in Q3 2013. Medical Center/Bellaire and the Southwest’s Galleria submarket were the only other submarkets to reach the $1.30 per sq. ft. level, at $1.39 and $1.34 respectively. The highest rents in suburban markets were $1.15, in Woodlands/Far North, and $1.13 and $1.12, in Katy Far West and Fort Bend respectively.
MULTI-HOUSING OCCUPANCY90.5% of units are occupied across the city. This marks an entire year of citywide occupancy rates above 90%. Year over year occupancy is up 90 bps from 89.6% in Q4 2012. However, Class D occupancy was the only product type to experience a gain in occupancy over the quarter, from 84.0% in Q3 2013 to 85.1% in Q4 2013. Class B and Class C product still have occupancies over 90%, at 93.5% and 91.6%, respectively. Class A occupancy dropped to 86.2% in Q4 2013, likely due to the high volume of delivered units. Overall, 25 of the 41 submarkets experienced occupancy rates over 90%. Inner Loop East, located in the central region, jumped 50 bps, from 94.1% in Q3 2013 to 94.6% in Q4 2013, to record the highest occupancy of all 41 submarkets this quarter. Despite the positive gains for that submarket, overall Central region occupancy dipped from 92.2% in Q3 2013 to 87.4% in Q4 2013.
MULTI-HOUSING CONSTRUCTIONThe number of units under construction for Q4 2013 is 17,614, down from 18,672 in Q3 2013, but still stronger than first two quarters of the year, which were 15,124 and 16, 449, respectively. The Central (Inner Loop) region’s accounts for the highest share of construction, representing 38% of units underway, followed by the Southwest region at 30%, where most construction is in the West Memorial/Briar Forest submarket. The Northwest region’s share of construction activity isn’t far behind at 28.4%. This region also had the highest number of delivered units for Q4 2013. Office development and employment growth is a contributing factor for the multi-housing construction boom in the Energy Corridor and in the north submarkets near the ExxonMobil campus. The number of proposed units is up this quarter, reaching 20,820, suggesting that the development trend will not slow for multi-housing in 2014.
UNEMPLOYMENTUnemployment continued its steady decline since 2010 through Q4 2013. National unemployment experienced a significant decline this quarter, from 7.3% as of August 2013 to 6.6% in November 2013. The Texas unemployment rate in November 2013 fell to 5.8%, while Houston unemployment dropped to 5.6%. The Greater Houston Partnership expects 69,800 new jobs to be created in 2014, which will maintain the downward unemployment rate trend into the new year. The healthcare sector in the Houston MSA has played a large role in this growth; not only in the Texas Medical Center, but also in Pearland, supporting further development in the Hwy 288/South submarket.
Figure 3: Average Rates Per Sq. Ft./Mth
Figure 4: Occupancy Rates by Class
Figure 5: Construction Activity and Absorption
Figure 6: Unemployment
Source: Apartment Data Services, January 2013. CBRE Research, Q4 2013.
3%
4%
5%
6%
7%
8%
9%
10%
2000
2001
2002
2003
2004
2005
2006
2007
2008
2009
2010
2011
2012
Q4
2013
US Texas Houston MSA
0
2,000
4,000
6,000
8,000
10,000
12,000
14,000
16,000
18,000
20,000
2007 2008 2009 2010 2011 2012 2013Units
Under Construction MH Permit ActivityDeliveries Net Absorption
78%
81%
84%
87%
90%
93%
96%
Q4 2012 Q1 2013 Q2 2013 Q3 2013 Q4 2013
Class A Class B Class C Class D MarketAverage
$0.40
$0.60
$0.80
$1.00
$1.20
$1.40
$1.60
Q4 2012 Q1 2013 Q2 2013 Q3 2013 Q4 2013Class A Class B Class C Class D Market
Average
© 2014, CBRE, Inc.
Hou
ston
Mu
lti-Hou
sing
| MarketV
iewQ
4 2
013
4
CENTRAL SOUTHWEST NORTHWEST NORTHEAST SOUTHEASTC1 Montrose/Museum District SW1 Galleria NW1 Brookhollow NE1 Northshore/Wood Forest SE1 Hwy 288/South
C2 Inner Loop West/Greenway Plaza SW2 Woodlake/Westheimer NW2 Spring Branch NE2 Eastex Frwy/Near Northeast SE2 Gulfgate/Almeda Mall
C3 Medical Center/Bellaire SW3 West Memorial/Briar Forest NW3 Inwood/Northwest NE3 Northline/Aldine SE3 Galena Park/Jacinto City
C4 Heights SW4 Westchase NW4 FM 1960 West/Champions NE4 Greenspoint SE4 Pasadena/Deer Park
C5 Inner Loop East SW5 Alief NW5 FM 1960 West/Steeplechase NE5 FM 1960 East/IAH Airport SE5 Friendswood/Pearland
SW6 Sharpstown/Westwood NW6 Bear Creek/Copperfield NE6 Lake Houston/Kingwood SE6 Clear Lake
SW7 Gulfton/Bissonnet NW7 Katy/Far West NE7 Far East SE7 Baytown
SW8 Braeswood/Fondren SW NW8 Tomball/Far Northwest SE8 Galveston/Brazoria
SW9 Almeda/South Main NW9 Woodlands/Far North
SW10 Fort Bend NW10 Conroe/Montgomery
SW11 Richmond/Rosenberg
+FOLLOW US
GLOBAL RESEARCH AND CONSULTING This report was prepared by the CBRE U.S. Research Team which forms part of CBRE Global Research and Consulting – a network of preeminent researchers and consultants who collaborate to provide real estate market research, econometric forecasting and consulting solutions to real estate investors and occupiers around the globe.
DISCLAIMER
Information contained herein, including projections, has been obtained from sources believed to be reliable. While we do not doubt its accuracy, we
have not verified it and make no guarantee, warranty or representation about it. It is your responsibility to confirm independently its accuracy and
completeness. This information is presented exclusively for use by CBRE clients and professionals and all rights to the material are reserved and cannot be
reproduced without prior written permission of the CBRE Global Chief Economist.
Lynn CirilloResearch Operations Manager e: [email protected]
Allie Conwell Researcher, Multi-HousingCBRE Houston Research2800 Post Oak, Suite 2300Houston, TX 77056t: +1 713 577 1894e: [email protected]
CONTACTSFor more information about this Houston Multi-Housing MarketView, please contact:
TEXAS RESEARCH
GOOGLE+ FACEBOOK TWITTER
© 2014, CBRE, Inc.