Rock engineering and ground control learning material
IndexSr. No
.
Practical Name Page No.
1 Preparation Of rock Sample for laboratory testing 2-132 Determination of uniaxial Compressive strength of rock
sample14-17
3 Determination of Tensile strength of a rock sample 18-214 Standard test procedure for the determination of the shear
strength of rock material in direct shear22-25
5 Determination of triaxial cell 26-336 Determination of point load strength index 34-417 Determination of protodykonov strength index 42-448 Instrumentation 45-689 Demonstration of various rock bolts 69-76
1 | P A G E
Practical No. 1
Aim: Preparation Of rock Sample for laboratory testing
1) Collection and storage of Sample
1.1) Def.:
Rock Sample: Arepresentative part of a larger rock for testing the rock properties
(i.e. strength, porosity, etc.) to find out the behaviour of rock under the stresses in strata during mining operations.
Size and shape of samples: The sample can be in shape of cylinder or cubical. The size of sample varies for rock sample for different tests as per requirement.
1.2) Collection of core samples from field
Test material is normally collected from the field in the form of drilled cores
Core drill sample
2 | P A G E
Core drilling bit
Field setup for core drilling machine
3 | P A G E
1.3) Core drilling machine
Heavy duty, pillar type frame with 2 HP, single phase AC motor. Varying cutting feeds provided with water-fed swivel head which can be connected to
suitable water supply. Provision at base for water connection/drainage. Core preparation from regular and irregular sample core size: EX to NX Clamping arrangement to hold specimens with regular/irregular shapes to the base of
machine. Four cutting speeds of 600, 800, 1100 and 1500 RPM.
4 | P A G E
1.4) Collection of rock sample from field
Field sampling procedure should be rational and systematic, and the material should be marked to indicate its original position and orientation relative to identifiable boundaries of the parent rock mass. Ideally, sample should be moisture proofed immediately after collection either by waxing, spraying or packing in polyethylene bag or sheet.(example: for moisture proofing by waxing the following procedure can be used for core that will not fail apart in handling).
(a)Wrap core in a clear thin polyethylene such as GLAD WRAP or SARAN WRAP,
(b)Wrap in cheese cloth,
(c)Coat wrapped core with a lukewarm wax mixture to an approx. 1/4 –in. (6.4 mm) thickness.
1.5) Avoidance of contamination
The deformation and fracture properties of rock maybe influenced by air, water and other fluids in contact with their internal (cracks and pores) surfaces. If this internal surfaces are contaminated by oils or other substances, their properties may be altered appreciably and give misleading test results. Of course, a cutting fluid is required with many types of specimen preparation equipments. Clean water is preferred fluid. Even so one must be cognizant of the effect of moisture on test specimens. While it may be impossible to exactly duplicate the in situ conditions even if they were know, a concerted effort should be made to simulate the environment from which the sample came. Generally, there are three conditions to be considered:
(a)Hard, dense rock and low porosity will not normally be affected by moisture. This type of material is normally allowed to air-dry prior to testing to bring all samples to an equilibrium condition. Drying at temperatures above 1200 F (490c) is not recommended as excessive heat may cause an irreversible change in rock properties.
(b)Some shale and rocks containing clay will disintegrate if allowed to dry. Usually disintegration of diamond drill cores can be prevented by wrapping the cores as they are drilled in a moisture proof material such as aluminium foil or chlorinated rubber, or sealing them in moisture proof containers.
(c)Mud shale and rock containing bentonites (e.g.: tuff) may soften if the moisture content is too high. Most of the softer rocks can be cored or cut using compressed air to clear cuttings and to cool the bit or saw.
5 | P A G E
2) Preparation of sample in laboratory
2.1) Core cutting and grinding machine
Table mounted Stable construction Feed arrangement for cutting Cooling water arrangement Heavy duty, AC, single phase motor
This unit is designed for cutting and grinding cylindrical rock specimens up to NX size. The outfit includes 200mm diameter diamond impregnated cutter, a fine diamond impregnated grinding wheel, a water supply system and simple holder.
AV-Vice, to hold the sample up to 55mm diameter x 140mm long to be cut parallel and square to the longitudinal axis is provided. Core longer than 140mm can be prepared reversing the specimen and holding the same vice. A hard feed arrangement is provided to facilitate the specimen with a uniform and smooth feeding motion. This unit is provided with 1HP, single phase AC motor. It can also be provided for 100mm and 150mm diameter samples.
2.2) Polishing and lapping machine
6 | P A G E
Compact table model. 20 cm diameter top and adapter to hold polishing cloth or paste. Sample holder to accommodate up to NX size cores. Continuous water feed arrangement during operation.
This unit is provided with a 14 HP, single phase AC motor. This bench mounted single spindle
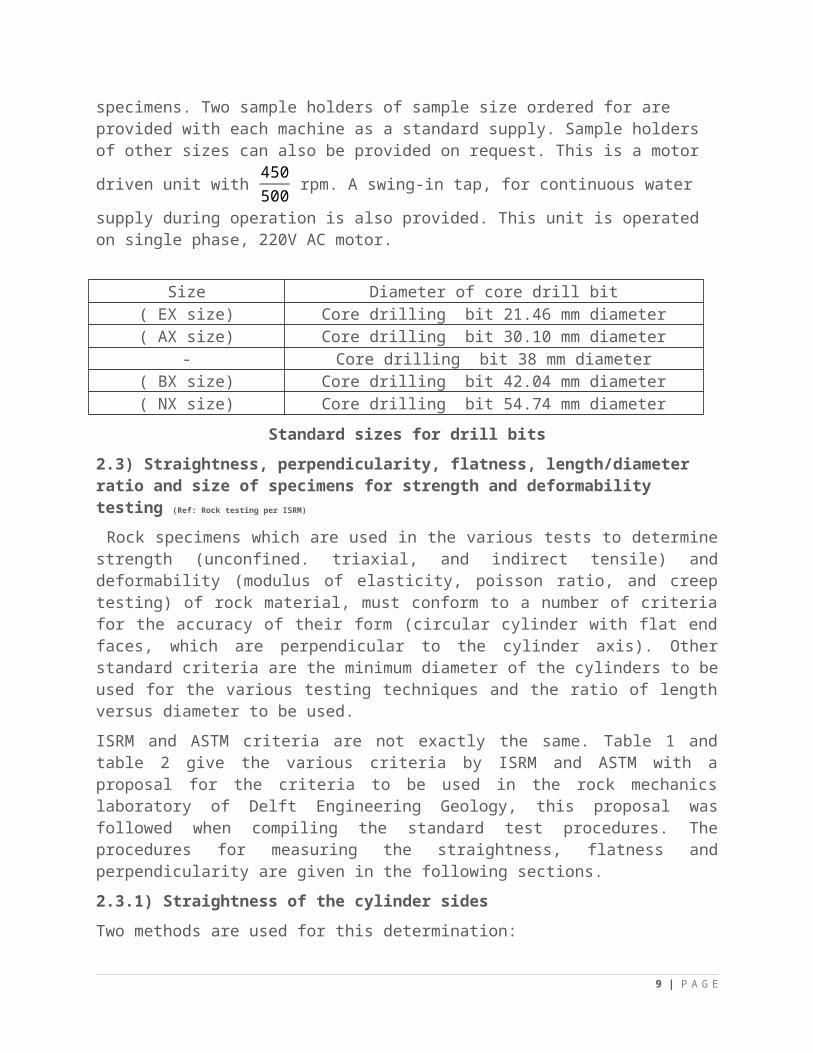
lapping machine is ideally suited for the final polishing of the mounted rock or concrete specimens. Two sample holders of sample size ordered for are provided with each machine as a standard supply. Sample holders of other sizes can also be provided on request. This is a motor
driven unit with 450500 rpm. A swing-in tap, for continuous water supply during operation is also
provided. This unit is operated on single phase, 220V AC motor.
Size Diameter of core drill bit( EX size) Core drilling bit 21.46 mm diameter( AX size) Core drilling bit 30.10 mm diameter
- Core drilling bit 38 mm diameter( BX size) Core drilling bit 42.04 mm diameter( NX size) Core drilling bit 54.74 mm diameter
Standard sizes for drill bits
2.3) Straightness, perpendicularity, flatness, length/diameter ratio and size of specimens for strength and deformability testing (Ref: Rock testing per ISRM)
Rock specimens which are used in the various tests to determine strength (unconfined. triaxial, and indirect tensile) and deformability (modulus of elasticity, poisson ratio, and creep testing) of rock material, must conform to a number of criteria for the accuracy of their form (circular cylinder with flat end faces, which are perpendicular to the cylinder axis). Other standard criteria are the minimum diameter of the cylinders to be used for the various testing techniques and the ratio of length versus diameter to be used.
ISRM and ASTM criteria are not exactly the same. Table 1 and table 2 give the various criteria by ISRM and ASTM with a proposal for the criteria to be used in the rock mechanics laboratory of Delft Engineering Geology, this proposal was followed when compiling the standard test procedures. The procedures for measuring the straightness, flatness and perpendicularity are given in the following sections.
2.3.1) Straightness of the cylinder sides
Two methods are used for this determination:
- Roll the sample on a flat smooth surface and measure the height of the maximum gap between the specimen and the flat surface with a feeler gauge. If this gap exceeds 0.50mm, the specimen does not meet the requirements for straightness and shall not be used for the testing.
The surface on which the specimen is rolled shall not depart from a plane by more than 0.013mm.
7 | P A G E
- Place the cylinder on the V-block. Place a dial indicator in contact with the top of the specimen as shown in figure app1.1, move the specimen from one end of the v-block to the other along a straight line.
- Record the minimum and maximum readings on the dial gauge and calculate the difference do repeat the same operations by rotating the specimen for every 90°, and obtain the difference d90, d180, and d270. The maximum value of these four values shell be less than 0.50mm (0.020in).
Figure app1.1: Assembly for determining the straightness of the cylindrical surface
2.3.2) Flatness of the end surfaces
The flatness of the end faces is determined by a set up similar to that for the cylindrical surface. The dial gauge, however, is now mounted near the end of the V-block (see figure app1.2.). Move the dial gauge holder horizontally along the end of the V-block, maintaining good contact with the block, and record the dial gauge readings every 3mm across the diameter. Plot the readings on an enlarged scale on mm paper and dram a smooth line through the points. The smoothness criterion is met when the smooth curve so determined does not depart from a visual best fit line by more than the value indicated in the standard test procedure (see also tables 1 and 2). Rotate the specimen 900 around its longitudinal axis and repeat the same operations and tolerance checks for the new diametrical plane.
Repeat the same procedure for the other end face.
8 | P A G E
Figure app1.2: Assembly for determining the perpendicularity of end surfaces to the specimen axis
Samples after preparation before testing in laboratory (Ref: Rock testing per ISRM PPT)
2.3.3) Perpendicularity of the end faces to the cylinder axis
This criterion can be checked using the measurements taken for the determination of the flatness of the end faces. Calculate the difference between the maximum and minimum readings on the dial gauge along each of the 4 diameters (the two lines perpendicular to each other on each end
9 | P A G E
face). These four values of difference should be divided by the specimen diameter and the resulting four values must all be smaller than the ratio indicated in the standard test procedures in this manual (see also tables 1 and 2).
Suggested by ISRM Suggested by ASTM Proposed for DEGStraightness Cylinder Better than 0.3mm Better than 0.5mm Better than 0.5mmFlatness of end faces Better than 0.02mm Better than 0.015mm Better than 0.02mmperpendicularity Better than 1:1000 Better than 1:200 Better than 1:200
Table 1 for: unconfined compression, triaxial strength, modules of elasticity, poisson ratio and creep testing
Suggested by ISRM Standard of ASTM Proposed for DEGStraightness cylinder Better than 0.025mm Better than 0.5mm Better than 0.5mmFlatness of end faces Better than 0.25mm No specification No specificationPerpendicularity Better than 1:200 Better than 1:100 Better than 1:100
Table2.for: Brazilian Tensile strength
2.3.4) Size and length/diameter ratio for specimens
Also for the specimen size and the specimen length/diameter ratio ASTM and ISRM do not follow the same standards. For the unconfined compressive strength and triaxial strength testing techniques listed in table 1 ASTM sets a standard of a minimum diameter of at least 10 times the largest grain size in the rock generally 48 mm is enough. ISRM holds also the condition of 10 times the largest grain size and gives as a minimum specimen diameter 54 mm. In the test procedures in this manual the ASTM standard was followed. Minimum specimen diameter indicated in this manual is 54 mm. The length/diameter ratio recommended by ISRM for the strength tests is 2.5 to 3, the ASTM standard, however is 2 to 2.5. The standard proposed in this manual is 2.5, which is not in conflict with ISRM and ASTM.
The diameter and length/diameter ratio of specimens for the Brazilian splitting tensile strength test suggested by ISRM are respectively 54 mm and 1:1. For ASTM the standards are 48 mm and 0.5:1 to 1:1. In this manual these values have been chosen as 54 mm and 1:1, so also here there is no conflict with the existing standards.
For the deformation tests the standards for diameter and length/diameter are as follows: at least 54 mm and 2.5 to 3.0 for the ISRM against 48 mm and 2.0 to 2.5 for ASTM.
Important: If specimens are available which do not confirm with the sizes or ratios indicated in this appendix, the test procedures remain valid. The only consequence is that in the report it must be stated clearly that the tests were done with specimens of sizes other than indicated in the standard test procedures of the laboratory.
a) Compressive strength: - coal and rocki. Cubical :- one side 25-50mm
ii. Cylindrical:- diameter 25-50mm or 10 times the grain size whichever is more, L/D ratio=2.5
iii. Prismatic: - sq base side 25 ratio 2.5.iv. Irregular: - by weight 30-35
By volume 100cm3
10 | P A G E
H/R ratio= 1:1/5
b) Tensile strength: -i. Direct test: - cylindrical diameter= 25-50 mm, L/D ratio 2.5
ii. Cylinder diameter 25, L/D ratio= 3-3.5iii. Prismatic: - square base side 25 mm, L/W ratio=3-3.53iv. Uniaxial by inclined dies: -
1) cylindrical-diameter 25-50 mm, L/D ratio 2.5-3
2) Prismatic- square base side 25mm, L/D ratio 2-2.5
d) Point load strength index:- i. Diameter loading :- cylindrical diameter 25-50 mm , L/D ratio 1.4-1.5
ii. Axial loading: -
1) Cylindrical diameter 25-50 mm, L/D ratio 1.1-0.05
2) irregular-H/W ratio 1-1.5
e) Flexural strengthi. Cylindrical-diameter 25 mm span 15-20 mm
ii. Prismatic- square bases 25 mm span 15-20 mmiii. Beam- rectangular cross section 3×8 mm span 15-20 mm
Name of test l/d ratio No of sample to be tested
Rate loading
Anistropic sample testing
formula
Isotropic sample testing
Uniaxial compressive test
2.5 >5 0.5-1 MPa/sec
both directions UCS= Pmax
π ( D2
)2
One direction
Brazilian test 0.5-0.6 >10 10-50kN/min
Both directions TS= 2P
π × L × DOne
directionsShear test 3-3.5 >5 _ -
normalstress=Pn
A-
S h earStress=Ps
A
11 | P A G E
Triaxial compressive Test
2.5 >5 0.5-1 MPa/sec
- Stress= PA0
(in Pa)-
Point load strength index
Diametrical test ratio >1
>10 _ -I s=( De
50 )0.45
× Is
Axial test ratio 0.3-1
-
3) ISRM Standards for Testing of Rock Specimens in Laboratory (Ref: phyco mechanical properties PPT)
(a) Test specimens shall be right circular cylinders having a height to diameter ratio of 2.0-3.0 and a diameter preferably of not less than NX core size, approximately 54 mm. The diameter of the specimen should be related to the size of the largest grain in the rock by the ratio of at least 10:1.
(b) The ends of the specimen shall be flat to 0.02 mm and shall not depart from perpendicularity to the of the specimen by more than 0.001 radian (at 3.5 mm) or 0.05 mm in 50 mm.
(c) The sides of the specimen shall be smooth free of abrupt irregularities and straight to within 0.3 mm over the lull length of the specimen.
(d) The use of capping materials or end surface treatments other than machining is not permitted.
(e) The diameter of the test specimen shall be measured to the nearest 0.1 mm by averaging two diameters measured at right angles to each other at about the upper-height, the midheight and the lower height of the specimen. The average diameter shall be used for calculating the cross-sectional area. The height the specimen shall be determined to the nearest 1.0 mm.
4) Important terms ( Ref: phyco mechanical properties PPT)
Moisture Content (M): It is the ratio of weight of water in the voids to the weight of dry solids in the rock sampleM = Ww / Ws, where M = Moisture Content, Ww = Weight of water, andWs = Weight of Solids
Degree of saturation (S): It is defined as the volume of water in the void to the total volume of voids in the rock sample S = Vw / Vv, where Vw = volume of water, and Vv = volume of voids. The rockmass having higher porosity has higher degree of saturation
Permeability (k): The ability of porous material to allow a liquid to pass through its pores, units: cm/sec, or m/sec
Q = k i A
Q= discharge through area, i= hydraulic gradient
Swelling: It is an increase in volume of the mass due to suction of water or due to contact of water for a long-time Swelling is more in weaker type rocks
Anisotropy: Properties of the elements of the rock mass are not similar in every direction, due to sequence of rock formation, i.e., due to existence of bedding planes, etc. Anisotropic material has some weakness in a particular direction. Sedimentary rocks have high degree of anisotropy.
OR
12 | P A G E
When the properties of a material vary with different crystallographic orientations, the material is said to be anisotropic.
Isotropy: When the properties of a material are the same in all directions, the material is said to be isotropic and this property of rock is known as isotropy.
Durability: It is the resistance to destruction. If rock is more durable means it will last for a longer period when put into use. It depends upon the nature of environment against which the rock is going to be used. Swelling index or slake durability test is used to describe nature of weathering
5) References
International Society for Rock Mechanics Suggested Methods "Rock Characterisation, Testing and Monitoring" Editor E.T. Brown, Pergamon Press 1981, pages 113 to 114.
ASTM Standard Test Method D2938-80
13 | P A G E
Practical No. 2
Aim: Determination of uniaxial Compressive strength of rock sample
Standard test procedure for the determination of unconfined compressive strength of rock material.
1) Scope of the test
The aim of this test is to determine the unconfined (or uniaxial) compressive strength of rock specimens of cylindrical form. The test is mainly intended for use in strength classification and characterisation of intact rock.
1.1) Apparatus used
- A testing machine of sufficient capacity and capable of applying axial load at a rate conforming to the requirements described in the test procedure. The steel platens with which the specimen is loaded shall consist of hardened steel (specifications see ASTM and ISRM) and be at least as large, but preferably not more than double the diameter of the specimen.
- The upper bearing plate shall be equipped with a spherical seat. The centre of curvature of the spherical seat must coincide with the centre of the top face of the specimen.
2) Test procedure
- Test specimens shall be right circular cylinders having a height to diameter ratio of 2.5 and a diameter preferable of not less than 54mm. The diameter of the specimen should be at least 10 times larger than the average grain size.
The number of specimens from one sample to be tested shall preferably be at least five. If the sample rock is anisotropic due to the presence of weakness planes and/or preferred orientation of minerals, the specimens should be prepared in such a way that both directions parallel as well as perpendicular to such planes can be tested. If enough testing specimens are available various intermediate angles can also be tested.
The end faces of the specimen shall be flat to 0.02 mm and be perpendicular to the specimen axis within 0.250 (0.25mm in 50mm). During the test capping of the samples is not permitted (see appendix 1).
14 | P A G E
The sides of the cylinder shall be smooth and free of abrupt irregularities and straight to within 0.5 mm over the full length of the specimen.
- The diameter of the specimen shall be recorded to the nearest 0.1mm by taking two perpendicular measurements at three different heights of the cylinder. The height of the cylinder shall be determined to the nearest 0.1mm.
- Preferably specimens should be tested at their natural water content. Precautions have to be taken that this water content is preserved during storage and specimen preparation.
- The load on the specimen shall be applied continuously at a constant stress rate such that failure will occur within 5 to 10 minutes of loading. This means for relatively strong rock a stress rate between 0.5 and 1Mpa/sec. The maximum load on the specimen shall be recorded in Newton with an accuracy of 1%.
2.1) Diameter measurement of Sample
With UTM, the axial displacement w.r.t. load is to be recorded manually with thehelp of proving ring, while lateral deformation recorded using dial gauges orstrain gauges coupled to LVDT,if provided.With Instran machine Displacement between Loading Platens will give axialdisplacement of the specimen under loading and directly get recorded inconnected computer. Lateral displacement will be recorded in computer using the special attachmentshown below or manually recorded using strain gauges coupled to LVDT
2.2) Unconfined Compression Test for Rocks Ref. Standard: ASTM 2938
This equipment is used for determining unconfined compressive strength of intact rock core specimens. The rock sample is cut to length and the machined flat. The specimen is placed in a loading frame and if required heated to the desired test temperature. Axial load is continuously increased on the specimen until peak load and failure are obtained.
The equipment consists:Load frame AIM-065Capacity 200KNSpeed 12Proving Ring 100KN-AIM-275
Platens, Spherical Seating/Rigid Seating- As per ASTM-2938 requirements
15 | P A G E
3) Calculation
Uniaxial compressive strength(U . C . S)=Pmax
π ( D2 )
2
In this formula Pmax is the maximum load on the specimen (in N) and D is the average specimen diameter (in m). The uniaxial compressive strength is expressed in Mpa.
16 | P A G E
4) Reporting
The report shall include the following information:
(a) Data on the sampling:
- Project name, location, date of sampling, sample number, depth below terrain (in case of borehole)
- Sketch of the mode of failure
- Type of sample (core, block, disturbed, or other), sample dimensions
- Lithology, weathering grade, grain size, natural water content
- Sample transport and storage conditions
(b) Data on the specimens:
- Form, dimensions and weight of all specimens
- Density and water content during testing
(c) Data on the testing procedure:
- Description of the testing machine and the stress rate used.
- A table listing of all the specimens that the values of unconfined compressive strength determined and the orientation of weakness planes (if present) with respect to the specimen axis.
- The average value of unconfined compressive strength for all specimen, when necessary grouped together for the same orientation of their plane of weakness.
5) Remarks
An important part of this testing procedure is essentially identical with parts of the tests for the determination of the rock elastic modulus and the Poisson ratio. Often the test is executed for the three purposes simultaneously.
6) References
International Society for Rock Mechanics Suggested Methods "Rock Characterisation, Testing and Monitoring" Editor E.T. Brown, Pergamon Press 1981, pages 113 to 114.
ASTM Standard Test Method D2938-80
17 | P A G E
Practical no. 3
Aim: Determination of Tensile strength of a rock sample
A) Direct testing:-
1. Cylindrical specimen gripped by the adhesive plug2. Cylindrical specimen fixed in adhesive colours3. Cylindrical specimen hold directly4. Specimen of sharp similar to those use for metal testing 5. Briquette shaped specimen
Test strength by tension clutch
The clutch assembly a newly developed device consists of two clamps one upper and other lower. The specimen is held between them whose assembly is mounted in the tensile flatten of machine through tensional rocks. Each clamp made up in two parts the lower parts houses of clutch ring which is made up of three segments called jaw fingers. The inner side of each jaw finger is separated and its outer surface is trapped.
The three segments are kept in the conical lower part of the clamp and are held in position by spring. The upper cap is screwed over the lower part. The clutch is suitable for cylindrical
Specimen with diameter 0.5 to 0.75 cm and the fracture have been formed to take place near the centre of specimen. The tensile strength is calculated by the equation i.e
σt= ϵtπD 2
Where ϵt be the tensile load on fracture d be the diameter of specimen
The system gives the consistent result and is suitable for competent rock.
Tensile strength by tension shackle
The tension shackle is another newly developed apparatus. It also consist of two components one upper and other lower. The sectional assembly with hollow cylindrical sample mounted in the machine. Each component of the shackle consist of splites. It is connected to the suspension assembly through suspension screw whine have semi-spherical heads are threaded at the other end.
The shackle works on the principle of transmitting the pure tension to the specimen through splitters. The upper edge of the splitter being flatten on the tension being applying the concentration of shear stress on the upper edge of specimen does not takes place out because of the wedging action of the splitters tension is transmitted along the fracture plane at a right angle to the direction of load.
The tensile stress is calculated by this formula i.e
σ t=Kft
(D−d )L
Where,K is an experimental factor
‘ft’ be the applied tensile force
18 | P A G E
‘D’ is outer diameter
‘d’ is inner diameter
L is length of specimen
1) Determination of shear strength under condition without normal stressa) Single shear strength b) Double shear strengthc) Punch test
2) Determination of shear strength without but under compression a) Testing by inclined diesb) Cylindrical specimen c) Prismatic specimen
3) Testing irregular specimen by tensiona) Without constraint b) With constraint
4) Determination of shear strength under confinement in triaxial cell
The result of comparative study of shear strength by different methods generally gives consistence results.
The result of double shear with prismatic specimen inclined dips with cylindrical specimen and triaxial.
Standard procedure for the determination of rock material indirect tensile strength by the Brazilian test
1. By sending of cylindrical or prismatic specimen
2. Bending of discs
3. By loading transverse load
4. Ring test
1) Scope of the test
The purpose of the test is to determine the splitting tensile strength of rock material by diametrical line compression of a disk form specimen.
1.1) Apparatus used
- A suitable testing machine, capable to load to the rock specimen at the required speed (see test procedure) and measure the applied load with the required accuracy. - Loading platens of hardened steel between which the rock specimen is compressed.
- ASTM procedure is based on flat platens
19 | P A G E
- ISRM procedure uses specially designed loading jaws (see figure 1 of the ISRM suggested method) to reduce premature cracking due to high stress concentrations. If such loading jaws are used, then the spherical seat of the testing machine must be kept in a locked position.
The following test procedure is based on the use of flat platens. To reduce stress concentrations, cardboard with a thickness of 0.5 mm can be used between the specimen and the loading platens.
- Double thickness (0.2 to 0.4 mm) adhesive paper strip (masking tape) with a width equal or slightly greater than the specimen thickness.
2) Test procedure
- The test specimen must have the form of a cylinder, with end faces perpendicular to the axis. The cylindrical surface must be free from obvious tool marks and any irregularities across the thickness of the specimen should not exceed 0.25 mm. The end faces must be flat to within 0.25 mm and square and parallel to within 0.250. At least ten specimens should be taken from one sample to obtain a meaningful average.
If the sample rock is anisotropic due to the presence of weakness planes or preferred orientation of minerals, the specimens should be prepared in such a way that both directions parallel as well as perpendicular to such planes can be tested (axis of the cylinder parallel to the plane).
- The specimen diameter shall preferably be not less than NX core size (54 mm), or at least 10 times the average grain size. The thickness/diameter ratio should be 0.5 to 0.6.
- The specimen must be wrapped with the extra thick masking tape around it. If masking tape is not available cardboard can be used to prevent stress concentrations.
- The load on the specimen must be applied continuously at a constant rate such that failure occurs within a few minutes. The actual loading rate depends on the strength of the material and the size of the specimen and may vary from 10 to 50 kN/minute
3) Calculation
The splitting tensile strength of the specimen can be determined with the following formula:
( indirect ) tensilestrengt h= 2 Pπ × L × D
(inMpa)
In this formula P is the maximum load at failure (in MN);
20 | P A G E
L is the length of the specimen (in m) and D is the specimen diameter (in m).
4) Reporting
The report shall include the following information:
(a) Data on the sampling:
- Project name, location, sample number, co-ordinates, depth below terrain (in case of borehole), date of sampling.
- Type of sample (core, block, disturbed), sample dimensions.
- Lithology, weathering grade, grain size, natural water content.
- Sample transport and storage conditions
(b) Data on the specimens:
- Form, dimensions and weight of all specimens
- Density and water content during testing
(c) Data on the testing procedure:
- Type of the testing machine used, loading rate
- Sketch of then mode of failure
- The indirect tensile strength of each specimen, together with the average result for the sample. If the sample is anisotropic separate figures should be given for the directions parallel and perpendicular to planes of weakness.
5) References
International Society for Rock Mechanics Suggested Methods "Rock Characterisation, Testing and Monitoring" Editor E.T. Brown, Pergamon Press 1981, pages 119 to 121.
ASTM Standard Test Method D3967-81
21 | P A G E
Practical no. 4
Standard test procedure for the determination of the shear strength of rock material in direct shear
1) Scope of the test
The objective of this test is to determine the shear strength of discontinuity planes or weak horizons in rock as a function of the stress perpendicular to the sheared plane. Peak and residual strength are distinguished.
2) Apparatus used
- A mould to set the test specimen at the required orientation and position in the filling material (plaster or cement), leaving the shear plane free. This mould must have exactly the same form as the shear box, to ensure perfect fitting when sample plus filler material are placed in the shear box.
- Testing equipment (shear box) consisting of the following parts:
- System to apply the normal load perpendicular to the plane to be tested. The resultant load should pass through the centre of the area tested. The loading system must be capable to maintain and measure the normal force to within 2% of the selected value during the whole duration of the test.
- System to apply and measure the shear force to the specimen. The force must be directed parallel to the shear plane and act through its centre. The system should enable shear displacements of the order of magnitude of 10% of the length of the shear plane in the direction of sliding. The shear force must be capable of increase at constant rates and of measuring the shear force with an accuracy of 2%.
- Micrometer dial gauges for the measuring of shear and normal displacements with an accuracy of 0.05 mm. Shear and normal displacement measurements must be possible up to 5mm with an accuracy better than 0.05 mm
2.1) Direct Shear Apparatus, hand operated for rocks
22 | P A G E
Ref standard ASTM D-5607-95
The equipment is used for direct shear laboratory test in rock samples. The test measures peak and residual direct shear strength as a function of stress normal to the sheared plane. The equipment can be used for testing core, lumps specimens.
3) Test procedure
- Test specimens can be taken from borehole cores or from block samples which are cut or bored in the laboratory. Extreme care must be taken that during sample taking in the field, transport and storage and during the preparation of the specimen for the test, the weakness plane is not damaged or disturbed. For this purpose the sample can be protected against failure by metal wiring and against drying out by wax or special foam material. No specific requirements exist for the form of the sample as long as it fits in the shear box, is deep enoughenclosed in the filling material, and the shear plane is parallel to the shear direction of the shear box. The number of specimens from one sample to be tested shall preferably be at least five, each one at a different level of confining stress.
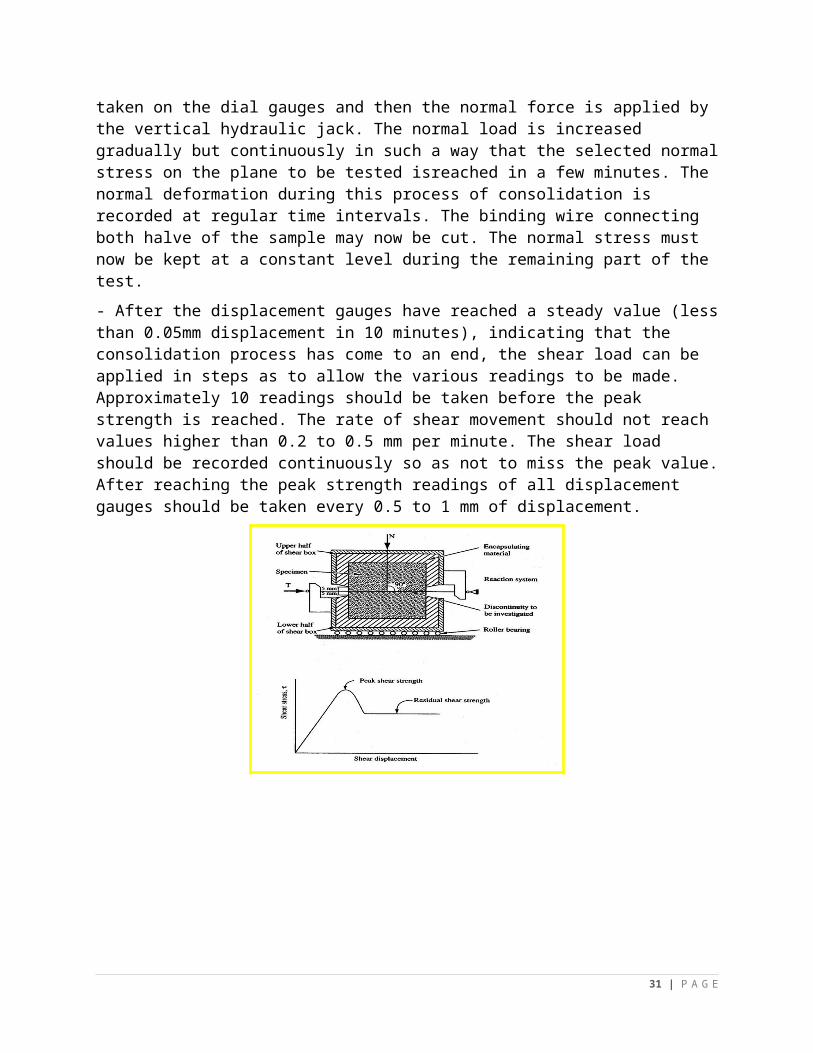
- After placing the hardened filler with the enclosed rock specimen in the shear box, the normal displacement and shear displacement measurement gauges are installed. A zero reading is taken on the dial gauges and then the normal force is applied by the vertical hydraulic jack. The normal load is increased gradually but continuously in such a way that the selected normal stress on the plane to be tested isreached in a few minutes. The normal deformation during this process of consolidation is recorded at regular time intervals. The binding wire connecting both halve of the sample may now be cut. The normal stress must now be kept at a constant level during the remaining part of the test.
- After the displacement gauges have reached a steady value (less than 0.05mm displacement in 10 minutes), indicating that the consolidation process has come to an end, the shear load can be applied in steps as to allow the various readings to be made. Approximately 10 readings should be taken before the peak strength is reached. The rate of shear movement should not reach values higher than 0.2 to 0.5 mm per minute. The shear load should be recorded continuously so as not to miss the peak value. After reaching the peak strength readings of all displacement gauges should be taken every 0.5 to 1 mm of displacement.
23 | P A G E
If at least four consecutive readings give not more than 5% of variation in shear stress over a displacement of more than 0.5mm, it can be concluded that the residual shear strength value has been reached.
- After a shear displacement of not more than 10% of the length of the shear plane in shear direction, the shear load can be reduced to zero. The shear direction can now be reversed (without decreasing the normal load) if residual values of shear strength for large amounts of shear displacements are requested. If not, or if residual strength has already been reached, the normal load can also be released, the specimen removed from the shear box and the shear plane inspected and described.
- An important observation is if the shear plane has coincided with the shear direction of the shear box. If this is not the case, a correction must be made for the inclination of the shear plane when normal and shear stress are determined.
3.1) The equipment consists of: Shear box size, (300mm x 300mm x 100mm) 1 No. Moulds for casting the samples 2 Nos. Jack capacity 100Kn 3 Nos.
a) One jack for normal load.b) One jack for shear load.c) One jack to return sample to original position.
Dial gauge 25 mm x 0.01 mm-6 nos.
-2 nos for measurement of shear displacement.
-4 nos for normal displacement and consolidation of sample. Hand operated hydraulic pump 700 bar 2 Nos. Load gauge-0.100 kN x 0.05 kN 2 Nos.
4) Calculation
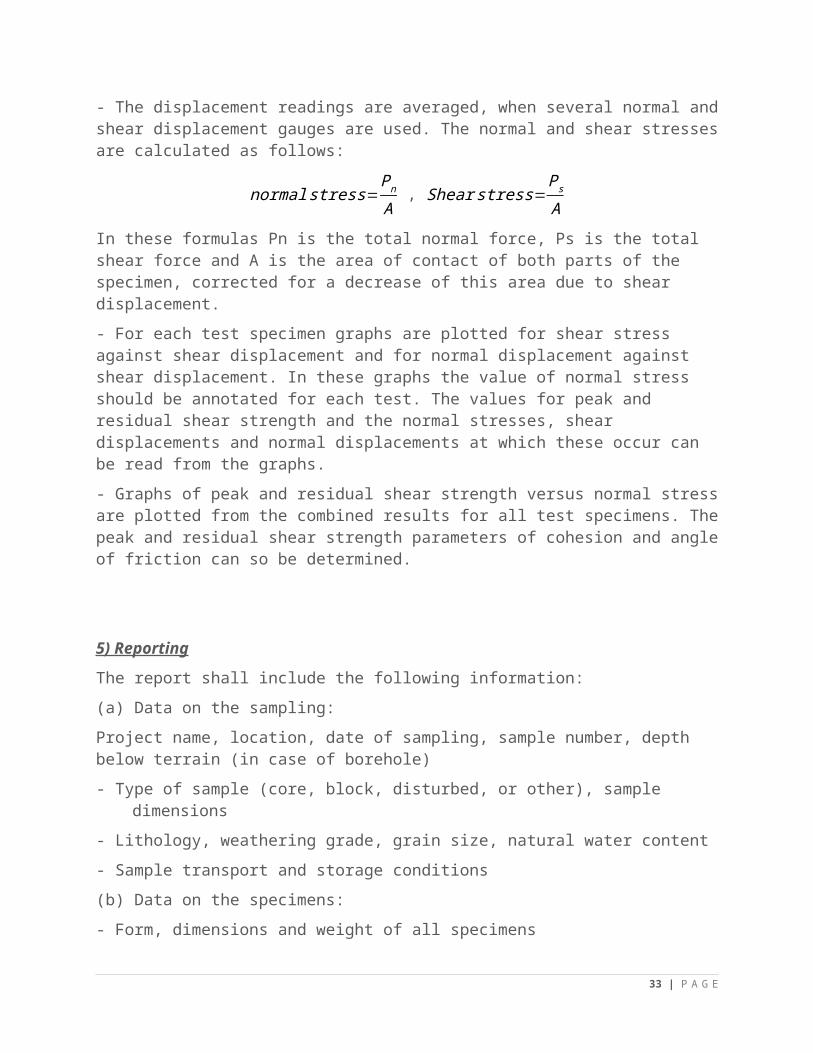
- The displacement readings are averaged, when several normal and shear displacement gauges are used. The normal and shear stresses are calculated as follows:
normal stress=Pn
A , Shear stress=
Ps
A
In these formulas Pn is the total normal force, Ps is the total shear force and A is the area of contact of both parts of the specimen, corrected for a decrease of this area due to shear displacement.
- For each test specimen graphs are plotted for shear stress against shear displacement and for normal displacement against shear displacement. In these graphs the value of normal stress should be annotated for each test. The values for peak and residual shear strength and the normal stresses, shear displacements and normal displacements at which these occur can be read from the graphs.
24 | P A G E
- Graphs of peak and residual shear strength versus normal stress are plotted from the combined results for all test specimens. The peak and residual shear strength parameters of cohesion and angle of friction can so be determined.
5) Reporting
The report shall include the following information:
(a) Data on the sampling:
Project name, location, date of sampling, sample number, depth below terrain (in case of borehole)
- Type of sample (core, block, disturbed, or other), sample dimensions
- Lithology, weathering grade, grain size, natural water content
- Sample transport and storage conditions
(b) Data on the specimens:
- Form, dimensions and weight of all specimens
- Water content of the shear plane during testing.
(c) Data on the testing procedure:
- Testing equipment used and loading rates during the test, sketch of specimen shear plane after the test.
- For each specimen the graphs of shear stress and normal displacement versus shear displacement and the graph of shear stress versus normal stress.
- Table with specimen number, normal stress and the corresponding values for peak andresidual shear strength with the corresponding values for shear displacement and normaldisplacement. - Shear stress versus normal stress graph for the values obtained from all testspecimens. Table with the concluded values of cohesion and angle of friction for peak and residual shear strength
6) Remarks
The levels of normal stress at which the shear test is executed shall be started at a low level and be increased on the basis of the results from the lower level shear strength.
7) References
International Society for Rock Mechanics Suggested Methods "Rock Characterisation, Testing and Monitoring" Editor E.T. Brown, Pergamon Press 1981, pages 135 to 137.
ASTM Standard Test Method D2664-80
25 | P A G E
Practical No. 5
Aim: Determination of triaxial cell
Standard test procedure for the determination of the strength of rockmaterial in triaxial compression
1) Scope of the test
The objective of this test is to determine the strength of cylindrical rock specimens subjected to triaxial compression. From the results of this test the values of internal friction and cohesion of the rock material can be calculated.
2) Apparatus used
- A triaxial cell body in which the specimen may be placed in order to apply the confining pressure.
- Both bearing plates shall be equipped with a spherical seat. The centres of curvature of the spherical seats must coincide with the centres of the end faces of the specimen.
- A flexible jacket to prevent the hydraulic fluid from entering the specimen. It shall be sufficiently rigid, so as not to enter surface pores.
- A testing machine of sufficient capacity and capable of applying controlling and measuring the axial load at a rate conforming to the requirements described in the test procedure. The steel platens with which the specimen is loaded shall consist of hardened steel (specifications see ASTM and ISRM) and be at least as large, but preferably not more than two mm larger than the diameter of the specimen. The spherical seating of the testing machine (if present) shall be removed or placed in a locked position.
- A hydraulic pump and oil pressure gauge, able to maintain and measure the confining oil pressure with an accuracy of 2%.
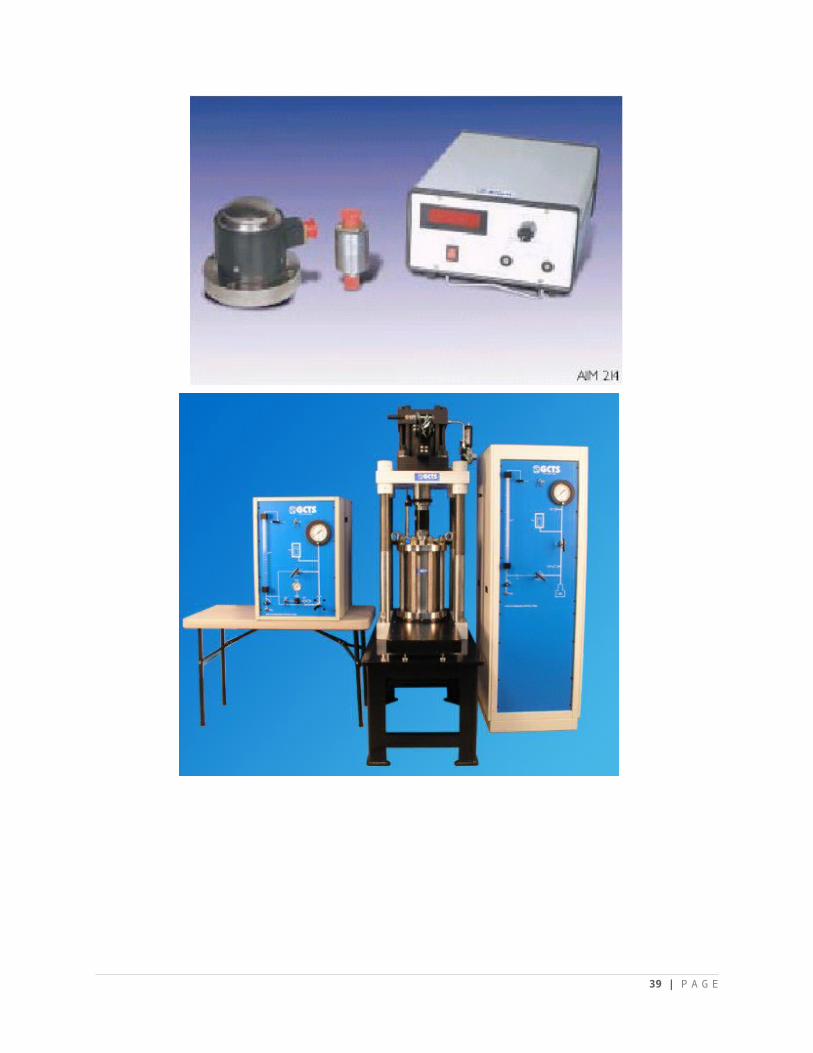
2.1) Machines used
TRIAXIAL TESTING OF ROCKS
Triaxial Cells
These cells are designed to withstand a lateral pressure of 150 bar (150 kg/cm2). Four no-volume change valves are fitted to the base for measurement of pore pressure , top drainage , bottom drainage and entries / exit of cell pressure. The cell is nickel platted and completely rust proof , hardened and ground pedestals are provided with radial grooves . the top loading pad is provided with spherical seating . Two port holes are provided to observe the sample during the assembly stage.
26 | P A G E
AIM 211 Triaxial Cell
For testing samples of 35 mm and 50 mm diameter.
AIM 212 Triaxial Cell
For testing samples of 75 mm and 100 mm 150 mm , AX, BX and NX sizes
Constant Pressure System:
AIM 213 Constant Pressure System for Rocks
The apparatus is designed to provide confining pressure upto 160 bar to triaxial cells.
The system consists of an oil pump, continuously driven by an electric motor during the entire process of operation to maintain the desired pressure.
The unit provides continuous variable pressure upto 160 bar which can be increased or decreased, simply by turning a control knob.
Supplied complete with pressure gauge. Flow valves and connecting pressure hose.
Range 0-160 Bar (0-160 kg/cm2)Steps of Pressure 1 Bar ( 1 kg/cm2)Accuracy ± 1% of indicated Load Electric Supply 220V. Single Phase , 50Hz, A C Supply
AIM 214 Electronics Instrumentation
27 | P A G E
This double channel electronic outfit is designed for direct reading of load and pore pressure in rock samples. This plug-in transducer module system facilitates easy installation and quick observation of readings.
The various components of this outfit consist of:
AIM 21401 Load CellCapacity 500 KN (50,000 Kgf)Resolution 0.1 KN (10 Kgf)Load Cell Excitation 7.5 V DCSensing Element Strain gauges in full bridge configuration
AIM 21402 Pore Pressure Transducer Capacity 200 bar (200 kg/cm2)Resolution 0.1 bar (0.1 kg/cm2)Pressure Cell Excitation 7.5 V DCSensing Element Strain gauges in full bridge configuration
AIM 21403 Digital Indicator, (Double channel)Mode of Display Digital, 3
12digit
Power Supply 230 V ± 10%, 50 Hz, ACNumber of Channels Two
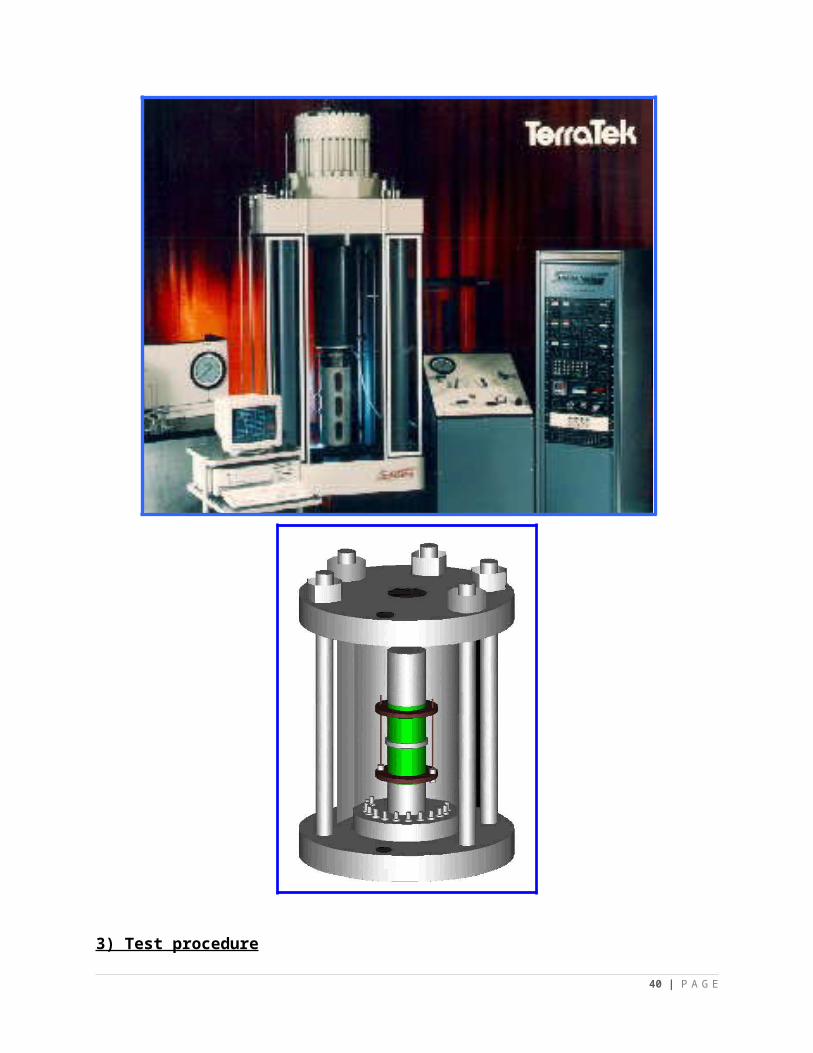
AIM 215 Triaxial Testing System
This high pressure triaxial testing system consists one each of the following:
Same as AIM 215, But with AIM 212 instead of AIM 211
29 | P A G E
30 | P A G E
3) Test procedure
- Test specimens shall be right circular cylinders having a height to diameter ratio of 2.5 and a diameter preferable of not less than NX core size (54mm). The diameter of the specimen should be at least 10 times larger than the average grain size.
The number of specimens from one sample to be tested shall preferably be at least five, each one at a different level of confining stress. For the determination of cohesion and friction also the results from specimen(s) tested in unconfined compression can be used. If the sample rock is anisotropic due to the presence of weakness planes and/or preferred orientation of minerals, the specimens should be prepared in such a way that both directions parallel as well as perpendicular to such planes can be tested. If enough testing specimens can be prepared from the available sample, various intermediate angles could also be tested.
- The end faces of the specimen shall be flat to 0.025 mm and be perpendicular to the specimen axis within 0.250 (0.25 mm in 50 mm). During the test, capping of the samples is not permitted. The sides of the cylinder shall be smooth and free of abrupt irregularities and straight to within 0.5 mm over the full length of the specimen. (Methods for the check of specimen from requirements are described in appendix 1.
- The diameter of the specimen shall be recorded to the nearest 0.1 mm by taking two perpendicular measurements at three different heights of the cylinder. The height of the cylinder shall be determined to the nearest 0.1 mm.
31 | P A G E
- Moisture can have a significant effect on the triaxial strength of the test specimen. When possible the natural water content shall be preserved until the time of the test. The moisture condition shall be reported in accordance with test nr. 2 in this handbook.
- The cell must be assembled with the specimen aligned between the steel platens and surrounded by the jacket. The specimen, the platens and the spherical seats shall be accurately aligned so that each is coaxial with the others.
The cell is placed into the testing machine. The confining stress and axial load are increased simultaneously and in such a way, that axial stress and confining pressure are approximately equal, until the predetermined level of confining pressure is reached. Subsequently, the confining pressure shall be maintained to within 2% of the prescribed value.
- The axial load on the specimen shall then be increased continuously at a constant stress rate such that failure will occur within 5 to 15 minutes of loading. This means for relatively strong rock a stress rate between 0.5 and 1 Mpa/sec.
- The maximum axial load and the corresponding confining pressure of the specimen shall be recorded.
4) Calculation
- The maximum axial load is converted to axial stress in the following way:
Axial Stress= PA0
(¿ Pa)
In this formula P is the maximum axial load (in Newton), A0 is the cross sectional area of the specimen at the start of the test.
- Construct Mohr circles for the test results from the unconfined compressive strength test and the triaxial compressive strength tests at the different values of confining pressure.
5) Reporting
The report shall include the following information:
(a) Data on the sampling:
- Project name, location, date of sampling, sample number, depth below terrain (in case of borehole)
32 | P A G E
- Type of sample (core, block, disturbed, or other), sample dimensions
- Lithology, weathering grade, grain size, natural water content
- Sample transport and storage conditions
(b) Data on the specimens:
- Form, dimensions and weight of all specimens
Density and water content during testing.
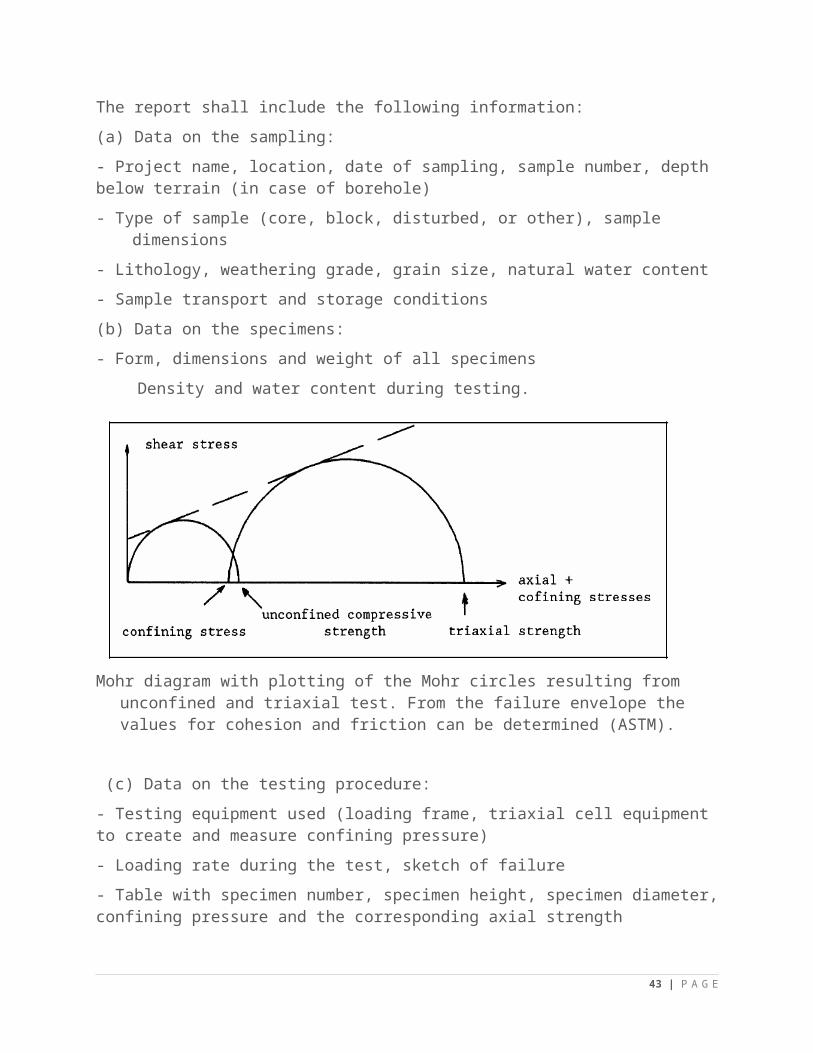
Mohr diagram with plotting of the Mohr circles resulting from unconfined and triaxial test. From the failure envelope the values for cohesion and friction can be determined (ASTM).
(c) Data on the testing procedure:
- Testing equipment used (loading frame, triaxial cell equipment to create and measure confining pressure)
- Loading rate during the test, sketch of failure
- Table with specimen number, specimen height, specimen diameter, confining pressure and the corresponding axial strength
- Mohr diagram with the Mohr circles from unconfined and triaxial strength tests
- Angle of internal friction and cohesion as determined graphically from the Mohr diagram
6) Remarks
The levels of confining pressure at which the triaxial test is executed shall be determined on the basis of the result of the unconfined compressive strength testing plotted in the Mohr diagram.
7) References
33 | P A G E
1)International Society for Rock Mechanics Suggested Methods "Rock Characterisation, Testing and Monitoring" Editor E.T. Brown, Pergamon Press 1981, pages 254 to 127)
ASTM Standard Test Method D2664-80
2) Rock testing per ISRM
Practical No. 6
Aim: Determination of point load strength index
Standard test procedure for the determination of the point load strength of rock material
1) Scope of the test
The point load strength test is intended as an index test for the strength classification of rock material. It may also be used to predict other strength parameters with which it is correlated, for example uniaxial compressive and tensile strength. The test determines the Point Load Strength Index Is (50) of rock specimens (expressed in units of stress, preferably in MPa) and their Strength Anisotrophy Is (50), which is the ratio of Point Load Strength values in directions which give the highest and lowest values.
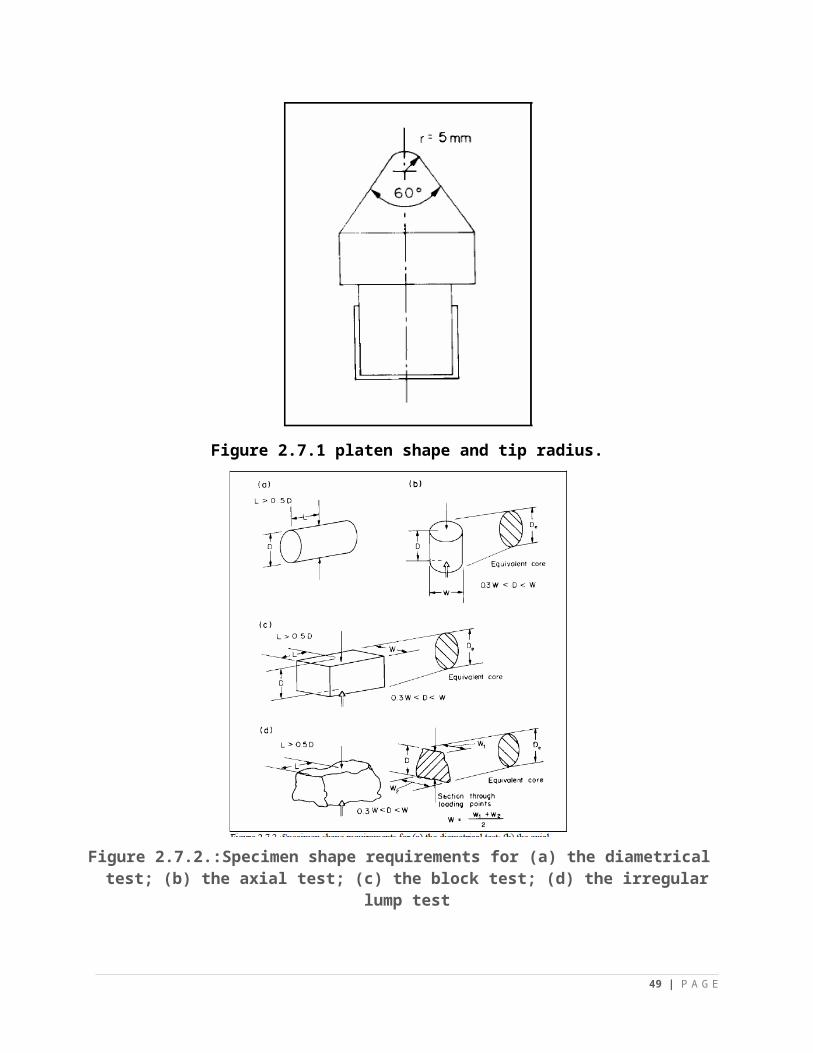
Rock specimens in the form of either core (the diametral and axial tests), cut blocks (the block test), or irregular lumps (the irregular lump test) are broken by a pair of spherically truncated, conical platens (see fig. 2.7.1)
2) Apparatus used
34 | P A G E
- The standard testing machine for point load testing, according to the specifications listed in the "suggested method for determining point load strength" issued by the International Society for rock mechanics.
- A calliper to measure the width W of the specimens and the diameter D of core samples. Accuracy 0.1 mm.
2.1) Machines used
AIM 206-I Point Load Index Tester (Ref Standard – IS: 8764)
Point load index tester, is used for determining the diametral point load strength index of rock cores and irregular lumps which can be tested
AIM 206-I Point Load Index Tester(Ref Standard – IS:8764)
Point Load Index Tester, is used for determining the Point Load Index of rock cores and irreguler lumps which can be tested without any treatment. The Point Load Test is primarily an index test for strength classification of rock materials. This instrument is mainly intended for field measurements on rock specimen but it can also be used in the laboratory. The results of the test may balso be used to predict the uniaxial compressive strength of rock from correlations. The apparatus is light and portable. It can be used in the laboratory as well as in the field.
Features:
Equipments is light and portable. Rock core specimens can be tested without any preperation. The instrument can be used in laboratory as well as at the drilling site. The results of the test may also be use to predict the uniaxial compressive strength of
rock. With this instrument, a wide range of core sizes can be tested. The frame has adequate adjustments to align perfectly the loading axis passing through
the centre of the bearing plates and loading platens at positions of the ram of the hydraulic jack.
35 | P A G E
2.2) Specimen selection and preparation
A test sample is defined as a number of rock specimens of similar strength for which a single Point Load Strength value is to be determined (preferably 10 specimens at least are tested from 1 sample).
For diametrical tests the specimens should have a ratio of length to diameter which is greater than 1.0.
For axial tests the core specimens should have a ratio length/diameter between 0.3 and 1.0.
For block tests and for irregular lump tests the shape requirements are illustrated in figure 2.7.2. (c) and 2.7.2.(d). The ratio D/W should be between 0.3 and 1.0, preferably close to 1.0.
For all types of samples the size limits are 15mm<D<85mm, however it is preferred that the D size of the specimens is as close as possible to 50mm, which is the size at which the standard index is defined.
For routine testing and classification, specimens should be tested either fully water-saturated or at their natural water content.
2.2.1) Test procedure for diametrical test
- The specimen is inserted in the testing machine and the platens are closed to make contact along a core diameter, ensuring that the distance L between the contact points and the nearest free end is at least 0.5 times the core diameter (fig. 2.7.2.a).
-The distance D is recorded +/- 2%.
- The load is steadily increased such that failure occurs within 10 to 60 seconds and the failure load P is recorded. The test should be rejected if the failure surface passes through only one loading point (see fig 2.7.3).
36 | P A G E
- The procedures above shall be repeated for the remaining specimens in the sample.
2.2.2) Test procedure for the axial test
- The specimen is inserted in the testing machine and the platens are closed to make contact along a line which is perpendicular to the core end faces. In case of isotropic rock this is usually parallel to the core axis, but for anisotropic rock see figure 2.7.3.
- The distance D between the platen contact points is recorded +/- 2%. The specimen width W, perpendicular to the loading direction is recorded +/- 5%.
- The load is steadily increased in such a way, that failure occurs within 10 to 60 seconds, and the failure load P is recorded. The test should be rejected as invalid if the fracture surface passes through only one loading point see fig. 2.7.3.
Figure 2.7.1 platen shape and tip radius.
37 | P A G E
Figure 2.7.2.:Specimen shape requirements for (a) the diametrical test; (b) the axial test; (c) the block test; (d) the irregular lump test
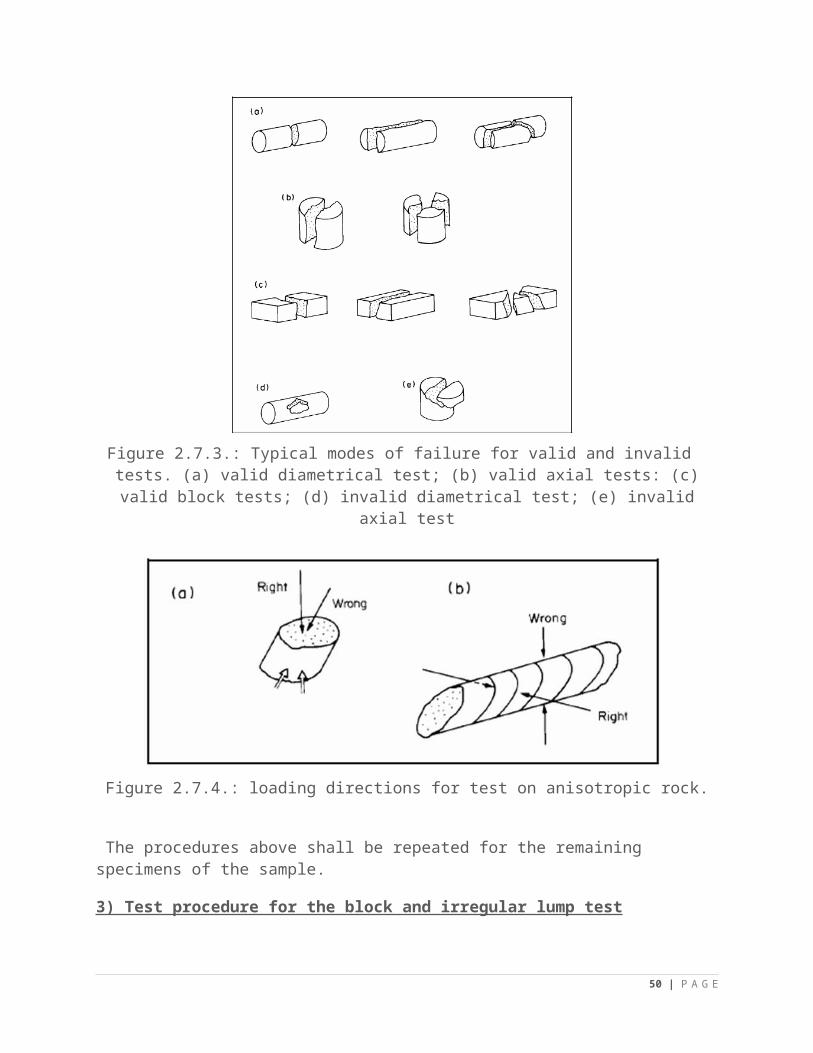
Figure 2.7.3.: Typical modes of failure for valid and invalid tests. (a) valid diametrical test; (b) valid axial tests: (c) valid block tests; (d) invalid diametrical test; (e) invalid axial test
38 | P A G E
Figure 2.7.4.: loading directions for test on anisotropic rock.
The procedures above shall be repeated for the remaining specimens of the sample.
3) Test procedure for the block and irregular lump test
- The specimen is inserted in the testing machine, assuring that the distance L (see fig. 2.7.2(c) and 2.7.2(d)) is at least 0.5 W. The specimen must be inserted in such a way that D is the smallest dimension of the specimen and that the platens are in contact with the specimen away from edges and corners.
- The distance D between the platens is recorded +/- 2%. The smallest specimen width W perpendicular to the loading direction is recorded +/- 5%. If the sides are not parallel, the W is calculated as (W1 + W2)/2 as shown in fig. 2.7.2(d). This smallest width is used for further calculation. It does not depend on the actual mode of failure.
- The load is steadily increased in such a way that failure occurs within 10 to 60 seconds and the failure load P is recorded. The test should be rejected as invalid if the fracture surface passes through only one loading point.
- The procedures above shall be repeated for the remaining specimens of the sample.
3.1) Testing of anisotropic rock
- When a rock is shale, bedded, schistose or otherwise anisotropic due to a clearly developed splitting direction, it should be tested in directions which give the lowest and highest strength values, which are in general parallel and perpendicular to the planes of anisotropy.
- If the sample consists of core drilled through the weakness planes, a set of diametrical test may be completed first, spaced at intervals which will yield pieces which can then be tested axially.
- Best results are obtained when the core axis is perpendicular to the planes of weakness, so that when possible the core should be drilled in this direction (this is possible when the cores are bored in the laboratory from a large block of rock). The angle between the core axis and the line perpendicular to the weakness planes should preferably not exceed 300.
39 | P A G E
- For measurement of the Is value in the directions of least strength, care should be taken to ensure that load is applied along a single weakness plane. Similarly when testing for the Is value in the direction of greatest strength, care should be taken to ensure that the load is applied perpendicularly to the weakness planes (see fig. 2.7.4.).
- If the sample consists of blocks or irregular lumps, it should be tested as two sub-samples, with load applied firstly perpendicular to, then along the observable planes of weakness. Again, the required minimum strength value is obtained when the platens make contact along a single plane of weakness.
4) Calculation
Uncorrected Point Load strength
The uncorrected point load strength Isis calculated as P/De2, where De (the equivalent core diameter) is given by:
De2 = D2 for diametrical tests
= 4A/π, for axial, block and lump tests and
A = W * D = minimum cross sectional area of a plane through the platen contact points
5) Size correction
- It varies as a function of D in the diametrical test, and as a function of De in axial, block and irregular lump tests, so that a size correction must be applied.
- The size corrected Point Load Strength Index Is (50) of a rock specimen or sample is defined as the value which would have been measured by a diametrical test with D = 50 mm.
- The most reliable method of obtaining Is (50), is to conduct diametrical tests at or close to D = 50 mm. Size correction is then either unnecessary (D=50mm) or introduces a minimum of error. This is the case, for example, for diametrical tests on NX core (D=54mm). Most point load strength tests, however, are executed using other sizes or shapes of specimen. In such cases the size correction as below must be applied.
- The most reliable method of size correction is to test the sample over a range of D or De values and to plot graphically the relation between P and De2. If log-log plotting is used the relation is usually a straight line (see fig. 2.7.5). Points that deviate substantially from the straight line may be disregarded (although they should not be deleted). The value P50 corresponding to
De2=2500mm2 can then be obtained by interpolation, if necessary by extrapolation, and the size corrected Point Load Strength Index calculated as P50/502.
- When this method is not practical, for example when testing single sized core at a diameter other than 50 mm or if only a few small specimens or lumps are available, size correction may be accomplished by using the formula:
Is(50)=( De50 )
0.45
× Is
40 | P A G E
- It has been found, that the size correction procedures specified above are not influenced by the degree of anisotropy Ia and the direction of loading with respect to planes of weakness; a result that greatly enhances the usefulness of this test.
6) Mean value calculation
The mean value of Is (50) is to be calculated by deleting the two highest and lowest values from the 10 or more valid tests, and calculating the mean of the remaining values. If significantly fewer specimens are tested only the highest and the lowest value are deleted and the mean calculated from those remaining.
Point Load Strength Anisotropy Index
The point load strength anisotropy index Ia(50) is defined as the ratio of mean Is(50) values measured perpendicular and parallel to planes of weakness, i.e. the ratio of the highest to lowest Point Load Strength Indices. The strength anisotropy index assumes values close to 1.0 for quasi-isotropic rocks and higher values when the rock is anisotropic.
7) Reporting
The report shall include the following information:
(a) Data on the sampling:
Project name, location, date of sampling, sample number, depth below terrain (in case of borehole)
- Type of sample (core, block, disturbed, or other), sample dimensions
- Lithology, weathering grade, grain size, natural water content
- Sample transport and storage conditions
(b) Data on the specimens:
- Form and dimensions of all specimens
- Density and water content during testing
(c) Data on the testing procedure:
Results for diametrical tests, axial tests, block tests and irregular lump tests, and for tests perpendicular and parallel to planes of weakness should be tabulated separately.
- For every specimen tested, it must be indicated which direction with respect to planes of weakness in the rock (if recognisable) was tested.
A tabulation of the values of P, D, (W, De2 and De if required), Is, (F if required) and Is(50) for each specimen in the sample.
For all isotropic samples a summary tabulation of mean Is(50) values.
For all anisotropic samples a summary tabulation of mean Is(50) values for sub-samples tested perpendicular and parallel to the planes of weakness, and of the corresponding Ia(50) values.
41 | P A G E
8) Remarks
For a thorough discussion about the principles of the test and about the practical application of its results see the "notes" on the pages 57 to 60 of the publication about the Suggested Method by ISRM.
9) References
ISRM - Commission on testing Methods. Working Group on Revision of the Point Load Test Method. "Suggested Method for Determining Point Load Strength", Int. Journal Rock Mech. Min. Sc. Vol.22, No.2, pp.51
42 | P A G E
Practical no. 7
Aim: - Determination of protodykonov strength index.
1) Protodyakonov Impact Strength Test
Protodyakonov Impact Strength Index (PSI) is a way of characterizing coal strength, which has immense possibility for practical implementation in coal cutting and drilling. It also gives an idea about the uniaxial compressive strength of the rock.
2) Method
Impact strength index test is first discovered by Protodyakonov to put forward an idea about the Rock’s strength properties, cuttability and brittleness, then is improved by Evans & Pomeroy (1966)
This technique is based upon the crushability of rock under standard experimental condition.
This test is performed by a vertical cylinder apparatus which is 30cm - 48 cm in height and has a steel plunger.
100 gm of sample is taken of size 4.75 mm to + 3.35 mm is taken in the cylinder.
50 gm of sample is taken if the sample is coal.
A plunger is dropped from a height of 65 cm into the cylinder in which the sample is kept.
The weight of the plunger taken is around 2.4 kg.
The plunger is dropped 20 times in the cylinder if the sample is rock and 15 times if the sample is coal.
The crushed sample is collected and is sieved through 0.5 mm sieve.
The -0.5 mm sample is collected and filled in the volumeter.
The height “h” in the volumeter is measured.
Protodyakonov impact strength index is found out by using the following formulae.
P.S.I = (20 x n)/h
Where
43 | P A G E
P.S.I = Protodyakonov strength index
n = no of blows
h = height in the volumeter
Fig 1. Coal sample after sieving Volumeter
Volumeter
Method of Calculation
• Initial weight of sample =50 gms for coal
• Initial weight of sample =100 gms for rock
• Height in volumeter = h
• No of blows = n = 15 for coal
• No of blows = n = 20 for rock
• P.S.I = 20 x n/h
Protodyakonov Impact Strength Test
The protodyakonov test was carried out with coal and sandstone samples. The determination of protodyakonov impact strength index tells about the crushing strength of the rocks and also reflects about the compressive strength of the rocks.
For coal samples the number of blows was 15.The number of tests carried out for coal samples was three It was found that the height in the volumeter of the coal samples was ranging between 31 to 34 mm.
The protodyakonov strength index was found out be ranging between 8.823- 9.677. The average of the strength indices was found out which came to be 9.291.
The number of blows given to sandstone sample was 20. Due to less available sandstone samples
2 tests were done for determining the protodyakonov impact index.
Protodyakonov test table for sandstone samplesSERIALNO.
WEIGHTOFSAMPLE
NUMBEROF BLOWS
HEIGHT OF FINES INVOLUMETER(MM)
P.S.I AVERAGEP.S.I.
1 100 20 16 25 23.62 100 20 18 22.2
The heights in the volumeter was found to be 16 and 18 mm, while the protodyakonov impact index was found to be average of 25 and 22.2 ,that is 23.6.
On comparing the values of the sandstone samples and coal samples, the sandstone samples show high values. This may be due to the high silica content in the sandstone which increases the resistance to the sudden impacts given by the plunger weighing 2.4 kg.
Ref:
DETERMINATION OF ROCK STRENGTH FROM SLAKE DURABILITY TESTS, PROTODYAKONOV IMPACT TESTS AND LOS ANGELES ABRASION RESISTANCE TESTS
A thesis submitted in partial fulfilment of the requirements for the degree of
Bachelor of Technology in Mining Engineering
By:- CHINMOY SWAIN
10605009
Department of Mining Engineering
National Institute of Technology
Rourkela-769008
2010
Practical no. 8 (Instrumentation)
45 | P A G E
1) STRATA MECHANISM:
Host rock geometry in coal mining is represented by stratified rock masses of relative weaker strength. Such stratifications are compound and unite in their virgin state before any kind of mining. Mining underneath (Both development and depillaring) tend to develop strain along weaker bedding planes generating bed separation, called as Dilation. By the action of gravity, the dilated mass / stratums are supposed to sag along its span within the mining voids / openings, subsequently reducing the gap between the floor and roof of workings, called as Convergence. Sagging of stratums from the roof under the influence of Dilation and subsequent convergence tend to exert certain Load on the support system and remaining pillar sides either static or dynamic. Dilation / Bed separation causes change in stress from its in-situ state, which in turn is propagated in the rocks around. Such induced effect of stress can be revealed in the workings with the help of instrumentation, aiding apprehension of strata movement and subsequent assessments.
2) OBJECTIVE:
Objective of the study is to identify, assess and co-relate the parameters of Strata mechanism such as Dilation, Convergence, Load, Axial Loadingand Stress etc. by instrumentation so as to provide a basis for the design of support system to prevent or control the collapse or failure of the roof, floor and ribs both safely and economically.
3) PARAMETERS OF STRATA MECHANISM:
Dilation & bed separation with in roof. Convergence of roof. Stress developed on pillars / ribs. Strain developed / Axial loading on roof bolts. Load on supports
4.0 INSTRUMENTATION & MONITORING:
4.1 Dilation
This is the width of gap generated due to bed separation, between twoconsecutive stratums. This can be monitored by installation and function of,
(i) Tell Tale
(ii) Multi Point Bore Hole Extensometer
(iii) Magnasonic Extensometer
I)Tell Tale:-
46 | P A G E
With conventional free standing support such as props, there is obvious indication when they are carrying excessive load, the greater the load the greater the deformation. Roof bolts however give no visual indication of load increase and therefore no indication of how close either the individual bolts or the system is to ultimate failure tell tale multi spring wire extensometer will detect any unstable trends in the strata so that timely remedial action can be taken by the management.
Tell tale is strata- extensometer. It provide pre-emptive warning of roof-falling. The dual-height tell tale provides an immediate visible warning, distinguishing between movement above and below rock-bolted height. It was first developed by British coal in early 1990’s. Subsequent to that many permutations and improvements in the basic design has been developed to suit different mining conditions. A brief outline of the different types of tell tales and their application is given below-
I.1) Single Height Tell Tale
It comprises a strata movement indicator usually with colour bands and/or graduations. As its simplest a mechanical tell tale consist of a strata movement indicator positioned in the mouth of a drilled hole and attached to an anchor installed up the hole. The earliest tell tale where simply longer bolts, point anchored above the support bolt horizon, and left protruding from the roof to indicate movement with the bolted horizon. These suffered from the disadvantages of limited monitored height and false readings caused by roof shear, which can result in the tell tale bolt being trapped along its length and pulled down with the roof. A typical single height tell tale now consists of a reference tube, an indicator tube, a stainless steel wire and a spring anchor positioned at twice the bolted height as shown in figure-
I.2) Dual Height Tell Tale
I.2.1) Introduction
Dual height tell tale is designed to be installed for monitoring the bolted strata. They have two versions- one for dry drilled holes and other for watery drilled holes. This is designed to be installed following the installation of the roof bolt reinforcement. The general assembly is shown in figure-
47 | P A G E
48 | P A G E
I.2.2) Installation
1. Drill hole, using appropriate bit to at least twice the bolt length.2. Insert top anchor, attached to smallest indicator ‘B’, to top of hole. Used purpose-
designed insertion rods graduated to confirm anchor position. Check for firm anchorage.3. Insert lower anchor attached to large indicator ‘A’, 0.3m below the top of the
reinforcement height using purpose graduated insertion rods.4. Secure reference tube.5. Position indicator ‘A’, top of green band to be level with bottom of reference tube. Align
to scale. Crimp ferrule in position.6. Position indicator ‘B’ top of green band to be level with bottom of indicator of ‘A’. Align
to scale. Crimp ferrule in position.7. Record details: At all tell tale sites a sign must be placed bearing a unique reference code
for identification purpose giving the type of tell-tale, its position date and time of installation and anchor height. This information should be passed to relevant officials, eg. The safety officer or manager.
I.2.3) Reading Methods
1. By colourReport whole and part bands visible e.g‘A’: Green, Yellow, Red‘B’: ¾ Green Yellow, Red
2. By Scale Report measurement, in millimetres, lining up with reference mark for each anchor. Reference for ‘A’ is bottom of reference tube.Reference for ‘B’ is bottom of indicator ‘A’.Scale has millimetre divisions, with centimetre marks
I.2.4) Interpretation
1 Movement of ‘A’ relative to its reference (bottom reference tube) is equal to the strata expansion within the bolted reinforcement height.
2 Movement of ‘B’ relative to its reference (bottom of A) is equal to the strata expansion of the top of bolt reinforcement height .
3 The total strata expansion is A+B
4 Expansion of strata above the top is not detected
I.3) THREE POINT TELL TALE
It is an improvement on this basic design of dual height tell tale. It is advocated where a combination of roof bolts and long tendons are installed at the face.
49 | P A G E
Since the adoption of the mechanical tell tale, many permutations and improvements on the basic design have been developed and applied to suit different mining circumstances. The triple height tell tale has been developed where 1-8m full column bolts and long tendon bolts of 3.6m height are used. As its name suggests, the triple height tell tale has an additional concentric indicator when compared to the dual height tell tale. The A indicator (nearest roof) is anchored 0.3m below the top of rock bolts, the B indicator ( middle) is anchored 0.5m below the top of the longer bolts and C indicator (lowest) is anchored a minimum of 5m above the roof horizon or 1m above the longer bolt. This allows the miner personnel and particularly the support engineer to easily determine whether any measured roof dilation is occurring within the bolted height (A indicator), in the roof zone reinforced by longer bolts alone ( B indicator ) or above the reinforced height ( C indicator ) and hence allows the most appropriate type of remedial support to be applied where required.
I.4) Four Point tell tale
It is a general purpose four wire extensometer, incorporating a water diverting feature and easily read visual indicators. The indicators are 150mm long and graduated in millimetres, with a centimetres scale. The range of the instrument is defined by the length of each indicator and the travel available (150 mm maximum). The system is designed for installation in vertical up holes and employees gravity of wire tensioning.
50 | P A G E
I.5) ROTARY TELL TALE
Mechanical tell tales installed in the roadways are difficult to read where the height is more. This problem has been overcome for single height tell tale by developing the rotary tell tale. The device converts roof movement into the rotation of a pointer round a dial and magnifies the movement by a factor of fifteen. It is easy to read, easy to install, accuracy is better than one mm and is of low cost. Small movement can be read easily with the reading visible from below even in a 5 metre high roadway. The dial is subdivided into coloured bands corresponding to chosen action levels.
I.5.1) Installation
1. Drill hole using 43mm bit to the required height.
2. Insert anchor of suspension cable to the top of hole. Use graduated purpose insertion rod to conform anchor position. Tug wire to seat anchor.
3. Keeping the suspension cable under tension, the reference tube can now be inserted into the bottom of the hole.
4. Position tube fitted with indicator to the lowest point and crimp ferrule.
5. Rotate and loosen positioning nut, rotate 12 sided scale disc and align pointer to 0 mark on scale.
6. Tighten positioning nut.
7. Now the extension meter is ready for working. Movement on the roof will be transferred to the reference tube. Pointer position on scale will indicate the strata expansion in mm.
Green zone : 0-5mm
Yellow zone : 6-10mm
Red zone : 11-25mm
51 | P A G E
I.6) AUTO WARNING TELL TALE
This provides a warning of impending goafing in depillaring operations via high visibility flashing LED’s. Intended applications include pillar extraction areas in room and pillar workings to give warning of impending goafing. It has the potentiality of saving many miners’ lives during the depillaring operation. This is based on the premise that goafing events are recorded by smaller scale roof dilation which will be detected by the tell tale. The tell tale design includes a low volt alkaline primary cell supply and LED configuration housed within the existing tell tales plastic drip dry molding. The auto warning electronic module powers the LEDs in a flashing sequence when a pre-set level of tell tale movement is reached. A minimum of two LEDs are employed. The flasher module has an operational ‘flashing’ life of over a week. The auto warning tell tale is currently being used in the first fully mechanised pillar extraction board and pillar mines in ECL, SECL, WCL and SCCL. Tell tales are being installed in each junction and roadway midpoint prior to extraction operation. The tell tales used are single height types with the anchor position at 10 m into the roof and a trigger level of 5 mm. This combination of large monitored height and low trigger level is intended to insure that the tell tale warning is triggered prior to the major goafing event.
I.6.1) Installation
1. Drill hole using 43mm bit to the required height.
2. Pre set the auto warning tell tale to the desired scale where auto warning is to trigger.
3. Insert anchor of suspension cable to the top of the hole. Use graduated purpose insertion rod to conform anchor position. Tug wire to seat anchor.
52 | P A G E
4. Keep the suspension cable under tension, the reference tube can now be inserted into the bottom of the hole. The reference tube should be pushed fully into the hole.
5. Position tube fitted with indicator to the lowest point and crimp ferrule.
6. Now the extension meter is ready for working. Movement on the roof will be transferred to the reference tube. When the roof movement reaches the preset scale auto warning LED will glow and start blinking.
II) Multi Point Borehole Extensometer
II.1) Principle –
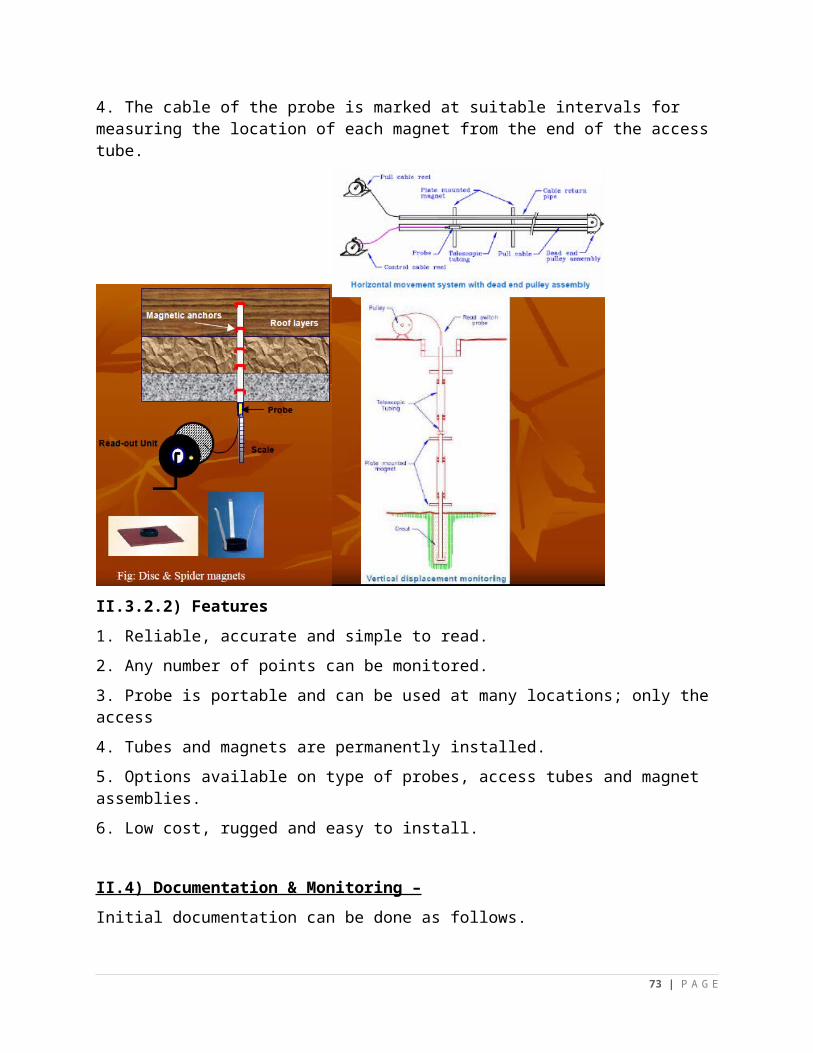
It is a basic instrument designed to measure strata dilation i.e., bed separation at strategic horizons, being placed inside a bore hole. It is a remote sensing instrument can be used at both accessible and inaccessible locations. It is very helpful to inculcate dead load in the roof mass and subsequent design of support requirement of the workings. Magnasonic extensometer it consists of anchors, rods, protective casing and transducers with displacement sensors. The anchors are made pre set to strategic horizons within a bore hole through anchor rods. Any dilation in these horizons cause movement of anchors and there causes a resultant displacement of anchor rods within transducer. Transducer, by the help of displacement sensors cause change in frequency, which is inculcated by the Read out Unit and further converted to mille meters (mm).
II.2) Applications and features
It consists of multiple anchors and is fixed to monitor the following:-
Bed separation between layers Progressive failure height of strata Magnitude and locations of strata movement Ensure efficiency of bolting and influence the extraction or development
53 | P A G E
It can be fixed in the side walls of the pillar or gallery to monitor. Pillar spalling or sloughing and cracks development is pillars
Can be fixed in the roof either from surface or from upper seam (300m) or from the working seam (24m) to monitor strata dilation as well as caving behaviour of roof rocks
Can be monitored remotely
Instrument fixed in the roof from working seam fails immediately after immediate roof fail.
II.3) Types of extensometer:- Sonic probe Magnetic
II.3.1) Sonic Probe extensometer
II.3.1.1) Principle of Sonic Probe Extensometer
1. The principle of the sonic probe relies on the magnetostrictive properties of the probe material.
2. An electric pulse in the head of the probe drives current up the length of the wand.
3. Interaction with the field produced by the toroid magnet induces an ultra-sonic signal that travels back to the head in the wave guide.
4. This acoustic signal is converted into an electrical signal and the time between pulses resolves the differences in position of the anchors as the speed of sound in the wave guide is known.
54 | P A G E
II.3.1.2) Features-
Quick, easy installation and readout
1. Portable, reusable sonic probe and sensor
2. Remote electronic readout
3. reads inter-anchor strains directly
4. Up to 20 anchors in one borehole
5. High accuracy and sensitivity
II.3.2) Magnetic extensometer
II.3.2.1) Principle of Magnetic Extensometer
1. Ring magnets positioned on a central access tube are fixed in the ground at locations where displacement is to be monitored.
2. A probe incorporating a Reed switch is made to travel within the access tube to sense the position of magnets outside the access tube. The Reed switch closes on entering a magnetic field and activates a buzzer or an indicator light
3. in the signal receiving instrument.
4. The cable of the probe is marked at suitable intervals for measuring the location of each magnet from the end of the access tube.
55 | P A G E
II.3.2.2) Features
1. Reliable, accurate and simple to read.
2. Any number of points can be monitored.
3. Probe is portable and can be used at many locations; only the access
4. Tubes and magnets are permanently installed.
5. Options available on type of probes, access tubes and magnet assemblies.
6. Low cost, rugged and easy to install.
II.4) Documentation & Monitoring –
Initial documentation can be done as follows.
date shift time Readings (mm) from anchors
change / Day (mm)
Heading position (m)
remarks
1 2 3 4 1 2 3 4 S H
Where,
S = Straight line distance
H = Distance covering gallery path
III) Magnasonic Extensometer
III.1) Principle of operation – It is a basic instrument designed to measure strata dilation or bed separation at strategic horizons, being placed inside a bore hole. It is a remote sensing instrument can be used at both accessible and inaccessible locations. It is very helpful to inculcate dead load in the roof mass and subsequent design of support requirement of the workings. It is designed to measure the distance between pairs of magnets up to 8m depth to accuracy of 0.02mm.
III.2) Installation –
Usually a vertical bore hole of about 8m depth is drilled and the multiple sensors are locked at predefined horizons. These anchors are magnetically connected to the transducer at the mouth of the hole. Change in reading due to dilation at any of such horizons may be measured through Read out Unit connected to transducer by wire.
56 | P A G E
III.3) Documentation & Monitoring –
Initial documentation can be done as follows.Date Shift Time Left
Hand Rib
Mid roof
Right hand rib
Cum. Change (mm)
Rate of Change (mm)
Remarks
1 2 3 4 n 1 2 3 4 N
III.4) Analysis –
Following basic observation can be drawn from such documentations.
• Total roof movement at a place of instrumentation at different time or stages of face advance.
• Total movement at individual anchor horizon plotted against time or stages of face advance.
4.2 Convergence
This is the closure of vertical gap between roof & floor, created either due to downward movement of roof or upward bulging of floor or both. This is a phenomena, generally occurs during Dynamic Loading. This is an indicative parameter deciding extent of advance support during extraction.
This can be inculcated by installation and analysis of comes out of
(I) Telescopic Convergence Indicators
(II) Remote Convergence Indicators.
(I) Telescopic Convergence Indicator
57 | P A G E
I.1) Principle: It is a simple instrument consisting of a graduated rod fitted in a pipe.It has a least count of 0.5 to 1 mm, and the telescopic movement is for a length of 2 to 4 m. The measuring points ("reference stations") are metal rods grouted in the roof and floor.
I.2) Procedure: Measurements are taken by simply stretching the telescopic rodbetween the reference points, and reading the graduations on the rod. Theseindicators are useful for understanding the roof to floor closure in the advancegalleries at various stages of extraction
Anchors placed in Roof and floor vertically in a straight line Distance between anchors is measured with convergence rod Sometimes hooks are placed in the both sides of the gallery in the pillars to facilitate measurement of roof convergence as well as floor heaving.
Anchors placed in Roof and floor vertically in a straight line Distance between anchors is measured with convergence rod Sometimes hooks are placed in the both sides of the gallery in the pillars to facilitate measurement of roof convergence as well as floor heaving
I.3) Documentation – Shift wise, even hourly documentation may be done in the mentioned format.Date Shift Place of
monitoringTime Cum.
Convergence (mm)
Rate of change in convergence(mm/shift or hour)
Position of working place
Remarks
58 | P A G E
(II) Remote Convergence Indicator
1) For monitoring convergence in goaf
2)Sensor – Vibrating wire type or Potentiometrictype
3) Needs laying of wire from instrument locationto measurement site
4)Fails immediately with the failure of immediateroof
The RCI consists of two telescopic tubes whose ends arefixed in the roof and the floor. It has a potentiometerconnected to the top sliding telescopic tube, and a sliderfixed to the bottom tube. Due to the movement of theroof, the slider moves on the resistance coil, resulting inchange in resistance, which is directly proportional tothe amount of convergence or divergence. The change inresistance is measured with the help of a batteryoperatedread out unit. The RCIs were installed at thejunctions in the middle of the panel.
II.1) Principle of Operation –
This is a very useful and reliable instrument for measuring convergence at accessible / inaccessible locations. This instrument can even work efficiently inside the goaf till destruction by roof fall. So it is a very useful instrument for prediction of roof fall. It may be vibrating wire type or rheostat type. In case of vibrating wire type, displacement of stretched spring loaded, vibrating wire due to convergence causes change in frequency which can be further converted to mm by the help of read out unit. In case of Rheostat type instrument, displacement of stretched spring loaded rheostat can cause change in resistance due to convergence (Closure of spring), which can be further converted to mm by the help of read out unit.
59 | P A G E
II.2) Installation –
The instrument is made fixed and vertical between roof and floor by the help of base pipe and extension rod in the position of stretched spring load. Any closure in roof and floor makes the spring load displaced, causing change in frequency / resistance and ultimately giving electronic reading of convergence through wire from a safe and predetermined distance.
II.3) Documentation –
Shift wise, even hourly documentation may be done in the mentioned format.Date Shift Place of
monitoringTime Cum.
Convergence (mm)
Rate of change in convergence(mm/shift or hour)
Position of working place
Remarks
II.4) Analysis –
Analysis may be carried out with the drawn parameters of Convergence, Rate of change of convergence vis. a. vis Time lag for roof falls vis. a. vis Area of exposure vis. a. vis Distance from goaf edge to land with TLV and apprehension of roof fall for safe withdrawal of men and material. It is absolutely mine and place specific in nature.
4.3) Load on Supports
This is the release of vertical stress over support system due to Loading effects of super incumbent, both In situ and Dynamic loading.
It can be inculcated by installation and analysis of comes out of Load Cells.
60 | P A G E
Solid load cell: - Solid style cells incorporate 3 vibrating wire strain sensing elements mounted parallel to the longitudinal axis of the cell. Optical spherical platens are available to enhance alignment to the load axis.
Annular load cell:- annular cells incorporate 3-6 vibrating strain sensors, mounted parallel to the longitudinal axis, equidistant around circumference.
Types of Load Cells:
(I) Vibrating wire load cell
(II) Rock bolt load cell
(III) Mechanical load cell
(IV) Hydraulic load cell
(V) Strain gauge load cell
I) Vibrating wire load cell
1. The load cell is a transducer working on vibrating-wire principle.2. It has three stretched wires housed in a metal cylinder, which are plucked by an electric
pulse of high energy.3. Changes in the load exerted on the cell cause changes in the length of the wire, resulting
in variations of frequency of vibration of the wire.4. As the load increases the frequency decreases accordingly and vice-versa.
61 | P A G E
5. This frequency is measured by a digital read-out unit, and is converted into load using calibration charts. Efficacy and adequacy of the support system can be inferred on the basis of these load cells.
II) Rock bolt load cell
1. The load cell is a transducer working on vibrating-wire principle.2. The load cells should be installed under the roof bolts using specially prepared steel
seating arrangement.3. The load cells should be installed at the junctions to understand the change in load over
the roof bolt during the operation.
III) Mechanical load cell1. Load cell consists of an elastic disc element sandwiched between two plates.2. The disc deflects under load and changes distance between plates.3. The deflection is measured with a dial gauge or suitable electronic transduced.4. It has limited application due to nonlinear calibration curve and restricted application
62 | P A G E
IV) Hydraulic load cell
Hydraulic Load cells are constructed from stainless steel. The load is distributed equally over the loading area of the cell by a thick, machined steel distributed plate. The load, when applied to the cell, causes a pressure increase in the hydraulic fluid, and this change in pressure may be measured via a bourdon tube gauge or a variety of electrical transducers.
Two design are available. An annular cell and a solid cell for the measurement of compressive force. Both design are available with the following readout methods:
1. A bourdon tube gauge. This is the most simple method but if directly connected requires access or visibility. The gauge can be mounted a short distance away and connected to the cell by a flexible hose.
2. Various types of electrical transducers, allowing for remote readout and data acquisition, are also available
V) Strain gauge load cell
Strain Gauge Load Cells incorporate From 8 to 16 high output electrical resistance strain gauges in a full bridge configuration that are bonded to a high strength steel or stainless steel spool. This arrangement compensates for both temperature effects and off center loading. Strain Gauge Load cells are available in virtually any size, in both annular and solid styles. Gauge waterproofing utilizes the latest application techniques and protective materials. The rugged design includes heavy duty protective cover, sealed construction, and low deflection under load
63 | P A G E
4.4) Stress
Stresses are the ground pressure associated with every location in the stratum. Principally these originate from the mechanism of dual equilibrium of forces due to spinning actions of the Earth around the Sun and around its own axis. Knowledge of magnitude and direction is important for safe strata management. These are derived from several sources.
4.4.1) Types of Stresses:
Based on source of origination, stresses are of two types.
1. In situ Stress – It is the inherent and prevalent stress instratum, before mining operations.
2. Induced Stress – It is the Stress created due to induced effect of mining operations.
Direction of Stresses:1. Horizontal Stress – Stress active in horizontal direction, originated due to lateral
release of energy with in stratum, is called Horizontal Stress.2. Vertical Stress – It is the component of stress due to gravity loading of the stratum.
Stress can be inculcated by installation and analysis of comes out of Stress Meters.
I.1) Principle: These are used for measuring unidirectional stress change in the pillar. It consists essentially of a wire tensioned across a steel cylinder (38 mm diameter). As the stress within the rock/coal changes, the cylinder deforms, causing tension in the wire to change.
64 | P A G E
I.2) Procedure: A bore hole of 38 mm diameter is required for installing the stress meters, preferably at mid height of the pillar either horizontally or slightly rising/dipping according to dip of the seam. The stress meter along with wedge and platen assembly is set in the borehole with the help of special installation tools, at a depth of about 4 to 9 m.
II) Stress Cell – 3 Dimensional Measurement
Stress cell consists of a soft inflatable membrane with 18 electrical resistance strain gauges mounted flush on its outer surface. These gauges are glued to the surface of the borehole to directly measure any strain changes that occur in the rock.
III)Earth Pressure Cell
The pressure cell is also based on the principle of vibrating-wire technology. It is constructed from two stainless steel plates welded together around the periphery so
as to leave a narrow space between them. This space is completely filled with de-aired hydraulic oil (Glycol).
65 | P A G E
It is connected to a vibrating-wire pressure transducer where the oil pressure is converted to an electrical signal which is transmitted through a signal cable to the readout unit.
The vibrating-wire based pressure cell has the advantage of long-term stability and remote monitoring with cables.
IV) Pillar Strain Meter
To measure the deformation of the pillar, electrical strain meters (“Pillar Strain Meters”) are used.
In this instrument, there is a steel/brass telescopic rod inside a larger diameter steel/brass tube anchor fixed in the pillar, and the other end is fixed in the anchor at 1 m below it. The bottom telescopic pipe has a potentiometer (a resistance coil, rheostat) or Vibrating wire sensor attached to it.
66 | P A G E
V) Crack Meter Monitoring joints for unexpected movement to provide early warning of performance
problems. Monitoring joints and cracks in structures that may be affected by nearby excavation and
construction activities. Monitoring cracks in structures that have experienced seismic activity.
VI) Rock bolt Strain Gauge Strain gauged rock bolts can be used to measure the distribution of bolt loads for design
purposes. Bolt loads can be monitored along each bolt by the use of multiple strain gauges. Multiple pairs of strain gauges are embedded at regular spacing along each bolt enabling
the axial loads and bending moments to be measured along its full length. Strain gauged rockbolts provide a valuable tool for monitoring support system
performance against design specification.• Axial loads and strains• Bending loads and strain difference• High strain zones from contour plots
Rock bolt strain gauge can be fixed in roof, sides, surface slopes, embankments, etc.
67 | P A G E
Wireless local reading or remote hard-wire reading up to two kilometers away are available.
Normally, for the 22 mm diameter bolts, the bolt loads should not exceed 25 t (250kN), which is the yield strength of the bolt steel.
VII) Continuous Pressure Chart Recorder The resistance or pressures of the powered support are monitored by a
pressure recorder consisting of bourdon tubes in phosphor bronze rolled in concentric circles for pressure sensing and a mechanically wound clock that rotates the recording chart once in 24 hours.
When the hydraulic lines of the support are connected to the bourdon tube, the hydraulic pressure will deflect a lever arm that is fixed at the tail end of the tube.
The amount of deflection is transmitted to the recording pin as pressure and recorded in the rotating chart.
It is essential that the writing device in the recording pin maintain clean line plotting and pose no smearing potential.
68 | P A G E
Sr. No.
Instrument Parameter Measured Accuracy
1. Telescopic Convergence Indicator
Roof to floor Convergence 0.5 to 1 mm
2. Remote Convergence Indicator
Roof to floor Convergence 0.5 mm
3. Load Cell load over the support or Rockbolt load
0.001 tonne
4. Stress Cell Change in stress over pillar or 3D stress
0.5% of Full Scale
5. Earth Pressure cell or Borehole Pressure Cell
Stress over pillar 1%
6. Rockbolt Strain Gauge Load profile of Rockbolt -7. Tell Tale Extensometer Convergence & Bed Separation
in the immediate roof1 mm
8. Multi Point Borehole extensometer(Sonic or Magnetic)
Bed separation, Caving behavior (Goaf)
±0.1 mm
9. Pillar strain meter or Crack meter
Deformation of pillar or crack growth
0.5 mm
10. Continuous Pressure Chart Recorder
Monitoring leg pressure of chock shield
1.5%
References:
1. GROUND MOVEMENT MONITORING UNDERGROUND & OPENCAST MINES
1.1 Skin Control: In strong, massive roof that is essentially self-supporting, cracks, joints, crossbeds, or slickensides can create occasional hazardous loose rock at the skin of the opening. In this environment, the function of the bolts is to prevent local rock falls, not to prevent a major collapse. A pattern of relatively light, short roof bolts is usually sufficient. Skin control is also an important secondary function of roof bolts in weaker ground.
1.2 Suspension: In many mines, a stronger unit that is largely self-supporting overlies a weak immediate roof layer. In these circumstances, roof bolts act to suspend the weaker layer. Experience has shown that roof bolts are extremely efficient in the suspension mode (6, 7, 8), though suspension becomes more difficult if the weak layer is more than 3 ft thick. The Coal Mine Roof Rating (CMRR) somewhat quantifies this effect through the Strong Bed Adjustment (9). The traditional dead-weight loading design approach is generally appropriate for suspension applications (1).
1.3 Beam Building: Where no self-supporting bed is within reach, the bolts must tie the roof together to create a “beam”. The bolts act by maintaining friction on bedding planes, keying together blocks of fractured rock, and controlling the dilation of failed roof layers (5, 10). In general, roof bolts have to work much harder in beam building than in suspension, and higher densities of support are required. However, it is these applications (and those
in the next category) that have been most troublesome for design.
1.4 Supplemental Support: Where the roof is extremely weak, and/or the stress extremely high, roof bolts may not be able to prevent roof failure from progressing beyond a reasonable anchorage horizon (figure 1d). In these cases, cable bolts, cable trusses, or standing support may be necessary to carry the dead-weight load of the broken roof, and the roof bolts act primarily to prevent unraveling of the immediate roof (11).
A simple stem of 24/25 mm round steel having a slit of about 3 mm at one end. Wedge consists of 20 mm square tapered to sharp angle for easy installation.
71 | P A G E
Thread size 24 mm 25 mmUnit size 32 mm 32 mmRecommended size 31-33 mm (series-11) 31-33 mm (series-11)Grade of steel IS 226-1969 IS 226-1969Length 300-3000 mm 600-3000 mmMinimum yield load of bolt shank
10860 kg 11780 kg
Minimum breaking load of bolt shank
19000 kg 20160 kg
Weight in kg/metre 3.55 3.85
Installation
1. Drill 31 mm dia hole for 25 mm slot bolt of 75 mm less than the length of the bolt.
2. Insert wedge into the slotted end of the bolt. Place bolt through opening in steel washer and push the whole unit to the back of the hole.
72 | P A G E
3. Put the dolly on the threaded portion of the bolt, by means of stopper hammering is done and wedge expansion provides anchorage.
4. A torque of 35 kg-metre for 24/25 mm. Bolt will be adequate for most of the applications.
2.2)Perfro bolts
A ribbed/torsteel rod is threaded at one end and chambered at the other end for easy insertion. Sleeve of recommended diameter made of flexible galvanized wire mesh (size 5 mm× 1 mm diameter) is used to insert the sand cement mortar into the drill hole
73 | P A G E
Installation
1. Drill hole of recommended diameter and of length longer than bolt to be used. Keep the hole free from chippings and dirt. Take wire mesh sleeve fill it with mortar (cement, sand and water 1:1:0.6 by volume)
2. Insert wire mesh into hole.
3. Put the bolt through sleeve till it reaches the back of the hole.
4. Put the bearing plate and nut after lapse of a few hours.
2.3) Expansion shell bolts
A forged head or stud type complete with expansion shell and plug. Different styles of roof bolt heads are available in high tensile steel or standard tested steel.
Complementary taper of plug and shell provides full contact with the wall of plug and shell provides full contact with the wall of hole.
74 | P A G E
Round size I.S. No. Minimum yield stress kg/mm2
Minimum breaking stress kg/mm2
16 & 20 mm 226-1969 26 4222 mm 226-1969 24 42
16 & 20 mm 1570-1961 32 58
Thread size 16 mm 20 mm 22 mmUnit size 32 mm 35 mm 32 mm 35 mm 38 mm 43 mmRecommended hole dia.
31-33 mm (series-11)
34-36 mm (series-31)
31-33 mm (series-11)
34-36 mm (series-31)
37-39 mm (series-12)
40-43 mm (electric drill)
Grade of steel IS:1570-1961 C-40 IS-226-1969 IS-1570-1961 C-40
IS: 226-1969
IS:1570-1961 C-
40Minimum yield load of bolt shank
6410 kg 8170 kg 10020 kg 9120 kg 12120 kg
Minimum breaking load of bolt shank
11660 kg 13200 kg 18210 kg 15960 kg 22040 kg
75 | P A G E
Length 600-3000 mm 600-3000 mm 600-3000 mmWeight in kg/metre
1.58 2.47 2.98
Installation
1. Drill hole of recommended diameter at right angles to bearing surface, to a depth larger than bolt to be used. Make the hole clean and free from cuttings.
2. Place washer on bolt thread. Plug on bolt four to eight turns.
3. Insert in hole until washer and bolt heads are against mouth of hole.
4. Apply torque as per recommendation. this expands the serrated shell against the wall of hole.
2.4) Resin bolts
Resin anchor system consists of an outer capsule rigid or flexible filled with resin and filler. The catalyst is provided in a separate tube within the outer casing. When the two are mixed together by bolt (which may be of wood or steel) by breaking the outer casing, the polymerization action starts between resin & hardener. The mixture sets rapidly and provides anchorage.
76 | P A G E
Thread size 20 mm 22 mmUnit size 32 mm 43 mm 43 mmBore hole size 30-33 mm
(series-11)39-43 mm
(Electric Drill)39-43 mm (Electric Drill)
Grade of steel IS:226-1969 IS:226-1969 IS:226-1969Minimum yield load of bolt shank
8170 kg 9120 kg
Minimum breaking load of bolt shank
13200 kg 15960 kg
Length 600-3000 mm 600-3000 mmResin capsule 300 mm long
× 28 mm O.D.300 mm long ×
36 mm O.D.300 mm long × 36 mm O.D.
Weight on kg/metre 2.47 2.98
N.B. Alternatively Bolts in Torsteel to IS-1786-1966 may also be provided.
InstallationRequisites:
i. Electric or pneumatic drill or impact wrench to spin bolt at 100-300 rpm.ii. An adapter to couple drill chuck to bolt.
Installation procedure
I. Clear the hole from dust chips, etc.II. Check that bolt is free to rotate in the hole and is of correct length (i.e. 70/80 mm less
than bolt length)III. Insert the necessary capsules into hole. Push gently capsules home with bolt.IV. Drive bolt home spinning it with drill. Don’t try to rush this stage. A slow, steady rate of
advance is necessary to ensure proper mixing.V. Spin bolt for further 30 seconds once it is home. Continue longer if an impact wrench is
being used and bolt is rotating very slowly.VI. Remove drill and adapter. Disturb bolt as little as possible until 30 minutes after gel has
occurred.
77 | P A G E
VII. Put plate and nut over bolt and tighten up.
REFERENCES
1) ANALYSIS OF ROOF BOLT SYSTEMSChristopher Mark, Chief, Rock Mechanics Section