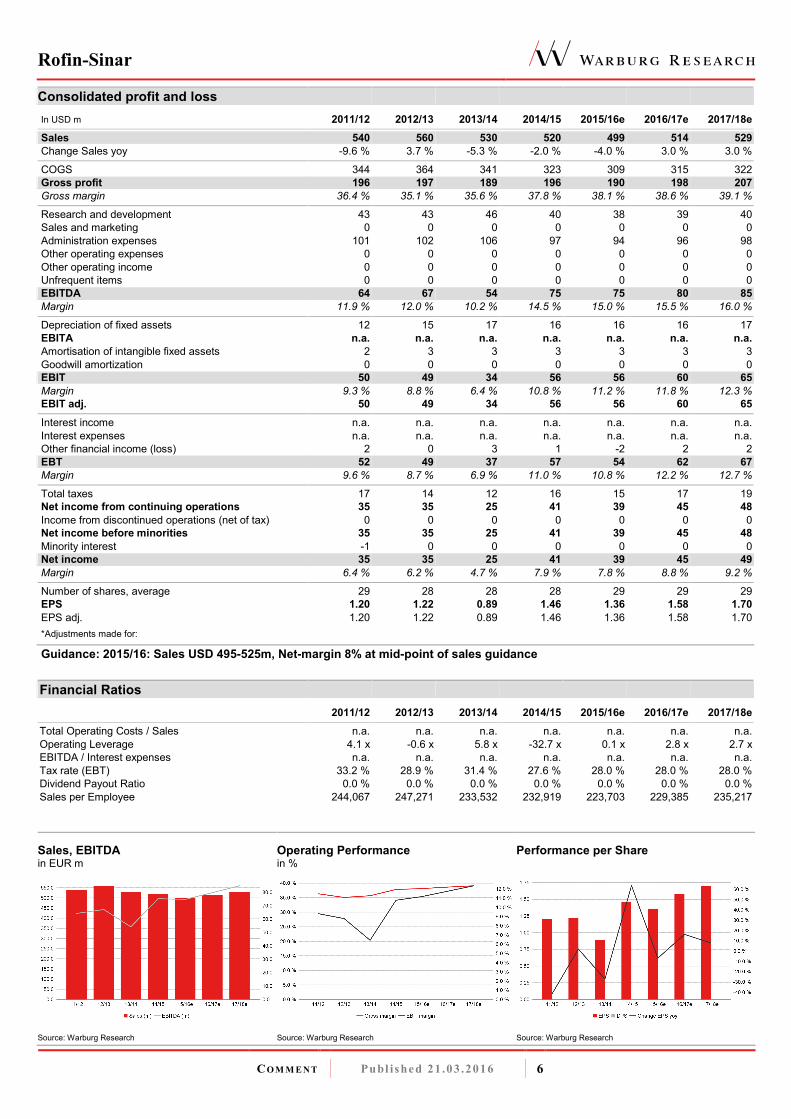
Rofin-Sinar (CDAX, Technology) C OMMENT Published 21.03.2016 1 Analyst Eggert Kuls [email protected]+49 40 309537 - 256 Value Indicators: EUR Share data: Description: DCF: 24.00 FCF-Value Potential 17e: 27.90 Bloomberg: RSI GR Reuters: RSTI ISIN: US7750431022 Rofin-Sinar is one of two world- leading manufacturers of industrial laser equipment Market Snapshot: EUR m Shareholders: Risk Profile (WRe): 2015/16e Hold (Buy) EUR 25.90 Price EUR 27.75 Downside -6.7 % Market cap: 791 No. of shares (m): 29 EV: 646 Freefloat MC: 791 Ø Trad. Vol. (30d): 14.80 m Freefloat 100.0 % Beta: 1.1 Price / Book: 1.5 x Equity Ratio: 79 % Coherent plans to take over Rofin-Sinar We downgrade Rofin-Sinar from Buy to Hold as the share price has exceeded our target price following the announcement that Coherent has entered into an agreement to acquire Rofin-Sinar in an all-cash transaction worth USD 942m or USD 32.50 per share which is equivalent to a premium of 42% to the closing price on the day before the announcement. The transaction is expected to be closed within six to nine months, subject to the approval of Rofin-Sinar shareholders, regulatory bodies etc. Rofin`s board of directors is supporting the intended takeover. We think the transaction makes sense for Coherent when looking at defined potential synergies of USD 30m p.a. (some 2% of combined turnover) and the access to Rofin`s new developments in the fields of high-power fibre and ultra-short pulse laser. Furthermore, Rofin had cash on hand of USD 177m as of the end of December 2015. For Rofin-Sinar shareholders our recommendation is to hold rather than sell the shares as the current share price in USD is some 3.5% below the intended bid of USD 32.50 which is expected to be paid by the end of this year at latest. Due to strong competition in the industrial laser sector we do not expect cartel authorities to express concern. However, Rofin-Sinar and Coherent are competing in several fields of activity such as laser for material processing and for microelectronics. In contrast, we see no overlap in the scientific business which is run by Coherent. In the fast-growing fibre laser segment, IPG Photonics is the dominant player and even a combination of Rofin and Coherent in this field would be much smaller. Hence, there could be some antitrust conditions but we do not expect the deal to be prohibited as a whole. Activist shareholder SilverArrow acquired a share of more than 9% in Rofin-Sinar last year and intended to increase its stake to some 15%. SilverArrow aims to bring three people to Rofin`s board of directors in order to improve the company`s performance going forward. Rofin-Sinar however has said that only one of the proposed persons is qualified to enter Rofin`s board and to help develop the business. Elections would have taken place at the AGM on March, 17. However, following the Coherent announcement, Rofin-Sinar has postponed its AGM in order to combine the AGM with the special shareholders meeting to approve the proposed combination with Coherent. No new date has been set so far. Also, SilverArrow has not yet made a statement on whether it welcomes the agreement with Coherent or not. Rofins`s share price was under strong pressure over the last months following weak order intake and a lowering of FY guidance. However, the outlook is more promising due to new product developments in the fields of high-power fibre und ultra-short pulse laser which are expected to contribute to a better H2. Nevertheless, due to the weak start to fiscal 2015/16 we were expecting the company to only meet the lower end of its guidance range. Rel. Performance vs CDAX: 1 month: 34.3 % 6 months: 21.0 % Year to date: 19.8 % Trailing 12 months: 40.7 % Company events: 05.05.16 Q2 04.08.16 Q3 10.11.16 Prel. FY 2015/16 29.11.16 FY 2015/16 FY End: 30.9. in USD m CAGR (14/15-17/18e) 2011/12 2012/13 2013/14 2014/15 2015/16e 2016/17e 2017/18e Sales 0.6 % 540 560 530 520 499 514 529 Change Sales yoy -9.6 % 3.7 % -5.3 % -2.0 % -4.0 % 3.0 % 3.0 % Gross profit margin 36.4 % 35.1 % 35.6 % 37.8 % 38.1 % 38.6 % 39.1 % EBITDA 4.1 % 64 67 54 75 75 80 85 Margin 11.9 % 12.0 % 10.2 % 14.5 % 15.0 % 15.5 % 16.0 % EBIT 5.3 % 50 49 34 56 56 60 65 Margin 9.3 % 8.8 % 6.4 % 10.8 % 11.2 % 11.8 % 12.3 % Net income 5.6 % 35 35 25 41 39 45 49 EPS 5.3 % 1.20 1.22 0.89 1.46 1.36 1.58 1.70 EPS adj. 5.3 % 1.20 1.22 0.89 1.46 1.36 1.58 1.70 DPS - 0.00 0.00 0.00 0.00 0.00 0.00 0.00 Dividend Yield n.a. n.a. n.a. n.a. n.a. n.a. n.a. FCFPS -0.62 1.47 0.40 1.47 1.14 0.97 1.07 FCF / Market cap -0.8 % 6.0 % 3.7 % 4.7 % 3.6 % 3.1 % 3.4 % EV / Sales 1.1 x 1.1 x 1.1 x 1.2 x 1.5 x 1.4 x 1.3 x EV / EBITDA 9.2 x 8.8 x 10.6 x 8.0 x 9.8 x 8.8 x 7.9 x EV / EBIT 11.7 x 12.0 x 16.9 x 10.7 x 13.1 x 11.6 x 10.3 x P / E 18.8 x 19.5 x 26.8 x 17.7 x 23.1 x 19.8 x 18.4 x P / E adj. 18.8 x 19.5 x 26.8 x 17.7 x 23.1 x 19.8 x 18.4 x FCF Yield Potential 6.0 % 6.6 % 5.6 % 7.9 % 6.2 % 7.3 % 8.2 % Net Debt -58 -94 -101 -134 -168 -198 -230 ROCE (NOPAT) 8.1 % 7.8 % 5.2 % 9.4 % 9.6 % 10.1 % 10.6 % Guidance: 2015/16: Sales USD 495-525m, Net-margin 8% at mid-point of sales guidance
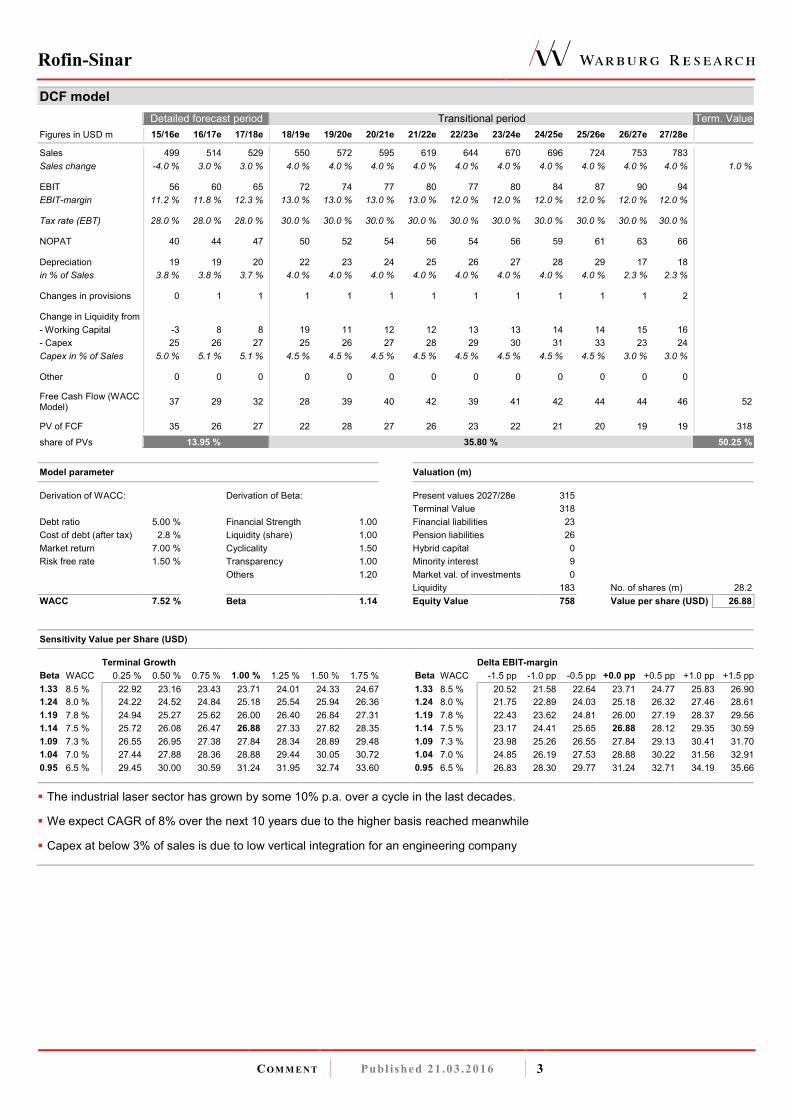
� The industrial laser sector has grown by some 10% p.a. over a cycle in the last decades.
� We expect CAGR of 8% over the next 10 years due to the higher basis reached meanwhile
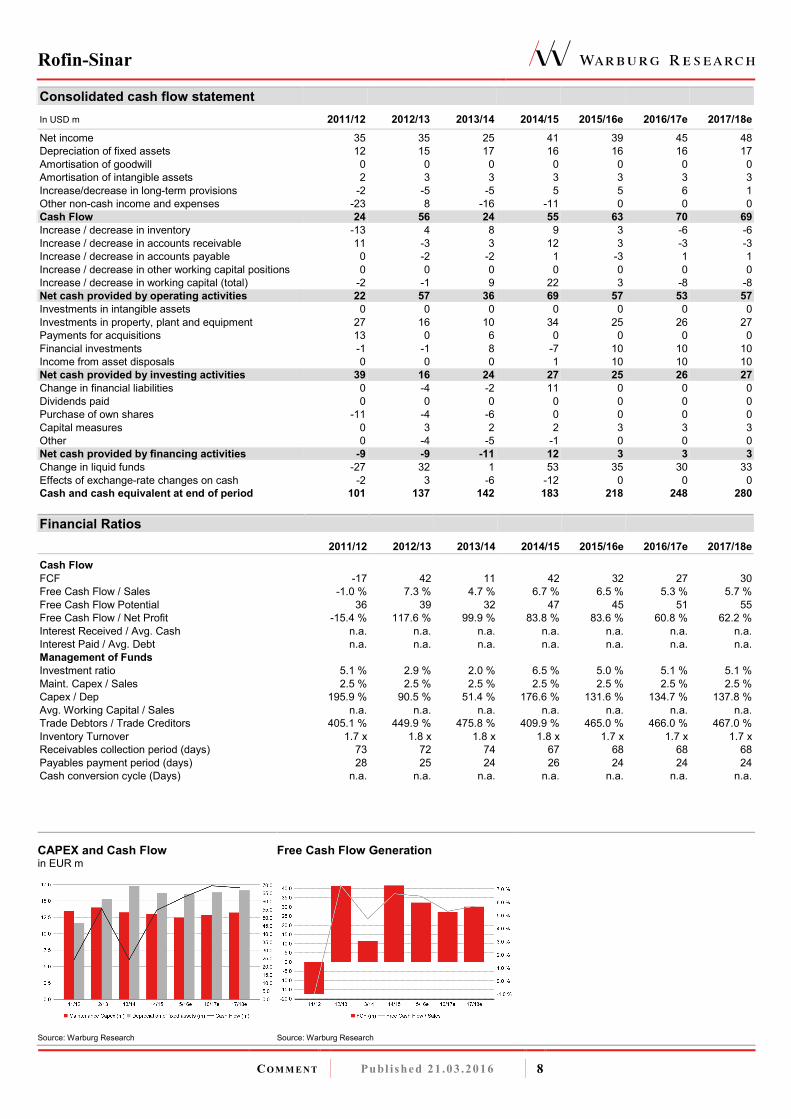
� Capex at below 3% of sales is due to low vertical integration for an engineering company
Rofin-Sinar
CO M M E N T Publ ished 21 .03 .2016 4
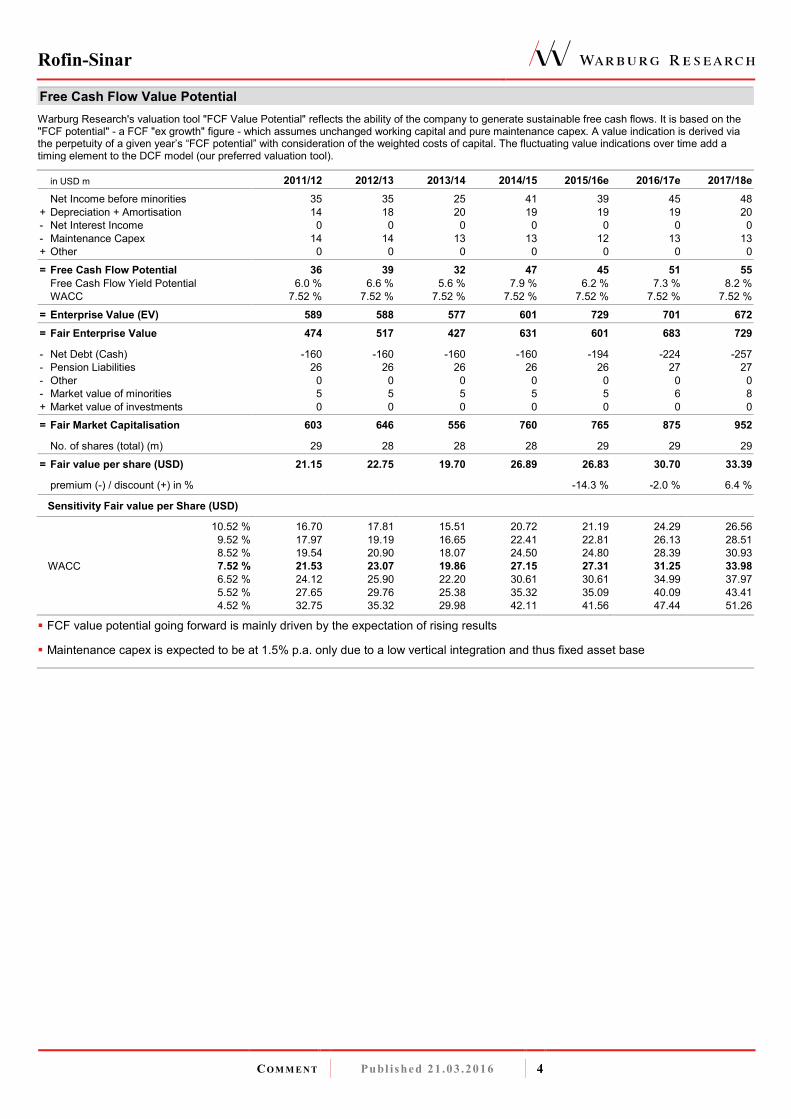
Free Cash Flow Value Potential Warburg Research's valuation tool "FCF Value Potential" reflects the ability of the company to generate sustainable free cash flows. It is based on the "FCF potential" - a FCF "ex growth" figure - which assumes unchanged working capital and pure maintenance capex. A value indication is derived via the perpetuity of a given year’s “FCF potential” with consideration of the weighted costs of capital. The fluctuating value indications over time add a timing element to the DCF model (our preferred valuation tool). in USD m 2011/12 2012/13 2013/14 2014/15 2015/16e 2016/17e 2017/18e
This research report was prepared by the Warburg Research GmbH, a fully owned subsidiary of the M.M.Warburg & CO (AG & Co.) KGaA and is
passed on by the M.M.Warburg & CO (AG & Co.) KGaA. It contains selected information and does not purport to be complete. The report is based on
publicly available information and data ("the information") believed to be accurate and complete. Warburg Research GmbH neither does examine the
information to be accurate and complete, nor guarantees its accuracy and completeness. Possible errors or incompleteness of the information do not
constitute grounds for liability of M.M.Warburg & CO (AG & Co.) KGaA or Warburg Research GmbH for damages of any kind whatsoever, and
M.M.Warburg & CO (AG & Co.) KGaA and Warburg Research GmbH are not liable for indirect and/or direct and/or consequential damages. In
particular, neither M.M.Warburg & CO (AG & Co.) KGaA nor Warburg Research GmbH are liable for the statements, plans or other details contained in
these analyses concerning the examined companies, their affiliated companies, strategies, economic situations, market and competitive situations,
regulatory environment, etc. Although due care has been taken in compiling this research report, it cannot be excluded that it is incomplete or contains
errors. M.M.Warburg & CO (AG & Co.) KGaA and Warburg Research GmbH, their shareholders and employees are not liable for the accuracy and
completeness of the statements, estimations and the conclusions derived from the information contained in this document. Provided a research report
is being transmitted in connection with an existing contractual relationship, i.e. financial advisory or similar services, the liability of M.M.Warburg & CO
(AG & Co.) KGaA and Warburg Research GmbH shall be restricted to gross negligence and wilful misconduct. In case of failure in essential tasks,
M.M.Warburg & CO (AG & Co.) KGaA and Warburg Research GmbH are liable for normal negligence. In any case, the liability of M.M.Warburg & CO
(AG & Co.) KGaA and Warburg Research GmbH is limited to typical, expectable damages. This research report does not constitute an offer or a
solicitation of an offer for the purchase or sale of any security. Partners, directors or employees of M.M.Warburg & CO (AG & Co.) KGaA, Warburg
Research GmbH or affiliated companies may serve in a position of responsibility, i.e. on the board of directors of companies mentioned in the report.
Opinions expressed in this report are subject to change without notice. All rights reserved.
COPYRIGHT NOTICE
This work including all its parts is protected by copyright. Any use beyond the limits provided by copyright law without permission is prohibited and
punishable. This applies, in particular, to reproductions, translations, microfilming, and storage and processing on electronic media of the entire content
or parts thereof.
DISCLOSURE ACCORDING TO §34B (1) OF THE GERMAN SECURITIES TRADING ACT (WHPG) AND THE ORDINANCE ON THE ANALYSIS OF FINANCIAL INSTRUMENTS (FINANV)
The valuation underlying the investment recommendation for the company analysed here is based on generally accepted and widely used methods of
fundamental analysis, such as e.g. DCF Model, Free Cash Flow Potential, Peer Group Comparison or Sum of the Parts Model. The result of this
fundamental valuation is modified to take into consideration the analyst’s assessment as regards the expected development of investor sentiment and
its impact on the share price.
Independent of the applied valuation methods, there is the risk that the price target will not be met, for instance because of unforeseen changes in
demand for the company’s products, changes in management, technology, economic development, interest rate development, operating and/or
material costs, competitive pressure, supervisory law, exchange rate, tax rate etc. For investments in foreign markets and instruments there are further
risks, generally based on exchange rate changes or changes in political and social conditions.
This commentary reflects the opinion of the relevant author at the point in time of its compilation. A change in the fundamental factors underlying the
valuation can mean that the valuation is subsequently no longer accurate. Whether, or in what time frame, an update of this commentary follows is not
determined in advance.
In accordance with § 5 (4) of the Ordinance on the Analysis of Financial Instruments (FinAnV) Warburg Research GmbH has implemented additional
internal and organisational arrangements to prevent or to deal with conflicts of interest. Among these are the spatial separation of Warburg Research
GmbH from M.M.Warburg & CO (AG & Co.) KGaA and the creation of areas of confidentiality. This prevents the exchange of information, which could
form the basis of conflicts of interest for Warburg Research in terms of the analysed issuers or their financial instruments.
The analysts of Warburg Research GmbH do not receive a gratuity – directly or indirectly – from the investment banking activities of M.M.Warburg &
CO (AG & Co.) KGaA or of any company within the Warburg Group.
All prices of financial instruments given in this financial analysis are the closing prices on the last stock-market trading day before the publication date
stated, unless another point in time is explicitly stated.
M.M.Warburg & CO (AG & Co.) KGaA and Warburg Research GmbH are subject to the supervision of the Federal Financial Supervisory Authority,
BaFin.
SOURCES
All data and consensus estimates have been obtained from FactSet except where stated otherwise.
Rofin-Sinar
CO M M E N T Publ ished 21 .03 .2016 10
Additional information for clients in the United States
1. This research report (the “Report”) is a product of Warburg Research GmbH, Germany, a fully owned subsidiary of M.M.Warburg & CO (AG & Co.)
KGaA, Germany (in the following collectively “Warburg”). Warburg is the employer of the research analyst(s), who have prepared the Report. The
research analyst(s) reside outside the United States and are not associated persons of any U.S. regulated broker-dealer and therefore are not subject
to the supervision of any U.S. regulated broker-dealer.
2. The Report is provided in the United States for distribution solely to "major U.S. institutional investors" under Rule 15a-6 of the U.S. Securities
Exchange Act of 1934.
3. Any recipient of the Report should effect transactions in the securities discussed in the Report only through J.P.P. Euro-Securities, Inc., Delaware.
4. J.P.P. Euro-Securities, Inc. does not accept or receive any compensation of any kind for the dissemination of the research reports from Warburg.
Reference in accordance with section 34b of the German Securities Trading Act (WpHG) and the Ordinance on the Analysis of Financial Instruments (FinAnV) regarding possible conflicts of interest with the analysed company:
-1- Warburg Research, or an affiliated company, or an employee of one of these companies responsible for the compilation of the
research, hold a share of more than 5% of the equity capital of the analysed company.
-2-
Warburg Research, or an affiliated company, within the last twelve months participated in the management of a consortium
for an issue in the course of a public offering of such financial instruments, which are, or the issuer of which is, the subject of the
financial analysis.
-3- Companies affiliated with Warburg Research manage financial instruments, which are, or the issuers of which are, subject of
the financial analysis, in a market based on the provision of buy or sell contracts
-4-
Warburg Research, or an affiliated company, were in the last twelve months bound by a service agreement with the issuers,
who are themselves or their financial instruments are, subject of the financial analysis, in connection with investment banking
business for which a service or a promise of a service emanated.
-5- The company compiling the analysis or an affiliated company had reached an agreement on the compilation of the financial
analysis with the analysed company.
-6- Companies affiliated with Warburg Research regularly trade financial instruments of the analysed company or derivatives of
these.
-7- The company preparing the analysis as well as its affiliated companies and employees have other important interests in
relation to the analysed company, such as, for example, the exercising of mandates at analysed companies.
Company Disclosure Link to the historical price targets and rating changes (last 12 months)
Investment recommendation: expected direction of the share price development of the financial instrument up to the given price target in the opinion of
the analyst who covers this financial instrument.
-B- Buy: The price of the analysed financial instrument is expected to rise over the next 12 months.
-H- Hold: The price of the analysed financial instrument is expected to remain mostly flat over the next 12
months.
-S- Sell: The price of the analysed financial instrument is expected to fall over the next 12 months.
“-“ Rating suspended: The available information currently does not permit an evaluation of the company.
WARBURG RESEARCH GMBH – RESEARCH UNIVERSE BY RATING
Rating Number of stocks % of Universe
Buy 124 65
Hold 57 30
Sell 5 3
Rating suspended 4 2
Total 190 100
WARBURG RESEARCH GMBH – ANALYSED RESEARCH UNIVERSE BY RATING I
I taking into account only those companies which were provided with major investment banking services in the last twelve
months.
Rating Number of stocks % of Universe
Buy 25 81
Hold 4 13
Sell 1 3
Rating suspended 1 3
Total 31 100
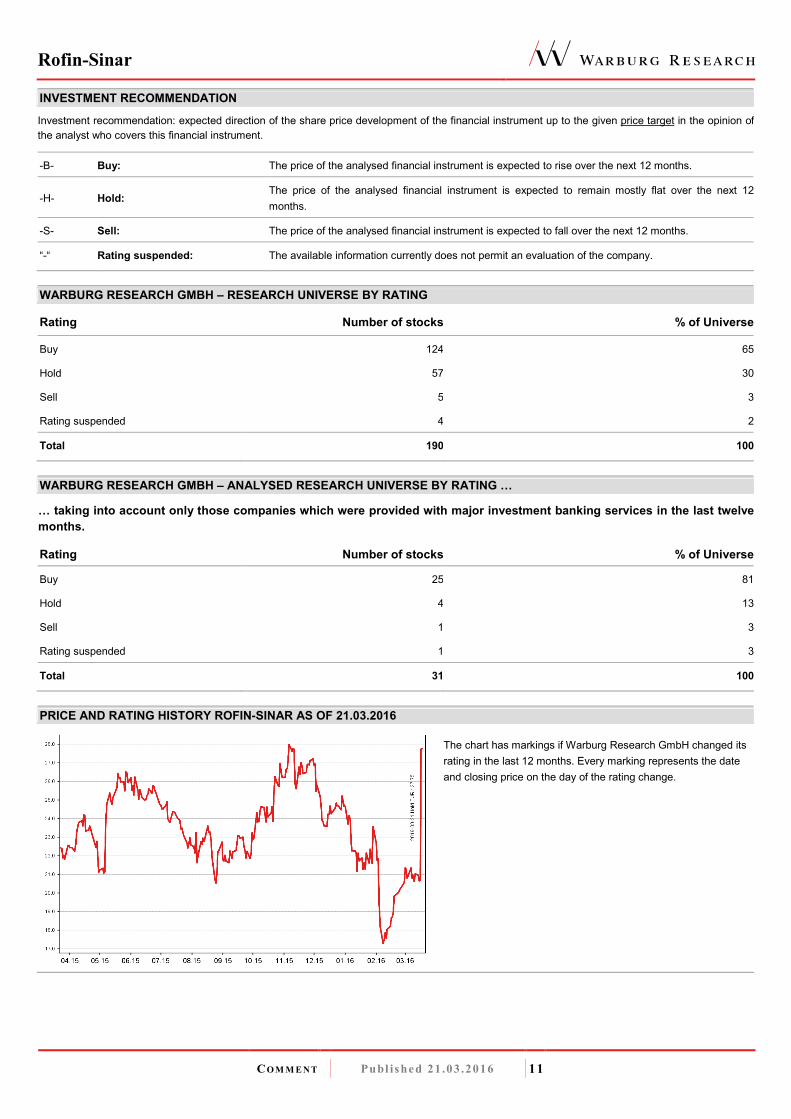
PRICE AND RATING HISTORY ROFIN-SINAR AS OF 21.03.2016
The chart has markings if Warburg Research GmbH changed its
rating in the last 12 months. Every marking represents the date
and closing price on the day of the rating change.
Rofin-Sinar
CO M M E N T Publ ished 21 .03 .2016 12
EQUITIES Roland Rapelius +49 40 3282-2673 Head of Equities [email protected] RESEARCH Michael Heider +49 40 309537-280 Andreas Pläsier +49 40 309537-246 Head of Research [email protected] Banks, Financial Services [email protected]
Henner Rüschmeier +49 40 309537-270 Malte Räther +49 40 309537-185 Head of Research [email protected] Telco, Internet, Media [email protected]
Lucas Boventer +49 40 309537-290 Jochen Reichert +49 40 309537-130 Renewables, Internet, Media [email protected] Telco, Internet, Media [email protected]
Christian Cohrs +49 40 309537-175 J. Moritz Rieser +49 40 309537-260 Engineering, Logistics [email protected] Real Estate [email protected]
Felix Ellmann +49 40 309537-120 Arash Roshan Zamir +49 40 309537-155 Software, IT [email protected] Cap. Goods, Renewables [email protected]
SALES TRADING Oliver Merckel +49 40 3282-2634 Jörg Treptow +49 40 3262-2658 Head of Sales Trading [email protected] Sales Trading [email protected] Michael Ilgenstein +49 40 3282-2700 Jan Walter +49 40 3262-2662 Sales Trading [email protected] Sales Trading [email protected] Bastian Quast +49 40 3282-2701 Sales Trading [email protected] MACRO RESEARCH Carsten Klude +49 40 3282-2572 Dr. Christian Jasperneite +49 40 3282-2439 Macro Research [email protected] Investment Strategy [email protected] Matthias Thiel +49 40 3282-2401 Macro Research [email protected]
Our research can be found under: Warburg Research research.mmwarburg.com/en/index.html Thomson www.thomson.com Bloomberg MMWA GO Reuters www.knowledge.reuters.com FactSet www.factset.com Capital IQ www.capitaliq.com For access please contact: