Page 1
COVER PAGE
ROLE OF COST CONTROL STRATEGY IN ACHIEVING COORPORATE
SURVIVAL AND GROWTH A CASE STUDY OF NIGERIA BREWERY, ENUGU
BY
GLORIA CLEMENT
PGD/NOU142853270
RESEARCH WORK SUBMITTED FOR THE AWARD OF POSTGRADUATE
DIPLOMA IN BUSINESS ADMISTRATION TO THE SCHOOL OF MANAGEMENT
SCIENCE, NATIONAL OPEN UNIVERSITY OF NIGERIA
CENTRAL AREA STUDY CENTRE, ABUJA
SEPTEMBER, 2015.
Page 2
TITLE PAGE
ROLE OF COST CONTROL STRATEGY IN ACHIEVING COORPORATE
SURVIVAL AND GROWTH
(A CASE STUDY OF NIGERIA BREWERY ENUGU STATE)
BY
GLORIA CLEMENT
PGD/NOU142853270
A PROJECT SUBMITTED TO THE SCHOOL OF MANAGEMENT SCIENCE
NATIONAL OPEN UNIVERSITY OF NIGERIA, ABUJA STUDY CENTRE,
IN PARTIAL FULFILMENT OF THE AWARD OF POST GRADUATE DEGREE
(PGD) IN BUSINESS ADMINISTRATION.
SEPTEMBER, 2015.
i
Page 3
DECLARATION
I declare that this project has been written by me and that is a record of my own research
work. To best of my knowledge and believe, it has not been previously presented in any form
whatsoever in any applications for Postgraduate Diploma in Business Administration.
All source of information collected and materials used have been dully acknowledged by
means of references and bibliography
-------------------------------------- ------------------------------------
Gloria Clement Date
ii
Page 4
APPROVAL
This Project titled “The Role of cost control Strategy In Achieving Corporate
SurvivalandGrowth Using Nigeria Brewery Enugu as a Case Study” has been accepted as
meeting the regulations governing the award of Postgraduate Diploma (PGD) in Business
Administration of National Open University of Nigeria and is accepted for its contribution to
knowledge and literary appreciation
…………………………………. ……….. ……….
Olisekebe, Valentine Ike (Mr)Date
(Supervisor)
……………………….. …………………
External Examiner Date
……………………….. …………………
Dean of School Date
………………………... ..………………...
Dean Postgraduate School Date
iii
Page 5
DEDICATION
This project work is dedicated to Almighty God, for his protection and guidance throughout
this project work and my study in the time spent in order to pursue a Postgraduate Diploma,
to my family for their supports, both in kind and financially. You all occupy a special part of
my hearts; thank you.
iv
Page 6
ACKNOWLEDGEMENT
First and foremost, I thank God Almighty, who gave me the privilege and opportunity to
write this project work. My appreciation goes to my able supervisor Mr Olisekebe, Valentine
Ikewho patiently read through and gave me all necessary correction, may God b less you in
your entire endeavour (Amen).
I will like to acknowledge my parents and siblings who through their continuous financial
support, encouragement and prays kept me going throughout these program, thank you so
much.
I will like to acknowledge also my friends as well as my well-wishers for their support.
v
Page 7
TABLE OF CONTENTS
Cover page i
Title Page ii
Certification iii
Approval iv
Dedication v
Acknowledgement vi
Table of Content vii
List of Tables viii
Abstract ix
CHAPTER ONE
1.1 Background of the study 1
1.2 Statement of the problem 3
1.3 Objective of the study 3
1.4 Research questions 4
1.5 Significance of the study 4
1.6 Statement of Hypothesis 5
1.7 Scope and Delimitation of the study 6
1.8 Scope of the study 6
1.9 Definition of term 6
CHAPTER TWO
LITERATURE REVIEW
2.1 Historic background of Nigeria Brewery, Enugu 10
2.2 Conceptual framework 13
2.3 Theoretical framework 26
vi
Page 8
2.4 Review of current literature 37
CHAPTER THREE
RESEARCH METHODOLOGY
3.1 Design of the study 46
3.2 Population 45
3.3 Sample size 46
3.4 Sampling Techniques 47
3.5 Research Instrument 48
3.6 Instrument Validation 49
3.7 Reliability of the instrument 49
3.8 Source of data collection 50
3.9 Method of data collection 50
CHAPTER FOUR
PRESENTATION AND DATA ANALYSIS
4.1 Data analysis, Findings & Discussion 55
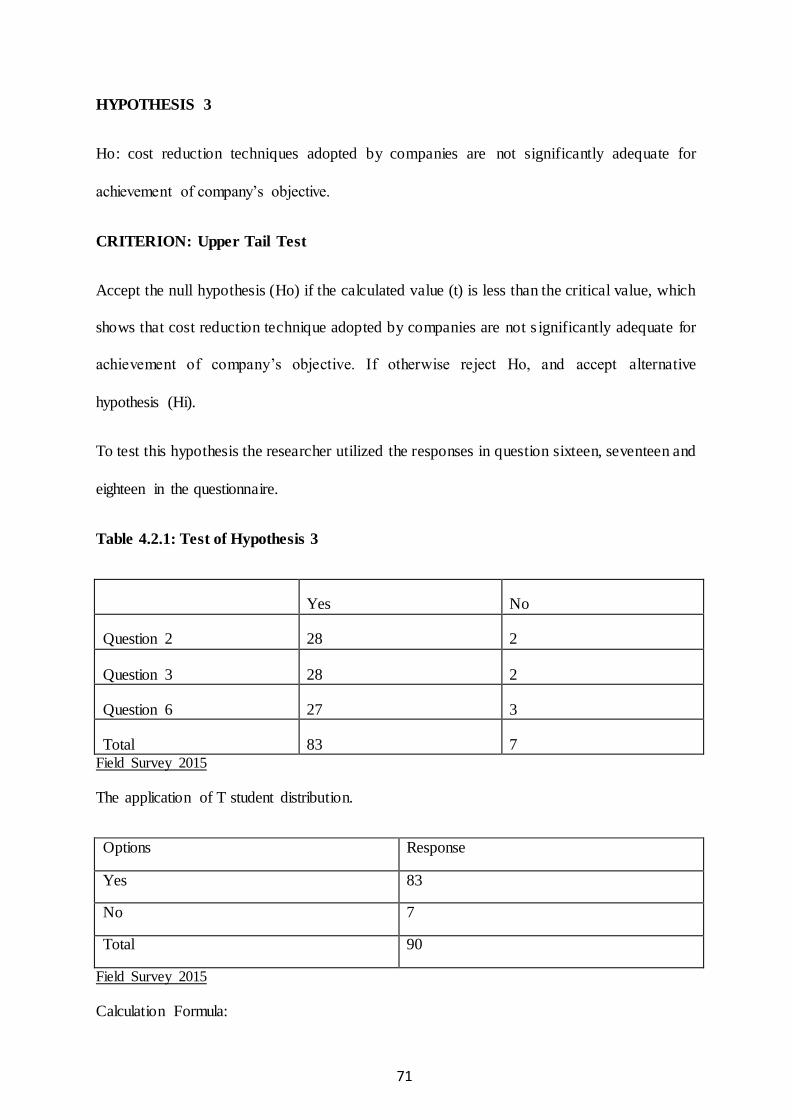
4.2 Test of Hypothesis 64
4.3 Discussion of the Findings 73
CHAPTER FIVE
SUMMARY, CONCLUSION AND RECOMMENDATION
5.1 Summary of the Findings 76
5.2 Conclusion 77
5.3 Recommendation 77
5.4 Proposal for further Studies 79
Reference 79
vii
Page 9
LIST OF TABLES
Table 2.2: Life method of inventory valuation 25
Table 2.4: Basis for direct labour cost 34
Table 2.5: Basis of labour hours 35
Table 2.6: Basis of machine hours 35
Table 3.1: Questionnaire distribution 48
Table 4.1: Questionnaire distribution 55
Table 4.2: Effect of physical control material theft 56
Table 4.3: Physical control in limiting wastage 56
Table 4.4: Effectiveness of cost control 57
Table 4.5: Information concerning material 57
Table 4.6: Effectiveness utilization of materials 58
Table 4.7: Cordial relations among heads of departments 58
Table 4.8: Consultation among heads in decision making 59
Table 4.9: Interdependency between workers 59
Table 4.10: Effect of co-ordination among cost centres 60
Table 4.11: Head involvement in budget preparation 60
Table 4.12: Supervision and implementation of budget 61
Table 4.13: Realizing objectives through the elimination of unnecessary cost 61
Table 4.14: Improvement in material handling through costs reduction techniques 61
Table 4.15: Cost reduction on profit planning 62
Table 4.17: Cost reduction in allocation of resources 63
Table 4.18: Effect of cost control on growth and profitability 63
Table 4.19: Test of hypothesis 64
viii
Page 10
ABSTRACT
These studies reveal the role of cost control strategy in achieving corporate survival and
growth a case study of Nigeria brewery Enugu state), Nigeria. The purpose of this research
paper is to examine the importance of cost control and the various cost control method used
and their impact on the survival of Nigeria brewery Enugu state. Used primary and
secondary data sources. The primary data were obtained using a structure questionnaire
which was administered to 30 randomly selected staff as well as discussion with some
targeted staff of Nigeria Brewery, Enugu State of Nigeria. The scoring on the questionnaire
was done using a five point Likert scale. The secondary data sources comprised of journal
articles, books, newspaper articles, company financial reports and internet. The student t -test
statistic and comparative percentage were used to test the hypothesis and the significance
level was α=0.01. This research discovered that 93.3% of the respondents were of the view
that cost control has greatly helped in boosting profitability in the company and 6.7%
disagreed. the cost reduction techniques adopted by the company are significantly adequate
for the achievement of companies’ objective .The study revealed that the problem of
manufacturing company is the high cost of overhead incurred in the company. These costs
are getting out of what the company could bear. This research recommended that The
companies should also make effort to improve its research and development unit to adapt to
local raw materials; a good budgeting process should also be put in place to control cost;
Just – in – Time (JIT) techniques should be employed to meet production and sales
requirement in Nigeria Brewery.
ix
Page 11
CHAPTER ONE
INTRODUCTION
1.1BACKGROUND OF THE STUDY
The word “cost” can be viewed in various ways. When it is considered in the noun form, “it
is the amount of the expenditure whether actual or notional incurred on, or attributable to a
given thing or activity.”In a relation to the research topic, cost can be defined as a term
providing service. It represents the monetary measurement of material, labour and overhead
used.
Control on the other hand is defined “as the process d assuring that plans are carried out in
such a way that objectives are attained:, control is also “ensuring that the cost to be incurred
on the total activity and various parts of it are kept under check and also that the quantum and
quality of activity are kept up to the mark” (Osisoma, 1996) Moore) 2001) says: To control,
you set goals, make plan, start to carry them out. Through control you try to guide things in
the direction you want them to go and hopefully you arrive at your goals.
From the definitions given above, cost control can define as the procedure and measures by
which the cost of carrying out an activity is kept under check. The aim is to ensure that costs
do not exceed to a certain level.
The use of effective cost control strategy cannot be over emphasized. Not only does it not
affect the individuals but, it also affect the whole economy of the nation business
organizations in both public and private sectors of the Nigerian economy have intentably
been facing adverse economic conditions. The by-product of the adverse economic
environment has been a considerable reduction in corporate profits. The concomitant effects
of the poor profit level have been retrenchments, abrupt closure of companies and parastatals
retirement with or without benefits or gratuities pay. Cut compulsory leave and so on.
1
Page 12
Reasons for these have been the remarkable increase in the cost of running business in the
country.
There are the foreign exchange problems with consequent lack of imported raw materials to
keep many manufacturing plants functional, even where the firms get the foreign exchange
market (FEM), it will not be enough to get the required quantity of raw materials to produce
at full capacity. A country faced with these problems has to find a solution to them.
Ogunlana (1993) also noted saying: “Nigeria is passing through a different period.
Everything possible must be done by everyone in a position to assist the economy in making
a guide recovering”. it at this point that the effective cost control strategies come to focus.
Its importance has just been recently recognized. It is therefore the deplorable situation
facing most business organization that many firms are now taking positive steps to adopt
effective cost control strategies to eliminate wastes, increase profitability and achieve higher
profitability and growth. It is not necessarily axiomatic that rising prices means rising costs,
effective cost control ensure the efficient use of resources. To effect this in a manufacturing
firm. Improvements in technologies are very helpful, but these alone are not sufficient. As
such, management of business organization has devices various strategies to supplement for
the technological inadequacy. Jobs are now timed and standards set. Cheaper and alternative
raw materials are now sought for to produce the same standards and quality of products.
Budgets have also been found as good cost control resources. In many organizations a
committee is set up under supervision of the chief Accountant with other department heads,
each charged with the responsibility of the overall cost control strategy, standards set should
be compared with actual order to correct variances that may emanate. Development in profit
should also be improved so as to ensure growth in organization.
2
Page 13
It based on the above background that the researcher intends to examine the role of cost
control strategies in achieving corporate survival and growth manufacturing organizations.
1.2 STATEMENT OF THE PROBLEM
In Nigeria, it has been observed the most business organization do not effectively control
their cost and problems have become more compounded since the advent of economic
recession in 1977.
The problem of being unable to adopt effective cost control strategies to reduce waste to an
acceptable level and improve upon profits, indeed; these problems demand immediate
solutions. Costs of operation an organization could be effectively controlled in order to
achieve maximum productivity and profitability. Effective cost control strategy involves
identifying the various systematic approaches for controlling cost so as to avoid the
occurrence of under utilization or over utilization of resources. The problems that impose the
proper control of costs by individual such as the personnel management, the cost accountant
and each departmental head and workers of the organization. The remunerations as ways of
motivation for all the individuals who helped in controlling costs accomplish the
organizational objective of higher profits and growth.
1.3 OBJECTIVES OF THE STUDY
The objectives of this study are:-
i. To ascertain out whether a typical Nigerian business undertake an effective cost
control strategy.
ii. To find out where the strategy minimizes total costs of operations with required
increase in profitability and growth.
3
Page 14
iii. To examine the nature of the strategy and its effect on profitability and growth of the
organization.
iv. To identify the roles played by the committee of cost organization.
1.4 RESEARCH QUESTIONS
In the course of the study some pertinent questions were asked and frank efforts were made
to address them, the questions thus include:
(i) What role does cost control have in preparation of growth and profitability in life
breweries?
(ii) What are the effective implementation and realization of full benefit of cost control?
(iii) What are the cost reductions adopted by the company?
1.5 SIGNIFICANCE OF THE STUDY
The study is necessitated by the obvious need for business organizations to plan for the
proper control of their costs through efficient handling of raw materials, equipments, spare
parts and payrolls, especially in this period of economic recession in Nigeria
To appreciate the vital role which effective cost control strategy plays in an organization’s
profit level, growth and existence. The significance of this study is to ensure that this vital
input to production is properly planned and optimally utilized for the achievement of
organization goals and objectives.
This study is useful to all levels of management in the manufacturing business especially
those in the strategic positions. Workers in non-managerial positions will also benefit from
this study, since they too will have to be involved at one point or the other by assisting in
controlling various departments.
4
Page 15
This study may also be useful to academics; it will provide lecturers, students and researchers
with data information to update their knowledge in matters concerning cost control.
Finally, the government, shareholders and potential investors will find this study very useful
in issues concerning control.
1.6 STATEMENT OF HYPOTHESES
In order to carry out this study successfully the following hypotheses were formulated:
i. Ho: The cost control process existence has no significant impact on growth and
profitability of the organizations.
Hi: The cost control process existence has significant impact on growth and profitability
of manufacturing organizations.
ii. Ho: There is no significant co-ordination among the different cost centers within the
company for effective implementation and realization of full benefit of costs control.
Hi: There is significant co-ordination among the different cost centers within the
company for effective implementation and realization of full benefit of costs
control.
iii. Ho: The cost reduction techniques adopted by the companies are not significantly
adequate for achieving company’s objectives.
Hi: The cost reduction techniques adopted by the companies are significantly adequate
for achieving company’s objectives.
5
Page 16
1.7 SCOPE & DELIMITATION OF THE STUDY
This study is limited to cost control in manufacturing industries and as such, it does not
extend other aspects of cost nor does it extend to other sectors of the economy.
In Nigeria, there are many manufacturing organizations registered with Manufactures
Association of Nigeria (MAN). Knowing that cost control is a broad area, the scope of this
study will be restricted to Nigeria Brewery Enugu.
In studying the organizations, the researcher will look at the effectiveness of the existing cost
control scheme and the role it plays in achieving survival and growth in the organizations.
1.8 LIMITATION OF THE STUDY
The general population of this study is all manufacturing firms in the country. This is because
the result of the research will be applied to them but due to the difficulty in having access to
this general population, the researcher chose the specific population to be the significant
staffs of Nigeria Brewery Enugu who are knowledgeable in the subject of the study. These
are about thirty-eight (38) in number that were selected from the accounts and finance
departments and among staff in change of store in the company.
Time Factor: it was one of the major setbacks encountered in carrying out this research. The
researcher has to allocate the limited time she has between her studies and this project work.
Financial problems: Research is capital intensive in nature. The cost of obtaining materials
for the study, the cost of transportation, typing cyclostyling etc: are all capital intensive.
1.9 DEFINITION OF TERMS
According to Ojo (p107) definition of terms used in social sciences research is operational
“words are defined as they are used by the researcher”. This means that the researcher used
certain definition of the terms in the study may be different from ordinary dictionary
meanings.
6
Page 17
ROLE: this is a prescribed or expected behavior associated with a particular position or
status in a group or organization.
COST: cost denotes the amount of money that a company spends on the creation or
production of goods and services. It does not include make-up for profit.
CONTROL: this is to test or verify (a scientific experiment) by a parallel experiment or
other standard of comparison.
COST CONTROL: Cost control is the control of all items of expenditure by regular and
frequent comparison of actual expenditure with predetermined standard or budgets, so the
undesirable trends from stand can be detected and corrected at an early stage.
STRATEGY: this is a plan of action designed to achieve a long – term or overall aim.
ACHIEVING: this is to accomplish a goal or to do something you set out to do. it also bring
about a desired result; succeed.
COOPERATE: this is to work or act together or jointly for a common purpose or benefit.
SURVIVAL: this is an object or practice that has continued to exist from earlier time.
GROWTH: this is the development from a lower or simpler to a higher or more complex
form; evolution.
7
Page 18
REFERENCE
• Argyris;. C. (1975) Human problem with Budgets Canada
Harvard Business Review Vol.2 No.4
• Anyanwu, B.E (1995) The Concept of internal Auditing,
Owerri: SEB publishing Ltd.
• Evans, D. F (2003) Flexible Budgetary Control and Standard Costs. Dallas Texas Mac
Donald and Evans Ltd.
• Garrison, R.H(1979) Management Accounting U.S.A:
Business publications Ltd.
• Gillespie .C. (2004). Standard and Direct Costing; New
Zealand: Pitman Publishing Inc.
• Harper H.M. (1982) Cost and Management Accounting;
London Mac Donald and Evans Ltd.
• Kohler, Eric L (1975), A Dictionary for Accountants Englewood Cliff presence Hail
publishers.
• Moore Franklin G. (2001) The Hand Book of Budgetary Control. U.K Graham
publishers.
• Morrison A .E (1981) Storage and Control of Stock.
London: Pitman publishing Ltd.
8
Page 19
• Obiagwu, F. A (1981) Budgetary for Effective Operation.
Owerri SEB publishers Ltd.
• Oliver Stanley (1975) Accountants Guide to Management Technique USA: Gower
Presshand ‘book
• Osisioma B.C (1996) Studies in Accountancy; Text and readings, Enugu New ages
publishers.
• Pandely I.M. (1985) Financial Management; New Delli:
Vikas publishing House.
9
Page 20
CHAPTER TWO
REVIEW OF LITERATURE
2.1 HISTORIC BACKGROUND OF NIGERIA BREWERY (ENUGU, ENUGU STATE)
Nigerian Breweries Plc, Enugu State Branch (Ama Brewery) is located at Amaeke Ngwo
near 9th Mile Corner in Enugu State. it is the sixth branch of Nigerian Brewery Plc in
Nigeria and it was commissioned in the year 2003. The site covers a total area of
approximately 100 hectares. Ama Brewery is designed with the best cutting edge
technology and world-class standard processes. The company has a production capacity of 3
million hectoliters per annum.
Nigeria Breweries Plc and Heineken International jointly owe the company. It is a beverage
company designed for the production of three brands of beer lagers namely; Star, Gulder and
Heineken, and two brands of soft drink namely; Amstel malta and Maltina, which
are successfully in production.
The company is made up of several departments which are controlled by heads of
departments (HODs) who in turn are summarily headed by brewery manager. He oversees the
general activities of the company.
DIFFERENT DEPARTMENTS AND THEIR FUNCTIONS
A. Support and development: This department is generally responsible for the welfare
and communications in the brewery. This department is the main administrative in the
company since they head decision-making. This department is headed by the
support and development manager and he is assisted by the human resource manager
that is principally involved with employee welfare and the information and
communication manager that is involved with the computer systems operation in the
brewery.
10
Page 21
B. Finance Department: This department is headed by the regional finance manager and
takes care of the company’s finance which is the fundamental tool for problem-
solving. This department provides the information for the company to attract investors,
establish lines of credit and plan for the future. They also pay workers’ salary. The
management and financial accountants assist the manager.
C. Logistics Department: This department is responsible for the stocktaking and
distribution of products to the public. They take care of the means of distribution of
their products and the sales of the products. This department is headed by the regional
logistics manager, and assisted by the middle manager.
D. Quality Assurance Unit: This department is in charge of maintaining the standard
quality of the inputs (raw materials) and outputs (products) of the company. This
department is headed by the total quality manager who is assisted by several analysts.
E. Production Department/Brew House: This department is the largest department and
is involved in the actual beverage making process. The brew house is designed for the
production of 12 brews per day and is automatically controlled from a central control
room and every activity from grains intake to storage is automatically carried out. This
department is headed by the production manager brewing, whom several swift
managers, operators and technicians, assist.
F. Packaging and Engineering Department: This is the second largest department as it
incorporates all packaging, engineering, waste disposal, maintenance and mechanical
processes in the brewery. It is headed by the Packaging and Engineering Manager and
is assisted by middle manager, technicians and operators
11
Page 22
Abbreviations:
S&DM___________ Support And Development Manager
HRM ___________ Human Resource Manager
HIN _____________ Head Industrial Nurse
ICM______________ Information Communication Manager
RFM ____________ Regional Finance Manager
MA______________ Management Accountant
FA ______________ Finance Accountant
RLM ____________ Regional Logistics Manager
LOM ____________ Logistics Operation Manager
SK______________ Store Keeper
TQM ___________ Total Quality Manager
PMB ___________ Production Manager Brewing
SMB____________ Shift Manager Brewing
BOP/BTE______ Packaging And Engineering Manager
PEM ___________ Engineering Development Manager
12
Page 23
MM____________ Maintenance Manager
SMP___________ Shift Manager Packaging
SPM___________ Spare Parts Manager
AM____________ Automation Manager
EUT___________ Engineers In Charge Of Utilities
TPM__________ Total Preventive Manager
PRM___________ Public Relation Manager
2.2 CONCEPTUAL FRAMEWORK
Costs are analyzed in order to provide information that will assist the measurement of control of
expenditure. Behaviorally, cost may be classified under controllable and non-controllable costs.
Kohler defined controllable costs as cost that varies with volume, efficiency and choices is less
than a proportionate manner with management determination and generally are known as
Variable Costs. Example is any cost which may be directly regulated at a particular level of
management authority.
Non-Controlled Costs are defined as:
1. Cost that do not fluctuate with volume
2. Any cost allocated to but not incurred by an operating unit, often not identified with the
supplied goods and services.
Beninger (1976) recognizes that controllable costs are subject to modification and change at a
particular level of management, while uncontrollable cost are not, But Horngren (1987) in his
own view noted that “all cost are controllable to some degree and by somebody over the long
run, those that are controllable are subject to various degrees, of influence’.
Generally, three types of factory costs are incurred in manufacturing companies
13
Page 24
1. Direct material: which is any raw material that is identifiable component of the finishes
product. For example nitrate which is used in the manufacture of Coca-Cola soft drink
2. Direct labour: which is the amount of wages earned by workers who are actually
engaged in transforming the materials its raw material states to a finishes product. Direct
materials and indirect labour comprise the prime cost of a product.
3. Factory overhead: which are indirect labour and other factory overhead. Indirect costs
comprise; factory overhead, selling overhead, distribution overhead and administrative
overhead.
In processing industries, direct labour and factory overhead costs are sometimes referred to as”
Conversion cost”.
The three (3) types of costs discussed above will give the total costs.
2.2.1 COST CONTROL, REDUCTION AND VALUES ANALYSIS
Cost control is adherence to standards; cost reduction is a challenge to the standards
themselves. In other words cost reduction is a further step to cost control. It involves such
measures and procedures by which cost per unit of quantity produced will be lower than
previously.
The aim of cost control must be cost reduction while the aim of cost reduction is to see
whether there is any possibility of bringing about a saving in the cost incurred-materials,
labour and overheads. To reduce cost, requires a, constant appraisal of the whole company
and not just production processes.
Value analysis is a special type of cost reduction. Olive Stanley defines it as “a systematic
inter disciplinary examination of design and other factors affecting the cost of production in
14
Page 25
order to desire a means of achieving the specified purposes, most economically at a required
standard of quantity and reliability”.
Its main objectives are to ascertain the appropriate cost for the appropriate performance.
2.2.2 ASPECT OF EFFECTIVE COST CONTROL
Effective cost control has two aspects; operational control and accounting control. Operational
Control: In a small enterprise, the manger can control cost through personal observation and
supervision of operations. As the business grows, such personal control is delegated too little
supervision. When the business continues to grow, a point is reached when such to control will
no longer be relied upon to keep waste, idleness, inefficiency and other cost contained,
consequently, it then becomes necessary to supplement operational control with accounting
control.
Accounting Control: This requires creating system of records which will analyze costs, account
for them and supply current pertinent reports to reveal how those who are responsible for costs
are discharging their responsibilities.
2.2.3 CONCEPTS OF PROBABILITY AND GROWTH
Accountants use the term profit in a number of ways, for instance profit is the excess of
revenue over cost, and it may qualify as the gross profit, net profit, pre4ax profit etc.
One can also define profit as simply the difference between revenue and cost which arises
because some firms are more efficient than others. Profitability therefore, is the measures of
returns on the resources or capital employed by the organization while growth is the rate of
development in the organization.
Nature and theories of profit
15
Page 26
Brigham and Pappas (1980) recognize four theories of profit which are “Frictional theory and
innovation theory”.
1. Frictional theory: This look at profit from the return of capital viewpoint; it save that return
on capital that would induce people to save and invest their money in business enterprises is
the normal profit. It goes further to say that normal profit is not steady due to frictions in the
economy, which may cause profit to fall below or rise above normal pro fits
2. The Monetary Theory: This suggests that due to some factory such as possession and
discovery of unique resources, innovations, patent rights, copyrights etc. some firms are
placed in the unique and monopoly situation which makes them to manipulate production and
price there by making abnormal profits.
3. The Compensatory or Functional Theory: These views profits are arising as compensation
for efficient and effective management and for undertaking the risks or mvesurLg n an
enterprise.
4. The Innovation Theory: It looks at profit as payment or compensation to successful
inventions of new things or ways of doing things
Factors That Affect Profitability and Growth: Since making of profit involves cost and
revenue, any factor that reduces costs, increase profit vice visa. The factors that affect
profitability and growth mostly in business organization are;
1. Fluctuation in economic Trend: firms are in business to minimize their costs and
optimize their revenues. An economy may experience such economic fluctuations as
depression, and this in turn influence business activities.
2. Changes in population and fashion
16
Page 27
3. The introduction of a new technique: Technology facilities production, it helps to reduce
unit costs, thereby increasing profitability, of the organization.
4. Demand and price.
5. Managerial skill: a prudent, resourceful efficient and innovative management is one that
is able to organize its operations such that costs are minimized and profits optimized.
Organization Role of Profit in a Business
Profits are indispensable in the life of any business organization, it aids business growth. It
increases the capital of the owners of the business. This is because part of the profits may be
ploughed back to: enhance the expansion of the business. Increase scale of production and
finance some other profit yielding projects. In a corporation, the shareholders receive their
share of profits only after dividends have been declared and the profits retained and ploughed
back.
The formula used in dividend declaration is
Po = ∑Dt/(Cl-1L)t
t= 1
where:
Po = Current price
Dt = expected dividend
K = discount rate
17
Page 28
= Indication that the fin is a going concern and there is no foreseeable termination daLe on
the stock. Source: (dames C. Van House, Financial management and policy, 6th ed Engle
wood cliff: prentice —Hall international Inc. 983, P.64).
Profit is indispensable for the growth of business as highlighted. It is therefore advisable for
business undertake those ventures that would maximize their profits and minimize those costs
without fraud or deception. Some of these would include the employment of capable and
efficient managers, proper and prudent employment of the resources available to the
organizations, making sure that enough finance is available to implement most of the projects
of the organization, making available modem equipment of production, which would increase
output and reduce limit cost of the products.
The aim of the measure is to reduce costs and increase revenues. The business organization
marketing, finance and administrative departments to ensure that co-ordination and efficiency
are achieved. In conclusion, the entire story is ensuring the adoption of effective costs control
measures to increase profitability and growth of a business organization.
2.2.4 MATERIAL INVETORY CONTROL
Effective control of material costs involves both operational and accounting control. From the
operational point of view, physical and procedural safeguards should be provided for materials
and supplies, physical facilities should be provide which will protect materials and supplies from
damage or deterioration and make them inaccessible to those unauthorized to do so. In addition,
specific employees should be more responsible for the purchasing receipt, inspection care and
disposition of materials and supplies.
Thus responsibilities of material control will be divided among purchasing, receiving and
inspection, production and service department personnel.
18
Page 29
Accounting control of material costs will be effected for by providing:
a. Forms for recording the requisitioning, ordering purchasing, receiving and inspecting.
b. Issuing and handling of direct and indirect materials.
c. Written procedures of all materials handling
d. Written authorization from persons in the company who are entrusted with phase of the
material acquisition and consumption.
e. A system or reports to reflect material cost performance in respect of such factors as
Usage, Waste, spoilage, Shrinkage and variances from established price and quantity
standards.
f. Written inventory taking procedure and component supervision of accounting and evaluation
inventories.
g. Logical, consistent policies or costing materials issue to production or service departments,
and for presentation of inventories.
2.2.5 THE PURCHASING FUNCTION
The control of material costs should begin with the requisitioning of materials and only few
responsible persons such as the departmental supervisors should be authorized to requisite
materials, and such authorization should be clearly defined in accounting and procedures manual.
In such cases, the authority to requisite production materials and factory supplies will be
confined to production materials and factory supplies will be confined to production control
department.
The Important Steps in Initiating Purchases are:
a. Need for materials.
b. Requisition for materials raised
c. Order prepared and placed
d. Materials they received from supplies.
19
Page 30
e. The material tested and inspected, certified perfect and are received or rejected for
valid reasons.
f. Goods received notes and the materials stored
g. Invoices passed for payment in the account section.
h. Appropriate accounting entries made in the costing and financial book.
Figure: PURCHASING PROCEDURE
NB:
G.R.N = Good Receive Note
L.P.O = local purchasing Order
The receiving department is responsible for running, checking and testing or inspecting
materials. Definite procedures should be established, physical control of materials received,
and a receiving report should be provided to verify receipts.
2.2.6 ACCOUNTABILITY FOR MATERIALS
The store department is charged with accountability for materials, including raw materials,
parts, supplies and scrap through the receiving reports and returned materials report. In the
materials against misappropriate or damage they should maintain constant watch over the
goods.
Buyer
Factory engineer
Suplies
Inspector
G.R.N Invoice
Reguisition
Chegues
Order L.P.O
Inspector Accountantoffice
G.R.N Invoice
Invoice G.R.N
Invoice G.R.N
Reguisition
20
Page 31
If the materials have been requisitioned in excess of actual needs, the excess amount should
be returned to the store department and procedures should be provided for controlling and
accounting for such returns. The store department should again be charged for the materials
and the department which returned them should be received from accounting for these
materials. The transfer of accountability and the reserves flow of cost can be document
through the use of material returned tickets
2.2.7 INVENTORY CONTROL
Pandey (1985) defines inventories as “stock of product a company is manufacturing for sales
and the components that make up the product”.
Plorison (1981) also defined it as “the means by which materials of the correct quantity and
quality is made available as and when required with due regard to economy in storage and
ordering costs, purchase prices and working capital”
Inventories exist in the form of raw materials, work- in-progress, and finished goods,
materials and work- in- progress inventories form more than 70% of any product cost and as
such the purchaser must buy what is right at right quality and quantity. However, Gillespie
(2004) recognizes that a company that neglects the management of inventories is only
jeopardizing its long-run profits ability and many fail ultimately”
In carrying out an efficient and effective control of inventories, the following decisions come
to mind;
a. How much to order?
b. when to order?
In approaching these two decisions, management feels somewhat ambivalent. Pressures, is to
order huge lot or quantity so as to minimize ordering cost. The order pressure is to order
small lot, so as to minimize carrying costs. If pushed too far, either of the courses of action
21
Page 32
will have unfavorable effect on profit but by using certain tool from operation research, we
can arrive at a model
for deriving economic Order Quantity (EOQ) is the point at which the ordering cost equals
the carrying (holding) cost as shown in figure 2 below.
Total point
Cost Low point
Stockholding cost
Ordering cost
EOQ Order size
Fig.2 EOQ MODEL
Ordering Cost: Includes the cost incurred in the requisitioning, purchase ordering
transporting, receiving inspecting and storing.
Carrying cost: Are costs incurred in holding a given level of inventory. They include storage
costs Insurance, Taxes, cost of deterioration and obsolescence etc.
Mathematically, EOQ= 2ac / Ip
Where:
22
Page 33
a = annual demand
c = ordering cost
p = price of inventory
I = an expression of 1% inventory holding cost.
For a period, the total ordinary cost is simply the number of orders for that period multiplied
by the cost per order. While the total carrying cost is the average number of units of inventory
for the period times of the carrying cost per unit.
Illustration= If a manufacturing company purchased raw
Materials from outside supplies at 17.10 per order.
Total annual need = N18O0.
Total ordering cost per order processed in N30 and the desired annual return on inventory
investment 15% of
N17.1O EOQ for the company can be calculated using the
Formula above
EOQ = 2ac/ip = (2x1800x30)/ip = 205units
Number of order will therefore be;
EOQ = 1800/205 = 8.8times
2.2.8 INVENTORY VALUATION METHODS
When the materials requisition have been honored by the storekeeper and have been noted on
the bin cards, they are passed to the cost officers. At this stage a price is inserted upon the
material requisitions and this is to give the total cost of the issue, which has been made to the
23
Page 34
job or process in the factor. C.J. Walker recommends the following valuation methods in a
manufacturing company. Actual Cost, F’IFO, LIFO, AVCO Market price and standards cost.
Some of these methods are explained below;
FIRST IN FIRST OUT (FIFO)
1. FIFO is a costing method widely used in valuing inventories. The method assumes
that materials flow from stores to production in the same chronological order as they
were produced; first purchases are issued out first.
Supposing Coca-Cola Bottling Company’s card for the month of June was as follows.
Quantity Price (N)
June 2 100 7.00
June 6 150 8.00
June 10 200 8.50
June 13 200 8.975
June 18 150 --
THEIR INVENTORIES CAN BE VALUED USING LIFO
VALUATION METHOD
Date Receipts
Qty Up(N) Value Qty Up(N) Values Qty Up(N) value
June 2 100 7.00 700 100 7.00 700
June 6 150 8.00 1200 250 7.8 1900
June 10 200 8.5 1700 450 8.5 3600
June 13 200 8.975 1795 650 8.975 5395
June 18 150 7.8 1100 500 4295
(100x7)
(50x8)
Field Survey 2015
24
Page 35
LAST IN FIRST OUT
Thus method assumes that the prices of last material that comes in is the price of issue unit
that quantity is exhausted, using the same illustration of coca-cola bottling company
valuation of inventories
Would appear as in table 2.2.
Table 2.2 life method of inventory valuation
Date Receipts
Qty Up(N) Value Qty Up(N) Values Qty Up(N) value
June 2 100 7.00 700 100 7.00 700
June 6 150 8.00 1200 250 7.8 1900
June 10 200 8.5 1700 450 8.5 3600
June 13 200 8.975 1795 650 8.975 5395
June 18 150 8.975 1346 500 8.098 4049
AVERAGE COST (AVCO) METHOD
Where a material is purchased at different prices, it seems logical to regard cost of a unit of
such material as the average of all the units’ purchases. This method tends to smoothen out
the fluctuations in prices and it favours the accountants. Using the same illustration, valuation
using AVCO method is as follow in table 2.4
Date Receipts
Qty Up
(N)
Value Qty Up
(N)
Values Qty Up
(N)
value
June 2 100 7.00 700 100 7.00 700
June 6 150 8.00 1200 250 7.8 1900
June 10 200 8.5 1700 450 8.5 3600
June 13 200 8.975 1795 650 8.975 5395
June 18 150 8.3 1245 500 4150
Field Survey 2015
Field Survey 2015
25
Page 36
2.3 THEORETICAL FRAMEWORK
Without manpower, it would be impossible to produce or distribute goods and services, and
thus impossible for the business to exists or achieve its objective. To buttress this, it is the
human resources that combine factors or ideas to produce the products and. services which
are economic products, which the consumer will be willing to buy with his hard earned cash
or currency.
The objective of planning, and control labour cost is therefore trying to ensure that the firm
receive optimum services at optimum cost from the people it employ in producing,
distributing products and services.
Labour costs involved both rational and accounting control.
Operational controls of labour costs involve Job analysis, job classification and the
recruiting, hiring and training of qualified personnel. It also involves the appointment of
supervisors with responsibility of clearly defined area of labour cost and necessary authority
to maintain control over labour utilization. Accounting control is achieved by development of
forms and records, and the preparation of various reports on:
a. The efficiency of utilization of labour
b. The effects of ways incentives
c. The share of labour in the total products of the enterprise.
ENTERPRISE
Labour control is meaningful only when it can be measured in number of persons employed
or man hours, units’ workers, capital asses, tools and equipments in monetary units.
26
Page 37
Approaches ofLabour Control
Labour control starts from selection of employees. The line manager supplies all information
needed as regards the selection to the personnel department. In some companies the personnel
manager does the work of finding suitable workers. In such a situation, if there is any
mistake, the personnel officer is blamed for making joint effort of line manager is required in
selection of employees. The requirements for employee’s selection are;
1. Physical requirements such as sex, eyesight, etc.
2. Mental or psychological requirements such as intelligence.
3 Training requirements such technical qualification and experiences.
Whenever the right person is selected there should be greater efficiency with minimum costs.
Furthermore, the rate of turnover should be at a reasonable level. Also excessive cost relating
to training and recruitment are avoided.
A. Induction Training
After selection, induction follows, that is an attempt should be made to introduced each
employee to what the company makes, how the particular department contributes to the end-
product, the organization of the business, the names of the mangers, foreman and
supervisors and any matter which affect him personally such as collection of wages, names of
trade union official, rules regarding overtime working cards details of social activities, as
activities standard output, cost per unit and the importance of controlling cost including the
correct procedures for checking on and off jobs, are all vital matters.
27
Page 38
B. Absenteeism, Lateness and Overtime
Batty recognizes that “if the right man is selected and trained for a particular job, this reduces
cost, provided a careful which is maintained on the performance of the works”.
As a general rule, the wage selection or personnel section keeps records of absenteeism or
late. The foreman should be aware of lateness or absence of work immediately they occur.
With this maintained in a firm effective labour control will be achieved at all times because
employees will now know that they are being monitored and this will improved their
behavior to work. Good performance should attract immediate record, and consistently bad
performance should attract necessary disincentive.
Another area to be watched carefully is overtime, It has to regulation otherwise some workers
will abandon their normal work in order to do them during overtime, thereby causing
additional costs. Limits should impose on normal working hours, above which no worker is
allowed to exceed. Control can be affected by stipulating that departmental managers must
authorizes all overtime if standard costing is employed, any normal overtime will usually be
included in the standard cost. If additional overtime is worked, the cost would reveal in
labour various.
C. Use of time sheet in labour control
Labour cost can be controlled through the use of time sheet. This requires the recording of the
time a job is started and when the same job is completed. In this regard, a hypothetical unit
representing the amount of work to be done in a given hour is established as a standard
performance.
In an organization, where time keeping is done by distinct department, it takes care of
1. Overseeing the arrival and departure of workers.
28
Page 39
2. Maintaining records of how workers spend plant time.
Control of the first item involving total hours on job is commonly reflected by the use of
clock cards. They contain space for an industrial employee’s names, his number, his duty for
the week, that is whether on morning or afternoon duty, arrival and departure times. The
cards are designed to be inserted into a time clock that wills in-print the time of each such
insertion. A time clock is usually placed inside each entrance to officers or departments with
an accompanying rack for holding the clock cards of all employees which use that particular
entrance. When an employee enters his work area in the morning, he takes his card from the
rack, inserts it in the clock and returns it to the rack. When he leaves for lunch, it will clock
out and again clock in after lunch, with a final clock out at the end of the day. This card
shows whether he was late and how many time he spent in the plant.
D. Labour Wastes and it control
Labour wastes can occur in the form of idleness, non- supervision of the worker force,
exercise tea-break and late arrival or early dismissal on workers part: Idleness manifest in
three principal areas namely: idleness of personnel, idleness of facilities and idle space.
Personnel idleness reflects in a plant incomplete utilization of its labour force.
The causes are:
1. Insufficient work for certain employees.
2. The seasonal nature of a company’s
3. Sickness and injuries
4. Labour management disagreements
5. Absenteeism and tiredness.
29
Page 40
The type of waste can be minimized by job analysis, time and motion studies and preparation
of intelligent job description. On the other hand, idle facilities may exist when workers are
unable to use existing productive facilities because of:
1. Material shortage.
2. Breakdown of equipment
3. Unavailability of equipment
4. Absence of inspectors
Accounting to control of idleness must start with records for accumulating the cost time of
man and facilities. Employee’s time reports should show directly the amount of idle time
daily and their immediate supervisors should report such idleness. Based on this,daily weekly
reports summarizing such idleness and its cost should be prepare and presented to
departmental supervisors.
Factors That Affect Worker Productivity
The factors that commonly affect workers productivity are the work condition, time keeping,
and the light at the work place, healthy welfare, contented workforce and transport fare.
To solve these problems Obiagwu (1981) outlined some concept that can be used to enhance
workers productivity. These are:
Work humanization, Job environment quantity of working life job content, and factory
conditions like the development of team work approach to tasks in order to surmount the
problems of boredom, the introduction of flexible time to provide the individual work with a
great sense of control and better working condition.
30
Page 41
In addition to the above, Anyanwu (1995) also recognizes job enlargement, job rotation and
redesign and redesign incentives scheme and Fringe Benefits Incentive Scheme: Moore
(2001) use the ten-n “Incentives to describe wage payment plans which tie wages directly or
indirectly to productivity standards”.
In developing a good wage incentive, the company must ensure that;
1. The work contents are accurately measured to obtain full confidence on the work.
2. The schemes are fair and just to both the employer and the employee.
3. The workers are paid in direct proportion to the individual effort rather than as a
group
4. The scheme is simple in operation so that the workers can calculate their wages
easily.
5. The scheme gives the worker a guaranteed minimum wage.
6. The scheme has a reasonable degree of performance, and contains as much incentives
for slow and fast works.
Companies are entitled to any of these types of incentive scheme;
• Individual scheme
• Group scheme
• Factory-wide productivity scheme
• Profit sharing plans.
All these incentives tend to make the workers earnings more reasonable and intact Fringe
Benefits: Fringe benefits represent an extra Income, Additional security more desirable
31
Page 42
working conditions that require no additional effort. They are some of the free or subsidized
services offered by gain onthe part of the employees, as without such services, the employees
would have to pay for themselves. These include; free market services, transport, housing,
food subsidized lunch or luncheon vouchers, recreational services, other fringe benefit may
include paid public and annual holidays, contribution towards sickness benefits, redundancy
a’ company provident funds and pension schemes.
The rationale behind this is to reduce cost or just to maintain costs within limit, even though
this may lead to greater pay packet. On the other hand, the work facilities are better utilized,
hence the workers know that for every effort they make, they will be rewarded.
In conclusion, economic revival required greater creativity in our approach to manpower
development and utilization. We must therefore harness and effectively manage our human
resources for economic survival.
2.3.1 OVERHEAD COST ANALYSIS AND CONTROL
Operational and. accounting controls are employed in the control of overhead costs.
Overhead can he classified into’
Variable and fixed overhead costs, while the former varies with the level of activity, the later
does not. In other words, fixed cost is stable and predictable while variable cost is unstable
and unpredictable, always up and down.
These are the conceptions of various authors in the field of cost accounting, hut the researcher
felt that since controllability is relative to both time horizon and the management
responsibility area under considerations, it will be erroneous to agree with these authors that
variable cost are controllable while fixed cost are uncontrollable.
In support of this Anyanwu (1995) noted that “fixed cost can be conducted to variable cost”.
32
Page 43
2.3.2 Overhead Application Basis
A reasonable basis for applying estimated overhead to job are established by relating
overhead to other factors of production. In practice, the overhead of a producing department
are commonly related to one of the following production factors identified by Helper (1982):
Direct material cost
• Direct labour cost
• Prime cost
• Direct labour hours
• Machine hours
• Unit of production. An illustration:
The Obi and Sons Co showed the following information for the year 1997.
Direct material 42,200
Direct wage cost 40,000
Direct labour hours 10,000 hours
Machine hour operated 20,000 hours
Overhead applicable to the shop 50,000
The one batch of Co2 made this during the period, incurred the following costs;
Material 400
Labour 800
33
Page 44
Direct hour 220
Machine hours 1,000
An account for Co2 of the overhead costs can be absorbed using any of the control basis
mentioned above.
Solution:
Direct labour = 5000/10,000 = 0.5x220 =N110
Direct wage cost = 5000/40,000 = 0.125 x 800 =N100
Machine hour operated 5000/20,000 = 0.25X 1000 = N250.
Table 2.4: Basis for Direct Labour Cost.
N N
Material 400 Overhead cost
Labour 800 Control A/C 1300
Overhead 100
Total 1300 1300
Direct labour hours 200
Machine hours 1,000
An account for Co2 of the overhead costs can be absorbed using any of the control basis
mentioned above:
Solution:
Field Survey 2015
34
Page 45
Direct labour = 5000/10,000 = 0.5 x 220 = N110
Direct wage cost = 5000/40,000 = 0.125 x 800 = N100
Machine hours operated = 5000/20,000 = 0.25x100 = N250
Table 2.4: Basis of Direct Labour Cost.
N N
Material 400 Overhead cost _
Labour 800 Control A/C 1300
Overhead 100 _
Total 1300 1300
Table 2.5: Basis of Labour Hours.
N N
Material 400 Overhead cost
Labour 800 Control A/C 1310
Overhead 110
Total 1310 1310
Table 2.6 Basis of Machine Hours.
N N
Material 400 Overhead cost
Labour 800 Control A/C 1300
Overhead 100
Total 1300 1300
Field Survey 2015
Field Survey 2015
Field Survey 2015
35
Page 46
The factory overhead control account is a general ledger cost of control account from the
above illustration; the company is favored with direct costs basis absorption.
2.3.3 WORKING CAPITAL MANAGEMENT AND CONTROL
This is another area in the cost control.
Van Horn’s (1990) describes working capital management as “involving the administration
of current assets and current liabilities”.
Current assets include assets such as cash, marketable securities, and receivables arid
inventories.
In this study, the researcher’s attention will be directed toward cash and inventory aspect of
working capital. Inventory management control had already been discussed. Therefore the
researcher will base his discussion in cash management. Cash are required as - cash balance
in hand, bank balances, short-term deposit and other near cash items.
j.m Keynes (1985) identified three basic motives for holding cash are;
1. Transaction motive: This is the need to hold cash for meeting payment arising in the
ordinary course of business
2. Precautionary motive: relates to holding of cash to meet unexpected contingencies.
3. Speculative motive: relates to the holding of cash to take advantage of expected
business opportunities.
Excess cash involves greater liquidity for idle assets, although this may involve little risks
and less profitability, as the excess cash are not channels into investment. On the other hand,
maximum availability of cash will ensure prompt payment for transactions, which is capable
of attracting cash discount, and this in effect will reduce unit cost of a firm‘s product when
36
Page 47
the excess are channeled into investment. This will attract more profits and some element of
work. Firms are therefore advised to make efficient use of their cash.
2.4 REVIEW OF CURRENT LITERATURE
According to Trevor (1979) “cost control is the control of expenditure within pre-determined
levels”
Eric (19Th) defined it as “the employment of management devices in the performance of any
operations so that re-establishment objectives of quality, quantity and time may be attained at
the lowest possible out lay for goods and services’.
Breech (1980) sees cost control as “the control of all terms of expenditure by regular and
frequent comparison of actual expenditure with predetermined standards for budget, so that
undesirable trends away from standard can be detected and corrected at early stage’.
According to Allan R. Drebin and Harold Bierman (1995) cost control considers what should
be and what corrective action should be taken when costs are excessive”,
From the foregoing, one can say that cost control is a continuous activity aimed at improving
efficiency and quality by ensuring that the right resources are provided, and only directing
anticipated levels, it is also concerned with understanding how and why costs change. Cost is
concerned with the setting of performance standard and monitoring of actual results against
these standards.
And finally, it is concerned with people’s attitude and motivation when handling money that
is not their own cost control will be meaningless unless constant attempts are made in
reducing the costs.
37
Page 48
In any organization, cost control will be best achieved when the following measures are
taken:
1. Cost standard are predetermined
2. The actual costs are ascertained
3. Comparisons are made between the two above
4. Variances are established, analysis and reported upon.
5. Executive actions necessary are taken to ensure that exceptions of deviations are
brought back on course.
A budget is a quantitative economic plan in respect of a period of time. Evans (2003) defined
budget and control as a system of controlling costs which includes the preparation of budget,
co-coordinating the departments, establishing responsibilities, comparing actual performance
with that budgeted and acting upon results to achieve maximum profitability”.
Certain fundamental principles can he outlined from these definitions and these are:
1. You establish a plan or target of performance which co-ordinates all the activities of
the business.
2. Record the actual performance.
3. Compare the actual performance with that planned.
4. Calculate the differences of variances and analyze the reasons for them.
5. Act immediately, if necessary to remedy the sit action.
One can say that budgetary control is an embodiment of planning and control process with
feedback concept. An illustration of this inter-relationship is presented in figure 2.4
38
Page 49
PLANNING PROCESS CONTROL PROCESS
Goals
Objective
Management
decision
Budgets
Feedback for fut
Fig. 2.4 Planning and Control Process
Source: management accounting: a decision emphasis by Don T Decoster and
EldenL.Sehafer)
The budget is not only expression of management plans but also basis of comparison with
actual results in the central process. The latter function being performed with the aid of
budgetary control reports. To make the budgetary control system effective, the organization
should:
Monitor actual activity and measure
actual results
Compare actual results with plan
identifying significant deviation
Investigation significant from deviation plans
Take corrective action
39
Page 50
1. Create budget centers
2. Introduce adequate accounting records
3. Prepare instruction in techniques
4. Prepare organization chart with defined responsibility.
5. Set the work of the budget committee.
6. Define the budget periods, the key factors and level of activity.
The most vital of all these is the preparation of an organization chart. The starting point in
designing and establishing a budgeting control system is to define responsibilities. This may
be best achieved through the preparation of a organization chart which will defines the
functional responsibilities of each member of company and his relationship to other
members. The organization chart will depend on the nature and size of the company but a
simplified sample is given in figure 2.5, this time depicting budget responsibilities
40
Page 51
Chief Executive
Buyer Sale manager Production
manager
Accountant
Purchases Sale, selling
and
distribution
costs
production
Figure 2.5. Organizational Chart of Budgetary Control
Responsibility for setting standard
Standard Costing: Is the system of cost accounting, which makes use of predetermined
standard cost relating to each element of cost control techniques which involves the following
steps:
1. Predetermination of the standard costs.
2. Recording of actual cost incurred.
3. Recoding of actual with standard costs
Budget Officer
Production cost Admin.
Cost cash master capital
expenditure
Plant utilization
41
Page 52
4. Obtaining the cost variances, which are analyzed so the inefficiency may be quickly
brought to the notice of the person responsible for them.
5. Reporting to management, so that appropriate action can he taken.
His action is the important of effective cost control. F hypothetical case is given below to
illustrate what face been discussed so far.
Fig. 2.6 production cost budget report to management for period: Three months to 31stJuly
2013
Variance
Budget Actual adversefavourable
N N N N
Direct materials
Product A 6,000 6,000 600 -
Product B 9,000 9,000 • -
Product C 3,000 2,850 • 150
Direct Labour - -
Product A 10,500 10,800 300 -
Product B 10,500 10,200 • 300
Product C 40,500 4,600 150 -
Production material 11 -
Product A 2,400 2,469 69 -
Product B 3,000 2,913 - 87
Product C 1,200 1,239 39 -
Total 50,100 50,721 1,158 537
Field Survey 2015
42
Page 53
With the above variance, whether adverse or favorable, management would now be in the
position to determine:
1. Where the variance occurred (material, labour and overhead)
2. What was responsible and
3. Why it happened.
43
Page 54
REFERENCES
• Batterseby Albert (1980) A Guide to stock control
London: Pitman Publishing Ltd.
• Black., Chapin. and miller (1975) Principles of Accounting
3rd Edition USA: CBS College publishing.
• Brigham and papas (1976) Management Economics
London: Dryden Press.
• Breech, E. F. L. (1980) The Principles and Practice of Management London:
Longmanpublishers.
• Earnest L.N (1976) Variance Accounting, London:Prentice —Hall Press inc
• Evans, D. F (2003) Flexible Budgetary Control and Standard Costs. Dallas Texas Mac
Donald and Evans Ltd.
• Garrison, R.H(1979) Management Accounting U.S.A:
Business publications Ltd.
• Gillespie .C. (2004). Standard and Direct Costing; New
Zealand: Pitman Publishing Inc.
• Harper H.M. (1982) Cost and Management Accounting;
London Mac Donald and Evans Ltd.
• Kohler, Eric L (1975), A Dictionary for Accountants Englewood Cliff presence Hail
44
Page 55
Publishers.
• Moore Franklin G. (2001) The Hand Book of Budgetary Control. U.K Graham Burn
publishers.
• Morrison A .E (1981) Storage and Control Of Stock.
London: Pitman publishing Ltd.
• Obiagwu, F. A (1981) Budgetary for Effective Operation.
Owerri SEB publishers Ltd.
• Oliver Stanley (1975) Accountants Guide to Management Technique USA: Gower
PressHand ‘book
• Osisioma B.C (1996) Studies in Accountancy; Text and readings, Enugu New ages
publishers.
• Strawser, B.F (1990) Financial Accountig. USA Dame Publishers Inc.
• Van Horns, James C, (1983) Fnancial Management and Policy 6th edition.
EnglewoodCliff; prentice.
45
Page 56
CHAPTER THREE
RESEARCH METHODOLOGY
3.1 DESIGN OF THE STUDY
This research adopted a case study and survey approach. Data were collected from the firm
used as case study. The data collected were analyzed and the findings used to generalize all
firms in the manufacturing industry.
3.2 POPULATION
Population is the totality of the observation with which we are concerned. Population can be
finite or infinite. A finite population has a definite unit, it is infinite if it has no upper unit or
the number of units it contains is not known. It is also considered as a universe of data
consisting of data within special parameters and it can refer to a special group to be
measured. It is precisely defined in this research work. Since the research could not cover the
whole population, a sample of the population was selected to represent the entire population
consisting of the respondent and selected analysis in respect of the research work. The
population in this research work is to Nigeria Breweries, Enugu.
3.3 SAMPLE SIZE
According to Obasi (1997, p.57) the size of a sample is determined by the combination of
technical issue as well as human and financial consideration. The technical factor includes the
size of population. The level of precision desired and the level of variability of factors to be
estimated. The homogeneity of the population, the extent of prior knowledge about the
characteristics of the population, the rate at which the development is taking place in the area,
among other critical determinations that informs the sample size.
46
Page 57
It is important to mention that sample size is used in studies that involve a large population.
Samples are used for the following reasons:
- To adequately manipulate an enormous population to avoid errors due to the
calculation of large numbers.
- The desire to reduce the cost of producing questionnaire that will cover the
entire population in question.
To this end, a total of 38 respondents were administered with the questionnaire chosen from
the identified and selected population. However, only 30 questionnaires were dully
completed and returned to the source. The responses from the respondents as contained in
this research questionnaire were restricted to accommodate the independent and dependent
variables so as to relate the facts on how the financial institutions operate or been furthered
towards economic development.
3.4 SAMPLING TECHNIQUES
The researcher adopted the judgmental sampling technique to decide that the enforce specific
population be used as the sample since the population is small and finite. Thus the sample
size is 38 staff selected from the two companies used as cases study.
QUESTIONNAIRE DESIGN AND ADMINISTRATION
The questionnaire was carefully design to save some specific purposes. It was designed to
collect data on the role of cost control strategy in an organization and the impact of the
strategy in achieving corporate survival and growth of the organization
47
Page 58
The questions was addressed to the following categories of employees in the organization;
top management staff, accountants, junior staff and factory workers. Breakdown of the
pattern of response from the employees are shown in table3.1 below:
Table 3.1 questionnaire distribution
No. of questionnaire
Respondents Sent out received Percentage
Top management 12 10 26.3
Accountant 6 5 13.2
Junior staff 10 7 18.4
Factory workers 10 8 21.0
Total 38 30 78.9
From the table above, a total of thirty-eight (38) questionnaire were distributed to different
categories of workers and thirty (30) were returned representing 78.9%
3.5 RESEARCH INSTRUMENT
Research instrument is a means or item through which information or data will be elicited.
The main research instruments used in gathering the necessary information for the research
work are interview and questionnaire. These were well constructed and clearly worked for
easy understanding and to void errors commonly associated with this type of instruments
when used by some researchers. Ambiguous questions were carefully avoided so that
respondents would feel free and understand the questions being asked. The research work
also made used of anecdotal sources that is, the secondary sources.
Field Survey 2015
48
Page 59
3.6 INSTRUMENT VALIDATION
Validity as postulated by Tuckman (1978,p. 92) is concerned with measurement. It deals with
accuracy and effectiveness of the measuring instrument. Validity is the appropriateness of an
instrument in measuring what it tends to measure. The validity of a test is the extent to which
a test measures what is supposed to measure.
This research work was done by giving the draft questions to the teacher’s supervisor, in
which his comments were useful in establishing content validity of the instrument.
In the conclusion of the research questionnaire, the following steps were applied;
i. The determination of the information required
ii. Who were the respondents to answer the question
iii. Deciding on how to phrase the question
iv. Deciding on how to arrange the questionnaire
v. Deciding on how to administer the questionnaire
3.7 RELIABILTY OF THE INSTRUMENT
Reliability of a test instrument according to Ogbuoshi (2006, p. 91) is consistency of the test
in measuring whatever intends to measure. It involves the accuracy of both the process and
result of the measurement. Wherein, a measuring instrument is reliable if it provides the same
data when administered twice or more under the same/similar condition.
The question and interview are reliable because it has given the researcher the desired result.
The researchers tested the reliability of the instrument by using the same questionnaire to take
two separate measurements on the same population at different times. The correction between
the two instruments shows the reliability of the instrument.
49
Page 60
3.8 SOURCE OF DATA COLLECTION
The data for this study were obtained from two major sources- primary and secondary
sources of information.
The Primary Data: These are data obtained from the companies with the aid of some
prepared pieces of questionnaire.
Staff of the organizations directly answered the questionnaire. In addition oral interview were
conducted with some top- level managers, production managers and particularly the financial
accountants. Personal observation was also used.
The Secondary Data: These are data obtained from several sources; these include textbooks
on cost accounting, management accounting, personal management, finance, economics,
magazines, Journals and newspapers,
3.9 METHOD OF DATA ANALYSIS
The major statistical methods used for data analysis was T-students distribution analysis. A
simple percentage was also used m the preliminary stage of the analysis.
The T- students distribution is computed using the
Formula
t = (X-U) N
Where:
T = Calculated value
N Number of respondents
50
Page 61
X = Number of successes (yes)
U = Number of respondents multiplied by the assumed probability (NP)
= Standard deviation NP9
P = Is the same as 90% of confidence
Q = is the same as 10% level of error.
The procedure involved preparation of the T- student distribution are as follow:
1. Calculate t
2. Refer to the appropriate table for the desired significance level (which is 90% in the
research study) and find the value of that t. this value will be positive for upper tail
test and value negative for lower tail test.
3. Decision rule:
For upper and one tail test (tve), accept
Ho, if calculated value (t) is less than the t interval otherwise reject Ho if calculated t is
greater than the t internal.
The T student’s distribution has a relative frequency curve that is bell shaped as shown in
51
Page 62
Figure 3.1;
Lower tail test Upper tail test
-X +X
FIGURE 3.1 SKETCH OF T- STUDENTS DISTRIBUTION
52
Page 63
REFERENCES
• Argyris;. C. (1975) Human problem with Budgets Canada
Harvard Business Review Vol.2 No.4
• Anyanwu, B.E (1995) The Concept of internal Auditing,
Owerri: SEB publishing Ltd.
• Batterseby Albert (1980) A Guide to stock control
London: Pitman Publishing Ltd.
• Black, Chapin. and miller (1975) Principles of Accounting
3rd Edition USA: CBS College publishing.
• Brigham and papas (1976) Management Economics
London: Dryden Press.
• Breech, E. F. L. (1980) The Principles and Practice of Management London:
Longmanpublishers.
• Earnest L.N (1976) Variance Accounting, London:Prentice —Hall Press inc
• Evans, D. F (2003) Flexible Budgetary Control and Standard Costs. Dallas Texas Mac
Donald and Evans Ltd.
• Garrison, R.H(1979) Management Accounting U.S.A:Business publications Ltd.
• Gillespie .C. (2004). Standard and Direct Costing; NewZealand: Pitman Publishing
Inc.
53
Page 64
• Harper H.M. (1982) Cost and Management Accounting; London Mac Donald and
EvansLtd.
• Kohler, Eric L (1975), A Dictionary for Accountants Englewood Cliff presence Hail
Publishers.
• Moore Franklin G. (2001) The Hand Book of Budgetary Control. U.K Graham Burn
publishers.
• Morrison A .E (1981) Storage and Control Of Stock.
London: Pitman publishing Ltd.
• Obiagwu, F. A (1981) Budgetary for Effective Operation.
Owerri SEB publishers Ltd.
• Oliver Stanley (1975) Accountants Guide to Management Technique USA: Gower
PressHand ‘book
• Van Horns, James C, (1983) Financial Management and Policy 6th edition.
EnglewoodCliff; prentice.
54
Page 65
CHAPTER FOUR
DATA ANALYSIS, FINDINGS, AND DISCUSSION
4.1 RESULT AND DATA ANALYSIS
In this chapter, attempts are made to analyze the data collected from the respondents through
the completed questionnaires. As indicated in chapter three, thirty eight (38) questionnaires
were distributed to the companies, while thirty (30) were returned representing 78.9%
response rate. A total of twenty (20) questions were asked to these categories of employees
and in analyzing their response simple percentage were utilized. Firstly, Yes/No response was
analyzed. The analysis was based on the company being studied.
The questionnaire was carefully design to save some specific purposes. It was designed to
collect data on the role of cost control strategy in an organization and the impact of the
strategy in achieving corporate survival and growth of the organization
The question was addressed to the following categories of employees in the organization;
Top management Staff, Accountants, Junior Staff and Factory Workers. A breakdown of the
pattern of response from the employees is shown in table 4.1 below:
Table 4.1 Questionnaire Distribution
No. of questionnaire
Respondents Sent out received percentage
Top management 12 10 26.3
Accountant 6 5 13.2
Junior staff 10 7 18.4
Factory workers 10 8 21.0
Total 38 30 78.9
55
Page 66
From the table above, a total of thirty-eight (38) questionnaire were distributed to different
categories of workers and thirty (30) were returned representing 78.9%.This implies that the
Top management turned out more in returning the distributed questionnaire.
Question 2: does the physical control over storage of materials help in limiting material theft?
Table 4.2 Effect of Physical Control Material Theft
Option Response Percentage
Yes 28 93.3
No 2 6.7
Total 30 100 Field Survey 2015
Remark: Twenty-eight (28) representing 93.3% of the employees indicated that the company
exercise physical control over storage of materials, which help in limiting material theft,
while 2(6.7%) said No. This implies that the company exercise physical control over storage
of materials, which help in limiting material theft.
Question 3: Does the physical over control handling and use of materials help in limiting
material wastage?
Table 4.3 Physical Control In Limiting Wastage
Option Response Percentage
Yes 28 93.3
No 2 6.7
Total 30 100 Field Survey 2015
56
Page 67
Remark: In response to question 3; 28 (93:3%j employees agreed that physical control over
handling and use of material help in limiting material wastage while 2(6.7%) disagreed. This
implies that physical control over handling and use of material help in limiting material
wastage.
Question 4: Is the cost control strategies effectives?
Table 4.4 Effectiveness of Cost Control
Option Response Percentage
Yes 15 50
No 15 50
Total 30 100 Field Survey 2015
Remark: In responding to question 4, there is an equal number of Yes and No responses,
which means 15 respondents agreed and 15 disagreed. This implies that there is or there is
none of the cost control strategies that are effective.
Question 5: Has material management employed by the company help to produce
management with accurate and ready information concerning materials?
Table4.5 Information Concerning Material
Option Response Percentage
Yes 26 86.7
No 4 13.3
Total 30 100 Field Survey 2015
57
Page 68
In responding to question 5, 26(86.7%) of the respondent agreed that material management
employed by the company help to provide management with accurate and ready information,
while 4(13.3%) disagreed. This implies that material management employed by the company
help to provide management with accurate information concerning materials.
Question 6: does your cost control scheme emphases efficient utilization of materials?
Table 4.6 Effectiveness Utilization of Materials
Option Response Percentage
Yes 27 90.0
No 3 10.0
Total 30 100.0 Field Survey 2015
Table 4.7 Cordial Relations among Heads of Departments
Option Response Percentage
Yes 27 90
No 3 10.0
Total 30 100 Field Survey 2015
Remarks: From the responses obtained 27(90%) agreed that cordial relationship exist
between the heads of department, while 3(10%) disagreed with the opinion. From the
information obtained; this implies that there is a cordial relationship between the head of the
departments.
Question 7: Does the head of the departments consult other heads of departments in decision
making?
58
Page 69
Table 4.8 Consultation among Heads in Decision Making.
Option Response Percentage
Yes 29 96.7
No 1 3.3
Total 30 100 Field Survey 2015
Remarks: 29(96,7%( of the employees are of the view that the head of department consult
each other decision making, while 1(3.3%) are against the opinion. This implies that the
heads do consult themselves when making decisions.
Question 8: Do the workers of a department help another worker of different department in
carrying out their assignments?
Table4.9 Interdependency between Workers.
Option Response Percentage
Yes 17 56.7
No 13 43.3
Total 30 100 Field Survey 2015
Remarks: in analyzing question 8; 17(56.7%) of the opinion agreed that there is
interdependency between New workers of different department, while 13(43.3%) were of a
different opinion. This implies that there is interdependency between new workers of
different department.
Question 9: Do (8 above) affect the co-ordination among different cost centers?
59
Page 70
Table 4.10 Effect of Co-ordination among Cost Centers.
Option Response Percentage
Yes 28 93.3
No 2 6.7
Total 30 100 Field Survey 2015
Remarks: Yes response were 28(93.3%), while No responses were 2(6.7%) This implies that
interdependency between workers affects the co-ordination among different cost centers.
Question 10: Are the heads of department involved in budget preparation?
Table 4.11 Head Involvement in Budget Preparation.
Option Response Percentage
Yes 28 93.3
No 2 6.7
Total 30 100 Field Survey 2015
Remarks: In response to question 10; 28(93.3%) of the respondents are of the view that head
of departments are involved in budgetary preparation, while 2(6.7%) disagreed. This implies
that head of department’s are involved in budget preparation.
Question 11: Are there effective supervision and implementation of budget by heads of cost
centers?
60
Page 71
Table4.12 Supervision and Implementation of Budget.
Option Response Percentage
Yes 28 93.3
No 2 6.7
Total 30 100 Field Survey 2015
Remarks: in view of the data above, yes 28(93.3%) and No 2(6.7%). This implies that there
are effective supervision and implementation of budget by heads of cost centers.
Question 12: Have identification arid elimination of unnecessarily in realizing corporate
objective?
Table 4.13 Realizing Objectives Through the Elimination of Unnecessary Cost.
Option Response Percentage
Yes 18 60.0
No 12 40.0
Total 30 100 Field Survey 2015
Remarks: in responding to question 12, ‘Yes were 18(60.0°/b), No responses were
12(40.0%). This implies that identification and elimination of unnecessary cost by value
analysis have contributed immensely in realizing the corporate objective.
Question 13: Have the cost reduction techniques employed by the companies improve
material handling method?
Table 4.14 Improvement in Material Handling Through Costs Reduction
Techniques.
61
Page 72
Option Response Percentage
Yes 28 93.3
No 2 6.7
Total 30 100 Field Survey 2015
Remarks: The figure obtained 28(93.3%) for Yes and 2(6.7%) for No, This implies that the
control method employed by the companies helped in proving their material handling.
Question 14: Have the cost reduction techniques employed by the company’s improved their
profit planning ability?
Table 4.15 Cost Reduction on Profit Planning
Option Response Percentage
Yes 28 93.3
No 2 6.7
Total 30 100 Field Survey 2015
Remarks: The obtained (283. 3%) for Yes, and (2 .7%) for No, This implies that the cost
reduction techniques provided by the company’s improved their profit planning ability.
Question 15: Is reliable cost reduction system effective tool for forecasting result?
Table 4.16Costs Reduction Systems is Effective Tool for Forecasting Results
Option Response Percentage
Yes 27 90.0
No 3 10.0
Total 30 100
62
Page 73
Field Survey 2015
Remark: In question 15, 27(90%) of the respondents agreed that a reliable costs reduction
systems is effective tool for forecasting results while 3(10%) respondents disagreed. This
implies that cost reduction systems employed by the companies are effective tool for
forecasting result
Question 16: In your opinion do you agree that cost reduction policy leads to rational
procurement and efficient allocation of resources?
Table 4.17: Cost Reduction in Allocation of Resources
Remark: From the data obtained, 17(56.7%) of the respondents agreed while 13(43.3%) of
the respondents disagreed. This implies that cost reduction policy leads to rational and
efficient allocation of resources in the companies under study.
Question 17: Do you agree that cost control process in existence has enhanced growth and
profitability?
Table 4.18 Effect of Cost Control on Growth and Profitability
Option Response Percentage
Yes 24 80.0
No 6 20.0
Total 30 100 Field Survey 2015
Remark: responding to question 17, 24(80.0%) of the respondents agreed while 6(20.0%) of
the respondents disagreed. This implies that cost control process in existence has enhanced
growth and profitability
63
Page 74
4.2 TEST OF HYPOTHESIS
The researcher formulated three hypotheses for the research study. These are tested below
using T-students distribution.
HYPOTHESIS 1
Ho: the cost control process in existence has not enhanced growth and profitability.
Hi: The cost control process in existence has enhanced growth and profitability.
Criterion: upper tail test
Accept the null hypothesis (HO) if the calculated value (t) is less than the critical value,
which indicates that effective cost control process in existence has not enhanced growth and
profitability. If otherwise, reject (Hi).
To test hypothesis one, the researcher used the responses in question two, three and six.
Table 4.19: Test of Hypothesis 1
Options Response Percentage
Question 2 28 2
Question 3 28 2
Question 6 27 3
Total 83 7 Field Survey 2015
The Application of T Student Distribution.
Options Response
Yes 83
64
Page 75
No 7
Total 90 Field Survey 2015
Calculation formula; .
t = (X-U) N
Where:
X = Number of successes (yes) = 83
N = Total Number =90
U = (NP) = (90 X assumed probability 90) = 81
= Standard deviation NP9
P = is the same as 90% of confidence
Q = is the same as 10% level of error
= 90 X 90 X 10 = 8.1 = 2.84
Therefore;
t = (83 – 81 90
2.84
t = 2 90 2.84
t = 18.97/2.84
65
Page 76
t = 6.6795
The significance level ( ) = 0.01 with 90 as degree of freedom, t at 90.% or 0.10 level of
significance is = 2910 calculated value (t) = 6.6795 critical value 1.2910 calculated value (t)
is greater than critical value.
Decision: Since the calculated value (t) is greater n the critical value, the null hypothesis (Ho)
is cc red and alternate hypothesis (Hi) is accepted, which states that cost control process in
existence has enhanced growth and profitability.
Conclusion: The researcher therefore concluded that cost control process in existence in the
under study has enhanced growth and profitability.
HYPOTHESIS 2
Ho: There is no co-ordination among different cost ms within the company for effective
implementation and realization of full benefit of cost control.
Hi: There is co-ordination among different cost centers and the company for effective
implementation and action of will benefit of cost control.
Criterion: Upper Tail Test
Accept the null hypothesis (Ho) if the calculated value (t) is less than the critical value, which
indicated that there co-ordination among the different cost centre with the companies for
effective implementation and realization of full benefit of cost control. If otherwise, reject
Ho, and accept alternative hypothesis (Hi).
To test this hypothesis the research researcher utilized the responses to question six, seven
and nine.
66
Page 77
Table 4.20 Test of Hypothesis 2
Options Response Percentage
Question 6 27 3
Question 7 29 1
Question 9 28 2
Total 84 6 Field Survey 2015
The application of T- student’s distribution
Options Response
Yes 84
No 6
Total 90 Field Survey 2015
NOTE:
The major statistical methods used for data analysis was T-students distribution analysis. A
simple percentage was also used m the preliminary stage of the analysis.
The T- students distribution is computed using the
formula
t = (X-U) N
Where:
T = Calculated value
N Number of respondents
X = Number of successes (yes)
67
Page 78
U = Number of respondents multiplied by the assumed probability (NP)
= Standard deviation NP9
P = Is the same as 90% of confidence
Q = is the same as 10% level of error.
The procedure involved preparation of the T- student distribution are as follow:
1. Calculate t
2. Refer to the appropriate table for the desired significance level (which is 90% in the
research study) and find the value of that t. this value will be positive for upper tail
test and value negative for lower tail test.
3. Decision rule:
For upper and one tail test (tve), accept
Ho, if calculated value (t) is less than the t interval otherwise reject Ho if calculated t is
greater than the t internal.
The T student’s distribution has a relative frequency curve that is bell shaped as shown in
figure 3.1;
68
Page 79
Lower tail test Upper tail test
-X +X
FIGURE 3.1 SKETCH OF T- STUDENTS DISTRIBUTION
Since the Calculation Formula is:
t = (x-u) N
Then:
X = Number of successes (yes) = 84
N = Total Number =90
U = (NP) = (90 X assumed probability 90) = 81
= Standard deviation NP9
P = Is the same as 90% of confidence
Q = is the same as 10% level of error
= 90 X 90 X 10
69
Page 80
= 8.1 = 2.84
Therefore;
t = (83 – 81 90
2.84
t = 3 90
2.84
t = 3 (9.486)/ 2.84
t = 10.02
The significance level (x) = 0.01 with 90 as degree of edom, tat 905 of 0.10 level of
significance is 1.2910
Calculated value (t) = 10.02
Critical value = 1.29 10
Decision: Since the calculated value (t) is greater than the critical value the null hypothesis
(Ho) is rejected and alternative hypothesis (Hi) is accepted with states that there is co-
ordination among different cost centers within the companies which helps for effective
implementation and realization of full benefit of cost control.
Conclusion: The researcher therefore concluded that co-ordination among different cost
centers within the companies help for effective implementation and realization of full benefit
cost control.
70
Page 81
HYPOTHESIS 3
Ho: cost reduction techniques adopted by companies are not significantly adequate for
achievement of company’s objective.
CRITERION: Upper Tail Test
Accept the null hypothesis (Ho) if the calculated value (t) is less than the critical value, which
shows that cost reduction technique adopted by companies are not s ignificantly adequate for
achievement of company’s objective. If otherwise reject Ho, and accept alternative
hypothesis (Hi).
To test this hypothesis the researcher utilized the responses in question sixteen, seventeen and
eighteen in the questionnaire.
Table 4.2.1: Test of Hypothesis 3
Yes No
Question 2 28 2
Question 3 28 2
Question 6 27 3
Total 83 7 Field Survey 2015
The application of T student distribution.
Options Response
Yes 83
No 7
Total 90
Field Survey 2015
Calculation Formula:
71
Page 82
t = (x-u) N
Where:
X = Number of successes (yes) = 83
N = Total Number =90
U = (NP) = (90 X assumed probability 90) = 81
= Standard deviation NP9
P = is the same as 90% of confidence
Q = is the same as 10% level of error
= 90 X 90 X 10
= 81000 = 2.84
Therefore;
t = (83 – 81 90
2.84
t = 2 90
2.84
t = 18.97/ 2.84
72
Page 83
t = 6.6795
The significance level (X) = 0.10 with 90 as degree of freedom, at 90% or 0.10 level of
significance is 1.2910
Calculated value (t) = 6.6795
Critical value 1.2910
Calculated value (t) is greater than the critical value (6.6795
1.2910)
4.3 DISCUSSION OF THE FINDINGS
Since the calculated value (t) is greater than the critical value, the null hypothesis (Ho) is
rejected and the alternative (Hi) is accepted which states that cost reduction tec hniques
adopted by the company are significantly adequate for achievement of the company’s
objective.
ENGLISH
The researcher therefore concludes that cost reduction techniques adopted by the company
are significantly adequate for the achievement of companies’ objective.
73
Page 84
REFERENCES
• Argyris;. C. (1975) Human problem with Budgets Canada
Harvard Business Review Vol.2 No.4
• Anyanwu, B.E (1995) The Concept of internal Auditing,
Owerri: SEB publishing Ltd.
• Batterseby Albert (1980) A Guide to stock control
London: Pitman Publishing Ltd.
• Black Chapin and miller (1975) Principles of Accounting
3rd Edition USA: CBS College publishing.
• Brigham and papas (1976) Management Economics
London: Dryden Press.
• Morrison A .E (1981) Storage and Control of Stock.
London: Pitman publishing Ltd.
• Obiagwu, F. A (1981) Budgetary for Effective Operation.
Owerri SEB Publishers Ltd.
• Oliver Stanley (1975) Accountants Guide to Management Technique USA: Gower
Press Hand ‘book
• Osisioma B.C (1996) Studies in Accountancy; Text and readings, Enugu New ages
publishers.
74
Page 85
• Pandely I.M. (1985) Financial Management; New Delli:
VikasPublishing House.
• Strawser, B.F (1990) Financial Accounting. USA Dame Publishers Inc.
• Van Horns, James C, (1983) Financial Management and Policy 6th edition.
EnglewoodCliff; prentice.
75
Page 86
CHAPTER FIVE
CONCLUSION AND RECOMENDATIONS
5.1 SUMMARY OF THE FINDINGS
Based on the analysis, the following findings were made:
1. Inadequate control and checks of materials in the store leads to theft and
unaccountability of items in the store.
2. There is no accurate or near accurate forecasting of inventory requirement. Raw
materials and supplies are ordered whenever the need to favour a contractor or vendor
comes to mind. At some points, materials not needed are ordered and stock piled
3. The internal control system of these firms weak. Fraud is almost legitimized and is
committed through pilferage of materials and supplies, creating false hills paying
creditors twice etc.
4. They do not attach importance to budgetary control, there is inadequacy problem
which resulted in management refused to invest in short term marketable securities,
purchase of raw materials for production, expansion of production line, and delay in
meeting short term obligations.
5. There is co—ordination among different cost centers within the company far effective
implementation and realization of full benefit of cost control.
6. Cost reduction techniques adopted by the companies are significantly adequate for the
achievement of the companies’ objective.
7. Cost control Process in existence in the two companies under study has enhanced
growth and profitability.
76
Page 87
5.2 CONCLUSION
The primary objective of any business organization is to maximize profit which will sustain
growth and existence. The profit objective is derived from the basic duty of the chief
executive to his share holders. He manages the company profitably while providing adequate
cash flows for corporate survival
These objectives can be achieved by effective cost control strategies, from the research study;
it has clearly shown that cost control if effectively carried out is a veritable tool for increasing
both the employee’s production and the organization’s profitability.
Thus one may conclude that effective cost control that the propensity to minimize the
deviations from standards in spite of the present economic recession.
5.3 RECOMMENDATIONS
For effective and efficient improvement on the cost contro l strategies existing in the company
under study, the following recommendations are made:
1. The existing cost control committee in the organizations should educate and enlighten
the workers on the importance and objective of the scheme. This will ensure its total
success in the companies.
2. The management should take necessary acting to ensure that variances are corrected.
This will enable then to know where the variances occur who was responsible for then
and why it occurred.
3. The companies should also make effort to improve its research and development unit
to adapt to local raw materials
77
Page 88
4. The factory workers and the junior staff should be included in the cost control
scheme. This is because the top management staff alone cannot achieve the
organization objective without the employees’ co-operating to make it a success for
effective and efficient cost control strategy to be achieved. The employee’s welfare
must be improved. The personal management should ensure that the workers’ wages
and salaries are commensurate with their services.
5. The cost accountant should be allowed to have a complete supervision and full
interaction with the factory workers during production.
6. Plant must be given adequate attention while installation of better and. technologically
improved paints is necessary, repair and maintenance of all machines must also be
done. This is because good assets management ensure increased productivity both in
terms of quality and quantity as this goes a long way to improving the profits of the
company, which is the major goal of cost control strategy.
7. Proper management and control should be exercised on stock or raw materials. This is
because any company that neglects the management of inventories only jeopardizes
its long run profitability and may fail ultimately. They should avoid material
pilferage, determination and careless handling of stocks.
8. Effective advertising should be carried out. The marketing department should put
more effort to widen their business scope. If the above recommendations are taken
into consideration, undoubtedly, the companies will achieve a substantial cost control
plan than what obtain presently.
78
1
Page 89
5.4 DIRECTION FOR FUTURE RESEARCH
The research findings are however not conclusion because the study was limited only to staff
of Nigeria brewery Enugu state. This cannot be said to be a true representation of what goes
on in all other organizations.
In this view, the researcher is suggesting that the study should no longer be limited to
geographical area like Enugu. It should be extended to three or more states as to ascertain if
the finding of the study is widespread.
79
Page 90
REFERENCES
• Argyris;. C. (1975) Human problem with Budgets Canada
Harvard Business Review Vol.2 No.4
• Anyanwu, B.E (1995) The Concept of internal Auditing,
Owerri: SEB publishing Ltd.
• Batters by Albert (1980) A Guide to stock control
London: Pitman Publishing Ltd.
• Black., Chapin. and miller (1975) Principles of Accounting
3rd Edition USA: CBS College publishing.
• Brigham and papas (1976) Management Economics
London: Dryden Press.
• Breech, E. F. L. (1980) The Principles and Practice of Management London:
Longman publishers.
• Earnest L.N (1976) Variance Accounting, London: Prentice —Hall Press inc
• Evans, D. F (2003) Flexible Budgetary Control and Standard Costs. Dallas Texas Mac
Donald and Evans Ltd.
• Garrison, R.H(1979) Management Accounting U.S.A:
Business publications Ltd.
• Gillespie .C. (2004). Standard and Direct Costing; New Zealand: Pitman Publishing
80
Page 91
Inc.
• Harper H.M. (1982)Cost and Management Accounting; London Mac Donald and
Evans Ltd.
• Kohler, Eric L (1975), A Dictionary for Accountants Englewood Cliff presence Hail
Publishers.
• Moore Franklin G. (2001) The Hand Book of Budgetary Control. U.K Graham Burn
publishers.
• Morrison A.E (1981) Storage and Control of Stock.
London: Pitman publishing Ltd.
• Obiagwu, F. A (1981) Budgetary for Effective Operation.
Owerri SEB publishers Ltd.
• Oliver Stanley (1975) Accountants Guide to Management Technique USA: Gower
Press Hand ‘book
• Osisioma B.C (1996) Studies in Accountancy; Text and readings, Enugu New ages
publishers.
• Pandely I.M. (1985) Financial Management; New Delli:Vikas publishing House
81
Page 92
QUESTIONNAIRE FOR A STUDY ON THE ROLE OF COST CONTROL
STRATEGY IN ACHIEVING CORPORATE SURVIVAL AND GROWTH:
Sir,
I am a post graduate student of National Open University of Nigeria doing post graduate
diploma in Business Administration (PGD) from the school of Management Sciences, Abuja
Study Centre.
In fulfillment of the requirement for the award of a Post Graduate Diploma in Business
Administration, I am currently conducting a study on the role of cost control strategy in
achieving corporate survival and growth using Nigeria Brewery, Enugu as a case study. This
questionnaire is therefore aimed at assisting me carryout the study successfully.
I wish to honestly assure you that the information that may be disclosed to me via the
questionnaire will be confidentially handled and used specially for academic purpose.
Thanks for your anticipated cooperation
Yours faithfully,
Gloria Clement
82
Page 93
PLEASE TICK (√ ) AND OR FILL WHERE APPROPRIATE
PART ONE
SECTION A:
1. Name of Respondent (optional)
2. Name of Organization / Institution
3. Age of Respondent: 18-25( ) 26-35 ( ) 36-45 ( ) 45 and above.
4. Sex (a) Male ( ) (b) Female ( )
5. Marital Status: Single ( ) Married ( ) divorcee ( ) widow ( )
6. Educational Qualification: NECO/SSCE ( ) OND/NCE ( ) B.Sc/BA ( )
MSC/MBA/MA ( ) PHD ( ) others specify..........
7. Rank / Grade Level (GL): (a) GL. 1-6 (b) GL. 7-10 (c) GL.12-14 (d) 15 and above (c)
others specify...................
8. position in the Organization:(a) Management Staff (b) Other Senior Staff (c) Control
Officer (d) Junior Staff (c) others specify.......................
83
Page 94
PART TWO
SECTION B:
1. Are you involved in the preparation of cost estimate in your organization? Yes ( )
No ( )
2. If your response above is yes, at what level are you involved?
(a) Unit level (b) Departmental level (c) Control Office (d) others
specify................
3. Do you know the role of the cost control in the organization?
(a) Yes (b) No.
4. Does the physical control storage of materials helps
in limiting materials theft?
a. Yes ( ) b. No ( )
5. Does the physical control over handling help in limiting materials wastages?
a. Yes ( ) b No ( )
6. Is the cost control strategy effective?
a. Yes ( ) b. No ( )
7. Has material management employed with company help to provide management
concerning materials?
a. Yes ( ) b. No ( )
8. Does the cost control scheme emphasize efficient utilization of materials?
84
Page 95
a. Yes ( ) b. No ( )
9. Does the organization have incentive scheme that will motivate workers?
a. Yes ( ) b. No ( )
10. If yes what motivational packages does the organization offer the workers?
a. Promotional ( )
b. Provision of fringe benefits ( )
c. All of the above ( )
11. Are the head of departments having cordial relationship?
a. Yes ( ) b. No ( )
12. Do head of department consult other heads in taking decision?
a. Yes ( ) b. No ( )
13. Do the workers of other department help other workers in carrying out their work?
a. Yes b. No ( )
14. Do these affect the co-ordination among different cost centers (quarreling, gossiping
and dominance)?
a. Yes ( ) b. No ( )
15. Are the heads of department involved in budget preparatory?
a. Yes ( ) b. No ( )
85
Page 96
16. Are there effective supervisions and implementation of budget by head of cost
carters?
a. Yes () b. No ( )
17. Have identification and elimination of unnecessary cost by value analysis contributed
immensely in. realizing the corporate objective?
a. Yes () b. No ( )
18. Has the cost reduction technique employed by the company help to improve material
handling methods?
a. Yes ( ) b. No ( )
19. Have the cost reduction techniques employed by the company improved the
company’s profit planning ability?
a. Yes ( ) b. No ( )
20. Is cost reduction system an effective tool for forecasting result?
a. Yes ( ) b. No ( )
21. In your opinion do you believe that cost reduction policy result to rational
procurement and efficient allocation of resources?
a. Yes ( ) b. No ( )
22. Do you agree that cost control existence has enhanced growth and profitability?
a. Yes ( ) b. No ( )
86