HSE Health & Safety Executive Reaction Inhibition in the Control of Exothermic Runaway Prepared by Chilworth Technology Ltd and HSL for the Health and Safety Executive 2003 RESEARCH REPORT 145
Transcript
HSE Health & Safety
Executive
Reaction Inhibition in the Control of Exothermic Runaway
Prepared by Chilworth Technology Ltd and HSLfor the Health and Safety Executive 2003
RESEARCH REPORT 145
HSE Health & Safety
Executive
Reaction Inhibition in the Control of Exothermic Runaway
K V Middle BSc CEng & R Bussey MSc Chilworth Technology Ltd
Beta House Chilworth Science Park
Southampton SO16 7NS UK
L Cusco PhD CEng, D Kerr & T J Snee PhD HSL Process Safety Section
Harpur Hill Buxton
Derbyshire SK17 9JN
Under the sponsorship of the UK Health and Safety Executive (HSE), Chilworth Technology Ltd and the Health and Safety Laboratories (HSL), Buxton, have undertaken a research programme into the use of chemical inhibition techniques as a Basis of Safety for the control of exothermic runaway reaction hazards.
The principal element of the research programme has been the design and running of a series of pilot scale trials at HSL into the inhibition of an uncontrolled styrene monomer polymerisation with associated laboratory and analytical work to plan the tests safely. The research has drawn upon laboratory work conducted by Chilworth Technology and mixing research sponsored by Chilworth. This report summarises the work conducted during the project, together with significant background information and then puts the results into an industrial context.
This work has drawn together existing literature and demonstrated the effectiveness of reaction inhibition at a pilot plant scale. A greater understanding of the prospects for inhibition as a Basis of Safety, and the factors to be considered during its utilisation, has been achieved.
This report and the work it describes were funded by the Health and Safety Executive (HSE). Its contents, including any opinions and/or conclusions expressed, are those of the authors alone and do not necessarily reflect HSE policy.
ISBN 0 7176 2730 6All rights reserved. No part of this publication may bereproduced, stored in a retrieval system, or transmitted inany form or by any means (electronic, mechanical,photocopying, recording or otherwise) without the priorwritten permission of the copyright owner.
Applications for reproduction should be made in writing to:Licensing Division, Her Majesty's Stationery Office, St Clements House, 2-16 Colegate, Norwich NR3 1BQ or by e-mail to [email protected]
2 INTRODUCTION............................................................................................. 22.1 Potential for Runaway Reaction ...................................................................... 22.2 Safety Based on Process Control Plus Active Quenching (Reaction Inhibition)4
2.3 The Use of Polymerisation Inhibitors............................................................... 42.4 Objectives of the Project ................................................................................. 52.5 Strategy .......................................................................................................... 5
3 EMERGENCY INJECTION AS A METHOD OF REACTION CONTROL ........ 73.1 Choice of Chemical Inhibition Agent................................................................ 73.2 Design of a High Reliability Control System for Injection ................................. 93.3 Mixing of the Inhibition Agent into the Reacting Medium ............................... 103.4 Present Knowledge and Areas of Uncertainty ............................................... 11
4 RESEARCH UNDERTAKEN DURING THE PRESENT PROJECT .............. 124.1 Inhibition System Under Investigation ........................................................... 124.2 Laboratory Investigations .............................................................................. 124.2.1 Characterisation of the Normal Reaction Using Heat Flow Calorimetry ...... 124.2.2 Characterisation of the Runaway Reaction Using Adiabatic Calorimetry .... 154.2.3 Inhibition Studies ........................................................................................ 184.3 Analysis of Kinetics ....................................................................................... 204.4 Laboratory Injection and Mixing Trials........................................................... 244.5 Mathematical Modelling of Mixing Trials........................................................ 254.6 Pilot Scale Facility at Buxton ......................................................................... 274.7 Specific Modifications to the Pilot Plant Facility for These Tests ................... 304.8 Emergency Pressure Relief of the Reactor ................................................... 31
5 HSL BUXTON RESEARCH TRIALS ............................................................ 325.1 Scale-Up Procedure used for the Design of the Buxton Experimental Trials . 325.2 Laboratory Trials ........................................................................................... 345.3 Pilot Plant Trials ............................................................................................ 375.4 Results from 210 litre Trials .......................................................................... 395.4.1 Test Programme......................................................................................... 395.4.2 Discussion of Raw Data ............................................................................. 425.4.3 Pre Injection Runaway................................................................................ 485.4.4 Application of Kinetics ................................................................................ 495.4.5 Heat Transfer Analysis ............................................................................... 505.4.6 Analysis of Mixing....................................................................................... 565.4.6.1 Pumping Capacities ................................................................................ 565.4.6.2 Mixing Time ............................................................................................ 575.4.7 Influence of Jet Mixing................................................................................ 585.5 Assessment of Trial Results.......................................................................... 605.6 Comparison Between Mathematical Modelling Simulations and Runaway
6 GENERAL CONCLUSIONS FROM PILOT SCALE TRIALS ........................ 646.1 Demonstration of Effectiveness of Technique ............................................... 646.2 Effect of Parameters Investigated ................................................................. 646.3 Ability to Predict Injection and Reaction Behaviour During Scale-up ............. 646.4 Areas of Continuing Uncertainty and Need for Further Work......................... 65
7 IMPLICATIONS FOR INDUSTRIAL APPLICATIONS .................................. 66
8 CONCLUSIONS............................................................................................ 688.1 Results from Programme .............................................................................. 688.2 Need for Further Work .................................................................................. 68
NOMENCLATURE
REFERENCES
Appendix A – Phi Tec Adiabatic Calorimetry Data
Appendix B – Laboratory Reactor Studies
Appendix C – Pilot Reactor Studies
Appendix D – Laboratory Mixing Trials – Figures
VISCOSITY ANNEX – Development and Testing of an In-situ Viscosity
Measuring System for the Adiabatic Dewar Calorimeter
iv
1 EXECUTIVE SUMMARY
Under the sponsorship of the UK Health and Safety Executive (HSE), Chilworth Technology
Ltd and the Health and Safety Laboratories (HSL), Buxton, have undertaken a research
programme into the use of chemical inhibition techniques as a Basis of Safety for the control
of exothermic runaway reaction hazards.
The principal element of the research programme has been the design and running of a series
of pilot scale trials at HSL into the inhibition of an uncontrolled styrene monomer
polymerisation with associated laboratory and analytical work to plan the tests safely. The
research has drawn upon laboratory work conducted by Chilworth Technology and mixing
research sponsored by Chilworth. This report summarises the work conducted during the
project, together with significant background information and then puts the results into an
industrial context.
This work has drawn together existing literature and demonstrated the effectiveness of
reaction inhibition at a pilot plant scale. A greater understanding of the prospects for
inhibition as a Basis of Safety, and the factors to be considered during its utilisation, has been
achieved.
Pilot scale (210 l) experiments on the uncontrolled polymerisation of styrene have
demonstrated the effectiveness of the inhibitor injection at two different agitation speeds and
under conditions immediately following agitation failure. Modelling of the experiments using
a network-of-zones approach has shown some inadequacies with the reproduction of the pilot
scale data, notably in the inability to simulate the jet mixing effects that dominate in small
scale plant with the conditions employed. The present modelling results do, however, under-
predict the mixing efficiency, thereby leading to a more conservative design for the cases
studied. Information on the selection of conditions for the design of a reaction inhibition
system is also given.
In an extension to the original project, funded by sponsorship from ISPESL of Italy, the
measurement of advancing viscosity in a laboratory calorimeter has been investigated. A
modified Dewar calorimeter has been built incorporating a vibrating pin viscometer. This
apparatus has been used to investigate the runaway reaction and viscosity behaviour of
styrene containing various initial concentrations of polystyrene for both uninhibited and
inhibited cases under different injection conditions. These trials have demonstrated the
effectiveness of the viscosity measurement apparatus and they have illustrated the effect of
viscosity and mixing conditions on the inhibition performance. However, a significant
deterioration in the thermal performance of the calorimeter was found with the prototype
employed, in comparison with a standard unit. Further work is recommended for
improvements to the apparatus and for computer CFD modelling of the mixing patterns of
small scale, pilot scale and industrial scale reactors.
1
2 INTRODUCTION
The background and context of this research are described in this chapter.
2.1 POTENTIAL FOR RUNAWAY REACTION
Many chemical reactions within the process industries are exothermic in nature. Under normal
operating conditions the release of this heat from the reactor is controlled by the use of
internal cooling coils and/or jackets. If the rate of heat generation exceeds the rate of heat
removal a self-sustaining uncontrolled runaway reaction may occur. An analysis of such 1incidents was conducted by Barton and Nolan in 1989. The paper covered 189 incidents that
occurred in the UK chemical industry between 1962 and 1987. Figure 2.1 shows the
distribution of the incidents reported.
1
2
4
4
5
8
8
10
13
15
64
0
A
A
10 20 30 40 50 60 70
Polymerisation (including condensation)
Nitration
Sulphonation
Hydrolysis
Salt formation
Halogenation (Chlorination & Bromination)
lkylation - using Friedel Crafts synthesis
mination
Diazotisation
Oxidation
Esterification
Figure 2.1 Number of incidents per specified chemical process
It can be seen that the potential for loss of control and hence runaway reaction is high, with
polymerisation accounting for almost 50% of the incidents studied.
Reactors used for exothermic processes are usually equipped such that either:
x The conditions that permit a runaway reaction are minimised to an acceptably low level
(prevention) or
x The conditions that permit a runaway reaction are minimised but not to a sufficient level
of acceptability. In this case, other measures are taken to protect the reactor against the
consequences of a runaway reaction (protection).
2
Although emergency relief venting is the most commonly employed technique for reactor
protection, there are occasions where the calculated vent size is unrealistically large. There
are other methods of reactor protection, including that of active quenching (reaction
inhibition), which is not commonly employed but has the potential to overcome some of the
inherent disadvantages of emergency relief venting. This approach may be aimed at batch,
semi-batch and continuous manufacturing processes and is also applicable to the storage of
self-reactive substances.
Processes in which heat is absorbed (endothermic processes) are generally easier to control
than processes which generate heat (exothermic processes). This is due to the fact that, as the
exothermic reaction causes an increase in temperature, the rate of reaction is also increased.
Most mitigation and control methods act to remove the heat that is being, or has been,
generated. Inhibition differs in that it interferes with the chemistry itself retarding the
mechanism that generates the heat.
The hazard posed by chemical reactions is associated with the generation of pressure in a
sealed, or inadequately vented, vessel. Pressure can be developed by:
x The exothermic reaction increases the mass temperature to above the atmospheric boiling
point and gives rise to vapour pressure effects.
x Gas generation associated with the desired process can cause pressurisation.
x The desired exothermic reaction increases the temperature sufficiently to initiate
secondary (undesired) reactions which generate heat and/or permanent gas or vapour
pressure effects.
The outcome of an exothermic runaway reaction is often a loss of containment of the process
materials. This can lead to a number of hazardous situations:
x If the process materials are flammable, this can lead to fires and explosions.
x Plant fragments may form missiles, posing a danger to personnel
x If the process materials are toxic, this can pose a hazard to plant (and off-site
neighbouring) personnel.
x If the process materials are environmentally damaging, this can pose a widespread
environmental hazard (in the case of waterways, this may not be limited to the area
immediately surrounding the plant).
There are several other effects on companies that suffer such occurrences. These include loss
of productivity (loss of market share), negative public perception of the company, legal costs
(if action is brought by the Health and Safety Executive (HSE)), environmental clean-up costs
and costs of rebuilding the damaged plant. Any one of the above consequences would be
reason enough to investigate methods of mitigation. Little work has been reported on the use
of reaction inhibition as a technique for mitigating the effects of a runaway reaction, which
has prompted the current research.
3
2.2 SAFETY BASED ON PROCESS CONTROL PLUS ACTIVE QUENCHING (REACTION INHIBITION)
A number of techniques are available to ensure safety in the event of runaway reactions. The
use of small quantities of active quenching agents that are capable of halting a runaway
reaction is one such technique. The major acknowledged limitation of inhibition systems is
that for some processes, inhibiting species may not exist (e.g. for decomposition reactions).
However, the cases where their use could be envisaged are :
x A catalyst is present to accelerate a chemical reaction.
x The reaction is highly dependent on pH.
x One of the reagents can be selectively reacted by another less hazardous route using an
alternative chemical.
x Highly reactive intermediate species are involved (such as free radicals).
Some industrial companies are understood to employ reaction inhibition systems as the basis
of safety. Many of these systems are employed for reactions involving free radical
mechanisms.
2.3 THE USE OF POLYMERISATION INHIBITORS
The present industrial use of polymerisation inhibitors may be summarised as:
x Storage of monomers (at one level, to prevent polymer formation, which would
contaminate the feed stream to a process, and at another level, to prevent uncontrolled
runaway reactions occurring during storage). This is probably the most well researched
application of inhibition theory. The operation involves dosing of materials and
monitoring of the concentration and there are no particular issues of delivery mechanism.
x Dosing to polymerisation reactors to modify the heat release characteristics during
normal reaction (to control “lively” reactions). This is a process control application
involving the dosing of material under controlled conditions.
x Dosing to polymerisation reactors to halt the reaction at a pre-determined conversion
(i.e. not 100%) in order to obtain particular properties in the polymer. Again, this is a
process control application involving the dosing of material under controlled conditions.
x As already discussed, in emergency systems to control reaction runaways in
polymerisation reactors. Some companies have their own proprietary data on which their
system was designed, whilst others have fitted systems that are not based on any reliable
data. This latter case is generally specified on “good engineering principles” alone. In
both cases, it is generally found that the inhibitor injection system is not the ultimate basis
of safety for the reactor, but that emergency relief venting is available to back-up the
injection system should it fail to be effective.
This project is designed to advance the knowledge-base in the last of these applications.
4
2.4 OBJECTIVES OF THE PROJECT
To test the operation on pilot scale of the inhibition of the runaway polymerisation of styrene
Preparation of a report containing a development in the understanding / guidance for the
design and application of reaction inhibition systems in industry.
2.5 STRATEGY
Laboratory scale tests were performed in an RC1 reaction calorimeter and Dewar vessel at
Chilworth with the aim of deriving kinetic information. The results of these experiments were
analysed to yield a complex empirical expression to describe the kinetics throughout the
runaway. Unfortunately, owing to insufficient data, the expression proved not to be
applicable across all of the proposed test conditions. To supplement this work, HSL also
carried out some adiabatic calorimetry to characterise the polymerisation kinetics, this data
being analysed to provide a pseudo-first order kinetic expression suitable for the initial stage
of the runaway. The results of these kinetic studies were used in a pilot plant simulation
program (Chem Model) to help in the design of the pilot scale experiments.
Pilot scale tests were planned and carried out for three sets of parameters chosen to allow a
reasonable test of the inhibition system. These planned pilot scale tests are outlined below.
Experiment 1
The conditions for this experiment were selected so that a runaway polymerisation reaction
was clearly established. The temperature at which the inhibitor is injected was chosen so that
the rate of temperature rise was reasonable, without being dangerously high, to give a fair
challenge to the inhibitor. A high gas pressure in the injection vessel and rapid agitation
allows a short injection time with efficient mixing.
Objectives
1.1) Establish that a pilot-scale runaway polymerisation could be initiated, detected and
then stopped by the injection of inhibitor.
1.2) Confirm predictions for the temperature-time profile predicted prior to the experiment
using the description of the reaction kinetics and heat transfer developed.
1.3) Provide data for comparison with network of zones modelling.
Experiment 2
The conditions for this experiment were the same as those for Experiment 1 except that the
speed of agitation was lower. The magnitude of the reduction in speed was selected during
water commissioning and after Experiment 1 by noting when there was a significant reduction
in turbulence, but without reaching the point where inhibition was likely to become
ineffective.
5
Objectives
2.1) Confirm predictions for the temperature-time profile predicted prior to the experiment
using the description of the reaction kinetics and heat transfer developed.
2.2) Established whether the reduction in agitation resulted in any significant changes in
the temperature distribution in the reactor either before or after inhibitor injection.
2.3) Provide data for comparison with network of zones modelling.
(Note: Experiments 1 and 2 required an additional (independent) temperature controller to
automatically open the bottom outlet valve on the reactor and discharge the contents to the
catch tank in the event that the inhibition system proved to be ineffective)
Experiment 3
The agitation speed was the same as Experiment 1 until the agitator was switched off just
below the injection temperature (giving residual agitation during injection). If the inhibitor
failed to stop the runaway, agitation would be resumed automatically when the temperature
exceeded the injection temperature by 5°C. The temperatures for switching off and resuming
agitation are provisional and were reviewed after experiments 1 and 2.
(Note: This experiment required substantial modifications to the wiring of the main control
panel for the pilot plant in order to restart the agitator automatically.)
Objectives
3.1) This experiment was used to establish what might occur if there was a delay of a few
seconds between the agitator stopping and the injection of the inhibitor to simulate an agitator
failure incident followed by emergency inhibition.
3.2) Large temperature gradients were expected to develop in the reactor during this
experiment. The temperature distribution was compared with the distribution predicted by
various analytical methods.
3.3) The experiment provided an indication as to whether residual agitation is required in
order for inhibition to stop the runaway.
6
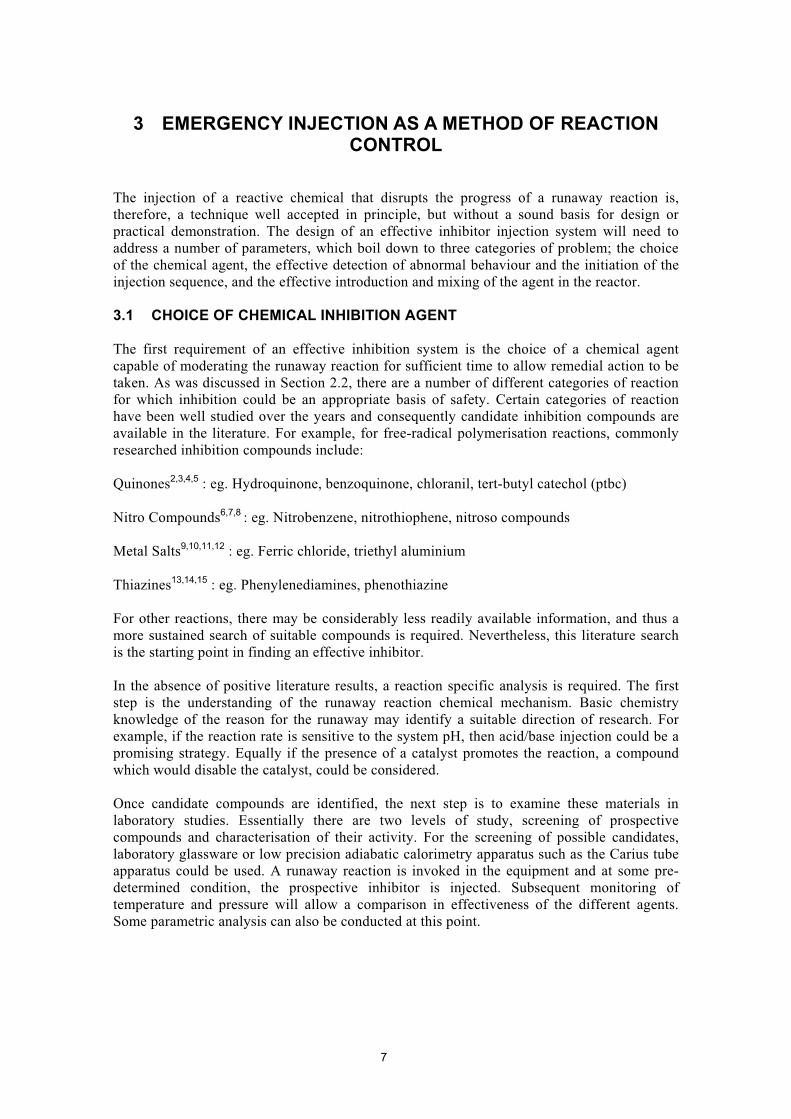
3 EMERGENCY INJECTION AS A METHOD OF REACTION CONTROL
The injection of a reactive chemical that disrupts the progress of a runaway reaction is,
therefore, a technique well accepted in principle, but without a sound basis for design or
practical demonstration. The design of an effective inhibitor injection system will need to
address a number of parameters, which boil down to three categories of problem; the choice
of the chemical agent, the effective detection of abnormal behaviour and the initiation of the
injection sequence, and the effective introduction and mixing of the agent in the reactor.
3.1 CHOICE OF CHEMICAL INHIBITION AGENT
The first requirement of an effective inhibition system is the choice of a chemical agent
capable of moderating the runaway reaction for sufficient time to allow remedial action to be
taken. As was discussed in Section 2.2, there are a number of different categories of reaction
for which inhibition could be an appropriate basis of safety. Certain categories of reaction
have been well studied over the years and consequently candidate inhibition compounds are
available in the literature. For example, for free-radical polymerisation reactions, commonly
Figure 4.6 Effect of Inhibitor Concentration upon Runaway Reaction Recovery
Clearly there is a correlation between the inhibitor concentration and recovery time for the
runaway. This would appear to agree with the suggested mechanism of inhibition, in that the
greater concentration of inhibitor is more readily available to mop up any styrene radicals that
may be generated, this relationship is not directly proportional (reaches saturation). There also
appears to be little effect upon the overall maximum temperature under adiabatic conditions
from the inhibitor concentration, suggesting that the inhibitor only affects the radicals already
formed, although it retains a reduced retarding effect. It was decided that for the pilot scale
trials an inhibitor concentration of 0.01 mol/mol would be used.
As the rate of styrene radical formation is a function of temperature, additional experiments
were conducted to assess the effect of temperature upon inhibitor effectiveness. Figure 4.7
shows a ptbc concentration of 0.01 mol/mol styrene being injected at three separate
temperatures. It can be seen that there is a strong correlation between temperature and
recovery time, with the recovery time becoming shorter at higher injection temperatures. It is
thought that the mode of action of the ptbc is to prematurely terminate growing polymer
chains, thereby yielding significantly shorter chains and causing the observed retardation.
18
50
0 1 2 3 4 5 6 7
j
100
150
200
250
300
350
400
Time (hours)
Tem
pera
ture
(°C
)
Blank T in ection = 110°C T injection = 130°C T injection = 150°C
Figure 4.7 Effect of Injection Temperature upon Recovery Time
19
4.3 ANALYSIS OF KINETICS
From the raw thermal data (obtained from the RC1 and adiabatic Dewar calorimeters) a
number of additional characteristics have been derived, the first of these is the kinetics. 18Townsend and Tou suggest that kinetic data may be derived from the temperature profile.
For an adiabatic exothermic reaction no heat generated is lost to the surroundings, therefore,
the heat is retained within the reaction mass and thus elevates the reaction mass temperature.
As the rate of heat generated is a function of the rate of reaction then the rate of temperature
rise may also be thought of as a function of the rate of reaction (this is not strictly true as both
the specific heat and composition vary during reaction). For simple systems this provides an
adequate description.
The following expression relates the temperature (T) to a pseudo first order reaction rate
constant (k0):
dT dt k 0 �T � T � max
Where:
T R � ae A k 0 � E
A plot of the ln k vs 1/T (K) will generate a linear relationship for a simple first order
reaction. The slope of the curve is equivalent to Ea/R and the intercept along the y axis is the
natural log of the pre-exponential factor.
This methodology was the basis of work done by Rowe16 during his investigations into
reaction inhibition.
Early work, upon thermally initiated free radical polymerisation, was carried out by Hui and
Hamielec19 . Their model, based upon isothermal data between 100°C and 200°C, was found
to correlate their data up to 230°C. For low conversions (the pilot scale work involves a
conversion of around 10%) the model may be simplified to:
dM/dt = 1.964 x 10⁵ e(-83472/(R.T)).[Monomer]3/2 .M
where, M is the mass of styrene monomer.
However, it was soon realised that chemically initiated styrene polymerisation could not be
considered a simple first order reaction and so further development was carried out. Figure
4.8 illustrates the temperature profile of an adiabatic runaway reaction for benzoyl peroxide
catalysed styrene polymerisation, overlaid by the rate of temperature rise. It can be seen that a
series of three distinct peaks are visible on the temperature rate curve. This suggests that three
separate reaction mechanisms are occurring at different stages during the runaway. This effect 20was also observed by Leung et al but to a lesser degree (probably due to lower sensitivity of
the calorimeter). Rowe and Leung both suggested that the first peak is due to chemically
initiated polymerisation. It was also suggested that the third peak was attributable to thermal
polymerisation. At this stage it is expected that the initiator, being an organic peroxide, would
have completely decomposed leaving only thermal effects dominating. Based upon work
conducted by Bevington21,22, Rowe went further to suggest that the second peak was due to
the formation of a second radical species.
20
Theoretically, the initiator decomposes to give two phenyl radicals :
PhCO-O-O-COPh Æ 2.Ph. + 2.CO2
It is conceivable that there exists an intermediate species, or stabilised free radical that only
initiates effectively at higher temperature conditions (such as a stabilised hydroperoxide). The
work conducted by Bevington indicated that the breakdown of benzoyl peroxide yields,
initially, benzoyloxy radicals (C6H5CO.O.). This radical then degrades, liberating carbon
dioxide to give the phenyl radical. Particularly in the presence of styrene, the decomposition
of the benzoyloxy radical is inhibited. The differing initiation potential of the phenyl and
benzoyloxy radicals may give rise to the two stage initiation kinetics observed.
70
120
170
220
270
320
370
30 32 34 36 38 40 42 44
0
1
Time (minutes)
Te
mp
era
ture
(°C
)
0.2
0.4
0.6
0.8
1.2
1.4
Ra
te o
f te
mp
era
ture
ris
e (
K/s
) Temperature dT/dt
Figure 4.8 Temperature and Rate of Temperature Rise for Benzoyl Peroxide Initiated
The specific safety options installed for these runaway polymerisation tests described above
(agitator restart and bottom dumping) are in addition to the standard emergency pressure relief
actions for the pilot reactor. These measures vent the reactor using an automatic pressure
relief valve if the reactor pressure reaches a set pressure. If this fails, then a bursting disc
vents the reactor via an independent route to the catch tank and provides the final basis of
safety.
31
5 HSL BUXTON RESEARCH TRIALS
5.1 SCALE-UP PROCEDURE USED FOR THE DESIGN OF THE BUXTON EXPERIMENTAL TRIALS
The following summarises the procedure adopted for the design of the pilot scale tests, using
adiabatic calorimetry and scale-up of heat transfer and mixing:
1. Adiabatic calorimetry
To determine the temperature and pressure vs time characteristics of the reaction.
2. Development of simplified kinetic expression to define the temperature and
concentration dependence of the rate of heat production
The adiabatic calorimetric data was used to develop a simplified kinetic expression to
describe the early stages of the polymerisation.
3. Prediction of runaway conditions in laboratory scale vessels (scale up of heat
transfer)
An analysis of the heat transfer characteristics of the laboratory-scale reactor was first
carried out in order to establish the experimental conditions for the pilot-scale tests. Heat
transfer characteristics were determined using electrical calibration, cooling curves and
standard procedures for calculating the overall heat transfer coefficient and the heat
transfer area.
The temperature profile of the runaway reaction on laboratory scale was predicted by
numerically solving the differential equations governing the rate of heat production from
the polymerisation, and the rate of heat transfer to the reactor jacket.
Predicted temperature-time variations, for a range conditions, were used to determine the
jacket temperature, which would:
x give a reproducible runaway reaction
x challenge the inhibition system
x give rates of temperature rise, before the injection of inhibitor, similar to the rates
that could occur due to upset conditions in an industrial-scale reactor.
4. Laboratory-scale experiments
Laboratory-scale experiments should preferably be carried out in vessels with geometric
similarity to the full-scale reactor. However, as no such similarity exists between the
laboratory and pilot scale vessels, allowance had to be made when analysing the results
from the trials. Tests were carried out over a range of conditions (agitation speeds,
injection temperatures, agitator failure etc.) to:
x investigate the efficiency of the inhibition agent
x establish whether long inhibition times (i.e. less efficient inhibition) occur due to
inefficient mixing or slow injection rates
x determine whether conditions can arise where inhibitor injection fails to stop the
runaway.
The results showed that the effectiveness of the inhibitor decreased as the injection
temperature was increased or the rate of agitation was reduced. This was in agreement
with earlier work.
32
5. Confirmation that the predictions for the laboratory-scale tests were reliable
The results of the laboratory-scale experiments were found to be quantitatively consistent
with the predicted temperature-time curves.
6. Scale-up of heat transfer characteristics from laboratory-scale to pilot-scale vessel,
and prediction of runaway conditions
A similar procedure was adopted to that outlined in step 3 above. The adiabatic data,
kinetic modelling and laboratory-scale results were used to select the jacket temperature
and injection temperature for the pilot-scale experiments.
The film heat transfer coefficient of the reactor was considered to be a key uncertainty.
Viscosity increases as the polymerisation reaction proceeds, and this could result in a
significant reduction in the heat transfer coefficient. However, by conducting the
inhibition tests at a low level of conversion, this aspect was minimised to a predictable
degree.
An assessment was made of the conditions which would indicate the onset of a runaway
reaction. In an industrial operation, desired operating conditions (e.g. temperature) and
their control ranges would be known; and scenarios whereby conditions could deviate
outside of this envelope would be determined. However, as no such normal operating
conditions exist in the case of the trials, the assessment was based upon the conditions
necessary to sustain reaction self-heating (to overcome heat losses) and the predicted
behaviour during runaway. Based on this analysis, the temperature, pressure and other
criteria for triggering of inhibitor injection in the pilot-scale reactor were determined.
The injection temperature of 120°C was chosen because, based on the laboratory scale
experiments, the system would be able to cope with the maximum expected rates of
temperature rise. This was a key parameter. Too low an injection temperature could lead
to spurious triggers, and too high a temperature could result in pressures and rates of
temperature rise too close to critical levels. Temperature was used as an injection
criterion rather than rate of temperature rise because of the difficulties associated with
smoothing out noise in the latter to avoid spurious triggers. Pressure was excluded from
consideration owing to the lack of sensitivity of this parameter inherent in operation
below the boiling point.
7. Scale-up of mixing/inhibition times, and determination of optimum location of
injection pipe.
The inhibitor must be injected into a region that optimises its dispersion throughout the
vessel. This position was chosen with respect to the characteristics of the mechanical
agitator, the liquid fill level and the practical constraints of the pilot scale reactor (i.e.
available branches). The inhibitor must enter below the surface of the liquid to favour
mixing. As the only available branch was on the top head of the pilot reactor, a dip pipe
was employed, although in this case the risk of pipe blockage was a consideration. As the
baffling in the glass lined reactor was poor, vortex effects had to be taken into account. A
balance was required between maximising agitation and minimising problems associated
with the vortex effect – it is noted that industrial scale reactors are generally less
susceptible to vortexing. Using water trials in the pilot-scale reactor, the vortex produced
by the agitator was analysed at different agitator speeds. An agitator speed of 103 rpm
was chosen as the maximum that could be used without introducing problems due to
vortex effects or excess bubbling.
33
Based on tracer dye experiments (see Section 4.4), the inhibitor was fed down a dip pipe,
directed towards the agitator beneath the liquid surface. The dip pipe dimensions and
motive gas pressure were chosen to produce the optimum dispersion rate.
The selection of the operating conditions for each of the tests involved a consideration ofthe following:x The first trial was based on water trials in the pilot-scale reactor, with a maximum
agitator speed of 103 rpm being adopted
x The agitator speed for the second pilot-scale trial was chosen based on classical
mixing theory. The water visualisation trials (see Appendix D) had confirmed the
validity of the flow number/mixing time approach for this special problem of
dispersing a small quantity of fluid into a large volume (see applicable equations in
Sections 4.4 and 5.3.6.1). The agitator speed was consequently chosen to give a
marked variation to experiment 1, but still within the timescale of the runaway
kinetics and turnover time
x For the third pilot-scale test (injection following agitator failure), the time delay was
again chosen using the earlier water trials, where the exponential nature of the swirl
decay was identified, this then being used with the reaction kinetics to choose
appropriate test conditions.
No experiments were conducted during the limited pilot scale trials to assess the effect of
jet mixing since its importance only became clear once the tests were completed.
8. Assessment of time available for inhibition to work on full-scale and to establish the
activation times temperatures and/or pressures for initiation of back up measures
such as quenching, dumping or pressure relief
Adiabatic temperature-time curves and the temperature variations predicted by numerical
integration were used to do this.
9. Pilot-scale experiments
With the completion of this procedure, a test protocol was ready to proceed with the pilot
scale trials.
5.2 LABORATORY TRIALS
Prior to designing the pilot scale experiments, qualitative tests were carried out in a 1.4 litre
laboratory reactor to investigate the feasibility of the pilot scale tests.
The laboratory reactor facility is designed for the study of runaway reactions on the laboratory
scale. Figure 5.1 is a schematic diagram of the laboratory reactor facility, showing the
location of all transducers, manual valves (MV) and automatic valves (AV). Table 5.1
provides a key to the labels on Figure 5.1. Reactants can be charged to the reactor via a feed
vessel which may be heated using a jacket. Heating baths are connected to both the reactor
jacket and the jacketed feed vessel. Polysiloxane is used as the external heat transfer fluid for
both vessels. The feed vessel is connected to a glass sight vessel (installed specifically for the
current test series). A tee-piece on the sight vessel allows flow of reactants from the feed
vessel to the reactor or from the reactor to a 7.1 litre catch tank via the pneumatically actuated
reactor vent valve (AV2). A syringe coupled with a double - acting air cylinder allows direct
injection of precise quantities of inhibitor solution into the reactor. The air cylinder can be
activated automatically by an alarm signal from the microlink system (which is linked to
reactor temperature sensor TC2) when a desired set temperature is exceeded. The reactor vent
34
valve (AV2) can be opened automatically by the pressure vent controller (which is linked to
reactor pressure transmitter P1) when a desired set pressure is exceeded. An additional
pneumatically actuated valve is fitted to the bottom outlet of the reactor. This allows
dumping of the reactor contents, if required. An orifice plate can be placed immediately
before the reactor vent valve to vary the venting restriction. The reactor can withstand an
internal pressure of 12 bar. The facility is fully instrumented with temperature and pressure
transducers, which are connected by intrinsically safe barriers to two data logging computer
systems. All electrical equipment connected to the laboratory reactor is either intrinsically
safe or flameproof and certain valves are pneumatically actuated so that the experiment can be
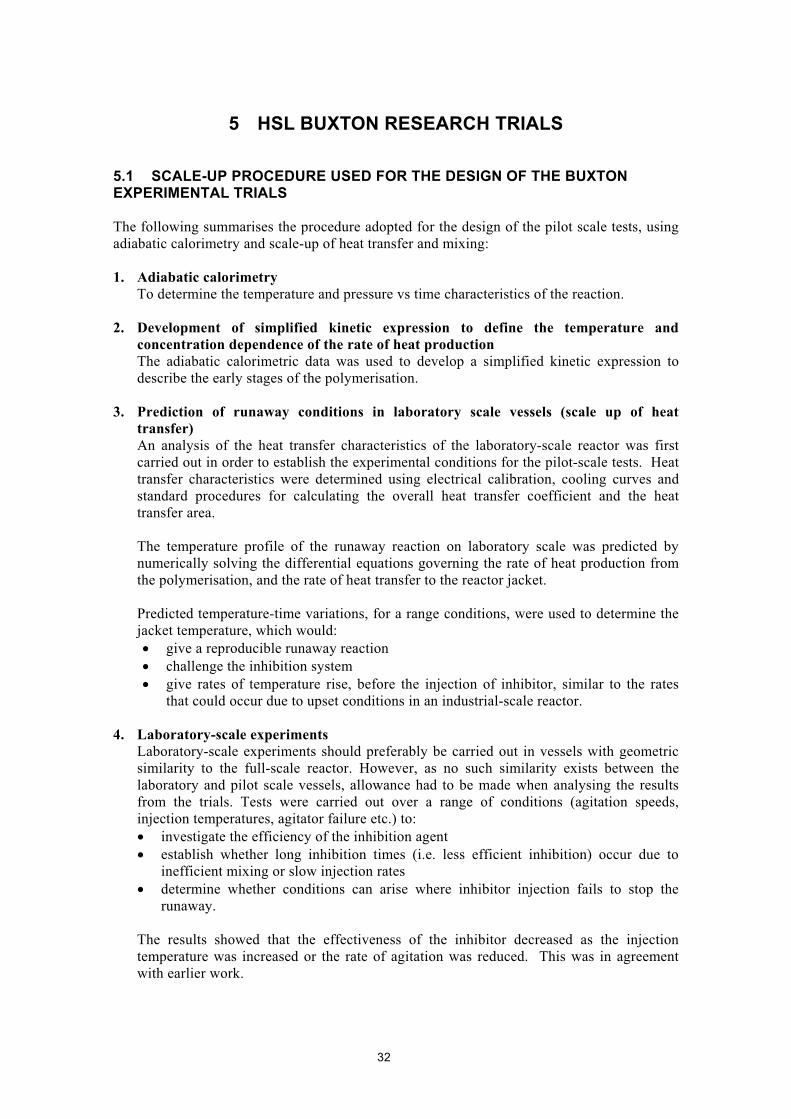
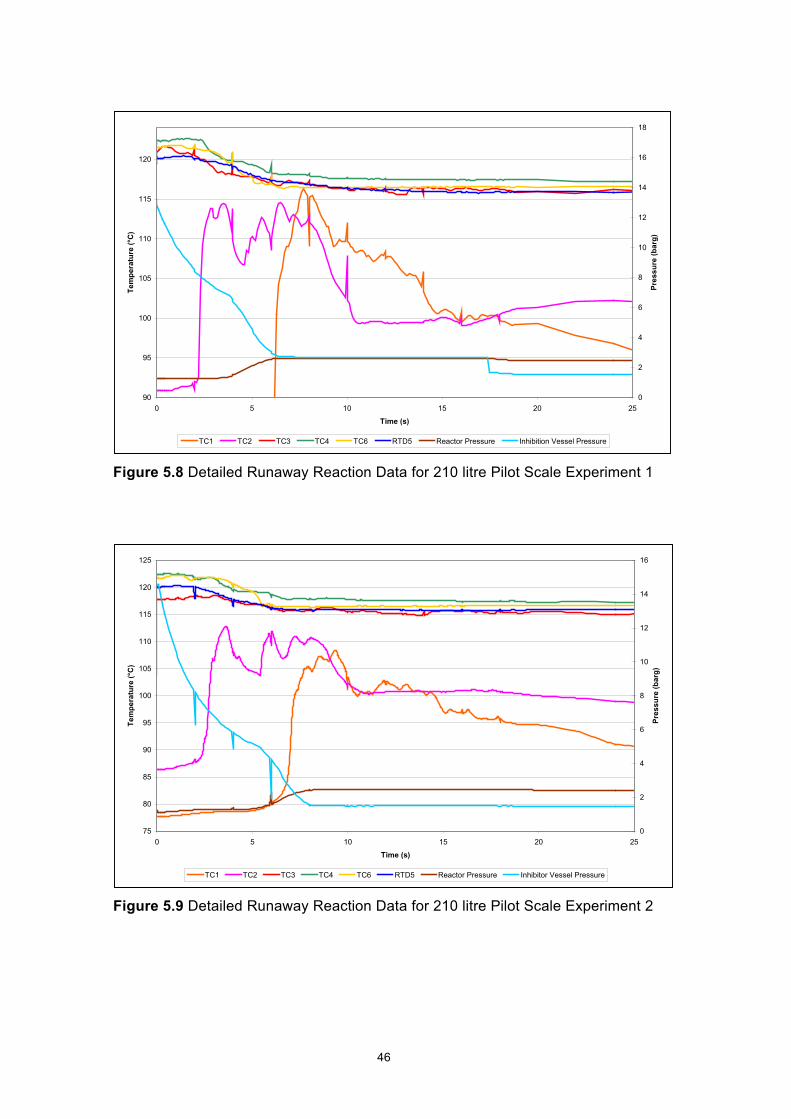
Figure 5.10 Detailed Runaway Reaction Data for 210 litre Pilot Scale Experiment 3
47
5.4.3 Pre Injection Runaway
As discussed in Section 5.4.1, all three pilot plant runaway trials were initiated at the same
point, the only significant variation was that of stirrer speed. Figure 5.11 illustrates the effect
of stirrer speed upon the runaway characteristics. It can be seen that once the runaway
reaction has been initiated the system is purely temperature dependent, as would be expected
for a homogeneous reaction system. Figure 5.11 also illustrates a high level of reproducibility
between each of the tests.
80
85
90
95
100
105
110
115
120
125
0 500 600100 200 300 400 700 800
Te
mp
era
ture
(°C
)
Time (s)
Experiment 1 Experiment 2 Experiment 3
Figure 5.11 Pre injection Runaway Reaction Temperature Profile (RTD 5 for
Experiment 1 & 2, TC6 for Experiment 3)
48
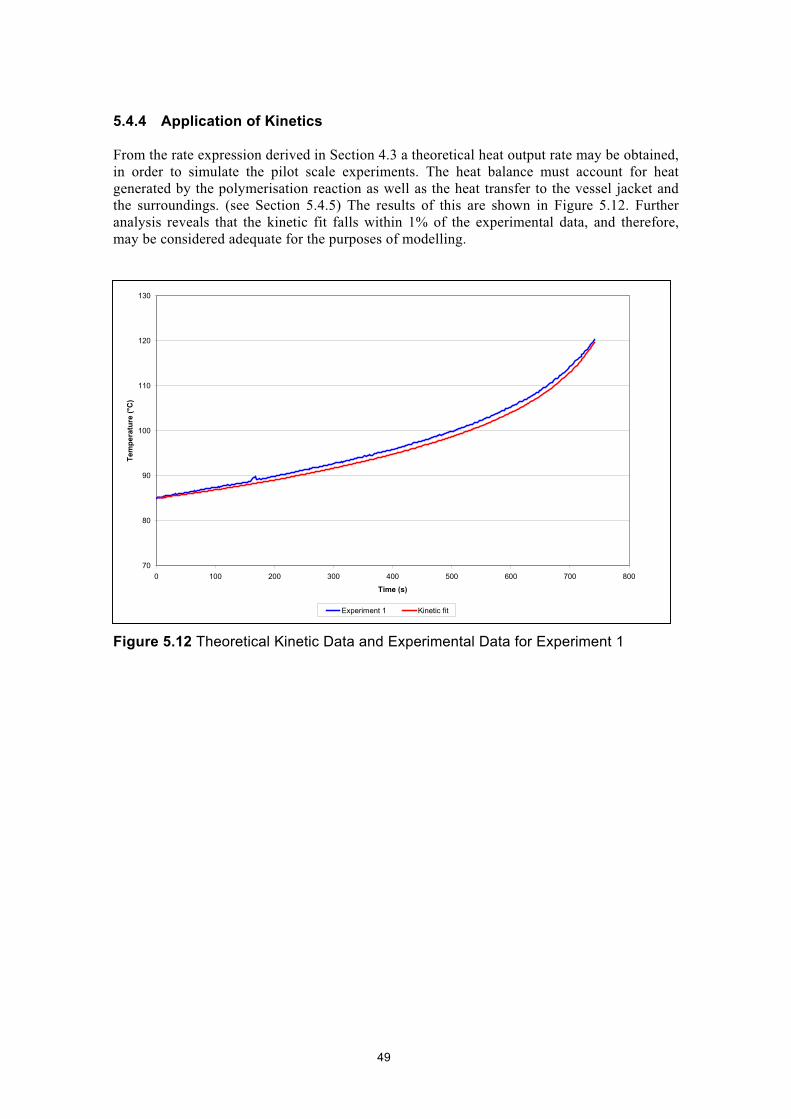
5.4.4 Application of Kinetics
From the rate expression derived in Section 4.3 a theoretical heat output rate may be obtained,
in order to simulate the pilot scale experiments. The heat balance must account for heat
generated by the polymerisation reaction as well as the heat transfer to the vessel jacket and
the surroundings. (see Section 5.4.5) The results of this are shown in Figure 5.12. Further
analysis reveals that the kinetic fit falls within 1% of the experimental data, and therefore,
may be considered adequate for the purposes of modelling.
70
80
90
0 800
100
110
120
130
100 200 300 400 500 600 700
Te
mp
era
ture
(°C
)
Time (s)
Experiment 1 Kinetic fit
Figure 5.12 Theoretical Kinetic Data and Experimental Data for Experiment 1
49
5.4.5 Heat Transfer Analysis
The pilot reactor has a jacket that may be operated with either water or steam as the heating
fluid. It has been found that for the response and control parameters attainable, in order to
attain reproducible temperature-time profiles during runaway, the most appropriate approach
is to hold the jacket temperature constant with hot water circulation and obtain a predictable
level of heat transfer from the contents to the jacket during a runaway. This isoperibolic
arrangement is a realistic representation of many industrial accident scenarios. Use of steam
allows temperatures above 100°C to be obtained, but the control here is poor; it was
consequently decided that hot water be used, thereby limiting the temperature to ca. 90°C.
Figure 5.13 shows the temperature profile after injection of the inhibitor. It is immediately
evident that experiment 3, without stirring, has a significantly reduced rate of temperature
drop compared to the two stirred runs, experiments 1 and 2. This trend follows what is
generally expected according to accepted heat transfer theory.
80
85
90
95
0
100
105
110
115
120
125
500 1000 1500 2000 2500 3000 3500 4000 4500 5000
Te
mp
era
ture
(°C
)
Time (s)
Experiment 1 Experiment 2 Experiment 3
Figure 5.13 Temperature Profile of All Three Runs Post Inhibitor Injection
Analysis of the cool down data using dimensionless numbers allows the extraction of
appropriate coefficients for further modelling. The use of empirical dimensionless group
correlations to design large scale plant based upon small scale experimental measurements is
well documented25. In particular the correlation for the inside film heat transfer coefficient for
agitated, jacketed vessels has been employed. Correlations for plant heat transfer take the
general form: bNu =K.(Re)a
.(Pr) .(P/Pw)c
From this equation, it can be shown that for a single reactor, the internal film heat transfer
coefficient is proportional to the stirrer speed to the power of “a”.
50
-1
Exact constants specific to the agitator employed (Pfaudler – retreating vertical blade turbine) 26were not available. For the purposes of analysis the coefficients used were
2 1K = 0.36, a = /3 b = /3 c = 0.21. This most closely matches the Pfaudler type of stirrer and
provides a conservative film heat transfer coefficient. For the conditions pertaining to
experiment 1, the inside film heat transfer coefficient has been calculated as 915 W.m-2.K .
The overall heat transfer coefficient (U) is defined as:
1 U
1 x 1 � � � ff
h O h o w i
Where the inside film heat transfer coefficient, hi, has already been derived for experiment 1.
The other terms in the denominator are the external film heat transfer coefficient (ho), the heat
transfer due to conduction across the reactor wall (x/O w), and the fouling factor (ff). If these
terms are considered constant across all experiments, they may be grouped together thus:
1 U
1 1 �
) hi
In order to determine, ) , it is necessary to determine the overall heat transfer coefficient, U.
This may be achieved graphically from the cool down curves. The rate of heat loss from the
reaction mass equates to the rate of heat transfer to the jacket, plus the heat loss to the head,
etc. The losses to the head will be minor in comparison to the jacket transfer and can be
assumed to be constant for the system. An energy balance across the jacket yields the
following approximate expression:
x dT Q m � C p � { U � A ' � T
dt
Rearranging:
m � C dT U
p � A ' � T dt
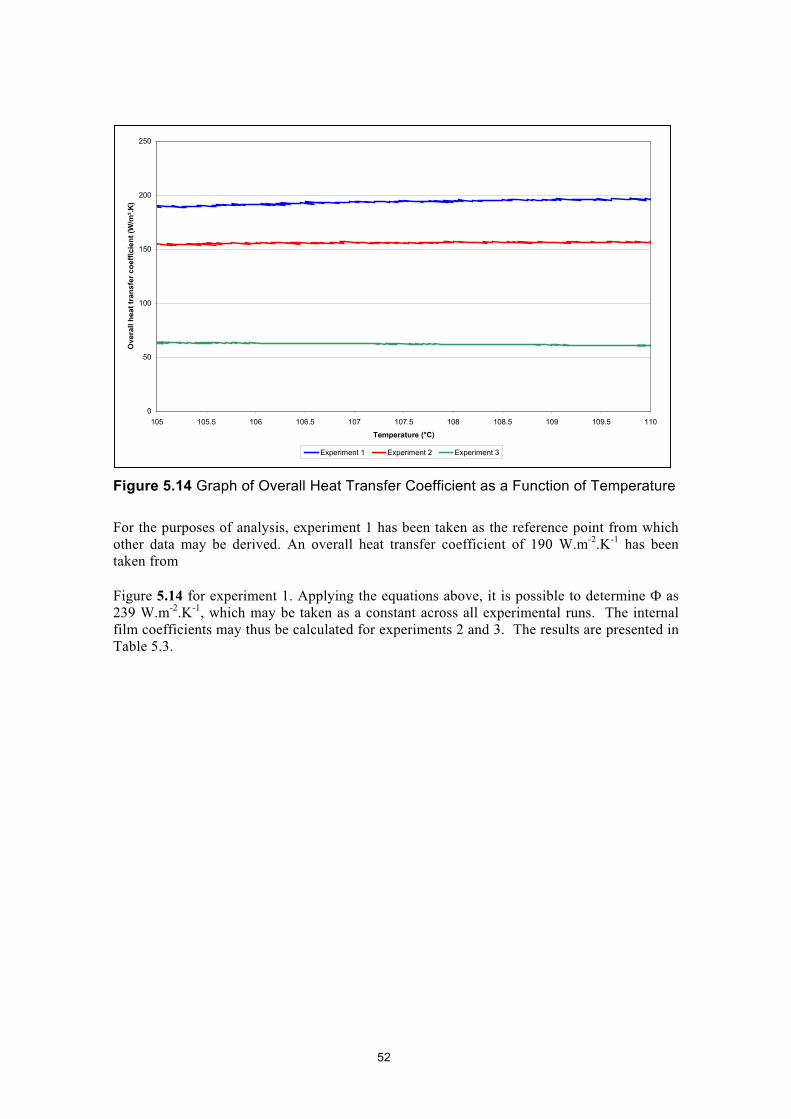
Values of the overall heat transfer coefficient have been derived across the whole cooldown
period and are presented in
Figure 5.14. Over the temperatures presented, the values are seen to be approximately
constant, although greater variation is observed across a wider range, being the result of the
non-jacket losses.
51
0
50
105 108
100
150
200
250
105.5 106 106.5 107 107.5 108.5 109 109.5 110
Temperature (°C)
Ov
era
ll h
ea
t tr
an
sfe
r c
oe
ffic
ien
t (W
/m².
K)
Experiment 1 Experiment 2 Experiment 3
Figure 5.14 Graph of Overall Heat Transfer Coefficient as a Function of Temperature
For the purposes of analysis, experiment 1 has been taken as the reference point from which -2 -1other data may be derived. An overall heat transfer coefficient of 190 W.m .K has been
taken from
Figure 5.14 for experiment 1. Applying the equations above, it is possible to determine ) as -1239 W.m-2.K , which may be taken as a constant across all experimental runs. The internal
film coefficients may thus be calculated for experiments 2 and 3. The results are presented in
Table 5.3.
52
Table 5.3 Table of Internal Film Heat Transfer Coefficients
Experiment U (W.m-2
.K-1
) ) (W.m -2
.K-1
) hi (W.m-2
.K-1
)
Experiment 1 190 239 915
Experiment 2 155 239 441
Experiment 3 60 239 80
Table 5.3 illustrates the dependence of heat transfer upon stirrer speed. The equation for
overall heat transfer using a Pfaudler style agitator indicated that the internal film coefficient
is proportional to the stirrer speed to the power of 0.67. Comparing experiments 1 and 2, the
results do not confirm this relationship, with the experimental temperature fall being less than
expected from the consideration of the stirrer speed alone (internal film coefficient of 441 -1 -1W.m-2.K , cf. calculated according to stirrer speed correlation alone 575 W.m-2.K ). The
reason for this anomaly is not clear. Such a comparison is not possible for experiment 3, since
the jacket heat transfer will proceed by a natural convection mechanism at the cessation of
agitation. It is also noted that the internal film heat transfer coefficient is not the limiting
resistance to heat transfer in both experiment 1 and experiment 2.
Using the coefficients of overall heat transfer to the jacket, one can attempt to add back the
heat loss and reconstruct the experiment as a pseudo-adiabatic test. This is shown in Figure
5.15. The objective is to determine the degree of inhibition. If the reconstruction generates a
flat temperature profile, this would suggest that the reaction has been fully halted. If the
reconstructed data shows a rise, residual reaction would be suggested. However, a residual
reaction with low level of heat production would not necessarily lead to a later runaway
during pilot tests as there is some heat transfer to the surrounding e.g. through jacket and this
could be sufficient to control the reactor contents temperature. This would be, of course, in
contrast to adiabatic conditions in some laboratory tests.
53
54
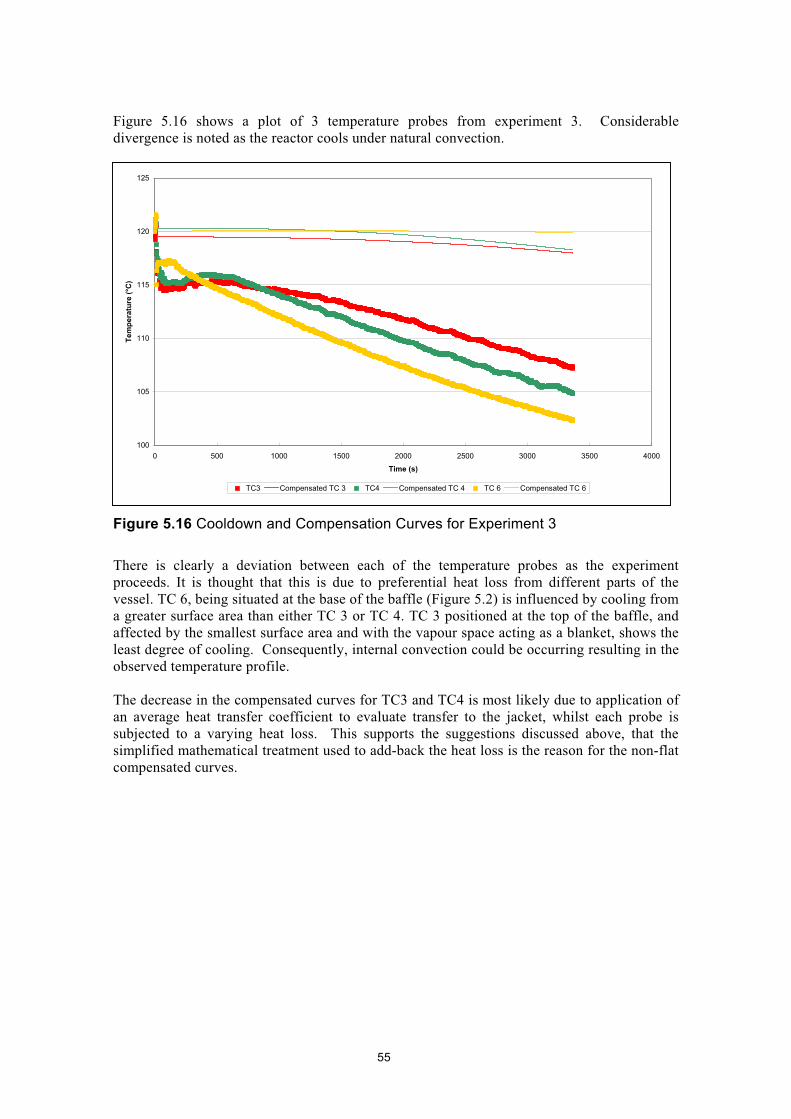
Figure 5.15 Cooldown and Compensated Temperature Curves for the Injection
Control Temperature Probe (RTD 5 for Experiment 1 and 2, TC 6 for Experiment 3)
Figure 5.15 does in fact show a very marginal rise in temperature for experiments 1 and 2. It
is not immediately clear whether this rise is due to continued reaction at a reduced rate, to the
heat input from continued agitation, or if the rise is due to the many approximations and
errors involved in the reconstruction process. In an assessment of potential errors, it should
be noted that the temperature compensated curves have been reconstructed using mean values
of heat transfer and specific heat.
It has already been stated that ptbc is a retarder rather than a reaction killer, however, for the
recovery, the rate of reaction is expected to be too low as to show any significant rise in
temperature (see Section 4.2.3). Therefore, the observed rise is probably due to the
mathematical technique used in reconstructing the data.
An analysis of mixing performance based upon computational techniques is discussed in
Section 5.6, however, one can also consider a traditional approach based upon dimensionless
numbers.
The fully turbulent condition for an agitated tank occurs at an impeller Reynolds
number, UND 2 / P , greater than 10000. The impeller Reynolds number is based upon the
impeller tip speed SND , where N is the rotational speed in revolution per unit time and D is
the impeller diameter. The type of fluid determines the viscosity term, P, in this dimensionless
number. Further, quantities are used for the analysis and scale-up of agitation and mixing and
are described here.
5.4.6.1 Pumping Capacities
The impeller pumping capacity, QP, can be defined as the volumetric flow rate of fluid which
leaves the turbine blades. In the other words, the impeller pumping capacity is the rate of flow
through the surface of the low aspect ratio cylinder, which forms the impeller envelope. For a
turbine, the pumping capacity in general may be represented by:
QP N u N u D3
Q
Then the flow number, NQ, can be expressed as:
QpNQ
ND3
There are a number of studies on the determination of the value of NQ. However, for thecurrent Pfaudler agitator, a value of 1 for NQ has been suggested.Thus, an impeller pumping capacity may be determined:
3Experiment 1 0.127 m .s-1
3 -1Experiment 2 0.0636 m .s
The pilot scale reactor liquid volume is calculated to be approximately 0.21 m³, therefore, an
overall turnover time of 1.65 seconds for experiment 1 and 3.3 seconds for experiment 2 is
expected.
56
5.4.6.2 Mixing Time
The mixing time is the time required to achieve a specified degree of approach to the final
uniform mixture of two miscible liquids. In the present case the use of temperature to judge
the degree of mixing has the consequence that a final uniform value must take into account
the heat losses to the jacket (i.e. decreasing datum). With all other mixing variables equal,
then a faster impeller speed will result in a shorter mixing time.
Figure 5.17 shows the normalised cool down curves for the temperature probes for