Page 1
Be-Software Draft Report 2.4 Marsden Point 25th November 2015 Prepared for Royal HaskoningDHV for Chancery Green on behalf of Refining New Zealand Limited Page 60
Run 071 Run 072
Run 073 Run 074
Page 2
Be-Software Draft Report 2.4 Marsden Point 25th November 2015 Prepared for Royal HaskoningDHV for Chancery Green on behalf of Refining New Zealand Limited Page 61
Run 075 Run 076
Run 077 Run 078
Page 3
Be-Software Draft Report 2.4 Marsden Point 25th November 2015 Prepared for Royal HaskoningDHV for Chancery Green on behalf of Refining New Zealand Limited Page 62
\
Run 079 Run 080
Run 081 Run 082
Page 4
Be-Software Draft Report 2.4 Marsden Point 25th November 2015 Prepared for Royal HaskoningDHV for Chancery Green on behalf of Refining New Zealand Limited Page 63
Run 083 Run 084
Run 085 Run 086
Page 5
Be-Software Draft Report 2.4 Marsden Point 25th November 2015 Prepared for Royal HaskoningDHV for Chancery Green on behalf of Refining New Zealand Limited Page 64
Run 087 Run 088
Run 089 Run 090
Page 6
Be-Software Draft Report 2.4 Marsden Point 25th November 2015 Prepared for Royal HaskoningDHV for Chancery Green on behalf of Refining New Zealand Limited Page 65
Run 091 Run 092
Run 093 Run 094
Page 7
Be-Software Draft Report 2.4 Marsden Point 25th November 2015 Prepared for Royal HaskoningDHV for Chancery Green on behalf of Refining New Zealand Limited Page 66
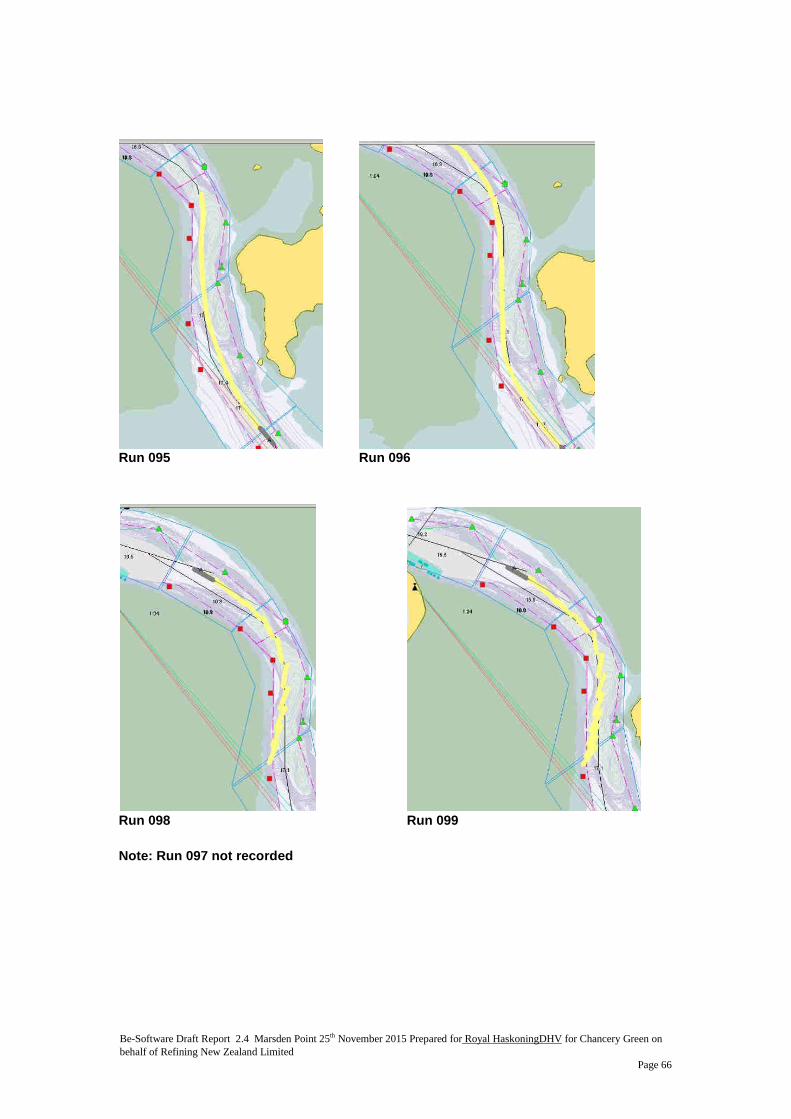
Run 095 Run 096
Run 098 Run 099
Note: Run 097 not recorded
Page 8
Be-Software Draft Report 2.4 Marsden Point 25th November 2015 Prepared for Royal HaskoningDHV for Chancery Green on behalf of Refining New Zealand Limited Page 67
Run 100 Run 101
Run 102 Run 103
Page 9
Be-Software Draft Report 2.4 Marsden Point 25th November 2015 Prepared for Royal HaskoningDHV for Chancery Green on behalf of Refining New Zealand Limited Page 68
Run 104 Run 105
Run 106 Run 107
Page 10
Be-Software Draft Report 2.4 Marsden Point 25th November 2015 Prepared for Royal HaskoningDHV for Chancery Green on behalf of Refining New Zealand Limited Page 69
Run 108 Run 109
Run 110 Run 111
Page 11
Be-Software Draft Report 2.4 Marsden Point 25th November 2015 Prepared for Royal HaskoningDHV for Chancery Green on behalf of Refining New Zealand Limited Page 70
Run 112 Run 113
Run 114 Run 115
Page 12
Be-Software Draft Report 2.4 Marsden Point 25th November 2015 Prepared for Royal HaskoningDHV for Chancery Green on behalf of Refining New Zealand Limited Page 71
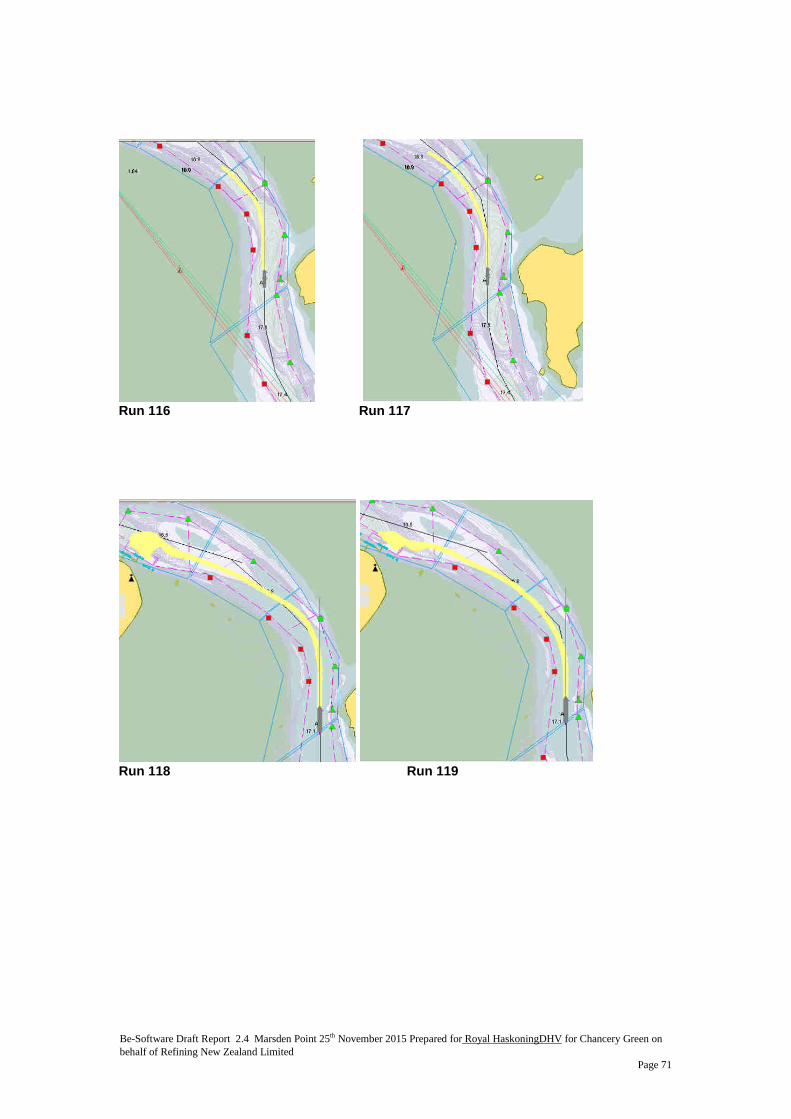
Run 116 Run 117
Run 118 Run 119
Page 13
Be-Software Draft Report 2.4 Marsden Point 25th November 2015 Prepared for Royal HaskoningDHV for Chancery Green on behalf of Refining New Zealand Limited Page 72
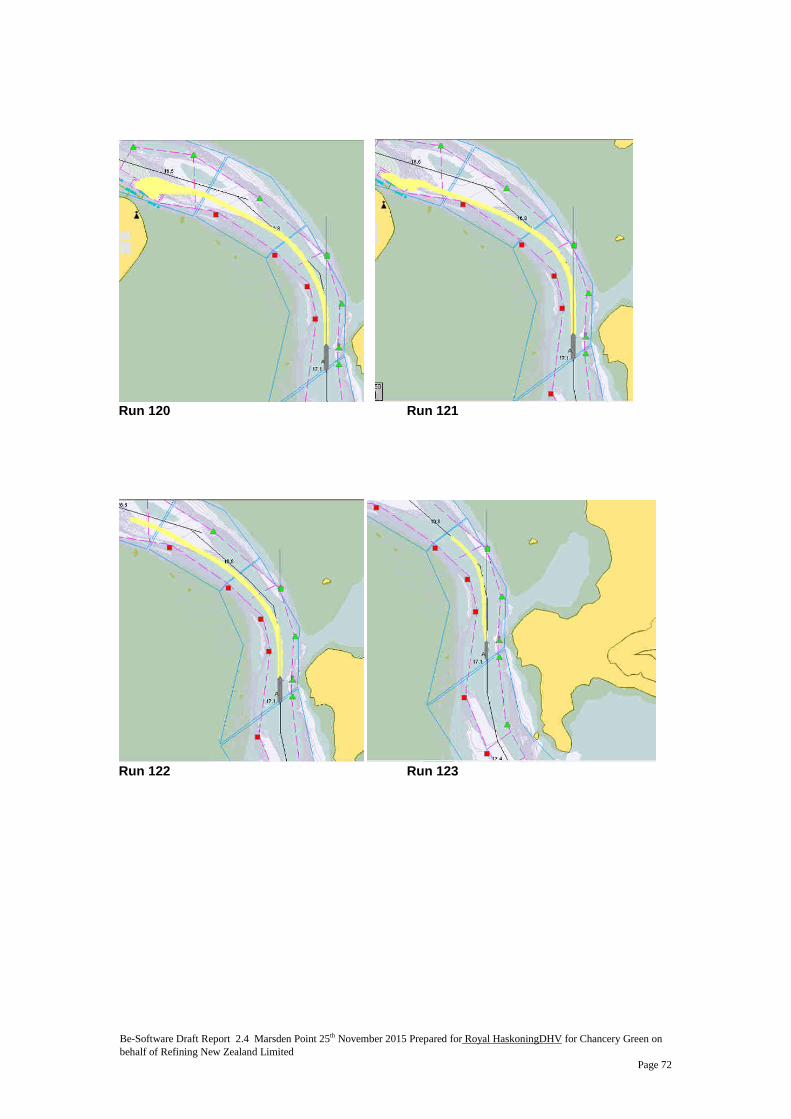
Run 120 Run 121
Run 122 Run 123
Page 14
Be-Software Draft Report 2.4 Marsden Point 25th November 2015 Prepared for Royal HaskoningDHV for Chancery Green on behalf of Refining New Zealand Limited Page 73
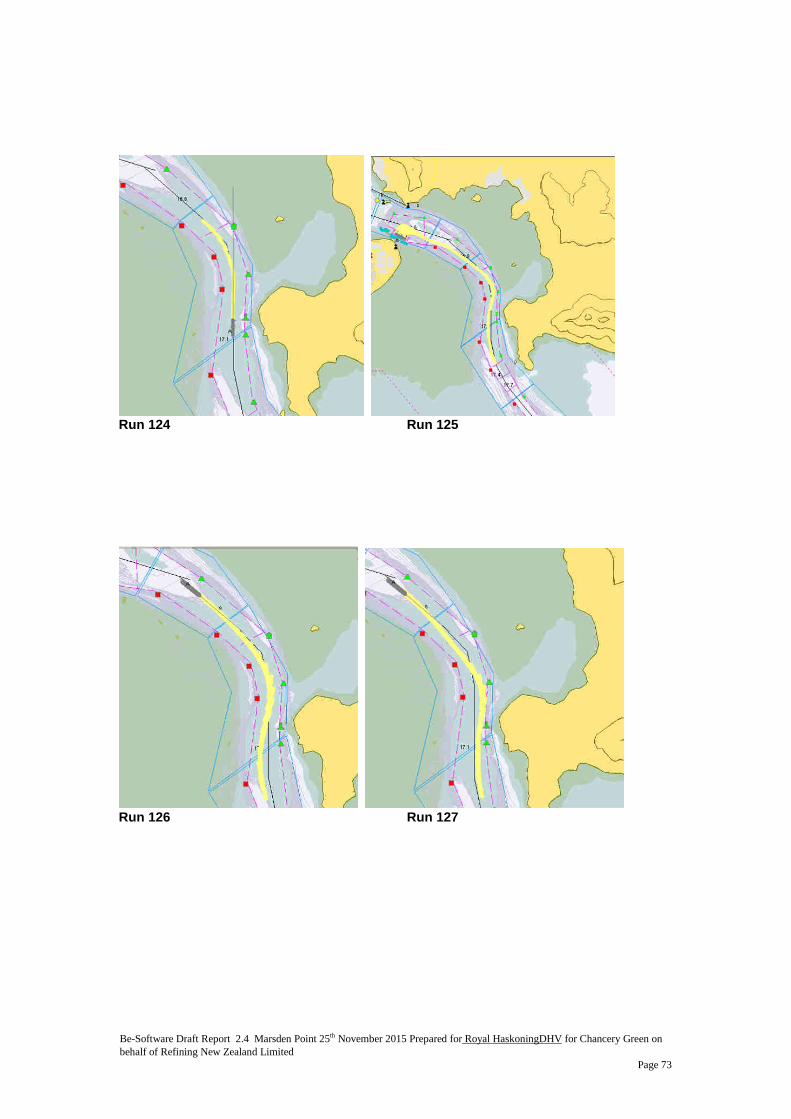
Run 124 Run 125
Run 126 Run 127
Page 15
Be-Software Draft Report 2.4 Marsden Point 25th November 2015 Prepared for Royal HaskoningDHV for Chancery Green on behalf of Refining New Zealand Limited Page 74
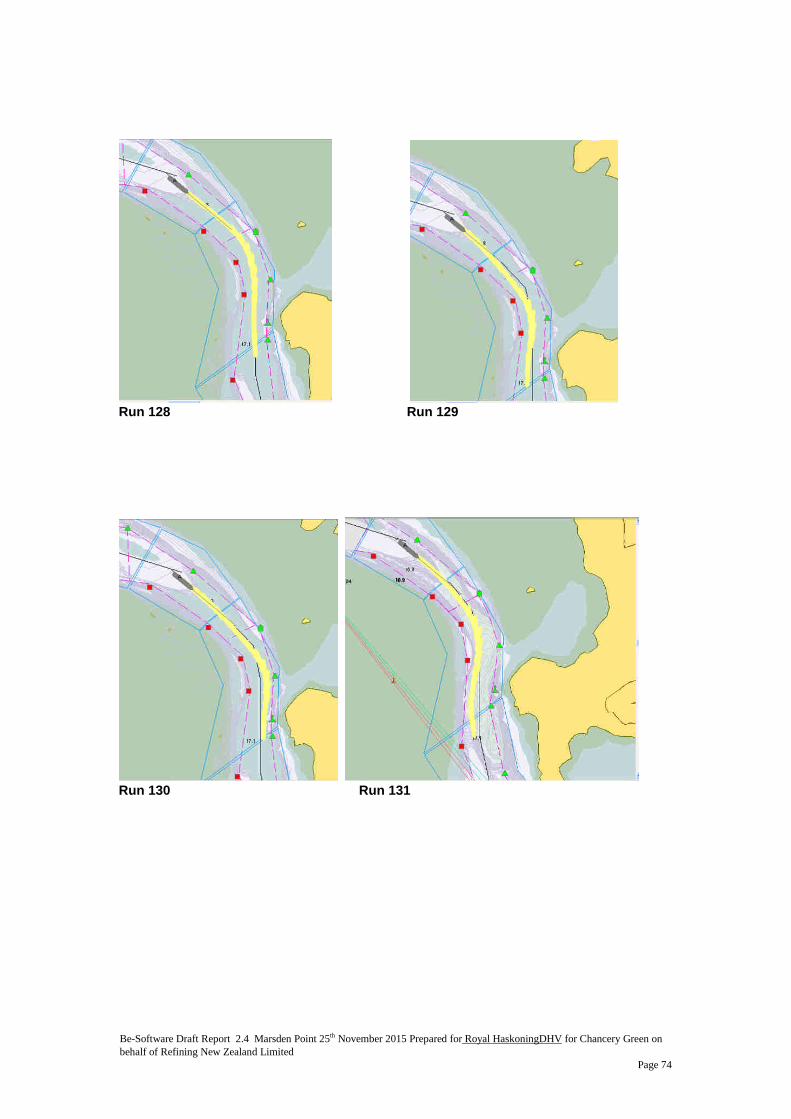
Run 128 Run 129
Run 130 Run 131
Page 16
Be-Software Draft Report 2.4 Marsden Point 25th November 2015 Prepared for Royal HaskoningDHV for Chancery Green on behalf of Refining New Zealand Limited Page 75
Run 132 Run 133
Run 134 Run 135
Page 17
Be-Software Draft Report 2.4 Marsden Point 25th November 2015 Prepared for Royal HaskoningDHV for Chancery Green on behalf of Refining New Zealand Limited Page 76
Run 136 Run 137
Run 138 Run 139
Page 18
Be-Software Draft Report 2.4 Marsden Point 25th November 2015 Prepared for Royal HaskoningDHV for Chancery Green on behalf of Refining New Zealand Limited Page 77
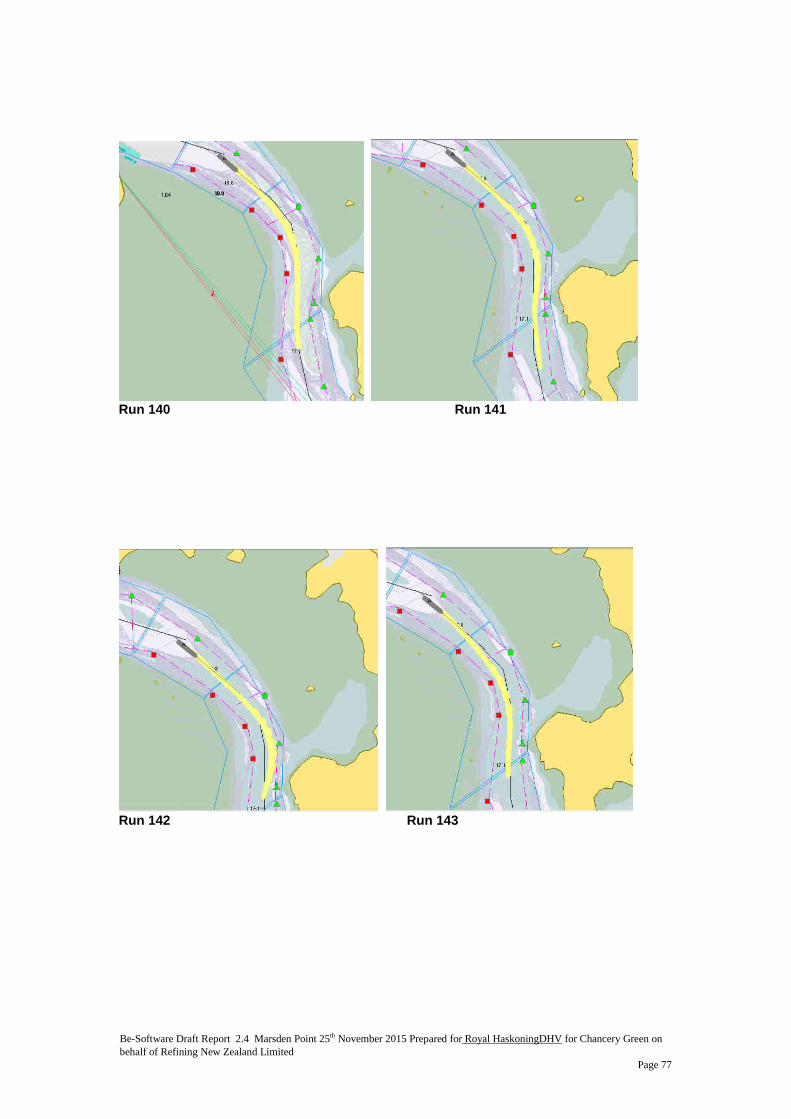
Run 140 Run 141
Run 142 Run 143
Page 19
Be-Software Draft Report 2.4 Marsden Point 25th November 2015 Prepared for Royal HaskoningDHV for Chancery Green on behalf of Refining New Zealand Limited Page 78
Run 144 Run 145
Run 146 Run 147
Page 20
Be-Software Draft Report 2.4 Marsden Point 25th November 2015 Prepared for Royal HaskoningDHV for Chancery Green on behalf of Refining New Zealand Limited Page 79
Run 148 Run 149
Run 150 Run 151
Page 21
Be-Software Draft Report 2.4 Marsden Point 25th November 2015 Prepared for Royal HaskoningDHV for Chancery Green on behalf of Refining New Zealand Limited Page 80
Run 152 Run 153
Run 154 Run 155
Page 22
Be-Software Draft Report 2.4 Marsden Point 25th November 2015 Prepared for Royal HaskoningDHV for Chancery Green on behalf of Refining New Zealand Limited Page 81
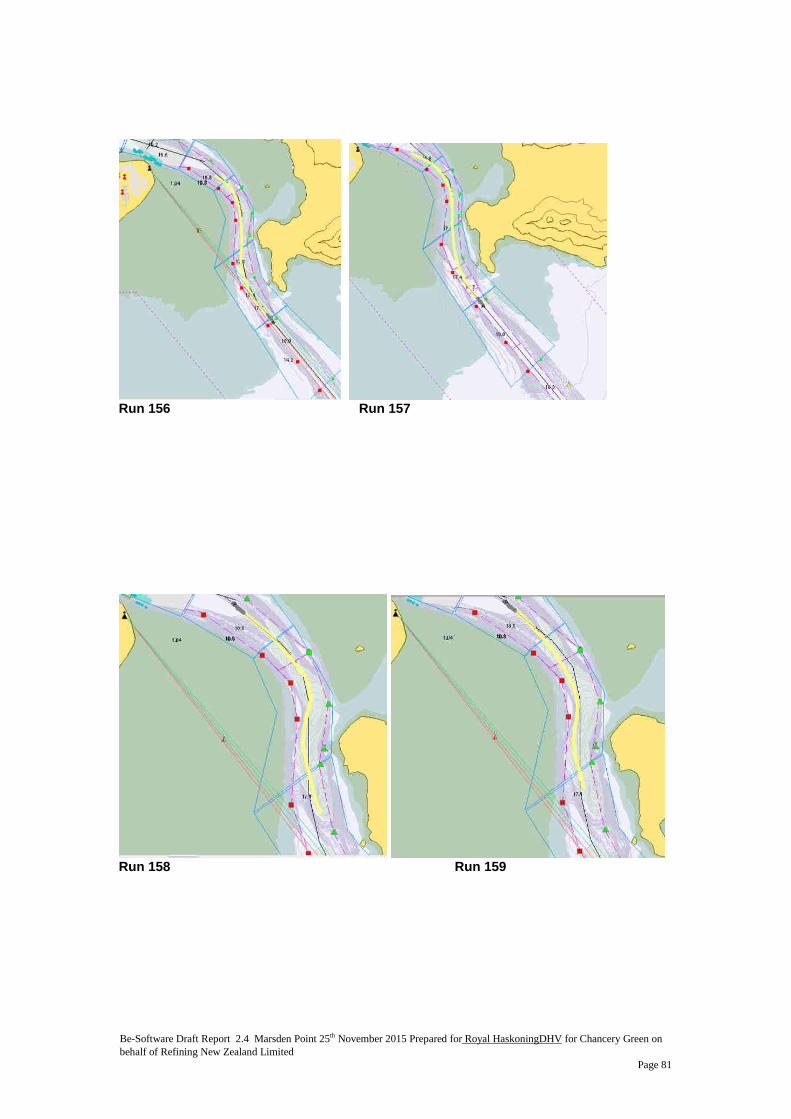
Run 156 Run 157
Run 158 Run 159
Page 23
Be-Software Draft Report 2.4 Marsden Point 25th November 2015 Prepared for Royal HaskoningDHV for Chancery Green on behalf of Refining New Zealand Limited Page 82
Run 160 Run 161
Run 162 Run 163
Page 24
Be-Software Draft Report 2.4 Marsden Point 25th November 2015 Prepared for Royal HaskoningDHV for Chancery Green on behalf of Refining New Zealand Limited Page 83
Run 164 Run 165
Run 166
Page 25
12 November 2016 RNZ CHANNEL DESIGN M&APA1028R002D08
APPENDIX D: Taurikura Bay Leads Report
Page 26
FINAL REPORT ON THE PROPOSED TAURIKURA BAY LEADS
Report prepared for Royal HaskoningDHV on behalf of Refining New Zealand
Limited
Revision 2.2
June 2016
Prepared by:
Page 27
Proposed Taurikura Leads Report Version 2.2 Page 1
Report Summary
As part of the Desktop Simulation Study prepared for Refining NZ in September 2015, it was
proposed to establish a set of Leads in Taurikura Bay to assist with the night time navigation of
arriving Suezmax Tankers and other vessels. These leads would define the north south centreline of
the proposed Channel Option 4-2 between buoys 3/6 and buoy 14. The requirement for leads only
applied to Channel Option 4-2.
These leads were trailed in the simulation study and found to be very useful for the proposed
Channel 4-2 as they helped the pilots turning the ship into the approach to the centreline of the
channel. The pilots commenced the turn after passing buoys 3\6 and used the leads to align
themselves into the centreline of the channel.
The Desktop Simulation study assumed the forward lead will be on the northern edge of Calliope
Bank and the rear lead on the foreshore. This report investigates further options to establish Leads.
There are four possible Leads options considered here.
(i) A PEL Sector Lead Light (PEL Option 1) established on Calliope Bank.
(ii) Traditional Leads (Low Leads Option 2) established on Calliope Bank (Fore lead) and
Taurikura Bay Foreshore (Rea r Lead). This was the option investigated in the previous report
revision (Report of Proposed Taurikura Bay Leads, Revision 1).
(iii) Traditional Leads (Water Leads Option 3) established on the Calliope Bank. Both Fore and
Rear Lead on Calliope Bank.
(iv) Traditional Leads (High Leads Option 4) established on Calliope Bank (Fore lead) and on the
lower southern slopes of Mania overlooking Taurikura Bay (Rear Lead).
This study investigated these proposed Leads options in more detail and the following results were
found:
All four Lead Options are viable but the PEL (Option 1) and the Water Leads (Option 3) will
cause the least visual impact on the local community around Taurikura Bay.
It was considered the PEL (Option 1) will be cheaper than the Water Leads (Option 3).
Traditional Leads offer the ability to judge the progress of the turn when swinging the ship
onto the centreline of the channel. However, Traditional Leads offer little indication of the
distance off the centreline when approaching the leading line.
The PEL (Option 1) can give a precise figure for distance off the centreline and by including an
oscillating boundary light option to the PEL; it is possible for the informed mariner to judge
the progress of the turn when swinging the ship onto the centreline of the channel.
The Traditional Leads would be visible in daytime use without lights. The PEL (Option 1) will
require daylights if it is to be used during the day. The PEL (Option 1) with daylights has more
Page 28
Proposed Taurikura Leads Report Version 2.2 Page 2
power requirements than the Traditional Leads and has a maximum day range out to the
vicinity of buoy 3.
The position of the existing isolated danger buoy in Taurikura Bay will create some
interference at night for all Leads Options but it is considered to be not serious. There will
also be some interference from shore light in Taurikura Bay for all Leads Options but it is not
considered serious. It was considered Buoy 11 should not cause any interference for all Leads
Options.
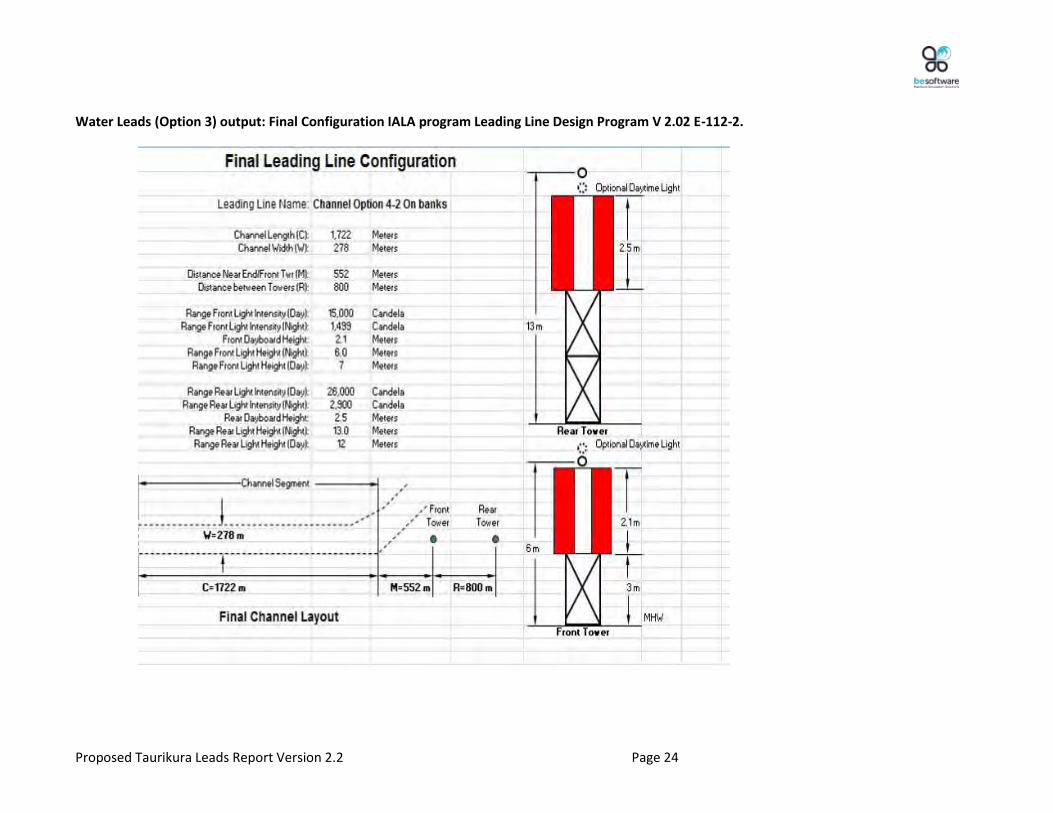
The program found the minimum heights (above Mean High Water) for the Water Leads
(Option 3) are 6 metres for the Front Lead and 13 metres for the Rear Lead.
The PEL (Option 1) will require a single tower which is 15 metres above MHW. It may be
possible to use a lower tower (10 metres) and tilt the PEL light.
Light intensity for the Traditional Leads options were checked against the IALA Leading Line
Design Program V 2.02 E-112-2. The report assumes recommended intensity for traditional
lights.
The report assumes a height of eye of the observer at 8 metres, 15 metres and 25 metres.
The lights were found to be usable with all options within the channel from heights of eye
above 7 metres.
It was considered that white lights offered the best visibility by night.
It is assumed that Calliope Bank is stable enough for establishment of a tower structure. This
should be verified.
It is assumed that approvals can be obtained for the establishment of lead towers in the
positions indicated in this report.
Page 29
Proposed Taurikura Leads Report Version 2.2 Page 3
1 PEL VERSES TRADITIONAL LEADS
A PEL light (Port Entry Light) uses a single sector light which provides a far greater resolution of
sector boundaries than had previously been possible (See Figure 1). Using a very fine angled sector
light, it is possible to define the centre line of a channel using a single station or tower. A white light
indicates the centre of the channel with red and green light sectors either side (See Figure 2).
Traditional Leads require two stations to define the centre line of a channel with a light at each
station. The PEL light has been available to mariners for over forty years but the traditional leads
have been used for much longer. The PEL light has gained acceptance across the world and
particularly in New Zealand and Australia, however pilots will often prefer one system over the other.
The following statements were supplied by Captain Ross Nicolls Director and Senior Pilot with
Brisbane Marine Pilots:
PEL vs. Lead lights is a subjective one depending on which Pilot you're talking to. This is more prominent when replacing one set of leads with the other and we have been through this in Brisbane and operates with both PEL's and traditional leads. The PEL certainly provides an indication of distance off the centre course line as the lights (shoulder and centre) are graduated and the Pilot can be educated as to the extremity of the lights visibility. Traditional leads only clearly indicate where the centre line is without any clear appreciation of distance either side. The primary benefit of the traditional lead is that they are constantly lit or visible as you approach the turn and you can gauge or get a feeling of how the turn is progressing by the aspect of the two leads. This is not as discernible with a PEL. If distance away from the centre line of a course is a critical component then a PEL defines this better. From the above, if mariners wish to use the PEL during the day then it must be provided with daytime lights which can be a problem if using solar power (as will be required in Taurikura Bay). The manufacturer of PEL lights, Vega of New Zealand http://www.vega.co.nz considers adequate power will be achievable for a PEL light established in Taurikura Bay. Similarly in order to get a feeling of how the turn is progressing, the PEL needs to be provided with the oscillating boundary option (see Figure 3). Vega offer oscillating boundary options which have successfully been used in Cook Strait and Lyttelton. Oscillating boundary is a factory fitted option for any PEL Light. It provides proportional indication of lateral movement within the sectors of the light. In the oscillating sector, the colour oscillates between the colours of the sectors on either side. The signal is easily and intuitively grasped by the mariner. A longer red flash and a shorter white flash means that the mariner is closer to the red sector, and vice versa. Judging the proportion of time in which each colour is displayed is quite straightforward, and the cycle repeats every three seconds. The oscillating boundary option provides the mariner with a feeling of how the turn is progressing, not as instinctive as the traditional lead but a functional alternative.
Page 30
Proposed Taurikura Leads Report Version 2.2 Page 4
Vega of New Zealand has three types of PEL lights (PEL-3, PEL-4 and PEL-6), all of which can provide the oscillating boundary option.
Figure 1 PEL 3 Installation (Courtesy Vega5)
Figure 2 Light Sectors PEL (Courtesy Vega5)
Figure 3 Oscillating Boundary Option (Courtesy Vega5)
Page 31
Proposed Taurikura Leads Report Version 2.2 Page 5
2 CHANNEL DESIGN CRITERIA TO ESTABLISH LEADS
To establish the traditional leads options, the IALA Guideline 1023 The Design of Leading Lines Edition
1.1 2005 was used. The proposed traditional lead options were tested against this IALA publication
in Melbourne by Be-Software. Guideline 1023 uses an excel program Leading Line Design Program V
2.02 E-112-2 (Table 1). The PEL (Option 1), where applicable, used the same design channel criteria.
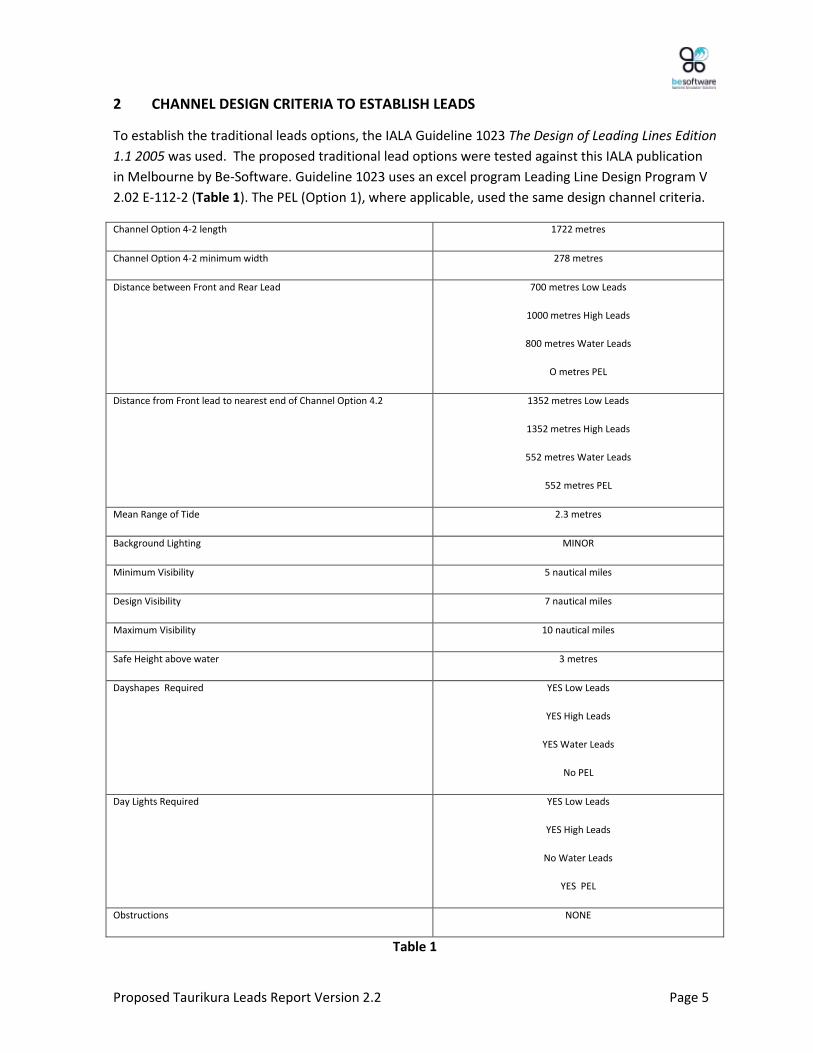
Channel Option 4-2 length 1722 metres
Channel Option 4-2 minimum width 278 metres
Distance between Front and Rear Lead 700 metres Low Leads
1000 metres High Leads
800 metres Water Leads
O metres PEL
Distance from Front lead to nearest end of Channel Option 4.2 1352 metres Low Leads
1352 metres High Leads
552 metres Water Leads
552 metres PEL
Mean Range of Tide 2.3 metres
Background Lighting MINOR
Minimum Visibility 5 nautical miles
Design Visibility 7 nautical miles
Maximum Visibility 10 nautical miles
Safe Height above water 3 metres
Dayshapes Required YES Low Leads
YES High Leads
YES Water Leads
No PEL
Day Lights Required YES Low Leads
YES High Leads
No Water Leads
YES PEL
Obstructions NONE
Table 1
Page 32
Proposed Taurikura Leads Report Version 2.2 Page 6
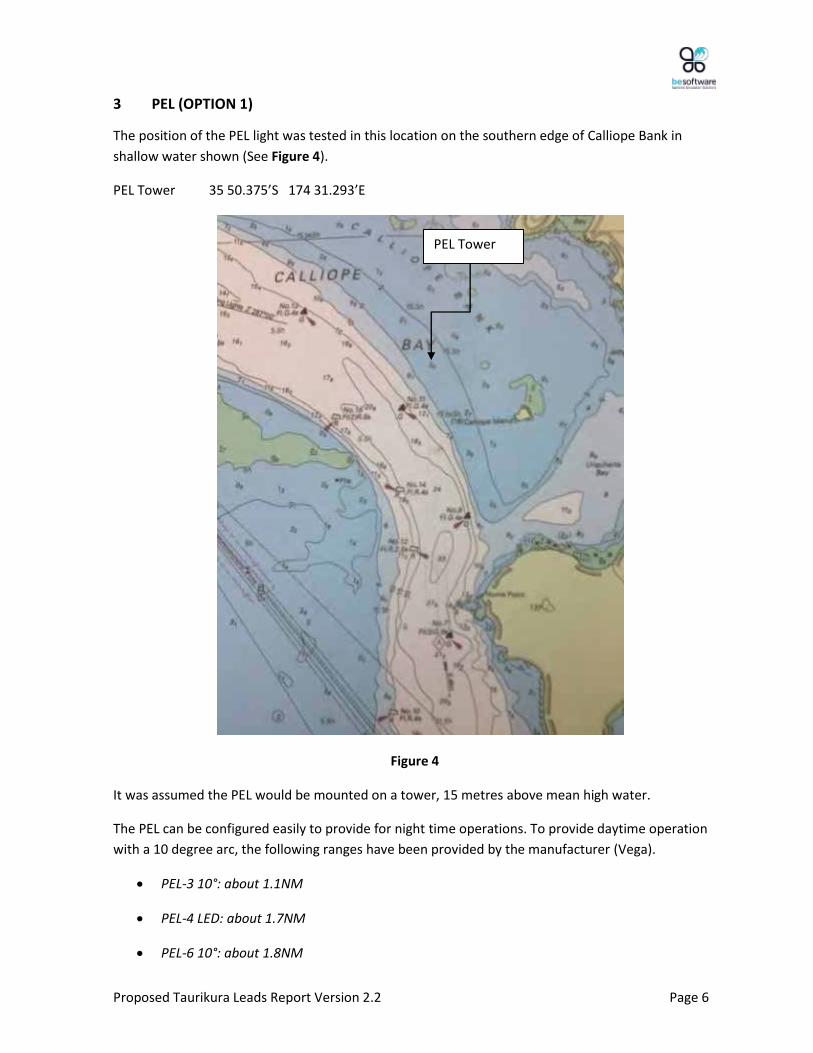
3 PEL (OPTION 1)
The position of the PEL light was tested in this location on the southern edge of Calliope Bank in
shallow water shown (See Figure 4).
PEL Tower 35 50.375’S 174 31.293’E
Figure 4
It was assumed the PEL would be mounted on a tower, 15 metres above mean high water.
The PEL can be configured easily to provide for night time operations. To provide daytime operation
with a 10 degree arc, the following ranges have been provided by the manufacturer (Vega).
PEL-3 10°: about 1.1NM
PEL-4 LED: about 1.7NM
PEL-6 10°: about 1.8NM
PEL Tower
Page 33
Proposed Taurikura Leads Report Version 2.2 Page 7
PEL-6 can provide the range coverage just to buoy 3 for daytime operation. Range assumes day
ranges T=0.74, with 10kcd/m2 sky luminance (bright cloud and clear sky 1). The atmospheric
transmissivity (T) is defined as the transmittance or proportion of light from a source that remains
after passing through a specified distance (one nautical mile) through the atmosphere, at sea level 1.
According to the manufacturer, the PEL4 will comfortably be visible at that maximum range.
Power requirements for PEL lights have been provided by the manufacturer Vega:
PEL-3: 100W, 12VDC.
PEL-4 LED: about 90W, 12VDC.
PEL-6: 250W, 24VDC.
It was considered the PEL-4 LED probably represents the best option for PEL if daytime operation is
required. The maximum range reaches to halfway between buoy 3 and 5 and is achieved with
relatively low power consumption.
Basic sectors were simulated from 173T to 183T and are indicated in the following Table 2. The
sectors are shown with the ranges (see Figure 5).
Sector Light Colour Light Characteristic Significance
173T to 175 T Green Fixed Start of Turn
175T to 177T Green White Flashing predominately green Approach
177T to 179 T White Green Flashing predominately white Close Approach
179T to 181T White Fixed Channel Centreline
181T to 183T White Red Flashing predominately white To west of Centreline
Table 2
Page 34
Proposed Taurikura Leads Report Version 2.2 Page 8
Figure 5
Simulation of the PEL (Option 1) was undertaken for both daytime and night time (See Figure 6
overleaf, daytime simulation). The simulation showed the ship undertaking the turn from 320T to
000T and the PEL was able to give an indication of the turn progress. Video files of the simulations
are included in the electronic version of this report. A PEL 4 light system was simulated.
Maximum Range PEL 6
Maximum Range PEL 4 Buoy 3
Buoy 5
Page 35
Proposed Taurikura Leads Report Version 2.2 Page 9
Figure 6
Page 36
Proposed Taurikura Leads Report Version 2.2 Page 10
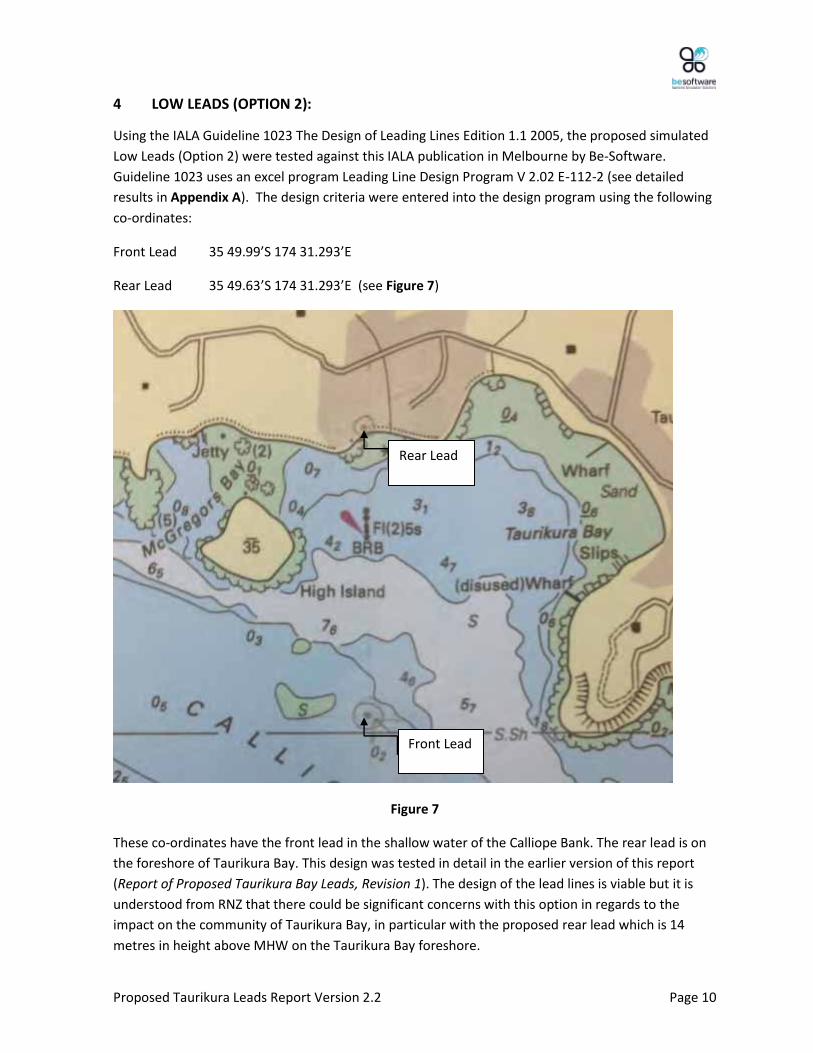
4 LOW LEADS (OPTION 2):
Using the IALA Guideline 1023 The Design of Leading Lines Edition 1.1 2005, the proposed simulated
Low Leads (Option 2) were tested against this IALA publication in Melbourne by Be-Software.
Guideline 1023 uses an excel program Leading Line Design Program V 2.02 E-112-2 (see detailed
results in Appendix A). The design criteria were entered into the design program using the following
co-ordinates:
Front Lead 35 49.99’S 174 31.293’E
Rear Lead 35 49.63’S 174 31.293’E (see Figure 7)
Figure 7
These co-ordinates have the front lead in the shallow water of the Calliope Bank. The rear lead is on
the foreshore of Taurikura Bay. This design was tested in detail in the earlier version of this report
(Report of Proposed Taurikura Bay Leads, Revision 1). The design of the lead lines is viable but it is
understood from RNZ that there could be significant concerns with this option in regards to the
impact on the community of Taurikura Bay, in particular with the proposed rear lead which is 14
metres in height above MHW on the Taurikura Bay foreshore.
Rear Lead
Front Lead
Page 37
Proposed Taurikura Leads Report Version 2.2 Page 11
Analysis of Google Earth data (see Figure 8) shows the position of the rear lead could be located in
front of a set of trees on the foreshore, which may lessen the visual impact. It should be verified by
actual survey and, also, to confirm the elevation of the land above Mean High Water. Nevertheless, it
is expected there could be community concern with the lead tower in this location.
Figure 8
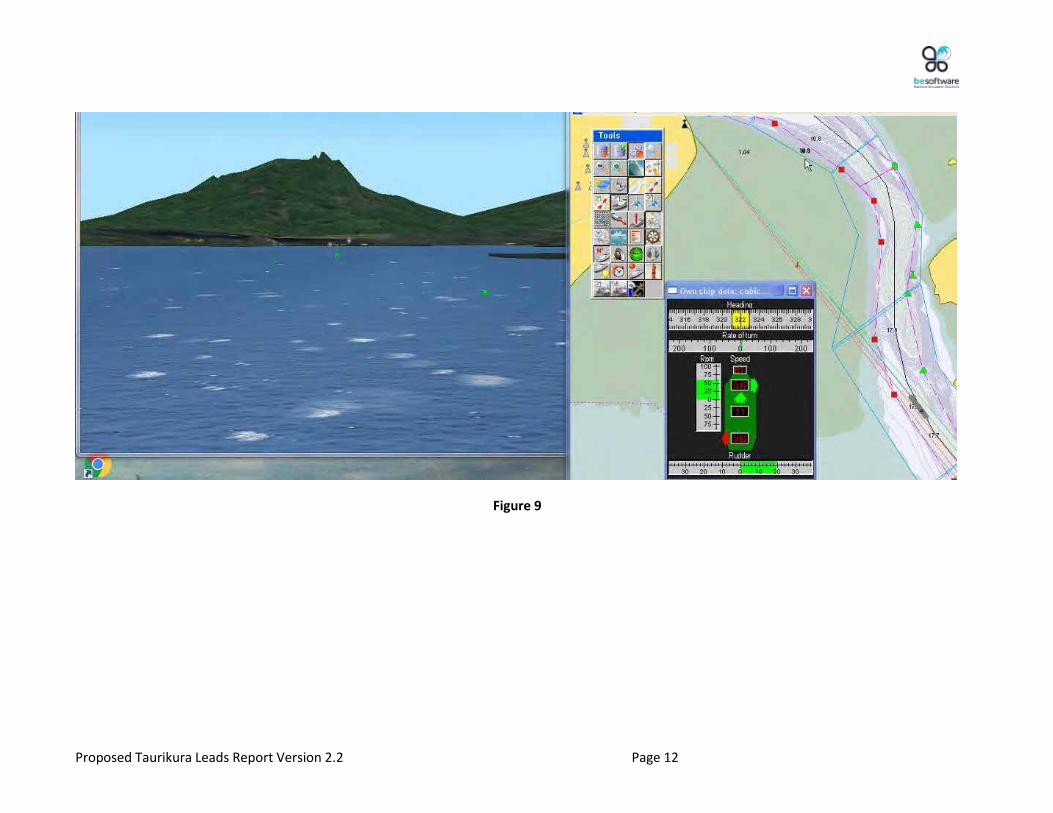
Simulation results for both night time and daylight navigation using the Low Leads were very
positive. The daytime navigation simulation is shown (see Figure 9 overleaf). It was considered that
daylights and dayshapes were appropriate and the lights are to be white for both day and night
operations.
Page 38
Proposed Taurikura Leads Report Version 2.2 Page 12
Figure 9
Page 39
Proposed Taurikura Leads Report Version 2.2 Page 13
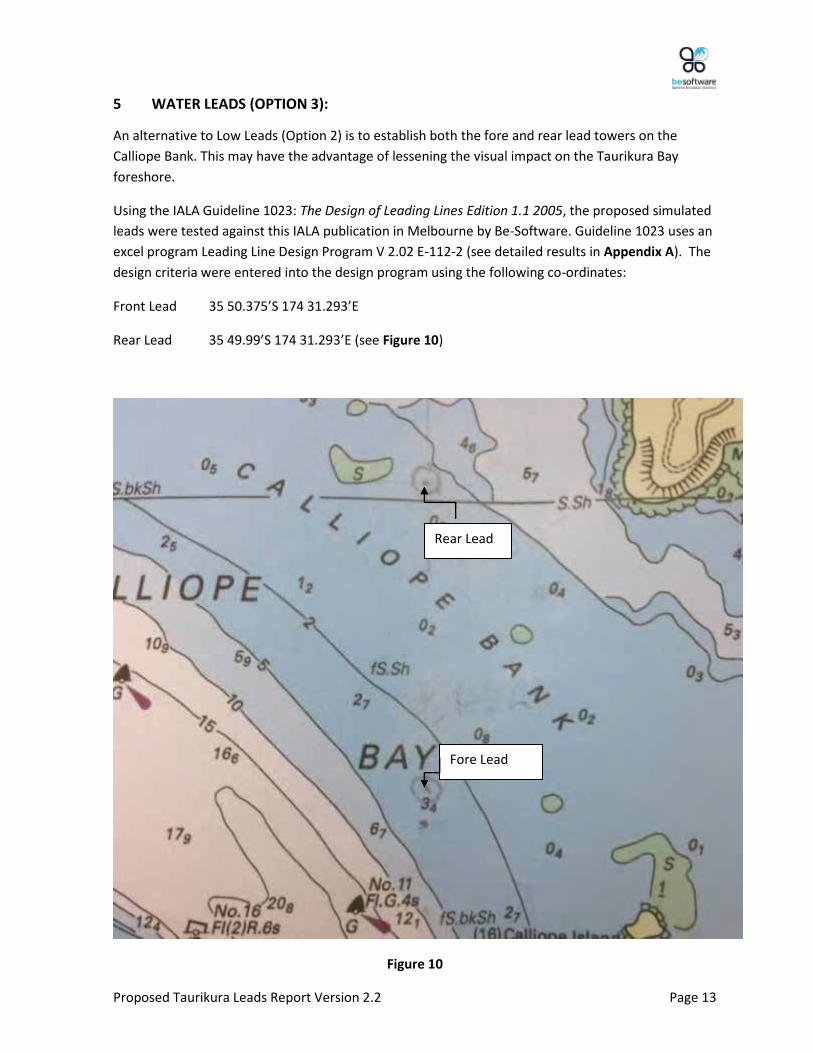
5 WATER LEADS (OPTION 3):
An alternative to Low Leads (Option 2) is to establish both the fore and rear lead towers on the
Calliope Bank. This may have the advantage of lessening the visual impact on the Taurikura Bay
foreshore.
Using the IALA Guideline 1023: The Design of Leading Lines Edition 1.1 2005, the proposed simulated
leads were tested against this IALA publication in Melbourne by Be-Software. Guideline 1023 uses an
excel program Leading Line Design Program V 2.02 E-112-2 (see detailed results in Appendix A). The
design criteria were entered into the design program using the following co-ordinates:
Front Lead 35 50.375’S 174 31.293’E
Rear Lead 35 49.99’S 174 31.293’E (see Figure 10)
Figure 10
Fore Lead
Rear Lead
Page 40
Proposed Taurikura Leads Report Version 2.2 Page 14
The results of simulation were positive and the leads were found to offer the required sensitivity. The
daytime navigation simulation is shown (see Figure 11 overleaf).
An advantage of having the leads closer to the channel is the possibility to dispense with the
daylights and use night lights only. Dayshapes would be required but they would be smaller than for
Low Leads (Option 2). Another advantage is the lead towers could be smaller. For the front lead, the
tower would be 6 metres above mean high water and the rear lead 13 metres above mean high
water. It was considered that buoy 11 would not cause interference with the Leads.
Page 41
Proposed Taurikura Leads Report Version 2.2 Page 15
Figure 11
Page 42
Proposed Taurikura Leads Report Version 2.2 Page 16
6 HIGH LEADS (OPTION 4):
The final alternative option is to place the rear lead higher up to the north of the housing in Taurikura
Bay. Using the IALA Guideline 1023 The Design of Leading Lines Edition 1.1 2005, the proposed
simulated leads were tested against this IALA publication in Melbourne by Be-Software. Guideline
1023 uses an excel program Leading Line Design Program V 2.02 E-112-2 (see detailed results in
Appendix A). The design criteria were entered into the design program using the following co-
ordinates:
Front Lead 35 49.99’S 174 31.290’E
Rear Lead 35 49.45’S 174 31.290’E (see Figure 12)
Figure 12
These co-ordinates have the front lead in the shallow water of the Calliope Bank which is the same
for Low Leads (Option 2). The rear lead is on the southern slope of Manaia Mountain, which is an
alternative site to that proposed for the rear lead for Low Leads (Option 2).
Rear Lead
Front Lead
Page 43
Proposed Taurikura Leads Report Version 2.2 Page 17
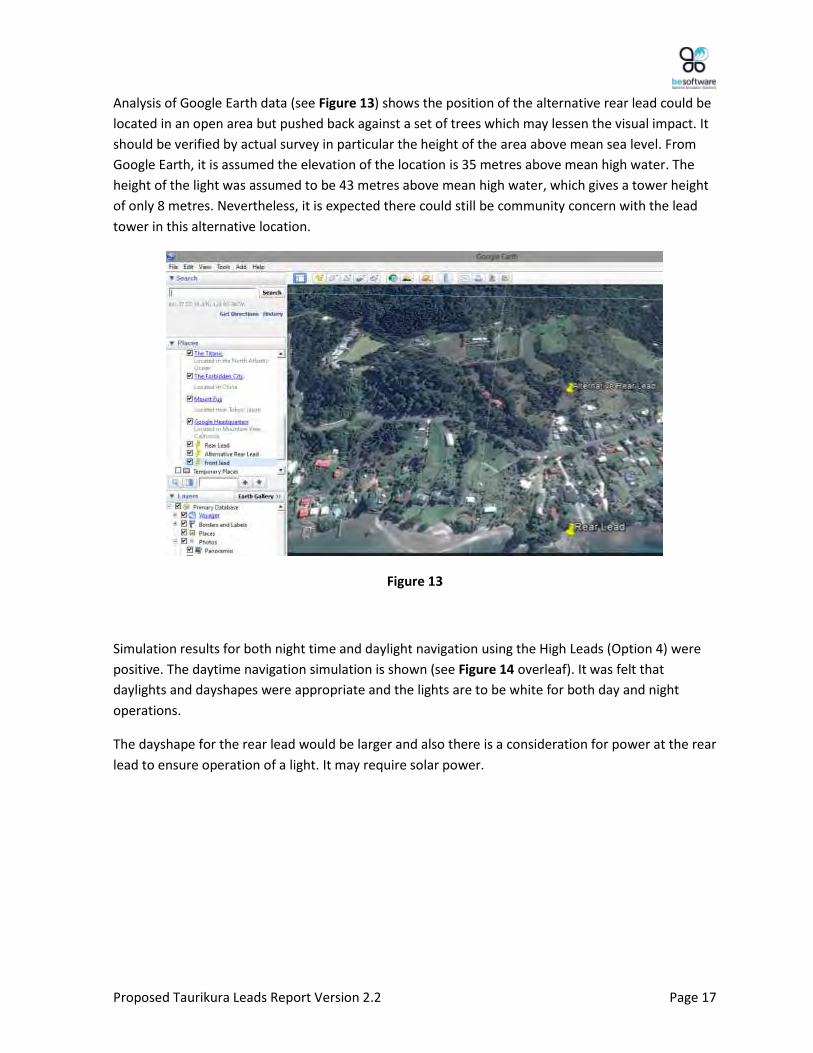
Analysis of Google Earth data (see Figure 13) shows the position of the alternative rear lead could be
located in an open area but pushed back against a set of trees which may lessen the visual impact. It
should be verified by actual survey in particular the height of the area above mean sea level. From
Google Earth, it is assumed the elevation of the location is 35 metres above mean high water. The
height of the light was assumed to be 43 metres above mean high water, which gives a tower height
of only 8 metres. Nevertheless, it is expected there could still be community concern with the lead
tower in this alternative location.
Figure 13
Simulation results for both night time and daylight navigation using the High Leads (Option 4) were
positive. The daytime navigation simulation is shown (see Figure 14 overleaf). It was felt that
daylights and dayshapes were appropriate and the lights are to be white for both day and night
operations.
The dayshape for the rear lead would be larger and also there is a consideration for power at the rear
lead to ensure operation of a light. It may require solar power.
Page 44
Proposed Taurikura Leads Report Version 2.2 Page 18
Figure 14
Page 45
Proposed Taurikura Leads Report Version 2.2 Page 19
7 SIMULATION RESULTS
The proposed leads were placed in the Be-Software Lanterna simulator for both night time and
daytime simulation of the leads, dayshapes and lights. White, red and blue lights were tested for
night time operations. Day time operations were tested with dayshapes only and also with dayshapes
and white daylights. A number of video files were produced and are included in the electronic
version of this document.
From the simulation for traditional lead options, it was considered the white lights were superior at
night but blue or red would also be adequate. Blue or red offer some advantages with some
background lights in the vicinity. By day, the dayshapes and daylight (white) were considered
superior to dayshapes only.
For the simulation of the PEL (Option 1), a PEL4 system was simulated with an arc of visibility of 10
degrees.
Both day and night time simulations were conducted. A comparison of the lead options that were
simulated is as shown in Table 3.
Lead
Option
Tower
Size
Day
Shapes
Height
Daylights
Available
Community
Concerns
Power
Supply
Distance
off
centreline
available
Indications
of progress
of turn
PEL Option1 15m or
perhaps
lower
Single
no Yes Minimal Solar Yes Adequate
with
boundary
oscillation
Low Leads
Option 2
7m FL
14m RL
3m FL
3m RL
Yes Highly likely Solar
plus
Shore
No Very Good
Water
Leads
Option 3
6m FL
13m RL
2.1m FL
2.5m RL
May not be
required
Less likely Solar No Good
High Leads
Option 4
7 m FL
8 m RL
needs
verifying
3m FL
4m RL
Yes Likely Solar
Perhaps
Shore
No Good
Table 3
Page 46
Proposed Taurikura Leads Report Version 2.2 Page 20
8 RECOMMENDATIONS AND CONCLUSIONS
All the proposed Leads Options are viable. It is recommended that
The back ground lighting on the foreshore of Taurikura Bay and the isolated danger buoy in
Taurikura Bay should be checked at night for intensity. It is assumed the lights are fairly weak
however, a nighttime photo or video of the region taken from a ship can verify this.
It is assumed that Calliope Bank is stable enough for establishment of a tower structure. This
should be verified.
It is assumed that approvals can be obtained for the establishment of lead towers in the
positions indicated in this report.
Final intensity of Traditional Lights should be verified using IALA program Leading Line Design
Program V 2.02 E-112-2 to confirm the lights do not merge over the usable segment of the
Channel Option 4-2.This report has used light intensities based on recommended values for
the night and the day lights.
The report assumes a height of eye of the observer at 8 metres, 15 metres and 25 metres.
The lights were found to be usable from observer heights of eye above 7 metres. Below 7
metres the lights will blur in the channel for the traditional lead options.
The land based Traditional Lead Options (2 and 4) will need surveying prior to a decision on
tower size due to uncertainty in the elevation of the land in the positions proposed in this
report.
Either the PEL (Option 1) using a PEL4 LED system or the Water Leads (Option 3) are the most
suitable for covering the mid channel segment of Channel Option 4-2 between buoys 3 /6
and 14.
The PEL (Option 1) is working at maximum range by day to provide coverage in the critical
approach to the channel; however it offers more information to the mariner. Using a PEL6
will marginally increase the range but at greater cost in terms of solar power configuration.
According to the manufacturer Vega, the PEL4 will be comfortably visible at the maximum
range.
It was considered that white lights offered the best visibility by night.
It was considered that buoy 11 would not cause interference with the Leads Option (1) or
Leads Option (3) by day or by night.
Page 47
Proposed Taurikura Leads Report Version 2.2 Page 21
9 REFERENCES
1. IALA Aids to Navigation Guide
2. IALA Guideline 1023 The Design of Leading Lines
3. IALA Guideline 1041 On Sector Lights
4. IALA Guideline 1043 Light Sources Used in Visual Aids to Navigation
5. Vega PEL Sector Lights
6. Vega PEL 4 Precision LED sector light http://www.vega.co.nz/shop/pel-4/
7. IALA Leading Line Design Programme V2.02 E-112-2
Page 48
Proposed Taurikura Leads Report Version 2.2 Page 22
APPENDIX A: IALA PROGRAM LEADING LINE DESIGN PROGRAM V 2.02 E-112-2 OUTPUTS
Page 49
Proposed Taurikura Leads Report Version 2.2 Page 23
Low Leads (Option 2) output: Final Configuration IALA program Leading Line Design Program V 2.02 E-112-2.
Page 50
Proposed Taurikura Leads Report Version 2.2 Page 24
Water Leads (Option 3) output: Final Configuration IALA program Leading Line Design Program V 2.02 E-112-2.
Page 51
Proposed Taurikura Leads Report Version 2.2 Page 25
High Leads (Option 4) outputs: Daylights IALA program Leading Line Design Program V 2.02 E-112-2.
Page 52
12 November 2016 RNZ CHANNEL DESIGN M&APA1028R002D08
APPENDIX E: Revised PIANC Channel Design Calculations
Page 53
PIANC (2014) CHANNEL WIDTH ASSESSMENT
OPTION 2 CHANNEL DESIGN
REACH 1: Fairway Buoy to Buoy 1/2
INPUT DATA
Parameter Value Unit Comment Source
Vessel Type Tanker n/a
Vessel Size Class Suezmax n/a OMC, 2015
Vessel Dead Weight Tonnage (DWT) 159,057 tonnes OMC, 2015
Vessel Beam (B) 50 m OMC, 2015
Vessel Length Overall (LOA) 276 m OMC, 2015
Vessel Length Between Perpendiculars (LBP) 264 m OMC, 2015
Vessel Draft (T) 17.02 m summer draft OMC, 2015
Channel Design Level -18.19 m CD 95% Access, minimum channel design level in Reach 1 OMC, 2015
Mean High Water Neap (MHWN) tide level 2.32 m CD Tonkin & Taylor, 2015
Channel Type Outer Channel n/a "Outer Channel" = open water, "Inner Channel" = protected water PIANC, 2014
Passing One-way n/a "Two-way" or One-way"
Vessel Manoeuvrability Poor n/a "Poor" = tankers/bulk carriers PIANC, 2014
"Moderate" = container vessels/car carriers/RoRo vessels/LNG&LPG vessels PIANC, 2014
"Good" = twin propeller ships/ferries/cruise vessels PIANC, 2014
(a) Vessel Speed (Vs) 6.8 knots "average" speed profile, varies from 6kts at Fairway Buoy to 6.8kts at Buoy 1/2 OMC, 2015
(b) Prevailing cross wind (Vcw) 20 knots "Mild" Vcw<15 knots, "Moderate" 15 knots <=Vcw<33 knots, "Strong" Vcw>33 knots Marsden Point, 5% annual exceedance wind speed 10m/s, MetOcean Solutions measured data
(c) Prevailing cross current (Vcc) 0.3 knots "Negligible" Vcc<0.2 knots, "Low" 0.2 knots<=Vcc<0.5 knots, "Moderate" 0.5 knots<=Vcc<1.5
knots, "Strong" Vcc>=1.5 knots
Max. ebb or flood current velocity +/-1hr from HW, Auckland Ports ADCP Data 2015
(d) Prevailing longitudinal current (Vlc) 0.4 knots "Low" VlC<1.5 knots, "Moderate" 1.5 knots<=VlC<3 knots, "Strong" VlC>=3 knots Max. ebb or flood current velocity +/-1hr from HW, Auckland Ports ADCP Data 2015
(e) Beam and stern quartering wave height (Hs) 2.4 m "Hs<=1m", "1m<Hs<3m", "Hs>=3m" OMC, 2015 99th percentile swell data
(f) Aids to Navigation Good n/a "Excellent" = paired lighted buoys with radar deflectors/lighted leading lines with availability
of Pilots, DGPS and Electronic Chart Display and Information System (ECDIS)
PIANC, 2014
"Good" = paired lighted buoys with radar deflectors/lighted leading lines with availability of
Pilots and DGPS
PIANC, 2014
"Moderate" = anything less than the facilities mentioned above PIANC, 2014
(g) Bottom Surface smooth and soft n/a "smooth and soft" or "rough and hard" PIANC, 2014
(h) Depth of waterway (h) 20.51 m at Mean High Water Neap tide (MHWN)
Depth to Draft Ratio (h/T) 1.21 n/a
Channel slope sloping channel edges and shoals n/a "gentle underwater channel slope (1:10 or less steep)" or "sloping channel edges and shoals"
or "steep and hard embankments, structures"
PIANC, 2014
CHANNEL WIDTH CALCULATION
Parameter Beam (B) Multiplier Category Comment Source
Basic Manoeuvring Lane (WBM) 1.8 Poor "Good" = 1.3B, "Moderate" = 1.5B, "Poor" = 1.8B (Table 3.4) PIANC, 2014
(a) Vessel Speed (Vs) 0.0 Slow "Fast" Vs>12 = 0.1B, "Moderate" 8<Vs<12 = 0.0B, "Slow" 5<Vs<8 = 0.0B (Table 3.5(a)) PIANC, 2014
(b) Prevailing cross wind (Vcw) 0.6 Moderate See Table 3.5(b) PIANC, 2014
(c) Prevailing cross current (Vcc) [Outer Channel] 0.3 Low See Table 3.5(c) PIANC, 2014
(c) Prevailing cross current (Vcc) [Inner Channel] 0.3 Low See Table 3.5(c) PIANC, 2014
(d) Prevailing longitudinal current (Vlc) 0.0 Low See Table 3.5(d) PIANC, 2014
(e) Beam and stern quartering wave height (Hs) 0.5 1m<Hs<3m Hs<=1m = 0.0B, 1m<Hs<3m = 0.5B, Hs>=3m = 1.0B (Table 3.5(e)) PIANC, 2014
(f) Aids to Navigation 0.2 Good See Table 3.5(f) PIANC, 2014
(g) Bottom Surface 0.1 h<1.5T See Table 3.5(g) PIANC, 2014
(h) Depth of waterway (h) [Outer Channel] 0.2 h<1.25T See Table 3.5(h) PIANC, 2014
(h) Depth of waterway (h) [Inner Channel] 0.2 1.15T<=h<1.5T See Table 3.5(h) PIANC, 2014
Width for Bank Clearance (WB) 0.3 sloping channel edges and shoals See Table 3.6 PIANC, 2014
Additional Width for Channel Passing (Wp) 0.0 Not Required See Table 3.7 PIANC, 2014
Total Channel Width [Outer Channel] 4.3 B
Total Channel Width [Outer Channel] 215 m
Total Channel Width [Inner Channel] 4.3 B
Total Channel Width [Inner Channel] 215 m
Page 54
PIANC (2014) CHANNEL WIDTH ASSESSMENT
OPTION 2 CHANNEL DESIGN
REACH 2: Buoy 1/2 to Buoy 3/6
INPUT DATA
Parameter Value Unit Comment Source
Vessel Type Tanker n/a
Vessel Size Class Suezmax n/a OMC, 2015
Vessel Dead Weight Tonnage (DWT) 159,057 tonnes OMC, 2015
Vessel Beam (B) 50 m OMC, 2015
Vessel Length Overall (LOA) 276 m OMC, 2015
Vessel Length Between Perpendiculars (LBP) 264 m OMC, 2015
Vessel Draft (T) 17.02 m summer draft OMC, 2015
Channel Design Level -17.65 m CD 95% Access, minimum channel design level in Reach 2 OMC, 2015
Mean High Water Neap (MHWN) tide level 2.32 m CD Tonkin & Taylor, 2015
Channel Type Outer Channel n/a "Outer Channel" = open water, "Inner Channel" = protected water PIANC, 2014
Passing One-way n/a "Two-way" or One-way"
Vessel Manoeuvrability Poor n/a "Poor" = tankers/bulk carriers PIANC, 2014
"Moderate" = container vessels/car carriers/RoRo vessels/LNG&LPG vessels PIANC, 2014
"Good" = twin propeller ships/ferries/cruise vessels PIANC, 2014
(a) Vessel Speed (Vs) 7.5 knots "average" speed profile, varies from 6.8kts at Buoy 1/2 to 7.5kts at Buoy 3/6 OMC, 2015
(b) Prevailing cross wind (Vcw) 20 knots "Mild" Vcw<15 knots, "Moderate" 15 knots <=Vcw<33 knots, "Strong" Vcw>33 knots Marsden Point, 5% annual exceedance wind speed 10m/s, MetOcean Solutions measured data
(c) Prevailing cross current (Vcc) 0.3 knots "Negligible" Vcc<0.2 knots, "Low" 0.2 knots<=Vcc<0.5 knots, "Moderate" 0.5 knots<=Vcc<1.5
knots, "Strong" Vcc>=1.5 knots
Max. ebb or flood current velocity +/-1hr from HW, Auckland Ports ADCP Data 2015
(d) Prevailing longitudinal current (Vlc) 0.4 knots "Low" VlC<1.5 knots, "Moderate" 1.5 knots<=VlC<3 knots, "Strong" VlC>=3 knots Max. ebb or flood current velocity +/-1hr from HW, Auckland Ports ADCP Data 2015
(e) Beam and stern quartering wave height (Hs) 1.9 m "Hs<=1m", "1m<Hs<3m", "Hs>=3m" OMC, 2015 99th percentile swell data
(f) Aids to Navigation Good n/a "Excellent" = paired lighted buoys with radar deflectors/lighted leading lines with availability
of Pilots, DGPS and Electronic Chart Display and Information System (ECDIS)
PIANC, 2014
"Good" = paired lighted buoys with radar deflectors/lighted leading lines with availability of
Pilots and DGPS
PIANC, 2014
"Moderate" = anything less than the facilities mentioned above PIANC, 2014
(g) Bottom Surface smooth and soft n/a "smooth and soft" or "rough and hard" PIANC, 2014
(h) Depth of waterway (h) 19.97 m at Mean High Water Neap tide (MHWN)
Depth to Draft Ratio (h/T) 1.17 n/a
Channel slope sloping channel edges and shoals n/a "gentle underwater channel slope (1:10 or less steep)" or "sloping channel edges and shoals"
or "steep and hard embankments, structures"
PIANC, 2014
CHANNEL WIDTH CALCULATION
Parameter Beam (B) Multiplier Category Comment Source
Basic Manoeuvring Lane (WBM) 1.8 Poor "Good" = 1.3B, "Moderate" = 1.5B, "Poor" = 1.8B (Table 3.4) PIANC, 2014
(a) Vessel Speed (Vs) 0.0 Slow "Fast" Vs>12 = 0.1B, "Moderate" 8<Vs<12 = 0.0B, "Slow" 5<Vs<8 = 0.0B (Table 3.5(a)) PIANC, 2014
(b) Prevailing cross wind (Vcw) 0.6 Moderate See Table 3.5(b) PIANC, 2014
(c) Prevailing cross current (Vcc) [Outer Channel] 0.3 Low See Table 3.5(c) PIANC, 2014
(c) Prevailing cross current (Vcc) [Inner Channel] 0.3 Low See Table 3.5(c) PIANC, 2014
(d) Prevailing longitudinal current (Vlc) 0.0 Low See Table 3.5(d) PIANC, 2014
(e) Beam and stern quartering wave height (Hs) 0.5 1m<Hs<3m Hs<=1m = 0.0B, 1m<Hs<3m = 0.5B, Hs>=3m = 1.0B (Table 3.5(e)) PIANC, 2014
(f) Aids to Navigation 0.2 Good See Table 3.5(f) PIANC, 2014
(g) Bottom Surface 0.1 h<1.5T See Table 3.5(g) PIANC, 2014
(h) Depth of waterway (h) [Outer Channel] 0.2 h<1.25T See Table 3.5(h) PIANC, 2014
(h) Depth of waterway (h) [Inner Channel] 0.2 1.15T<=h<1.5T See Table 3.5(h) PIANC, 2014
Width for Bank Clearance (WB) 0.3 sloping channel edges and shoals See Table 3.6 PIANC, 2014
Additional Width for Channel Passing (Wp) 0.0 Not Required See Table 3.7 PIANC, 2014
Total Channel Width [Outer Channel] 4.3 B
Total Channel Width [Outer Channel] 215 m
Total Channel Width [Inner Channel] 4.3 B
Total Channel Width [Inner Channel] 215 m
Page 55
PIANC (2014) CHANNEL WIDTH ASSESSMENT
OPTION 2 CHANNEL DESIGN
REACH 3: Buoy 3/6 to Buoy 7
INPUT DATA
Parameter Value Unit Comment Source
Vessel Type Tanker n/a
Vessel Size Class Suezmax n/a OMC, 2015
Vessel Dead Weight Tonnage (DWT) 159,057 tonnes OMC, 2015
Vessel Beam (B) 50 m OMC, 2015
Vessel Length Overall (LOA) 276 m OMC, 2015
Vessel Length Between Perpendiculars (LBP) 264 m OMC, 2015
Vessel Draft (T) 17.02 m summer draft OMC, 2015
Channel Design Level -16.87 m CD 95% Access, minimum channel design level in Reach 3 OMC, 2015
Mean High Water Neap (MHWN) tide level 2.32 m CD Tonkin & Taylor, 2015
Channel Type Outer Channel n/a "Outer Channel" = open water, "Inner Channel" = protected water PIANC, 2014
Passing One-way n/a "Two-way" or One-way"
Vessel Manoeuvrability Poor n/a "Poor" = tankers/bulk carriers PIANC, 2014
"Moderate" = container vessels/car carriers/RoRo vessels/LNG&LPG vessels PIANC, 2014
"Good" = twin propeller ships/ferries/cruise vessels PIANC, 2014
(a) Vessel Speed (Vs) 7.5 knots "average" speed profile, varies from 7.5kts at Buoy 3/6 to 7.3kts at Buoy 7 OMC, 2015
(b) Prevailing cross wind (Vcw) 20 knots "Mild" Vcw<15 knots, "Moderate" 15 knots <=Vcw<33 knots, "Strong" Vcw>33 knots Marsden Point, 5% annual exceedance wind speed 10m/s, MetOcean Solutions measured data
(c) Prevailing cross current (Vcc) 0.3 knots "Negligible" Vcc<0.2 knots, "Low" 0.2 knots<=Vcc<0.5 knots, "Moderate" 0.5 knots<=Vcc<1.5
knots, "Strong" Vcc>=1.5 knots
Max. ebb or flood current velocity +/-1hr from HW, Auckland Ports ADCP Data 2015
(d) Prevailing longitudinal current (Vlc) 1.3 knots "Low" VlC<1.5 knots, "Moderate" 1.5 knots<=VlC<3 knots, "Strong" VlC>=3 knots Max. ebb or flood current velocity +/-1hr from HW, Auckland Ports ADCP Data 2015
(e) Beam and stern quartering wave height (Hs) 0.9 m "Hs<=1m", "1m<Hs<3m", "Hs>=3m" OMC, 2015 99th percentile swell data
(f) Aids to Navigation Good n/a "Excellent" = paired lighted buoys with radar deflectors/lighted leading lines with availability
of Pilots, DGPS and Electronic Chart Display and Information System (ECDIS)
PIANC, 2014
"Good" = paired lighted buoys with radar deflectors/lighted leading lines with availability of
Pilots and DGPS
PIANC, 2014
"Moderate" = anything less than the facilities mentioned above PIANC, 2014
(g) Bottom Surface smooth and soft n/a "smooth and soft" or "rough and hard" PIANC, 2014
(h) Depth of waterway (h) 19.19 m at Mean High Water Neap tide (MHWN)
Depth to Draft Ratio (h/T) 1.13 n/a
Channel slope sloping channel edges and shoals n/a "gentle underwater channel slope (1:10 or less steep)" or "sloping channel edges and shoals"
or "steep and hard embankments, structures"
PIANC, 2014
CHANNEL WIDTH CALCULATION
Parameter Beam (B) Multiplier Category Comment Source
Basic Manoeuvring Lane (WBM) 1.8 Poor "Good" = 1.3B, "Moderate" = 1.5B, "Poor" = 1.8B (Table 3.4) PIANC, 2014
(a) Vessel Speed (Vs) 0.0 Slow "Fast" Vs>12 = 0.1B, "Moderate" 8<Vs<12 = 0.0B, "Slow" 5<Vs<8 = 0.0B (Table 3.5(a)) PIANC, 2014
(b) Prevailing cross wind (Vcw) 0.6 Moderate See Table 3.5(b) PIANC, 2014
(c) Prevailing cross current (Vcc) [Outer Channel] 0.3 Low See Table 3.5(c) PIANC, 2014
(c) Prevailing cross current (Vcc) [Inner Channel] 0.3 Low See Table 3.5(c) PIANC, 2014
(d) Prevailing longitudinal current (Vlc) 0.0 Low See Table 3.5(d) PIANC, 2014
(e) Beam and stern quartering wave height (Hs) 0.0 Hs<=1 Hs<=1m = 0.0B, 1m<Hs<3m = 0.5B, Hs>=3m = 1.0B (Table 3.5(e)) PIANC, 2014
(f) Aids to Navigation 0.2 Good See Table 3.5(f) PIANC, 2014
(g) Bottom Surface 0.1 h<1.5T See Table 3.5(g) PIANC, 2014
(h) Depth of waterway (h) [Outer Channel] 0.2 h<1.25T See Table 3.5(h) PIANC, 2014
(h) Depth of waterway (h) [Inner Channel] 0.4 h<1.15T See Table 3.5(h) PIANC, 2014
Width for Bank Clearance (WB) 0.3 sloping channel edges and shoals See Table 3.6 PIANC, 2014
Additional Width for Channel Passing (Wp) 0.0 Not Required See Table 3.7 PIANC, 2014
Total Channel Width [Outer Channel] 3.8 B
Total Channel Width [Outer Channel] 190 m
Total Channel Width [Inner Channel] 4.0 B
Total Channel Width [Inner Channel] 200 m
Page 56
PIANC (2014) CHANNEL WIDTH ASSESSMENT
OPTION 2 CHANNEL DESIGN
REACH 4: Buoy 7 to Buoy 14
INPUT DATA
Parameter Value Unit Comment Source
Vessel Type Tanker n/a
Vessel Size Class Suezmax n/a OMC, 2015
Vessel Dead Weight Tonnage (DWT) 159,057 tonnes OMC, 2015
Vessel Beam (B) 50 m OMC, 2015
Vessel Length Overall (LOA) 276 m OMC, 2015
Vessel Length Between Perpendiculars (LBP) 264 m OMC, 2015
Vessel Draft (T) 17.02 m summer draft OMC, 2015
Channel Design Level -16.86 m CD 95% Access, minimum channel design level in Reach 4 OMC, 2015
Mean High Water Neap (MHWN) tide level 2.32 m CD Tonkin & Taylor, 2015
Channel Type Inner Channel n/a "Outer Channel" = open water, "Inner Channel" = protected water PIANC, 2014
Passing One-way n/a "Two-way" or One-way"
Vessel Manoeuvrability Poor n/a "Poor" = tankers/bulk carriers PIANC, 2014
"Moderate" = container vessels/car carriers/RoRo vessels/LNG&LPG vessels PIANC, 2014
"Good" = twin propeller ships/ferries/cruise vessels PIANC, 2014
(a) Vessel Speed (Vs) 7.3 knots "average" speed profile, varies from 7.3kts at Buoy 7 to 6.8kts at Buoy 14 OMC, 2015
(b) Prevailing cross wind (Vcw) 20 knots "Mild" Vcw<15 knots, "Moderate" 15 knots <=Vcw<33 knots, "Strong" Vcw>33 knots Marsden Point, 5% annual exceedance wind speed 10m/s, MetOcean Solutions measured data
(c) Prevailing cross current (Vcc) 0.5 knots "Negligible" Vcc<0.2 knots, "Low" 0.2 knots<=Vcc<0.5 knots, "Moderate" 0.5 knots<=Vcc<1.5
knots, "Strong" Vcc>=1.5 knots
Max. ebb or flood current velocity +/-1hr from HW, Auckland Ports ADCP Data 2015
(d) Prevailing longitudinal current (Vlc) 1.5 knots "Low" VlC<1.5 knots, "Moderate" 1.5 knots<=VlC<3 knots, "Strong" VlC>=3 knots Max. ebb or flood current velocity +/-1hr from HW, Auckland Ports ADCP Data 2015
(e) Beam and stern quartering wave height (Hs) 0.6 m "Hs<=1m", "1m<Hs<3m", "Hs>=3m" OMC, 2015 99th percentile swell data
(f) Aids to Navigation Good n/a "Excellent" = paired lighted buoys with radar deflectors/lighted leading lines with availability
of Pilots, DGPS and Electronic Chart Display and Information System (ECDIS)
PIANC, 2014
"Good" = paired lighted buoys with radar deflectors/lighted leading lines with availability of
Pilots and DGPS
PIANC, 2014
"Moderate" = anything less than the facilities mentioned above PIANC, 2014
(g) Bottom Surface smooth and soft n/a "smooth and soft" or "rough and hard" PIANC, 2014
(h) Depth of waterway (h) 19.18 m at Mean High Water Neap tide (MHWN)
Depth to Draft Ratio (h/T) 1.13 n/a
Channel slope sloping channel edges and shoals n/a "gentle underwater channel slope (1:10 or less steep)" or "sloping channel edges and shoals"
or "steep and hard embankments, structures"
PIANC, 2014
CHANNEL WIDTH CALCULATION
Parameter Beam (B) Multiplier Category Comment Source
Basic Manoeuvring Lane (WBM) 1.8 Poor "Good" = 1.3B, "Moderate" = 1.5B, "Poor" = 1.8B (Table 3.4) PIANC, 2014
(a) Vessel Speed (Vs) 0.0 Slow "Fast" Vs>12 = 0.1B, "Moderate" 8<Vs<12 = 0.0B, "Slow" 5<Vs<8 = 0.0B (Table 3.5(a)) PIANC, 2014
(b) Prevailing cross wind (Vcw) 0.6 Moderate See Table 3.5(b) PIANC, 2014
(c) Prevailing cross current (Vcc) [Outer Channel] 0.3 Low See Table 3.5(c) PIANC, 2014
(c) Prevailing cross current (Vcc) [Inner Channel] 0.3 Low See Table 3.5(c) PIANC, 2014
(d) Prevailing longitudinal current (Vlc) 0.2 Moderate See Table 3.5(d) PIANC, 2014
(e) Beam and stern quartering wave height (Hs) 0.0 Hs<=1 Hs<=1m = 0.0B, 1m<Hs<3m = 0.5B, Hs>=3m = 1.0B (Table 3.5(e)) PIANC, 2014
(f) Aids to Navigation 0.2 Good See Table 3.5(f) PIANC, 2014
(g) Bottom Surface 0.1 h<1.5T See Table 3.5(g) PIANC, 2014
(h) Depth of waterway (h) [Outer Channel] 0.2 h<1.25T See Table 3.5(h) PIANC, 2014
(h) Depth of waterway (h) [Inner Channel] 0.4 h<1.15T See Table 3.5(h) PIANC, 2014
Width for Bank Clearance (WB) 0.3 sloping channel edges and shoals See Table 3.6 PIANC, 2014
Additional Width for Channel Passing (Wp) 0.0 Not Required See Table 3.7 PIANC, 2014
Total Channel Width [Outer Channel] 4.0 B
Total Channel Width [Outer Channel] 200 m
Total Channel Width [Inner Channel] 4.2 B
Total Channel Width [Inner Channel] 210 m
Page 57
PIANC (2014) CHANNEL WIDTH ASSESSMENT
OPTION 2 CHANNEL DESIGN
REACH 5: Buoy 14 to Buoy 16
INPUT DATA
Parameter Value Unit Comment Source
Vessel Type Tanker n/a
Vessel Size Class Suezmax n/a OMC, 2015
Vessel Dead Weight Tonnage (DWT) 159,057 tonnes OMC, 2015
Vessel Beam (B) 50 m OMC, 2015
Vessel Length Overall (LOA) 276 m OMC, 2015
Vessel Length Between Perpendiculars (LBP) 264 m OMC, 2015
Vessel Draft (T) 17.02 m summer draft OMC, 2015
Channel Design Level -16.69 m CD 95% Access, minimum channel design level in Reach 5 OMC, 2015
Mean High Water Neap (MHWN) tide level 2.32 m CD Tonkin & Taylor, 2015
Channel Type Inner Channel n/a "Outer Channel" = open water, "Inner Channel" = protected water PIANC, 2014
Passing One-way n/a "Two-way" or One-way"
Vessel Manoeuvrability Poor n/a "Poor" = tankers/bulk carriers PIANC, 2014
"Moderate" = container vessels/car carriers/RoRo vessels/LNG&LPG vessels PIANC, 2014
"Good" = twin propeller ships/ferries/cruise vessels PIANC, 2014
(a) Vessel Speed (Vs) 6.8 knots "average" speed profile, varies from 6.8kts at Buoy 14 to 5.8kts at Buoy 16 OMC, 2015
(b) Prevailing cross wind (Vcw) 20 knots "Mild" Vcw<15 knots, "Moderate" 15 knots <=Vcw<33 knots, "Strong" Vcw>33 knots Marsden Point, 5% annual exceedance wind speed 10m/s, MetOcean Solutions measured data
(c) Prevailing cross current (Vcc) 0.7 knots "Negligible" Vcc<0.2 knots, "Low" 0.2 knots<=Vcc<0.5 knots, "Moderate" 0.5 knots<=Vcc<1.5
knots, "Strong" Vcc>=1.5 knots
Max. ebb or flood current velocity +/-1hr from HW, Auckland Ports ADCP Data 2015
(d) Prevailing longitudinal current (Vlc) 1.5 knots "Low" VlC<1.5 knots, "Moderate" 1.5 knots<=VlC<3 knots, "Strong" VlC>=3 knots Max. ebb or flood current velocity +/-1hr from HW, Auckland Ports ADCP Data 2015
(e) Beam and stern quartering wave height (Hs) 0.6 m "Hs<=1m", "1m<Hs<3m", "Hs>=3m" OMC, 2015 99th percentile swell data
(f) Aids to Navigation Good n/a "Excellent" = paired lighted buoys with radar deflectors/lighted leading lines with availability
of Pilots, DGPS and Electronic Chart Display and Information System (ECDIS)
PIANC, 2014
"Good" = paired lighted buoys with radar deflectors/lighted leading lines with availability of
Pilots and DGPS
PIANC, 2014
"Moderate" = anything less than the facilities mentioned above PIANC, 2014
(g) Bottom Surface smooth and soft n/a "smooth and soft" or "rough and hard" PIANC, 2014
(h) Depth of waterway (h) 19.01 m at Mean High Water Neap tide (MHWN)
Depth to Draft Ratio (h/T) 1.12 n/a
Channel slope sloping channel edges and shoals n/a "gentle underwater channel slope (1:10 or less steep)" or "sloping channel edges and shoals"
or "steep and hard embankments, structures"
PIANC, 2014
CHANNEL WIDTH CALCULATION
Parameter Beam (B) Multiplier Category Comment Source
Basic Manoeuvring Lane (WBM) 1.8 Poor "Good" = 1.3B, "Moderate" = 1.5B, "Poor" = 1.8B (Table 3.4) PIANC, 2014
(a) Vessel Speed (Vs) 0.0 Slow "Fast" Vs>12 = 0.1B, "Moderate" 8<Vs<12 = 0.0B, "Slow" 5<Vs<8 = 0.0B (Table 3.5(a)) PIANC, 2014
(b) Prevailing cross wind (Vcw) 0.6 Moderate See Table 3.5(b) PIANC, 2014
(c) Prevailing cross current (Vcc) [Outer Channel] 1.0 Moderate See Table 3.5(c) PIANC, 2014
(c) Prevailing cross current (Vcc) [Inner Channel] 0.8 Moderate See Table 3.5(c) PIANC, 2014
(d) Prevailing longitudinal current (Vlc) 0.2 Moderate See Table 3.5(d) PIANC, 2014
(e) Beam and stern quartering wave height (Hs) 0.0 Hs<=1 Hs<=1m = 0.0B, 1m<Hs<3m = 0.5B, Hs>=3m = 1.0B (Table 3.5(e)) PIANC, 2014
(f) Aids to Navigation 0.2 Good See Table 3.5(f) PIANC, 2014
(g) Bottom Surface 0.1 h<1.5T See Table 3.5(g) PIANC, 2014
(h) Depth of waterway (h) [Outer Channel] 0.2 h<1.25T See Table 3.5(h) PIANC, 2014
(h) Depth of waterway (h) [Inner Channel] 0.4 h<1.15T See Table 3.5(h) PIANC, 2014
Width for Bank Clearance (WB) 0.3 sloping channel edges and shoals See Table 3.6 PIANC, 2014
Additional Width for Channel Passing (Wp) 0.0 Not Required See Table 3.7 PIANC, 2014
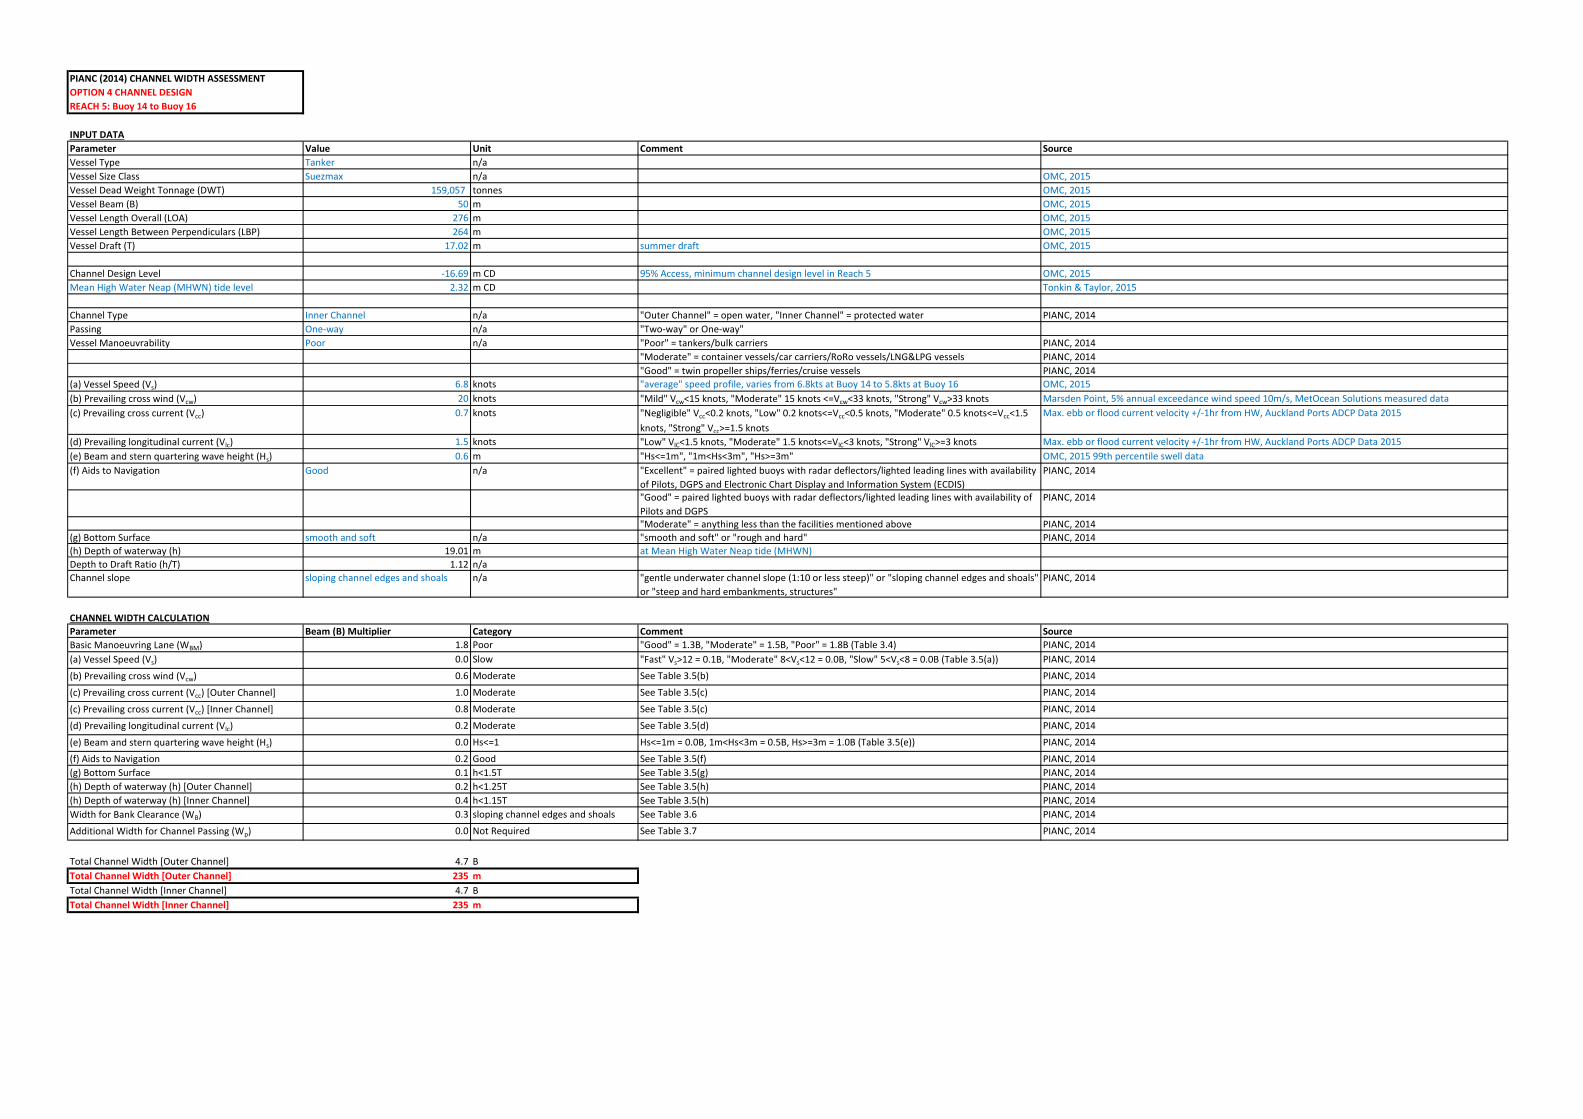
Total Channel Width [Outer Channel] 4.7 B
Total Channel Width [Outer Channel] 235 m
Total Channel Width [Inner Channel] 4.7 B
Total Channel Width [Inner Channel] 235 m
Page 58
PIANC (2014) CHANNEL WIDTH ASSESSMENT
OPTION 2 CHANNEL DESIGN
REACH 6: Buoy 16 to Buoy 17
INPUT DATA
Parameter Value Unit Comment Source
Vessel Type Tanker n/a
Vessel Size Class Suezmax n/a OMC, 2015
Vessel Dead Weight Tonnage (DWT) 159,057 tonnes OMC, 2015
Vessel Beam (B) 50 m OMC, 2015
Vessel Length Overall (LOA) 276 m OMC, 2015
Vessel Length Between Perpendiculars (LBP) 264 m OMC, 2015
Vessel Draft (T) 17.02 m summer draft OMC, 2015
Channel Design Level -16.31 m CD 95% Access, minimum channel design level in Reach 6 OMC, 2015
Mean High Water Neap (MHWN) tide level 2.32 m CD Tonkin & Taylor, 2015
Channel Type Inner Channel n/a "Outer Channel" = open water, "Inner Channel" = protected water PIANC, 2014
Passing One-way n/a "Two-way" or One-way"
Vessel Manoeuvrability Poor n/a "Poor" = tankers/bulk carriers PIANC, 2014
"Moderate" = container vessels/car carriers/RoRo vessels/LNG&LPG vessels PIANC, 2014
"Good" = twin propeller ships/ferries/cruise vessels PIANC, 2014
(a) Vessel Speed (Vs) 5.8 knots "average" speed profile, varies from 5.8kts at Buoy 16 to 2kts at Buoy 17 OMC, 2015
(b) Prevailing cross wind (Vcw) 20 knots "Mild" Vcw<15 knots, "Moderate" 15 knots <=Vcw<33 knots, "Strong" Vcw>33 knots Marsden Point, 5% annual exceedance wind speed 10m/s, MetOcean Solutions measured data
(c) Prevailing cross current (Vcc) 0.7 knots "Negligible" Vcc<0.2 knots, "Low" 0.2 knots<=Vcc<0.5 knots, "Moderate" 0.5 knots<=Vcc<1.5
knots, "Strong" Vcc>=1.5 knots
Max. ebb or flood current velocity +/-1hr from HW, Auckland Ports ADCP Data 2015
(d) Prevailing longitudinal current (Vlc) 1.5 knots "Low" VlC<1.5 knots, "Moderate" 1.5 knots<=VlC<3 knots, "Strong" VlC>=3 knots Max. ebb or flood current velocity +/-1hr from HW, Auckland Ports ADCP Data 2015
(e) Beam and stern quartering wave height (Hs) 0.6 m "Hs<=1m", "1m<Hs<3m", "Hs>=3m" OMC, 2015 99th percentile swell data
(f) Aids to Navigation Good n/a "Excellent" = paired lighted buoys with radar deflectors/lighted leading lines with availability
of Pilots, DGPS and Electronic Chart Display and Information System (ECDIS)
PIANC, 2014
"Good" = paired lighted buoys with radar deflectors/lighted leading lines with availability of
Pilots and DGPS
PIANC, 2014
"Moderate" = anything less than the facilities mentioned above PIANC, 2014
(g) Bottom Surface smooth and soft n/a "smooth and soft" or "rough and hard" PIANC, 2014
(h) Depth of waterway (h) 18.63 m at Mean High Water Neap tide (MHWN)
Depth to Draft Ratio (h/T) 1.09 n/a
Channel slope sloping channel edges and shoals n/a "gentle underwater channel slope (1:10 or less steep)" or "sloping channel edges and shoals"
or "steep and hard embankments, structures"
PIANC, 2014
CHANNEL WIDTH CALCULATION
Parameter Beam (B) Multiplier Category Comment Source
Basic Manoeuvring Lane (WBM) 1.8 Poor "Good" = 1.3B, "Moderate" = 1.5B, "Poor" = 1.8B (Table 3.4) PIANC, 2014
(a) Vessel Speed (Vs) 0.0 Slow "Fast" Vs>12 = 0.1B, "Moderate" 8<Vs<12 = 0.0B, "Slow" 5<Vs<8 = 0.0B (Table 3.5(a)) PIANC, 2014
(b) Prevailing cross wind (Vcw) 0.6 Moderate See Table 3.5(b) PIANC, 2014
(c) Prevailing cross current (Vcc) [Outer Channel] 1.0 Moderate See Table 3.5(c) PIANC, 2014
(c) Prevailing cross current (Vcc) [Inner Channel] 0.8 Moderate See Table 3.5(c) PIANC, 2014
(d) Prevailing longitudinal current (Vlc) 0.2 Moderate See Table 3.5(d) PIANC, 2014
(e) Beam and stern quartering wave height (Hs) 0.0 Hs<=1 Hs<=1m = 0.0B, 1m<Hs<3m = 0.5B, Hs>=3m = 1.0B (Table 3.5(e)) PIANC, 2014
(f) Aids to Navigation 0.2 Good See Table 3.5(f) PIANC, 2014
(g) Bottom Surface 0.1 h<1.5T See Table 3.5(g) PIANC, 2014
(h) Depth of waterway (h) [Outer Channel] 0.2 h<1.25T See Table 3.5(h) PIANC, 2014
(h) Depth of waterway (h) [Inner Channel] 0.4 h<1.15T See Table 3.5(h) PIANC, 2014
Width for Bank Clearance (WB) 0.3 sloping channel edges and shoals See Table 3.6 PIANC, 2014
Additional Width for Channel Passing (Wp) 0.0 Not Required See Table 3.7 PIANC, 2014
Total Channel Width [Outer Channel] 4.7 B
Total Channel Width [Outer Channel] 235 m
Total Channel Width [Inner Channel] 4.7 B
Total Channel Width [Inner Channel] 235 m
Page 59
BEND GEOMETRY
OPTION 2 CHANNEL DESIGN
Bend No. Entry Channel Heading Exit Channel Heading Bearing Change (S) Vessel Beam Vessel LOA Bend Radius* Entry Channel Width Draft Angle Width^ Response Time Width" Bend Width Exit Channel Width
(deg. from North) (deg. from North) (m) (m) (m) (m) (m) (m) (m) (m)
1 321 345 24 50 276 1400 215 12.1 20.0 245 200
2 345 369 24 50 276 1400 200 12.1 20.0 230 200
3 369 309 60 50 276 800 200 21.2 20.0 275 235
* 5 x LOA recommended, Table 3.8 PIANC 2014
^ Eqn. 3-5 PIANC 2014
" Eqn. 3-6 PIANC 2014
Page 60
PIANC (2014) CHANNEL WIDTH ASSESSMENT
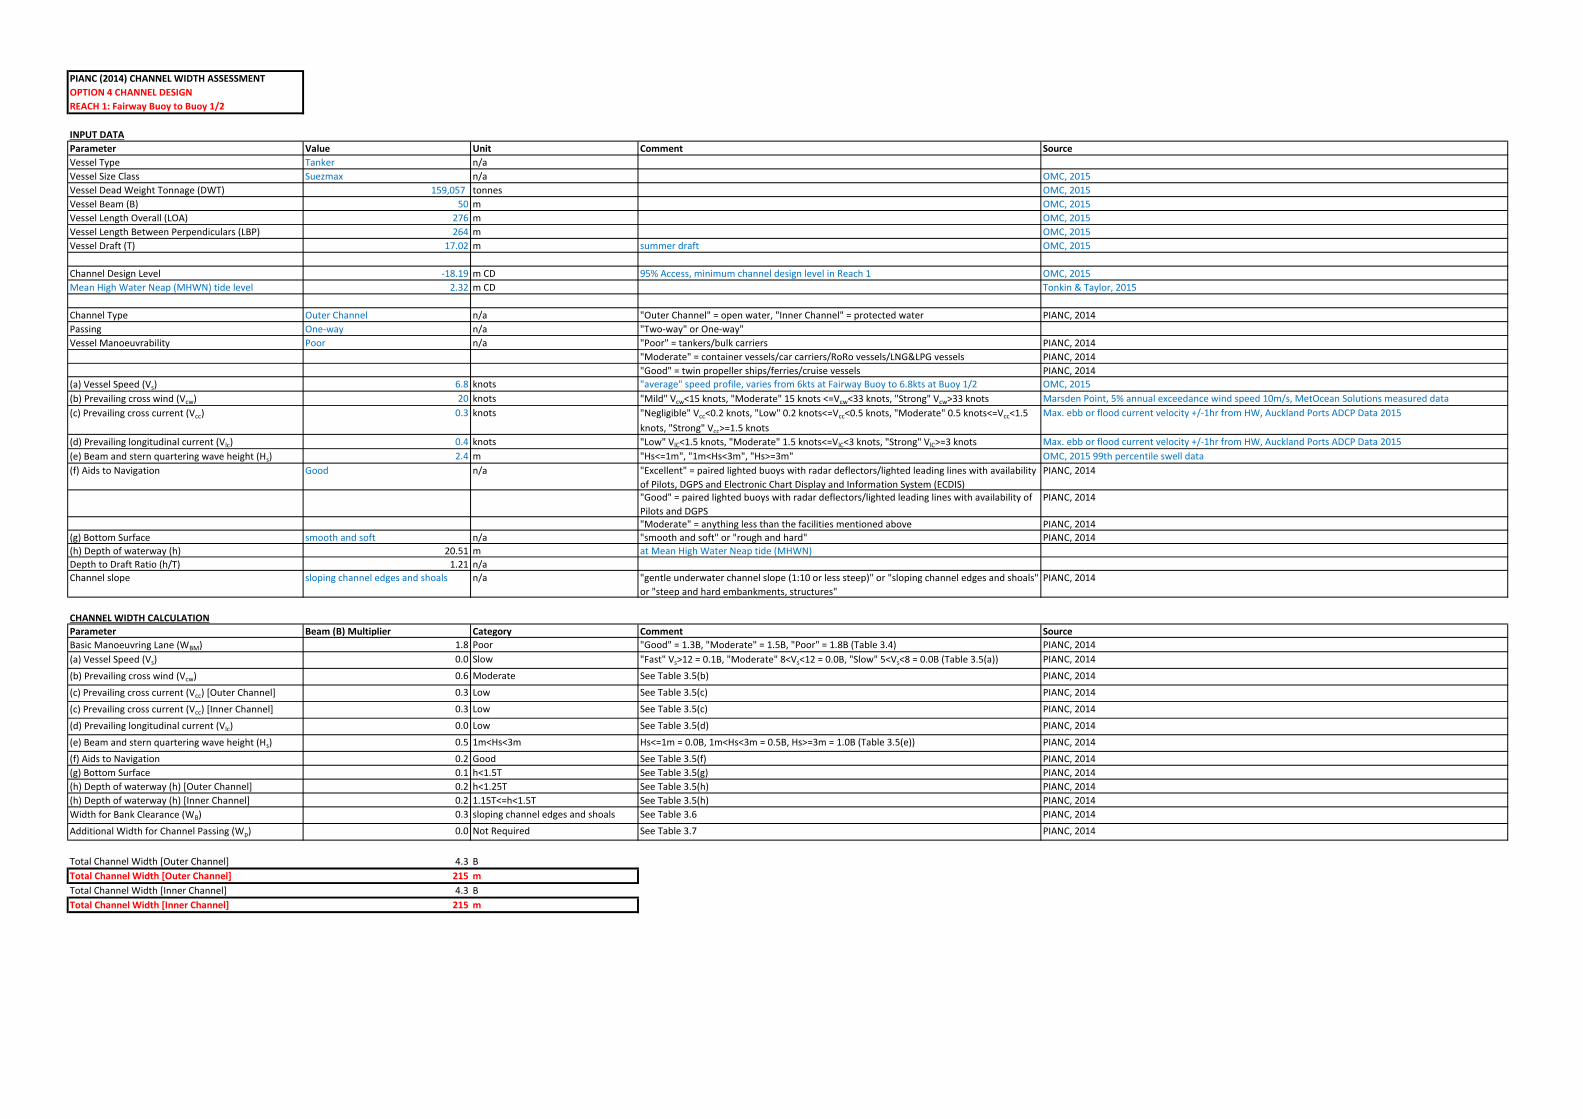
OPTION 4 CHANNEL DESIGN
REACH 1: Fairway Buoy to Buoy 1/2
INPUT DATA
Parameter Value Unit Comment Source
Vessel Type Tanker n/a
Vessel Size Class Suezmax n/a OMC, 2015
Vessel Dead Weight Tonnage (DWT) 159,057 tonnes OMC, 2015
Vessel Beam (B) 50 m OMC, 2015
Vessel Length Overall (LOA) 276 m OMC, 2015
Vessel Length Between Perpendiculars (LBP) 264 m OMC, 2015
Vessel Draft (T) 17.02 m summer draft OMC, 2015
Channel Design Level -18.19 m CD 95% Access, minimum channel design level in Reach 1 OMC, 2015
Mean High Water Neap (MHWN) tide level 2.32 m CD Tonkin & Taylor, 2015
Channel Type Outer Channel n/a "Outer Channel" = open water, "Inner Channel" = protected water PIANC, 2014
Passing One-way n/a "Two-way" or One-way"
Vessel Manoeuvrability Poor n/a "Poor" = tankers/bulk carriers PIANC, 2014
"Moderate" = container vessels/car carriers/RoRo vessels/LNG&LPG vessels PIANC, 2014
"Good" = twin propeller ships/ferries/cruise vessels PIANC, 2014
(a) Vessel Speed (Vs) 6.8 knots "average" speed profile, varies from 6kts at Fairway Buoy to 6.8kts at Buoy 1/2 OMC, 2015
(b) Prevailing cross wind (Vcw) 20 knots "Mild" Vcw<15 knots, "Moderate" 15 knots <=Vcw<33 knots, "Strong" Vcw>33 knots Marsden Point, 5% annual exceedance wind speed 10m/s, MetOcean Solutions measured data
(c) Prevailing cross current (Vcc) 0.3 knots "Negligible" Vcc<0.2 knots, "Low" 0.2 knots<=Vcc<0.5 knots, "Moderate" 0.5 knots<=Vcc<1.5
knots, "Strong" Vcc>=1.5 knots
Max. ebb or flood current velocity +/-1hr from HW, Auckland Ports ADCP Data 2015
(d) Prevailing longitudinal current (Vlc) 0.4 knots "Low" VlC<1.5 knots, "Moderate" 1.5 knots<=VlC<3 knots, "Strong" VlC>=3 knots Max. ebb or flood current velocity +/-1hr from HW, Auckland Ports ADCP Data 2015
(e) Beam and stern quartering wave height (Hs) 2.4 m "Hs<=1m", "1m<Hs<3m", "Hs>=3m" OMC, 2015 99th percentile swell data
(f) Aids to Navigation Good n/a "Excellent" = paired lighted buoys with radar deflectors/lighted leading lines with availability
of Pilots, DGPS and Electronic Chart Display and Information System (ECDIS)
PIANC, 2014
"Good" = paired lighted buoys with radar deflectors/lighted leading lines with availability of
Pilots and DGPS
PIANC, 2014
"Moderate" = anything less than the facilities mentioned above PIANC, 2014
(g) Bottom Surface smooth and soft n/a "smooth and soft" or "rough and hard" PIANC, 2014
(h) Depth of waterway (h) 20.51 m at Mean High Water Neap tide (MHWN)
Depth to Draft Ratio (h/T) 1.21 n/a
Channel slope sloping channel edges and shoals n/a "gentle underwater channel slope (1:10 or less steep)" or "sloping channel edges and shoals"
or "steep and hard embankments, structures"
PIANC, 2014
CHANNEL WIDTH CALCULATION
Parameter Beam (B) Multiplier Category Comment Source
Basic Manoeuvring Lane (WBM) 1.8 Poor "Good" = 1.3B, "Moderate" = 1.5B, "Poor" = 1.8B (Table 3.4) PIANC, 2014
(a) Vessel Speed (Vs) 0.0 Slow "Fast" Vs>12 = 0.1B, "Moderate" 8<Vs<12 = 0.0B, "Slow" 5<Vs<8 = 0.0B (Table 3.5(a)) PIANC, 2014
(b) Prevailing cross wind (Vcw) 0.6 Moderate See Table 3.5(b) PIANC, 2014
(c) Prevailing cross current (Vcc) [Outer Channel] 0.3 Low See Table 3.5(c) PIANC, 2014
(c) Prevailing cross current (Vcc) [Inner Channel] 0.3 Low See Table 3.5(c) PIANC, 2014
(d) Prevailing longitudinal current (Vlc) 0.0 Low See Table 3.5(d) PIANC, 2014
(e) Beam and stern quartering wave height (Hs) 0.5 1m<Hs<3m Hs<=1m = 0.0B, 1m<Hs<3m = 0.5B, Hs>=3m = 1.0B (Table 3.5(e)) PIANC, 2014
(f) Aids to Navigation 0.2 Good See Table 3.5(f) PIANC, 2014
(g) Bottom Surface 0.1 h<1.5T See Table 3.5(g) PIANC, 2014
(h) Depth of waterway (h) [Outer Channel] 0.2 h<1.25T See Table 3.5(h) PIANC, 2014
(h) Depth of waterway (h) [Inner Channel] 0.2 1.15T<=h<1.5T See Table 3.5(h) PIANC, 2014
Width for Bank Clearance (WB) 0.3 sloping channel edges and shoals See Table 3.6 PIANC, 2014
Additional Width for Channel Passing (Wp) 0.0 Not Required See Table 3.7 PIANC, 2014
Total Channel Width [Outer Channel] 4.3 B
Total Channel Width [Outer Channel] 215 m
Total Channel Width [Inner Channel] 4.3 B
Total Channel Width [Inner Channel] 215 m
Page 61
PIANC (2014) CHANNEL WIDTH ASSESSMENT
OPTION 4 CHANNEL DESIGN
REACH 2: Buoy 1/2 to Buoy 3/6
INPUT DATA
Parameter Value Unit Comment Source
Vessel Type Tanker n/a
Vessel Size Class Suezmax n/a OMC, 2015
Vessel Dead Weight Tonnage (DWT) 159,057 tonnes OMC, 2015
Vessel Beam (B) 50 m OMC, 2015
Vessel Length Overall (LOA) 276 m OMC, 2015
Vessel Length Between Perpendiculars (LBP) 264 m OMC, 2015
Vessel Draft (T) 17.02 m summer draft OMC, 2015
Channel Design Level -17.65 m CD 95% Access, minimum channel design level in Reach 2 OMC, 2015
Mean High Water Neap (MHWN) tide level 2.32 m CD Tonkin & Taylor, 2015
Channel Type Outer Channel n/a "Outer Channel" = open water, "Inner Channel" = protected water PIANC, 2014
Passing One-way n/a "Two-way" or One-way"
Vessel Manoeuvrability Poor n/a "Poor" = tankers/bulk carriers PIANC, 2014
"Moderate" = container vessels/car carriers/RoRo vessels/LNG&LPG vessels PIANC, 2014
"Good" = twin propeller ships/ferries/cruise vessels PIANC, 2014
(a) Vessel Speed (Vs) 7.5 knots "average" speed profile, varies from 6.8kts at Buoy 1/2 to 7.5kts at Buoy 3/6 OMC, 2015
(b) Prevailing cross wind (Vcw) 20 knots "Mild" Vcw<15 knots, "Moderate" 15 knots <=Vcw<33 knots, "Strong" Vcw>33 knots Marsden Point, 5% annual exceedance wind speed 10m/s, MetOcean Solutions measured data
(c) Prevailing cross current (Vcc) 0.3 knots "Negligible" Vcc<0.2 knots, "Low" 0.2 knots<=Vcc<0.5 knots, "Moderate" 0.5 knots<=Vcc<1.5
knots, "Strong" Vcc>=1.5 knots
Max. ebb or flood current velocity +/-1hr from HW, Auckland Ports ADCP Data 2015
(d) Prevailing longitudinal current (Vlc) 0.4 knots "Low" VlC<1.5 knots, "Moderate" 1.5 knots<=VlC<3 knots, "Strong" VlC>=3 knots Max. ebb or flood current velocity +/-1hr from HW, Auckland Ports ADCP Data 2015
(e) Beam and stern quartering wave height (Hs) 1.9 m "Hs<=1m", "1m<Hs<3m", "Hs>=3m" OMC, 2015 99th percentile swell data
(f) Aids to Navigation Good n/a "Excellent" = paired lighted buoys with radar deflectors/lighted leading lines with availability
of Pilots, DGPS and Electronic Chart Display and Information System (ECDIS)
PIANC, 2014
"Good" = paired lighted buoys with radar deflectors/lighted leading lines with availability of
Pilots and DGPS
PIANC, 2014
"Moderate" = anything less than the facilities mentioned above PIANC, 2014
(g) Bottom Surface smooth and soft n/a "smooth and soft" or "rough and hard" PIANC, 2014
(h) Depth of waterway (h) 19.97 m at Mean High Water Neap tide (MHWN)
Depth to Draft Ratio (h/T) 1.17 n/a
Channel slope sloping channel edges and shoals n/a "gentle underwater channel slope (1:10 or less steep)" or "sloping channel edges and shoals"
or "steep and hard embankments, structures"
PIANC, 2014
CHANNEL WIDTH CALCULATION
Parameter Beam (B) Multiplier Category Comment Source
Basic Manoeuvring Lane (WBM) 1.8 Poor "Good" = 1.3B, "Moderate" = 1.5B, "Poor" = 1.8B (Table 3.4) PIANC, 2014
(a) Vessel Speed (Vs) 0.0 Slow "Fast" Vs>12 = 0.1B, "Moderate" 8<Vs<12 = 0.0B, "Slow" 5<Vs<8 = 0.0B (Table 3.5(a)) PIANC, 2014
(b) Prevailing cross wind (Vcw) 0.6 Moderate See Table 3.5(b) PIANC, 2014
(c) Prevailing cross current (Vcc) [Outer Channel] 0.3 Low See Table 3.5(c) PIANC, 2014
(c) Prevailing cross current (Vcc) [Inner Channel] 0.3 Low See Table 3.5(c) PIANC, 2014
(d) Prevailing longitudinal current (Vlc) 0.0 Low See Table 3.5(d) PIANC, 2014
(e) Beam and stern quartering wave height (Hs) 0.5 1m<Hs<3m Hs<=1m = 0.0B, 1m<Hs<3m = 0.5B, Hs>=3m = 1.0B (Table 3.5(e)) PIANC, 2014
(f) Aids to Navigation 0.2 Good See Table 3.5(f) PIANC, 2014
(g) Bottom Surface 0.1 h<1.5T See Table 3.5(g) PIANC, 2014
(h) Depth of waterway (h) [Outer Channel] 0.2 h<1.25T See Table 3.5(h) PIANC, 2014
(h) Depth of waterway (h) [Inner Channel] 0.2 1.15T<=h<1.5T See Table 3.5(h) PIANC, 2014
Width for Bank Clearance (WB) 0.3 sloping channel edges and shoals See Table 3.6 PIANC, 2014
Additional Width for Channel Passing (Wp) 0.0 Not Required See Table 3.7 PIANC, 2014
Total Channel Width [Outer Channel] 4.3 B
Total Channel Width [Outer Channel] 215 m
Total Channel Width [Inner Channel] 4.3 B
Total Channel Width [Inner Channel] 215 m
Page 62
PIANC (2014) CHANNEL WIDTH ASSESSMENT
OPTION 4 CHANNEL DESIGN
REACH 3: Buoy 3/6 to Buoy 7
INPUT DATA
Parameter Value Unit Comment Source
Vessel Type Tanker n/a
Vessel Size Class Suezmax n/a OMC, 2015
Vessel Dead Weight Tonnage (DWT) 159,057 tonnes OMC, 2015
Vessel Beam (B) 50 m OMC, 2015
Vessel Length Overall (LOA) 276 m OMC, 2015
Vessel Length Between Perpendiculars (LBP) 264 m OMC, 2015
Vessel Draft (T) 17.02 m summer draft OMC, 2015
Channel Design Level -16.87 m CD 95% Access, minimum channel design level in Reach 3 OMC, 2015
Mean High Water Neap (MHWN) tide level 2.32 m CD Tonkin & Taylor, 2015
Channel Type Outer Channel n/a "Outer Channel" = open water, "Inner Channel" = protected water PIANC, 2014
Passing One-way n/a "Two-way" or One-way"
Vessel Manoeuvrability Poor n/a "Poor" = tankers/bulk carriers PIANC, 2014
"Moderate" = container vessels/car carriers/RoRo vessels/LNG&LPG vessels PIANC, 2014
"Good" = twin propeller ships/ferries/cruise vessels PIANC, 2014
(a) Vessel Speed (Vs) 7.5 knots "average" speed profile, varies from 7.5kts at Buoy 3/6 to 7.3kts at Buoy 7 OMC, 2015
(b) Prevailing cross wind (Vcw) 20 knots "Mild" Vcw<15 knots, "Moderate" 15 knots <=Vcw<33 knots, "Strong" Vcw>33 knots Marsden Point, 5% annual exceedance wind speed 10m/s, MetOcean Solutions measured data
(c) Prevailing cross current (Vcc) 0.7 knots "Negligible" Vcc<0.2 knots, "Low" 0.2 knots<=Vcc<0.5 knots, "Moderate" 0.5 knots<=Vcc<1.5
knots, "Strong" Vcc>=1.5 knots
Max. ebb or flood current velocity +/-1hr from HW, Auckland Ports ADCP Data 2015
(d) Prevailing longitudinal current (Vlc) 1.3 knots "Low" VlC<1.5 knots, "Moderate" 1.5 knots<=VlC<3 knots, "Strong" VlC>=3 knots Max. ebb or flood current velocity +/-1hr from HW, Auckland Ports ADCP Data 2015
(e) Beam and stern quartering wave height (Hs) 0.9 m "Hs<=1m", "1m<Hs<3m", "Hs>=3m" OMC, 2015 99th percentile swell data
(f) Aids to Navigation Good n/a "Excellent" = paired lighted buoys with radar deflectors/lighted leading lines with availability
of Pilots, DGPS and Electronic Chart Display and Information System (ECDIS)
PIANC, 2014
"Good" = paired lighted buoys with radar deflectors/lighted leading lines with availability of
Pilots and DGPS
PIANC, 2014
"Moderate" = anything less than the facilities mentioned above PIANC, 2014
(g) Bottom Surface smooth and soft n/a "smooth and soft" or "rough and hard" PIANC, 2014
(h) Depth of waterway (h) 19.19 m at Mean High Water Neap tide (MHWN)
Depth to Draft Ratio (h/T) 1.13 n/a
Channel slope sloping channel edges and shoals n/a "gentle underwater channel slope (1:10 or less steep)" or "sloping channel edges and shoals"
or "steep and hard embankments, structures"
PIANC, 2014
CHANNEL WIDTH CALCULATION
Parameter Beam (B) Multiplier Category Comment Source
Basic Manoeuvring Lane (WBM) 1.8 Poor "Good" = 1.3B, "Moderate" = 1.5B, "Poor" = 1.8B (Table 3.4) PIANC, 2014
(a) Vessel Speed (Vs) 0.0 Slow "Fast" Vs>12 = 0.1B, "Moderate" 8<Vs<12 = 0.0B, "Slow" 5<Vs<8 = 0.0B (Table 3.5(a)) PIANC, 2014
(b) Prevailing cross wind (Vcw) 0.6 Moderate See Table 3.5(b) PIANC, 2014
(c) Prevailing cross current (Vcc) [Outer Channel] 1.0 Moderate See Table 3.5(c) PIANC, 2014
(c) Prevailing cross current (Vcc) [Inner Channel] 0.8 Moderate See Table 3.5(c) PIANC, 2014
(d) Prevailing longitudinal current (Vlc) 0.0 Low See Table 3.5(d) PIANC, 2014
(e) Beam and stern quartering wave height (Hs) 0.0 Hs<=1 Hs<=1m = 0.0B, 1m<Hs<3m = 0.5B, Hs>=3m = 1.0B (Table 3.5(e)) PIANC, 2014
(f) Aids to Navigation 0.2 Good See Table 3.5(f) PIANC, 2014
(g) Bottom Surface 0.1 h<1.5T See Table 3.5(g) PIANC, 2014
(h) Depth of waterway (h) [Outer Channel] 0.2 h<1.25T See Table 3.5(h) PIANC, 2014
(h) Depth of waterway (h) [Inner Channel] 0.4 h<1.15T See Table 3.5(h) PIANC, 2014
Width for Bank Clearance (WB) 0.3 sloping channel edges and shoals See Table 3.6 PIANC, 2014
Additional Width for Channel Passing (Wp) 0.0 Not Required See Table 3.7 PIANC, 2014
Total Channel Width [Outer Channel] 4.5 B
Total Channel Width [Outer Channel] 225 m
Total Channel Width [Inner Channel] 4.5 B
Total Channel Width [Inner Channel] 225 m
Page 63
PIANC (2014) CHANNEL WIDTH ASSESSMENT
OPTION 4 CHANNEL DESIGN
REACH 4: Buoy 7 to Buoy 14
INPUT DATA
Parameter Value Unit Comment Source
Vessel Type Tanker n/a
Vessel Size Class Suezmax n/a OMC, 2015
Vessel Dead Weight Tonnage (DWT) 159,057 tonnes OMC, 2015
Vessel Beam (B) 50 m OMC, 2015
Vessel Length Overall (LOA) 276 m OMC, 2015
Vessel Length Between Perpendiculars (LBP) 264 m OMC, 2015
Vessel Draft (T) 17.02 m summer draft OMC, 2015
Channel Design Level -16.86 m CD 95% Access, minimum channel design level in Reach 4 OMC, 2015
Mean High Water Neap (MHWN) tide level 2.32 m CD Tonkin & Taylor, 2015
Channel Type Inner Channel n/a "Outer Channel" = open water, "Inner Channel" = protected water PIANC, 2014
Passing One-way n/a "Two-way" or One-way"
Vessel Manoeuvrability Poor n/a "Poor" = tankers/bulk carriers PIANC, 2014
"Moderate" = container vessels/car carriers/RoRo vessels/LNG&LPG vessels PIANC, 2014
"Good" = twin propeller ships/ferries/cruise vessels PIANC, 2014
(a) Vessel Speed (Vs) 7.3 knots "average" speed profile, varies from 7.3kts at Buoy 7 to 6.8kts at Buoy 14 OMC, 2015
(b) Prevailing cross wind (Vcw) 20 knots "Mild" Vcw<15 knots, "Moderate" 15 knots <=Vcw<33 knots, "Strong" Vcw>33 knots Marsden Point, 5% annual exceedance wind speed 10m/s, MetOcean Solutions measured data
(c) Prevailing cross current (Vcc) 0.3 knots "Negligible" Vcc<0.2 knots, "Low" 0.2 knots<=Vcc<0.5 knots, "Moderate" 0.5 knots<=Vcc<1.5
knots, "Strong" Vcc>=1.5 knots
Max. ebb or flood current velocity +/-1hr from HW, Auckland Ports ADCP Data 2015
(d) Prevailing longitudinal current (Vlc) 1.5 knots "Low" VlC<1.5 knots, "Moderate" 1.5 knots<=VlC<3 knots, "Strong" VlC>=3 knots Max. ebb or flood current velocity +/-1hr from HW, Auckland Ports ADCP Data 2015
(e) Beam and stern quartering wave height (Hs) 0.6 m "Hs<=1m", "1m<Hs<3m", "Hs>=3m" OMC, 2015 99th percentile swell data
(f) Aids to Navigation Good n/a "Excellent" = paired lighted buoys with radar deflectors/lighted leading lines with availability
of Pilots, DGPS and Electronic Chart Display and Information System (ECDIS)
PIANC, 2014
"Good" = paired lighted buoys with radar deflectors/lighted leading lines with availability of
Pilots and DGPS
PIANC, 2014
"Moderate" = anything less than the facilities mentioned above PIANC, 2014
(g) Bottom Surface smooth and soft n/a "smooth and soft" or "rough and hard" PIANC, 2014
(h) Depth of waterway (h) 19.18 m at Mean High Water Neap tide (MHWN)
Depth to Draft Ratio (h/T) 1.13 n/a
Channel slope sloping channel edges and shoals n/a "gentle underwater channel slope (1:10 or less steep)" or "sloping channel edges and shoals"
or "steep and hard embankments, structures"
PIANC, 2014
CHANNEL WIDTH CALCULATION
Parameter Beam (B) Multiplier Category Comment Source
Basic Manoeuvring Lane (WBM) 1.8 Poor "Good" = 1.3B, "Moderate" = 1.5B, "Poor" = 1.8B (Table 3.4) PIANC, 2014
(a) Vessel Speed (Vs) 0.0 Slow "Fast" Vs>12 = 0.1B, "Moderate" 8<Vs<12 = 0.0B, "Slow" 5<Vs<8 = 0.0B (Table 3.5(a)) PIANC, 2014
(b) Prevailing cross wind (Vcw) 0.6 Moderate See Table 3.5(b) PIANC, 2014
(c) Prevailing cross current (Vcc) [Outer Channel] 0.3 Low See Table 3.5(c) PIANC, 2014
(c) Prevailing cross current (Vcc) [Inner Channel] 0.3 Low See Table 3.5(c) PIANC, 2014
(d) Prevailing longitudinal current (Vlc) 0.2 Moderate See Table 3.5(d) PIANC, 2014
(e) Beam and stern quartering wave height (Hs) 0.0 Hs<=1 Hs<=1m = 0.0B, 1m<Hs<3m = 0.5B, Hs>=3m = 1.0B (Table 3.5(e)) PIANC, 2014
(f) Aids to Navigation 0.2 Good See Table 3.5(f) PIANC, 2014
(g) Bottom Surface 0.1 h<1.5T See Table 3.5(g) PIANC, 2014
(h) Depth of waterway (h) [Outer Channel] 0.2 h<1.25T See Table 3.5(h) PIANC, 2014
(h) Depth of waterway (h) [Inner Channel] 0.4 h<1.15T See Table 3.5(h) PIANC, 2014
Width for Bank Clearance (WB) 0.3 sloping channel edges and shoals See Table 3.6 PIANC, 2014
Additional Width for Channel Passing (Wp) 0.0 Not Required See Table 3.7 PIANC, 2014
Total Channel Width [Outer Channel] 4.0 B
Total Channel Width [Outer Channel] 200 m
Total Channel Width [Inner Channel] 4.2 B
Total Channel Width [Inner Channel] 210 m
Page 64
PIANC (2014) CHANNEL WIDTH ASSESSMENT
OPTION 4 CHANNEL DESIGN
REACH 5: Buoy 14 to Buoy 16
INPUT DATA
Parameter Value Unit Comment Source
Vessel Type Tanker n/a
Vessel Size Class Suezmax n/a OMC, 2015
Vessel Dead Weight Tonnage (DWT) 159,057 tonnes OMC, 2015
Vessel Beam (B) 50 m OMC, 2015
Vessel Length Overall (LOA) 276 m OMC, 2015
Vessel Length Between Perpendiculars (LBP) 264 m OMC, 2015
Vessel Draft (T) 17.02 m summer draft OMC, 2015
Channel Design Level -16.69 m CD 95% Access, minimum channel design level in Reach 5 OMC, 2015
Mean High Water Neap (MHWN) tide level 2.32 m CD Tonkin & Taylor, 2015
Channel Type Inner Channel n/a "Outer Channel" = open water, "Inner Channel" = protected water PIANC, 2014
Passing One-way n/a "Two-way" or One-way"
Vessel Manoeuvrability Poor n/a "Poor" = tankers/bulk carriers PIANC, 2014
"Moderate" = container vessels/car carriers/RoRo vessels/LNG&LPG vessels PIANC, 2014
"Good" = twin propeller ships/ferries/cruise vessels PIANC, 2014
(a) Vessel Speed (Vs) 6.8 knots "average" speed profile, varies from 6.8kts at Buoy 14 to 5.8kts at Buoy 16 OMC, 2015
(b) Prevailing cross wind (Vcw) 20 knots "Mild" Vcw<15 knots, "Moderate" 15 knots <=Vcw<33 knots, "Strong" Vcw>33 knots Marsden Point, 5% annual exceedance wind speed 10m/s, MetOcean Solutions measured data
(c) Prevailing cross current (Vcc) 0.7 knots "Negligible" Vcc<0.2 knots, "Low" 0.2 knots<=Vcc<0.5 knots, "Moderate" 0.5 knots<=Vcc<1.5
knots, "Strong" Vcc>=1.5 knots
Max. ebb or flood current velocity +/-1hr from HW, Auckland Ports ADCP Data 2015
(d) Prevailing longitudinal current (Vlc) 1.5 knots "Low" VlC<1.5 knots, "Moderate" 1.5 knots<=VlC<3 knots, "Strong" VlC>=3 knots Max. ebb or flood current velocity +/-1hr from HW, Auckland Ports ADCP Data 2015
(e) Beam and stern quartering wave height (Hs) 0.6 m "Hs<=1m", "1m<Hs<3m", "Hs>=3m" OMC, 2015 99th percentile swell data
(f) Aids to Navigation Good n/a "Excellent" = paired lighted buoys with radar deflectors/lighted leading lines with availability
of Pilots, DGPS and Electronic Chart Display and Information System (ECDIS)
PIANC, 2014
"Good" = paired lighted buoys with radar deflectors/lighted leading lines with availability of
Pilots and DGPS
PIANC, 2014
"Moderate" = anything less than the facilities mentioned above PIANC, 2014
(g) Bottom Surface smooth and soft n/a "smooth and soft" or "rough and hard" PIANC, 2014
(h) Depth of waterway (h) 19.01 m at Mean High Water Neap tide (MHWN)
Depth to Draft Ratio (h/T) 1.12 n/a
Channel slope sloping channel edges and shoals n/a "gentle underwater channel slope (1:10 or less steep)" or "sloping channel edges and shoals"
or "steep and hard embankments, structures"
PIANC, 2014
CHANNEL WIDTH CALCULATION
Parameter Beam (B) Multiplier Category Comment Source
Basic Manoeuvring Lane (WBM) 1.8 Poor "Good" = 1.3B, "Moderate" = 1.5B, "Poor" = 1.8B (Table 3.4) PIANC, 2014
(a) Vessel Speed (Vs) 0.0 Slow "Fast" Vs>12 = 0.1B, "Moderate" 8<Vs<12 = 0.0B, "Slow" 5<Vs<8 = 0.0B (Table 3.5(a)) PIANC, 2014
(b) Prevailing cross wind (Vcw) 0.6 Moderate See Table 3.5(b) PIANC, 2014
(c) Prevailing cross current (Vcc) [Outer Channel] 1.0 Moderate See Table 3.5(c) PIANC, 2014
(c) Prevailing cross current (Vcc) [Inner Channel] 0.8 Moderate See Table 3.5(c) PIANC, 2014
(d) Prevailing longitudinal current (Vlc) 0.2 Moderate See Table 3.5(d) PIANC, 2014
(e) Beam and stern quartering wave height (Hs) 0.0 Hs<=1 Hs<=1m = 0.0B, 1m<Hs<3m = 0.5B, Hs>=3m = 1.0B (Table 3.5(e)) PIANC, 2014
(f) Aids to Navigation 0.2 Good See Table 3.5(f) PIANC, 2014
(g) Bottom Surface 0.1 h<1.5T See Table 3.5(g) PIANC, 2014
(h) Depth of waterway (h) [Outer Channel] 0.2 h<1.25T See Table 3.5(h) PIANC, 2014
(h) Depth of waterway (h) [Inner Channel] 0.4 h<1.15T See Table 3.5(h) PIANC, 2014
Width for Bank Clearance (WB) 0.3 sloping channel edges and shoals See Table 3.6 PIANC, 2014
Additional Width for Channel Passing (Wp) 0.0 Not Required See Table 3.7 PIANC, 2014
Total Channel Width [Outer Channel] 4.7 B
Total Channel Width [Outer Channel] 235 m
Total Channel Width [Inner Channel] 4.7 B
Total Channel Width [Inner Channel] 235 m
Page 65
PIANC (2014) CHANNEL WIDTH ASSESSMENT
OPTION 4 CHANNEL DESIGN
REACH 6: Buoy 16 to Buoy 17
INPUT DATA
Parameter Value Unit Comment Source
Vessel Type Tanker n/a
Vessel Size Class Suezmax n/a OMC, 2015
Vessel Dead Weight Tonnage (DWT) 159,057 tonnes OMC, 2015
Vessel Beam (B) 50 m OMC, 2015
Vessel Length Overall (LOA) 276 m OMC, 2015
Vessel Length Between Perpendiculars (LBP) 264 m OMC, 2015
Vessel Draft (T) 17.02 m summer draft OMC, 2015
Channel Design Level -16.31 m CD 95% Access, minimum channel design level in Reach 6 OMC, 2015
Mean High Water Neap (MHWN) tide level 2.32 m CD Tonkin & Taylor, 2015
Channel Type Inner Channel n/a "Outer Channel" = open water, "Inner Channel" = protected water PIANC, 2014
Passing One-way n/a "Two-way" or One-way"
Vessel Manoeuvrability Poor n/a "Poor" = tankers/bulk carriers PIANC, 2014
"Moderate" = container vessels/car carriers/RoRo vessels/LNG&LPG vessels PIANC, 2014
"Good" = twin propeller ships/ferries/cruise vessels PIANC, 2014
(a) Vessel Speed (Vs) 5.8 knots "average" speed profile, varies from 5.8kts at Buoy 16 to 2kts at Buoy 17 OMC, 2015
(b) Prevailing cross wind (Vcw) 20 knots "Mild" Vcw<15 knots, "Moderate" 15 knots <=Vcw<33 knots, "Strong" Vcw>33 knots Marsden Point, 5% annual exceedance wind speed 10m/s, MetOcean Solutions measured data
(c) Prevailing cross current (Vcc) 0.7 knots "Negligible" Vcc<0.2 knots, "Low" 0.2 knots<=Vcc<0.5 knots, "Moderate" 0.5 knots<=Vcc<1.5
knots, "Strong" Vcc>=1.5 knots
Max. ebb or flood current velocity +/-1hr from HW, Auckland Ports ADCP Data 2015
(d) Prevailing longitudinal current (Vlc) 1.5 knots "Low" VlC<1.5 knots, "Moderate" 1.5 knots<=VlC<3 knots, "Strong" VlC>=3 knots Max. ebb or flood current velocity +/-1hr from HW, Auckland Ports ADCP Data 2015
(e) Beam and stern quartering wave height (Hs) 0.6 m "Hs<=1m", "1m<Hs<3m", "Hs>=3m" OMC, 2015 99th percentile swell data
(f) Aids to Navigation Good n/a "Excellent" = paired lighted buoys with radar deflectors/lighted leading lines with availability
of Pilots, DGPS and Electronic Chart Display and Information System (ECDIS)
PIANC, 2014
"Good" = paired lighted buoys with radar deflectors/lighted leading lines with availability of
Pilots and DGPS
PIANC, 2014
"Moderate" = anything less than the facilities mentioned above PIANC, 2014
(g) Bottom Surface smooth and soft n/a "smooth and soft" or "rough and hard" PIANC, 2014
(h) Depth of waterway (h) 18.63 m at Mean High Water Neap tide (MHWN)
Depth to Draft Ratio (h/T) 1.09 n/a
Channel slope sloping channel edges and shoals n/a "gentle underwater channel slope (1:10 or less steep)" or "sloping channel edges and shoals"
or "steep and hard embankments, structures"
PIANC, 2014
CHANNEL WIDTH CALCULATION
Parameter Beam (B) Multiplier Category Comment Source
Basic Manoeuvring Lane (WBM) 1.8 Poor "Good" = 1.3B, "Moderate" = 1.5B, "Poor" = 1.8B (Table 3.4) PIANC, 2014
(a) Vessel Speed (Vs) 0.0 Slow "Fast" Vs>12 = 0.1B, "Moderate" 8<Vs<12 = 0.0B, "Slow" 5<Vs<8 = 0.0B (Table 3.5(a)) PIANC, 2014
(b) Prevailing cross wind (Vcw) 0.6 Moderate See Table 3.5(b) PIANC, 2014
(c) Prevailing cross current (Vcc) [Outer Channel] 1.0 Moderate See Table 3.5(c) PIANC, 2014
(c) Prevailing cross current (Vcc) [Inner Channel] 0.8 Moderate See Table 3.5(c) PIANC, 2014
(d) Prevailing longitudinal current (Vlc) 0.2 Moderate See Table 3.5(d) PIANC, 2014
(e) Beam and stern quartering wave height (Hs) 0.0 Hs<=1 Hs<=1m = 0.0B, 1m<Hs<3m = 0.5B, Hs>=3m = 1.0B (Table 3.5(e)) PIANC, 2014
(f) Aids to Navigation 0.2 Good See Table 3.5(f) PIANC, 2014
(g) Bottom Surface 0.1 h<1.5T See Table 3.5(g) PIANC, 2014
(h) Depth of waterway (h) [Outer Channel] 0.2 h<1.25T See Table 3.5(h) PIANC, 2014
(h) Depth of waterway (h) [Inner Channel] 0.4 h<1.15T See Table 3.5(h) PIANC, 2014
Width for Bank Clearance (WB) 0.3 sloping channel edges and shoals See Table 3.6 PIANC, 2014
Additional Width for Channel Passing (Wp) 0.0 Not Required See Table 3.7 PIANC, 2014
Total Channel Width [Outer Channel] 4.7 B
Total Channel Width [Outer Channel] 235 m
Total Channel Width [Inner Channel] 4.7 B
Total Channel Width [Inner Channel] 235 m
Page 66
BEND GEOMETRYOPTION 4 CHANNEL DESIGNBend No. Entry Channel Heading Exit Channel Heading Bearing Change (S) Vessel Beam Vessel LOA Bend Radius* Entry Channel Width Exit Channel Width Draft Angle Width^ Response Time Width" Bend Width
(deg. from North) (deg. from North) (m) (m) (m) (m) (m) (m) (m) (m)
1 321 360 39 50 276 1800 215 225 9.4 20.0 2552 360 309 51 50 276 800 225 235 21.2 20.0 275
* 5 x LOA recommended, Table 3.8 PIANC 2014^ Eqn. 3-5 PIANC 2014" Eqn. 3-6 PIANC 2014
Page 67
12 November 2016 RNZ CHANNEL DESIGN M&APA1028R002D08
APPENDIX F: Full Bridge Simulation Study Report