COOPERATIVES Rural COOPERATIVES USDA / Rural Development January/February 2001 USDA / Rural Development January/February 2001 Challenges pile up for sugar beet co-ops Challenges pile up for sugar beet co-ops
Transcript
COOPERATIVESRura
lCOOPERATIVESUSDA / Rural Development January/February 2001USDA / Rural Development January/February 2001
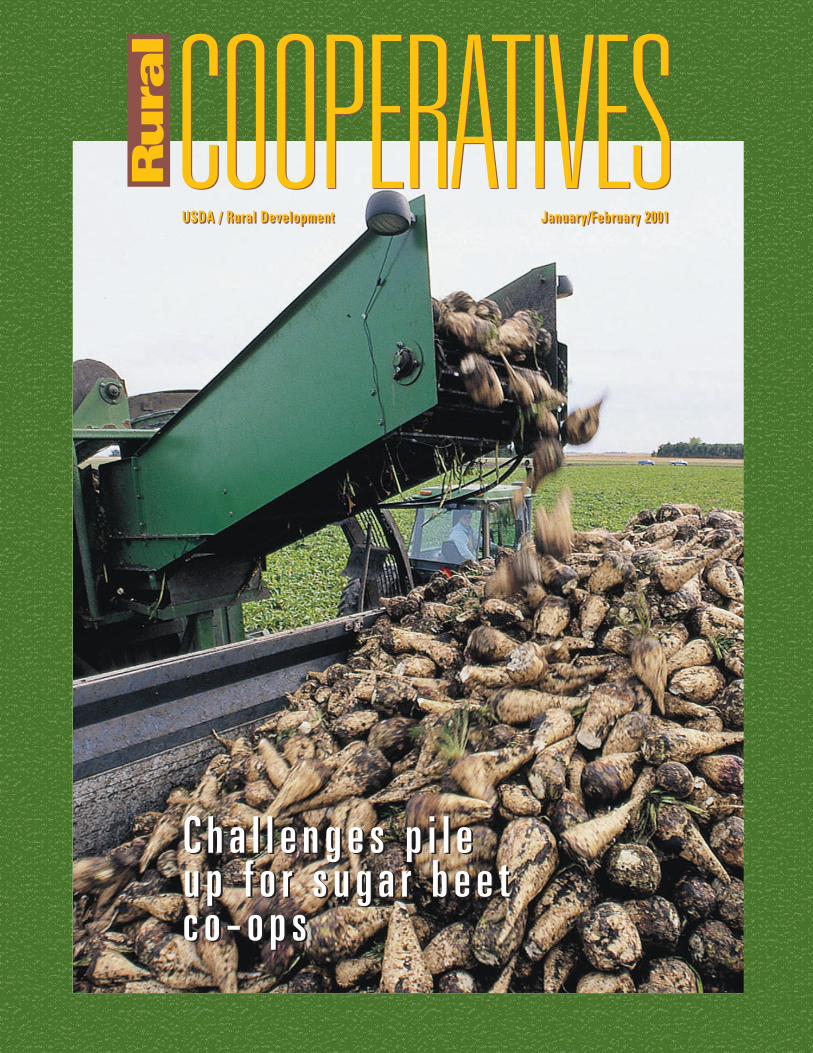
C h a l l e n g e s p i l eu p f o r s u g a r b e e tc o - o p s
C h a l l e n g e s p i l eu p f o r s u g a r b e e tc o - o p s
2 January/February 2001 / Rural Cooperatives
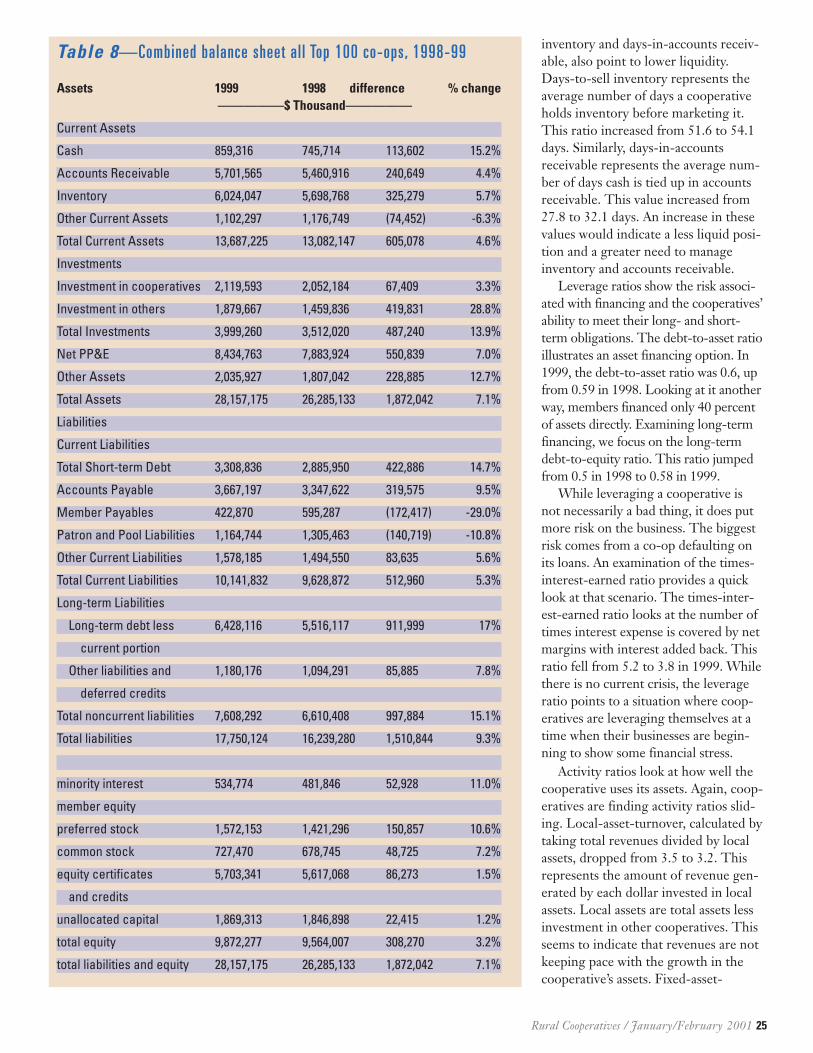
Cooperative leaders across Americaare coming to grips with the sweepingchanges in the farm economy andstructural changes in the ag processingand distribution sectors. The changesinclude a dwindling number of farms,an increased size of remaining farms,and concentration in food processingand retailing. Other challenges areposed by the burden of huge invento-ries of many crops that are causingdepressed markets and by the effectsof new technology, such as e-com-merce, robotics and satellite commu-nications systems.
The economics of farm operationsclearly influences the vitality of grow-ers’ off-farm businesses — their coop-eratives — as shown in the reports oncooperative share of marketing activityand the performance of the largestcooperatives found on page 7.
As cooperative boards of directorsand managers deal with these issues,we should remind ourselves of thebenefits of cooperatives workingtogether as a strategy for the efficientuse of member resources. Regionaland national federations of coopera-tives have operated successfully formany years, linking the basic manu-facturing of farm supplies (fertilizer,petroleum, etc.) to distribution at thelocal level.
Similarly, farm credit associationsown regional farm credit banks whilerural electric distribution coopera-tives own generation and transmissioncooperatives. Livestock shipping asso-ciations have been linked to regionallivestock marketing cooperatives.U.S. Premium Beef is linked throughownership in Farmland NationalFoods and cooperative grain elevators
are linked to soybean processing andmilling operations, such as Ag Pro-cessing Inc. and CHS Cooperatives.
Minnesota and North Dakota sug-ar beet cooperatives have developed aclose working relationship throughmarketing agencies-in-common.These include Midwest Agri-Com-modities for marketing sugar beet
byproducts and United Sugars Co. formarketing refined sugar (see page 10).These combined marketing effortsoffer a fine example of benefits to pro-ducer members from coordinatedmarketing activity.
Many more examples could be cited, but the point is that effective
cooperative systems have been devel-oped which serve farmer and ranchermembers well — and continue toserve them well — through coopera-tion among cooperatives. Farmers andranchers have realized significantindependence through their purchas-ing and marketing cooperatives. Butthe system is only as good as the sup-port generated by continued commit-ment to working together for thecommon good.
A tendency exists in some quartersto align operations with investor-owned firms rather than remainingcommitted to developing strong coop-erative systems. Many associated issuesconcerning farmer ownership and con-trol are quite complex and requirecareful analysis to determine long-termimplications.
During times of economic stressfor the farm economy, as exist now,there are no “silver bullets” to securefinancing, nor are there any “magic”business alignments that will solvelong-term problems; we should notdeviate from sound cooperative principlesand practices. Continued progressthrough forward-looking cooperativestrategies and cooperative educationfor boards and managers — and thefarm sector at large — are called forif a vibrant cooperative system is tobe a part of the rural scene in thefuture.
Randall Torgerson, Deputy Administrator USDA Rural Business-Cooperative Service
C O M M E N T A R Y
Commitment to cooperative systems
During times of
economic stress for
the farm economy,
as exist now,
there are no
“silver bullets” to
secure financing.
Rural Cooperatives / January/Febrary 2001 3
RURAL COOPERATIVES (1088-8845) is publishedbimonthly by Rural Business–Cooperative Service,U.S. Department of Agriculture, 1400 IndependenceAve. SW, Stop 0705, Washington, DC. 20250-0705.The Secretary of Agriculture has determined thatpublication of this periodical is necessary in thetransaction of public business required by law of the Department. Periodicals postage paid atWashington, DC. and additional mailing offices.Copies may be obtained from the Superintendent ofDocuments, Government Printing Office, Washington,DC, 20402, at $3.50 domestic, $4.38 foreign; or byannual subscription at $15.00 domestic, $18.75 for-eign. Postmaster: send address change to: RuralCooperatives, USDA/RBS, Stop 3255, Wash., DC20250-3255.
Mention in RURAL COOPERATIVES of company andbrand names does not signify endorsement overother companies’ products and services.
Unless otherwise stated, contents of this publica-tion are not copyrighted and may be reprintedfreely. For noncopyrighted articles, mention ofsource will be appreciated but is not required.
The United States Department of Agriculture (USDA)prohibits discrimination in all its programs and activities on the basis of race, color, national origin,sex, religion, age, disability, political beliefs, sexualorientation, and marital or family status. (Not all prohibited bases apply to all programs). Persons with disabilities who require alternative means forcommunication of program information (braille, largeprint, audiotape, etc.) should contact USDA’s TARGETCenter at (202) 720-2600 (voice and TDD).
To file a complaint of discrimination, write USDA,Director, Office of Civil Rights, Room 326-W, WhittenBuilding, 14th and Independence Avenue, SW,Washington, D.C. 20250-9410, or call (202) 720-5964(voice or TDD). USDA is an equal opportunityprovider and employer.
Ann Veneman, Secretary of Agriculture
Randall Torgerson, Deputy Administrator, USDARural Business-Cooperative Service
Dan Campbell, Managing Editor
Pamela J. Karg, Field Editor
Vision 2000/Kota, Design
Have a cooperative-related question?Call (202) 720-6483, orFax (202) 720-4641, Information Director,
This publication was printed with vegetable oil-based ink.
United States Department of Agriculture
COOPERATIVESRura
l
COOPERATIVESJanuary/February 2001 Volume 68 Number 1
O n t h e C o v e r :
Big sugar beet crops — such as this Red River Valley harvest — haveadded challenges for producers and their cooperatives, which are strug-gling to bring balance to the market. A Payment-In-Kind (PIK) diversion pro-gram has encouraged diverting a portion of the crop. See story on page 10.Photo courtesy American Crystal Sugar
F E A T U R E S
4 Peach growers cling to associationCCPA assumes greater role in helping industry manage supply,avoid pitfalls.By Pamela J. Karg
7 Co-ops’ share of farm market, major cashexpenditures down in ‘99By Charles Kraenzle
10 Sweet and sourSurgar cooperatives restructure to combat foreign threats, low prices.By Pamela J. Karg
15 A critical look at new-generation cooperativesBy Randall Torgerson
20 Financial performance declines for largest agco-ops in ‘99By David Chesnick
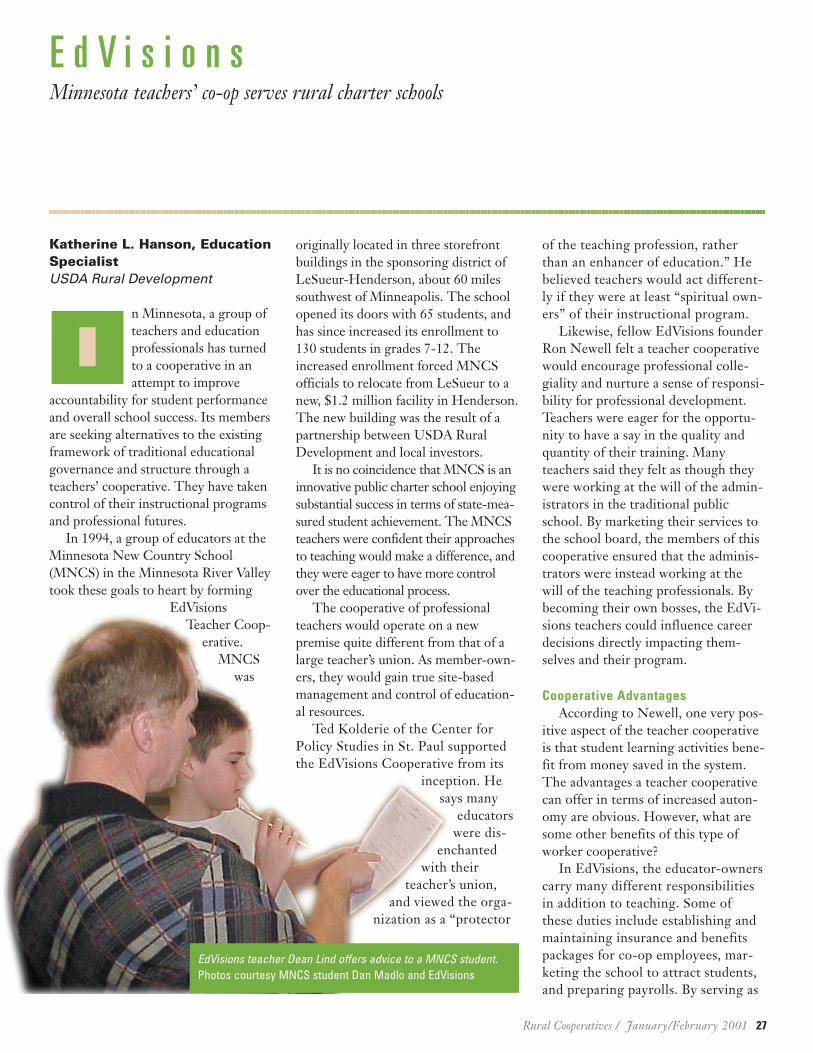
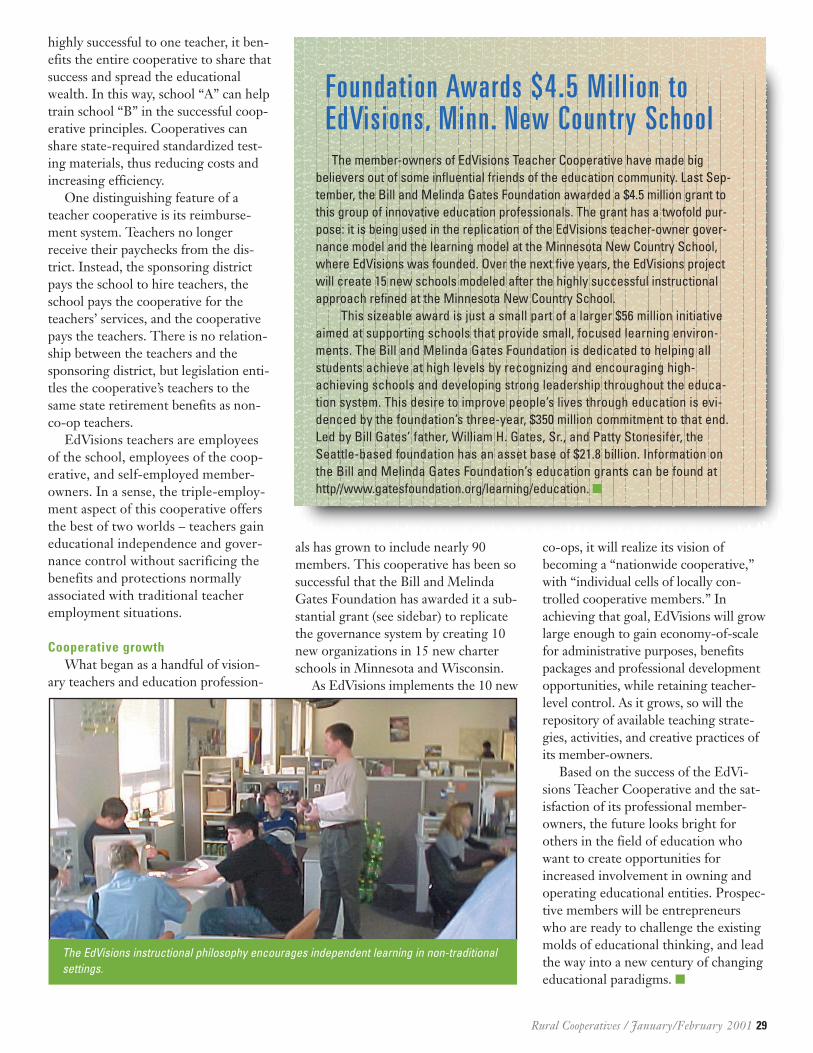
27 EdVisionsMinnesota teacher’s co-op serves rural charter schoolsBy Katherine L. Hanson
D E P A R T M E N T S2 COMMENTARY
30 NEWSLINE
4 January/February 2001 / Rural Cooperatives
By Pamela J. KargField Editor
Editor’s note: this is the second of twoarticles focusing on bargaining coopera-tives. In the Nov.-Dec. 2000 issue, thefocus was on the cherry industry’s bar-gaining association.
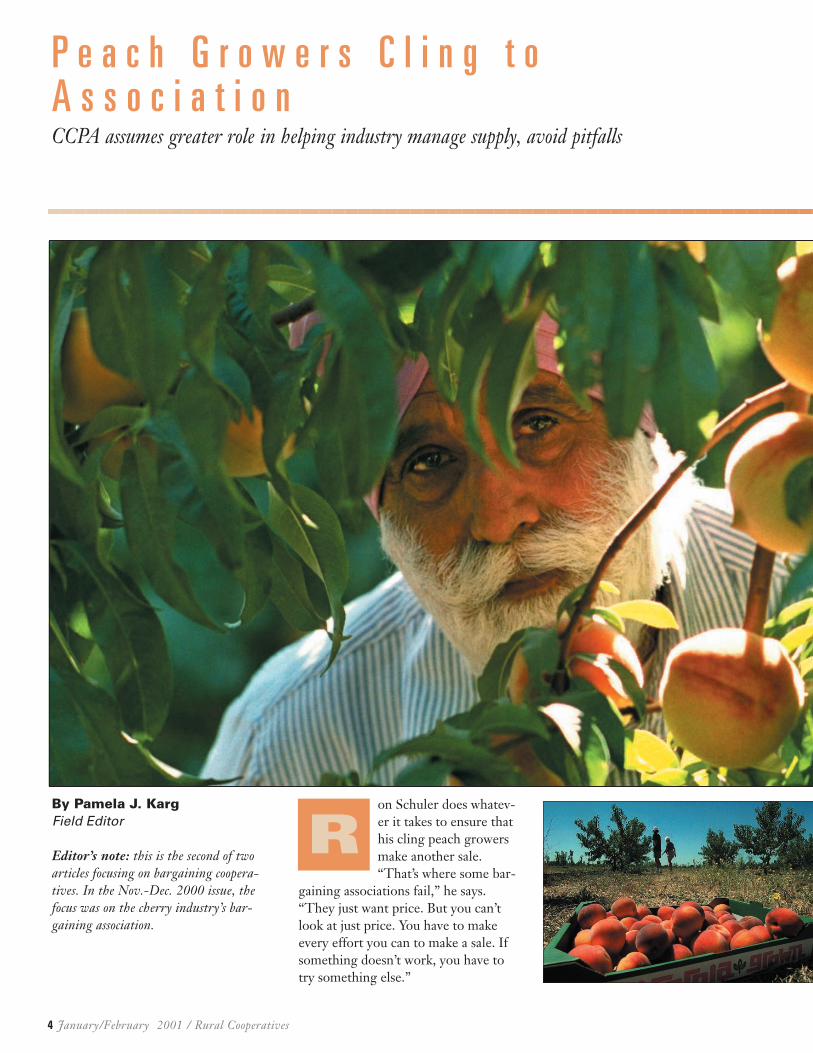
on Schuler does whatev-er it takes to ensure thathis cling peach growersmake another sale.“That’s where some bar-
gaining associations fail,” he says.“They just want price. But you can’tlook at just price. You have to makeevery effort you can to make a sale. Ifsomething doesn’t work, you have totry something else.”
P e a c h G r o w e r s C l i n g t oA s s o c i a t i o nCCPA assumes greater role in helping industry manage supply, avoid pitfalls
R
Rural Cooperatives / January/February 2001 5
Schuler has led the California Can-ning Peach Association (CCPA)through a plethora of issues thatrange from grower-funded supplymanagement plans to negotiatingcontracts with new owners of the for-mer Tri-Valley Growers canningfacilities. He says there is no topic theAssociation should shy away from if itinfluences the marketing picture forCCPA members.
“We’re active and involved in allaspects of our industry. Why elsewould I be sending Associationemployees to an energy seminar?Because it impacts all of us and weneed to know about it,” Schuler says.
That total immersion has madeCCPA the longest-lived cooperativebargaining association in the nation. Italso has earned Schuler respect withinCalifornia agricultural circles.
“He is the dean of California bar-gaining associations,” says Vaughn Koli-gian, chief executive officer of the RaisinBargaining Association in California.
Yet longevity and admiration don’tadd up to much in the face of marketshare erosion due to cheap imports,food industry concentration, a proces-sor bankruptcy and a farm policy thatoffers little for specialty crops such aspeaches. Something has to change,peach growers say. And, as it has alwaysdone, CCPA is doing everything it canto make sure it does.
A home and a priceGrowers founded CCPA in 1922
with a $30,000 loan from A.P. Gianniniof the Bank of Italy (which eventuallybecame Bank of America). Local, dis-parate groups of peach growers cametogether under two ideals: a home forevery grower’s peaches and a fair pricefor the fruit.
Unlike freestone peaches that couldbe sold fresh, dried or canned, clingpeaches had only one use: canning. Asa result, the California cling peachindustry grew up with the idea that itwas captive to canners.
“By 1901, more cling than freestonepeaches were canned in California forthe first time,” writes Frank Van Kony-nenburg, a retired CCPA director andpast chairman of the board. He wrote“A Home and A Price: 75 Years of His-tory with the California CanningPeach Association” in 1997. “Thatsame year, California Fruit Canners’Association-Del Monte offered five-year term contracts to cling growers at$20 per ton. A number of growerssigned up to ensure a home and takesome risk out of growing clings having
an assured home with a canner everyyear was much more of a necessity,”Van Konynenburg adds.
Rapid inflation caused by WorldWar I saw long-term contract growersreceive $25 a ton while non-contractgrowers earned up to the astronomicalprice of $110 a ton. Through countyFarm Bureaus, growers organized localpools. However, canners told tales ofpostwar economic depression woes.
Undaunted, growers realized theyneeded something larger than a countygroup. Before the end of January 1922,CCPA organized and hired AmbertDal Poggetto as its manager. By spring,760 growers representing 25 percent ofcling growers and tonnage in Califor-nia were CCPA members. Thanks tothe February 1922 passage of the Cap-per-Volstead Act, the association oper-ated without threat of anti-trust battles.
Canning peaches todayIn the 1927 annual report, CCPA
leaders noted that, “Despite a contrarybelief among growers, the growers’interest does not cease until the finalproduct is consumed.” Through thedecades, CCPA has learned valuablelessons like this and they mold its pro-grams, policies and attitudes today.
This past summer, Tri Valley Grow-ers announced it was filing for Chapter11 bankruptcy protection and reorgani-zation. CCPA growers were among sev-eral farm groups to feel the chillingafter-shocks of a lost market on top ofworld trade issues that were rearing theirugly heads.
“TVG announced it could only take85 percent of the 2000 crop, so weneeded to do something to take care ofthe other 15 percent, or about 30,000tons of peaches,” Schuler explains. “Ifthat production had come onto theopen market at the same time we weretrying to negotiate a price with DelMonte, we wouldn’t have had a strongmarket,” he stresses.
As it had done a few other times in itshistory, CCPA offered members a chanceto pull out trees and to receive money todo so. Other commodity groups have hadsimilar production reduction programs.
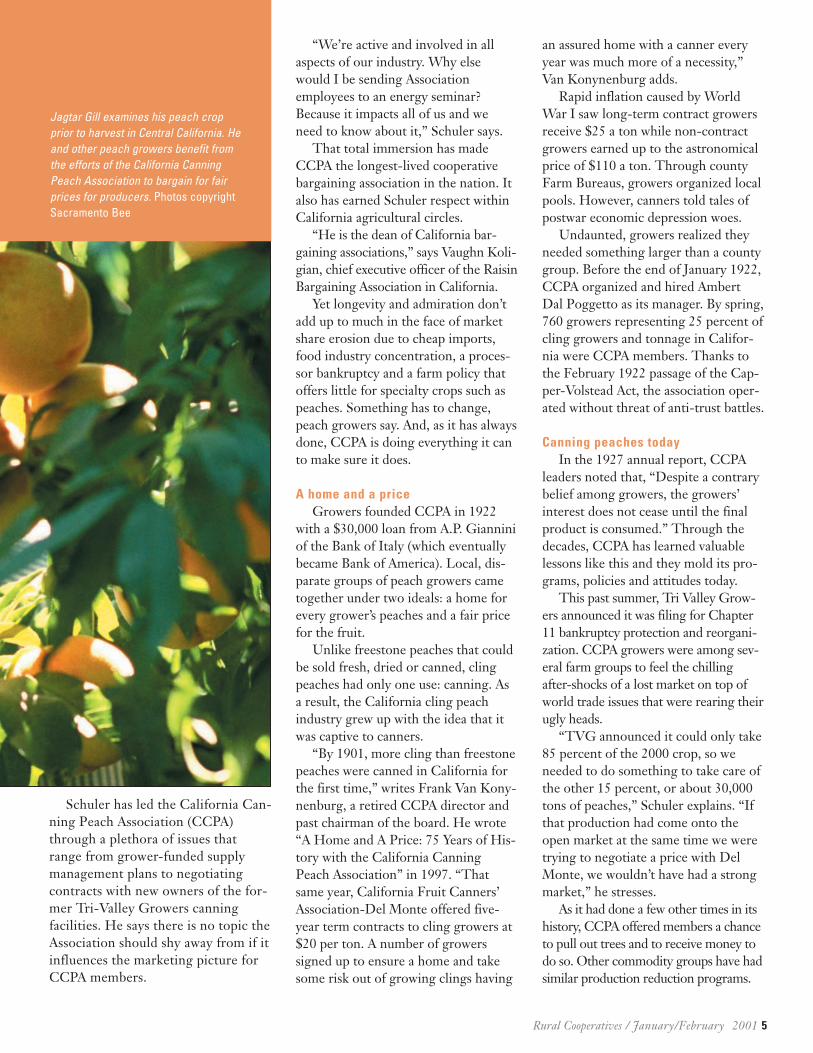
Jagtar Gill examines his peach cropprior to harvest in Central California. Heand other peach growers benefit fromthe efforts of the California CanningPeach Association to bargain for fairprices for producers. Photos copyrightSacramento Bee
However, the CCPA plan is unique because producers fund it entirely.
“It wasn’t as equitable to everyone as it could have been,”Schuler explains. “There were growers with extra-earlies (ear-ly ripenning peach varieties) who weren’t allowed to partici-pate due to timing. But, as it turns out, we got 11,000 acresout and we accomplished our goal of reducing oversupply,which helped sustain prices.”
Small, specialty marketThe canning peach industry is not a large agricultural sec-
tor compared to dairy orcorn. Producers voted outa state Joint MarketingOrder in 1996. There areno government programsand no volume controlprovisions, though apeach marketing board isin place to promote theCalifornia-grown fruit.
Peach growers havetaken a decidedly inde-pendent path. Yet, pitfallsabound, and Schulerbelieves the next FarmBill needs to addresssmall, specialty farmcrops, such as peaches.
“There was $28 billionpaid to farmers last yearby the government, butless than 3 percent went to California farmers while over 50percent of our nation’s fruits and vegetables come from farmshere,” Schuler points out. “Somewhere along the line, we haveto realize that we can’t continue like this. It’s getting increas-ingly difficult for our farmers to compete.”
A major portion of the competition comes from the Greekpeach industry. Those growers are over-producing low-quali-ty fruit that is flooding the U.S. marketplace at low prices,Schuler charges.
“We’re trying to work with them so they understandwhat could potentially happen to everyone’s market if theycontinue on this path,” Schuler says. One option U.S.growers have suggested to their Greek counterparts aregreen drops. Producers agree to pull down a certainamount of fruit in exchange for some partial payment. Inthe process, supplies shrink and prices may rise as long asconsumption holds. “It’s been hard to convince them thatthis could work just as it has for CCPA in the past,”Schuler adds.
Meanwhile, higher quality standards are in place forAmerican fruit. U.S. cling peach growers also face competi-tion from within: consolidation in the food industry and ris-ing production costs, which includes another jump in theminimum wage.
Rising costs, more consolidation“Sixty-eight percent of peach costs are labor,” Schuler
says. Processors have been reluctant to buy machine-harvest-ed fruit over charges of inferior quality. But a recent increasein the California minimum wage has growers and processorstaking a second look.
“A few in the past have done a poor job with machine-harvesting. So, we’re working between processors andgrowers to set up strict rules on how to do it without sacri-ficing quality. We’ll have padding requirements on themachines to minimize bruising. We’re working on quality
criteria for when thatfruit gets to the plant.We need varieties thatcan hold up to machineharvesting. There will bea price differential inplace,” he explains.
The other major pro-duction cost for theentire California agricul-tural system is energy.Natural gas and electricalcosts are rising, androlling blackouts areplaguing the state. “Weneed to be aware of boththe processor side as wellas the producer side ofevery issue. Knowingboth sides is key,”Schuler says.
To that end, members need to hear from the marketingside of their business. This year’s annual meeting keynotespeaker was Bob Piccinini, chairman and chief executive offi-cer of SaveMart Supermarkets.
“If we don’t hear what our customers want or followprocessor guidelines, we cannot achieve a reasonable price.We need to hear what our customers are going through sowe know how to respond and we know what’s possible,”Schuler says.
Growers at the meeting heard that the food industrycontinues to consolidate. Fewer, yet larger, customers wantthe highest quality fruit at the lowest possible price. Thefood chain is squeezing out more costs. Consumers arespending a greater share of their food dollar at fast-foodrestaurants.
As a result, supermarkets need quick, nutritious foods forharried consumers who would rather drive-thru to pick upsupper in a bag than check out at the express lane with 10items or less. Producers were encouraged to continue newproduct testing and new packaging designs.
“We’ve always got to be looking for that next sale,”Schuler adds. “The Association has to do whatever it can tomake sure we get people to eat some golden sunshine – clingpeaches in a can.” �
6 January/February 2001 / Rural Cooperatives
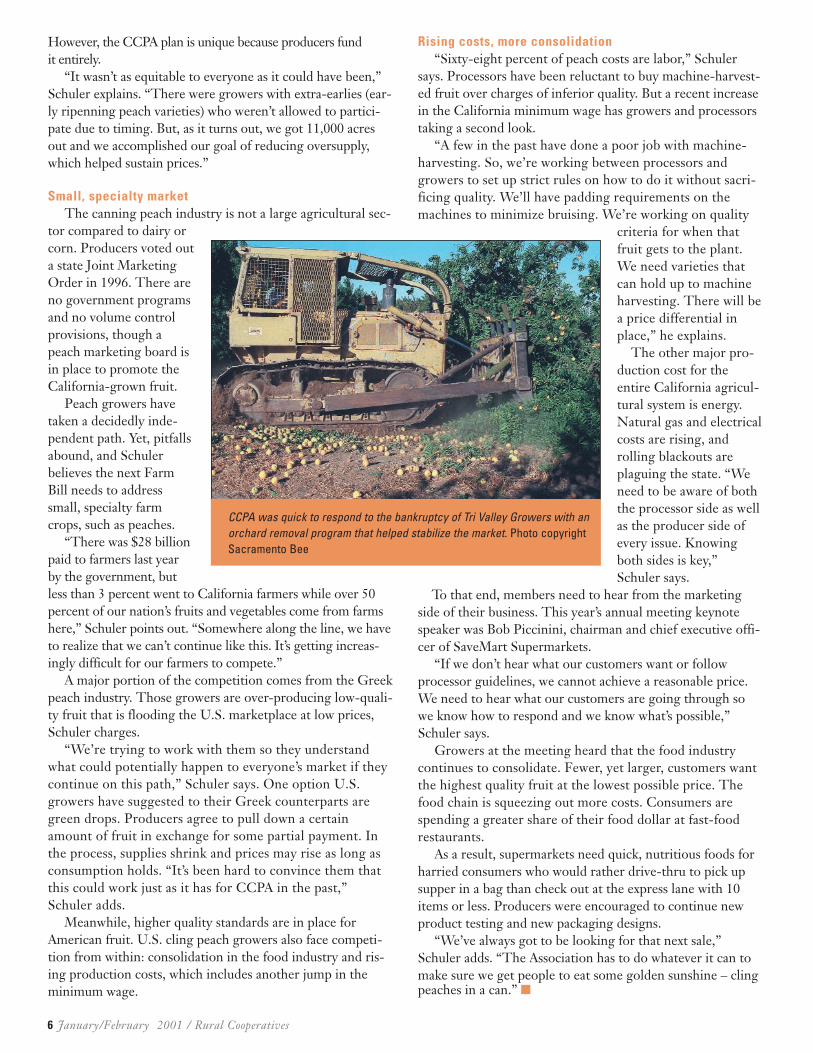
CCPA was quick to respond to the bankruptcy of Tri Valley Growers with anorchard removal program that helped stabilize the market. Photo copyrightSacramento Bee
Rural Cooperatives / January/February 2001 7
Charles A. Kraenzle, DirectorUSDA Rural Development, RBSStatistics Staff
Editor’s note: Assistance in developingestimates of cooperatives’ shares of farmmarketings and farm production expendi-tures was provided by the Rural Business-Cooperative Service of USDA RuralDevelopment staff, including David Ches-nick, 100 largest cooperatives; Dave Cum-mins, grains and oilseeds; Eldon Eversull,farm supplies; and Andy Jermolowicz,fruits and vegetables and tobacco.
recent U.S. Departmentof Agriculture analysisshowed that farmercooperatives’ share oftotal farm marketing —
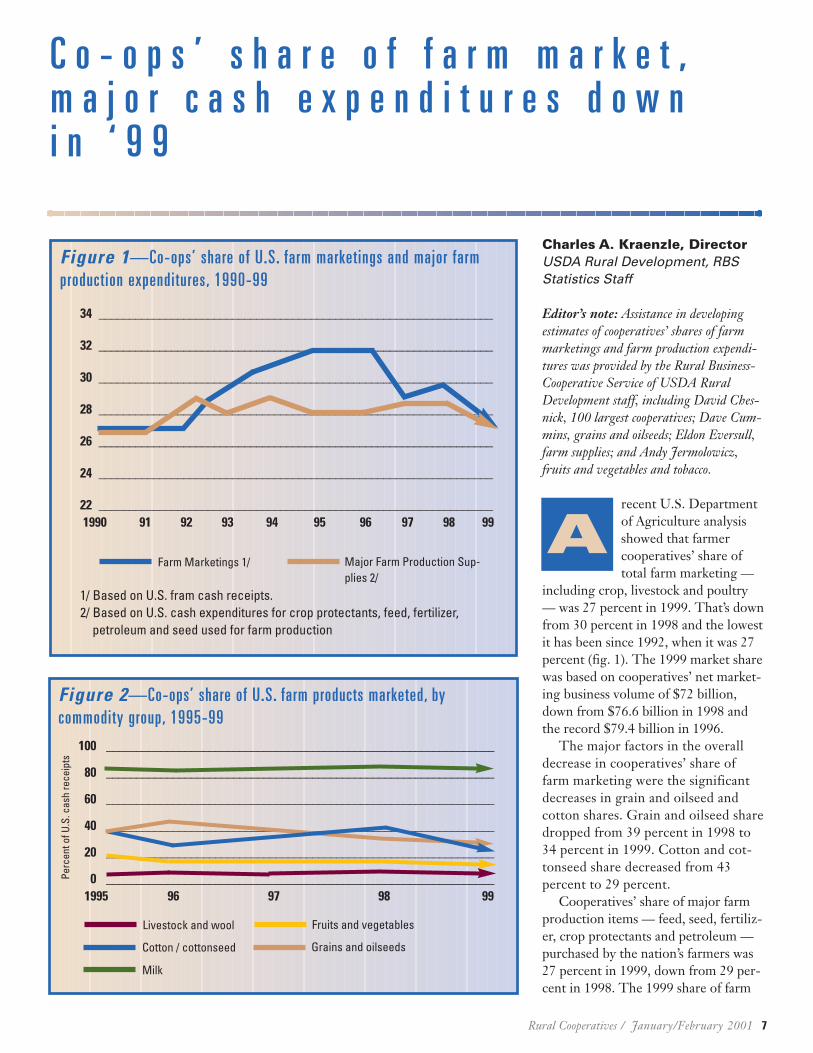
including crop, livestock and poultry— was 27 percent in 1999. That’s downfrom 30 percent in 1998 and the lowestit has been since 1992, when it was 27percent (fig. 1). The 1999 market sharewas based on cooperatives’ net market-ing business volume of $72 billion,down from $76.6 billion in 1998 andthe record $79.4 billion in 1996.
The major factors in the overalldecrease in cooperatives’ share offarm marketing were the significantdecreases in grain and oilseed andcotton shares. Grain and oilseed sharedropped from 39 percent in 1998 to34 percent in 1999. Cotton and cot-tonseed share decreased from 43 percent to 29 percent.
Cooperatives’ share of major farmproduction items — feed, seed, fertiliz-er, crop protectants and petroleum —purchased by the nation’s farmers was27 percent in 1999, down from 29 per-cent in 1998. The 1999 share of farm
C o - o p s ’ s h a r e o f f a r m m a r k e t ,m a j o r c a s h e x p e n d i t u r e s d o w n i n ‘ 9 9
A
Figure 1—Co-ops’ share of U.S. farm marketings and major farmproduction expenditures, 1990-99
supplies purchased was based on coop-eratives’ net sales of $23.2 billion,down from $24.6 billion in 1998 andthe record $25.2 billion in 1997.
Most milk sold through co-opsFarmer cooperatives’ net sales of
milk and milk products totaled $26 bil-lion in 1999, up $0.7 billion, or 2.6percent, from 1998. U.S. farm cashreceipts for milk were down nearly$0.9 billion, or 0.8 percent, in 1999,due to lower milk prices. Co-ops’ shareof total U.S. farm cash receipts for milkwas down slightly in 1999, to 89 per-
cent, from 90 percent in 1998 (table 1). Nationally, the quantity of milk
marketed in 1999 was up .8 percentfrom 1998. At the same time, theweighted average U.S. price per 100pounds of milk was down nearly 7 per-cent. Co-ops’ share of milk sales at thefirst-handler level includes the value ofmilk for which cooperatives bargainedwith processors over price and terms oftrade for members.
Co-ops’ share of grain and oilseedmarketed at the farm-gate dropped from39 percent in 1998 to 34 percent in 1999.Faced with continued sharp price
declines in 1999, many co-ops withheldmarketing proportionally larger volumesof grains and oilseeds than did investor-owned grain firms, based on the anticipa-tion of higher prices in the future. Thiswas facilitated by the co-ops’ traditionallyproportionally larger grain storage capac-ity at the local level. During 1999, farmercooperatives marketed $17.1 billionworth of grains and oilseeds, down from$21.3 billion in 1998.
Co-ops’ share of cotton and cotton-seed cash receipts stood at 29 percent in1999, down from 43 percent in 1998.The net value of cotton and cottonseedpurchased by farmer cooperatives was$2.1 billion, down nearly 30 percent from1998. In comparison, farm cash receiptsfor cotton and cottonseed were downonly 3.9 percent for the 1998 crop. Theexit of one large co-op that marketed cot-ton, as well as lower cotton production—due to drought and fewer planted acres—were major factors in the decline.
Co-ops accounted for 18 percent ofthe nation’s fruit/vegetable sales in1999, compared with 19 percent in1998. Co-ops’ sales of fruits and veg-etables totaled nearly $9.3 billion in1999, down 1.1 percent from a yearearlier. Total U.S. average cash receiptsfor fruits/vegetables, however, were up1.9 percent in 1999.
Cooperatives’ share of livestock(including wool and mohair) market-ings was 13 percent in 1999, downslightly from 14 percent in 1998. Co-ops’ net sales of livestock were $7.3 bil-lion in 1999, down from $7.4 billion, or1.3 percent. However, total U.S. cashreceipts for livestock/wool increased 4.9percent from 1998 to 1999, due mainlyto higher prices for beef cattle.
Cooperatives’ share of “all other”marketings — such as poultry, dry edi-ble beans and peas, tobacco, nuts, riceand sugar — was 12 percent, the sameas reported for 1998. Co-ops’ “all oth-er” marketings totaled $10.2 billion in1999 and 1998. In comparison, totalU.S. cash receipts for “all other” mar-ketings increased 3.4 percent. Thebiggest increase was in nuts and miscel-laneous marketings, such as hay, grassesand other field crops.
Table 1—Cooperatives’ share of U.S. farm marketings, by selectedcommodity group, 1999-97
Commodity group 1999 1998 1997
Percent of U.S. cash receipts 1/Milk 89 90 88Grains and oilseeds 34 39 43Cotton and cottonseed 29 43 38Fruits and vegetables 18 19 19Livestock and wool 2/ 13 14 12All other 3/ 12 12 13Total 4/ 27 30 29
1/ Estimates are rounded to the nearest whole percent. Selected data items for 1997and 1998 were revised.
2/ Includes mohair.3/ Includes poultry and eggs, dry edible beans and peas, nuts, rice, tobacco, sugar-
cane, sugar beets, honey and other miscellaneous marketings.4/ All farm commodities weighted by value.
Table 2—Cooperatives’ share of major U.S. farm production expenditures, 1999-97
Farm production item 1999 1998 1997
Percent of U.S. farm production expenditures1/Fertilizer 45 45 45Petroleum 45 50 45Crop protectants 34 34 34Feed 19 21 22Seed 10 10 10Total 2/ 27 29 29
1/ Estimates are rounded to the nearest whole percent.2/ The five major farm production items weighted by value.
Rural Cooperatives / January/February 2001 9
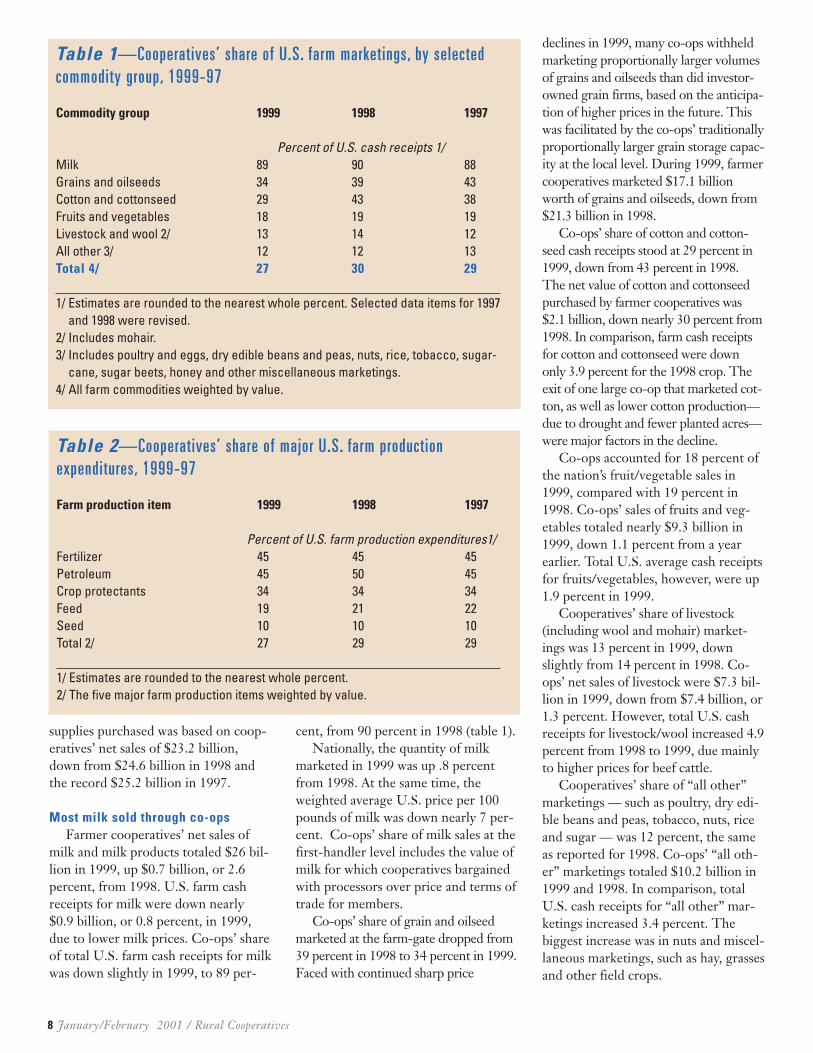
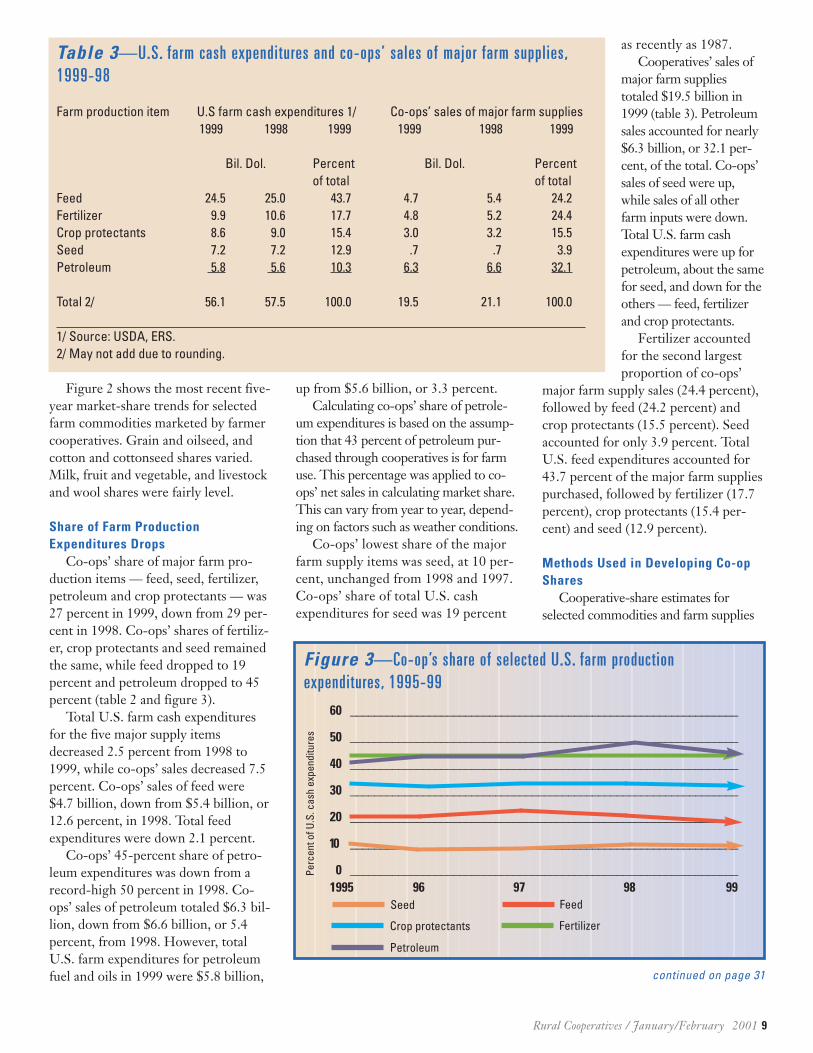
Figure 2 shows the most recent five-year market-share trends for selectedfarm commodities marketed by farmercooperatives. Grain and oilseed, andcotton and cottonseed shares varied.Milk, fruit and vegetable, and livestockand wool shares were fairly level.
Share of Farm ProductionExpenditures Drops
Co-ops’ share of major farm pro-duction items — feed, seed, fertilizer,petroleum and crop protectants — was27 percent in 1999, down from 29 per-cent in 1998. Co-ops’ shares of fertiliz-er, crop protectants and seed remainedthe same, while feed dropped to 19percent and petroleum dropped to 45percent (table 2 and figure 3).
Total U.S. farm cash expendituresfor the five major supply itemsdecreased 2.5 percent from 1998 to1999, while co-ops’ sales decreased 7.5percent. Co-ops’ sales of feed were$4.7 billion, down from $5.4 billion, or12.6 percent, in 1998. Total feedexpenditures were down 2.1 percent.
Co-ops’ 45-percent share of petro-leum expenditures was down from arecord-high 50 percent in 1998. Co-ops’ sales of petroleum totaled $6.3 bil-lion, down from $6.6 billion, or 5.4percent, from 1998. However, totalU.S. farm expenditures for petroleumfuel and oils in 1999 were $5.8 billion,
up from $5.6 billion, or 3.3 percent.Calculating co-ops’ share of petrole-
um expenditures is based on the assump-tion that 43 percent of petroleum pur-chased through cooperatives is for farmuse. This percentage was applied to co-ops’ net sales in calculating market share.This can vary from year to year, depend-ing on factors such as weather conditions.
Co-ops’ lowest share of the majorfarm supply items was seed, at 10 per-cent, unchanged from 1998 and 1997.Co-ops’ share of total U.S. cashexpenditures for seed was 19 percent
as recently as 1987. Cooperatives’ sales of
major farm suppliestotaled $19.5 billion in1999 (table 3). Petroleumsales accounted for nearly$6.3 billion, or 32.1 per-cent, of the total. Co-ops’sales of seed were up,while sales of all otherfarm inputs were down.Total U.S. farm cashexpenditures were up forpetroleum, about the samefor seed, and down for theothers — feed, fertilizerand crop protectants.
Fertilizer accountedfor the second largestproportion of co-ops’
major farm supply sales (24.4 percent),followed by feed (24.2 percent) andcrop protectants (15.5 percent). Seedaccounted for only 3.9 percent. TotalU.S. feed expenditures accounted for43.7 percent of the major farm suppliespurchased, followed by fertilizer (17.7percent), crop protectants (15.4 per-cent) and seed (12.9 percent).
Methods Used in Developing Co-opShares
Cooperative-share estimates forselected commodities and farm supplies
Table 3—U.S. farm cash expenditures and co-ops’ sales of major farm supplies,1999-98
Farm production item U.S farm cash expenditures 1/ Co-ops’ sales of major farm supplies1999 1998 1999 1999 1998 1999
Bil. Dol. Percent Bil. Dol. Percentof total of total
percent below their historical averageand refined sugar prices bottomed outlast fall. A self-supporting sugar indus-try program has turned to governmentsupport. Good weather, a large domes-tic sugar crop, government-guaranteedimport increases and trade disputeswith Mexico and Canada have souredthe outlook for the industry.
As prices took a nearly unprecedent-ed free-fall in late 2000, however,growers and their cooperatives begantheir own slicing and dicing to deter-mine how to weather the economiclumps. Sugar cooperatives are cuttingcosts to improve operating efficienciesand have anteed up money to studywhether to own a greater share of thefarm-to-consumer processing chain.They continue to educate politicalleaders about the realities of U.S. sugarpolicy. In the process, American sugargrowers might turn their sour grapesinto sweet successes through innova-tion and perseverance.
Processors forfeit sugar, PIK offeredgrowers
Weak prices have caused many sugaroperations, including American CrystalSugar Co. of Moorhead, Minn., to for-feit sugar to the government for thefirst time in more than 20 years. JamesHorvath, president and CEO of thesugarbeet grower’s cooperative says,
“Turning sugar over to the governmentis not something we do lightly. Howev-er, market conditions at this time makeforfeiture a viable alternative.”
Under the sugar price-support pro-gram administered by USDA, proces-sors may pledge sugar as collateral fornine-month loans. If market prices arebelow the loan rate for sugar, theprocessor may forfeit sugar to USDAinstead of repaying the loan.
Horvath pointed to a number of fac-tors that combined to push U.S. sugarprices to their lowest level since themid-1980s. Foremost among these aretrade and domestic policy issues.Traditionally, USDA managed sugarimports to balance supply and demand.Horvath says a number of recentactions by government policymakershave limited USDA’s ability to use thistool to the extent it has in the past.
“In the Uruguay Round of theWorld Trade Organization negotia-
tions, the government agreed toimport at least 1.25 million tons ofsugar each year, regardless of whetherthe U.S. market needs the sugar ornot,” Hovarth says. “This means thatforeign sugar coming into the U.S. iscausing pressure on prices.”
Another source of price weaknesswithin the U.S. sugar market is some-thing called “stuffed molasses.” Thismixture of sugar and molasses, made inCanada and brought into the UnitedStates, wreaks havoc on the industry.Horvath says that stuffed molassesimports will displace at least 100,000tons of domestic sugar this year.
Finally, he says, there is potential foran increase in sugar imports from Mex-ico. Under the North American FreeTrade Agreement (NAFTA), that coun-try can ship unlimited amounts of sug-ar into the U.S. market after it pays a“second tier tariff.” Mexican sugar pro-duction has grown dramatically since
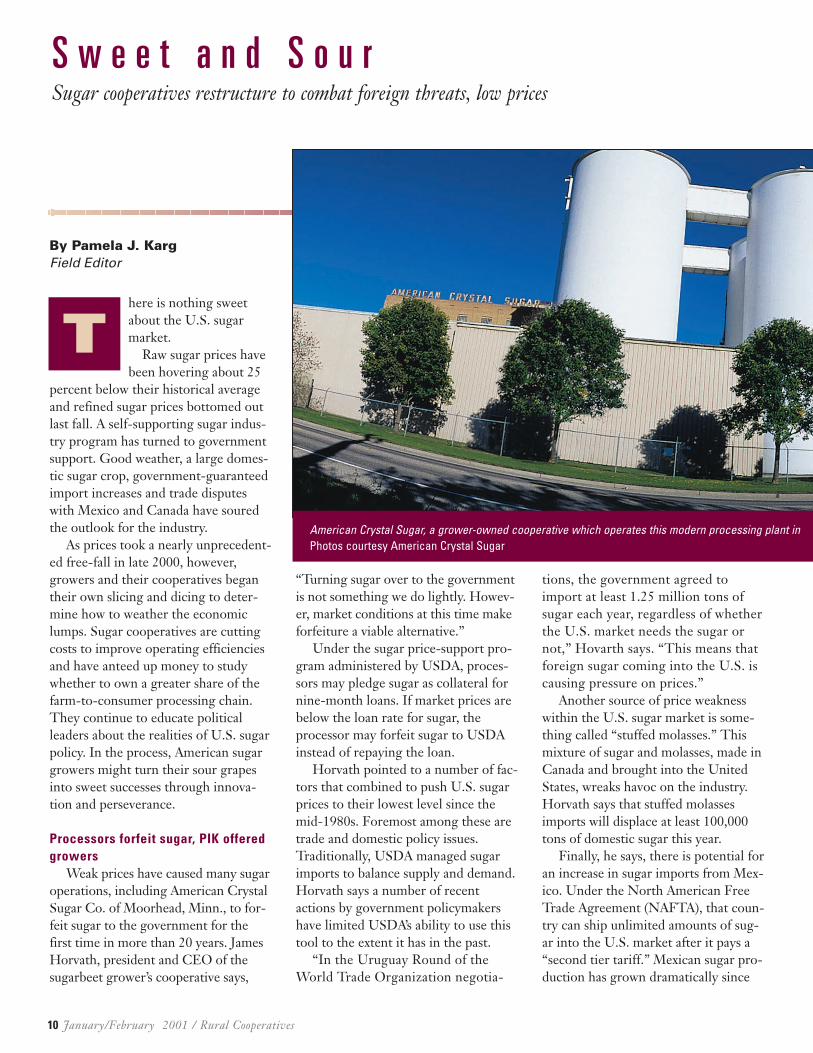
S w e e t a n d S o u rSugar cooperatives restructure to combat foreign threats, low prices
T
American Crystal Sugar, a grower-owned cooperative which operates this modern processing plant in Photos courtesy American Crystal Sugar
implementation of NAFTA in 1994.Because of sharp declines in worldmarket prices, Mexican producersdivert some of their surplus here.
“When NAFTA was being negotiat-ed, the second tier tariff provision did
not look like a threat to U.S. produc-ers,” according to Horvath. “Now,because of the very poor prices avail-able in the world market, paying thesecond tier tariff and shipping sugarinto the U.S. is beginning to look moreattractive to Mexican sugar producers.”
Trade issues are compounded by alarge domestic sugar crop this year.“Some U.S. sugar producers wereblessed with a very good crop this year,both in cane and beet areas,” Horvarthsays. “This is certainly a part of thesupply/demand balance. Even thoughAmerican Crystal’s shareholders har-vested fewer tons in 1999 than in 1998,we are getting more sugar per ton.Putting these two factors together, ourtotal sugar production will be about the same.”
Poor domestic prices have forcedAmerican Crystal to forfeit sugar toUSDA. “The Sugar Program approvedby Congress in 1996 gives sugar pro-
ducers the loan program as a way toensure the market is balanced,” Hor-vath said. “Last fall, forfeiture to thegovernment was the best financialalternative for our shareholders. How-ever, our long-term interest is to bring
the market back into balance. If thatcan be accomplished, we anticipateprices would return to the levels nor-mally provided by the Sugar Program.”
On the grower side of the supplyequation, USDA’s Commodity CreditCorporation (CCC) offered a Pay-ment-In-Kind (PIK) diversion pro-gram. The PIK program offered sugarbeet producers the choice of divertingfrom production a portion of their cropin exchange for sugar held in CCCinventory. CCC Executive Vice Presi-dent Keith Kelley reported that pro-ducers submitted 5,022 acceptable bidsto participate in the program. Sugarbeet acreage diverted from productiontotaled 101,832.9 acres.
By reducing the 2000 harvest, thePIK program helped lower governmentinventory costs, alleviate the currentover-supply of sugar resulting fromchanges in supply conditions, and con-sequently strengthen sugar prices. CCC
transferred title to 277,349 tons ofrefined crystalline sugar to participatingproducers, or their assignees, on Dec. 1.The acres diverted from production bythe PIK program represented about 7percent of acreage planted to sugar-beets. Transfer of this sugar will resultin about a $555,000 reduction inmonthly CCC storage-related outlays.The sugar transferred from CCC inven-tory also represented about 7 percent ofthe expected fiscal year 2001 domesticsugar production from sugarbeets.
Testifying before the Senate Agricul-ture Committee in late summer, Hor-vath said that his farmer/owners “aresupportive of this (PIK) concept. Webelieve it achieves several worthwhileobjectives for the industry and the gov-ernment.” He listed these benefits:� It helps reduce the current oversup-ply of sugar by cutting the number ofharvested acres this year.� It saves USDA the responsibility ofobtaining and managing large amountsof purchased or forfeited sugar.� It starts the industry down the roadto balance an over-supplied market.� It saves the government money.
Nevertheless, Horvath emphasizedthat PIK does not eliminate the need forUSDA to purchase additional sugar. In aletter to then-Agriculture Secretary DanGlickman, the domestic sugar industryrepresentatives said, “We cannot empha-size too much how important we believeit is that USDA issue an announcementimmediately of an additional sugar pur-chase, in a significant amount, to avoidCCC sugar loan forfeitures.”
In a September 2000 editorial, TheMiami Herald weighed in on the sugarsituation. “The full impact of the failureof the 1996 Freedom to Farm Act willbe felt in South Florida as sugarcanegrowers forfeit their crops in lieu ofrepaying $141 million in governmentloans,” the editorial reads. “AmongMidwest beet farmers, the losses to tax-payers are likely to be much greater,$251 million… In theory, Freedom toFarm and the weaning of farmers fromgovernment controls had a lot going forit. Even today, the U.S. Department ofAgriculture can point to studies show-
Rural Cooperatives / January/February 2001 11
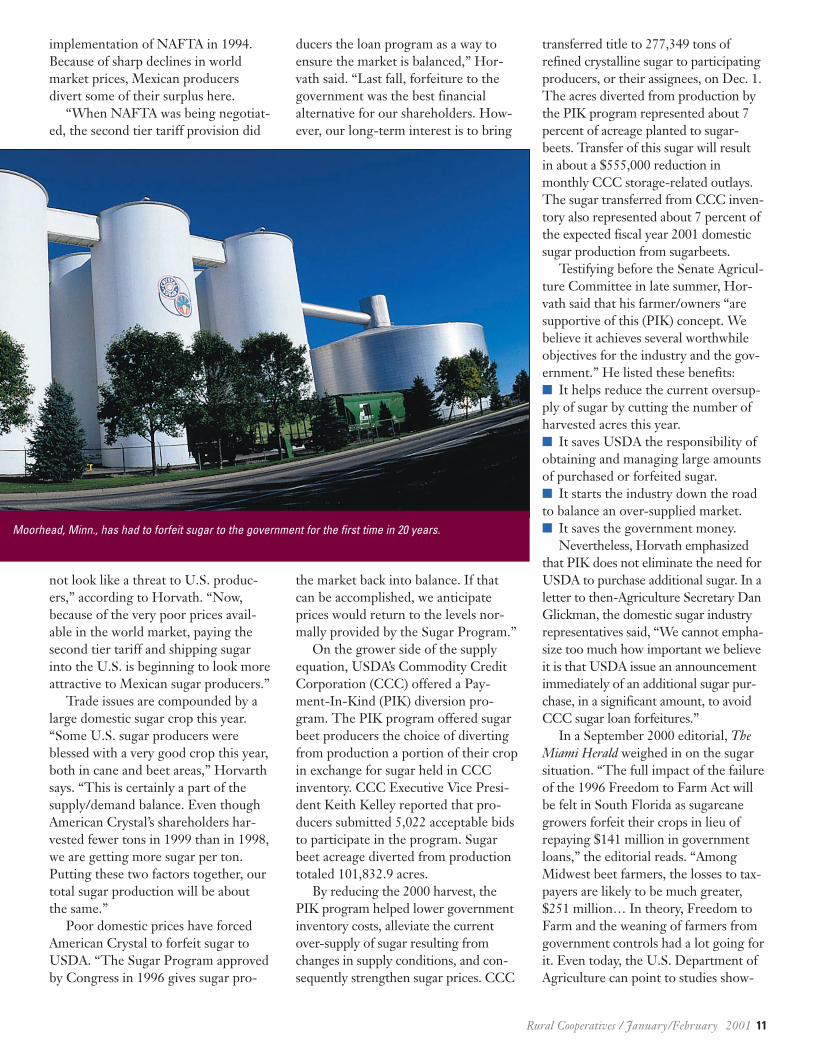
Moorhead, Minn., has had to forfeit sugar to the government for the first time in 20 years.
12 January/February 2001 / Rural Cooperatives
ing that farmers are generally better offthan they would have been under theprograms that had government tellingfarmers what to plant and guaranteeingminimum prices. However, the newpolicy isn’t working for all the farmersor all the commodities, and the sugarprogram is one example.”
Diversifying, owning operationsAmerican Crystal Sugar, the largest
U.S. sugar beet processor, is owned bynearly 3,000 grower/shareholders inthe Red River Valley of North Dakotaand Minnesota.Throughout the1990s, AmericanCrystal and oth-er partnersformed severalmarketing agen-cies in common(MAC) and jointventures toexpand market-ing and to diversify agriculturalopportunities for area farmers.
One marketing agency in common,United Sugars, was started in 1993 byAmerican Crystal; Minn-Dak FarmersCooperative, Wahpeton, N.D.; andSouthern Minnesota Beet Sugar Coop-erative, Renville, Minn. By poolingtheir resources, the three co-opsformed the nation’s largest beet sugarmarketing company. In 1997 amidheavy blizzards and a 500-year flood,United States Sugar Corporation, aClewiston, Fla., sugarcane grower andprocessor owned primarily by employ-ees and two charitable foundations,joined the venture. That additionincreased United Sugars’ share of theU.S. market to 25 percent. That sameyear, American Crystal introducedPillsbury Best, the country’s firstnational brand of sugar.
The three Upper Midwest sugarbeetcooperatives had developed close work-ing relations in 1979 by forming Mid-west Agri-Commodities, a marketingagency in common. American Crystal,Minn-Dak and Southern MinnesotaBeet Sugar Cooperative are partners inthe organization that markets molasses,
beet pulp and other byproducts. American Crystal has a 46-percent
ownership interest in ProGold LLC.The corn syrup plant in Wahpeton,N.D., was organized as a farmer-owned,value-added processor in 1996 by Gold-en Growers Co-op, American CrystalSugar and Minn-Dak Farmers Cooper-ative. It began operations just beforehigh-fructose corn syrup prices droppedby 28 percent. Operating losses causedthe new cooperative to lease its plant toCargill, which manages all aspects of itsoperations. Operations were halted
temporarily Jan. 16.American Crystal Sugar Company
has a 50-percent ownership interestin Crystech, LLC, which was formedto acquire, construct, finance, oper-ate and maintain a molasses desug-arization facility at the Hillsboro,N.D., sugar factory. The Crystechfacility came on line in 2000.
Success of the Minnesota and NorthDakota sugar beet cooperatives hasinspired western U.S. sugar farmers toexplore ways to capture a greater shareof the consumer food dollar. Growersare bidding to buy sugar plants ownedby Tate & Lyle’s Western Sugar Co. andby Imperial Sugar’s Holly division.Frank Eckhardt of the Colorado Sugar-beet Growers Association believes farm-ers will raise the money and the plantswill come under farmer ownership.
“This goes back to 1974 when wewanted to buy the Great Western Sugarplants,” Eckhardt says. “But a mannamed White got them, who then soldthem to the Hunt Brothers in the early1980s. When they went bankrupt, Tate& Lyle North American Sugars boughtthem. Every 10 to 12 years, we’ve hadto go through somebody else buyingthem. When times were tough, privateinvestors got out and growers had a
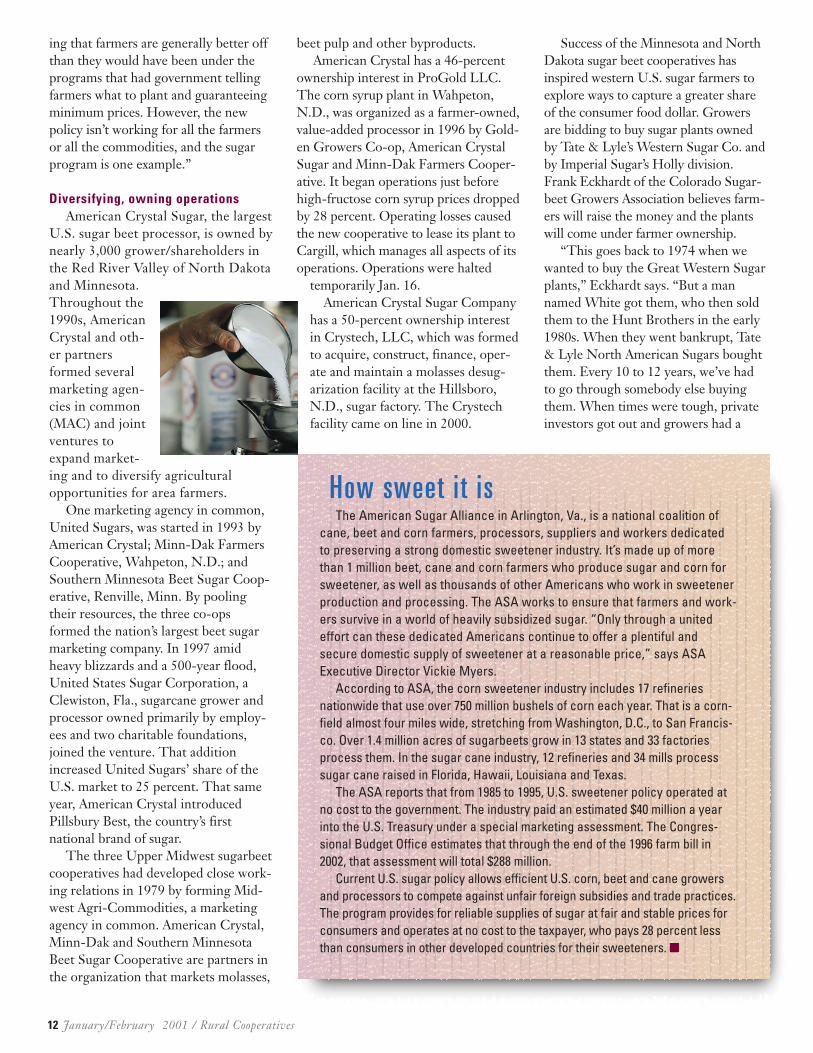
The American Sugar Alliance in Arlington, Va., is a national coalition ofcane, beet and corn farmers, processors, suppliers and workers dedicatedto preserving a strong domestic sweetener industry. It’s made up of morethan 1 million beet, cane and corn farmers who produce sugar and corn forsweetener, as well as thousands of other Americans who work in sweetenerproduction and processing. The ASA works to ensure that farmers and work-ers survive in a world of heavily subsidized sugar. “Only through a unitedeffort can these dedicated Americans continue to offer a plentiful andsecure domestic supply of sweetener at a reasonable price,” says ASAExecutive Director Vickie Myers.
According to ASA, the corn sweetener industry includes 17 refineriesnationwide that use over 750 million bushels of corn each year. That is a corn-field almost four miles wide, stretching from Washington, D.C., to San Francis-co. Over 1.4 million acres of sugarbeets grow in 13 states and 33 factoriesprocess them. In the sugar cane industry, 12 refineries and 34 mills processsugar cane raised in Florida, Hawaii, Louisiana and Texas.
The ASA reports that from 1985 to 1995, U.S. sweetener policy operated atno cost to the government. The industry paid an estimated $40 million a yearinto the U.S. Treasury under a special marketing assessment. The Congres-sional Budget Office estimates that through the end of the 1996 farm bill in2002, that assessment will total $288 million.
Current U.S. sugar policy allows efficient U.S. corn, beet and cane growersand processors to compete against unfair foreign subsidies and trade practices.The program provides for reliable supplies of sugar at fair and stable prices forconsumers and operates at no cost to the taxpayer, who pays 28 percent lessthan consumers in other developed countries for their sweeteners. �
How sweet it is
chance to get in, but times were toughfor us, too,” Eckhardt explains. Howev-er, current owner Tate & Lyle – basedin England and one of the world’slargest sugar industry players — hasbeen receptive to a farmer buyout.
“They’re offering the plants at theirappraised value. Because the farmershave been investing in the plant, silos andequipment all along, we have $12 millionin equity built up. We would have hadmore, but we lost it all when the HuntBrothers went broke. So now we willonly need to pay $78 million for theplants instead of the $90 million they’reappraised at,” Eckhardt explained.
To buy the six sugar plants – oneeach in Montana and Wyoming, andtwo each in Colorado and Nebraska –several western organizations bandedtogether to form the Rocky MountainSugar Growers Cooperative. Includedin the founding group is Eckhardt’s Col-orado sugarbeet bargaining association,for which he serves as board treasurer.
“It seems as though there’s onlyenough profit for one entity anymore,and a cooperative has more latitude inoperations and sales,” Eckhardt said.
Western sugar growers are hearingthe message. The co-op is asking grow-ers to commit $185 per acre of plantedbeets, with $35 per acre due by Feb.1and the rest a month later. The co-op isseeking commitments representingabout 185,000 acres in the four states.
The sale faces a March 31 deadline.There are over-subscriptions in Mon-tana, and Wyoming is right on targetwith the amount of acres that havebeen contracted in the past to supplythe plant, said Rick Rodriguez, vicepresident of the Big Horn Basin BeetGrowers. Big Horn Basin is a partnerin the farmer buy-out effort.
“We were a little skeptical goinginto this, but I’m meeting with mygrowers this morning to go throughsome more questions they have. I’dhave to say everyone is fairly positiveabout this. There’s even a few grow-ers who have decided not to go in,but they sure hope it works out
because they don’t want Rodriguezfarms to suddenly be marketing 1,500acres of (pinto) beans,” Rodriguez said.The Basin area has a short growingseason and crop production mainstaysare malt barley on contract for Coorsbeer, some seed crops, sugarbeets anddry beans. Rodriguez and his father,Paul, plant about 1,500 acres of sug-arbeets. Switching to another cropcould upset the agricultural marketbalance in the Big Horn.
“Even the guys downtown realizethe importance of sugarbeets to thisarea. It’s a $30 million industry here,when you consider growers andemployees at the Lovell plant,”
Despite some major obstacles, American sugar producers remain amongthe world’s most efficient, according to a global survey by the renowned com-modities research firm, LMC International, based in Oxford, England.
For the most recent five-year period studied, 1994/95-98/99, U.S. cornsweetener producers were the lowest cost of 19 countries, U.S. beet sugarproducers were second lowest cost of 40 countries, and U.S. cane sugar pro-ducers ranked 31st among 63 nations. For beet and cane sugar combined, theU.S. ranks 32nd among 102 countries studied. “Adding in the very cost competi-tive corn sweetener industry lifts the combined U.S. sweetener sector to 20thplace out of 120 countries,” said LMC analyst Martin Todd.
Todd said U.S. corn sweetener producers have long been the world’s low-est cost producers by far, and that American sugar producers have managedto improve their ranking in each of the five-year periods LMC has studiedsince 1979.
Todd said the U.S. producers’ ranking is all the more impressive becausethey faced two major obstacles. One is that their competition is dominated bydeveloping-country cane producers “where wages are generally very low andenvironmental regulations tend to be far less stringent than in the U.S.,” hesaid. Developing countries produce two-thirds of the world’s sugar.
The second obstacle was the strong value of the dollar, which has soaredin value by about two-thirds in the past 20 years against the currencies ofmost other cane-producing countries. Todd explained, “A strong dollar acts toinflate that value of your costs relative to other countries, irrespective ofwhether or not you have managed to lower your own costs.”
Todd said, “The second half of the 1990’s presented the U.S. sweetenerindustry with a stern test of its ability to remain internationally cost competi-tive. Perhaps the greatest of these has been the strengthening of the U.S. dol-lar, which is beyond the control of domestic producers. Nevertheless, theindustry has shown itself equal to the challenge, maintaining its impressiveinternational ranking as a sugar and sweetener producer.” �
U.S. ranked among world’s lowestcost producers
Rural Cooperatives / January/February 2001 13
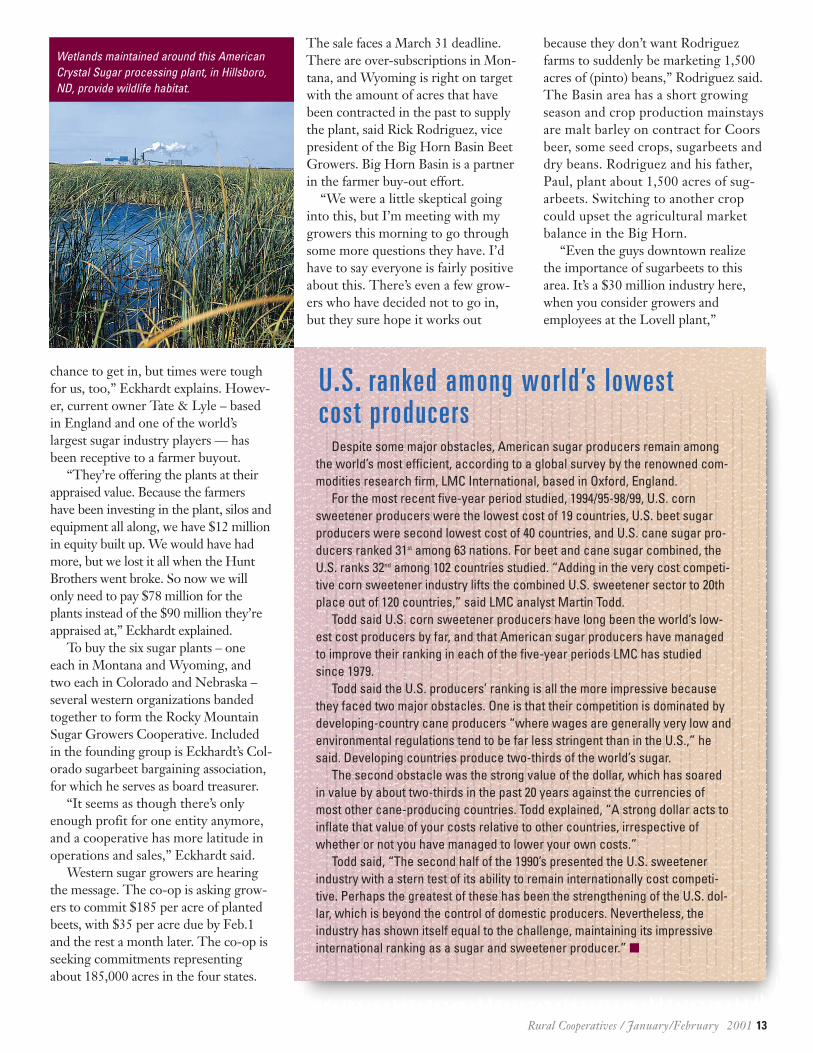
Wetlands maintained around this AmericanCrystal Sugar processing plant, in Hillsboro,ND, provide wildlife habitat.
Rodriguez added. “I just got a $100 check from the localKiwanis to put towards our feasibility study costs. And we’vereceived money from all three cities in the area – Powell,Cody and Lovell – as well as Big Horn and Park counties.The state didn’t have any money, but did help us secure a$25,000 USDA grant.”
Eastern Colorado may be a bit over-subscribed and west-ern Colorado is still uncertain, Eckhardt added about hishome state.
“The average age of farmers is a little higher in the west-ern region. They have a few more options because of thecontinued population growth and land pressures, and if theydon’t have children coming into the business, this is a harddecision to make. If we do this right, those older farmers whodo come in can make some money,” explains Eckhardt, whofarms 1,750 acres of sugarbeets, onions, potatoes, ediblebeans, shelled corn and silage corn at LaSalle, Colo., nearGreeley. The fourth-generation farm includes his two sons.Some years, his sugar acres are the second- or third-highestincome generators in the operation.
“Sugarbeets have just worked a lot better in our rotationand with the price fluctuations for different commodities,” hesays. “With different trade policies coming into play, prices tofarmers haven’t been too good. So we just feel that, as a coop-erative, we could do better with marketing and keeping pricesmore stable for farmers.”
Helping the newly formed Rocky Mountain groupthroughout these initial stages has been Larry Steward. Heretired in September as chief executive officer of Minn-DakFarmers Cooperative in Wahpeton and planned to move toColorado. “But he’s agreed to help us during the feasibilitystudy. When we get going, our plan would be to hire him asour CEO,” said Rodriguez.
By mid-January, it was uncertain what Nebraska growerswould do. While a number of them had put up a $2-per-acrefee to fund the feasibility study, Nebraskans now have a sec-ond option to consider after Imperial Sugar Co. announcedits Holly Sugar plants in Wyoming and Montana may closedue to financial troubles.
Randon Wilson, a Salt Lake City lawyer working on bothproposals and providing assistance to similarly affectedMichigan beet growers, said Western and Holly growers havetalked about joining forces if their efforts succeed. Thatwon’t happen if too few growers back the Tate & Lyle buy-out, he told the Scottsbluff, Neb., World-Herald.
Nebraska panhandle growers “have got a clear choice,”said Wilson, who helped Idaho and Oregon beet growers buyAmalgamated Sugar Co. in 1997. “They either save the(local) industry or sentence it to death.”
Eckhardt added that, if the grower buyout fails, Tate &Lyle say they will shut down Western Sugar’s factories aftercontracts with growers expire in 2003. He and other organiz-ers don’t think that way; they foresee a sweeter future. �
14 January/February 2001 / Rural Cooperatives
“The American sugar farmers I work with every day arehaving a really scary Halloween, with prices they receivefor their crop down by almost a third in the four years ofoperating under the current Farm Bill,” said Luther Mark-wart, executive vice president of the American SugarbeetGrowers Association (ASGA) this past October. The eco-nomic picture remained unchanged months later.
“At the same time,” he said, “the big internationalmanufacturers of sugar-containing products — from can-dy makers to bakers and cereal companies — continueto raise their prices.”
Markwart, who is also chairman of the American Sug-ar Alliance, cites figures from the Bureau of Labor Statis-tics and USDA in making his assertion. “Since the start ofthe 1996 Farm Bill, the wholesale refined sugar price hasdropped almost 29 percent. The price for raw cane sugar
has declined during this same period by more than 14percent,” he said.
“The price consumers pay for candy has risen morethan 6 percent during this period. Cereal prices are upalmost 7 percent, cookies and other bakery products areup 8 percent and ice cream prices have climbed by 10 per-cent,” Markwart said. “Even for sugar on the grocery storeshelf, despite the dramatic one-third plunge in the whole-sale price, the price consumers pay has barely declined atall, a mere half-a-percentage point,” he added.
The ASGA incorporated in October 1975 to unite thesugarbeet growers in the United States and promote thecommon interests of its members, which include legisla-tive and international representation and public rela-tions. ASGA represents over 12,000 sugarbeet farmers in13 states. �
Candy goblins gobble up profits from lower sugar prices
Randall E. Torgerson, Deputy AdministratorUSDA Rural Business-Cooperative Service
Editor’s note: this article is based on the author’s remarks atthe annual Pacific Coast/National Cooperative Bargaining Con-ference in Reno, Nev.
aking a critical look at the concept of new-gen-eration cooperatives is a topic where some havefeared to tread. But in the wake of the recentbankruptcy of Tri Valley Growers, it is asubject that merits close attention.
Growers have two basic organizational strategies forachieving marketing power. One is by organizing horizon-tally to help establish farmgate prices. In addition to coop-erative bargaining associations, guilds, alliances and farmorganizations are variants that engage in the pricing ofidentity-preserved commodities.
The second strategy is vertical integration, by whichproducers seek to add valuebeyond the farmgate throughcooperative marketing.
All business organiza-tions have three distinguish-ing features: ownership,control and who receivesthe benefits. The coopera-tive is owned and controlledby its users through democ-ratic or proportional voting.It is capitalized by thoseusing its services andreturns to capital are limit-ed. And it is obligated toreturn net margins (bene-fits) to users on the basis oftheir patronage. We define a cooperative as a user-ownedand user-controlled business in which benefits arereceived in proportion to use.
What is different about new-generation cooperatives interms of structure and operations? A number of elementsincorporated in these co-ops have been found in Californiafor a number of years. But they were reborn on the highplains and prairies of North Dakota and Minnesota in the
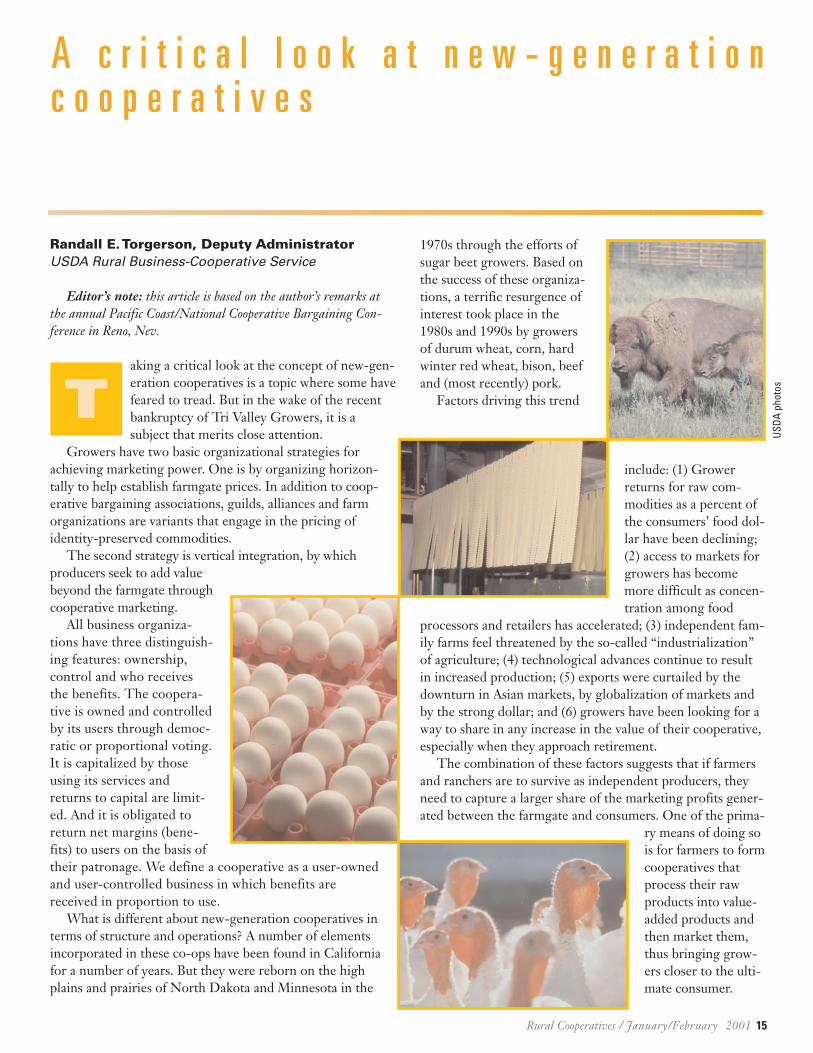
1970s through the efforts ofsugar beet growers. Based onthe success of these organiza-tions, a terrific resurgence ofinterest took place in the1980s and 1990s by growersof durum wheat, corn, hardwinter red wheat, bison, beefand (most recently) pork.
Factors driving this trend
include: (1) Growerreturns for raw com-modities as a percent ofthe consumers’ food dol-lar have been declining;(2) access to markets forgrowers has becomemore difficult as concen-tration among food
processors and retailers has accelerated; (3) independent fam-ily farms feel threatened by the so-called “industrialization”of agriculture; (4) technological advances continue to resultin increased production; (5) exports were curtailed by thedownturn in Asian markets, by globalization of markets andby the strong dollar; and (6) growers have been looking for away to share in any increase in the value of their cooperative,especially when they approach retirement.
The combination of these factors suggests that if farmersand ranchers are to survive as independent producers, theyneed to capture a larger share of the marketing profits gener-ated between the farmgate and consumers. One of the prima-
ry means of doing sois for farmers to formcooperatives thatprocess their rawproducts into value-added products andthen market them,thus bringing grow-ers closer to the ulti-mate consumer.
Rural Cooperatives / January/February 2001 15
A c r i t i c a l l o o k a t n e w - g e n e r a t i o nc o o p e r a t i v e s
T
USDA
pho
tos
16 January/February 2001 / Rural Cooperatives
Farmer organizations — such as the National Wheat Grow-ers, National Corn Growers and National Pork ProducersCouncil — have become leading proponents urging theirmembers to move in this direction.
Based on these facts, many growers have pursued a verti-cal-integration strategy by organizing for marketing. Com-mon characteristics of these new-generation cooperatives arethat equity investment is a prerequisite to establishing deliv-ery rights. These delivery rights are part of a producer mar-keting agreement (contract) that pools the delivery of prod-ucts and links them to equity units purchased in thecooperative. If a grower is unable to deliver his agreed rawproducts, purchase of commodities is authorized by thecooperative for undelivered obligations. Delivery rights are
allocated according to plant processing capacity. This closesmembership at plant capacity.
Delivery rights are in the form of equity shares that canbe sold to other eligible producers at prices agreed to by thebuyer and seller. The board of directors approves all stocktransfers to assure that they are held only by eligible pro-ducers. This prevents ownership by outside investors. Thevalue of delivery rights (shares) may appreciate or depreci-ate in value depending upon the performance of the coop-erative. High levels of cash patronage refunds are issuedannually to producers since they have substantial risk capitalinvested in the organization.
The advantage of the new-generation cooperativeapproach is that adequate equity capital is raised at the out-set. The burden of capitalization is distributed equitably inproportion to future use of the marketing organization. Sub-stantial up-front investment by members means that theywant the business to succeed. And, assuming the business isperforming adequately, exiting members can sell their invest-ed equity at a value reflecting the cooperative’s performance.
Like any business, future success depends upon a well-founded business strategy, identification of a ready marketfor the product, sound management, a strong role by theboard of directors overseeing policy direction of the orga-nization and protecting members’ assets, and goodboard/management relations. The organization also has tofollow sound cooperative practices. Deviation from theseoften spells trouble, often leading to poor performance oreven the failure of the business.
Examples of new-generation cooperatives include: Dakota
Growers Pasta Cooperative, Spring Wheat Bakers, SouthDakota Soybean Processors, North American Bison Cooper-ative, Iowa Turkey Growers Cooperative, U.S. PremiumBeef and Corn Plus ethanol cooperative. A number havestarted from scratch and built new facilities. Others, such asPacific Coast Producers, have taken over ownership ofprocessors that growers were formerly supplying.
A variant of these new-generation marketing cooperativesare those organized for farm production purposes. Produc-tion cooperatives have been organized by corn and soybeangrowers to add value to their raw commodities by feedingthem to poultry and livestock. New, large-scale productionenterprises have been organized in the pork, egg and dairysectors. Examples are ValAdCo pork producers, Golden Oval
and Dakota Layers Cooperative, and some new dairy cooper-atives in Kansas and North Dakota.
It is estimated that between 75 and 100 new-generationcooperatives have been organized to date. Many are still inthe formative stages. But of those that are operating, we canidentify some strengths and shortfalls, and lessons to learn.
How are they performing? Four issues can be raised about the existence and perfor-
mance of new-generation cooperatives: ability to control pro-duction, stock vs. non-stock form of business, exclusivity inthe farming community and the business culture.
New-generation cooperatives, in theory, are very marketoriented — they find a market for their output and producefor it, expanding production of processed products only tomeet increasing demand. Presumably, they do not expandproduction beyond the immediate market. Evidence to dateon this score is mixed.
In their formative stages, new-generation cooperativeshave done an excellent job of identifying markets for theirprocessed products, i.e., not just producing something andthen asking the market to take it. This has been accom-plished through thorough market research as a part of theirfeasibility analyses and then activating a particular marketingstrategy in a business plan. Clearly, this has been a plus.
Over the long term, however, it does not appear thatthey are immune from the trap of many isolated unitsmaking independent production decisions and then over-producing for the market. This is the exact same dilemmathat faces individual growers and is the Achilles heel of
One of the attributes of new-generation cooperatives, in theory, is that they are very market oriented — that is, theyfind a market for their output and produce for it.
Rural Cooperatives / January/February 2001 17
independent growers, each making their own productiondecisions in isolation.
One current example is the dilemma found in the sugarindustry (see related story, page 10). Like many other com-modity sectors, refined sugar is being produced in sugarbeet country in excess of market needs, despite the fact thatabout one-half of the production is sourced from new-gen-eration cooperatives in the Red River Valley, Idaho andWashington. Production expansion has occurred in recentyears where cooperatives have believed that they have astrategic advantage.
Marketing cooperatives by themselves are not a mecha-nism for industry-wide production reduction andrestraint. Indeed, this is one reason that they have beenlooked upon – in aggregate – as a competition-enhancinginfluence on markets.
Business form is a hot-button issue. Most states permitincorporation under either non-stock or capital stock coop-erative statutes. At one time, there was a movement thatsuggested that the non-stock cooperative was a purer formof cooperative. This feeling was particularly strong in Cali-fornia in the 1920s. However, many U.S. cooperativesinvolved in value-added marketing are organized on a stockbasis. The conversion of Tri Valley Growers to a stock planraised this issue again.
Exclusivity is another key issue. Cooperatives haveoften had open membership policies under which growerscould freely join, sometimes simply by walking in the doorand transacting business. This has been especially true inthe farm supply business and many raw commodity mar-keting and bargaining associations. Larger numbers ofproducers often translate into larger volumes, greateroperating efficiencies, more strength in the market and afeeling of community spirit.
To the extent that new-generation cooperatives are onlyopen to those who can afford sometimes high, up-frontcapitalization investments, they are viewed as more restric-tive in their membership. Rather than having a rising tidethat lifts all boats, only those that can afford to invest arebenefactors. This criticism is heightened in those new-gen-eration cooperatives that tie membership control to thenumber of delivery rights owned, instead of the more typi-cal one-person, one-vote rule.
A fourth issue is the potential for new-generation coop-eratives to take on more of an “investor” than a “coopera-tive” culture. Since access to delivery rights is linked toinvestment in shares and an internal market is created forthese delivery rights, some critics feel there is a potentialfor the organization to become more driven by return-to-capital than by return-to-use as a guiding principle. Thisbecomes exacerbated if the business is allowed to be orga-nized as a limited liability company that has managementor other outside investors. A trend can easily developwhereby the business is driven strictly by return-on-invest-ment considerations. It then evolves culturally into just
another business — not one dedicated solely to serving theinterest of growers.
Co-op practices need scrutinyIn the United States, share of marketing activity repre-
sented by cooperatives has doubled since the 1950s. Andthere is a great deal of opportunity for future growth. Whenproblems occur, it is generally due to faulty practices. Theselead to under-performance of the business and, in some cas-es, to ultimate failure.
A few new-generation cooperatives have experiencedproblems, including:
1. Purchase of delivery rights outside of a grower’s pro-duction territory.
2. Use of purchases “off the market” rather than a mem-ber’s delivery as a predominant means of fulfillingdelivery right obligations.
3. Leasing of delivery rights as a way to hold on to appre-ciated value rather than having ownership in the handsof active producers.
4. Making fixed-term market obligations for final productswhen the market for a raw commodity is short, causingwide price disparity for producers and losses for thebusiness.
5. Hiring of management from outside of the industrythat doesn’t know intricacies of the market or how toadapt their management style to a user-owned business.
6. Sourcing equity outside of membership, thereby result-ing in conflicting goals and fiduciary responsibilities.
7. Attempts by board members to micro-manage thebusiness.
8. Engaging in large amounts of non-member business.9. Efforts by the board chairman to also serve as chief
executive officer, creating lack of trust within the membership.
Ownership of delivery rights One successful new-generation cooperative in Minnesota
decided to expand operations in a state that was not even con-tiguous to it. Instead of selling delivery rights for supplying thenew plant to producers surrounding it, many of the deliveryrights were purchased by existing members in the distant state.Similarly, some producers subscribed to more delivery rightsthan they had the capacity to deliver from their own farms.
This practice violates basic tenets of operating on a coop-erative basis, in which value is added to the production ofone’s own farming operation. Instead, it appears that returnon investment was simply sought by processing someoneelse’s raw commodities.
Off-market purchasesThe provision for purchases “off the market” in new-
generation cooperatives was put there because of the possi-bility of a drought, hail storm or disease that would make itimpossible for a member to fulfill his or her contractual
18 January/February 2001 / Rural Cooperatives
delivery obligation. To keep the plant running at capacity,the cooperative could make purchases on the open marketin the member’s name.
Some new-generation cooperatives have made this a com-mon practice, again losing the traceability of productionfrom one’s own farm through the cooperative. This practiceagain smacks of operating more like an investor-owned firmthan a user-owned business. Some California cooperativeshave even been processing non-member products (cash mar-ket) instead of using plant capacity to process members’products under marketing agreements. This has led to mem-ber dissatisfaction in several instances and criticism thatmembers are being treated as residual claimants rather thanprimary beneficiaries.
Leasing of delivery rightsCooperative control should be vested in the hands of
active producers. The recent payment-in-kind (PIK) pro-
gram for sugar beet growers disclosed that many sugar coop-erative members — particularly older ones — had leasedtheir delivery rights to other producers. This presented manyadministrative problems for USDA.
The sugar program notwithstanding, the fact that deliveryrights were leased clearly shows a problem. Growers holdingdelivery rights, while not actively producing themselves, aredoing so based on expected appreciation in value of thoserights or for tax purposes regarding their estates. This is aproperty rights issue, not unlike production quotas, whichrequires active monitoring by boards of directors and theneed for policy direction. Otherwise, ownership in the coop-erative could end up in the hands of retirees rather thanactive producers.
The previous three practices are those particularly relat-ed to new-generation cooperatives. The following six arerelated to all types of cooperatives including the new-gener-ation variety.
Fixed-term market obligationsA Minnesota new-generation cooperative ran into severe
difficulty when its management entered into fixed-price con-tracts for sale of processed products at a time when a shortcrop led to skyrocketing raw commodity prices. Millions ofdollars in losses occurred that threatened to wipe out a largepart of the entire grower equity base.
In order to survive, the company had to seek an outsideequity investor, in this case a major investor-owned firmthat was in the same business. When it recovered from thedebacle, members wanted to buy out the outside firm, butfound resistance to liquidating the investment by the out-side company, which had been given some control over thecooperative’s marketing operations as a condition of invest-ment. In an era of fluctuating commodity prices associatedwith the global market, this shows that boards have to scru-tinize management activities through policies that assurecontinuity of operations.
Hiring management from outside the industryIt is a necessity to secure top management that believes in
the cooperative method of doing business and understandsbasic cooperative principles and practices. Numerous exam-ples can be found where outside management is hired thatpossesses little understanding of the cultural differences
between user-owned and investor-owned businesses, andmoreover are not predisposed to learning about them. As aresult, both board and management experience a great dealof frustration that leads to under-performance. Similar situa-tions can be found where a successful manager in one indus-try is brought in to another, but an understanding of theessential nuances of that industry is missing. This results inpoor decisions and can lead to failure.
Outside EquityA basic cooperative operating premise is that control fol-
lows investment. If farmers want to control their business,they have to invest in it. There simply is no substitute forgrower equity in a cooperative. Some people like to promoteoutside ownership in cooperatives without realizing that thisact changes the basic fiduciary relationship within the organi-zation. Conflicting goals result between maximizing returnsto investors and maximizing returns to grower owner-users.Basic methods of providing equity capital are through up-front subscription, retained annual earnings and per-unitcapital retains. One or a combination of these must be usedto finance the value-added marketing business.
Using outside sources of ownership dilutes the purposeand the direction of cooperatives — frequently makingthem more management than producer controlled. Readysources of debt capital continue to be available to coopera-
A basic cooperative operating premise is that controlfollows investment. If farmers want to control theirbusiness, they have to invest in it.
Rural Cooperatives / January/February 2001 19
tives that are creditworthy through the cooperative creditsystem and other sources.
Board micro-management A key to successful cooperatives is good board-manage-
ment relations. This is a practice that is a two-way street andhas to be worked on every day of the year. It requires con-stant education about the respective roles of each. Boardsmust hire qualified managers in whom they have confidenceand then turn over the day-to-day managerial responsibili-ties to them. Boards set policies that guide managers andprovide them adequate room with which to manage. Periodic evaluations determine if objectives are being metand whether corrective action is required. Managers have aresponsibility for maintaining good board-management rela-tionships. Boards that develop an adversarial attitude towardmanagers or attempt to second guess decisions by micro-managing are destructive.
As an example, the board of a commodity promotionorganization in Wisconsin was spending board meeting timegoing over every check written by the association. A NorthDakota sugar beet cooperative lost a very resourceful manag-er because a few board members were attempting to dictatehiring and other belt tightening measurers rather than lettingthe manager handle it. These are examples of actions thatlead to mistrust that eventually can lead to the demise of acooperative.
Non-member businessEngagement in large amounts of non-member business
can lead to changing priorities in a cooperative. It is oftenjustified on the basis of using tax-paid surplus as a cushion forlosses. But it can also shift management’s attention to maxi-mizing profits at this end of the business rather than enhanc-ing returns to member-users. Over time, the culture of theorganization changes to operating more as an investor-ownedrather than a user-owned business. Recent developments inCalavo exemplify this development.
Attempts to wear two hatsPeriodically, we see a board chairman who thinks he
should also wear the hat of the chief executive officer. Thissituation is closely related to the former issue of micro-managing, but is a special case. While there is no questionthat one of the primary responsibilities of a board of direc-tors is to see that members’ assets are protected and that theorganization is being operated in the members’ interests,attempts by board leaders to substitute their policy rolewith executive management responsibilities simply doesn’twork in cooperatives.
Much progress, strong potentialDespite identifying certain practices that have been, or
have the potential to be, problematic for new-generationcooperatives, there are many more success stories. The fail-
ure rate has not been high. We have to consider this newform of organization as a work in progress in which continualfine-tuning and adjustments will be made to enhance theirpotential for success on all operational fronts: governance,transfer of delivery rights, capitalization methods, poolingrules, expansion options and membership relations.
A number of these projects typify farmers’ and ranchers’efforts to identify niche markets that they can fill withoutincurring the wrath of dominant players in the industry. Assmaller businesses, they are more nimble and can adapt theirmarketing strategy within these market settings. In some cas-es, such as Dakota Growers Pasta Cooperative and sugarbeetcooperatives’ marketing agencies in common, they may growto become top players in the industry. In others, such asSpring Wheat Bakers and North American Bison Coopera-tive, they have identified niche markets that are not dominat-ed by any major player.
The Iowa Turkey Growers Cooperative has found itsmark in further processing of meats rather than selling wholebirds, and is rapidly expanding its role in luncheon meats fordelis and for private-label markets. U.S. Premium Beef hasdeveloped a quality grid that rewards members for deliveringhigher quality beef that meets consumer demand. As partowner of the rapidly growing Farmland Foods cooperativeteam, they are participating in retail markets through Wal-mart and other major outlets. A number of grain growershave seen their ethanol cooperatives experience improvedmargins with the rise in petroleum prices and the possiblereduction in the use of MTBE as a gasoline additive. Dozensof others are up and running or on the launching pad.
Congress is supporting these efforts through loan guar-antees for stock purchase in new value-added cooperatives,grant programs that provide assistance in studies and helpdefray some startup costs, establishment of a value-addedmarket development resource center and establishment ofcooperative centers that offer technical assistance. A pro-posal has even been introduced that would establish a gov-ernment-sponsored equity capital venture fund to augmentthese developments. And USDA recently announced a pro-gram that rewards processors for using more grains inethanol-producing facilities. Conversion of other forms ofbiomass to energy are also the subject of expanded pro-gram funding.
In short, there is a lot of momentum and energy in thevalue-added arena as farmers seek to strengthen income andkeep themselves in the driver’s seat at a time of rapid consoli-dation and concentration in the food industry. How will it allturn out? Are these efforts too late? Or, are they on the cut-ting edge of new institutional market development?
The outcome will be determined by the strength of lead-ership offered, careful development of business plans andmarketing strategy, and proper capitalization. Ultimately, theassurance that these businesses are set up on a user-owned,user-controlled and user-benefitted basis will determine ifmembers are the primary beneficiaries. �
20 January/February 2001 / Rural Cooperatives
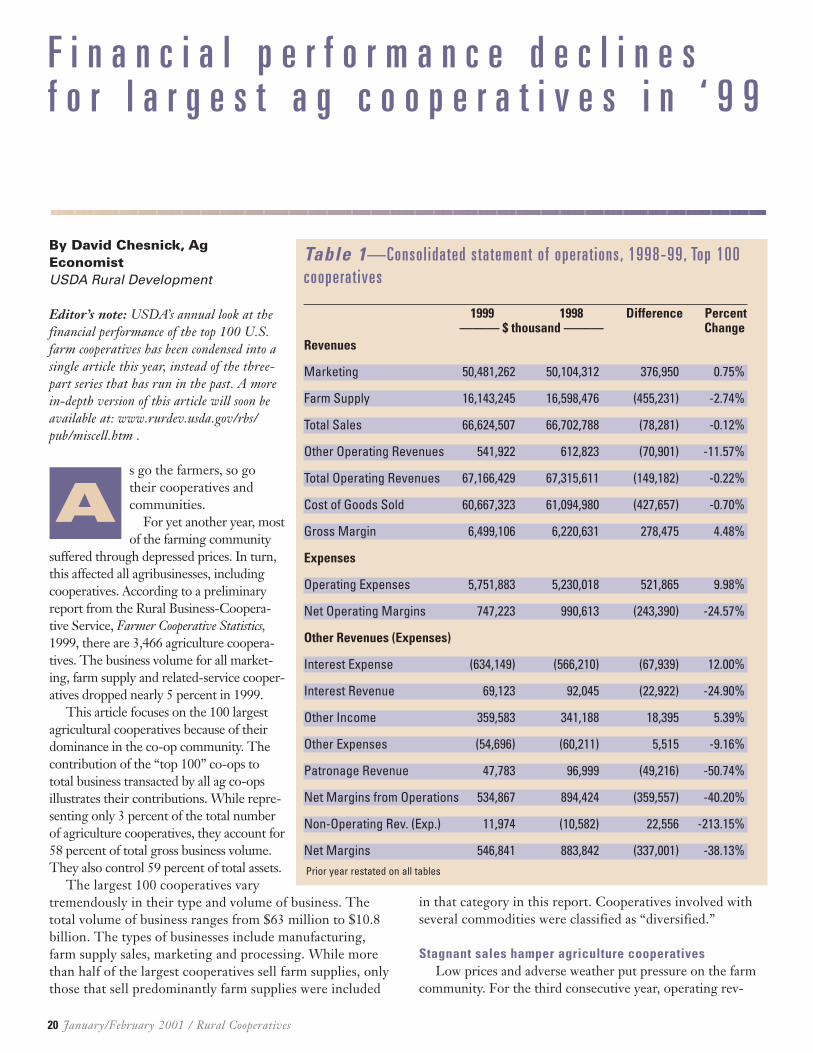
By David Chesnick, AgEconomist USDA Rural Development
Editor’s note: USDA’s annual look at thefinancial performance of the top 100 U.S.farm cooperatives has been condensed into asingle article this year, instead of the three-part series that has run in the past. A morein-depth version of this article will soon beavailable at: www.rurdev.usda.gov/rbs/pub/miscell.htm .
s go the farmers, so gotheir cooperatives andcommunities.
For yet another year, mostof the farming community
suffered through depressed prices. In turn,this affected all agribusinesses, includingcooperatives. According to a preliminaryreport from the Rural Business-Coopera-tive Service, Farmer Cooperative Statistics,1999, there are 3,466 agriculture coopera-tives. The business volume for all market-ing, farm supply and related-service cooper-atives dropped nearly 5 percent in 1999.
This article focuses on the 100 largestagricultural cooperatives because of theirdominance in the co-op community. Thecontribution of the “top 100” co-ops tototal business transacted by all ag co-opsillustrates their contributions. While repre-senting only 3 percent of the total numberof agriculture cooperatives, they account for58 percent of total gross business volume.They also control 59 percent of total assets.
The largest 100 cooperatives varytremendously in their type and volume of business. Thetotal volume of business ranges from $63 million to $10.8billion. The types of businesses include manufacturing,farm supply sales, marketing and processing. While morethan half of the largest cooperatives sell farm supplies, onlythose that sell predominantly farm supplies were included
in that category in this report. Cooperatives involved withseveral commodities were classified as “diversified.”
Stagnant sales hamper agriculture cooperativesLow prices and adverse weather put pressure on the farm
community. For the third consecutive year, operating rev-
F i n a n c i a l p e r f o r m a n c e d e c l i n e sf o r l a r g e s t a g c o o p e r a t i v e s i n ‘ 9 9
A
Table 1—Consolidated statement of operat ions, 1998-99, Top 100cooperatives
Net Margins 546,841 883,842 (337,001) -38.13%Prior year restated on all tables
Rural Cooperatives / January/February 2001 21
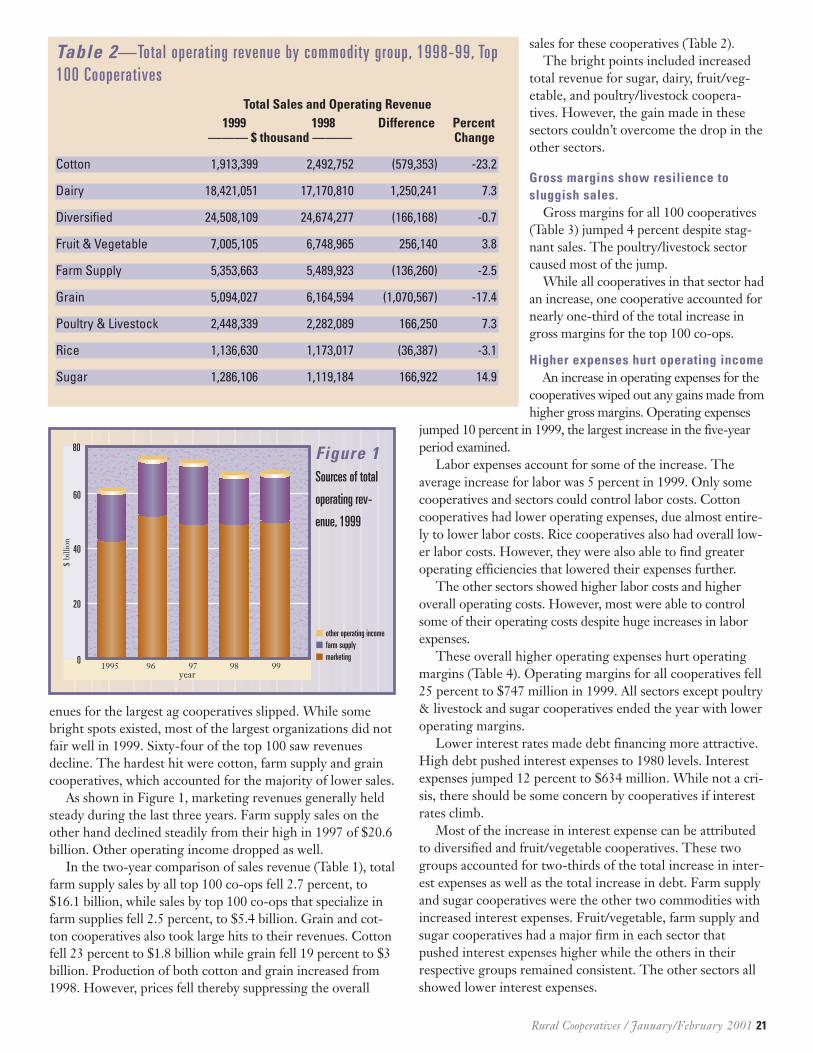
enues for the largest ag cooperatives slipped. While somebright spots existed, most of the largest organizations did notfair well in 1999. Sixty-four of the top 100 saw revenuesdecline. The hardest hit were cotton, farm supply and graincooperatives, which accounted for the majority of lower sales.
As shown in Figure 1, marketing revenues generally heldsteady during the last three years. Farm supply sales on theother hand declined steadily from their high in 1997 of $20.6billion. Other operating income dropped as well.
In the two-year comparison of sales revenue (Table 1), totalfarm supply sales by all top 100 co-ops fell 2.7 percent, to$16.1 billion, while sales by top 100 co-ops that specialize infarm supplies fell 2.5 percent, to $5.4 billion. Grain and cot-ton cooperatives also took large hits to their revenues. Cottonfell 23 percent to $1.8 billion while grain fell 19 percent to $3billion. Production of both cotton and grain increased from1998. However, prices fell thereby suppressing the overall
sales for these cooperatives (Table 2). The bright points included increased
total revenue for sugar, dairy, fruit/veg-etable, and poultry/livestock coopera-tives. However, the gain made in thesesectors couldn’t overcome the drop in theother sectors.
Gross margins show resilience tosluggish sales.
Gross margins for all 100 cooperatives(Table 3) jumped 4 percent despite stag-nant sales. The poultry/livestock sectorcaused most of the jump.
While all cooperatives in that sector hadan increase, one cooperative accounted fornearly one-third of the total increase ingross margins for the top 100 co-ops.
Higher expenses hurt operating incomeAn increase in operating expenses for the
cooperatives wiped out any gains made fromhigher gross margins. Operating expenses
jumped 10 percent in 1999, the largest increase in the five-yearperiod examined.
Labor expenses account for some of the increase. Theaverage increase for labor was 5 percent in 1999. Only somecooperatives and sectors could control labor costs. Cottoncooperatives had lower operating expenses, due almost entire-ly to lower labor costs. Rice cooperatives also had overall low-er labor costs. However, they were also able to find greateroperating efficiencies that lowered their expenses further.
The other sectors showed higher labor costs and higheroverall operating costs. However, most were able to controlsome of their operating costs despite huge increases in laborexpenses.
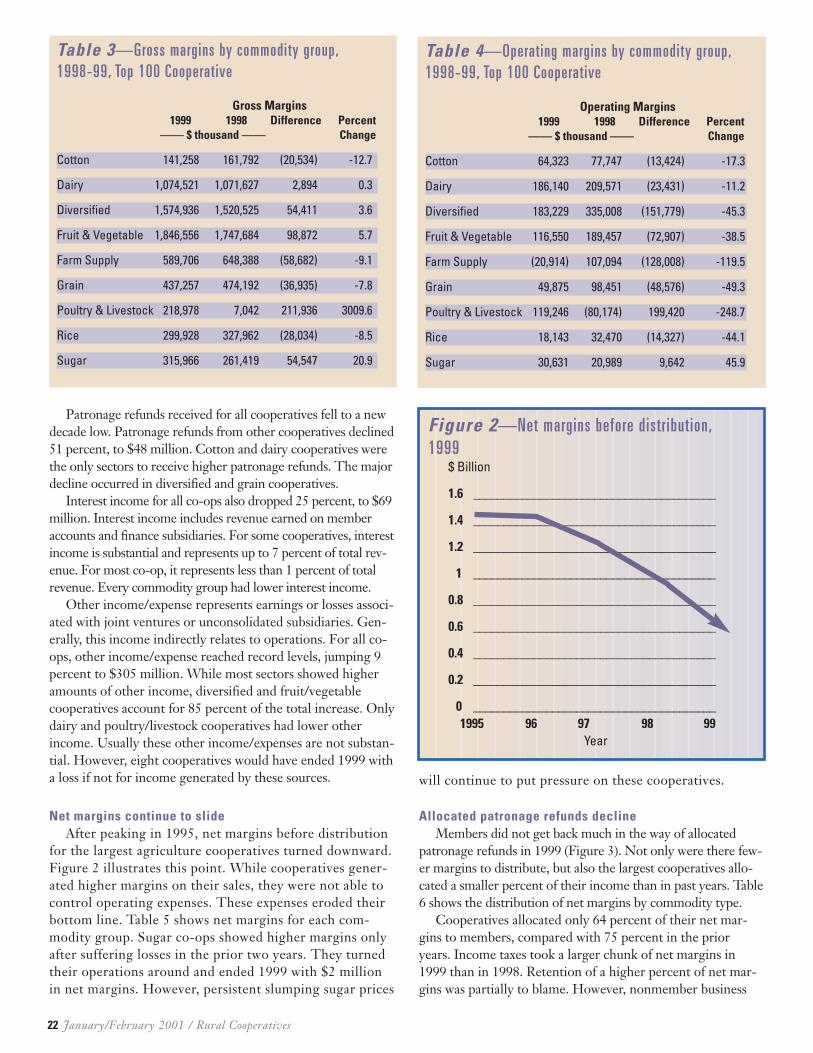
These overall higher operating expenses hurt operatingmargins (Table 4). Operating margins for all cooperatives fell25 percent to $747 million in 1999. All sectors except poultry& livestock and sugar cooperatives ended the year with loweroperating margins.
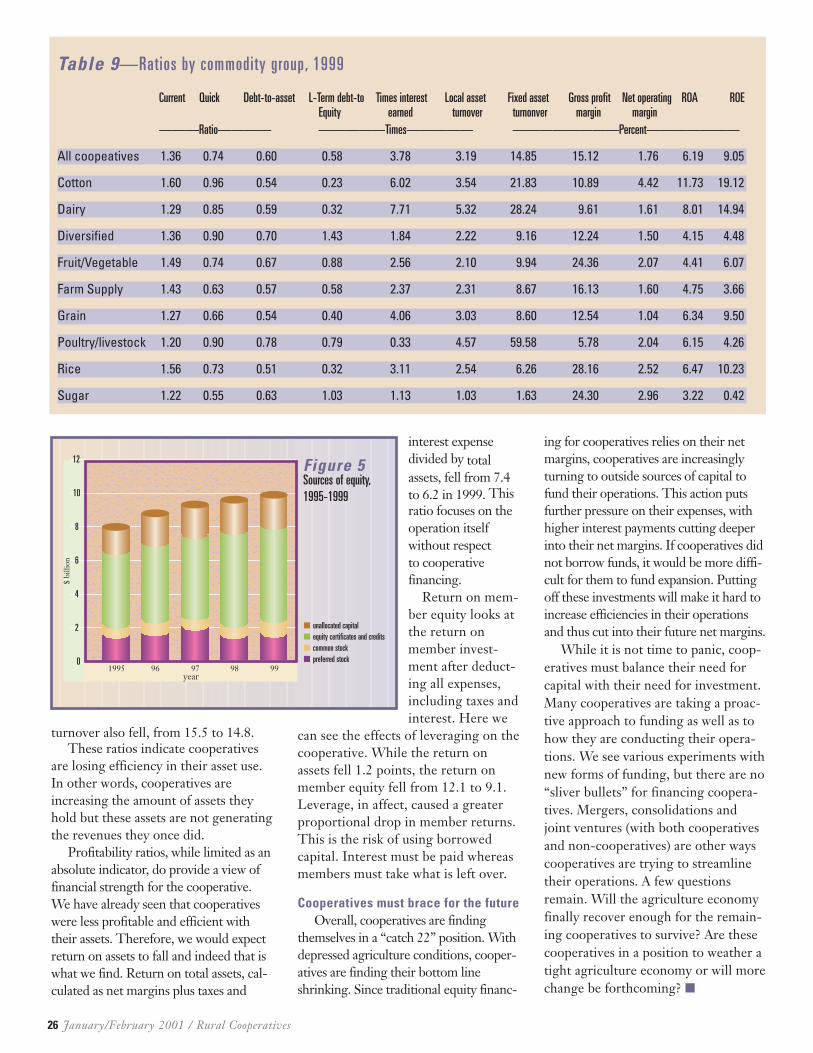
Lower interest rates made debt financing more attractive.High debt pushed interest expenses to 1980 levels. Interestexpenses jumped 12 percent to $634 million. While not a cri-sis, there should be some concern by cooperatives if interestrates climb.
Most of the increase in interest expense can be attributedto diversified and fruit/vegetable cooperatives. These twogroups accounted for two-thirds of the total increase in inter-est expenses as well as the total increase in debt. Farm supplyand sugar cooperatives were the other two commodities withincreased interest expenses. Fruit/vegetable, farm supply andsugar cooperatives had a major firm in each sector thatpushed interest expenses higher while the others in theirrespective groups remained consistent. The other sectors allshowed lower interest expenses.
Table 2—Total operating revenue by commodity group, 1998-99, Top100 Cooperatives
Total Sales and Operating Revenue1999 1998 Difference Percent
Patronage refunds received for all cooperatives fell to a newdecade low. Patronage refunds from other cooperatives declined51 percent, to $48 million. Cotton and dairy cooperatives werethe only sectors to receive higher patronage refunds. The majordecline occurred in diversified and grain cooperatives.
Interest income for all co-ops also dropped 25 percent, to $69million. Interest income includes revenue earned on memberaccounts and finance subsidiaries. For some cooperatives, interestincome is substantial and represents up to 7 percent of total rev-enue. For most co-op, it represents less than 1 percent of totalrevenue. Every commodity group had lower interest income.
Other income/expense represents earnings or losses associ-ated with joint ventures or unconsolidated subsidiaries. Gen-erally, this income indirectly relates to operations. For all co-ops, other income/expense reached record levels, jumping 9percent to $305 million. While most sectors showed higheramounts of other income, diversified and fruit/vegetablecooperatives account for 85 percent of the total increase. Onlydairy and poultry/livestock cooperatives had lower otherincome. Usually these other income/expenses are not substan-tial. However, eight cooperatives would have ended 1999 witha loss if not for income generated by these sources.
Net margins continue to slideAfter peaking in 1995, net margins before distribution
for the largest agriculture cooperatives turned downward.Figure 2 illustrates this point. While cooperatives gener-ated higher margins on their sales, they were not able tocontrol operating expenses. These expenses eroded theirbottom line. Table 5 shows net margins for each com-modity group. Sugar co-ops showed higher margins onlyafter suffering losses in the prior two years. They turnedtheir operations around and ended 1999 with $2 millionin net margins. However, persistent slumping sugar prices
will continue to put pressure on these cooperatives.
Allocated patronage refunds declineMembers did not get back much in the way of allocated
patronage refunds in 1999 (Figure 3). Not only were there few-er margins to distribute, but also the largest cooperatives allo-cated a smaller percent of their income than in past years. Table6 shows the distribution of net margins by commodity type.
Cooperatives allocated only 64 percent of their net mar-gins to members, compared with 75 percent in the prioryears. Income taxes took a larger chunk of net margins in1999 than in 1998. Retention of a higher percent of net mar-gins was partially to blame. However, nonmember business
Table 4—Operating margins by commodity group,1998-99, Top 100 Cooperative
Table 3—Gross margins by commodity group,1998-99, Top 100 Cooperative
Gross Margins1999 1998 Difference Percent
—— $ thousand —— Change
Cotton 141,258 161,792 (20,534) -12.7
Dairy 1,074,521 1,071,627 2,894 0.3
Diversified 1,574,936 1,520,525 54,411 3.6
Fruit & Vegetable 1,846,556 1,747,684 98,872 5.7
Farm Supply 589,706 648,388 (58,682) -9.1
Grain 437,257 474,192 (36,935) -7.8
Poultry & Livestock 218,978 7,042 211,936 3009.6
Rice 299,928 327,962 (28,034) -8.5
Sugar 315,966 261,419 54,547 20.9
and other ventures contribute to the increase as well. Cooperatives also are paying out more dividends. These div-
idends are not the same as patronage dividends paid on businessdone with the cooperative, but rather dividends paid on sharesowned. Some cooperatives are using more non-patronagesources of equity to help finance their operation and expansion.
Total assets jump as co-ops accumulate more debtDespite slumping sales, cooperatives continue to increase
their asset base. Assets for all cooperatives jumped 7 percent in1999 (Figure 4), ending the year with a value of $28.2 billion.
Current assets increased 5 percent, to $13.7 billion. Coop-eratives were holding a higher percentage of cash in 1999than in 1998. While both accounts receivable and inventoryincreased, their percentage of total assets fell for the fifthstraight year. This would indicate that cooperatives are tryingto adjust to a declining agriculture economy.
The largest increase in assets occurred in investments, andjoint ventures accounted for most of it. The largest increasein investments was with non-cooperative- joint ventures andunconsolidated subsidiaries.
Property, plant and equipment expanded 7 percent, to$8.4 billion. These fixed assets represent 30 percent of totalassets, the same percentage as in 1998.
Expansion of assets fueled by higher debtLiabilities financed 80 percent of asset expansion in 1999.
Total liabilities climbed 9 percent, to $17.7 billion in 1999.Leading the way was debt. Total short- and long-termincreased by $1.3 billion.
Current liabilities increase by 5 percent, to $10.1 billion.Short-term debt and accounts payable were the leadingcauses of this increase. Those liabilities owed to members —either through cash patronage and other revolving equity orthrough pool liabilities — fell by $313 million. All this leadsto a higher leveraged cooperative and greater influence fromoutside creditors.
Rural Cooperatives / January/February 2001 23
Table 5—Net margins by commodity group,1998-99, Top 100 Cooperative
Total Distribution 58,187 222,766 134,091 6,905 (66,170) 80,864 95,149 12,913 2,136
year
$ bi
llion
� Income Tax� Dividends� unallocated� Allocated
1995 96 97 98 99
Figure 3Distribution of net margins,1995-19991.2
1
0.8
0.6
0.4
0.2
0
1.6
1.4
Non-current liabilities posted a 15 percent jump, ending 1999 at $7.6billion. Long-term debt was the majorinfluence on this increase, jumping $912million. Fruit/vegetable, farm supplyand diversified cooperatives contributedthe largest increases in long-term debt.Only a few cooperatives dominated thefruit/vegetable and farm supply arenawhile most cooperatives in those twosectors actually had lower long-termdebt. Every cooperative in the diversi-fied group showed higher debt levels.
Equity climbs but is overshadowed by debt
Equity for the largest agriculturecooperatives increased 3 percent, to arecord high level of $9.9 billion. Everycategory of equity increased, withmember equity having the greatestincrease (Figure 5). Member equity,which includes common stock, pre-ferred stock, equity certificates andcredit, jumped $286 million, ending1999 at $8 billion. Unallocated equityincreased 1 percent, to $1.9 billion.However, the increase in equity did not
rise as much as theliabilities of theseco-ops.
Large co-opperformancecontinues to takebeating
The averageperformance mea-sures for all 100cooperatives con-tinued to showdeterioration overthe prior year.The tools devel-oped to analyze the cooperative’sfinancial information include severalperformance measurements or ratios(Table 9). These measurements arestandard ratios found in most finan-cial textbooks.
The current and quick ratios examinethe cooperative liquidity. Both ratiosshow that the average cooperative liq-uidity has been eroding over the 4 yearspreceeding 1999. The current ratio fellfrom 1.37 to 1.36 between 1998 and
1999. The quick ratio fell from .76 to.74 during the same period. While thischange is relatively small, it does sup-port the assumption stated earlier thatmost cooperatives are relying moreheavily on outside financial sources.With short-term debt and accountspayable increasing faster than currentassets, cooperatives are also relyingmore on outside sources to finance theirday-to-day operations.
Other ratios, such as days-to-sell
24 January/February 2001 / Rural Cooperatives
Table 7—Condensed balance sheet by commodity type, 1999
total liabilties and equity 674,011 4,290,662 10,398,544 4,468,914 3,544,776 2,124,988 978,246 485,734 1,191,300
Figure 4
$ bi
llion
year
� other assets� Net PP&E� Investments� Current assets
1995 96 97 98 99
Figure 4Asset allocation,1995-199925
20
15
10
5
0
30
Rural Cooperatives / January/February 2001 25
inventory and days-in-accounts receiv-able, also point to lower liquidity.Days-to-sell inventory represents theaverage number of days a cooperativeholds inventory before marketing it.This ratio increased from 51.6 to 54.1days. Similarly, days-in-accountsreceivable represents the average num-ber of days cash is tied up in accountsreceivable. This value increased from27.8 to 32.1 days. An increase in thesevalues would indicate a less liquid posi-tion and a greater need to manageinventory and accounts receivable.
Leverage ratios show the risk associ-ated with financing and the cooperatives’ability to meet their long- and short-term obligations. The debt-to-asset ratioillustrates an asset financing option. In1999, the debt-to-asset ratio was 0.6, upfrom 0.59 in 1998. Looking at it anotherway, members financed only 40 percentof assets directly. Examining long-termfinancing, we focus on the long-termdebt-to-equity ratio. This ratio jumpedfrom 0.5 in 1998 to 0.58 in 1999.
While leveraging a cooperative isnot necessarily a bad thing, it does putmore risk on the business. The biggestrisk comes from a co-op defaulting onits loans. An examination of the times-interest-earned ratio provides a quicklook at that scenario. The times-inter-est-earned ratio looks at the number oftimes interest expense is covered by netmargins with interest added back. Thisratio fell from 5.2 to 3.8 in 1999. Whilethere is no current crisis, the leverageratio points to a situation where coop-eratives are leveraging themselves at atime when their businesses are begin-ning to show some financial stress.
Activity ratios look at how well thecooperative uses its assets. Again, coop-eratives are finding activity ratios slid-ing. Local-asset-turnover, calculated bytaking total revenues divided by localassets, dropped from 3.5 to 3.2. Thisrepresents the amount of revenue gen-erated by each dollar invested in localassets. Local assets are total assets lessinvestment in other cooperatives. Thisseems to indicate that revenues are notkeeping pace with the growth in thecooperative’s assets. Fixed-asset-
Table 8—Combined balance sheet all Top 100 co-ops, 1998-99
unallocated capital 1,869,313 1,846,898 22,415 1.2%
total equity 9,872,277 9,564,007 308,270 3.2%
total liabilities and equity 28,157,175 26,285,133 1,872,042 7.1%
turnover also fell, from 15.5 to 14.8. These ratios indicate cooperatives
are losing efficiency in their asset use.In other words, cooperatives areincreasing the amount of assets theyhold but these assets are not generatingthe revenues they once did.
Profitability ratios, while limited as anabsolute indicator, do provide a view offinancial strength for the cooperative.We have already seen that cooperativeswere less profitable and efficient withtheir assets. Therefore, we would expectreturn on assets to fall and indeed that iswhat we find. Return on total assets, cal-culated as net margins plus taxes and
interest expensedivided by totalassets, fell from 7.4to 6.2 in 1999. Thisratio focuses on theoperation itselfwithout respect to cooperativefinancing.
Return on mem-ber equity looks atthe return onmember invest-ment after deduct-ing all expenses,including taxes andinterest. Here we
can see the effects of leveraging on thecooperative. While the return onassets fell 1.2 points, the return onmember equity fell from 12.1 to 9.1.Leverage, in affect, caused a greaterproportional drop in member returns.This is the risk of using borrowedcapital. Interest must be paid whereasmembers must take what is left over.
Cooperatives must brace for the futureOverall, cooperatives are finding
themselves in a “catch 22” position. Withdepressed agriculture conditions, cooper-atives are finding their bottom lineshrinking. Since traditional equity financ-
ing for cooperatives relies on their netmargins, cooperatives are increasinglyturning to outside sources of capital tofund their operations. This action putsfurther pressure on their expenses, withhigher interest payments cutting deeperinto their net margins. If cooperatives didnot borrow funds, it would be more diffi-cult for them to fund expansion. Puttingoff these investments will make it hard toincrease efficiencies in their operationsand thus cut into their future net margins.
While it is not time to panic, coop-eratives must balance their need forcapital with their need for investment.Many cooperatives are taking a proac-tive approach to funding as well as tohow they are conducting their opera-tions. We see various experiments withnew forms of funding, but there are no“sliver bullets” for financing coopera-tives. Mergers, consolidations andjoint ventures (with both cooperativesand non-cooperatives) are other wayscooperatives are trying to streamlinetheir operations. A few questionsremain. Will the agriculture economyfinally recover enough for the remain-ing cooperatives to survive? Are thesecooperatives in a position to weather atight agriculture economy or will morechange be forthcoming? �
26 January/February 2001 / Rural Cooperatives
Table 9—Ratios by commodity group, 1999
Current Quick Debt-to-asset L-Term debt-to Times interest Local asset Fixed asset Gross profit Net operating ROA ROEEquity earned turnover turnonver margin margin
� unallocated capital� equity certificates and credits� common stock� preferred stock
1995 96 97 98 99
Figure 5Sources of equity,1995-199910
8
6
4
2
0
12
Rural Cooperatives / January/February 2001 27
Katherine L. Hanson, EducationSpecialist USDA Rural Development
n Minnesota, a group ofteachers and educationprofessionals has turnedto a cooperative in anattempt to improve
accountability for student performanceand overall school success. Its membersare seeking alternatives to the existingframework of traditional educationalgovernance and structure through ateachers’ cooperative. They have takencontrol of their instructional programsand professional futures.
In 1994, a group of educators at theMinnesota New Country School(MNCS) in the Minnesota River Valleytook these goals to heart by forming
EdVisionsTeacher Coop-
erative.MNCS
was
originally located in three storefrontbuildings in the sponsoring district ofLeSueur-Henderson, about 60 milessouthwest of Minneapolis. The schoolopened its doors with 65 students, andhas since increased its enrollment to130 students in grades 7-12. Theincreased enrollment forced MNCSofficials to relocate from LeSueur to anew, $1.2 million facility in Henderson.The new building was the result of apartnership between USDA RuralDevelopment and local investors.
It is no coincidence that MNCS is aninnovative public charter school enjoyingsubstantial success in terms of state-mea-sured student achievement. The MNCSteachers were confident their approachesto teaching would make a difference, andthey were eager to have more controlover the educational process.
The cooperative of professionalteachers would operate on a newpremise quite different from that of alarge teacher’s union. As member-own-ers, they would gain true site-basedmanagement and control of education-al resources.
Ted Kolderie of the Center forPolicy Studies in St. Paul supportedthe EdVisions Cooperative from its
inception. Hesays many
educatorswere dis-
enchantedwith their
teacher’s union,and viewed the orga-
nization as a “protector
of the teaching profession, ratherthan an enhancer of education.” Hebelieved teachers would act different-ly if they were at least “spiritual own-ers” of their instructional program.
Likewise, fellow EdVisions founderRon Newell felt a teacher cooperativewould encourage professional colle-giality and nurture a sense of responsi-bility for professional development.Teachers were eager for the opportu-nity to have a say in the quality andquantity of their training. Manyteachers said they felt as though theywere working at the will of the admin-istrators in the traditional publicschool. By marketing their services tothe school board, the members of thiscooperative ensured that the adminis-trators were instead working at thewill of the teaching professionals. Bybecoming their own bosses, the EdVi-sions teachers could influence careerdecisions directly impacting them-selves and their program.
Cooperative AdvantagesAccording to Newell, one very pos-
itive aspect of the teacher cooperativeis that student learning activities bene-fit from money saved in the system.The advantages a teacher cooperativecan offer in terms of increased auton-omy are obvious. However, what aresome other benefits of this type ofworker cooperative?
In EdVisions, the educator-ownerscarry many different responsibilitiesin addition to teaching. Some ofthese duties include establishing andmaintaining insurance and benefitspackages for co-op employees, mar-keting the school to attract students,and preparing payrolls. By serving as
E d V i s i o n s Minnesota teachers’ co-op serves rural charter schools
I
EdVisions teacher Dean Lind offers advice to a MNCS student.Photos courtesy MNCS student Dan Madlo and EdVisions
their own governance system, themembers eliminate about 20 percentof the costs normally associated withadministrative staffing duties. Thiscan be especially difficult since char-ter schools deal with twice as muchpaperwork as do their traditionalcounterparts.
Dean Lind is a veteran teacher atMNCS and a charter member ofEdVisions. Like many in the organi-zation, Lind must assume responsi-bility for a portion of the administra-tive operations of the cooperative.“The original intent of the charterschool law was to help reduce thepaperwork associated with schooloperations. However, because werepresent small, independent schools,EdVisions can’t take advantage of theeconomy of scale in a larger adminis-tration to spread the workload moreevenly,” Lind explains. “Further,charter schools are scrutinized muchmore closely in terms of accountabil-ity, which contributes to the paper-work burden.”
Membership in this worker-ownedcooperative is not limited to profes-sional educators. EdVisions provides avoice to the people who are directlyinvolved with, and affected by, deci-sions regarding teachers. In theireagerness to make the educationalprocess an interactive one, EdVisionsmembers invite parents to join the co-op. Since parents are “outsiders” tothe teaching profession – and notdirectly affected by administrativedecisions such as salary, benefits, andstaff development — the potential forfriction exists.
According to Newell, there has beenno dissension among the membersbased on whether they are teachers orparents. By contrast, the parents deferto teachers on career-affecting deci-sions and are more concerned with cur-riculum and instruction issues.
Another cooperative advantage is itsability to pool resources and ideas withother teacher-members who are alsostriving to deliver guaranteed academicachievements that ensure job retention.If a particular method or activity proves
28 January/February 2001 / Rural Cooperatives
Why are teachers seekingalternatives to the traditional, top-down administrative systems ineducation? Consider the state ofeducation in America’s burgeoningsociety.
Education is a top priority forthe new Bush administration.Many public school systems are ina state of crisis with rising enroll-ments and falling academicachievement. There are more chil-dren enrolled in school now than atany time in American history, andthat number is increaseing at aphenomenal rate in some districts.Last September, 53 million childrenentered U.S. public and privateschools – an increase of 8 millionschoolchildren in the last 15 years.
At the same time, many publiceducation systems have failed toaccomplish the goals establishedby state and federal mandates.Many districts have not re-invest-ed in their school buildings as theycompete with other governmentprograms for tax dollars.
These factors translate intoincreased demands for academicaccountability. Parents, teachers,administrators and legislators rec-ognize the need for educationreform and improved teachingmethods. Public education reformshave provided innovative, market-based alternatives to the tradition-al system. Teachers in the trench-es fighting the accountabilitybattle have real-life ideas forchange that could improve studentperformance. Quite simply, theyrecognize the need for change inthe education business.
In addition to the first-knownteachers’ cooperative, anotherpart of the reform effort originatingin Minnesota was the nation’s firstcharter school, formed in 1991. A
charter school operates on publicfunds, under a written agreementbetween a school and a grantingauthority. What makes a charterschool different is its freedom frommost administrative constraintsthat traditionally encumber publicschools.
The trade-off is that a charterschool must demonstrate greateraccountability in exchange forautonomy. Achieving performancestandards stated in the charter isthe basis for its periodic renewal.The school faces suspension orclosure if it fails to meet acceptedstandards. Naturally, if a charterschool closes, its teachers are outof a job.
This novel approach hasencouraged teachers and educa-tion professionals to be more cre-ative in their curriculum design,development and delivery. Char-ter schools, proponents say,allow for freedom in the develop-ment of customized curricula andeducational programs. Indeed,although charter schools areaccountable for the academicachievement of their students,the methods by which they pro-duce those results are completelyindividual.
Teachers get the flexibility andindependence to customize learn-ing opportunities to meet theneeds of their specific students.This ability to empower teachersand make them stakeholders in theeducational process makes char-ter schools popular educationaloptions. From this environment ofautonomy and accountability, anew breed of teachers hasemerged. More importantly, theseteachers want to own their ser-vices, and market those servicescompetitively. �
Educational challenges pose need for change
highly successful to one teacher, it ben-efits the entire cooperative to share thatsuccess and spread the educationalwealth. In this way, school “A” can helptrain school “B” in the successful coop-erative principles. Cooperatives canshare state-required standardized test-ing materials, thus reducing costs andincreasing efficiency.
One distinguishing feature of ateacher cooperative is its reimburse-ment system. Teachers no longerreceive their paychecks from the dis-trict. Instead, the sponsoring districtpays the school to hire teachers, theschool pays the cooperative for theteachers’ services, and the cooperativepays the teachers. There is no relation-ship between the teachers and thesponsoring district, but legislation enti-tles the cooperative’s teachers to thesame state retirement benefits as non-co-op teachers.
EdVisions teachers are employeesof the school, employees of the coop-erative, and self-employed member-owners. In a sense, the triple-employ-ment aspect of this cooperative offersthe best of two worlds – teachers gaineducational independence and gover-nance control without sacrificing thebenefits and protections normallyassociated with traditional teacheremployment situations.
Cooperative growthWhat began as a handful of vision-
ary teachers and education profession-
als has grown to include nearly 90members. This cooperative has been sosuccessful that the Bill and MelindaGates Foundation has awarded it a sub-stantial grant (see sidebar) to replicatethe governance system by creating 10new organizations in 15 new charterschools in Minnesota and Wisconsin.
As EdVisions implements the 10 new
co-ops, it will realize its vision ofbecoming a “nationwide cooperative,”with “individual cells of locally con-trolled cooperative members.” Inachieving that goal, EdVisions will growlarge enough to gain economy-of-scalefor administrative purposes, benefitspackages and professional developmentopportunities, while retaining teacher-level control. As it grows, so will therepository of available teaching strate-gies, activities, and creative practices ofits member-owners.
Based on the success of the EdVi-sions Teacher Cooperative and the sat-isfaction of its professional member-owners, the future looks bright forothers in the field of education whowant to create opportunities forincreased involvement in owning andoperating educational entities. Prospec-tive members will be entrepreneurswho are ready to challenge the existingmolds of educational thinking, and leadthe way into a new century of changingeducational paradigms. �
Rural Cooperatives / January/February 2001 29
The EdVisions instructional philosophy encourages independent learning in non-traditionalsettings.
The member-owners of EdVisions Teacher Cooperative have made bigbelievers out of some influential friends of the education community. Last Sep-tember, the Bill and Melinda Gates Foundation awarded a $4.5 million grant tothis group of innovative education professionals. The grant has a twofold pur-pose: it is being used in the replication of the EdVisions teacher-owner gover-nance model and the learning model at the Minnesota New Country School,where EdVisions was founded. Over the next five years, the EdVisions projectwill create 15 new schools modeled after the highly successful instructionalapproach refined at the Minnesota New Country School.
This sizeable award is just a small part of a larger $56 million initiativeaimed at supporting schools that provide small, focused learning environ-ments. The Bill and Melinda Gates Foundation is dedicated to helping allstudents achieve at high levels by recognizing and encouraging high-achieving schools and developing strong leadership throughout the educa-tion system. This desire to improve people’s lives through education is evi-denced by the foundation’s three-year, $350 million commitment to that end.Led by Bill Gates’ father, William H. Gates, Sr., and Patty Stonesifer, theSeattle-based foundation has an asset base of $21.8 billion. Information onthe Bill and Melinda Gates Foundation’s education grants can be found athttp//www.gatesfoundation.org/learning/education. �
Foundation Awards $4.5 Mill ion toEdVisions, Minn. New Country School
30 January/February 2001 / Rural Cooperatives
U.S., Canadian Pasta Co-ops LinkOfficials from Dakota Growers Pas-
ta Company, Carrington, N.D., andPrairie Pasta Producers, Carlyle,Saskatchewan, signed amemorandum ofunderstanding Jan. 25outlining how the twodurum co-ops willwork together in build-ing an international,farmer-owned, value-added pasta company.The partnership is aproactive approachpositioning DakotaGrowers Pasta Compa-ny in an increasinglycompetitive global pas-ta market. “We’re try-ing to do what is right for the farmer.This is not an action that will allow thedumping of Canadian durum into U.S.markets,” said Tim Dodd, president ofDakota Growers Pasta Company.
Perry MacKenzie, board chairman ofPrairie Pasta Producers, sees the prelimi-nary understanding as a positive opportu-nity for Canadian durum producers.“Together, Prairie Pasta Producers andDakota Growers Pasta Company canwork toward developing a level playingfield for durum producers in NorthAmerica.” Dakota Growers Pasta Co.now can allow non-United States entitiesand associations of agricultural producersto join the cooperative.
“It is very important to our membersthat this company remain farmer-owned,” said Dodd. New associationsthat apply for cooperative membershipmust be grower owned and requireboard approval. “Our mission is twofold,but is very simple: providing our cus-
tomers with premium quality pastaproducts and maximizing returns to ourgrower-members.” Dodd embraces theidea of including all durum producers
from the durum triangleregion of the northern plainsto create a single producer-owned pasta company.
“The pasta industry is inthe state of overcapacity. Wehave quadrupled our pastacapacity and milling needsover the last seven years.Enrolling Canadian farmersinto our cooperative pro-vides a broader base to selectdurum that meets the qualityneeds our customers havecome to expect. By workingtogether with the Canadian
farmers, we can accomplish more thanworking against one another.”
The overcapacity market issue hasbeen clearly identified by Prairie PastaProducers in its feasibility study andbusiness plan as well. The group hasrecognized that building a “greenfield”plant presents tremendous risk at atime that the pasta industry is fightingfor market share at less than desirableprices. This agreement would allowthem to work together in DakotaGrowers Pasta Co. rather than againstthem. The next step for the two orga-nizations is to develop a definitiveagreement that can be submitted to theSaskatchewan Securities Commission.
Three-person panel to settle raisindeadlock
Raisin packers and growers in Cali-fornia are in the midst of a seriousimpasse over the field price for raisins.Prices are normally set by October, but
in late January the price was still unset-tled and growers were left without pay-ment for much of their crop while pack-ers were trying to deal with the foodindustry without knowing their ultimatecosts for raisins. In the latest develop-ment, Superior Court Judge StephenKane in Fresno ruled that a three-mem-ber arbitration panel will be used todetermine the price. According to theFresno Bee, this is the first time in the34-year history of the Raisin BargainingAssociation that the matter has beenmoved to arbitration because of a dead-lock between growers and packers.
Potato co-op seeks answers to cropsurplus
Northwest potato growers are strug-gling to survive in a supply-bloatedmarket that has seen prices plunge toabout one cent per pound for a cropthat costs them about five cents perpound to produce. To help reduce thesurplus, a new cooperative, PotatoManagement Inc., has been formed byPotato Growers of Idaho. The co-ophopes to dispose of 10 percent of thecrop – or about 400 to 600 millionpounds of the 1.5-billion pound crop.By reducing the over-supply andencouraging members to reduce theirplanted acreage, the co-op hopes to dri-ve prices back up. In late January, theco-op was donating spuds to charitableorganizations to feed the needy.
Executive director sought forCooperation WorksCooperation Works, the national net-work of cooperative developers and cen-ters, is conducting a nationwide searchfor an executive director. The NorthDakota Association of Rural Electric
N E W S L I N E
Packaged pasta rollsdown the line at DakotaGrowers Pasta Co.USDA Photo
Rural Cooperatives / January/February 2001 31
Cooperatives is coordinating the recruit-ing project. Interested persons shouldapply by March 22 to Kent Brick,NDAREC, P.O. Box 727, Mandan, ND58554-0727. Cooperation Works’ mis-sion is to advance the national networkof cooperative developers dedicated toprosperous sustainable communities.
Robson heads Milk Board James Robson, a former vice presi-
dent with Dairygold Inc., Seattle,Wash., is the new chief executive officerof the Wisconsin MilkMarketing Board, Madison.He leads the $26.5 millionorganization, which con-ducts statewide and nation-al dairy marketing and pro-motion programs forWisconsin-made dairyproducts. Producer checkofffunds support the activities.Most recently, Robsonmanaged a Texas firm thatworked with dairies, foodprocessors, wholesalers and retailers instrategic planning, new product develop-ment, promotion and sales training.
Tripp Producers join AMPIAnother 27 dairy producers, this
time shippers to the defunct Tripp,S.D. Cheese Company, now marketmilk to the Freeman, S.D., plantowned by Associated Milk Producers,Inc. (AMPI). Combining overlapping
routes should streamline operationsand cut hauling costs. In other AMPInews, the cooperative has distributedequities and earnings payments totaling$8.3 million to members - - revolved$5.6 million of members’ 1995 capitalretain investment and paid $2.7 millionin allocated equities.
Co-op education on web siteLocal cooperative directors, man-
agers and employees in the Cenex Har-vest States-Land O’Lakes systems can
now access cooperativeeducation material and ahost of other resources bytapping into the new web-site, www.mbrservices.com.The new site includes anelectronic newsletter, ePre-view, frequently usedregional phone numbersand e-mail addresses andCo-op Shop, where youcan purchase product andpromotional materials and
meeting supplies identified with theseregional cooperative systems. JessicaLamker, managing editor of the site,says it offers more informational andeducational resources for local cooper-atives, such as director’s corner,monthly articles on ways to improveoperations of boards of directors, jobsin the country to help with cooperativeemployee placement, and financialunderstanding, a series of learning
modules about the basics of coopera-tive financial statements.
Alabama honors LoftisThe Alabama Council of Coopera-
tives has bestowed its annual cooperatoraward on Jim Loftis for his 30 years ofpromoting cooperatives in the South-east. He currently is director of com-munications and governmental affairsfor Southern States Cooperatives, Rich-mond, Va. A native of Tennessee, Loftisbegan a 24-year career with Gold KistInc., Atlanta, managing its grain eleva-tors in North Carolina and laterbecoming regional manager of memberrelations and director of public affairs.He is a past chairman of the GeorgiaAgribusiness Council and serves on thepublic affairs committee of the NationalCouncil of Farmer Cooperatives.
Alto leads cheese projectA new cheese yield project by Alto
Dairy Cooperative, Waupun, Wis.,teaches members how to tailor theirmilk production to meet specific pro-tein needs of cheesemakers. Producerslearn what management practices canhelp them meet the milk componentlevels required by individual proces-sors. Higher cheese yields and possiblyhigher prices paid to producers areamong anticipated results. The pilotproject was made possible, in part, bythe Wisconsin Department of Agricul-ture, Trade and Consumer Protection.
Co-op’ share of farm market continued from page 9
are based on data from several sources.They include the annual survey of farmercooperatives conducted by USDA’s RuralBusiness-Cooperative Service, otherCooperative Services studies, cashreceipts from farm marketings and farmproduction expenditures published byUSDA’s Economic Research Service(ERS), milk volume handled by the top50 cooperatives published by Hoard’sDairymen, and from Cooperative Ser-vices’ commodity specialists.
Co-ops’ shares of farm marketingsrepresent estimates of cooperative activi-
ty at the farm-gate or first-handler level.Share estimates for farm productionitems represent cooperative activity insales of supplies to farmers. The shareestimate for each commodity was basedon dollar value and annual changes inrelated data or on physical quantity(where available). In most cases, theshare estimate was based on dollar value.
For those commodities where physi-cal quantity handled by cooperatives wasnot available, cooperatives’ shares offarm marketings were estimated by firstsubtracting gross margins from net
cooperative business volume. These esti-mated “payments to farmers” were thenrelated to their respective total U.S. cashreceipts, adjusted for crop year, to calcu-late the percentage share figures.
Shares of the major farm supplyitems were estimated by first subtract-ing from co-ops’ net business volumethe volume of business exported, sold toother firms and used for nonfarm pur-poses. These adjusted business volumeswere then related to their respectivetotal U.S. cash expenditures to calculatetheir percentage share estimates. �
James Robson
32 January/February 2001 / Rural Cooperatives
COOPERATIVESRu
ral
COOPERATIVESS u b s c r i p t i o n s O r d e r F o r m
Company or Personal Name (please type or print clearly)
Additional Address/Attention Line
Street Address
City State Zip Code
Daytime Phone Number including area code
Purchase Order Number
� YES, enter my subscription as follows:
___ subscriptions to Rural Cooperatives (NFC) for$15 per year ($18.75 foreign).
The Total cost of my order is $ _________ . The priceincludes regular domestic postage and handling andis subject to change.
Mail This Form To: New Orders, Superintendent of Documents •PO Box 371954 • Pittsburgh, PA • 15250-7965
May we make your name/address available toother mailers? ____ yes ____ no
Order Processing Code
* 5 3 8 9
Please Choose Method of Payment:
� check payable to the Superintendent of Documents