107
Rutherford County, TN Community Health Needs Assessment 2016

Rutherford County, TN Community Health Needs Assessment
2016

Health Is:
• A state of complete physical, mental and social well-being and not merely the absence of disease or infirmity
Source: World Health Organization
Welcome

• Assessments done separately in 2013 as requirement for STH and VUMC as non-profit hospitals
– ACA related requirement
• For new cycle, came together in overlapping counties
• Review findings of most recent RCHD, VUMC and STH health assessment
• Collectively identify needs for Rutherford County
Why are we here?

• Reviewed publically available community health data
• Interviewed key stakeholders
• Conducted listening sessions
• Convened today’s summit to identify needs
• Special attention to underserved, low-income, minority populations
• Post-summit: Review needs for development of Implementation Strategies
Approach

• Health Department Update
• Review Findings
– Secondary Data
– Interviews
– Listening Sessions
• Exercise 1 : Identification of Health Needs
• Exercise 2 : Visioning, Goals and Resources
• Summary
Agenda

Rutherford County – Health Priorities
Dana Garrett, RN, BSN

Findings from Secondary Data Review Rutherford County, TN
2016 Community Health Assessment

Determinants of Health Introduction and Methods
Rutherford
Tobacco Use Diet & Exercise Alcohol & Drugs Sexual Activity
Access to Care Quality of Care
Education Employment Income Social Support Safety
Air & Water Housing & Transit

• Used publically available data
• Indicators, considered
– Recommendations of
• Centers for Disease Control and Prevention
• Catholic Health Association
– Review of RCHD, STH and VUMC 2013 CHNA
Methods: Secondary Data

– Demographics and Socioeconomic Status
– Social & Natural Environment
– Access to Health Care
– Health Status
• Morbidity/Mortality
• Birth Outcomes
• Preventive Care/Risk Factor Behaviors
• Infectious Diseases
• Mental & Emotional Health
– Other Community Assessments
Indicator Topics

Demographics: Rutherford Demographic / Socioeconomic
Rutherford
Source: US Census Bureau (2015). State and County QuickFacts: Davidson Co., TN. Retrieved on 6/30/15, from: http://quickfacts.census.gov/qfd/states/47000.html
Rutherford TN USA
Population, % change from 2010-2014
10.0% 3.2% 3.3%
Persons under 18 years 25.3% 23.0% 23.3%
Persons 65 years and over 9.3% 14.7% 14.1%
Female persons, percent 50.7% 51.2% 50.8%
Language other than English spoken at home
9.9% 6.6% 20.7%
Persons below poverty level 13.0% 17.6% 15.4%
Persons per square mile 424 153 87
2014 Population estimate: 288,906

288,734
349,083
409,986
155,284
187,195
226,453
0
50,000
100,000
150,000
200,000
250,000
300,000
350,000
400,000
450,000
2015 2025 2035
From 2010-2014, Rutherford County Grew 10% This is more than three times faster than the state as a whole
Population
Jobs
Demographic / Socioeconomic
Rutherford Projected Population and Job Growth (2015, 2025, 2035)
Source: Nashville Metro Planning Organization, US Census Bureau Quickfacts. Retrieved 8/21/15 *Data for May 2015
4.6% Unemployment*

Population Below the Poverty Level ACS 2009-13
Demographic / Socioeconomic
Rutherford
Source: : Map of Population Below Poverty Level, Rutherford Co. TN. Community Commons (2015). Retrieved: July 15, 2015, from www.communitycommons.org Data Source: US Census Bureau, American Community Survey. 2009-13. Source geography: Tract
Rutherford Co. 13.1%
Tennessee 17.7%
United States 15.4%
20% +
15.1-20%
10.1-15%
<10.1%
Percent in Poverty

Population Below the Poverty Level By Race, ACS 2009-13
Demographic / Socioeconomic
Rutherford
Source: Population Below Poverty Level, Rutherford Co. TN. Community Commons (2015). Retrieved: July 15, 2015, from www.communitycommons.org Data Source: US Census Bureau, American Community Survey. 2009-13. Source geography: Tract

Children in Poverty Trends, County, State and National
Demographic / Socioeconomic
Rutherford
Source: : University of Wisconsin Population Health Institute. County Health Rankings 2015. Data Source: US Census Bureau, Small Area Income and Poverty Estimates, American Community Survey. Retrieved on August 16, 2015 from: http://www.countyhealthrankings.org/

Population with No High School Diploma (25yrs and older)
Demographic / Socioeconomic
Rutherford
Source: Map of Population with No High School Diploma, Rutherford County, TN. Community Commons (2015). Retrieved: July 15, 2015, from www.communitycommons.org Data Source: US Census Bureau, American Community Survey. 2009-13. Source geography: Tract
Rutherford Co. 10.3%
Tennessee 15.6%
United States 14.0%
>21%
16.1-21%
11.1-16%
<11.1%
Percent without HS Diploma

Rutherford County ranks in the middle of TN Counties
87% (2014)
Demographic / Socioeconomic
Rutherford
81% (2013)
93% (2014)
USA
TN
Graduation Rates 2014
Rutherford
Source: County and State : The Annie E. Casey Foundation. 2015 KIDS COUNT Data Books, Retrieved from : http://www.datacenter.aecf.org US rate source: National Center for Education Statistics - http://nces.ed.gov/ccd/tables/ACGR_2010-11_to_2012-13.asp

Summary
Demographic / Socioeconomic
Rutherford
• County is experiencing rapid growth
• 90% with high school education
• 13% live in poverty; 16.5% of children live in
poverty (40% below 200%)
• Poverty and Education vary by place and race

• Housing
• Neighborhood Safety
• Transportation
• Access to Healthy Food
• Air
Social & Natural Environment

Affordable Housing 2013
Social & Natural Environment
Rutherford
Source: US Census Bureau (2015). State and County QuickFacts: Davidson Co., TN. Retrieved on 6/30/15, from: http://quickfacts.census.gov/qfd/states/47000.html
Rutherford Tennessee US
Homeownership rate 67.6% 67.8% 64.9%
Median household income $55,401 $44,298 $53,046
Median value of owner-occupied housing
$159,100 $139,200 $176,700
House value / Income 2.9 / 1 3.1 / 1 3.3 / 1
Cost Burdened Households 31.4% 31.0% 35.5%
Cost Burdened Renters 47.2% 45.9% 48.3%
Poverty 13.0% 17.6% 15.4%

Social & Natural Environment
Rutherford Homelessness 2015
1,675 Individuals
Experiencing Homelessness
846 Adults 829 Children
Source: City of Murfreesboro Consolidated Plan 2015-20: http://www.murfreesborotn.gov/DocumentCenter/View/2278

621
Social & Natural Environment
Rutherford
431
USA
TN
Rutherford County
Violent Crime Rate Per 100,000 population
199
Source: University of Wisconsin Population Health Institute. County Health Rankings 2015 Retrieved on July 31, 2015 from: http://www.countyhealthrankings.org/

Social & Natural Environment
Rutherford
Source: Tennessee Bureau of Investigation. Tennessee Crime On-Line. Retrieved on 8/12/15, From: http://tennesseecrimeonline.com/public/Browse/browsetables.aspx
Domestic Violence Number of Victims
2014 Rate per 1,000
Rutherford 12.7 Tennessee 11.6
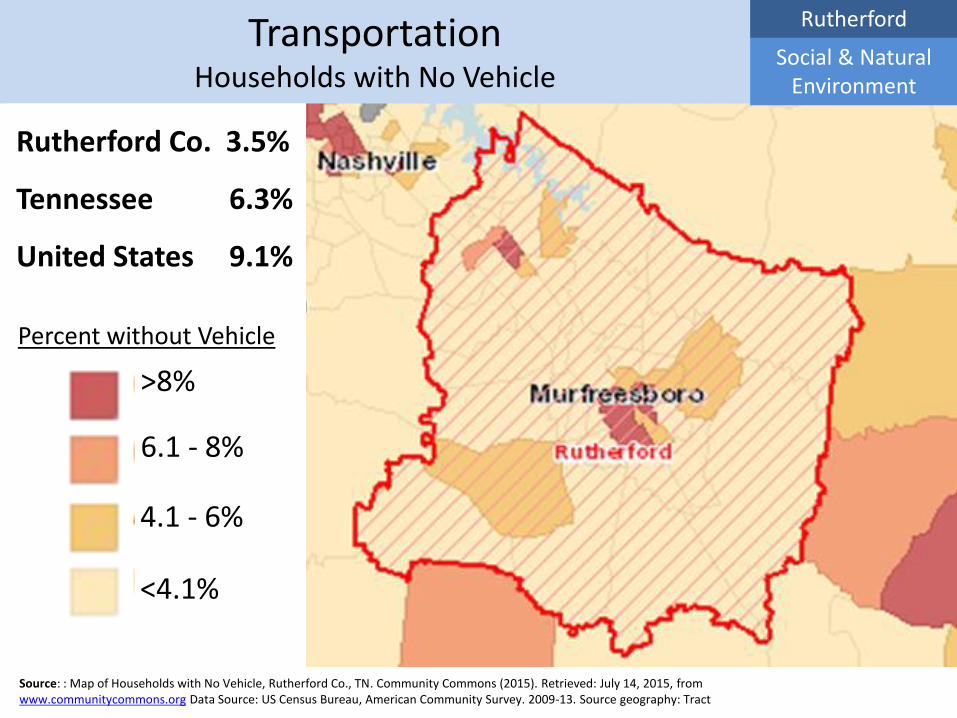
Transportation Households with No Vehicle
Social & Natural Environment
Rutherford
Source: : Map of Households with No Vehicle, Rutherford Co., TN. Community Commons (2015). Retrieved: July 14, 2015, from www.communitycommons.org Data Source: US Census Bureau, American Community Survey. 2009-13. Source geography: Tract
Rutherford Co. 3.5%
Tennessee 6.3%
United States 9.1%
>8%
6.1 - 8%
4.1 - 6%
<4.1%
Percent without Vehicle

Population with Limited Food Access Social & Natural Environment
Rutherford
Source: Map of Population with Limited Food Access, Nashville TN. Community Commons (2015). Retrieved: July 14, 2015, from www.communitycommons.org Data Source: US Department of Agriculture, Economic Research Service, USDA - Food Access Research Atlas. 2010. Source geography: Tract
Rutherford Co. 28.6%
Tennessee 27.4%
United States 23.6%
>50%
20.1 - 50%
5.1-20%
<5.1%
No Low Food Access

Fast Food Restaurants Rate per 100,000 population
Social & Natural Environment
Rutherford
Source: Community Commons . Fast Food Restaurants, Rate per 100,000 population by year, 2008-2013. Data Source: US Census Bureau, County Business Patterns. Additional data analysis by CARES. 2013. Source geography: County Retrieved 7/14/15, Retrieved from: communitycommons.org

Social & Natural Environment
Rutherford
Source: Family & Children’s Services. Data Source: United Way of Metropolitan Nashville., 2-1-1
2-1-1 Calls, Top 10 Categories FY2014
Social & Natural Environment
Rutherford
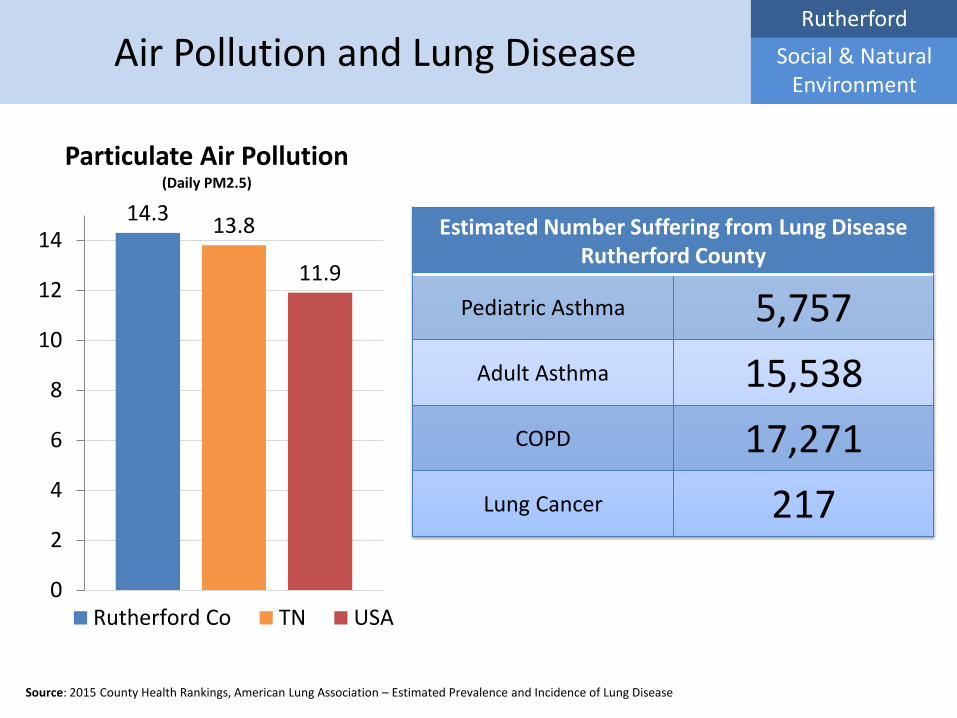
Source: 2015 County Health Rankings, American Lung Association – Estimated Prevalence and Incidence of Lung Disease
Air Pollution and Lung Disease
14.3 13.8
11.9
0
2
4
6
8
10
12
14
Particulate Air Pollution (Daily PM2.5)
Rutherford Co TN USA
Estimated Number Suffering from Lung Disease Rutherford County
Pediatric Asthma 5,757
Adult Asthma 15,538
COPD 17,271
Lung Cancer 217

Summary Social & Natural Environment
Rutherford
• Many are burdened by housing costs
• Violent crime rate is high
• Areas of limited healthy food access are present
• Rates of fast food establishments are rising
• Particulate air pollution presents a regional
challenge

• Provider availability
• Health staffing shortages by HPSAs
• Insurance coverage
Access to Health Care

Access to Health Care
Rutherford
Source: 2015 County Health Rankings
Provider Rates
RutherfordTop 10% US
Counties
Primary Care 2231:1 1045:1
Dental 2036:1 1377:1
Mental Health 1358:1 386:1
County Heath
Rankings
Rutherford Best 10% of US Counties

Access to Providers Behavioral Risk Factor Surveillance Survey
Access to Health Care
Rutherford
Source: Tennessee Department of Health (2013/2012) Behavioral Risk Factor Surveillance System: Tennessee State and Regional Data, retrieved from: on July 17, 2015 Centers for Disease Control and Prevention, National Center for Chronic Disease Prevention and Health Promotion, Division of Population Health. BRFSS Prevalence & Trends Data [online]. 2015. [accessed Aug 05, 2015].

73
Access to Health Care
Rutherford
65
85
Preventable Hospital Stays # of Hospital Stays for ambulatory-care sensitive conditions / 1,000 Medicare Enrollees
Source: University of Wisconsin Population Health Institute. County Health Rankings, 2015. Preventable Hospital Stays, 2012.. Data CDC, National Center for Health Statistics and Division of Behavioral Surveillance Dartmouth Institute for Health Policy & Clinical Practice. Retrieved on 7/17/15, From: http://www.countyhealthrankings.org
USA
TN
Rutherford

Chronic Disease Hospitalization Rate (age-adjusted per 100,000)
Access to Health Care
Rutherford
Source: TN DOH, Chronic Disease Health Profile, December 2011, Retrieved 8/15/15, from: http://hit.state.tn.us/CDProfiles.shtml

Health Insurance Tennessee Coverage of Total Population 2013
Access to Health Care
Rutherford
Source: : Kaiser Family Foundation 2015. State Health Facts. Health Insurance Coverage of the Total Population. Retrieved: August 28, 2015, from www.kff.org Data Source: US Census Bureau, American Community Survey. 2009-13. Source geography: Tract

Health Insurance Uninsured Population 2009-2013
Access to Health Care
Rutherford
Source: : Map of Insurance-Uninsured Population, Rutherford Co., TN. Community Commons (2015). Retrieved: July 14, 2015, from www.communitycommons.org Data Source: US Census Bureau, American Community Survey. 2009-13. Source geography: Tract
Rutherford Co. 13.6%
Tennessee 14.1%
United States 14.9%
20% +
15.1-20%
10.1-15%
<10.1%
No Data
Percent Uninsured

Summary Access to Health Care
Rutherford
• Fewer providers relative to nation and state
– 11% did not see MD due to cost
– 28% did not visit a dental professional in the past year
• HPSA facilities within county
• Remain less than 100% coverage, 100% access

• Morbidity/Mortality
– Causes of Death
– Premature Death (Years of Potential Life Lost)
• Birth Outcomes
• Preventive Care/Risk Factor Behaviors
• Infectious Disease
• Mental & Emotional Health
Health Status

Morbidity / Mortality
Rutherford
Source: National Center for Health Statistics http://blogs.cdc.gov/nchs-data-visualization/2015/06/01/deaths-in-the-us/
Causes of Death: USA, 1900-2013 Age adjusted Death Rates for Selected Major Causes of Death
0
100
200
300
400
500
600
1900 1910 1920 1930 1940 1950 1960 1970 1980 1990 2000 2010
Mo
rtal
ity
Rat
e p
er 1
00
,00
0,
Stan
dar
d P
op
ula
tio
n
Year
Heart Disease
Influenza, Pneumonia
Cancers
Accidents
Stroke

Morbidity / Mortality
Rutherford
Cancer
23
Heart Disease 22
Lung Disease 6
Accidents 5
Stroke 5
Alzheimer's 4
Diabetes 3
Flu / Pneumonia 3
Suicide 2
Liver Disease 2
Other [25]
Percentage of Deaths Rutherford County (2011-2013)

Morbidity / Mortality
Rutherford
6605
8636
6592
0 2000 4000 6000 8000 10000
United States
Tennessee
Rutherford County
Premature Death Rate per 100,000 population (2013)
Source: National Vital Statistics System-Mortality (NVSS-M) (2011-2013)
Premature Death Rate of Potential Years of Life Lost per 100,000 population - 2013

22.2
15.3
12.8
6.3
2.2 3.3
21.6
15.1 14.9
5.7
3.2 4.4
0
5
10
15
20
25
Cancer Heart Disease UnintentionalInjury
Suicide Homicide PerinatalPeriod
Pe
rce
nta
ge o
f Y
PLL
<ag
e 7
5 y
ear
s
Rutherford County
TN
USA
Premature Death Rutherford County (2009) vs. Tennessee (2013) vs. United States (2013)
Morbidity / Mortality
Rutherford
Source: State and National data - National Vital Statistics System-Mortality (NVSS-M) (2013), Rutherford County Data - Tennessee Department of Health, Office of Policy, Planning and Assessment, Division of Health Statistics (2009)
Premature Death Percentage of Years of Potential Life Lost, by Leading Cause

Morbidity / Mortality
Rutherford Premature Death in TN Racial Disparity in % of YPLL by Cause
21.4
17.6 16.2
6.1
1.4 2.1
17.6 16.8
10.6
2.1
8.6
6.7
0
5
10
15
20
25
Cancer Heart Disease UnintentionalInjury
Suicide Homicide PerinatalPeriod
Pe
rce
nta
ge o
f Ye
ars
of
Po
ten
tial
Lif
e L
ost
(<7
5)
TN - White
TN - Black
Source: State and National data - National Vital Statistics System-Mortality (NVSS-M) (2013), Rutherford County Data - Tennessee Department of Health, Office of Policy, Planning and Assessment, Division of Health Statistics (2009)

Morbidity / Mortality
Rutherford Cancer Death Rates in Tennessee Disparities by Race, Gender (2012)
311.6
94.8 90.9
45.5 37.3 32.4
151.7
45.1 32
14.7 13.3 21.4
0
50
100
150
200
250
300
350
All Cancer Lung DigestiveSystem
Genital Colorectal BreastCancer
Dea
th R
ate
fro
m C
ance
r, p
er 1
00
,00
0 p
op
ula
tio
n
Black Male White Male Black Female White Female
The cancer death rate is higher for men than women.
Particularly black men, who die of cancer at more than twice the rate of white women
Source: CDC Wonder, US Cancer Statistics, Data is age-adjusted statewide rate for Tennessee in 2012

Morbidity/ Mortality
Rutherford Heart Disease Death Rates in Tennessee Disparities by Race, Gender
251.4
208
236.8
195.1
265.7 266.5
170
190
210
230
250
270
290
2004 2005 2006 2007 2008 2009 2010 2011 2012 2013
Dea
th R
ate
fro
m H
eart
Dis
eas
e, p
er 1
00
,00
0 p
op
ula
tio
n
Rates of Heart Disease Death are Falling, particularly for women and non-white men
Source: 2013 Tennessee Women’s Health Report Card, 2013 Tennessee Men’s Health Report Card
White Male
Female (all)
Black Male
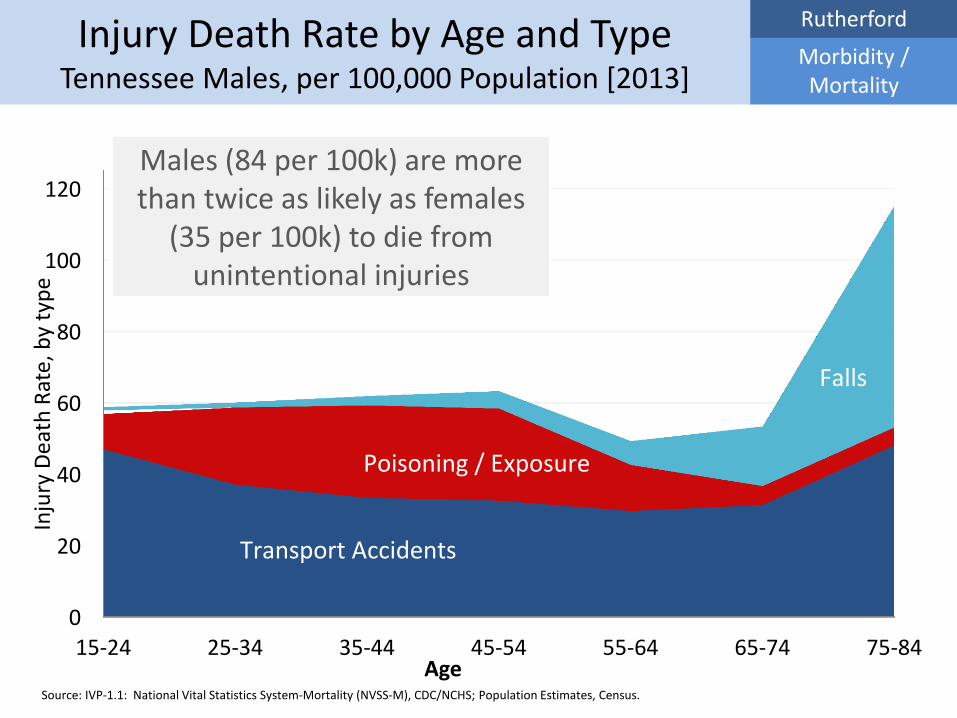
Morbidity / Mortality
Rutherford
Source: IVP-1.1: National Vital Statistics System-Mortality (NVSS-M), CDC/NCHS; Population Estimates, Census.
Injury Death Rate by Age and Type Tennessee Males, per 100,000 Population [2013]
0
20
40
60
80
100
120
15-24 25-34 35-44 45-54 55-64 65-74 75-84
Inju
ry D
eath
Rat
e, b
y ty
pe
Age
Transport Accidents
Poisoning / Exposure
Falls
Males (84 per 100k) are more than twice as likely as females
(35 per 100k) to die from unintentional injuries

Summary Morbidity / Mortality
Rutherford
• Cancer and heart disease are leading causes of death
• Causes of death vary by race and gender
• Combined accidents, assaults and suicide represent 12% of deaths and 21% of years of potential life lost

• Infant Mortality
• Low Birth Weight
• Prenatal Care
• Teen Pregnancy
Birth Outcomes

0
0.5
1
1.5
2
2.5
3
0
20
40
60
80
100
120
140
160
180
200
1915 1925 1935 1945 1955 1965 1975 1985 1995 2005
Dis
par
ity
in B
lack
Rat
e o
ver
Wh
ite
Rat
e
Infa
nt
Dea
th R
ate
pe
r 1
00
0 L
ive
Bir
ths
Black
White
Relative Disparity in Black Rate over White Rate
Birth Outcomes
Rutherford Infant Mortality in the United States
Racial Disparities since 1915
Source: CDC/NCHS, National Vital Statistics System, Mortality Data ;1900–1967, CDC Wonder

Birth Outcomes
Rutherford
Source: TN Dept of Health, Division of Policy, Planning and Assessment, Office of Health Stats; National Vital Statics Reports, Vol 64 No1 Jan 15, 2015; KIDS Count
4.5
6.8
6
0
1
2
3
4
5
6
7
8
9
10
Infant Death Rate / 1000births
Rutherford
Tennessee
United States
US Ranks 55th
Infant Mortality: Rutherford Co International Comparison - 2013
Cuba (4.7)
France (3.3)
Czech Republic (2.6)
Japan (2.1)

Birth Outcomes
Rutherford
Source: TN Dept of Health, Division of Policy, Planning and Assessment, Office of Health Stats; National Vital Statics Reports, Vol 64 No1 Jan 15, 2015; KIDS Count
1.5
8.7
4.5
1.6
9.1
6.8
1.4
8
6
0
1
2
3
4
5
6
7
8
9
10
Very Low Birthweight(%)
Low Birthweight (%) Infant Death Rate / 1000births
Rutherford
Tennessee
United States
Birth Outcomes 2013

1.5
8.7
4.5
1.3
7.7
3.6 2.7
14.2
7.7
0
2
4
6
8
10
12
14
16
Very Low Birthweight (%) Low Birthweight (%) Infant Death Rate / 1000 births
Rutherford
White
Black
2.1x
Birth Outcomes
Rutherford Birth Outcomes Racial Disparities In Rutherford County (2013)
2.1x
1.8x
Source: TN Dept of Health, Division of Policy, Planning and Assessment, Office of Health Stats; National Vital Statics Reports, Vol 64 No1 Jan 15, 2015; KIDS Count

Teen Pregnancy Rates; Ages 15-17, Trend: 2005-2014
Birth Outcomes
Rutherford
33.8
16.1
28.8
10.7
0
5
10
15
20
25
30
35
40
2005 2006 2007 2008 2009 2010 2011 2012 2013 2014
Tee
n P
regn
ancy
Rat
e, p
er
10
00
15
-17
yo
Fe
mal
es
Teen Pregnancies are In Decline Across the County and State
Tennessee (-52%)
Rutherford(-63%)
Source: KIDScount, Tennessee Department of Health, Office of Policy Planning and Assessment, Division of Health Statistics.

Summary Birth Outcomes
Rutherford
• Infant mortality and low birth weight rates are high
– Vary by race
• Mothers receiving early prenatal care is steady, but remains below HP2020 goal
• Teen pregnancy and birth rates continue to decline
– Vary by race

• Well-being
• Tobacco & Substance Use
• Obesity & Nutrition
• Physical Activity
• Youth Risk Behavior Survey
• Vaccinations
Preventive Care / Risk Factor Behaviors

23%
Preventive Risk Factors
Rutherford
Source: 2015 County Health Rankings, BFRSS, 2006-2012
15%
17%
Adults Reporting “Poor” or “Fair” Health 2006-2012
USA
TN
Rutherford

23%
Preventive Risk Factors
Rutherford
Source: 2015 County Health Rankings, : Tennessee Department of Health, Division of Policy, Planning and Assessment, Behavioral Risk Factor Surveillence System., HealthyPeople2020.gov
21%
12%
Adult Smokers 2013
17%
Tobacco use is the most preventable
cause of premature mortality and
morbidity - TN Dept of Health
Healthy People 2020 Target
USA
TN
Rutherford

Preventive Risk Factors
Rutherford Substance Abuse
TDMHSAS Funded Treatment Admissions, by Cause (FY 2014)
5.6
36.9
51.5
39.9
11.6
40.2 44.2
38.6
0
10
20
30
40
50
60
70
Methamphetamines Opiods Alcohol Other Illicit Drugs
Pe
rce
nt
of
Tota
l Ad
mis
sio
ns,
by
Sub
stan
ce
Substance of Abuse for TDMHSAS funded treatment admissions
Rutherford County
TN
Source: 2014 Tennessee Behavioral Health County Data Book
More than 1 in 12 People in Rutherford County have Abused Substances in the Past Year

34% Obese
Preventive Risk Factors
Rutherford
Source: Mid-Cumberland and State: Source: Tennessee Department of Health . 2013 BRFSS. US, Source: ,Kaiser Family Foundation
31% Obese
Adults Obese and Overweight 2013
69% Overweight and Obese
68% Overweight and Obese
64% Overweight and Obese
34% Obese
Mid-Cumberland Region
TN
USA

77%
70%
Social Environment
Rutherford
Source: 2015 County Health Rankings
65%
Access to Exercise Opportunities 2013
USA
TN
Rutherford

63%
Preventive Risk Factors
Rutherford
Source: Tennessee Department of Health 2013 . Behavioral Risk Factor Surveillance Survey
75%
71% Mid-Cumberland
Region
Adults Participating in Physical Activity (Past Month) 2013
USA
TN

Preventive Risk Factors
Rutherford
Source: BRFSS: TN DoH (2013). Behavioral Risk Factor Surveillance System: Tennessee State and Regional Data. Retrieved 8/14/15 from: http://tn.gov/health/topic/statistics-brfss
Influenza & Pneumococcal Vaccination Adults and Seniors 2013

73%
Preventive Risk Factors
Rutherford
Source: TN DoH (2014). Behavioral Rtor Surveillance System: Tennessee State and Regional Data.. *Data is for Mid-Cumberland Region
24-Month Vaccinations 2014
77%
92.4
97.1 96.2 96.2
83.8
97.1
93.3
80828486889092949698
100
DTaP Poliomyelitis MMR Hepatitis B Hib Varicella Pneumococcus
The Mid-Cumberland Region Exceeds Healthy People 2020 Targets in 6 of 7 Leading Recommended Vaccinations at 24 months of age
24 Month Olds, Fully Vaccinated
(4:3:1:3*:3:1:4 Series)
HP 2020 Target (90%)
Mid-Cumberland Region

Youth Risk Behavior Survey 2013 – Tennessee High School Youth (US)
Preventive Risk Factors
Rutherford
• Tobacco Use – 15.4% smoked cigarettes within 30 days (US: 15.7%)
– 12% smoked a whole cigarette before age 13 (US: 9.3%)
• Nutrition & Obesity – 16.9% are obese (US: 13.7%)
– 15.4% are overweight (US: 16.6%)
• Physical Activity – 19.6% were not physically active at least 60 min on
at least 1 day during the past week (US: 15.2%)
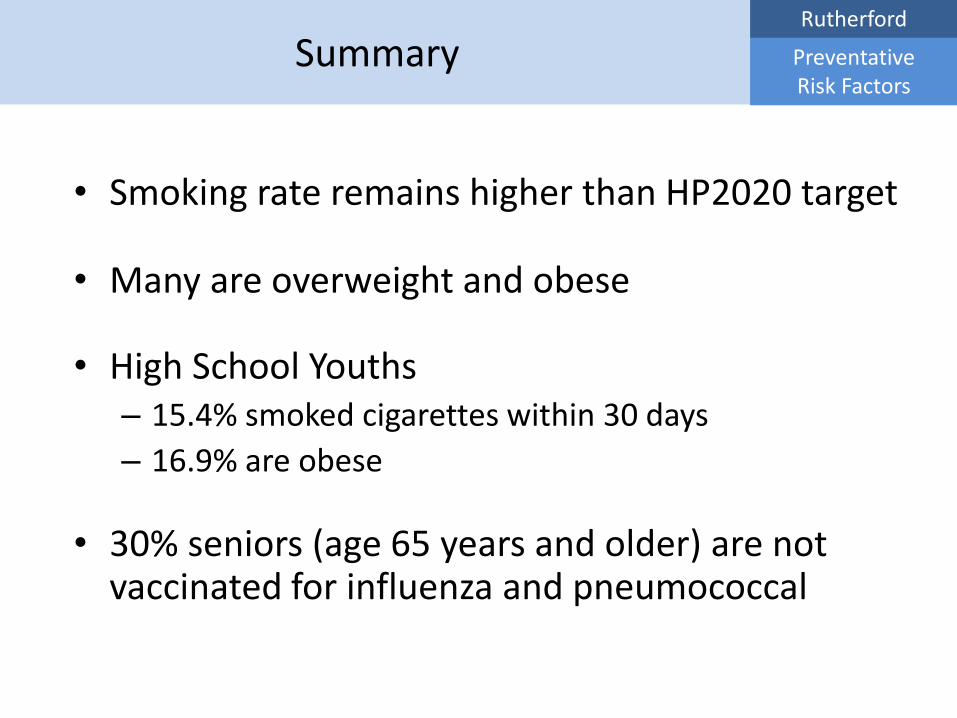
Summary Preventative Risk Factors
Rutherford
• Smoking rate remains higher than HP2020 target
• Many are overweight and obese
• High School Youths – 15.4% smoked cigarettes within 30 days
– 16.9% are obese
• 30% seniors (age 65 years and older) are not vaccinated for influenza and pneumococcal

• STD incidence rates
– chlamydia
– gonorrhea
– syphilis
• HIV incidence rate
Infectious Disease

Chlamydia Trends 2003 – 2012
Infectious Disease
Rutherford
Source: Community Commons (2015). Data Source: US Department of Health Human Services, Health Indicators Warehouse. Centers for Disease Control and Prevention, National Center for HIV/AIDS, Viral Hepatitis, STD, and TB Prevention. 2012. Source geography: County. Retrieved on 7/14/15, From: www.communitycommons.org Source: Centers for Disease Control and Prevention . NCHHSTP Atlas. Chlamydia by County. Retrieved on 8/12/15, From: http://gis.cdc.gov/GRASP/NCHHSTPAtlas/main.html
State 2012 White 251.5 Black 1,629.9

Gonorrhea Trends 2003 – 2012
Infectious Disease
Rutherford
Source: Community Commons (2015). Data Source: US Department of Health Human Services, Health Indicators Warehouse. Centers for Disease Control and Prevention, National Center for HIV/AIDS, Viral Hepatitis, STD, and TB Prevention. 2012. Source geography: County. Retrieved on 7/14/15, From: www.communitycommons.org
State 2012 White 36.5 Black 627.2

HIV Prevalence Trends 2008-2010
Infectious Disease
Rutherford
Source: Community Commons (2015). Data Source: US Department of Health Human Services, Health Indicators Warehouse. Centers for Disease Control and Prevention, National Center for HIV/AIDS, Viral Hepatitis, STD, and TB Prevention. 2010. Source geography: County. Retrieved on 7/14/15, From: www.communitycommons.org
State 2010 White 145.6 Black 1,093.6

Summary Infectious Disease
Rutherford
• Chlamydia rates are rising
• Gonorrhea rate is increasing locally
• STD prevalence rates vary
– By Race/Ethnicity (higher among minorities)

• ACE
• Well-being
• Mental Illness
• Serious mental illness
Mental & Emotional Health

Mental and Emotional Health
Rutherford
Adverse Childhood Events (ACEs)
# ACEs % (TN)
0 48%
1 20%
2 11%
3 7%
4(or more) 14%
Source: “Adverse Childhood Experiences in Tennessee,” Tennessee Department of Health

3.4
Mental and Emotional Health
Rutherford
Source: Source: 2015 County Health Rankings
2.7
3.5
USA
TN
Poor Mental Health Days (last 30 days) 2013
Rutherford

21%
Mental and Emotional Health
Rutherford
Source: 2015 County Health Rankings,
20%
19%
USA
TN
Mental Illness in the past Year (18+) 2013
Rutherford

Mental and Emotional Health
Rutherford
Source: Substance Abuse and Mental Health Services Administration. Behavioral Health Barometer: Tennessee, 2014. HHS Publication No. SMA–15–4895TN. Rockville, MD: Substance Abuse and Mental Health Services Administration, 2015.
Serious Mental Illness (SMI) in the past Year (18+), 2013
Serious Mental Illness (SMI)
Schizophrenia
Bipolar Disorder
Schizoaffective Disorder
Major Depressive Disorder
~8,000 Experience
Serious Mental Illness Each Year

Mental and Emotional Health
Rutherford
Mental Illness
“Evidence has shown that
mental disorders
are strongly related to the occurrence of many chronic diseases, including
diabetes, cancer, cardiovascular disease, asthma, and obesity
and many risk behaviors for chronic disease; such as,
physical inactivity, smoking, excessive drinking, and insufficient sleep.”
- Centers for Disease Control

• TN Dept. of Health – Drive Your County to the Top Ten
http://tn.gov/health/topic/specialreports
• County Health Status Indicators http://wwwn.cdc.gov/CommunityHealth/HomePage.aspx
Other Community Assessments

Community Needs Assessments
Rutherford
Summary
• 13% live in poverty
– 40% of children below 200% poverty level
• Health outcomes could be improved
• Place & Race matter
• Many resources in our community

Thank you / Questions

Findings From Interviews with Community Leaders

Methods: Interviews
• Interviewed community representatives and leaders with: – Focus on the broad interests of the community
– Serving low-income, minority or underserved populations
• Sectors represented include: public health, government/public sector, health care, education, faith community, private foundations, academia
• Interviews conducted in pairs by STH, VUMC and graduate students from MMC and VU
• Closed and open-ended questions Rutherford

Methods: Interviews (cont.)
• Semi-structured interview protocol focused on health concerns, determinants of health, health systems issues, health assets
• Quantitative data (6 questions) :
– Entered in REDCap and analyzed using excel
– “Other” responses coded or analyzed separately
• Qualitative data (3 questions):
– Thematic analysis conducted using team of 3 reviewers for each question
Rutherford

“What are the Greatest Health and/or Health Care Concerns in your Community?” (n=28)
Health Concerns (Rutherford) %
1. Mental/Emotional Health 50
2. Obesity 46
3. Affordability/Cost of Care 39
4. Access to Care 36
5. Alcohol & Drug Abuse 32
6. Oral/Dental Health 29
6. Housing/Homelessness 29
6. Health Education 29
9. Transportation 21
Rutherford Respondents Could Select Up to Five Response Options Answers with zero responses excluded from chart

“What Socioeconomic and Demographic Factors have the Biggest Impact on Community Health?”(n=28)
Leading Health Concerns (Rutherford)
%
1. Health Insurance Coverage 54
2. Poverty/Working Poor 39
3. Education Attainment 32
4. Language Barriers 25
4. Wealth Dispersion 25
6. Cultural Competency 21
6. Housing/Homelessness 21
6. Food Insecurity 21
Rutherford Respondents Could Select Up to Three Response Options

“What Environmental Factors have the Biggest Impact on Community Health?”(n=28)
Conditions/Diseases (Rutherford) %
1. Healthy Food Access 57
2. Transportation 54
2. Housing/Homelessness 54
4. Limited Sidewalks 29
5. Secondhand Smoke 25
Rutherford Respondents Could Select Up to Three Response Options

“What Conditions and Diseases are Causing Illness and Death in your Community?” (n=28)
Conditions / Diseases (Rutherford) %
1. Alcohol & Drug Abuse/ Addiction 50
2. Emotional and Mental Health 46
3. Obesity 43
4. Diabetes 39
5. Cancer 29
6. Cardiovascular Disease 25
Rutherford Respondents Could Select Up to Three Response Options

Health System (Rutherford) %
1. Affordability/Cost of Care 39
2. ER use for non-emergencies 32
3. Health Education 25
3. Coordination of Care 25
5. Transportation Barrier to Care
21
5. Provider Availability 21
5. Health Navigation 21
5. Not Prevention Focused 21
5. Access: Overall 21
“What Are the Greatest Barriers within the Health System?” (n=28)
Rutherford Respondents Could Select Up to Three Response Options

Behaviors (Rutherford) %
1. Alcohol/Drug Abuse & Addiction 54
2. Nutrition/Healthy Eating 46
2. Physical Activity 46
4. Tobacco Use/Smoking 36
5. Health Education /Literacy 32
6. Preventive Care 25
7. Texting While Driving 21
7. Adherence to Medical Regimen 21
“What Behaviors have the most Negative Impact on Health in your Community?” (n=28)
Rutherford Respondents Could Select Up to Three Response Options

“What Reasons/Barriers exist that cause the use of ER for non-emergencies?” (n=28)
• Lack of consistent source of medical care ▫ There are not enough primary care providers for people
to see when needed urgently or for prevention
• Convenience, hours of operation and transportation ▫ The ER provides immediate access to care during non-
business hours ▫ Lack of after hours availability to primary care
providers
• No Health Insurance ▫ Many without insurance aren’t familiar with the
financial impact of unnecessary ER use
• Health Navigation/Literacy ▫ Many homeless families are more concerned about
shelter than preventive healthcare
Rutherford

“What Community Health Assets work well to support health and well-being?” (n=28)
• Safety net healthcare & service providers
▫ Local health department
▫ Mobile health unit & safety net clinics
▫ Basic service agencies
• Community cohesiveness
▫ We work well together
▫ Degree of perceived collaboration and engagement within the county
• Hospitals & Healthcare availability in the county
• Greenways & Recreational opportunities
▫ Walking trails, farmers’ markets
▫ Local recreational facilities
Rutherford

“What Priority Actions should Rutherford County focus on?” (n=28)
• Increase access to affordable primary care
▫ Address transportation barriers
▫ More providers for low income individuals
▫ Integration of services
• Substance abuse
• Mental health
• Lifestyle component
▫ Healthy food access/nutrition/obesity
▫ Walkability/physical activity
• Increase access to adult dental care
Rutherford

Rutherford Co. Interview Summary
Rutherford
Alcohol & Drug abuse/addition
Emotional and Mental Health
Nutrition/Physical Activity
Working together to address issues

Findings From Community Listening Sessions

Listening Session Methodology
Rutherford
• Three listening sessions held. Collaborated with health department and community partners on recruitment – Rutherford County Health Department (Smyrna) – Primary Care & Hope Clinic – First Baptist Church
• Moderated and co-moderated by partners • Moderator’s guide topics included community
assets and issues, health and healthcare issues, preventable ER utilization, and priority actions
• Short survey to obtain participant demographic info • Qualitative data: thematic analysis conducted using
team of four reviewers

Demographic Information Listening Sessions
Demographics of Participants (n=37)
– 76% Female
– 97% English speakers
– 25% High School Completion or less, 22% Some College, 53% College Degree or more
– 19% Uninsured, 58% Insured, 15% Medicare, 3% Medicaid
Rutherford

“What Community Health Assets/Resources work well to support health and well-being?”
• Parks, greenways
• Centralized location and highways
• Growth of businesses
• Activities for kids and recreational opportunities
–Many opportunities offered by faith community
Rutherford

“What are the Top Community Issues?”
• Traffic
• Transportation and difficulty navigating different areas of the county
• Walkability
• Cost of living – Affordable child care – Affordable housing
• Resources available but community not using or aware of them
• Long wait for services/benefits (i.e. housing and unemployment)
Rutherford

“What are the Greatest Health and/or Health Care Issues in your community?”
• Access to care, cost of care – Insurance gap, lack of insurance – Cost of prescription drugs
• Culture of unhealthy eating
• Emotional/mental health – Opportunities and youth development
• Substance use/abuse – Addiction – Prescription drugs
• Access to specialty care – Mental and adult dental
Rutherford

“What Reasons/Barriers exist that cause the Use of ER for non-emergencies?”
• No co-pays or need for cash upfront
• Care regardless of ability to pay or comprehensiveness of insurance coverage
• Transportation barrier to local care providers
• Challenges of accessing primary care system and limitations of available hours for primary care visits
Rutherford

“If you had a Magic Wand, what Priority Actions should your community focus on?”
• Transportation, transit, connectivity across the county
• Coordination and collaboration across community and health resources
• Access to care: – Mental health
– Adult dental
• Expand affordable insurance options and address insurance gap
Rutherford

Rutherford Co. Listening Session Summary
Rutherford
Transportation and lack of connectivity
across the county
Emotional/Mental health
Health system difficult to navigate and not
easily accessible
Information on health and social services
can be difficult to access

Limitations: Primary and Secondary Data
• Interviews:
– Response categories on interview guide for some questions not mutually exclusive
– Variability in number of responses that respondents chose
• Listening sessions:
– Representativeness of listening session participants
– Potential language/cultural barriers
• Secondary data:
– Source variability
– Benchmarking not always available
Rutherford

• Interviewees & listening session participants
• Primary Care and Hope Clinic
• First Baptist Church
• Lane Agri-Park Community Center/ Rutherford County Agricultural Extension
• Student team members:
– Christopher Artis, Meharry Medical College
– Althea Robinson, Vanderbilt University
– Shellese Shemwell, Vanderbilt University
Acknowledgements

Questions/Discussion

Exercise 1: Identification of Health Needs
Identification of Health Needs
• Please write down 3 Health Needs
– 1 per sticky note
• Place sticky note on white paper

Exercise 2: Visioning, Goals, Resources
• Work in groups
• Worksheets at tables
• Groups will need:
– Facilitator
– Recorder
– Reporter

Thank you to all!!


