20
3. SYSTEM OPERATION (VOLTAGE CONTROL AND SYSTEM PROTECTION) SPEAKER: MR. KISHISHITA T AKESHI, KANSAI ELECTRIC POWER CO., Inc. 47

3. SYSTEM OPERATION
(VOLTAGE CONTROL AND SYSTEM PROTECTION)
SPEAKER: MR. KISHISHITA TAKESHI,
KANSAI ELECTRIC POWER CO., Inc.
47
3. System Operation(Voltage Control and System Protection)
Study onOptimal Electric Power Development
in Java-Madura-Baliin the Republic of Indonesia
August 2008NEWJEC Inc.
The Kansai Electric Power Co., Inc.
Technical Transfer Seminar
3-1
Table of Contents
1. Design of Transmission Line and Substation
2. Advanced and Efficient Technologies of Transmission and Substation Equipment
3. System Operation(Voltage Control and System Protection)
3-2
3. System Operation
3-1. Fault Extension Protection Relay System3-2. Reactive Supply Equipment3-3. Voltage Operation3-4. HVDC Technology3-5. Hydropower Operation with the Developed
Support System3-6. Pumped-Storage Power Station3-7. Power System Analysis3-8. Introduction of Past Large Scale Power Outages
in KANSAI
3-3
3. System Operation
3-1. Fault Extension Protection Relay System3-2. Reactive Supply Equipment3-3. Voltage Operation3-4. HVDC Technology3-5. Hydropower Operation with the Developed
Support System3-6. Pumped-Storage Power Station3-7. Power System Analysis3-8. Introduction of Past Large Scale Power Outages
in KANSAI
3-4
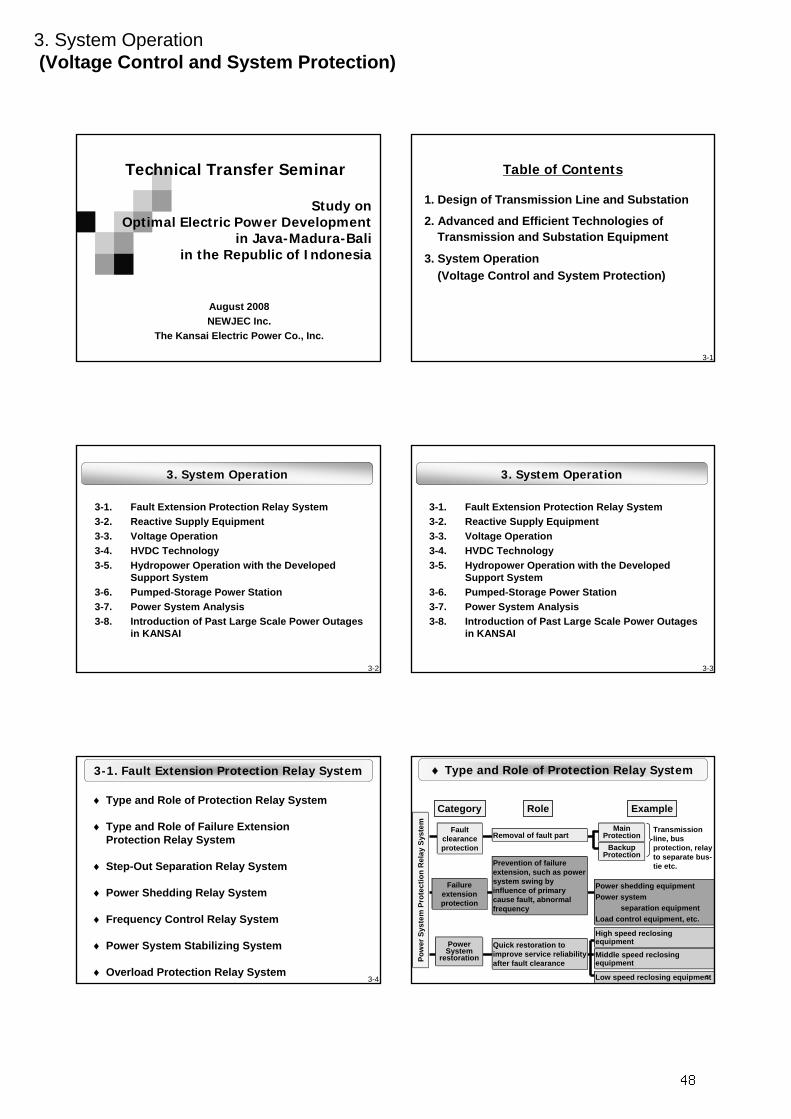
3-1. Fault Extension Protection Relay System
♦ Type and Role of Protection Relay System
♦ Type and Role of Failure ExtensionProtection Relay System
♦ Step-Out Separation Relay System
♦ Power Shedding Relay System
♦ Frequency Control Relay System
♦ Power System Stabilizing System
♦ Overload Protection Relay System3-5
Power shedding equipment Power system
separation equipment Load control equipment, etc.
Backup Protection
Transmission line, bus protection, relay to separate bus-tie etc.
High speed reclosingequipment
Main Protection
Middle speed reclosing equipment
Low speed reclosing equipment
Power System
restoration
Removal of fault part
Prevention of failure extension, such as power system swing by influence of primary cause fault, abnormal frequency
Quick restoration to improve service reliability after fault clearance
Fault clearance protection
Failure extension protection
Pow
er S
yste
m P
rote
ctio
n R
elay
Sys
tem
♦ Type and Role of Protection Relay System
5
Category Role Example
48

3. System Operation(Voltage Control and System Protection)
3-6
Dra
stic
cha
nge
in fl
ow /
Con
side
rabl
e an
d ra
pid
unba
lanc
e of
sup
ply
and
dem
and
Single fault
Rapid demandfluctuations
Main relay operates& Reclosing
・Main relay separatesfaulty phase
・Multi-phase reclosing
Backup relay operates
2-circuit loop reclosing(Reclosing function in route failure in loop systems)
Power control/shedding, load shedding by overload protection relay
Larg
e-sc
ale
pow
er o
utag
e
Failure of high-speed fault clearance
Route failure in trunk line
Step-out
Overload
Voltage instability
Frequency abnormality
Protection range of relay system for fault clearance
Protection range of failure extension protection relay system
Block Block Block Block
Block
Block
Block
BlockBlock
Block
Operation failure of main protection relays or CB may cause various abnormal system conditions, and if such a situation is not properly handled, it may result in large-scale power outages. Therefore failure extension protection relay system is installed.
Simultaneous failureof 2-circuit intransmission
Power shedding, system separation by step-out prevention relay
Power shedding, system separation by step-out separation relay
load shedding by voltagedrop relay
Power shedding, load shedding by frequency rise/drop prevention relay
Power shedding, load shedding by frequency
rise/drop prevention relay
♦ Type and Role of Failure Extension Protection Relay System (1)
3-7
- Maintenance of Stability -
Failure extension protection
Relay
Maintenance of stability
Maintenance of frequency
Over load resolution
Stability collapse prevention and step out separation due to a delay of fault interruptionStep out prevention and step out separation of local systems due to fault interruption Step out prevention among power systems due to assumed large power drop faultsPrevention of chain reactions to other companies due to step outPrevention of collapse of all systemsdue to faults out of assumption
Faul
t con
tinua
tion
sepa
ratio
n
Pow
er s
hedd
ing
Ste
p ou
t sep
arat
ion
Freq
uenc
yse
para
tion
Spe
cial
pro
tect
ion
syst
em (B
SS
)
Emer
genc
y lo
ad
shed
ding
Bus
sep
arat
ion
Pum
ped
stor
age
load
in
terru
ptio
n
♦ Type and Role of Failure Extension Protection Relay System (2)
3-8
- Maintenance of Frequency, Overload Resolution -Maintenance of stability
Maintenance of frequency
Over load resolution
Prevention of frequency drops due to assumed large power drop faults
Power drop faults out of assumption, fault of 1 outer loop in case of radial operation, maintenance of frequency in case of isolated faults of main power systemsPrevention of chain reactions due to abnormal frequency in case of faults to other companiesOver load resolution of sound equipment due to fault interruption
Faul
t con
tinua
tion
sepa
ratio
n
Pow
er s
hedd
ing
Ste
p ou
t sep
arat
ion
Freq
uenc
yse
para
tion
Spe
cial
pro
tect
ion
syst
em (B
SS
)
Emer
genc
y lo
ad
shed
ding
Bus
sep
arat
ion
Pum
ped
stor
age
load
in
terru
ptio
n Failure extension protection
Relay
♦ Type and Role of Failure Extension Protection Relay System (3)
3-9
Stable condition
Small rotary force is added
Threads twista little
Light weight is risen by transmission of force
If a few threads are cut under this condition,
Vibration settles after occurrence, force continues to be transmitted. (Twist becomes large a little)
Transient stability
limit
Large rotary force is added
Threads twistlarge
Heavy weight is risen by transmission of force
If a few threads are cut under this condition,
Vibration becomes large after occurrence. Threads are twistedand force is not transmitted at last.
Weight is not risen.
Once twisted, threads cannot recover Step out among power systems
δ
→
→
→
δ
→
→
→
δ
→
→
δ
→→
→
Limit of phase angle
♦ Step-Out Separation Relay System (1)
3-10
-Distance Relay MethodBased on the characteristics of impedance trajectory during step-out,
a few zones are created through combination with distance relay. This method detects the sequential passing of the impedance trajectory through these zones. Detection is possible using only the local voltage and the current information.
Step-out separation
~ ~Ry
Passing the locus
Z
Detect impedance passing through
the zone
Z
ABC
Impedance Plane
♦ Step-Out Separation Relay System (2)
3-11
Control end
Fault detection
end
~
G~
G G G
~
G
G~
G
~
Flow P
Main System
Calculation end
Transmission channel
RySeparate 2
Separate 1
Separate 4
Separate 5
Ry
Separate 3
Ry
Ry
Hydro powerstations
Faultdetection
Fault detection
Ry
Faultdetection
Example of Power Shedding Relay
Freeze Telemeter information
Calculate shedding amount needed for Flow P
Select shedding locations
Release freeze
Telemeter informationof each G
Flow P information
Set shedding priority
Judge control pattern
Select shedding location up to
reaching amount needed
Shed Shed Shed Shed Shed
Shedding command
Detect fault
(a) System Configuration(b) Control Flow
In case of severe faults in power systems, some of generators are controlled quickly in the early stage, anticipating collapse of stability, or such measures as system separation will be taken so as to prevent step-out.
♦ Power Shedding Relay System
~
49

3. System Operation(Voltage Control and System Protection)
3-12
[Hz]
59.0
Power SystemStabilizing System
(BSS: Block System Stabilizer)
60.0
(Separate from other systems)
Emergency load shedding relay(Under Frequency Relay)
Frequencyseparation relay
58.0
Frequency
Other systems
Own system
Ry
Sheddingsignal
Load
♦ Frequency Control Relay System
- When supply (generation)becomes insufficient fordemand (load), frequency drops.
- When supply (generation)exceeds demand (load), frequency rises.
3-13
(BSS: Block System Stabilizer)
G G
PL1 PL2 PL3
PG
Purpose of installation : Maintenance of frequency and stabilityof power systems
Calculation of required quantity of load shedding
Selection of the loadto be shed
Selected load in advance is shed when specific fault occurs
BSS System
Cal
cula
tion
func
tion
Con
trol
func
tion
Po Power System Capacity
Control finish time: 0.5sec.
♦ Power System Stabilizing System (1)
3-14
周波数
60HzWith BSS
59Hz
58Hz Without BSS
Other Systems
Other Systems
Load60Hz
Power system is stabilized through load shedding by BSS
Load
60Hz+-
Load Generation
BSS
60HzLoad Generation
Separation from
other systems
Flow of current
Frequency
60Hz++--
Drop of frequency(Without BSS)
System collapse
Generation failure
Other systems
+-
+-
Generation
Generation
with
♦ Power System Stabilizing System (2)
3-15
~
RyOverload occurs
Detects overload
Overload control
LT
HTT1
T2
T3
Ove
rload
con
trol
This relay system detects overload current in case overload occurs in transmission lines or transformers and conducts overload control such as generator shedding or load shedding. Such an operation is carried out properly in coordination with the overload capacity of protected facilities.
♦ Overload Protection Relay System
Ry(H)
Ry(L)
3-16
3. System Operation
3-1. Fault Extension Protection Relay System3-2. Reactive Supply Equipment3-3. Voltage Operation3-4. HVDC Technology3-5. Hydropower Operation with the Developed
Support System3-6. Pumped-Storage Power Station3-7. Power System Analysis3-8. Introduction of Past Large Scale Power Outages
in KANSAI
3-17
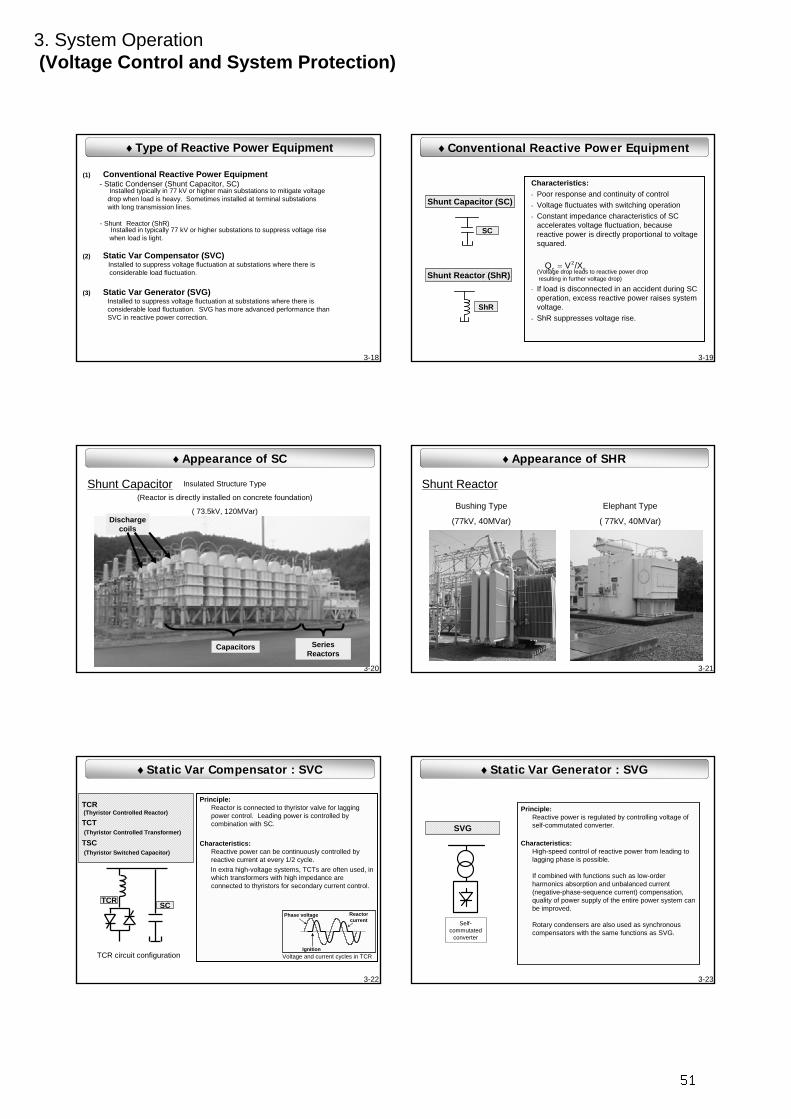
3-2. Reactive Power Equipment
♦ Type of Reactive Power Equipment
♦ Conventional Reactive Power Equipment
♦ Static Var Compensator : SVC
♦ Static Var Generator : SVG
♦ Planning of Reactive Power Equipment
50
3. System Operation(Voltage Control and System Protection)
3-18
(1) Conventional Reactive Power Equipment- Static Condenser (Shunt Capacitor, SC)
Installed typically in 77 kV or higher main substations to mitigate voltagedrop when load is heavy. Sometimes installed at terminal substationswith long transmission lines.
- Shunt Reactor (ShR) Installed in typically 77 kV or higher substations to suppress voltage risewhen load is light.
(2) Static Var Compensator (SVC) Installed to suppress voltage fluctuation at substations where there isconsiderable load fluctuation.
(3) Static Var Generator (SVG) Installed to suppress voltage fluctuation at substations where there isconsiderable load fluctuation. SVG has more advanced performance thanSVC in reactive power correction.
♦Type of Reactive Power Equipment
3-19
Characteristics:- Poor response and continuity of control- Voltage fluctuates with switching operation- Constant impedance characteristics of SC
accelerates voltage fluctuation, because reactive power is directly proportional to voltage squared.
(Voltage drop leads to reactive power dropresulting in further voltage drop)
- If load is disconnected in an accident during SC operation, excess reactive power raises system voltage.
- ShR suppresses voltage rise.
Shunt Capacitor (SC)
Shunt Reactor (ShR)
SC
ShR
♦Conventional Reactive Power Equipment
c2
c /XVQ =
3-20
Shunt Capacitor Insulated Structure Type
(Reactor is directly installed on concrete foundation)
( 73.5kV, 120MVar)
Capacitors
Discharge coils
Series Reactors
♦Appearance of SC
3-21
Elephant Type
( 77kV, 40MVar)
Bushing Type
(77kV, 40MVar)
♦Appearance of SHR
Shunt Reactor
3-22
Principle: Reactor is connected to thyristor valve for lagging power control. Leading power is controlled by combination with SC.
Characteristics: Reactive power can be continuously controlled by reactive current at every 1/2 cycle.In extra high-voltage systems, TCTs are often used, in which transformers with high impedance are connected to thyristors for secondary current control.
SCTCR
TCR(Thyristor Controlled Reactor)
TCT(Thyristor Controlled Transformer)
TSC(Thyristor Switched Capacitor)
Reactor current
Voltage and current cycles in TCR
Phase voltage
IgnitionTCR circuit configuration
♦Static Var Compensator : SVC
3-23
Principle: Reactive power is regulated by controlling voltage of self-commutated converter.
Characteristics:High-speed control of reactive power from leading to lagging phase is possible.
If combined with functions such as low-order harmonics absorption and unbalanced current (negative-phase-sequence current) compensation,quality of power supply of the entire power system can be improved.
Rotary condensers are also used as synchronous compensators with the same functions as SVG.
SVG
Self-commutated
converter
♦Static Var Generator : SVG
51

3. System Operation(Voltage Control and System Protection)
3-24
System voltage (Vs) is stabilized by synchronization ofvoltage (Vi) generated by self-commutated converter
Self-commutated converter
Power system
Transformer
DC power source
I T
VsV I
Ed +-
Basic circuit
I T VsVI
XTSystem voltage
Reactance of output transformer
Voltage generatedby self-commutated converter
Equivalent circuit
♦Operation Principle of SVG
3-25
P
PInve
rter
Pa
nel
D. Pure water system
F. Control and Protection
B. Inverter panels
A. Transformer for Converter
E. Air-Cooling system
C. Initial charger panels
Circuit Configuration
Cooling System for Pure water
DC/AC
C.
77kV Busbar
A.
B.
♦Appearance of SVG
System Layout
F.
E.
D.
C.
3-26
1. Recognition of study phase
2. Forecast of future demand
3. Basic concept of planning of reactive power equipment
4. Decision of required capacity of reactive power equipment
5. Decision of single capacity of reactive power equipment
・Static Capacitor (SC) :Analysis of feature of max. demand load curve・Shunt Reactor (ShR) : Analysis of feature of min. demand load curve
・Check actual data of active power and reactive power・Forecast of future demand
・Balance of system block
・Consideration of generators’ power factor in each block
・Consideration of voltage deviation
♦Planning of Reactive Power Equipment
3-27
0
5000
10000
15000
20000
25000
30000
35000
0
5000
10000
15000
20000
25000
30000
35000
Total demand of Kansai (MW)
spring summer autumn winterSeasons
Phase1: Summer heavy demand period (3:00PM from the end of July to the beginning of September)
Japanese spring holydays
Summer holydays
1.Recognition of study phase
Trend of daily max. Trend of daily max. demanddemand
Phase1: Study for need of Static Capacitor, system voltage tends to be low during summer heavy load period.
As of 2003
Apr. May Jun. Jul. Aug. Sep. Oct. Nov. Dec. Jan. Feb. Mar.
Phase2: Study for need of Shunt Reactor, system voltage tends tobe high during winter light load period.
Trend of daily min. Trend of daily min. demanddemand
Phase2: Winter light demand period (5:00AM on January 2, 3, and 4)
♦Planning of Reactive Power Equipment (1)
3-28
2.Forecast of future demand- Study on actual data of active power (P) and reactive power (Q)
- Demand forecast in summer heavy load periodP: future P demand is forecasted with some economical index
correlated with power demand (GDP, population, number of households, number of offices, and shipment value of commercial products)
Q: future Q is derived from correlation between past P and Q
- Demand forecast in winter light load periodP: P is derived from historical record by linear regression analysis
Q: Q is derived from correlation between past P and Q
Load data: Active and reactive power measured at secondaryside (77kV) of transformers at each primary substation(154kV, 275kV and 500kV)
♦Planning of Reactive Power Equipment (2)
3-29
3. Basic concept of planning of reactive power equipment
Balancing reactive power in each block prevents both voltage differences among substations by large reactive power flow on trunk line and severe voltage rising or drop in case trunk lines are cut off.
<Concept of Block Balance>
Reactive power must be balanced not only in whole system but in major block.
For example, there are seven blocks in main 500kV substationsin KANSAI.
Concept: Reactive power will not be handled over between blocks and adjacent utilities.
1 2 3 4
5
6
7
♦Planning of Reactive Power Equipment (3)
52

3. System Operation(Voltage Control and System Protection)
3-30
4. Decision of required capacity of reactive power equipment
Generators
Line chargeTransformer
lossForecasted demand(P + jQ)
ConsumptionGeneration
Line loss
Static Capacitor
・Summer heavy load periodequal
equal
Installation of Static Capacitoris studied.
・Winter light load period
Installation of Shunt Reactoris studied.
ConsumptionGeneration
Generators
Line chargeTransformer
loss
Line loss
Forecasted demand(P + jQ)
Shunt Reactor
♦Planning of Reactive Power Equipment (4)
Heavy
Light
3-31
5. Decision of single capacity of reactive power equipment<Regulated voltage deviation (normal condition)>
Nominal Voltage Allowance
100V
200V
101 6 V
202 20 V
Application
Light, refrigerator, cleaner, etc.
Large size air conditioner,IH cooking heater, etc.
<Allowance of voltage deviation (switching on and off of equipment)>
6.6kV
22 - 77kV
Within 10%
Within 2%
Distribution line, customer
Transmission line, distribution line, customer
Note
Electric utility law enforcement regulations
Grid-interconnection Code
Nominal Voltage AllowanceApplication Note
♦Planning of Reactive Power Equipment (5)
The single capacity of reactive power equipment is limited by acceptable voltage shock due to connection and disconnectionof the equipment.
±±
3-32
3. System Operation
3-1. Fault Extension Protection Relay System3-2. Reactive Supply Equipment3-3. Voltage Operation3-4. HVDC Technology3-5. Hydropower Operation with the Developed
Support System3-6. Pumped-Storage Power Station3-7. Power System Analysis3-8. Introduction of Past Large Scale Power Outages
in KANSAI
3-33
3-3. Voltage Operation
♦ Voltage Standard in Japan
♦ Typical Operation of System Voltage
♦ Basic Characteristics Regarding Voltage Stability
♦ P-V(Nose) Curve
♦ Case Study of Black Out Caused by Voltage Instability
3-34
Voltage classat customers Reference voltage Voltage variation
range
100V 101V 101 6V
200V 202V 202 20V
Regulation in Japan
+-
+-
♦ Voltage Standard in Japan
Higher voltage systems are operated properly to maintain voltage within the regulated variation range.
3-35
Control of exciting current for
maintenance of constant voltage
with AVR
Change of turns ratio with on-load
tap changer
Switchingof reactive supply
equipment
ShR SC
TrAVR
♦ Typical Operation of System Voltage
Voltage
High
Low
-Turn on SC or Turn off ShR- Increase on-load tap - Increase exciting current ofgenerators
-Turn on ShR or Turn off SC- Reduce on-load tap- Reduce exciting current of
generators
AVR: Automatic Voltage RegulatorShR: Shunt ReactorSC: Shunt Capacitor
UP
DOWN
53

3. System Operation(Voltage Control and System Protection)
3-36
j X P + j Q
Vs Vr
j Y
P = (Vs Vr) / X sinQ = (Vs Vr) / X cos – (1 / X-Y) Vr2
Active power and reactive power (P and Q) supplied to the load, can be expressed as follows:
This formula is used in discussion of steady-state and transient stabilities
Delete since sin2 +cos2 = 1
P2+(Q+(1 / X-Y) Vr2)2 = (Vs Vr / X)2
For simplification, let = Q / P
Solve these 2 equations for Vr (to consider voltage stability)
♦ Basic Characteristic RegardingVoltage Stability
..
.
.
. .α
(Vs2 / X2 - 2P(1 / X - Y) (Vs4 / X4- 4P(1 / X - Y) Vs2 / X2 - 4P2(1 / X-Y)2)
2(1 / X - Y)2Vr = .α ± α
θ θ θ
θθ
3-37
The above equation expresses change of receiving voltage (Vr) in response to change in demand (P, Q). When power factor is constant,Vr is plotted against P as follows:
Vr
P
Limit voltagefor stable transmission
Maximum transmission capacity(Limit power for stable transmission)
Stable domain
Unstable domain
♦ P-V(Nose) Curve (1)
(Vs2 / X2 - 2P(1 / X - Y) (Vs4 / X4- 4P(1 / X - Y) Vs2 / X2 - 4P2(1 / X-Y)2)
2(1 / X - Y)2Vr = .α ± α
3-38
Vr
P
●
In case a double circuit line is reduced to a single circuit after the fault. With double circuit line, system is
operated at the intersection of Nose curve and load voltage characteristics.
●
With single circuit line, the intersection is in the unstable domain.
P-V curve of load with constant impedance characteristics
When one of the two circuits trips in high voltage transmission lines with heavy power flow, voltage may reach the unstable domain and eventually collapse.
Maximum transmission capacity (Single circuit line)
Maximum transmission capacity (Double circuit line)
♦ P-V(Nose) Curve (2)
Stable domain
Unstable domain
3-39
Vr
P
Increasing load( P-V curves of load with
constant impedance characteristics )
●
Transmission capacity decreasesdue to lowered power factor
caused by increased load
Before sharp rise of load, SC must be turned on in advance to increase transmission capacity.
Increase of load withoutSC control
Vr
P
SC turned on
If SC is turned onin advance…
The flow to maintain voltage is as follows:SC turned on → load increase → SC turned on → load increase
Intersection comes closer to unstable domain.
♦ P-V(Nose) Curve (3)
3-40
Time & Date: 1:19 pm on July 23, 1987
Location:Tokyo
Details: Interrupted power: 8,179 MW Recovered at 4:40 pm (Duration: 3 hrs. 21 min.)
1. Load increased at industrial demand peak at around 1pm combined with rising of temperature
2. SC turned on to sustain voltage
3. Impossible to follow the demand; voltage dropped
4. Large-scale outage by operating of distance relay
♦Case Study of Black OutCaused by Voltage Instability (1)
Total demand
(MW)
30,900
39,300
36,500
Time
1. Sharp load rises2. SC turns on Hit voltage limit for
stable transmission
12 am 1 pm
400MW/m
3. Voltage collapses4. Distance relay
operates
3-41
Vr
How voltage was collapsed due to delayed switching of SC
P
Load increase → SC turn on→ load increase → SC turn on to
maintain voltage
Operation point moves down into unstable domain, leading to voltage collapse
Operation point shifts with demand increase
♦Case Study of Black OutCaused by Voltage Instability (2)
54

3. System Operation(Voltage Control and System Protection)
3-42
3-4. HVDC Technology
♦ Outline of HVDC- Advantage of HVDC- Outline of HVDC System Diagram- Outline of Converter Station
♦ Kii Channel HVDC
♦ Developed HDVC Control Method- DC Continuous Operation Control - Power Modulation
3-43
3. System Operation
3-1. Fault Extension Protection Relay System3-2. Reactive Supply Equipment3-3. Voltage Operation3-4. HVDC Technology3-5. Hydropower Operation with the Developed
Support System3-6. Pumped-Storage Power Station3-7. Power System Analysis3-8. Introduction of Past Large Scale Power Outages
in KANSAI
3-44
ACAC DCDC
EvaluationEvaluation PoorPoorCostCost PoorPoor
PoorPoorPoorPoor GoodGood
OutlineOutline
13 Lines 4 Lines
Environment
Operation ((controllablecontrollable))
((less cablesless cables))
((advantageadvantage))
GoodGoodGoodGood
GoodGood
♦ Advantage of HVDC
3-45
AC System
Pole Line
Return Line
Yura SW/SKihoku
Converter Station
Submarine Cable
Overhead Line
Smoothing Reactors
DC GIS DC Filters
Shunt Capacitors
Converter Transformers
ThyristorValves
AC Filters
Return Line
Pole Line
Future stage
♦ Outline of HVDC System Diagram
AnanConverter Station
3-46
AC YardAC Yard
380m
320m
BirdBird’’s eye view of s eye view of KihokuKihoku Converter StationConverter Station
AC FilterAC Filter
Control OfficeControl Office
Valve HallValve HallEntrance GateEntrance Gate
Smoothing ReactorSmoothing Reactor
DC YardDC Yard
Shunt CapacitorShunt Capacitor
Valve Cooling TowerValve Cooling Tower
Reservoir for Reservoir for cooling cooling waterwater
♦ Outline of Converter Station
3-47
60Hz
50Hz
KyushuShikoku
Kansai Chubu
TokyoHokuriku
Hokkaido
Tohoku
:HVDC:FC:BTB
Kii Channel HVDC Link
Hokkaido-HonshuHVDC Link
600MW
Higashishimizu FC 300MW
Shinshinano FC 600MW
Sakuma FC 300MW
MinamifukumitsuBTB
300MW
1400MW
6-ProjectSum:3500MW
Chugoku
HVDC in JapanHVDC in Japan
♦ HVDC in Japan
55
3. System Operation(Voltage Control and System Protection)
3-48
Tsuruga
ReinanMihama
OhiTakahama
Okutataragi
Ohkawachi
Higashi-okayama
Seiban
Hoku-setsu
InagawaNishi-kyoto
Shin-ikoma
Shin-ayabe
KeihokuHigashi-Ohmi
Minami-Kyoto
Higashi-yamato
Oku-yoshino
Shigi
KinokawaTachibana Bay
AwaGobo
KihokuKihoku
Anan
Yura
Sanuki
NotePower Station
Substation
Switching Station
Converter Station
500kV Overhead transmission Line
500kV Underground Transmission Line
DC250kV Overhead Transmission Line(designed for 500kV)
DC250kV Submarine Cable(designed for 500kV)
Kii Channel HVDC Link
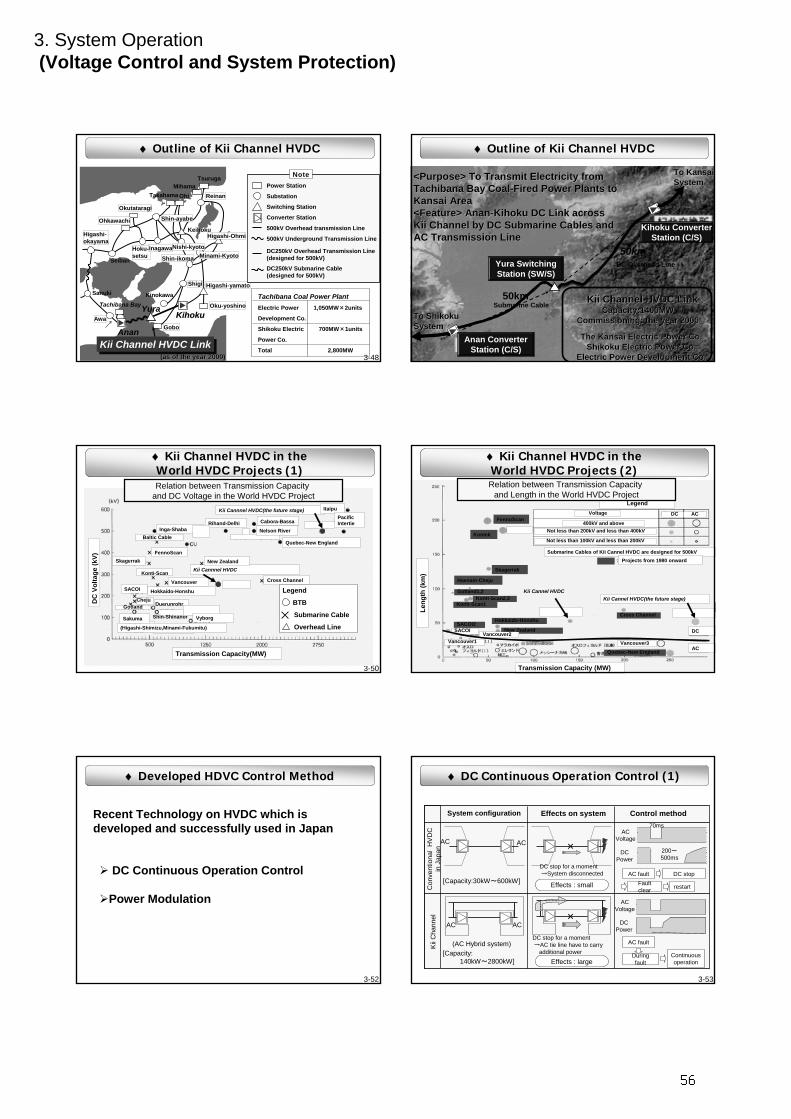
Tachibana Coal Power PlantElectric Power 1,050MW×2units
Development Co.
Shikoku Electric 700MW×1units
Power Co.
Total 2,800MW(as of the year 2000)(as of the year 2000)
♦ Outline of Kii Channel HVDC
3-49
Yura SwitchingStation (SW/S)
Anan ConverterStation (C/S)
Kihoku ConverterStation (C/S)
50km
50km
<Purpose> To Transmit Electricity from <Purpose> To Transmit Electricity from Tachibana Bay CoalTachibana Bay Coal--Fired Power Plants toFired Power Plants toKansai AreaKansai Area<Feature> Anan<Feature> Anan--KihokuKihoku DC Link DC Link acrossacrossKiiKii ChannelChannel by DC Submarine Cables andby DC Submarine Cables andAC Transmission LineAC Transmission Line
KiiKii Channel HVDC LinkChannel HVDC LinkCapacity:1400MWCapacity:1400MW
Commissioning: the year 2000Commissioning: the year 2000
The Kansai Electric Power Co.The Kansai Electric Power Co.Shikoku Electric Power Co.Shikoku Electric Power Co.
Electric Power Development Co. Electric Power Development Co.
To KansaiTo KansaiSystemSystem
To ShikokuTo ShikokuSystemSystem
Submarine Cable
DC Overhead Line
♦ Outline of Kii Channel HVDC
3-50
Kii Cannnel HVDC(the future stage)
Kii Cannnel HVDC
Transmission Capacity(MW)
DC
Vol
tage
(kV)
Inga-ShabaRihand-Delhi Cabora-Bassa
Quebec-New England
Nelson River
ItaipuPacific Intertie
Baltic Cable
FennoScanSkagerrak
Konti-Scan
Vancouver
Hokkaido-HonshuSACOI
ChejuGotland
Shin-Shinanor Vyborg
Cross Channel
Legend
BTB
Submarine Cable
Overhead Line
New Zealand
Sakuma
(Higashi-Shimizu,Minami-Fukumitu)
Duerunrohr
×
♦ Kii Channel HVDC in the World HVDC Projects (1)Relation between Transmission Capacity
and DC Voltage in the World HVDC Project
3-51
紀 伊 水 道 Ⅰ 紀 伊 水 道 Ⅱ
Not less than 200kV and less than 400kV
Not less than 100kV and less than 200kV
400kV and above
LegendVoltage DC AC
Kii Cannel HVDC(the future stage)Kii Cannel HVDC
Transmission Capacity (MW)
Leng
th (k
m)
Submarine Cables of Kii Cannel HVDC are designed for 500kVProjects from 1980 onward
DC
AC
Baltic
FennoScan
Kontek
Skagerrak
Haenam-Cheju
Gotland1,2Konti-Scan2,3
Konti-Scan1
Hokkaido-HonshuSACOI2
Cross Channel
New Zealand
Quebec-New England
Vancouver3
Vancouver2SACOI
Vancouver1
Relation between Transmission Capacity and Length in the World HVDC Project
♦ Kii Channel HVDC in the World HVDC Projects (2)
3-52
DC Continuous Operation Control
Power Modulation
♦ Developed HDVC Control Method
Recent Technology on HVDC which is developed and successfully used in Japan
3-53
Con
vent
iona
l H
VD
Cin
Jap
anK
iiC
hann
el
System configuration Effects on system Control method
(AC Hybrid system)
AC
[Capacity:30kW~600kW]
×
DC stop for a moment→System disconnected
Effects : small
×
DC stop for a moment→AC tie line have to carry
additional power
Effects : large
70msAC
Voltage
DC Power
200~500ms
AC fault DC stopFault clear restart
AC fault
During fault
Continuous operation
AC
AC AC
[Capacity:140kW~2800kW]
AC Voltage
DC Power
♦ DC Continuous Operation Control (1)
56

3. System Operation(Voltage Control and System Protection)
3-54
Simulation waveform
AC voltage(Vac)
Delay angle(α)
DC voltage
(Vd)
DC current
(Id)
DC power(Pdc)
Controller
~
~
Awa
1050kWGD1
Anan KihokuPole 1
Pole 2
1400kW
APSA
T M
H
Vd
Id
Minami-Kyoto
Higashi-Yamato
Vac = 0pu
1cct 1LG - (4cycle) - 1LO
Phase A
100ms
1PU
1PU
1PU
90 degree
~
Pole
2Phase B
Phase C
DC system power was recovered to 90% of the
rated value in about 100ms after the fault clearing.
♦ DC Continuous Operation Control (2)
3-55
Power Modulation damps power oscillation and keeps the stability in case transmission lines fault and generators trip.
Image of Power Modulation
Control DC poweras damper
Damp poweroscillation
Seesaw : Power Oscillation in Inter-Area between Kansai and Chugoku ( 3sec. Cycle )
Spring : Power Oscillation in Shikoku Local Area ( 2sec. Cycle )
Chugoku Kyushu
KansaiChubu
Shikoku
Higashi-Okayama Minami-Kyoto
KihokuSeesaw
Anan
Spring
Damper(DC Transmission Line)
♦ Power Modulation (1)Power Modulation (1)
3-56
KyushuShikoku
KansaiKansai ChubuChubu
Chugoku
DC Operation Power Before: 1400MWPM Operation:1519 - 1341MW
Seiban-Okayama
Disturbance
1400 MW for KansaiEPDC Tachibana-bay Power Plant 1G Trip(Before 1G: 1050MW, 2G: 944MW, S: 700MW)
600
1000
1400
1800
2200
2600
-2 0 2 4 6 8 10 12
Seiban-Okayama Line
DC Power
Time [sec]
Pow
er F
low
[MW
]
Opposite
Operation of Power Modulation
♦ Power Modulation (2)Power Modulation (2)
PM is damping power oscillation in SeibanOkayama line effectively.
| △Fa - △Fk | ≧ 0.04 Hz( Timer 0.65 sec. )
PM Start| Fa - Fk | 0.04 Hz(Timer 0.65 sec.)
PM Start| △Fa - △Fk | ≦ 0.02 Hz( Timer 3 sec.)
PM Stop| Fa - Fk | 0.02 Hz( Timer 3 sec. )
PM Stop≥ ≤
3-57
3. System Operation
3-1. Fault Extension Protection Relay System3-2. Reactive Supply Equipment3-3. Voltage Operation3-4. HVDC Technology3-5. Hydropower Operation with the Developed
Support System3-6. Pumped-Storage Power Station3-7. Power System Analysis3-8. Introduction of Past Large Scale Power Outages
in KANSAI
3-58
3-5. Hydropower Operations withthe Developed Support System
♦ Hydropower Generation and Operationin Japan
♦ Optimal Hydropower Operation with theDeveloped Support System
♦ Summary
3-59
Purpose: To Optimize 1) Annual operation of big reservoir
2) Daily and/or weekly operation of power plants with regulating pondage
under constraints of hydro power plants complex developed in cascade.
♦What is Developed Support System forOptimal Hydropower Operation?
57

3. System Operation(Voltage Control and System Protection)
3-60
rainfallsnow
Generation of Hydro power plants (HPPs) in cascade is closely influenced each other, thus it is very complicated to find out optimal operational plan.
Necessity to develop tools for optimal planning!
Reservoir *1
Regulating pondage *2 Hydropower plant
*1: Storage pondage with large capacity enough to control yearly/seasonal inflow/outflow operation
♦ Hydro Power Plants in Cascade
*2: Storage pondage with relatively small capacity which can control weekly/daily inflow/outflow operation 3-61
0(km)
5 15 2010 25
Kiso River
Otaki River
Downstream
Development scale:2 reservoirs
12 regulatingpondages
32 HPPs(60 Gen units.)
Makio Dam
♦ Location of HPPs in Kiso River System
3-62
Kiso River
Otaki RiverKiso River system is one of the best practices in consistent with the development of whole river system.
♦ Vertical Profile of Kiso River
3-63
Hokuriku
KANSAI
TEPCO1,816MW
Hokkaido826MW
Tohoku1,953MW
2,185MW
Chubu1,860MW
3,266MWShikoku457MW
Kyusyu1,228MW
Cyugoku771MW
Total rated capacity of HPPRun-of river type, reservoir type, and pondage type(Excluding pumped-storage type)
No. 1
Source: 108th ELECTRIC POWER DEMAND AND SUPPLY REPORTissued by JAPAN ELECTRIC POWER SURVEY COMMITTEE
Kiso River(Kansai)
Tone River(TEPCO)
Comparison of the largest river basins in Kansai and TEPCO
No. 2
1,047 1,006Rated capacity(MW)
11 46Run-off river type
21 8Reservoir typePondage type
32 54Total
Num
ber o
f HPP
- Operation of reservoir/pondage type HPPs requires sophisticated skills.
- The more HPPs, the more difficult operation.
♦ Hydro Power in Japan
3-64
(MW)(MW)
0 20 2 44 66 88 10 12 14 16 18 20 22 2410 12 14 16 18 20 22 244 5 6 7 8 9 10 11 12 1 2 34 5 6 7 8 9 10 11 12 1 2 3
30,00030,000
25,00025,000
20,00020,000
15,00015,000
10,00010,000
5,0005,000
00
Yearly load curve
Maximum
Peak demand in summer
Maximum
Peak demand of a day
Daily load curve
Maximum
Nuclear
Hydro
Purchase
Thermal
Pump
Peak demand in winter
♦ Utilization of Hydro Power in Generation
3-65
Tool: Reservoir Operation Support System(ROS)
Tool: Hydropower Scheduling Support System(HSS)
Reservoir
Regulatingpondage
Content: Annual discharge plan Objective: To maximize
- reduction of generation cost, or- total power generation (kWh)
Content: Daily operation plan of each HPPObjective: To maximize
- reduction of generation cost
GG
GG
GG
GG
Reservoir operation
Con
sist
ent o
pera
tion
thro
ugho
ut a
rive
r bas
in
Regulating pondage operation
♦ River System Operation
* Reduction of generation cost
58

3. System Operation(Voltage Control and System Protection)
3-66First year Second year Third year
Multi-year (up to 3-year) planning is also available.
Most probable incoming water volume is calculated based on records for the past 30 years.
: Planned water level: Planned incoming volumeHigh-water case
Low-water case
Probable range of water level
Annual operation of reservoir is calculated to maximize the reduction of generation costof the year.
Wat
er L
evel
Apr. May Jun. Jul. Aug. Sep. Oct. Nov. Dec. Jan. Feb. Mar.
♦ Optimal Reservoir Discharge Plan with ROS
3-67
Pow
er g
ener
atio
n
Reduction of generation cost on the day was about 4%.
0
200
400
600
800
1,000
1 2 3 4 5 6 7 8 9 10 11 12 13 14 15 16 17 18 19 20 21 22 23 240
1
2
3
4[MWh]
: Possible generation by newly-developed HSS: Possible generation by previous support system: Incremental fuel cost [Cent/kWh]
Incr
emen
tal f
uel c
ost p
er k
Wh
Less generationduring off-peak hours
Less generationduring off-peak hours
More generationduring on-peak hours
♦ Optimal Hydropower Operation with HSS
3-68Note: Actual effect depends on each river condition.
HSSHydropowerScheduling
SupportSystem
Workinghours
Algorithm
2 hours 1.5 hours
- Reduction of generation cost by 1.6% on average, which corresponds to2.8 million USD per yearNonlinear programming
(Reduced gradient method)Linear programming
(Network flow method)
ROSReservoirOperationSupportSystem
Workinghours
Algorithm
More than 1 week 1 day
- Reduction of generation cost by 1.9% on average, which corresponds to 2.3 million USD per year
- Substantial reduction of working hours required
Hand calculation based on experience Dynamic programming
Previous work/system Newly-developed system Effect of installationin KANSAI
♦ Evaluation of Effects of ROS and HSS
3-69
♦ Summary
♦Tools (ROS and HSS) for optimal planning of HPPswere developed to fully utilize hydro potential in a consistently developed river basin.
♦ Efficient and reliable hydropower operation is available with the use of developed ROS and HSS, which leads to maximization of reduction of generation cost or total power generation.
3-70
3. System Operation
3-1. Fault Extension Protection Relay System3-2. Reactive Supply Equipment3-3. Voltage Operation3-4. HVDC Technology3-5. Hydropower Operation with the Developed
Support System3-6. Pumped-Storage Power Station3-7. Power System Analysis3-8. Introduction of Past Large Scale Power Outages
in KANSAI
3-71
3-6. Pumped-Storage Power Station
♦ Introduction
♦ General Pumped-Storage Power Station
♦ Adjustable Speed Pumped-Storage Generation System
59

3. System Operation(Voltage Control and System Protection)
3-72
♦ Locations of Power Stations in KANSAI
CHUBU
SHIKOKU
CHUGOKU
HOKURIKU
Biwa Lake
Wakasa Bay Sho riv
Jintsuu riv
Kurobe riv
Kiso riv
Thermal power
Nuclear power
InstallationPowerStations
Total number ofpower stations
12
3
4
Numberof stations
163
16,907MW
9,768MW
4,884MW
Authorized output
34,861MW
3,302MWConventional hydro power
38
11
18
Number of generators
293
226144Pumped storage
hydro power
3-73
generators
Pumped–
storage
Thermal
Hydro
Nuclear
Features
FuelCost
Loadfollowing
Use low-priced power at nighttime
30%loss
Limited by timesor hour of startand stop
Influenced by a natural phenomenon
Constant powergeneration
Large
Small
0
Note
Dem
and
Hours 240
Nuclear power generation
Hydro power generation
Thermal powergeneration
Pumpedwater
Pumped–storage generation
Purchases and Interchanges
Purchasesand
InterchangesSmall
Constituted by nuclear, thermal, and hydro
♦ Features of Generators
Good
poor
Verypoor
Very Good
Good
3-74
Dem
and
Hours 240
Nuclear power generation
Hydro power generation
Thermal powergenerationPumped
water
Pumped–storage generation
Purchases and Interchanges
It is more advantageous togenerate power with pumpedwater using inexpensive power sources at midnight, rather than operating expensive oil thermal power plants at peak time.
[Unit cost of pumped hydro power]= [Unit cost of Pumping] / 0.7
♦ Outline of General Pumped-StoragePower Station
3-75
Measure forDemand
and supplycontrol
Measure forsupply
capability
Measure forfrequency
fluctuation and load following
Measure forfaults
Measure forSurplus power
Used as peak supply source tocope with peak demand.(Power generation)
Used as a supplementary measure to regulate frequency and cope with load following.(Power generation and pumping)
Used as emergency supply sourcein case of tripping of generators.(Power generation)
Used to absorb surplus power during light load condition at midnight due to increase of power sources with fixed output.(Pumping)
♦ Roles of Pumped-Storage Power Station (1)
3-76
Economic measure
System reliability
Voltage control
Cost reduction by the operation of pumped storage power plants instead of short-time operation of expensive peak thermal power units(Power generation and pumping)
Used to reduce the amount of load shedding in case of power source tripping.(Power generation and pumping)
Used to control power flow at the time of switching in power system.(Power generation and pumping)
Others Power flow control
Used to absorb reactive power through pumping operation in case of system voltage increase at midnight.(Pumping)
♦ Roles of Pumped-Storage Power Station (2)
3-77
12 18 24 Hours
Gen
erat
ion
/E
lect
ricity
con
sum
ptio
n
60
Variation ofgeneration Minute change
in every moment
Surplus power used by pumpedstorage power
plants
Variation ofElectricity consumption
Balance between Demand and Supply
♦ Roles of Adjustable SpeedPumped-Storage Generating System (1)
It is important to maintain the balance between generators and electricity consumption at all times.
Adjustable speed pumped-storage generation system can control pumping power (cf. conventional system cannot) and can control generationwidely by changing the rotation speed of the motor/generator.
60

3. System Operation(Voltage Control and System Protection)
3-78
60HzFrequency
- +
ElectricityConsumption Generation
- Hydro power plants- Thermal power plants- Nuclear power plants- Pumped storage
power plants (Generation in thedaytime)
- Buildings- Factories- Homes- Pumped storage
power plants(Pumping in the nighttime)
Adjustable speed pumped-storage generating system makes it possible to increase or decrease generationas electricity consumption increases or decreases.
Daytime frequency control
Adjustable speed pumped-storage generating system makes it possible to decrease or increase the pumping power as electricity consumption increases or decreases. Conventional pumped-storage plants cannot change the pumping power.
Nighttime frequency control
♦ Roles of Adjustable SpeedPumped-Storage Generating System (2)
3-79
Generation ElectricityConsumption
Pumped-Storage Coal
Adjustable outputof pump power
Constant(Not adjustable)
output ofpump power
Image ofcontrol
at midnight
♦ Effects of Adjustable SpeedPumped-Storage Generating System
Pumped-Storage
Generation ElectricityConsumption
CoalOil
Adjustment bythermal power
plants
Conventional pumped-storage generation system
- Decrease of the amount of pumping (pumping losses)- Increase of output rate of thermal power plants
Effects
Constant highoutput rate
Adjustable speed pumped-storage generation system
3-80
Pump-Turbine
Generator/Motor
Rectifier
Stator
DC
Generator/Motor
Rotor
Cycloconverter
ACRotor
Stator
Pump-Turbine
CircuitBreaker Circuit
Breaker
-5 to +5Hz
Adjustable Speed PlantConventional Plant
DC current issupplied to therotor, androtation speed is not adjustable
AC current withvariable frequency issupplied to therotor, androtation speed isadjustable
♦ Mechanism of Adjustable SpeedPumped-Storage Generating System
3-81
Rotor
StatorPump-Turbine
CircuitBreaker
Gen
erat
ion
Pum
ping
Generation
Pumping Changing of rotation speed
UpperReservoir
Conventionalplants
Adjustable speedplants
Valve operation
Valve operation& Changing of rotation speed
Operatingmethod
LimitedControl range
WideControl range
Generatingmode
Lower Reservoir
- More power losses- Power is uncontrollable
- Less power losses - Power is controllable
Pumpingmode
♦ Operating Method of Adjustable Speed Pumped-Storage Generating System
Valve operation(opening or closing)
3-82
3. System Operation
3-1. Fault Extension Protection Relay System3-2. Reactive Supply Equipment3-3. Voltage Operation3-4. HVDC Technology3-5. Hydropower Operation with the Developed
Support System3-6. Pumped-Storage Power Station3-7. Power System Analysis3-8. Introduction of Past Large Scale Power Outages
in KANSAI
3-83
3-7. Power System Analysis
♦ Stability Classifications
♦ Concept of Steady-State Stability
♦ Concept of Transient Stability
♦ Power System Analysis Methods
♦ Measurement Method of Characteristics of Generator and Excitation System
61

3. System Operation(Voltage Control and System Protection)
3-84
Concept figure
Intermediate-scale disturbance which includes the following cases: oscillation is not damped or is amplified during transient period; transmission line is opened or closed; power source or load is cut off from the system.
Transient period
Inter-mediate period
From occurrence of system disturbance to the first wave(lasting about 1 second)
Time period (after transient period) during which the system continues to be disturbed for a few (2 to about 15) cycles of disturbance.(lasting from 2 to about 15 seconds)
Time period longer than intermediate period
Back-up protection relay operates because of failure of main protection relay after fault occurrence (e.g. ground / short circuits)
Particular instability mode that potentially exists in each power system
Time range classification
Time range afteroccurrence of disturbance
TimePhas
e an
gle
Transient stability
Steady-state stability
Steady-state
period
Causes of disturbance
Phas
e an
gle
Pha
se a
ngle
♦Stability Classifications
Time
Time
θ
θ
θ
3-85
Power (P = Er x I x cos ) is:
IX x cos = a x b, a x b = Es x sin
jXI ErEs
Power system model
I
b
a
IX
Er
Es
Vectors of Es, Er and I
- Es is sending voltage
- Er is receiving voltage
- Z jX is line impedance
- I is current
- is phase angle
I x cos = a x bX = Es x sin
X
P = Er x I x cosx =Es x Er
Xsin
IX x cos = a x b = Es x sin
♦Concept of Steady-State Stability (1)
≈
θ
θ
θ
θ
θ
θ
Internal phase angle of generator is neglected
δδ
δ
δδ
δ
3-86
- The greater the generator output,the greater until reaches 90 degrees.
- After is greater than 90 degrees, generator output drops.
- The generator is accelerated as θgets bigger
- Magnetic coupling between the armature and rotor breaks and eventually causes step-out.
Transmission capacity (P)
Normal condition
”Steady-state stability” is the degree of stable operation of the generators in steady state. The maximum transmission capacity in this state is expressed as the “Steady-state power limit”
Power limit
Step-out
Power transmission is impossible
Power curve against phase angle
♦Concept of Steady-State Stability (2)
θ θ
θ
1
2
3
1 2
2 3
Es x ErX
3 0 90 180Phase angle
(degrees)θ
sin θ
3-87
“Transient Stability” is the degree of power system stability in case of
sudden and major disturbances which include the following cases:
Transient stability can be explained
with Equal area method, where fault
occurs at point F in a parallel double
circuit transmission line.
Generator
P
F
a. System fault and subsequent protection relay operations;
b. Large-scale generator tripping or load sheddig, sudden changes in
impedance due to changes of system configuration with CB operation.
♦Concept of Transient Stability (1)
3-88
Power transmission when fault occursin double circuit transmission lines
90° 180°
P (a) Transmission with double circuits before fault
P
180°
P 3φG(b) During fault
180°
P(c) Transmission with
single circuit after fault removal
Expressed in P- Curves
♦Concept of Transient Stability (2)θ
0 90 180
Phase angle (degrees)
1.
Curve 0 (before fault)
Curve 2 (after fault removal)
Curve 1 (during fault)
2.3.
4.
5. 6.
7.
0 1 2
8.9.
A
B
Stability maintained
0 90 180
1.
2.
3.
4.
5.
9.
A
B
Step-out
At transient stability limit
P
P
P0
P0
θ
θ θ θ
0θ 3θ 4θ
θ0θ
0θ 1θ
1θ2θ3θ
0θ
A < B
A = B
A > B
3-89
Voltage stabilityPower disturbance
(stability)
Sub-synchronous resonance (SSR)
Higher harmonicSurge
(lightning, switching)
10-4 110-110-210-3 10210
Sys
tem
ph
enom
ena
Time (sec.)
100
10
1
1000
Stability domain
Effective value analysis
Normal state domain
Instantaneousvalue analysis
APSA
RTDSEMTP
Y-method
PSS/E
Over-voltage and over-current domain (instantaneous values)
Sys
tem
sca
le (n
umbe
r of g
ener
ator
s)
Depending on system control, protection and phenomena to be analyzed, appropriate time domain and system scale must be chosen to determine the right analysis method accordingly.
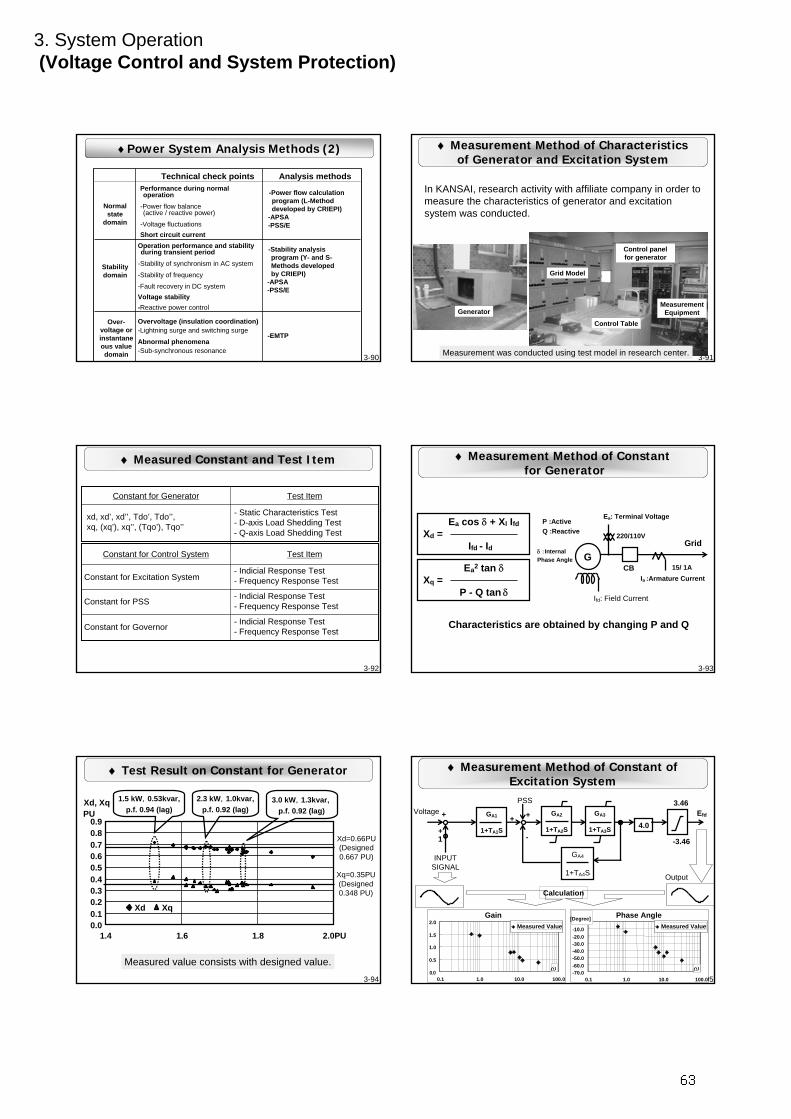
♦Power System Analysis Methods (1)
62
3. System Operation(Voltage Control and System Protection)
3-90
Technical check points Analysis methodsPerformance during normal operation
-Power flow balance (active / reactive power)
-Voltage fluctuationsShort circuit current
-Power flow calculation program (L-Method developed by CRIEPI)
-APSA-PSS/E
Normal state
domain
Stability domain
Over-voltage or instantaneous value domain
Overvoltage (insulation coordination)-Lightning surge and switching surge
Abnormal phenomena-Sub-synchronous resonance
Operation performance and stability during transient period
-Stability of synchronism in AC system
-Stability of frequency
-Fault recovery in DC systemVoltage stability-Reactive power control
-Stability analysis program (Y- and S-Methods developedby CRIEPI)
-APSA-PSS/E
-EMTP
♦Power System Analysis Methods (2)
3-91
In KANSAI, research activity with affiliate company in order to measure the characteristics of generator and excitation system was conducted.
Control Table
MeasurementEquipment
Grid Model
Control panelfor generator
Generator
Measurement was conducted using test model in research center.
♦ Measurement Method of Characteristicsof Generator and Excitation System
3-92
♦ Measured Constant and Test Item
- Static Characteristics Test- D-axis Load Shedding Test- Q-axis Load Shedding Test
xd, xd’, xd’’, Tdo’, Tdo’’, xq, (xq’), xq’’, (Tqo’), Tqo’’
Test ItemConstant for Generator
Constant for Governor
Constant for PSS
- Indicial Response Test- Frequency Response TestConstant for Excitation System
Test ItemConstant for Control System
- Indicial Response Test- Frequency Response Test
- Indicial Response Test- Frequency Response Test
3-93
♦ Measurement Method of Constantfor Generator
Ea cos δ + Xl Ifd
Ifd - IdXd =
Ea2 tan δ
P - Q tan δXq =
P :ActiveQ :Reactive
GGrid
Ea: Terminal Voltage
Ia :Armature Current
Ifd: Field Current
220/110V
15/ 1ACB
δ :Internal Phase Angle
Characteristics are obtained by changing P and Q
3-94
♦ Test Result on Constant for Generator
0.00.10.20.30.40.50.60.70.80.9
1.4 1.6 1.8 2.0PU
Xd Xq
Xd, XqPU
Xq=0.35PU(Designed0.348 PU)
Xd=0.66PU(Designed0.667 PU)
3.0 kW,1.3kvar, p.f. 0.92 (lag)
1.5 kW,0.53kvar,p.f. 0.94 (lag)
2.3 kW,1.0kvar,p.f. 0.92 (lag)
Measured value consists with designed value.3-95
♦ Measurement Method of Constant ofExcitation System
GA1
1+TA1S
Voltage
INPUTSIGNAL
GA3
1+TA3S4.0
3.46
-3.46
Efd
-+
+ + +
PSS
1
GA2
1+TA2S
Calculation
Output
GA4
1+TA4S
Gain
0.0
0.5
1.0
1.5
2.0
0.1 1.0 10.0 100.0
Phase Angle
-70.0-60.0-50.0-40.0-30.0-20.0-10.0
0.0
0.1 1.0 10.0 100.0
[Degree]Measured ValueMeasured Value
ω ω
63

3. System Operation(Voltage Control and System Protection)
3-96
♦ Test Result on Constant ofExcitation System
1.5
1.5
GA2 GA3
0.2
0
TA1
1
1
GA1
0.050.20.020.1Designed
0.10.10.0010.1Approximation
TA4GA4TA3TA2
Measured value consists with designed value.
Gain
0.0
0.5
1.0
1.5
2.0
0.1 1.0 10.0 100.0-70.0-60.0-50.0-40.0-30.0-20.0-10.0
0.0
0.1 1.0 10.0 100.0
[Degree]Gain MeasuredApproximation
MeasuredApproximation
Phase Angle
ω ω
3-97
♦ Summary
For system analysis, characteristics of generator and excitation system in accordance with actual performance shall be used.
In KANSAI, measurement method on characteristics of generator and excitation system was researched and developed.
With the measurement method, characteristics of generator and excitation system where constants are unknown can be identified and used for system analysis.
3-98
3. System Operation
3-1. Fault Extension Protection Relay System3-2. Reactive Supply Equipment3-3. Voltage Operation3-4. HVDC Technology3-5. Hydropower Operation with the Developed
Support System3-6. Pumped-Storage Power Station3-7. Power System Analysis3-8. Introduction of Past Large Scale Power Outages
in KANSAI
3-99
3-8. Introduction of Past Large ScalePower Outages in KANSAI
♦ Past Large Scale Power Outages in KANSAI
♦ Miboro Power Plant Accident Case
♦ Great Hanshin-Awaji Earthquake Case
♦ Large Power Plant Trunk Lines Accident Case
3-100
MiboroPower Plant
Accident(June 22, 1965)
GreatHanshin-Awaji
Earthquake(January 17, 1995)
InterruptedDemand (MW)
(A)2,940 2,840
System*Capacity (MW)
(C)4,100 12,700
72% 22%
Duration(B) 3hrs. 4min. 153hrs. 17min.
Large PowerPlant Trunk
Lines Accident(December 22, 2005)
1,890
39min.
25,300
7.5%
♦Past Large Scale Power Outages in KANSAI
* at the time of outage
(A)
(C)100×
3-101
Height:125m
Steel tower was hit by a rockwith several tons !!
MiboroMiboro DamDam
♦Miboro Power Plant Accident Case (1)
Time & Date:- 8:16 am on June 22, 1965Location:- Miboro Hydro Power PlantDetails: - Entire extra-high voltagesystem tripped (2,940 MW)(70 % of power demand supplied by Kansai)
64

3. System Operation(Voltage Control and System Protection)
3-102
Maruyama TL
Minami-Osaka
HirakataItamiHimeji No.2
Himeji(Chugoku EPCo)
Seki
(Chubu EPCo)Maruyama
(Hokuriku EPCo)
Miboro
Aimoto
Ikehara
Jouhana
(in MW)
Dai-Kurobe TL
Central demand area of Kansai EPCo
Shin-Hokuriku TL
220350
250
370
410
System capacity: 4,100 MW
Lake Biwa
Sequence of Events (1)
1. Accident1. Accident
At fault
Kita-Osaka
Higashi-Osaka
3 trunk lines in loop operation
♦Miboro Power Plant Accident Case (2)
1. Accident occurred
3-103
2222
33
22
Torsion increasesas more power flows
(Chugoku EPCo)
(Hokuriku EPCo)
AimotoJouhana
Miboro
Dai-Kurobe TL
Shin-Hokuriku TL
Maruyama TLHigashi-OsakaMinami-
Osaka
ItamiHimeji No.2
Himeji
Hirakata
Sequence of Events (2)
♦Miboro Power Plant Accident Case (3)
Kita-Osaka
2. The line tripped and loop was opened3. Power flow concentrated on
Dai-Kurobe TL
(Chubu EPCo)
3-104
4. Generators stepped out 5. Interconnections with other companies
were cut off due to frequency drop6. Generator tripped due to frequency drop7. Large-scale blackout
5
5
Step-out (stability limit) (Hokuriku EPCo)
AimotoJouhana
Miboro
Maruyama
Dai-Kurobe TL
Shin-Hokuriku TL
Maruyama TL
Kita-Osaka
Hirakata
Higashi-OsakaMinami-
Osaka
Ikehara
Himeji
Himeji No.2
Sequence of Events (3)
♦Miboro Power Plant Accident Case (4)
Itami
(ChugokuEPCo)
44
6 (Chubu EPCo)
3-105
Daily load curve on the day
0
5
10
15
20
25
0 6 12 18
3.7 GW
1/17/1995
1/31/1994
Blackout area justafter the earthquake
- Outage of generation : 1.8 GW- Outage of load : 3.3 GW- Magnitude of the earthquake: 7.2- Maximum accelerationof the earthquake: 818gal
(GW)
Hours
5:46
Collapsed highway
♦Great Hanshin-Awaji Earthquake Case (1)
20
15
10 3.3 GW
3-106
The number of customers without electricity
0
50
100
150
200
250
300
260 (5:46)
100 (7:30) Restored bulk system by switching
Jan. 17 18 19 20 21 22 23
50 (20:00)
40 (8:00) All substations (275kV, 154kV)restored to temporary operating condition
21 (7:00)12 (19:00)
11 (6:00)8 (18:00)
5 (9:00) 2 (9:00) 0 (15:00)
Restored to temporaryoperation condition
Not including customers whose homes were destroyed or were unable to receive electricity due to other problems
[Million]
3.0
2.5
2.0
1.5
1.0
0.5
0
System operation contributed the early restoration
♦Great Hanshin-Awaji Earthquake Case (2)
3-107
0 50 100km
KYOTO
OSAKA
KOBE
Fault
500kV T/L
Date : Dec. 22, 2005 Time : 8:52 AMPower interruption : 1,890MW
To Large Power Plant
Estimated Cause :
Galloping Phenomenon
Route-A Route-B
♦Large Power Plant Trunk LinesAccident Case (1)
65

3. System Operation(Voltage Control and System Protection)
3-108
Dec.22, 200508:49 Trip of Route-A 2L08:50 Trip of Route-B 2L08:51 Trip of Route-A 1L08:52 Trip of Route-B 1L
B S/S
Loss of 4,800MW generation triggered by
four lines tripping
A Large Power Plant
Route-B
Route-A
08:49 08:5008:51 08:52
1 L 2 L 1 L 2 L Load sheddingaccording to periodical
pre-calculation by “BSS”
(Area total demand : 25,300MW)
C SW/S
GGGG
♦Large Power Plant Trunk LinesAccident Case (2)
3-109
Purpose Functional diagram
Fault detection terminal
Loss of generator
60.0
59.0
Time
Frequency[Hz]
Loss of small generator
Load shedding is executed
Loss of large generator
G
Load shedding
Control terminal
Fault detection terminal
Main system
To keep system frequency greater than 59.0Hz and to avoid cascading line tripping.
< Outline of BSS >
♦Large Power Plant Trunk LinesAccident Case (3)
3-110
With BSS
・Frequency drop causes separation from other systems and load shedding (Under frequency relay operated)
・Outage in wider areas and delay in restoration
Outage power: approx. 2.2GWRestoration time: about 40 min.
Outage power: approx: 4.6GWRestoration time: about 150 min.
・ By preventing frequency drop in advance, separation from otherinterconnected systems was avoided.
・ Limited outage areas and quick restoration
Without BSS
♦Large Power Plant Trunk LinesAccident Case (4)
3-111
♦Lessons from the Outages
The importance of fault extension protection relays wasrecognized in case large generators drop.The accident eventually lead to the development of “BSS (Block System Stabilizer)” later.
Miboro Power Plant Accident
Great Hanshin-Awaji Earthquake
Large Power Plant Trunk Systems Accident
Outage was restored to temporary operation condition earlier than any other infrastructures such as water supply and city gas, due to the effects of consistent training in KANSAI.
The effectiveness of “BSS” against severe accident was confirmed because power system was fully restored in a very short time despise the large scale outage.
66


![Takeshi Amemiya-Advanced Econometrics[1]](https://static.documents.pub/doc/80x56/543b86b9afaf9fe7568b4999/takeshi-amemiya-advanced-econometrics1.jpg)


