SRI Internationa l Draft Final Technical Report • January 2002 INITIAL DEVELOPMENT OF A CONTINUOUS EMISSION MONITOR FOR DIOXINS Final Technical Report Reporting Period Start Date:July 29, 1998 Reporting Period End Date: January 31, 2002 Authors: Michael J. Coggiola, Harald Oser, Gregory W. Faris , and David R. Crosley Report Issue Date: January 2002 DOE Award Number: DE-AC26-98FT-40370 Prepared by: SRI International 333 Ravenswood Avenue Menlo Park, CA 94025-3493 Prepared for: U.S. Department of Energy National Energy Technology Laboratory 3610 Collins Ferry Road Morgantown, WV 26505 This report was prepared as an account of work sponsored by an agency of the United States Government. Neither the United States Government nor any agency thereof, nor any of their employees, makes any warranty, express or implied, or assumes any legal liability or responsibility for the accuracy, completeness, or usefulness of any information, apparatus, product, or process disclosed, or represents that its use would not infringe privately owned rights. Reference herein to any specific commercial product, process, or service by trade name, trademark, manufacturer, or otherwise does not necessarily constitute or imply its endorsement, recommendation, or favoring by the United States Government or any agency thereof. The views and opinions of authors expressed herein do not necessarily state or reflect those of the United States Government or any agency thereof. 3 3 3 R a v e n s w o o d A v e n u e • M e n l o P a r k , C A . 9 4 0 2 5 - 3 4 9 3 • 6 5 0 . 8 5 9 . 2 0 0 0
Transcript
SRI International
Draft Final Technical Report • January 2002
INITIAL DEVELOPMENT OF A CONTINUOUS EMISSION MONITORFOR DIOXINS
Final Technical Report
Reporting Period Start Date:July 29, 1998
Reporting Period End Date: January 31, 2002
Authors: Michael J. Coggiola, Harald Oser, Gregory W. Faris , and David R. Crosley
Report Issue Date: January 2002
DOE Award Number: DE-AC26-98FT-40370
Prepared by: SRI International
333 Ravenswood Avenue
Menlo Park, CA 94025-3493
Prepared for: U.S. Department of Energy
National Energy Technology Laboratory
3610 Collins Ferry Road
Morgantown, WV 26505
This report was prepared as an account of work sponsored by an agency of the United States Government. Neither the United
States Government nor any agency thereof, nor any of their employees, makes any warranty, express or implied, or assumes any
legal liability or responsibility for the accuracy, completeness, or usefulness of any information, apparatus, product, or process
disclosed, or represents that its use would not infringe privately owned rights. Reference herein to any specific commercial
product, process, or service by trade name, trademark, manufacturer, or otherwise does not necessarily constitute or imply its
endorsement, recommendation, or favoring by the United States Government or any agency thereof. The views and opinions of
authors expressed herein do not necessarily state or reflect those of the United States Government or any agency thereof.
3 3 3 R a v e n s w o o d A v e n u e • M e n l o P a r k , C A . 9 4 0 2 5 - 3 4 9 3 • 6 5 0 . 8 5 9 . 2 0 0 0
Draft
i
ABSTRACT
Under contract DE-AC26-98FT-40370, SRI International has completed the third phase ofa planned three-phase effort to develop a laboratory prototype continuous emission monitor (CEM)for dioxins and furans generated during the incineration of waste materials at DOE remediation
sites. The project was initiated on July 29, 1998 with the technical effort completed in October2001.
During this research effort, SRI has made numerous improvements in our jet-REMPI
instrument. These improvements have involved characterization and optimization of the molecularcooling in the gas jet, implementation of a custom-fabricated, four pulsed valve assembly, newdata acquisition and display software, and preliminary development of a wavelength and mass
calibration approach. We have also measured the REMPI excitation spectra of numerous organiccompounds that are likely to be present in the exhaust stream of a waste incinerator. These spectramust be well characterized in the laboratory to understand any potential interferences that might
arise when monitoring for dioxin and furan congeners.
Our results to date continue to validate the original concept of using jet-REMPI as thedetection method in a dioxin CEM. Using only commercial components with minor modifications,
we have already demonstrated a detection sensitivity in the low ppt range with sufficient chemicalspecificity to separately detect two closely related congeners of dichlorodibenzodioxin present in amixture.
To demonstrate the utility of this methodology outside of the controlled conditions of thelaboratory, we performed a series of pseudo-field experiments at the US Environmental ProtectionAgency’s National Risk Management Research Laboratory, Research Triangle Park, NC. The
instrument used for those studies was built by SRI under contract with US EPA, and was an exactduplicate of the SRI system. This duplication allowed the experiments to be conducted withouttransporting the SRI system to the EPA site. Using the jet-REMPI system in conjunction with a
combustion flow reactor, the joint SRI-EPA team discovered several new, and unexpected,chemical species in the exhaust stream of a pure methane flame.
Based on our work in this project, we have developed a number of concepts for
instrumental improvements that will substantially increase our sensitivity while maintaining theexceptional selectivity required of a dioxin CEM. In addition, we have developed several systemconfigurations with varying degrees of functionality that can be further developed and deployed
for process monitoring, surrogate measurements, and potentially, as a dioxin control CEM. Due tothe extremely demanding regulatory compliance monitoring requirements involving both congener
Draft
ii
specificity and sub-part-per-trillion sensitivity with near real-time speed, we believe it is not as yet
possible to specify a system configuration for a true dioxin compliance monitor.
While a true TEQ compliance monitor is not yet possible using the jet-REMPI approach,the technique may prove useful as a surrogate, or indicator monitor. This application would
involve continuous measurement of surrogate compounds, such as lowly chlorinated dioxins andfurans, whose concentrations have been previously correlated with the TEQ. Such an instrumentwould not require the extreme sensitivity of a compliance monitor although the high degree of
2.1 Benefits to the User of a Dioxin CEM ................................................................................ 52.2 Technology Development Requirements ............................................................................ 92.3 Description of the Technology............................................................................................ 9
3. RESULTS AND DISCUSSION ............................................................................................. 143.1 Instrument Modifications .................................................................................................. 14
3.1.5 New Optical Frequency Doubler........................................................................... 223.1.6 New control Program ............................................................................................ 233.1.7 Internal Temperature ............................................................................................. 23
3.1.8 New Ion Source Chamber ..................................................................................... 273.1.9 4-Valve Inlet Assembly......................................................................................... 293.1.10 New Jet-REMPI TOFMS ...................................................................................... 30
3.2.7 Improved Dynamic Range .................................................................................... 543.2.8 Field Work at EPA NRMRL................................................................................. 563.2.9 Other Collaborations ............................................................................................. 60
3.3 Dioxin CEM Design Specification.................................................................................... 603.3.1 TEQ Monitor ......................................................................................................... 603.3.2 Alternative REMPI-Based Instrumentation Schemes ........................................... 63
4. CONCLUSIONS..................................................................................................................... 645. FUTURE WORK .................................................................................................................... 656. REFERENCES........................................................................................................................ 65
7. ACKNOWLEDGEMENTS .................................................................................................... 668. APPENDIX A: Preliminary Test Plan “Field Measurements Using Jet-REMPI:
Application To Flow Reactor Combustion Processes” ........................................................... 68
9. APPENDIX B: SRI Proprietary Design Concepts .................................................................. 6910. APPENDIX C: “Development of a jet-REMPI (resonantly enhanced multiphoton ionization)
11. APPENDIX D: “Congener-specific detection of dioxins using jet-REMPI”,Chemosphere 43, 469 (2001). ................................................................................................. 82
12. APPENDIX E: “Development Of A Real-Time Continuous Emissions Monitor For
Dioxins And Other Chlorinated Aromatics”, Organohalogen Compounds 40, 551(1999). ... 9213. APPENDIX F: “Development Of A Real-Time Continuous Emissions Monitor For
Hazardous Aromatic Air Pollutants”, Organohalogen Compounds 45, 141(2000). ............... 97
14. APPENDIX G: “Dioxin And Furan Laboratory Measurements Using Jet-REMPI “,Organohalogen Compounds 54, 360(2001). ......................................................................... 102
Draft
v
FIGURES
1. Two-dimensional map of the mass and wavelength space for a number of hazardous
air pollutants, including lowly chlorinated dioxins. The Xs correspond to the center
wavelength for the principal absorption feature for each species. ....................................... 11
2. High resolution, two-dimensional map of the mass and wavelength space for the
2,3- and 2,8-dichlorodibenzodioxins. The approximate width of the principal
absorption feature for each congener is shown by the line connecting the Xs. The
instrumental mass resolution and optical resolution are shown by the vertical and
41. Time dependence of phenol measured in a lean methane flame at EPA ............................. 58
42. Time dependence of phenol measured in a lean methane flame at EPA ............................. 59
43. Wavelength dependence of the aniline jet-REMPI signal measured in a lean
methane flame at EPA.......................................................................................................... 59
Draft
viii
TABLES
1. Hazardous air pollutants previously measured by jet-REMPI. ............................................ 12
2. Performance specifications of the Continuum laser system................................................. 20
3. Comparison between required and currently available performance specifications
for key components of a jet-REMPI system ........................................................................ 62
Draft
1
1. EXECUTIVE SUMMARY
Under contract DE-AC26-98FT-40370, SRI International has completed all three phasesof a planned three-phase effort to develop a laboratory prototype continuous emission monitor(CEM) for dioxins and furans generated during the incineration of waste materials at DOE
remediation sites. During the 42 month course of executing this project, some of the originallyproposed tasks were either modified, deleted, or replaced to reflect the changing state ofknowledge, the technical progress, unresolved technical issues, and unplanned, new research
opportunities and directions.
1.1 SCOPE OF WORK
The objective of this effort is to develop a laboratory instrument that can providecontinuous monitoring of the emission levels of polychlorinated dibenzo-p-dioxins (PCDDs) and
polychlorinated dibenzofurans (PCDFs) generated by incineration equipment at DOE sites.Once developed, this instrument will be used to systematically study the emission levels of keydioxins and furans that contribute to the toxic equivalence (TEQ). This information, combined
with mechanistic modeling studies being undertaken elsewhere, will lead to the designspecifications for a real-time, autonomous dioxin CEM that can be used for compliancemonitoring at DOE incinerators.
The goal of the first phase of the effort was to establish the sensitivity and chemicalspecificity using currently available dioxin detection instrumentation. The instrument developedin Phase 1 required a stepwise process of designing, testing, evaluating, and upgrading that was
continued in Phase 2. Phase 2 included extensive, systematic testing of the laboratory prototype,performance evaluation, and a design for upgrading to a system that can measure each of thedioxin and furan congeners that contribute to the TEQ. Phase 3 included additional instrumental
improvements, expansion of the spectral library, and testing the laboratory system undersimulated field conditions of a sample stream containing typical levels of flue-gas combustionby-products.
A major objective of our effort has been to make incremental improvements in theanalytical capabilities of the jet-REMPI system. Initial evaluations of the sensitivity and
specificity for the baseline instrument assembled during Phase 1 were used to establish neededchanges and to refine the laboratory dioxin CEM system. These tasks helped to establish which
Draft
2
chemical species can be monitored by a prototype instrument and how best to optimize the
ionization scheme and laser source(s), the mass spectrometer configuration, and numerous otherdesign and operational parameters.
SRI successfully modified an existing TOFMS for use as the laboratory prototype dioxin
CEM. All the planned major modifications were completed, as well as several additional,unplanned modifications that became necessary during the work. At the completion of Phase 1,the SRI instrument was performing as well or better than any jet-REMPI instrument reported in
the open scientific literature.
SRI made considerable progress on the improvement of the operation of our prototypejet-REMPI apparatus. These improvements are described in detail below in Section 3 of this
report. At the conclusion of this effort, the complete system, including the tunable laser and themass spectrometer were fully functional. The overall reliability, stability, and reproducibility ofthe instrument were greatly improved.
1.2.2 Sampling and Preconcentration
The goal of this task was to address the critical issues associated with acquiring arepresentative sample of the stack emissions and transporting that sample to the instrument
without significant loss or change in its chemical composition. Because the sensitivity of theinstrument remains significantly below that required for a dioxin CEM compliance monitor,some form of sample preconcentrator may need to be developed.
SRI made relatively little progress on this task for a variety of reasons. The issue ofsampling is closely tied to the specific details of the source from which the sample is to beextracted. Because we as yet have no definite test bed with which to test our system, it is
difficult to design a universal sampler. Similarly, the design of a preconcentrator, or even theneed for a preconcentrator, cannot be established until the instrumental sensitivity has beenmaximized to the extent possible. Since we are continuing to improve the limits of detection
through optimization of the instrument, we cannot as yet determine if preconcentration will berequired. Moreover, we have become aware of a preliminary preconcentrator design beingdeveloped by the research group of Dr. Brian Gullett, of the National Risk Management
Research Laboratory, U.S. Environmental Protection Agency.
We have collaborated with this group on a number of dioxin CEM issues, including thedesign of a preconcentrator. At the conclusion of the present effort, the EPA had assembled a
prototype preconcentrator, but no testing had been completed.
Additionally, we have also become aware of other DoE-funded work on sampling andpreconcentration being performed at both MSE Technology Applications, Inc. (MSE), Butte,MT, and the Diagnostic Instrumentation & Analysis Laboratory (DIAL), at Mississippi State
Draft
3
University, Mississippi State, MS. SRI has maintained contact with researchers at both
institutions, as well as making on-site visits to view and discuss their sampling designs.
1.2.3 Instrument Optimization
SRI successfully investigated the sensitivity of the jet-REMPI instrument using several
lowly chlorinated dioxin congeners. Detailed “calibration curves” were not generated, however,because the focus was on estimating the limit of detection (LOD) rather than on establishing auseful range of linear response. In addition, each of many of the improvements made on a
continuing basis would necessitate repeated remeasuring of the calibration curves. Since othergroups have demonstrated linear response over five to six orders of magnitude using a verysimilar jet-REMPI instrument, it is reasonable to assume that our instrument will provide at least
equivalent performance.
In an extension of the proposed sensitivity testing, SRI was able to demonstrate twocritical additional performance characteristics: (1) congener-specific detection in mixtures and
(2) two-photon, two-color REMPI detection of a chlorinated aromatic compound. Both of theseperformance characteristics are essential for a dioxin CEM.
This task was designed to investigate the function of key elements of the instrument,
including the pulsed gas inlet valve, laser ionization source(s), ion extraction optics, and themass spectrometer. The commercial, pulsed, inlet gas valve used initially may eventually bereplaced with one designed specifically for this application. Design criteria will include
operation at elevated temperatures, repetition rate and pulse length commensurate with the laserionization source(s), and a geometry that maximizes the sample gas density in the ionizationregion.
The use of two-color REMPI schemes were also studied as a means of improving boththe sensitivity and the chemical selectivity. The ion extraction optics were carefully designed totake into account four factors: (1) the field distortions associated with the proximity of the pulsed
gas valve to the ionization region, (2) the geometry of the ionization region, (3) space chargeeffects within the extraction volume, and (4) the phase space volume associated with the ionacceptance of the mass spectrometer. Computer simulations using SIMION 6.0 were used
extensively for this design.
A systematic study of the supersonic molecular beam formed by the free jet expansionwas performed. This characterization allowed SRI to optimize the location of the ionization
region with respect to the exit of the nozzle. This optimization not only increased the sensitivityof the instrument by maximizing the ionization yield, but it also allowed for an improved andsimplified mechanical design of the source vacuum chamber.
Draft
4
Finally, the functioning of the mass spectrometer was investigated with respect to its
transmission, resolution, sensitivity, and background noise level.
1.2.4 Laboratory Calibration
The goal of this task was the calibration of the laboratory prototype instrument to
establish its sensitivity, chemical specificity, response time, measurement reproducibility, andreliability. Using the optimized instrument developed in Phase 2, SRI originally planned a seriesof comprehensive laboratory tests using a combination of PCDDs and PCDFs that contribute to
the TEQ . The bulk of these laboratory tests were replaced with a pseudo-field test performed atEPA’s National Risk Management Research Laboratory (NRMRL), Research Triangle Park, NC.
The vapor delivery system that would have been used for the calibration studies proved
more difficult to design and construct than originally planned due to the strict materialslimitations (for example, no Teflon or other polymeric seals), and the necessity of operating atelevated temperatures. We originally had planned to use standard, commercial permeation
devices, however, these were not readily available for chlorinated dioxins and furans, nor werethey designed to operate above 70˚ C. Because of these restrictions, we had to develop a designthat did not use normal valves and seals which could result in loss of the target compounds due
to adsorption or chemical degradation. Our design required the fabrication of several pieces ofcustom glassware. Although all the necessary components were eventually acquired, we did notcomplete the assembly and testing, choosing instead to make the measurements at NRMRL.
SRI made the first measurements of the REMPI excitation spectrum of benzene-d6 (C6D6)which could serve as a calibrant molecule. The use of this compound as both a mass andwavelength calibration standard was demonstrated. Although more work will be required to
implement an automated calibration scheme based on perdeuterobenzene, our preliminaryexperiments show that it is feasible to do this.
1.2.5 Dioxin CEM Design Specification
At the conclusion of this effort, we believe that the required performance specificationsof a dioxin CEM instrument capable of serving as a regulatory monitor are beyond the currentstate of the technology. Nonetheless, it is possible to provide a general design specification for
this instrument.
Although specific design elements can be specified, the exact laser or TOFMSconfiguration can change in time not only because many choices and combinations are possible,
but also because both components are continually being improved by commercial manufactures.At the current stage of development, it is much more important to establish feasibility andgeneral design specifications, than to project specific criteria for rapidly evolving technologies,such as laser sources.
Draft
5
We provide a general design specification in Section 3.3, along with a discussion of the
current state of technological development for the key components. Finally, we provide adiscussion of optional monitoring systems that are possible using the REMPI TOFMS approach.
2. BACKGROUND
Current techniques for monitoring emissions of PCDDs and PCDFs use sampling times
in excess of hours, during which the analytes are collected on adsorbing materials followed by
sample extraction and preparation for later gas chromatography/mass spectrometry (GC/MS)
analysis.1 These costly and time demanding methods have drawbacks in that compliance
measurements are made only infrequently (perhaps once or twice per year). The consequences
are overdesigned air pollution control systems and regulatory strategies that rely on indirect
process monitoring rather than direct monitoring and dioxin prevention strategies.
2.1 BENEFITS TO THE USER OF A DIOXIN CEM
In light of these limitations, a continuous emission monitor (CEM) for PCDD and PCDFoffers four benefits to users:
• Direct, rapid detection of PCDD and PCDF congeners, their indicators
(compounds measured in lieu of PCDDs and PCDFs that indicate the
parallel presence of PCDDs and PCDFs), or their precursors (compounds
that have been shown to be chemical progenitors of PCDDs and PCDFs).
• Combustion system optimization through continuous, on-line monitoring
and process control.
• A method to advance prevention of PCDD and PCDF formation rather than
rely on flue gas cleaning controls.
• Assurance to stakeholders (such as permit writers and the public) that the
process is operating safely.
The U.S. EPA Office of Solid Waste (OSW), which regulates hazardous waste treatment
processes, has identified continuous PCDD and PCDF monitoring as a research priority, because
PCDDs and PCDFs can drive risk assessments.2 The OSW recognizes that CEMs offer superior
continuous compliance assurance compared with infrequent, extractive sampling. Their policy
provides the economic incentive for waste facilities to use CEMs by eliminating waste feed
characterization, compliance testing, and operating parameter monitoring for pollutants when a
Draft
6
facility uses CEMs. However, with few PCDD/PCDF CEM technologies under development,
the DOE will not be able to implement this superior mode of compliance. A CEM for
compliance purposes will likely require higher performance capabilities (especially for
sensitivity) than if the CEM were used for research purposes or as a method of combustion
optimization. These CEM sensitivity needs will be lessened by using a short duration sample
concentration method. However, sensitivity for a dioxin CEM is a primary issue, requiring
measurements at concentrations two to four orders of magnitude lower than ever achieved
before.
As suggested by experts in this area,3 a dioxin CEM should first be used as a research
tool in laboratories studying PCDD and PCDF formation and control. Such an instrument will
need to make rapid, accurate measurements of PCDDs and PCDFs but at concentrations much
higher than needed for a compliance CEM. This type of instrument will greatly accelerate our
understanding of PCDD and PCDF formation and the availability of prevention and control
techniques. Researchers have limited understanding of how combustion processes affect PCDD
and PCDF formation, largely due to their need to relate time-integrated sampling data with
dynamic formation mechanisms and combustor conditions after an often multi-week analysis lag
period. A real-time CEM will provide immediate feedback on how variations in combustion
operating parameters affect PCDD and PCDF formation and/or destruction, thus allowing more
accurate correlations and much more comprehensive data analysis. An instrument that can make
these types of measurements will also be valuable to DOE as new waste treatment processes are
evaluated and readied for permitting and public acceptance.
As our understanding of PCDD and PCDF formation improves, it will be valuable to
build a database using emissions from actual waste treatment processes to correlate operating
conditions with PCDD and PCDF formation. Such a database can be used to devise operating
strategies to prevent formation of PCDD and PCDF. This database can also be used to identify
surrogates or indicators that can be monitored more easily and cheaper than the PCDD and
PCDF themselves, leading to less expensive, more widely implemented compliance and control
strategies.
CEMs also provide data important for stakeholder's assurance that the combustion
processes are operating safely. Stakeholders such as public interest groups, permit writers, and
local citizens groups can play a major role in permitting waste treatment facilities. Real-time
emissions data may accelerate their acceptance, saving time and money during the permitting
process.
Draft
7
This overall approach of coordinating dioxin measurement and control extends beyond
the scope of this project and will involve several government agencies. SRI is closely involved
with the dioxin monitoring community and we are working to bring this broader vision to reality.
This project focuses on the issue of dioxin measurement and how to develop a REMPI
(resonance enhanced multiphoton ionization) –based CEM system to measure the type and
concentrations of dioxins necessary to provide DOE a means to continuously monitor dioxins for
regulatory compliance.
Two critical issues must be addressed before a dioxin CEM can be successfully
developed:
• What would you measure? There are 210 PCDD and PCDF congeners, with
widely varying levels of toxicity, and most are not considered
toxicologically significant.
• To what minimum concentration (sensitivity) would you need to measure it?
The draft MACT rule proposes an emission limit of 0.2 ng/m3 2,3,7,8 TCDD
toxic equivalence (TEQ).
Toxic equivalence factors (TEF) are defined as a set of weighting factors expressing the
toxicity of each compound relative to the toxicity of 2,3,7,8 TCDD. TEFs vary from 1.0 to 0.001
for 17 different 2,3,7,8-substituted compounds. The total TEQ is calculated by multiplying the
concentration of each PCDD and PCDF by its corresponding factor TEF. Several weighting
schemes are available. NATO has proposed a scheme assigning factors to 17 different 2,3,7,8-
substituted compounds and assigning no factor to the 193 non-2,3,7,8-substituted compounds.
Estimates of performance needs for a dioxin CEM for regulatory compliance can be made based
on the existing knowledge of TEF and TEQ. Considering only the 17 compounds in the total
TEQ, the sensitivity required for a dioxin CEM would need to be a factor of ten less than the
emission limit for each of the 17 congeners (i.e., divide the TEQ by 17 x 10). Hence, the
required minimum detection limit is equivalent to the emission limit divided by 170, or 0.001
ng/m3 or better, for each congener in the TEQ.
In the best case, if you could argue that the probability of formation of each congener was
about equal, then the minimum detection limits could be higher for compounds with a lower
TEQ factor. In other words, given a minimum detection limit of 0.001 ng/m3 for 2,3,7,8 TCDD,
the other 16 PCDD/F congeners having TEFs between 0.5 to 0.001 would have corresponding
minimum detection limits of 0.002 ng/m3 to 1.0 ng/m3.
As shown in the estimates above, the detection limits must be very low to directly
measure all 17 congeners in the TEQ. A proposed alternative is to monitor precursors or
Draft
8
surrogates, identified using a dioxin CEM in research laboratories to collect real-time data. This
real-time data would be invaluable to develop mechanistic understandings, leading to surrogates
or precursors that can be measured at much higher concentrations. According to experts in this
area,4 the study of lightly chlorinated (mono-, di-, or tri-) dioxins would be acceptable, because
these congeners are easier to measure. The molecules are very similar to those in the TEQ and
would likely lead to correlations describing the formation of TEQ congeners.
Laboratory experiments for studying dioxin formation and control usually operate at total
dioxin concentrations around 100 to 1000 ng/m3. Depending on how many of the 210 total
congeners are present, detection limits around 5 ng/m3 for each congener of interest would be
more than enough. The first step in developing a dioxin CEM suitable for compliance
monitoring is, therefore, to develop a laboratory instrument capable of speciating dioxin
congeners, precursors, or surrogates, and measuring their concentrations in real-time with a
sensitivity in the low ng/m3 range. By combining this information with sophisticated combustion
models, it will be possible to determine the specific target chemicals that must be measured by a
dioxin CEM, and the levels to which they must be measured. Only after this information is
available can a dioxin CEM suitable for compliance use be developed.
In recent years, many significant improvements have been made in the detection of
dioxins resulting from various combustion processes. Several research groups, including DLR
(Deutsche Forschungsanstalt für Luft und Raumfahrt) in Stuttgart, Germany,3,5 The Technical
University of Munich, Germany,6,7 U.S. university research at Ann Arbor and Cornell, and
Sandia National Laboratories8 in Livermore, CA, have demonstrated instruments or components
of instruments based on REMPI. To date, however, none of these research programs has
achieved the sensitivity required for either compliance monitoring or a research CEM to study
formation and control of dioxins. The possibility of a commercial dioxin CEM becoming
available within the next five to ten years is questionable without a development program
focused on achieving specific performance goals for a dioxin CEM.
Of particular interest and promise for the real-time characterization of dioxins is the
combination of a pulsed gas jet with REMPI and time-of-flight mass spectrometry (TOFMS).
Using this approach, the group at DLR Stuttgart has measured non-, mono-, di-, tri-, and tetra-
chlorinated dioxins at the EPA National Risk Management Laboratory (NRML) facility during
tests from July to October, 1996.9 The measured minimum detectability for dichlorinated
dioxins was approximately 20 ng/m3. We estimate that this detection limit can be improved by at
least one order of magnitude to about 1 ng/m3 for dichlorinated dioxins. Using the current one-
color REMPI scheme, the sensitivity decreases with increasing chlorination, making detection of
the more highly chlorinated dioxins problematic.
Draft
9
2.2 TECHNOLOGY DEVELOPMENT REQUIREMENTS
REMPI needs significant enhancements to reach the sub-ng/m3 detection limits required
for a compliance CEM. Potential enhancements include the use of sample preconcentration, a
two-color REMPI scheme, and higher repetition rate laser systems. As a research dioxin CEM,
however, the current REMPI-TOFMS scheme may need to be improved by only one or two
orders of magnitude.
Based on our previous research with REMPI and our understanding of dioxin regulatory
structure, four major areas must be studied to develop a REMPI-based dioxin CEM:
• Determination if penta- and higher chlorinated dioxins will require a two-
color REMPI scheme.
• Measurement of detection limits for congeners as a function of chlorination
and improvement in the detection limits via system improvements and
sample preconcentration.
• Development of a particle desorber/separator to liberate dioxins adsorbed on
particles for detection by the REMPI analyzer.
• Development of a mechanistic understanding of dioxin formation and
control to determine which congeners should be measured, and at what
concentration, to provide measurements for regulatory compliance and
process control.
This project will address the first three areas and provide the tools necessary to address
the fourth. We continue to work closely with dioxin research groups to ensure that the dioxin
mechanistic studies are integrated into the instrument development work.
2.3 DESCRIPTION OF THE TECHNOLOGY
Resonance enhanced multiphoton ionization is a highly sensitive, highly species-selective,
gas-phase analysis technique that has been applied to numerous problems in molecular
spectroscopy and combustion research. SRI has been using multiphoton-mass spectrometric
techniques to study spectroscopy and trace-level detection for more than a decade. We pioneered
the application of these methods to the detection of aromatic and chlorinated organic
compounds.10,11 For REMPI of complex molecules, such as dioxins, the spectra can be simplified
greatly by expansion through a nozzle. Adiabatic expansion results in low sample temperatures,
which increases the electronic ground state population and narrows the resonance line widths. The
enhanced population of the ground state gives an increase in sensitivity, while the narrower line
Draft
10
widths give rise to very sharp REMPI transitions. One or two lasers are used to ionize the cooled
gas molecules by absorption of two or more photons, one of which is resonant with an electronic
transition in the target molecule.
Ions produced by REMPI are often detected using a TOFMS that takes advantage of the
pulsed nature and well-defined temporal character of laser ionization. Many REMPI
experiments performed at SRI have successfully used the TOFMS approach. The simultaneous
detection by mass and wavelength yields high chemical selectivity. Typical sensitivities of
conventional REMPI TOFMS systems that do not use sample molecule cooling are in the mg/m3
range and higher, which is insufficient either for a laboratory system or for regulatory monitoring
of chlorinated aromatics in a waste treatment process such as an incinerator.
A major improvement in sensitivity without loss in selectivity can be achieved using a
pulsed gas valve that produces a supersonic expansion. In a supersonic jet, the temperature drop
occurs only in a relatively narrow zone downstream of the nozzle but upstream of the Mach disk,
or shock front. Laser ionization in the region of the Mach disk provides the highest sensitivity
due to the local maximum in gas density. This phenomenon was exploited by SRI in a 1987study of the four-photon dissociation and ionization of H2 in a pulsed jet.12
The combination of REMPI and mass spectrometry provides a unique, two-dimensional,
approach to the analytical measurement of trace levels of organic compounds in complex
mixtures. The two-dimensional nature of REMPI-MS is illustrated in Figure 1, which compares
28 hazardous air pollutants (HAPs) by plotting their molecular weight as a function of the
primary S0→S1 transition wavelength. The molecular weight corresponds to mass that would be
monitored by the MS, while the transition wavelength corresponds to the optical wavelength
used to resonantly excite the molecule. It is apparent that, for these selected HAPs, closely
related species tend to cluster together, as might be expected.
At first glance, it appears, however, as if some species may not be distinguishable. For
example, in the upper right corner, the 2,3-dichlorodibenzodioxin and the 2,8-
dichlorodibenzodioxin are nearly coincident on this map. In actuality, these species are readily
separable using jet-REMPI, as shown in the high resolution, two-dimensional map in Figure 2.
Four dioxin species fall within the narrow mass and wavelength ranges displayed in Figure 2,
corresponding to the 2,3- and 2,8-dichlorodibenzodioxin molecules containing two chlorine-35
atoms, and one chlorine-35 and one chlorine-37 atom. On the expanded scale, the S0→S1
transition wavelength is seen to actually have a finite width, typically 0.03 nm, as shown by the
horizontal bars for each species. The four molecules are widely separated on this map compared
with our instrumental resolution, both in mass (approximately 0.25 amu) and wavelength
Draft
11
(approximately 0.005 nm). Hence, jet-REMPI TOFMS can easily distinguish these four species.
This capability was verified experimentally in Phase 1.
50
70
90
110
130
150
170
190
210
230
250
250 260 270 280 290 300 310
Mas
s (a
mu)
S0-S1 Wavelength (nm)
Benzene
Toluene Phenol
o-Xylene
m-Xylene
p-Xylene
o-Cresol
m-Cresolp-Cresol
Chlorobenzeneo-Chlorotoluene
m-Chlorotoluenep-Chlorotoluene
o-Dichlorobenzene
m-Dichlorobenzene p-Dichlorobenzene
2,4-Dichlorotoluene
2,5-Dichlorotoluene
2,6-Dichlorotoluene3,4-Dichlorotoluene
Dibenzofuran
Dibenzodioxin
2-Chlorodibenzodioxin
2,3-Dichlorodibenzodioxin
2,7-Dichlorodibenzodioxin
2,8-Dichlorodibenzodioxin
Napthalene
Figure 1. Two-dimensional map of the mass and wavelength space for a number of hazardous air
pollutants, including lowly chlorinated dioxins. The Xs correspond to the center wavelength
for the principal absorption feature for each species.
Table I lists the pertinent information for a range of hazardous air pollutants that have
been previously examined using jet-REMPI. This list is not intended to be comprehensive but
rather illustrative of the general classes of compounds that readily accessible using this vapor
Figure 2. High resolution, two-dimensional map of the mass and wavelength space for the 2,3- and
2,8-dichlorodibenzodioxins. The approximate width of the principal absorption feature for
each congener is shown by the line connecting the Xs. The instrumental mass resolution and
optical resolution are shown by the vertical and horizontal bars, respectively.
Table 1HAZARDOUS AIR POLLUTANTS PREVIOUSLY MEASURED BY JET-REMPI
Molecule Formula Mass [amu] S0-S1 [nm]
Benzene C6H6 78 259.0
Toluene C7H6 92 266.7
Phenol C6H6O 94 275.0
o-Xylene C8H10 106 261.8
m-Xylene C8H10 106 260.0
p-Xylene C8H10 106 259.7
o-Cresol C7H8O 108 276.5
Draft
13
m-Cresol C7H8O 108 277.5
p-Cresol C7H8O 108 283.0
Chlorobenzene C6H5Cl 112 269.8
o-Chlorotoluene C7H7Cl 126 268.6
m-Chlorotoluene C7H7Cl 126 275.1
p-Chlorotoluene C7H7Cl 126 275.4
Naphthalene C10H8 128 299.0
o-Dichlorobenzene C6H4Cl2 146 276.0
m-Dichlorobenzene C6H4Cl2 146 274.1
p-Dichlorobenzene C6H4Cl2 146 279.7
2,4-Dichlorotoluene C7H6Cl2 160 279.2
2,5-Dichlorotoluene C7H6Cl2 160 279.6
2,6-Dichlorotoluene C7H6Cl2 160 276.4
3,4-Dichlorotoluene C7H6Cl2 160 280.6
Dibenzofuran C12H8O 168 293.5
Dibenzodioxin C12H8O2 184 296.0
2-Chlorodibenzodioxin C12H7ClO2 212 304.5
2,3-Dichlorodibenzodioxin C12H6O2Cl2 246 306.0
2,7-Dichlorodibenzodioxin C12H6O2Cl2 246 304.3
2,8-Dichlorodibenzodioxin C12H6O2Cl2 246 305.7
Additional experimental details on the method and data acquired during the course of this
project are described in two recent publications, included in Appendix C: “Development of a jet-REMPI (resonantly enhanced multiphoton ionization) continuous monitor for environmentalapplications”, Appl. Opt. 40, 859 (2001), and Appendix D: “Congener-specific detection of
dioxins using jet-REMPI”, Chemosphere 43, 469 (2001). SRI’s contributions to the 1999, 2000,and 2001 annual dioxin conferences are also included as Appendices E-G, respectively.
Draft
14
3. RESULTS AND DISCUSSION
3.1 INSTRUMENT MODIFICATIONS
Figure 3 is a schematic of the laboratory prototype REMPI TOFMS instrument we
assembled for this effort. The TOFMS was originally developed for NASA to provide real-time
chemical characterization of tropospheric aerosol particles. That instrument, with a suitable
aerosol inlet stage, was successfully deployed on a NASA DC-8 research aircraft as part of a
two-month field mission. Described below are numerous modifications, improvements, and
additions made in the original TOFMS system for this project.
IonReflector
Ion ExtractionOptics
Time-of-Flight Mass Spectrometer
Nd:YAGLaser
Pulsed Gas Inlet(shown rotated 90˚
OpticalParametricOscillator
Ion BeamSteering Plates
ChevronChannelplate
Detector
Figure 3. Schematic of the jet-REMPI apparatus.
3.1.1 Vacuum System
The first step in this project was to modify of our existing time-of-flight mass
spectrometer system. To use the system for the jet-REMPI application, a new source vacuum
housing was required. The new source chamber included two ports for laser windows, large
diameter ports for the pulsed valve, the turbomolecular pump and connection to the flight tube,
and three smaller ports for pressure gauges and other feedthroughs. Figure 4 shows a sketch of
the chamber fabricated from a commercial, 8-inch diameter, stainless steel “tee” manufactured
by MDC Vacuum Products, Hayward, CA. A still newer source chamber was fabricated later in
the project as described in Section 3.1.8.
Draft
15
Figure 4. Design of the jet-REMPI vacuum housing.
In parallel with fabrication of the new source housing, we also modified the main vacuum
chamber of the TOF flight tube to permit ready access to the microchannel plate detector
assembly. The commercial vacuum chamber as supplied by R. M. Jordan, Grass Valley, CA,
Draft
16
requires a significant degree of disassembly to access the detector. Under normal conditions, this
is not a problem because the detector is relatively robust. However, our experience with this
instrument indicates that the detector produces an unacceptably large amount of ringing
following the detection of a strong ion signal. This ringing in the signal results in loss of data for
several hundred nanoseconds following the strong peak. Typically, this type of ringing indicates
of an impedance mismatch somewhere in the detection circuitry. Correction of a mismatch
requires a trial-and-error approach of testing different resistive termination and capacitive bypass
configurations under actual detection conditions. The need to change the configuration
frequently makes the rapid disassembly and reassembly of the detector important. Because of
physical constraints and the design of the microchannel plate detector, we added a rectangular,
metal-gasketed, flange to the side of the flight tube, as shown in Figure 5. The rectangular port
permits easy removal and installation of various detector configurations without resorting to
disassembly of the main vacuum chamber.
Figure 5. Design of the rectangular detector port modification to the time -of-flight mass spectrometer
vacuum housing.
Draft
17
The internal components of the new jet-REMPI laser ionization source were purchased
from R. M. Jordan. The source consists of a repeller plate, extraction grid, acceleration grid,
Einsel lenses, and steering plates. The laser-ionization source was installed in the source vacuum
chamber along with a pair of quartz windows for laser access.
Pumping for the instrument was originally provided by two, 250 L/sec Varian
turbomolecular pumps. One pump was located on the lower flange of the source chamber shown
in Figure 4, while the second pump was located on the flight tube. The latter was a standard V-
250 type pump, while the former was a V-250SF split-flow type. The split-flow pump
incorporates an intermediate pumping port that was used to provide backing for the V-250 pump.
The two turbomolecular pumps are backed by a 450 L/min Varian mechanical pump. The all-
metal vacuum housing for the time-of-flight mass spectrometer system routinely achieves
pressures in the mid 10-8 Torr range with no sample present. Under routine operation, the
pressure in the source region rises to 5 x 10⁻⁵ Torr, and the pressure in the flight tube rises to 2 x
10-7 Torr. The pumping system was subsequently upgraded in conjunction with the new source
chamber (see Section 3.1.8).
3.1.2 Pulsed Valve
The pulsed valve selected for the prototype laboratory instrument is an unmodified,
commercial, General Valve Series 9 type. This valve was ordered with the high-temperature coil
option, in anticipation of heating above 150°C.
The pulsed valve was fitted with a copper heating block to allow for thermal control of
the valve temperature. Two 50-watt cartridge heaters were inserted into the copper block to
provide heating, while a type-K thermocouple also inserted into the block is used to measure the
temperature. A standard proportional temperature controller is used to maintain the valve at
desired temperature. An vacuum insert was fabricated to position the pulsed valve close to the
ion extraction optics. A cross sectional view of the insert, shown in Figure 6, includes an outline
of the heater block and the pulsed valve.
A movable mounting system was fabricated using a bellows-sealed vacuum translator to
position the valve. This system is shown schematically in Figure 7, along with the ion extraction
optics. The main component of the translator is a commercial, MDC unit capable of providing
7 cm of linear travel. As shown in Figure 7, the bellows-sealed translator is mounted on the
large top flange of the ion source vacuum chamber. In the figure, the insert is at its lowest
position within the source chamber, and hence the molecular jet is closest to the laser ionization
region. Adjustment of the position of the jet relative to the laser beam allows optimization of the
Draft
18
signal that results from ionizing molecules that have achieved the maximum degree of cooling.
In our later design, we eliminated the movable feature and fixed the separation at the optimum
position. The fixed location pulsed valve configuration is described in Section 3.1.7.
.
pulsed valve
heater block
exit orifice
Figure 6. Design of the pulsed valve positioning device
Many pulsed valve designs have been developed based on simple electromechanical
solenoid mechanisms, piezoelectric actuators, magnetic repulsion devices, and modified fuel
injectors. Pulsed durations range from a few microseconds to hundreds of microseconds, while
repetition rates reach 80 Hz or higher, depending on the pulse duration and valve design. A
critical parameter for the pulsed valve in a dioxin CEM is the temperature at which it can
operate. Because of the low volatility of the heavier dioxin congeners, the inlet sampling lines
and pulsed valve must be continuously heated above 250°C. Although many of the earlier valve
designs could not be heated much above 100°C due to the temperature limits of the sealing
materials, designs13,14 now exist for pulsed valves that can operate routinely at temperatures
Draft
19
above 400°C. These designs will form the basis for our design of a high-temperature pulsed
valve.
Figure 7. Schematic of the valve positioning system installed on the ion source vacuum housing. The
ion extraction optics are shown in the center of the lower chamber.
3.1.3 Tunable uv Laser
The laser system required for REMPI of dioxins must be capable of providing tunable,
narrow band radiation in the range between 220 and 350 nm. At present, the most reliable
Draft
20
method of generating this laser radiation is through the use of an optical parametric oscillator
(OPO) pumped by a Nd:YAG laser. Commercial Nd:YAG lasers are very well-developed,
stable, and reliable solid-state systems capable of delivering millions of pulses with minimal
maintenance. Modern OPOs are also relatively reliable and stable systems. They provide many
advantages over the tunable dye lasers they have replaced. OPOs are all solid-state devices that
are easily controlled by a computer. They use no consumables and can provide wavelength
scanning over a broad visible wavelength range, typically between 440 and 750 nm. Frequency
doubling in a nonlinear, solid-state crystal, provides the tunable uv radiation. Once they are
adjusted, OPOs require minimal maintenance and only occasional recalibration.
At the beginning of this project, SRI had available a Continuum Powerlite 9010 Nd:YAG
pump laser system. Using capital equipment funds, SRI purchased a Continuum Sunlite OPO.
The Powerlite was returned to the factory where it was upgraded to drive the new OPO. The
upgrade included replacement of the flashlamps and laser rods, installation of improved
electronics, and realignment. In addition, an intermediate optics housing located between the
Nd:YAG and the OPO was purchased for installation during the upgrade. This unit allows either
the fundamental or one of the harmonics to be diverted out of the laser and used independently of
the OPO.
Our Continuum Nd:YAG pump laser and new OPO were delivered at the end of February
1999, and the actual installation was performed at the beginning of March. The factory
refurbished pump laser and the OPO laser specifications are given in Table 2. All operating
parameters meet or exceed our requirements for using this system in the jet-REMPI experiments.
Measured output energies from the Sunlite OPO over the important wavelength range
from 680 nm to 460 nm averaged 45 mJ with the amplifier being pumped with 180 mJ of 355 nm
PERFORMANCE SPECIFICATIONS OF THE CONTINUUM LASER SYSTEM
Parameter Specification Actual
1064 nm pulse energy (unseeded) 2000 mJ > 2000 mJ
355 nm third harmonic energy 400 mJ 420 mJ
1064 nm pulse width 5-9 ns 8 ns
355 nm pulse width 3-7 ns 6.2 ns
1064 nm shot-to-shot stability ±2.5% ≤1%
355 nm shot-to-shot stability ±4.0% ±1.5%
Draft
21
As noted, tunable radiation in the ultraviolet region is required for REMPI of dioxins and
other aromatic hydrocarbon species. Generation of this uv radiation from the visible OPO output
was achieved by using an Inrad Autotracker II doubler. The Autotracker uses a feedback control
system and stepper motors to continuously adjust the alignment of its optical components during
wavelength scanning. The Autotracker II provides barely minimal performance when used with
the Continuum OPO. The high scanning rate of the OPO, which is necessary for fast time
response of the instrument, causes the Autotracker to become unstable and oscillate rather than
smoothly track the changing wavelength. The Autotracker was ultimately replaced with a
Continuum FX-1 doubler. The FX-1, described in Section 3.1.5, is designed to operate with the
OPO and provides significantly more stable operation.
3.1.4 Mass Spectrometer
A primary consideration in the choice of a mass spectrometric analysis technique is the
method of ion formation. For a REMPI-based CEM, the mass spectrometric method of choice is
time-of-flight (TOF). TOF is an inherently pulsed technique that matches well with the pulsed
laser ionization, and it offers the advantage of generating a complete mass spectrum from each
laser pulse.
The mass spectrometric requirements of a dioxin CEM instrument are modest: an upper
mass range of 400, with unit mass resolution. Typical TOF mass analyzers can meet these
requirements using a simple, linear flight path when combined with a short duration, pulsed
laser, ionization source. The low signal levels that may result from the use of a very narrow ion
formation pulse can be offset for by signal averaging over multiple laser pulses. To optimize this
mode of operation, a high repetition rate ionization laser would be desirable. Achieving high
mass resolution with a TOF instrument is straightforward, using a pulsed laser for ionization,
because of the narrow spatial, temporal, and energy spread of the nascent ions.
An increasingly common TOF approach is the use of an ion mirror, or reflectron-type
TOF. This device has many desirable properties and is the approach taken in our instrument.
Resolving powers (m/∆m) of more than 1000 can be readily obtained using a reflectron with a
pulsed laser ionization source. Although mass resolving powers in excess of 1000 are not
necessary to separate adjacent mass peaks even at the highest mass-to-charge ratios expected in a
dioxin CEM, high resolution gives rise to signals with much narrower, and hence much higher,
peaks. The increased peak amplitude leads directly to an increased signal-to-noise ratio.
A significant improvement in resolution and signal level can also be obtained through the
careful design of the ion extraction optics. As a result of the pulsed laser ionization scheme, ion
Draft
22
formation is constrained to occur over a very limited spatial region. Normally, a well-
constrained ion formation region can be readily coupled with high efficiency to a TOF mass
analyzer using simple ion extraction optics. In our instrument, however, an additional spatial
constraint is imposed by the use of a pulsed gas inlet. Pulsed valves can produce a supersonic
molecular beam as the gas expands and cools adiabatically. An optimum location downstream
from the orifice exists where the internal molecular temperature will have reached a minimum
while the local gas density remains high. Ionization at this location will yield the optimum
optical spectroscopic selectivity with maximum ion signal level. Because this optimum
ionization region will typically be only a few centimeters from the exit orifice, the ion optics
must be carefully designed to include the influence of the pulsed valve on the extraction fields.
We therefore undertook a detailed simulation of the ion extraction optics for the time-of-
flight mass spectrometer. A critical design parameter affecting the detection sensitivity of the
jet-REMPI scheme is the location of the exit of the pulsed nozzle relative to the ionization laser.
This distance influences the signal in two ways: (1) the large, grounded, valve body can distort
the ion extraction and focusing fields, and (2) the gas density and degree of internal cooling of
the supersonic expansion varies with position. Using the standard simulation program, SIMION,
we modeled all aspects of the ion extraction optics to determine an optimum initial configuration
of the key components. The results of these simulations were incorporated into the design of the
pulsed valve mount and ion extraction optics.
3.1.5 New Optical Frequency Doubler
In the early part of the Phase 2 effort, it became necessary to move the location of the jet-REMPI instrument. Because moving the instrument involves repositioning of the laser systemwhich necessitates optical realignment, we took the opportunity to install a commercial laser
table in place of the homemade table that had been used previously. The new table is a standardNewport 4’ x 8’ honeycombed table with predrilled holes for optical mounts. Because movingand remounting the laser system requires realignment by the manufacturer. This realignment
was done in conjunction with the installation of a Continuum FX-1 doubler system. The FX-1replaced the Inrad Autotracker system that had been used to convert the tunable visible output ofthe OPO into the required uv. Because the Inrad unit was not integrated into the OPO system, its
ability to track the wavelength tuning was poor, resulting in output instabilities. The FX-1 istotally integrated into the OPO system, eliminating these problems and significantly improvingthe output stability of the laser. The FX-1 was purchased as part of SRI’s EPA project on urban
air toxics, which shared the laser system with this effort.
Draft
23
3.1.6 New Control Program
A major thrust during the second phase was the development of new control and dataacquisition software. Although the existing software, written in Visual Basic 6.0, was sufficientfor most tasks, our planned improvements would have required considerable changes in the code.
For a variety of reasons, we concluded that National Instruments LabView offered a betterdevelopment platform. LabView is generally considered to be an industry standard forinstrument control and real-time data acquisition. The current version of our control program
was developed using LabView 6.0.
The baseline program functioned correctly, and was able to control the laser wavelength,acquire time-of-flight data from the digitizer, and display and store the resulting mass spectra.
Additional features were added to the software, specifically improved calibration methods. Thegeneral approach to automating the calibration is to provide the user with a list of possiblecalibrant species for which the software has predetermined wavelengths and expected masses.
Selection of the calibrant would then automatically sequence through the wavelengths, recordingand displaying the intensities of the expected masses. Repeating this data collection as afunction of calibrant concentration would yield a calibration curve.
Although the new control program functioned as expected, a potentially serious problemwas found associated with the averaging function. It was found that 100 laser shots at 10 Hz thatshould have required exactly 10 seconds, actually required 20 seconds to complete. The timing
problem was determined to be due to an automatic power down feature of the Signatec DA500Adigitizer. This feature, designed to prevent the board from overheating during prolonged use,had not been properly disabled during the 100 shot burst. Hence the digitizer periodically
reverted to a low power mode which introduced an additional 100 msec delay when the next scanwas triggered. Since the LabView driver that we have used to interface with the Signatec carddid not provide control over this feature, we implemented the necessary changes to the driver and
overcame this limitation. Data collection now occurs with no time overhead so that 100 lasershots at 10 Hz requires just 10 seconds.
3.1.7 Internal Temperature
The effective internal temperature of sample molecules in the supersonic jet is importantfor determining both sensitivity and selectivity of the jet-REMPI method. To determine theoptimum operating conditions for obtaining the lowest temperature in combination with the
maximum signal level, we performed two types of experiments. First, the sensitivity andtemperature distribution in the pulsed supersonic beam was measured as a function of the valveopening time. The opening time directly affects the collisional behavior in the supersonic beam,and to a lesser extent, the density distribution. The latter is expected to increase as the opening
time is increased, achieving a maximum value for opening times greater than the time required
Draft
24
for the pulsed valve to fully open. The second type of measurement determined the effect on
sensitivity and rotational temperature of the distance between the gated valve and the laser beam.This distance is important for allowing the collisional cooling to extract as much random thermalenergy from the molecular beam as possible. Benzene was used as a thermometric speciesowing to its well-established REMPI spectroscopy. In particular, the 1B2u ← 1A1g 6
10 band near
259 nm was studied. Band profiles were calculated as described below and fitted to the
measured spectra, allowing a determination of the temperature to an accuracy of approximately1ºK.
Band profiles require calculation of the individual relative line intensities, IKJ which are
given by
IKJ = C ν AKJ gKJ e-F(K,J)kT
where C is proportional to the Franck-Condon Factor (constant for a single vibration level), ν is
the photon frequency, AKJ is the line strength (given by the Hönl-London formulae for aperpendicular transition in a symmetric top), gKJ are the statistical weights of the lower state (for
molecule with D6 rotational symmetry), F(K,J) is the energy of the lower level, J is the totalangular momentum and K is the projection of J onto the figure axis of the symmetric top, bothfor the lower state. A complete band consists of P, Q, and R subbands corresponding to∆J=0,±1, with subband origins distributed along Fortrat parabolas corresponding to ∆K=±1.
Accurate band profiles require that Coriolis energies be included for the upper state.
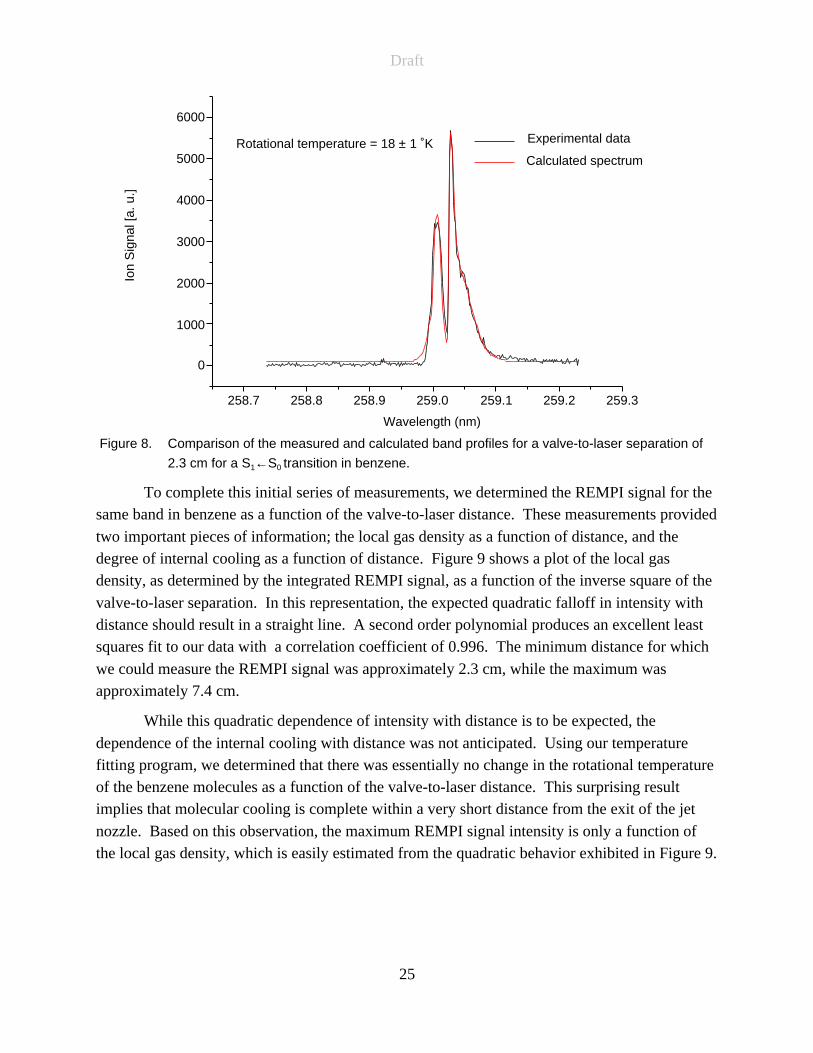
We chose benzene as the test molecule because its optical absorption spectrum is wellcharacterized. We made measurements of a single band contour for benzene, shown in Figure 8.This spectrum was taken at a distance of 2.3 cm from the nozzle following a delay from the
valve opening that provided the best ion intensity and cooling for this distance. The band shownis part of the lowest singlet-singlet transition (S1←S0) of benzene near 259 nm. This specific
transition has the spectroscopic identification 1B2u ← 1A1g 610 (l = ±1). The band shown
corresponds to many overlapping rotational lines. From the overall contour of these overlapping
lines, we can determine an effective rotational temperature of the benzene molecules.
To determine the temperature, we wrote a computer program to fit the simulated the formof the band contour as a function of temperature. This program used the most recent values for
the spectroscopic parameters for the transition13 and the appropriate statistical weights14. Theresult of this fitting program gives the best estimate of the rotational temperature of the benzenemolecules, which is 18±1 K for this measurement. The high quality of the calculated fit is
shown in Figure 8. This rotational temperature is very low, and indicates that our gas expansionis near optimum in terms of its cooling characteristics.
Draft
25
258.7
0
6000
Calculated spectrum
Ion
Sig
nal [
a. u
.]Experimental data
Wavelength (nm)
5000
4000
3000
2000
1000
258.8 258.9 259.0 259.1 259.2 259.3
Rotational temperature = 18 ± 1 ˚K
Figure 8. Comparison of the measured and calculated band profiles for a valve-to-laser separation of
2.3 cm for a S1←S0 transition in benzene.
To complete this initial series of measurements, we determined the REMPI signal for thesame band in benzene as a function of the valve-to-laser distance. These measurements provided
two important pieces of information; the local gas density as a function of distance, and thedegree of internal cooling as a function of distance. Figure 9 shows a plot of the local gasdensity, as determined by the integrated REMPI signal, as a function of the inverse square of the
valve-to-laser separation. In this representation, the expected quadratic falloff in intensity withdistance should result in a straight line. A second order polynomial produces an excellent leastsquares fit to our data with a correlation coefficient of 0.996. The minimum distance for which
we could measure the REMPI signal was approximately 2.3 cm, while the maximum wasapproximately 7.4 cm.
While this quadratic dependence of intensity with distance is to be expected, the
dependence of the internal cooling with distance was not anticipated. Using our temperaturefitting program, we determined that there was essentially no change in the rotational temperatureof the benzene molecules as a function of the valve-to-laser distance. This surprising resultimplies that molecular cooling is complete within a very short distance from the exit of the jet
nozzle. Based on this observation, the maximum REMPI signal intensity is only a function ofthe local gas density, which is easily estimated from the quadratic behavior exhibited in Figure 9.
Draft
26
0.00 0.05 0.10 0.15 0.20
0.0
0.5
1.0
1.5
2.0
2.5
3.0
Ion
Sig
nal [
a. u
.]
1/x2 [cm-2]
Distance 7.5 cm
Distance 2.3 cm
Least squares fitDensity ~ 1/x2
Figure 9. Variation of the jet-REMPI signal for benzene measured at 78 amu and a wavelength of
259.1 nm as a function of the laser-valve separation.
At the smallest valve-to-laser separation of 2.3 cm, the measured and calculated bandprofiles were shown in Figure 8. Figure 10 shows the corresponding results for the largest valve-
to-laser separation of 7.5 cm. The best fit rotational temperature for this data set was 18.5±1 ˚K.
The relative lack of a strong temperature dependence on the valve-to-laser separation isnot unexpected. At a separation of 2.3 cm, the benzene molecules are most likely already in a
collision-free regime, hence, no further reduction in temperature will occur. While the valve-to-laser separation does not influence the internal temperature of the beam, the 1/x2 drop in localdensity measured in Figure 9 confirms the importance of fixing the valve-to-laser separation at
the smallest value possible consistent with the mechanical constraints of the ion extraction opticsand the gas pumping.
The other key variable in optimizing the REMPI signal is the delay between the valve
pulse and the ionization laser pulse. To investigate the dependence of the benzene REMPI signalon this parameter, we made a series of band profile measurements while varying the delay time.The results are shown in Figure 11. The solid line in Figure 11 shows the variation in the signal
strength of the 78 amu benzene parent ions measured with a time delay of between 300 and 1100µs. As expected, the ion signal initially rises as the delay time increase, reflecting the increase in
Draft
27
258.7
0
6000
Calculated spectrum
Ion
Sig
nal [
a. u
.]
Experimental data
Wavelength (nm)
5000
4000
3000
2000
1000
258.8 258.9 259.0 259.1 259.2 259.3
Rotational temperature = 18.5 ± 1 ˚K
Figure 10. Comparison of the measured and calculated band profiles for a valve-to-laser separation of
7.5 cm for a S1← S0 transition in benzene.
gas density as the molecular beam forms and flows past the ionization region. As the delay timebecome longer than approximately 450 µs, the signal level begins to decrease as the bulk of thegas pulse has passed the laser beam.
Also shown in Figure 11 are the fitted rotational temperatures measured at a number oftime delays. Using only a simple vertical scaling of the two sets of data, we find that therotational temperature exactly follows the gas density variation. This indicates that the peak
density corresponds to the coolest neutral molecules. Presumably, this correspondence arisesbecause the cooling mechanism depends on intermolecular collisions, which will be mostprobable when the local gas density is at a maximum. That these two dependencies occur at a
common time delay greatly simplifies the optimization of the signal with respect to thisparameter.
3.1.8 New Ion Source Chamber
The original jet-REMPI laser ionization source chamber was designed to maximizeflexibility and versatility. It incorporated a precision translation stage to allow adjustment of thedistance between the exit of the pulsed nozzle and the laser ionization zone. While this
capability proved to be very useful in optimizing the performance of the system, it is nowpossible to fix this distance at an optimum valve and hence we can eliminate the translation stageand simplify the instrument. Elimination of the translation stage involved fabrication of a new
Draft
28
Density distribution
Temperature
200 400 600 800 1000 1200
0
50
100
150Io
n S
igna
l [a.
u.]
Valve Trigger to Laser Delay [µs]
80
60
40
20
Rot
atio
nal T
empe
ratu
re [˚
K]
Figure 11. Variation of the jet-REMPI density distribution (signal level) for benzene measured at 78 amu
and a wavelength of 259.1 nm as a function of the delay between the valve trigger and the
laser pulse. The corresponding rotational temperature as determined by fitting the band
profiles is also shown.
source chamber. A cross sectional drawings of the new chamber is shown in Figure 12. Note
that a new valve assembly, described in detail below, is positioned at a fixed distance from thelaser beam. The outer body of the vacuum chamber was modified to move the valve as close aspossible to the ion extraction optics without inducing an appreciable distortion in the electric
field potentials required for extraction and acceleration of the ions. This design also providesmaximum pumping in the pulsed gas jet region, which is important in maintaining a low pressurein the ion source region.
The new chamber also allows us to overcome an operational problem associated with theuse of a single pulsed valve. With a single pulsed valve, it is not possible to perform any routinemaintenance without venting the entire apparatus to atmosphere. Replacement of the sealing
poppet is a typical example of an operation requiring considerably longer to complete becausethe vacuum system must be vented and re-evacuated. In addition, we have found that it isdifficult to remove residual traces of many of the sample compounds that we have been studying.
These compounds tend to have low vapor pressures and adhere to surfaces within thepulsed valve. Even with prolonged heating, we are able to detect minute traces of samples thathave nominally been removed from the inlet. This is of course a result of the exceptional
sensitivity of the instrument.
Draft
29
Turbomolecularpump
TOFFlighttube
Ion extraction
optics
Four valve
assembly
Laserbeam
Figure 12. Schematic of the new ion source vacuum chamber including the sliding four-valve assembly.
3.1.9 4-Valve Inlet Assembly
To circumvent the above described shortcomings of the original pulsed valve design, wedesigned a new valve assembly that incorporates four pulsed valves on a sliding mount. The
Draft
30
new source chamber was fabricated to accept this assembly in place of the single pulsed valve.
The sliding valve mount, shown in Figure 13, was designed to allow any of the four valves to bepositioned over the ionization region without loss of vacuum. This capability permited us to (1)remove any of the inactive valves for servicing without vacuum loss, (2) rapidly switch from a
valve with residual sample contamination to a clean valve, and (3) quickly investigate the effectof varying the nozzle diameter on sensitivity.
Figure 14 shows the configuration of the four valve assembly. This unit was custom
fabricated for SRI by General Valve based on our design. It incorporates four standard series 9valves in a sliding base block. Figure 14 shows a cross section of the base and one of the valves.
Heating of the pulsed valves is very important, especially when dealing with the more
highly chlorinated dioxins. Experience has shown that temperatures of at least 200 deg C arerequired to avoid unacceptable sample loss due to condensation. To achieve this temperature, wehave designed and fabricated a large copper heater block that surrounds all four valves. The
block extends from the sliding base to a point just below the Swagelok® fitting on the top of thevalves. This block has four, 0.25” diameter channels drilled through its length to accommodatefour, 200-Watt cartridge heaters. In addition, the sliding base has four, 0.125” diameter channels
drilled through its length to accommodate four, 50-Watt cartridge heaters. These two sets ofheaters will be independently controlled to maintain the valves at an elevated temperature. Thisseparation in control zones was necessary because of the relatively large thermal mass of the
latter components as compared with the former components.
3.1.10 New Jet-REMPI TOFMS
While fabricating a new jet-REMPI system for delivery to the US EPA, we
simultaneously assembled a duplicate TOFMS for use on this project, as well as our EPA HAPseffort. The majority of the components were purchased using SRI internal funds. We completedassembly and testing of a new jet-REMPI system during the second phase of our project. The
internal ion optics of this new system were initially the same as our functioning system,however, provisions have been made to implement the slit nozzle in the near future. Pumpingfor the new instrument includes a 550 l/sec turbomolecular pump for the source region, and a
smaller, 250 l/sec turbomolecular pump for the flight tube. This system, assembled usingsupport from SRI, will be used to measure the spectroscopic signatures and detection limits oftarget compounds. This instrument makes use of the new ion source vacuum chamber and four-
valve assembly described above. These modifications, along with the larger vacuum pump, willsimplify testing of the slit nozzle and rapid switching between varying sample streams.
Draft
31
Figure 13. Configuration of the custom-fabricated, four-valve assembly.
Figure 14. Cross sectional view of one valve and the base plate of the four-valve assembly.
Draft
32
The new system can be used either with the same laser system as the existing jet-REMPI
instrument, or it can be easily moved to another laboratory where a similar laser system isavailable for occasional use. Access to the second laser system provides an opportunity tosimultaneously perform two different experiments using the two mass spectrometer systems. A
photograph of the new TOFMS and existing laser system is shown in Figure 15.
Figure 15. Photograph of the new TOFMS and existing laser system at SRI.
3.1.11 Two-Color REMPI
Most of the data shown in this report were recorded using the two-photon, one-color
REMPI scheme where only the first photon is resonantly absorbed and the wavelength of the
second photon is not important so long as it excites the molecule above the threshold for
ionization. This scheme is possible only so long as the resonantly excited level lies at an energy
of at least half of the ionization potential (IP). If the S0→S1 transition energy is less than IP/2,
then either a third photon will be required for ionization, or a second photon of higher energy is
Draft
33
needed. Although three-photon REMPI is possible, it is less efficient than the two-photon
scheme.
Figure 16 shows the variation in the S0→S1 transition energy for some dioxin congeners
as a function of their degree of chlorination. Although data are not available for most of thehighly chlorinated dioxin congeners, estimates have been made based on conventional uv
absorption spectra. A monotonic decrease in the transition energy with chlorination is predicted.
Also shown in Figure 16 is the monotonic increase in IP/2 as a function of chlorination. For
congeners that lie to the left of the crossing point of these two parameters, the one-color REMPI
scheme can be used. This has been experimentally verified at least through the
dichlorodibenzodioxin congener. Interestingly, the important tetrachloro-substituted dioxins lie
very near the crossing point, and the applicability of the one-color REMPI scheme is uncertain.
It is clear, however, that for more highly chlorinated congeners, a two-color scheme will be
required.
In preparation for two-color REMPI studies, we assembled the necessary opticalcomponents to generate a second, fixed wavelength, of 266 nm. Figure 17 shows the optical
schematic of our modified laser system. Note that the tunable wavelength portion of the systemremains essentially unchanged from the previously used configuration. The additional laserpulse at 266 nm is generated by doubling the excess 532 nm second harmonic of the Nd:YAG
fundamental. This second wavelength pulse overlaps the tunable pulse spatially within the ionsource; however, it is temporally delayed by ~5 ns. Although the delay is adjustable, 5 ns is areasonable starting value. The delay must be long enough to allow molecules in resonance with
the tunable light to be excited before being ionized by the 266 nm photon, yet not so long thatthey are either lost from the ionization region or the molecule returns to the ground state.
The additional laser pulse at 266 nm is generated by doubling the excess 532 nm second
harmonic of the Nd:YAG fundamental. This second wavelength pulse overlaps the tunable pulsespatially within the ion source; however, it is temporally delayed by ~5 ns. Although the delay isadjustable, 5 ns is a reasonable starting value. The delay must be long enough to allow
molecules in resonance with the tunable light to be excited before being ionized by the 266 nmphoton, yet not so long that they are either lost from the ionization region or the molecule returnsto the ground state.
3.2 REMPI SPECTRA AND CALIBRATION METHODS
The initial test experiments designed to verify operation of the jet-REMPI systemconsisted of placing a small amount of liquid 2,5-dichlorotoluene into the inlet line of the pulsedvalve. The room temperature vapor pressure of 2,5-dichlorotoluene is high enough that no
Draft
34
0 1 2 3 4 5 6 7 8
3.8
3.9
4.0
4.1
4.2
one color limit (= IP/2)
Ene
rgy
[eV
]
Number of Chlorine Substitutents
S0 → S1 excitation
Figure 16. Variation of the S0 → S1 excitation energy (o) as a function of chlorination for dibenzodioxins.
Also shown is the one-color, two-photon ionization limit (n) corresponding to one half of the
ionization potential. The S0→S1 excitation energy for the tetrachlorinated dibenzodioxin is
estimated from conventional uv absorption spectroscopy.
heating was required to generate a sample. Unfiltered room air was used as a carrier gas in these
experiments. Voltages on the TOFMS were initially adjusted according to the SIMION
calculations, and the laser was tuned to a wavelength of 279.6 nm where strong REMPI
absorption was expected. Within a short time, a mass spectrometric signal corresponding to the
parent ion at 160 atomic mass units (amu) was observed. Some additional adjustments in the
TOFMS voltages were made along with adjustments in the pulsed valve parameters and the
delay time between the sample injection and the laser trigger.
We quickly found that the signal levels were too strong, causing nonlinear effects and
saturation of the detection electronics. The signal levels were reduced by using a combination of
reduced gain on the multichannel plate detector and by attenuating the laser intensity.
3.2.1 Initial Test Spectra
The initial mass spectrum measured for 2,5-dichlorotoluene showed very good mass
resolution in excess of 500 (m/∆m), and the chlorine isotopic peaks were easily resolved, as
shown in Figure 18. In addition, no significant fragmentation was observed, and no extraneous
background peaks were present. In this mass spectrum, the three major isotopic peaks at m/z
160, 162, and 164, corresponding to 35Cl35Cl, 35Cl37Cl, and 37Cl37Cl, respectively, are in the ratio
of 100:66.7:10.4. While these ratios are very close to the expected values of 100:65.0:10.6, the
minor discrepancies are actually the result of the very high wavelength resolution of our
instrument and the slight shift in resonance energy associated with the 1% mass difference
among the different isotopic species. Thus, a wavelength of 279.6 nm will be in exact resonance
with the molecules containing 35Cl35Cl, slightly off resonance with the molecules containing35Cl37Cl, and even further off resonance with the 37Cl37Cl species.
A wavelength scan was performed for 2,5-dichlorotoluene between 260 and 285 nm. The
resulting REMPI signal at m/z 160 is shown in Figure 19. This preliminary jet-REMPI data
indicated that the molecules had not achieved the desired degree of internal cooling. This was
manifested as wider than expected peaks in the wavelength dependant scan of the parent mass
ions shown in Figure 19. While the wavelength dependence had the expected peaks at the
correct locations, the peak widths were considerably larger (50%) than expected from previously
published results on the same molecule. Two possible factors can lead to the observed peak
broadening: a wider than expected laser linewidth, or target molecules that have retained
excessive internal energy as a result of insufficient cooling in the gas expansion. Since the
Nd:YAG-OPO system was operating optimally with a linewidth on the order of 0.04 cm-1, the
most obvious source of peak broadening was due to a lack of gas cooling in the jet.
Draft
36
00 20 40 60 80 100 120 140 160 180 200
10
20
30
40
50
60
70Io
n S
igna
l (ar
b. u
nits
)
Mass (amu)
155 157 159 161 163 165 167 169
Figure 18. Mass spectrum recorded for jet-REMPI detection of 2,5-dichlorotoluene at a wavelength of
279.6 nm. The inset shows an expanded region about the parent ion peaks. The chlorine
isotope peaks are clearly resolved.
258 262 266 278 282 286270 274
Wavelength (nm)
0
10
20
30
40
50
Ion
Sig
nal (
arb.
uni
ts)
Figure 19. Wavelength dependence of the m/z 160 ion signal for jet-REMPI detection of 2,5-
dichlorotoluene.
Molecules that have undergone a free-jet expansion will not exhibit the expected degree
of internal cooling if they have undergone either too few collisions during the expansion or too
Draft
37
many collisions after the expansion. Given our operating conditions, the valve timing
parameters, and system pressures, it was apparent that the most reasonable explanation was too
many collisions. Also, during our testing, first one and then the second of our 250 L/s
turbomolecular pumps failed. The pump on the flight tube region was temporarily replaced with
a 170 L/s pump, while the source chamber pump was temporarily replaced with a 330 L/s
turbomolecular pump.
With this configuration, we observed a slight narrowing of the absorption peaks, but still
not to the degree expected. We did, however, observe that the pressure differential between the
source (ionization) chamber and the flight tube was only a factor of 3, indicating that too much
of the sample gas load was entering the flight tube, rather than being retained and removed in the
source chamber. This observation led to a change in the way we isolated the two vacuum
regions. Specifically, we incorporated a cylindrical metal can that enclosed the ion extraction
optics. This isolation can was sealed to the ion lenses, using a closely fitting Teflon ring.
Later tests showed a slightly improved vacuum isolation; however, the relatively large
(1.27-cm-diameter) aperture in the ion extraction plate still provided too much gas conductance.
Because the ion beam at this position is expected to be a few millimeter in diameter, this aperture
size was reduced to 0.63 cm in diameter. The combination of enclosing the ion optics with the
smaller extraction aperture produced more than an order of magnitude reduction in the pressure
differential between the two chambers. Under these conditions, we again measured the
wavelength dependence for detection of 2,5-dichlorotoluene and found the peaks to be as narrow
as previously reported, indicating that the desired degree of molecular cooling had been
achieved.
The desired cooling effect was verified by measuring the wavelength dependence for
both 1,2-dichlorobenzene and monochlorobenzene. Both molecules exhibited very narrow
resonance absorption peaks. These results are shown in Figures 20 and 21, respectively.
Figure 22 shows the mass spectrum measured for the jet-REMPI detection of 1,2-
dichlorobenzene at a wavelength of 261.2 nm. Again, only the parent ion signals, including
isotopic chlorine, are observed. Similarly, Figure 23 displays the mass spectrum measured for
the jet-REMPI detection of monochlorobenzene at a wavelength of 266.0 nm.
Draft
38
50
150
250
350
450
550
650
750
850
260 261 262 263 264 265 266 267 268
Ion
Sig
nal (
arb.
units
)
Wavelength (nm)
Figure 20. Wavelength dependence of the m/z 146 ion signal for the jet-REMPI detection of 1,2-
dichlorobenzene.
0.05
0.15
0.25
0.35
0.45
0.55
265 267 269 271 273 275 277 279 281
Ion
Sig
nal (
arb.
uni
ts)
Wavelength (nm)
Figure 21. Wavelength dependence of the m/z 112 ion signal for the jet-REMPI detection of
monochlorobenzene.
Draft
39
0
1000
2000
3000
4000
5000
6000
140 142 144 146 148 150 152 154 156
Ion
Sig
nal (
arb.
uni
ts)
Mass (amu)
Figure 22. Mass spectrum recorded for jet-REMPI detection of 1,2-dichlorobenzene at wavelength of
261.2 nm.
0
1000
2000
3000
4000
5000
6000
108 110 112 114 116 118 120 122
Ion
Sig
nal (
arb.
uni
ts)
Mass (amu)
Figure 23. Mass spectrum recorded for jet-REMPI detection of monochlorobenzene at wavelength of
266.0 nm.
Draft
40
Following the source modifications described above, the jet-REMPI instrument appeared
to provide the expected degree of both optical resolution and mass resolution. These studies
clearly indicate the importance of maintaining the optimum vacuum conditions within the
ionization and ion extraction regions. They also indicate that the 250 L/s turbomolecular pump
used initially on the source region was too small to adequately handle the gas load from the
pulsed nozzle, especially for opening times of 200 µs or greater. Fortunately, larger pumps are
readily available and can easily be incorporated into the system without any modifications.
Larger pumps will become more important when the new valve is used due to the higher gas
flow.
Our first tests showed that the smaller aperture in the ion extract electrode produced the
desired reduction in the pressure differential between the ionization and detection chambers. We
also found that the wavelength dependence for detection of 2,5-dichlorotoluene showed peaks
that were as narrow as previously reported. This verified that the desired degree of molecular
cooling had been achieved. However, it remained to verify that the signal levels (and hence, the
sensitivity) of the instrument had not been adversely affected by the smaller aperture.
We therefore measured the signal levels for both 1,2-dichlorobenzene, and
monochlorobenzene. With some minor adjustment of the ion optical potentials, we found the
signal levels to be essentially the same as those previously measured with the larger aperture.
This finding is consistent with our expectation that the ion beam is smaller in diameter than the
0.63-cm aperture.
During this work, which involved the use of 1,2-dichlorobenzene as the sample gas, we
observed the expected, but very small, isotope shift in the peak optical absorption wavelength
due to 37Cl relative to 35Cl. This effect was observed by changing the OPO wavelength by
0.005 nm and observing that the ion signal associated with the 35Cl35Cl-C6H4 decreased while the
corresponding signal from the 37Cl37Cl-C6H4 increased. Our ability to observe this effect
confirms several experimental factors. The OPO wavelength is very stable and reproducible, and
the sample molecules have achieved a high degree of internal cooling, allowing for very narrow
absorption features.
3.2.2 Lowly Chlorinated Dioxins
Following our preliminary experiments on chlorinated benzene and toluene that
established the operational ability of our instrument, we began an initial survey of the jet-REMPI
spectra for simple, lowly chlorinated dioxins. Three congeners were examined in pure vapor
form: 2-monochlorodibenzodioxin, 2,7-dichlorodibenzodioxin, and 2,8-dichlorodibenzodioxin.
Draft
41
REMPI spectra for each of these compounds have been reported previously by others. We also
studied, a mixture of the 2,7-dichlorodibenzodioxin, and 2,8-dichlorodibenzodioxin congeners.
This is the first time that a mixture of these two closely related dioxin congeners has been
measured using jet-REMPI.
Figures 24 through 26 show the measured jet-REMPI wavelength dependence for the
three dioxin congeners studied in pure vapor form. For each congener, note that the ion signal
shows numerous, narrow, absorption peaks corresponding to resonant excitation of different ro-
vibrational levels in the ground electronic state of each molecule. Furthermore, there is no
background ion signal measured at off-resonance wavelengths. For each congener, the
corresponding mass spectrum shows only the expected parent ion peaks, including the chlorine
isotopic peaks.
0
1
2
3
4
5
300 301 302 303 304 305 306 307
Ion
Sig
nal (
arb.
uni
ts)
Wavelength (nm)
Figure 24. Wavelength dependence of the m/z 218 ion signal for the jet-REMPI detection of 2-
monochlorodibenzodioxin.
Draft
42
0
1
2
3
302 303 304 305 306
Ion
Sig
nal (
arb.
uni
ts)
Wavelength (nm)
Figure 25. Wavelength dependence of the m/z 252 ion signal for jet-REMPI detection of 2,7-
dichlorodibenzodioxin.
0
1
2
3
4
302 303 304 305 306
Ion
Sig
nal (
arb.
uni
ts)
Wavelength (nm)
Figure 26. Wavelength dependence of the m/z 252 ion signal for jet-REMPI detection of 2,8-
dichlorodibenzodioxin.
Draft
43
Of particular interest and importance are the data shown in Figure 27. Here, the sample
consisted of an equimolar mixture of the 2,7- and 2,8-dichlorodibenzodioxin congeners. Several
absorption peaks corresponding to each of the congeners have been noted to show that many
wavelengths are available for separately detecting these two closely related congeners in a
mixture. The mixture data in Figure 27 are essentially the algebraic sum of the wavelength scans
for the separate component shown in Figures 25 and 26. Although it has always been presumed
that such selective detection of closely related congeners was possible using this method, this is
the first clear demonstration.
3.2.3 Other REMPI Spectra
During the course of Phase 2, we measured the wavelength-dependent REMPI spectra of
a number of important HAPs that are likely present in most incinerator exhaust streams. Two
examples are shown in Figures 28 and 29. Figure 28 shows the wavelength dependence for the
jet-REMPI detection of p-xylene, while Figure 29 shows the corresponding data for phenol.
As part of our development of a rapid calibration method, our new data acquisitionsoftware is capable of recording the full mass spectrum as the wavelength is varied. The resultof this can be viewed as a three-dimensional, false-color map showing the ion intensity (color) as
a function of the mass (y-axis) and wavelength (x-axis). An example of this type of map isshown in Figure 30. Here, a mixture of benzene (78 amu), toluene (92 amu), and chlorobenzene
0
1
2
3
4
5
301.5 302.5 303.5 304.5 305.5 306.5
Ion
Sig
nal (
arb
units
)
Wavelength (nm)
2,8 DCDD
2,8 DCDD
2,7 DCDD
2,7 DCDD
2,7 DCDD
2,7 DCDD
Figure 27. Wavelength dependence of the ion signal at m/z 252 for the jet-REMPI detection of a mixture
of 2,7-dichlorodibenzodioxin and 2,8-dichlorodibenzodioxin.
Draft
44
0
5
10
15
20Io
n S
igna
l [a.
u.]
Wavelength [nm]
p-xylene
250 255 260 265 270 275 280
Figure 28. REMPI excitation spectrum for p-xylene.
245 250 255 260 265 270 275 280 285
Wavelength [nm]
1400
1200
1000
800
600
400
200
0
Ion
sign
al [a
.u.]
Phenol
Figure 29. REMPI excitation spectrum for phenol.
(112 amu) diluted in room air was used as the sample. It is apparent from Figure 30 that each
compound only gives rise to a single parent ion signal, however, that ion signal appears at anumber of wavelengths. By taking a cut in the vertical direction at a fixed wavelength, youwould produce a mass spectrum showing what ion signals you would expect if all of these
compounds were present in the sample stream; that is, a chemical interference spectrum.
Draft
45
By taking the corresponding horizontal cut through the data at a fixed mass, you would
obtain the normal REMPI excitation spectra, such as those shown in Figures 28 and 29. It mustbe noted that the results shown in Figure 30 are preliminary in nature and included here only todemonstrate the type of data visualization display that is being developed.
As an example, Figure 31 shows three horizontal cuts in the data from Figure 30, one ateach of the three primary mass peaks. As expected, we easily recover the REMPI excitationspectra for the individual compounds even though only one set of data was recorded.
Two additional test compounds were investigated, aniline, and o-toluidine. Bothcompounds are known to yield sharp, well-defined REMPI spectra. By measuring these spectra,we can simultaneously verify the wavelength dependence, the absorption linewidths, the absolute
mass calibration, and the mass resolution. The spectra that were measured for each compoundare shown in Figures 32 and 33. These spectra were indistinguishable from those that wepreviously measured with the older instrument, as well as spectra reported in the literature
measured under comparable conditions.
Figure 30. False color map showing the intensity (color) measured as a function of wavelength and
mass for a mixture of benzene (78 amu), toluene (92 amu), and chlorobenzene (112 amu).
Draft
46
5
10
15
20
25
30
35
40
45
Ion
Sig
nal [
a. u
.]
Wavelength [nm]
Benzene: 78 amu
Toluene: 92 amu
Chlorobenzene: 112 amu
256 258 260 262 264 266 268 270 272 274
Figure 31. REMPI excitation spectra for benzene, toluene, and chlorobenzene derived from the three-
dimensional map in Figure 30.
280 282 284 286 288 290 292 294 296
0
5
10
15
20
25
30
Wavelength spectrum of AnilineMass m = 93 amu is monitored
Ion Signal [a. u.]
Wavelength [nm]
Figure 32. Wavelength dependence for the REMPI ionization of aniline.
Draft
47
294 295 296 297 298 299 300 301 302 303 304 305
0
5
10
15
20Wavelength spectrum of o- toluidineMass m = 107 amu is monitored
Ion Signal [a. u.]
Wavelength [nm]
Figure 33. Wavelength dependence for the REMPI ionization of o-toluidine.
Based on the results obtained with the new mass spectrometer, we investigated theREMPI spectra of the unchlorinated dibenzodioxin. Our wavelength scan is shown in Figure 34.
290 292 294 296 298 300-20
0
20
40
60
80
100
120
140
Ion Signal [a. u.]
Wavelength [nm]
Figure 34. Wavelength dependence for the REMPI ionization of dibenzodioxin.
Although the spectra measured using the new mass spectrometer system, including
aniline, o-toluidine, and unchlorinated dibenzodioxin, shown in Figures 32, 33, and 34,
Draft
48
respectively, were essentially the same as we previously had measured with the older instrument,
we soon found that for even lowly chlorinated compounds with moderate vapor pressures, theREMPI spectra were much broader than expected. The apparent cause for this poor opticalresolution was insufficient thermal cooling in the jet expansion. We had previously observed
similar effects when using the original ion extraction configuration as supplied by R. M. Jordan.Since the new spectrometer incorporated the standard Jordan source, we concluded that the smallspacing between the repeller and extraction electrodes was responsible for disrupting the free-jet
expansion and thereby preventing sufficient collisional cooling. To quickly overcome thisproblem, we removed the ion source from our older spectrometer that had been modified toincrease the electrode spacing, and installed it in our new spectrometer. We then verified that
full molecular cooling was achieved.
As a test molecule, we examined the REMPI absorption spectrum of 2-monochlorodibenzofuran (2-MCF). This species had not previously been studied by REMPI.
Figure 35 shows the jet-REMPI signal recorded for the parent (35Cl) ion at m/z 202 as a functionof the wavelength for a one-color, two-photon ionization process. The wavelength dependenceshows numerous, well-resolved, absorption features. We noted, however, that both he relativelylow signal level and the lack of an apparent S0→S1 band origin at long wavelengths might
indicate that a two-color scheme would yield more sensitivity. We have made a very preliminary
test of this by combining a tunable photon with a fixed 266 nm photon, and indeed we see anenhanced signal.
Io
n S
igna
l [a.
u.]
Wavelength (nm)
299 300 301 302 303
0
5
10
15
20
25
30
35
Figure 35. Wavelength dependence for the REMPI ionization of 2-monochlorodibenzofuran.
Draft
49
3.2.4 Two-Color REMPI Spectra
To demonstrate the two-color approach, we again examined the jet-REMPI wavelengthdependence for 1,2-dichlorobenzene. Figure 36 shows the m/z 146 ion signal measured using acombination of tunable uv from the OPO and 266 nm produced by quadrupling the Nd:YAG
fundamental. Since 1,2-dichlorobenzene can also be ionized by the one-color, two-photonscheme, we have shown that ion signal in Figure 36 as well.
Note that the large absorption peak at 272.61 nm appears using both ionization schemes.
However, the absorption peak at 273.58 nm appears only in the two-color signal. This featurearises from the absorption of one photon that is resonant with vibrationally excited ground statemolecules, followed by absorption of a 266 nm photon to produce ionization. Because the
absorption of a second photon at 273.58 nm cannot ionize 1,2-dichlorobenzene, this feature doesnot appear in the one-color REMPI spectrum. As shown in Figure 36, the threshold for the one-color, two-photon process is approximately 273 nm.
Some effort was also expended to improve the optics for performing two-color REMPIexperiments. In particular, the original proof of concept two-color experiments used a tunable uvphoton in the 273 nm range combined with the fixed, 4th harmonic of the Nd:YAG at 266 nm.
Although we will initially retain this overall configuration, the new optics will improve both the
0
0.1
0.2
0.3
0.4
0.5
272 272.5 273 273.5 274
Ion
Sig
nal (
arb
units
)
Wavelength (nm)
one-color, two-photonREMPI threshold
one-color
two-color
Figure 36. Wavelength dependence of the ion signal at m/z 146 for the jet-REMPI detection of 1,2-
dichlorobenzene. The lower trace was recorded using a one-color, two-photon, REMPI scheme.
The upper trace was recorded using a two-color, two-photon REMPI scheme where the second color
was at a fixed wavelength of 266 nm.
Draft
50
ease of performing two-color experiments and the sensitivity of the method resulting form
improved stability and overlap of the tow laser beams within the ionization volume. We are alsoconsidering implementation of a 5th harmonic generator to yield a fixed, 213 nm beam. Theincreased energy of the second photon will make possible the detection of wider range of
compounds than is possible using the 266 nm color.
The REMPI absorption spectrum of 2-monochlorodibenzofuran (2-MCF) signal recordedfor the parent (35Cl) ion at m/z 202 as a function of the wavelength for a one-color, two-photon
ionization process showed numerous, well-resolved, absorption features (Figure 35). We noted,however, that both the relatively low signal level and the lack of an apparent S0→S1 band origin
at long wavelengths might indicate that a two-color scheme would yield more sensitivity. Wemade a very preliminary test of this by combining a tunable photon with a fixed 266 nm photon,and indeed we see an enhanced signal.
We extended these two-color measurements which have verified and quantified theimprovement. Figure 37 shows the measured REMPI signal for the parent ion (m/z 202) usingdifferent excitation/ionization schemes. Initially, only the fixed wavelength at 266 nm was used.
With a energy of 0.2 mJ, no REMPI signal was measured, as expected. After several minutes,0.5 mJ of tunable light at 300.41 nm was added, resulting in an immediate increase in the signal.This signal remained constant for many minutes until the 266 nm fixed wavelength laser was
blocked. Although the tunable laser at 300.41 remained on resonance, the REMPI signaldeceased by a factor of ten. Finally, the OPO was detuned from resonance where 0.5 mJ at 300.3nm again produced no measurable signal.
0 500 1500 25001000 2000
Time (sec)
Ion
Sign
al (a
.u.)
-2
0
2
4
6
8
10
12
14
0.2 mJ @ 266 nm
0.5 mJ @ 300.41 nm+
0.2 mJ @ 266 nm
0.5 mJ @ 300.41 nm
0.5 mJ @ 300.3 nm(off resonance)
Figure 37. Dependence of the REMPI ionization signal for 2-monochlorodibenzofuran using different
excitation schemes.
Draft
51
It should be noted that the relatively large fluctuations in the two-color signal were due to
variations in the energy of the 266 nm light. These variations were in turn caused by the lack oftemperature stability of the externally mounted doubling crystal. A thermostated enclosure wasadded to the crystal, and these fluctuations have been greatly reduced by maintaining it at
35 deg C.
3.2.5 Calibration Methods
Before jet-REMPI can be used as a CEM, a variety of field calibration methods must be
developed. Three types of instrumental calibration is needed, one for each of the three keyparameters; intensity, mass, and wavelength. Intensity calibration will require development of astandardized vapor delivery system capable of introducing a know, reproducible, concentration
of a calibrant into the inlet.
Calibration of the mass and wavelength can actually be accomplished simultaneouslythrough the appropriate choice of a target molecule. As an example of how this might be
accomplished, we have chosen perdeuterobenzene (C6D6) as a test molecule. While benzene anddeuterobenzene (C6H5D) will be present in most incinerator sample streams, perdeuterobenzenewill never occur naturally. Moreover, there are no commonly occurring interferents at mass 84.
Figure 38 shows the REMPI excitation spectrum for a 1:1 mixture of benzene andperdeuterobenzene. Note that over this narrow wavelength scan, each molecule exhibits onlytwo, narrow, absorption features.
The perdeuterobenzene features are the same magnitude as the undeuterated molecule,and each is shifted by a fixed amount. Because the perdeuterobenzene features are so narrow,they can readily be used to check the wavelength calibration of the OPO. At the same time, a
narrow wavelength can will provide two independent mass peaks (78 and 84 amu) that can beused to verify the time-to-mass conversion factors. In principle, it is better to have two or masspeaks with a larger mass separation, however, for a periodic check of the mass calibration, this
approach may be adequate. Of course, other, higher molecular weight compounds can be addedto the calibration mixture to accomplish this.
Draft
52
Figure 38. REMPI excitation spectra for a 1:1 mixture of benzene (78 amu) and perdeuterobenzene (84
amu) recorded simultaneously as a function of REMPI excitation wavelength.
3.2.6 Off-line Sampling
An important aspect of the dioxin CEM development effort is the sampling. Whiledevelopment of a sampling system was originally part of our planned effort, a number of factors
have led us to reduce the level of effort devoted to this aspect of the work. Among the factors isthe continuing uncertainty of the role of particulates in dioxin monitoring, the ongoingsampler/preconcentrator development efforts in Dr. Brian Gullett’s laboratory at EPA, and the
corresponding sampler work being pursed at MSE and DIAL.
As part of SRI’s ongoing EPA effort to apply jet-REMPI to characterization of urban airpollutants, it was essential that an external sampling method be developed so that preliminary
laboratory studies of the typical composition and concentrations of HAPs in urban air could beconducted prior to planning any field studies. Although that effort was not directly associatedwith the dioxin CEM project, the experience and results are sufficiently relevant that they are
included here.
As a first approach, we used standard charcoal sorbent tubes connected to portable airmetering pumps. By operating the pumps at a calibrated air flow for selected periods of time, we
could sample known volumes of air. The sorbent tubes were then returned to the laboratory andthe adsorbed organic compounds recovered using conventional solvent extraction methods.Because we needed to perform a chemical survey before applying jet-REMPI, we analyzed the
extracted samples using GC-MS. Once a set of target compounds had been identified by GC-
Draft
53
MS, the same sample was examined using jet-REMPI to confirm their presence and ascertain the
signal levels available from our instrument.
The sampling method can be summarized as follows:(1) Open hermetically sealed carbon filter element (CFE) and insert in
sample pump inlet tube;(2) Calibrate flow using a Buck flow meter(3) Start sample pump and mark time
(4) At end of desired time duration, stop pump(5) Remove CFE from pump inlet hose and cap open ends of CFE(6) If at remote site, place capped CFE in cooler with icepack
The laboratory extraction procedure can be summarized as follows:(1) Break open main sample volume of CFE.(2) Pour filter carbon into sample vial
(3) Cap sample vial and label(4) Repeat for breakthrough volume of CFE(5) Add 1.0ml of CS2 to sample vial
(6) Wait minimum of 30 min
The GC/MS analysis procedure can be summarized as follows:(1) At beginning of day, run GC-MS calibration
(2) Run previously developed method “CS2MIX”(3) Inject 2.0µl of sample into GC/MS inlet
(4) After GC/MS run, analyze spectrum with NIST MS search(5) At end of day, run bake column
The Jet-REMPI analysis procedure can be summarized as follows:
(1) Warm-up laser system(2) Calibrate system, see note below(3) Evacuate heated inlet sample flask(4) Inject 10µl of sample into flask
(5) Select wavelength and mass
(6) Adjust gain(7) Select filename and set beginning and ending wavelengths(8) Plot and examine final REMPI data
Note that we created a calibration mix to check and adjust the wavelength ranges andmass calibrations. This was used in the beginning to set up the data acquisition software and
occasionally to verify that the setup was still in spec.
Draft
54
To test this sampling and analysis approach, we took samples were taken from open
containers, gasoline tank headspace, automobile exhaust, and ambient air. In ambient air, wecollected samples on a CFE for 3.5 hours, to obtain enough sample to use GC/MS as a surveytool. Only toluene shows in the GC/MS scan as a small signal. To use jet-REMPI, we diluted
the sample by a factor of 20,000 to avoid overloading the instrument. This dilution is equivalentto a direct measurement with a sampling time of about 1 sec. All of the BTEX (benzene,toluene, ethyl benzene, and the xylenes) compounds were readily seen in the jet-REMPI
instrument, and the three isomers of xylene can be individually quantified. Our preliminarystudy showed that not only can many urban air pollutants, such as BETX, can be detectedquantitatively using jet-REMPI using long-term sorbent sampling, but more importantly, because
of the high sensitivity of REMPI, these same compounds could also be detected in the field innear real-time without sampling and preconcentration.
3.2.7 Improved Dynamic Range
One of the critical limitations in our system is the 8-bit digitizer. At the present time, alldigitizers operating above 200 MHz are limited to 8-bits. This effectively yields a dynamicrange of at most 255:1, but more realistically, about 100:1 due to random noise fluctuations. In
practical terms, this means that once the parameters of the signal chain are fixed (MCP voltage,preamplifier gain, digitizer input attenuation) to keep the largest signals on scale, then any minorpeaks less than 1% of full scale are not easily recovered. Signal averaging can help recoversmall peaks from the noise, but since the S:N improvement varies only with √(repetitions),
considerable additional time is required to achieve a substantial improvement. Another approach
to improving the dynamic range is to employ a logarithmic amplifier (log amp). This approachhas traditionally been problematic due to the limited speed of log amps and their inherentelectrical noise. Newer log amps offer the possibility that this approach may be viable, and we
are planning to test an Analog Modules Model 384 in the near future. One other option toimprove the dynamic range of the digitizer is to use two digitizers in tandem, each with adifferent gain. The resultant signal is then reconstructed from the two separate digital traces
using the relative gains. The major disadvantage of this approach is the $6500 cost for eachdigitizer.
Because we have a spare Signatec DA500A digitizer board, we investigated the use of a
second digitizer as a means of increasing the effective dynamic range of our data acquisitionsystem. The DA500A digitizers has the capability of being configured in a master-slavearrangement. This configuration uses only a single channel counter to advance each digitizer,
ensuring perfect temporal registration of the two traces. Test software was written to implementthe master-slave configuration and a 40 MHz arbitrary waveform generator was used to providea test signal whose relative peak amplitudes could be easily controlled.
Draft
55
Figure 39 shows the results of the test. The first digitizer was adjusted to have a full
scale input of 0.237 Vdc, while the second digitizer was set for a full scale of 1.282 Vdc. Bothdigital traces (shown as the upper and middle graphs, respectively) were transferred to thecomputer after each trigger and an effective signal synthesized (lower graph). The algorithm
used to synthesize the resultant signal was simply:
signal(i) = signal1(i) if signal1(i)<255
= signal2(i) × gain2/gain1 otherwise
where i = 1 to 16384
For the data shown in Figure 39, the gain ratio was 5.409, yielding an effective dynamic
range of 10-bits, or nearly one order of magnitude better than a single digitizer. Note that in theupper trace, the signal periodically exceeds full scale of the first digitizer, while the gain of thesecond digitizer is such that the middle trace is always less than full scale. Although not
apparent, all of the low level signal details visible in the upper trace are reproduced exactly in thebottom trace.
In principle, a gain ratio of more than 18:1 can be achieved using the DA500As which
would provide an effective dynamic range of 12 bits. Currently, however, the output of our fastpreamplifier is limited to less than 2 volts, so the full 12 bits cannot be realized. Nonetheless, theresults shown in Figure 39 show that an order of magnitude improvement can be achieved with
minimal additional programming effort.
Draft
56
Figure 39. Test of dual digitizer data acquisition system. The upper trace was acquired on the first
digitizer with a full scale input of 0.237 Vdc. The center trace was acquired on the second
digitizer with a full scale input of 1.282 Vdc, and the lower trace is the composite signal
produced according to the algorithm described in the text.
3.2.8 Field Work EPA NRMRL
SRI had a unique opportunity to perform a series of pseudo-field measurements without
the time and expense associated with transporting the instrument to a field site. This waspossible because by using the REMPI apparatus that SRI built for Dr. Brian Gullett at the EPA’sNRMRL. Since that apparatus is essentially a duplicate of the one currently in use at SRI,
measurements taken with the system in conjunction with EPA’s combustion facility allowed usto make these “field-like” measurements.
Dr. Oser, therefore, traveled to NRMRL and was able to perform numerous experiments
using the SRI-built REMPI apparatus in conjunction with the EFR flow reactor. A diagram ofthe flow reactor is shown in Figure 40. An outline of these experiments was provided in
Draft
57
mass flowcontrollers
coolingwater
naturalgas
N2 H2 CH4 O2 N2/Cl2 compressedair
watertrap
HCtrap
flame
furnace
quartz burner
3-stagefurnace
reactor air
quartzreactor
fly ash
fly ashfeeder
fly ash air
TC
N2
to jet-REMPI inlet
Figure 40. Diagram of the US EPA combusiton research flow reactor used in the field measurements.
Appendix A Proposed Test Plan, which was submitted prior to beginning the work. Theoutcome of these experiments is being critically examined and will be the focus of a joint SRI-EPA publication. It should be noted, however, that for the most part the experiments were
successful, and should yield considerable new information. It is also worth noting that theapparatus was operating at least as well as when it was first installed at RTP, with typicaldetection limits in the low ten’s of ppt for simple aromatics such as benzene. The preliminary
results are reported here.
Among the most intriguing observations was the detection of several interesting speciesthat were identified in a nominally “clean” methane flame. Benzene and phenol were both
positively detected in the off-gas stream of the reactor. In addition, clear evidence was alsofound for aniline produced in the EPA reactor under the test conditions. For all species, themeasured spectra are essentially identical to those recorded using a “clean” test gas mixture and
all were easily detected in the exhaust stream. Furthermore, their presence could be entirely
Draft
58
attributed to the methane combustion chemistry as the background levels were not detectable in
the absence of the flame.
Figure 41 shows the time dependence of the phenol signal at m/z 94 with the laser tunedto the primary resonance at 274.1 nm. The time resolution of this data was 1 second,
corresponding to 10 laser shots per data point. Between t = 0 and 250 seconds, the backgroundsignal was measured with no reactant gases flowing. At 250 seconds, the methane and oxygenreactants were introduced but without igniting the flame. Note that prior to flame ignition, the
phenol signal was essentially absent. At the point indicated on the figure, the flame was ignited,and the phenol signal rose rapidly and remained more or less constant until the flame wasextinguished. With the flame off, the phenol signal initially decreased rapidly followed by a
slower decrease back to the baseline. The slower decay was likely due to residual phenol in thesampling line and pulsed valve. Increasing the temperature of these components would likelydecrease the phenol clearance time. Under the REMPI conditions used to measure the data in
Figure 41, we estimate the phenol concentration to be 150 ppt.
Figure 42 shows a similar time history recorded for the aniline signal at m/z 93 and awavelength of 292.8 nm (see Figure 43). In this measurement, the methane flame equivalence
ratio was also 0.8. Again, the aniline signal was absent until the flame was ignited, at whichpoint it rose rapidly and remained easily measurable until the flame was extinguished. Noestimate has been made yet for the concentration of aniline in the exhaust gas stream.
Mass = 94 amuWavelength = 274.1 nmConcentration ~ 150 ppt
0 500 1000 1500 2000 2500
Time (sec)
0
Ion
Sig
nal (
arb
units
)
1
2
3
4
Flame On
Flame Off
Figure 41. Time dependence of phenol measured in a lean methane flame at EPA.
Draft
59
Mass = 93 amuWavelength = 292.8 nm
500 1000 1500 2000 2500
0
Ion
Sig
nal (
arb
units
)
1
2
3
4
Flame On
Flame Off
3000
Time (sec)
Figure 42. Time dependence of aniline measured in a lean methane flame at EPA.
Mass = 93 amu
287 288 289 290 291
0
Ion
Sig
nal (
arb
units
)
1
2
3
4
292
5
6
7
8
-1293 294
Wavelength (nm)
Figure 43. Wavelength dependence of the aniline jet-REMPI signal measured in a lean methane
flame at EPA.
Draft
60
Because the observation of aniline in the exhaust stream from a nominally pure methane
flame was unexpected, a wavelength scan was recorded at m/z 93 to confirm the identification.Figure 43 shows the measured REMPI signal over the wavelength range from 287.5 nm to 293.5nm. This spectrum corresponds to the known REMPI absorptions for aniline under jet-cooled
conditions. Note that the data in Figure 42 was measured with the laser tuned to the primaryresonance line at 292.8 nm.
3.2.9 Other Collaborations
During the course of this effort, SRI interacted with a number of other research groupsinvolved in closely related efforts. Drs. Crosley and Oser visited the DIAL group at MississippiState University to discuss complimentary field experiments that could be performed at their
facility as part of our future efforts to develop and test jet-REMPI under a variety of conditions.
In light of SRI’s plans to eventually test the jet-REMPI system on a pilot-scalecombustor, it became clear that we would need to coordinate our instrument design efforts with
those of the sampler developers. As a result, a visit was made by Drs. Coggiola and Oser to thefacilities of MSE during this reporting period. Detailed technical discussions were held coveringtheir sampler probe design, function, and possible integration with our system. Plans were also
discussed for possible field experiments to be conducted at MSE that would be designed to makea side-by-side comparison of the real-time jet-REMPI detection of important organic compoundswith MSE’s sorbent tube collection and offline GC-MS analysis.
SRI has recently been asked to participate in an international effort to assemble a REMPIdata base of common chemicals detectable by this method. The consortium has applied toIUPAC for recognition and funding. SRI intends to share with the group our library of REMPI
spectra, and furthermore, we will use this opportunity to help develop a uniform reporting formatand searchable database.
In addition to these collaborations, SRI maintains a close working relationship with Dr.
Gullett.
3.3 DIOXIN CEM DESIGN SPECIFICATION
3.3.1 TEQ Monitor
Based on the results obtained to date, it is not possible to conclude that an instrument
based on a jet-cooled molecular beam combined with REMPI and TOFMS will ultimatelyprovide the sensitivity, selectivity, and time response required for a dioxin CEM. Thisobservation is based on a number of factors, including the “chlorine effect”, and the unresolved
Draft
61
issues associated with the role of particulates in the formation and transport of dioxins and
furans.
The so-called chlorine effect has been observed and verified by every group applyingREMPI to polychlorinated dioxins. This effect, which manifests itself as a significant reduction
in ionization efficiency for each additional chlorine added to a congener, may substantially limitthe ability of REMPI to achieve the sub-ppt detection levels required of a compliance CEM.While the chlorine effect has not been verified for all important congeners, and hence may be
less important than currently believed, there is sufficient evidence to make it reasonable toassume that it will impact the detectability of more highly chlorinated congeners. There are avariety of potential ameliorating techniques that might be employed. For example, the use of
two-color REMPI, shorter laser pulses, and improvements in the ion extraction and detectioncould overcome, at least in part, the reduced ionization efficiency of highly chlorinated dioxins.
The issues associated with sampling in general, and the role of particulates in particular,
has not been adequately addressed by the dioxin CEM community to the point where usefulguidance is available. One of the most significant technical issues in regard to sampling is therequirement to maintain all surfaces of the sampling line at an elevated temperature such that the
most highly chlorinated dioxin and furan congeners of interest (2,3,7,8-chlorine substitutedspecies) are not lost due to condensation. This thermal requirement extends to the pulsed valve,as well. Moreover, the actual surface materials that are in contact with the sampled vapor stream
are critical, further exacerbating the difficulties. Finally, a key issue is the disposition ofparticulates in the sample stream. Because particles, and any adsorbed dioxin and furancongeners, are included in the standard method 23 sample collection and analysis train, they are
a de facto part of the TEQ determination. Thus, since particulates contribute to the TEQ, theytoo must be included in the REMPI TEQ measurement. Despite their potential importance, thereare currently no adequate sampling and desorption methods suitable for use with a real-time
dioxin CEM regardless of the detection methodology. It seems clear that more work will berequired in the future to address these issues.
As a general design specification, a jet-REMPI based dioxin CEM would consist of the
basic components used in our laboratory prototype, albeit with significant improvements wherefeasible. The generic specification therefore consists of: (1) a heated sampling and transfer linewhose surfaces are chemically inert toward all congeners of interest; (2) a heated, pulsed valve
with similar thermal and chemical characteristics; (3) a narrow band, tunable, pulsed uv lasersource operating at as high a repetition rate as the detection electronics, pulsed valve, andvacuum system will allow; (4) ion extraction optics capable of collecting and focusing the vastmajority of nascent ions into the mass spectrometer; (5) a time-of-flight mass spectrometer with
mass resolution exceeding 500, and preferably at least 1000; (6) an ion detector that is linearwith incident current over 3-4 orders of magnitude without signal distortion or electronic ringing;
Draft
62
(7) a preamplifier with a minimum 500 MHz bandwith; (8) a high speed digitizer providing at
least 12 bits of effective resolution and a single shot time resolution of 1-2 nsec and a high-speeddata transfer rate to the data acquisition computer; (9) on-line wavelength, mass, and intensitycalibration; and (10) a fully automated, autonomous control system.
There are numerous other operational specifications for many of these components thatare not explicitly stated here. For example, the uv output of the laser system must be very stablein wavelength, linewidth, optical beam quality, and intensity independent of the thermal and
mechanical environment in which it would operate. Moreover, the laser conditions must bereproducible over long periods of time to avoid the need for recalibration. While this might beaccomplished with a combination of temperature control and vibration isolation, these are not
necessarily simple engineering issues. Similarly, the optical alignment of the ionization laserbeam with the ion source region is critical to maintain optimum overlap between the laser andpulsed gas jet. Variations in the spatial overlap between these two can lead to significant
degradation in both the signal level and the apparent mass resolution. Thus, mechanical rigidityof the entire system is a critical engineering design parameter.
It is instructive to review the current state of development of each of the key components
outlined above. Table 3 summarizes the requirements and the currently available ordevelopmental capabilities for each component.
COMPARISON BETWEEN REQUIRED AND CURRENTLY AVAILABLE PERFORMANCESPECIFICATIONS FOR KEY COMPONENTS OF A JET-REMPI SYSTEM
Component Required Performance _ Curently Available 1. heated sampling and transfer
linesurfaces are chemically inerttoward all congeners of interest
could be assembled usingexisting technology with theexception of particulate treatment
2. heated, pulsed valve surfaces are chemically inerttoward all congeners of interest
problematic, both with regard tochemical inertness of thesurfaces and thermalperformance
3. narrow band, tunable, pulseduv laser source
operate at as high a repetitionrate as the detection electronics,pulsed valve, and vacuumsystem will allow
could be assembled usingexisting, commercial systems
4. ion extraction optics capable of collecting andfocusing the vast majority ofnascent ions into the massspectrometer
highly refined, and meet thedemands
5. time-of-flight mass mass resolution exceeding 500, can be readily assembled or
Draft
63
spectrometer and preferably at least 1000 purchased
6. ion detector linear with incident current over3-4 orders of magnitude withoutsignal distortion or electronicringing
can be readily assembled orpurchased
7. preamplifier minimum 500 MHz bandwith can be readily assembled orpurchased
8. high speed digitizer at least 12 bits of effectiveresolution and a single shot timeresolution of 1-2 nsec and a high-speed data transfer rate to thedata acquisition computer
could be assembled formcommercially available systems,high cost
10. control system fully automated, autonomous could be developed usingexisting technologies
3.3.2 Alternative REMPI-Based Instrumentation Schemes
While a true TEQ compliance monitor is not yet possible using the jet-REMPI approach,the technique may prove useful as a surrogate, or indicator monitor. This application would
involve continuous measurement of surrogate compounds, such as lowly chlorinated dioxins andfurans, or other species whose concentrations have been previously correlated with the TEQ. Suchan instrument may not require the extreme sensitivity of a compliance monitor although the high
degree of chemical selectivity could remain important. Specific operational criteria dependstrongly on the specific target compounds.
The configuration of such an instrument would depend strongly on the specific chemical
surrogate(s) chosen and their anticipated concentration(s) and form. Assuming that thesurrogates were lowly chlorinated dioxin and furan congeners with three of fewer chlorineatoms, then the laboratory prototype system developed and used in this effort would form the
basic design specification. In particular, the pulsed jet inlet, narrow-band laser, and modestresolution TOFMS would all be required to maintain adequate sensitivity and selectivity.Because only lowly chlorinated congeners would be of interest, the thermal issues associated
with both the transfer line and the pulsed valve would be easily mitigated using conventionaltechnologies.
Should a robust correlation between simpler surrogates, such as chlorobenzenes, and the
true TEQ be established for a particular combustion system, then a REMPI-based instrumentmight be simplified as well. These simplifications might be include replacement of the pulsed
Draft
64
valve with a capillary inlet, and the use of a wider band, tunable uv laser source, or even, a fixed
frequency (266 nm) pulsed source. The capillary inlet would consist of a length of uncoated,glass capillary tubing that forms a gas flow restrictor, limiting the pressure in the ionizationchamber to a reasonable value. Such an inlet is continuous, rather than pulsed, thus the average
flow must be considerably less than the currently used pulsed flow. Nonetheless, the pulsedionization source would still allow use of TOFMS detection.
The benefits of this simplified design include considerably lower cost, reduced size and
complexity, and improved robustness and easy of use, particularly if a fixed frequency lasersource is used in combination with a pulsed valve. The drawbacks include reduced sensitivityand selectivity, the need for an acceptable surrogate-TEQ correlation that is valid over a range of
operating conditions and feedstocks, and the possibility that the resulting measurements wouldnot satisfy regulatory requirements. In fact, the measurements made using such a system are bestconsidered as a real-time indication of the process conditions, rather than as a real-time
emissions monitor. Such a measurement could be very useful in ensuring that the combustionprocess is operating within acceptable design parameters, and by inference, in compliance withemissions limits.
It remains to be shown that appropriate surrogates are available whose levels correlatewith the TEQ. If acceptable surrogates are found, then it must be demonstrated that they can bemeasured in real-time and at the expected levels with a simplified instrument.
4. CONCLUSIONS
We can conclude from our work to date and the extremely demanding regulatorycompliance monitoring requirements involving both congener specificity and sub-part-per-trillion
sensitivity with near real-time speed, that it is not as yet possible to specify a system configurationfor a true dioxin compliance monitor. As detailed in this report, this conclusion is based on anumber of factors, including both scientific, technical, and engineering issues.
We have developed a number of concepts for instrumental improvements that willsubstantially increase our sensitivity while maintaining the exceptional selectivity required of adioxin CEM. In addition, we have developed several system configurations with varying degrees
of functionality that can be further developed and deployed for process monitoring, surrogatemeasurements, and potentially, as a dioxin control CEM.
5. FUTURE WORK
Draft
65
The direction of future work on the development and application of the jet-REMPI
method for continuous emissions monitoring will depend strongly on the intended application.Should a true TEQ compliance monitor be required, then the effort would clearly focus onimproving the sensitivity to overcome the apparent chlorine effect. At the same time, the critical
sampling issues, especially those associated with particulates, must be addressed andsatisfactorily resolved.
While SRI has measured the jet-REMPI spectra for many pollutants of interest, including
selected polychlorinated dioxins, many additional congeners must be similarly investigated so asto expand the library of detectable compounds. All work to date indicates that this readily donefor dioxins and furans with three or fewer chlorines using the current system. For more highly
chlorinated species, the two-color approach will be require, although we have demonstratedduring this effort that it works well and is easily implemented in the laboratory. Inclusion of themore highly chlorinated species in the spectral library would also require a high temperature inlet
and pulsed valve, both of which are developmental items. Sensitivity is not an issue in regards toacquiring REMPI excitation spectra, so no additional developments would be required for thatwork.
As detailed elsewhere in this report, sampling issues remain largely unresolved. The useof fast preconcentration/desorption may be a viable means of improving the effective sensitivityof the method. If the preconcentrator can introduce some degree of preseparation, then it could
improve selectivity as well. Sample preconcentration might also help to resolve the particulateproblem by allowing collection and then thermal desorption of adsorbed species from particles inthe exhaust stream. Clearly, this process will be difficult to implement in a quantitative way
while maintaining the time response of the system.
6. REFERENCES
1. K. Ballschmiter, Bacher, Dioxine, VCH, Weinheim, Germany (1996).
2. F. Chanania, EPA Office of Solid Waste, personal communication (February 1997).
3. H. Oser, R. Thanner, H. H. Grotheer, B. Gullett, N. Bergan French, D. Natschke, "DLR Jet-REMPI as a Continuous Emissions Monitor: Measurements of Chlorinated
Dibenzodioxins," in Proceedings, 1997 International Conference on Incineration andThermal Treatment Technologies, (May 1997).
4. Brian Gullett, EPA National Risk Management Laboratory, Combustion Research Branch,
personal communication (April 1997).
Draft
66
5. H. Oser, R. Thanner, and H. H. Grotheer, in Proceedings, 1996 International Conference on
Incineration and Thermal Treatment Technologies (1996), pp. 387-392.
6. R. Zimmermann, U. Boesl, D. Lenoir, A. Kettrup, Th. L. Grebner, and H. J. Neusser, Int. J.Mass Spectr. Ion Phys. 145, 97 (1995).
7. C. Weickhardt, R. Zimmermann, U. Boesl, and E. W. Schalg, Rapid Comm. MassSpectrom. 7, 183 (1993).
8. E. A. Rohlfing, 22nd Symp. (Int.) on Combustion, The Combustion Institute, p. 1843
(1988).
9. N. Bergan French, B. K. Gullett, H. Oser, H. H. Grotheer, D. Natschke, “Jet-REMPIDioxin CEM Test Program Final Report,” DOE Westinghouse Savannah River (1997).
10. M. Rossi and D. J. Eckstrom, Chem. Phys. Lett. 120, 118 (1985).
11. M. Rossi and H. Helm, J. Chem. Phys. 87, 902 (1987).
12. E. Y. Xu, T. Tsuboi, R. Kachru, and H. Helm, Phys Rev. A36, 5645 (1987).
13. M. Okruss, R. Müller, and A. Hese, J. Mol. Spectrosc. 193, 293 (1999).
14. E. B. Wilson, Jr., J. Chem. Phys. 3, 276 (1935).
7. ACKNOWLEDGEMENTS
The authors wish to acknowledge the technical contributions of Mr. Steve E. Young, andMr. William C. Olson, SRI, for their many contributions and helpful technical suggestions anddiscussions. In addition, we acknowledge the technical contributions of undergraduate students
Ms. Qui Luu, Ms. Katherine Copic, Mr. Steven Schuh, and Mr. Gregory Grist who contributed tothis effort as part of the Research Experience for Undergraduate program under sponsorship ofthe National Science Foundation.
Significant contributions were made by Mr. Bengt Volquadrdsen, a visiting SRIInternational Fellow.
We gratefully acknowledge the technical guidance and encouragement provided by Mr.
Ronald K. Staubly, National Energy Technology Laboratory, Morgantown, WV, Mr. Stephen J.Priebe, Idaho National Engineering Laboratory, Dr. Stephan Weeks, Bechtel-Nevada, and Ms.Nina French, Sky+, Napa, CA.
Draft
67
During the course of this effort, we benefited from numerous discussions and visits with
Drs. Brian Gullett and Lukas Oudejans, US EPA, RTP, NC; the technical staff of MSETechnology Applications, Inc., Butte, MT, in particular, Dr. Clarence Whitworth and Mr. DanBattleson; as well as the technical staff of DIAL, Mississippi State University, Mississippi State,
MS.
Selected portions of the work described in this report were jointly supported by thiscontract and EPA Agreement Number R 82792701-0, “Characterization of Urban Air Toxics
Sources In Support of HAPs Emission Control Strategies”.
Draft
68
APPENDIX A
Preliminary Test Plan Field Measurements Using Jet-REMPI: Application To Flow Reactor
Combustion Processes
Research test plan for the visit of Dr. Harald Oser, June 18–29, 2001, to EPA/APPCD, ResearchTriangle Park, NC. This test plan is based on the assumption that as of June 18, 2001:
• The EFR flow reactor will be available for tests.• A REMPI library including additional aromatic compounds will be available based on a
recently purchased mixture of aromatics.• A non-Teflon (quartz or stainless steel) sampling line is available.
The preliminary test plan includes three types of experiments list in order of priority:
1. Flue gas sampling versus N2, N2/H2O environment. What is the effect of flue gas on the
REMPI signal of a known compound, for example, deuterated benzene? What compoundscan be identified as PICs?, versus equivalent ratio?
The jet-REMPI apparatus will be setup to sample directly from the EFR flow reactor.Initially, deuterated benzene will be injected into the inlet, and a baseline signal levelestablished. The same species will then be monitored with the flow reactor in operation to
assess the impact of flue gas on detection. Flow reactor conditions will be varied as timeallows. A search will be made for products of incomplete combustion using the expandedREMPI aromatic library.
2. Sampling for dioxins using N2 carrier gas spiked with known levels of selected dioxincongeners (non- and lowly-chlorinated). Investigate possible production of dioxins in the
flue gas resulting from addition of fly ash and/or reactive species.
Sampling issues. One sampling issue regards the possible influence of water on the REMPI
signal. Prior work at EPA has shown the deuterated benzene signal increases when water vaporis present in the sample stream. These measurements were made using a Teflon transfer line,and the will be repeated using either a stainless steel or, preferably, quartz sampling probe.Issues regarding sample recovery, adsorption, pre-exposure of lines, and response times may be
investigated if time permits.
Draft
69
APPENDIX B
SRI Proprietary Design Concepts for Improved Slit-Type Nozzle and Ion Extraction Optics
Previous jet-REMPI studies of chlorinated aromatic compounds, show that achievable
sensitivities are in the low parts-per-trillion range. Our preliminary experiments, described
below, confirm this observation. While this represents excellent chemical sensitivity that is
sufficient for many analytical applications, it must be improved by several orders of magnitude
for a dioxin and furan CEM.
SRI developed several concepts for improving the sensitivity of our jet-REMPI
instrument. One of the most promising improvements is the use of slit-type pulsed nozzle in
place of the standard valve with a circular orifice. A slit-type pulsed valve will produce a wide
gas jet that, when crossed by the laser, will yield a much larger ionization volume than the
existing configuration. Although slit-type pulsed gas valves have been developed previously,
they have not been used with laser ionization, and therefore, no designs exist for the critical ion
extraction optics that can accommodate a line-source of ions.
Using SIMION, we have now developed a new ion optical design, shown in Figure B1.
Note that the lenses are not circular, but rather slits with the longer dimension into the plane of
the page. The dotted lines indicate open mesh grids used to maintain the proper electrostatic
fields and to shield the ions from the distortion induced by the large, grounded, valve body
approximately 1 cm from the laser beam. Note also that the vertical and horizontal scales are not
equal in this sketch; the horizontal dimension is compressed to keep the full 30-cm length
visible, while the vertical dimension is expanded to show the electrode detail.
SIMION simulations of this source show excellent ion beam behavior in the field-free
flight tube to the left of the sketch. This behavior can be seen by the ion trajectories shown in
Figure B1, which shows the very tight ion focal point just inside the second lens element to the
left of the laser ionization region. This will allow us to incorporate a small-diameter skimmer at
that point and hence to provide differential pumping within the source region to reduce the gas
load due to the much larger open area of the slit nozzle as compared with the conventional
circular nozzle. Some of the key characteristics of the new source are listed in Table B1.
In addition to the SIMION simulations described above for the design of the ion
extraction optics, we have begun performing gas dynamic simulations to better understand
optimal slit configurations, the tradeoffs involved with the use of a slit nozzle instead of a
circular nozzle, and any resulting constraints on our improved ion optics. These simulations are
Draft
70
based on method of characteristics calculations for free jet expansions from circular and slit
shaped nozzles.16-18 The accuracy of these calculations, which assume an isentropic gas
Electrons
Pulsed Slit-Type Valve
Ions
Laser Beam
Figure 8. Design of the ion extraction optics for a slit-type pulsed valve. Ion trajectories were
calculated by SIMION for realistic ionization and source conditions.
Table B1CHARACTERISTICS OF THE SLIT-TYPE ION SOURCE
Feature Effect Use of wire mesh grid
structures
• No disturbance of electrostatic field distribution with small
separation between laser beam and metal valve.
• Smallest possible distance from grid to laser beam of 1 cm.
• Allows experimental verification of cooling effects either with
circular or slit nozzle and locating the optimum distance between
valve and laser beam to maximize sensitivity and selectivity.
• Allows a determination of the effective temperature in the
supersonic beam, using either NO or benzene.
Symmetrical arrangement of
acceleration and repeller
electrodes
• Electrons are removed from the system within the shortest possible
time. This reduces possible interaction between electrons and
sample and increases the S/N ratio.
• Detection of electrons is possible, if desired.
• Reduces interference of the supersonic beam by electrodes.
Draft
71
Design of electrodes • Grid-free electrodes give higher ion transmission.
• Slit formed electrodes in combination with optimized field
distribution increase the accessible ionization volume with
acceptable mass resolution.
• Incorporates a skimmer in the acceleration electrode to reduce the
carrier gas flow into the MS and minimize the interaction time
between ions and background gas in the “high pressure” region of
the ion source.
• Allows “collinear” arrangement of valve and ion source.
• Minimal exposure of the ions to the surface of the acceleration
electrode.
expansion, has been tested previously by others. Although the slit expansion typically cools
more slowly than the circular expansion, the fact that the nozzle width is typically narrower than
the circular nozzle diameter compensates for this effect. Detailed results from these difficult
calculations are not completed.
Based on the promising results of our ion optical simulations for a slit-type geometry, we
turned our attention to the details associated with fabricating the various ion optical lens
elements required to assemble this device. The primary difficulties in fabricating these lens
elements are their small physical dimensions and the very close tolerances that must be
maintained to create the required electric field uniformity. We determined that standard
mechanical machining approaches could not achieve the required specifications. As an
alternative, we explored fabrication methods based on electrodeposition of copper onto a
machined form. Following removal of the form by chemical dissolution, the resulting copper
lens element would be overcoated first with nickel, then gold.
A vendor was located who could maintain our dimensional specifications, and a number
of slit-type electrodes were fabricated using this approach. Sacrificial aluminum forms were
machined and plated with copper to the desired thickness. The aluminum forms were then
removed by etching in a hot solution of sodium hydroxide. After the copper electrodes are gold
coated, they will be assembled into an ion source. This fabrication approach appears to yield
copper electrodes of very high quality and dimensional accuracy.
We have begun making modifications to the older TOFMS to accept the slit source. Weare currently having the previously fabricated, copper, slit-type ion optics coated with gold. Weare also planning to purchase a larger turbomolecular pump of at least 1000 l/s for the source
region, as well as a high vacuum rotatable flange. The former is required to handle the muchhigher gas load that will be generated using the slit valve, while the latter is necessary to provideexact alignment of the valve with the laser and extraction optics.
Draft
72
We making modifications to our older TOFMS to accept the slit source, and we have
recently purchase a 1300 l/s turbomolecular pump for the source region, as well as a highvacuum rotatable flange. The former is required to handle the much higher gas load that will begenerated using the slit valve, while the latter is necessary to provide exact alignment of the
valve with the laser and extraction optics. Both components were acquired using capitalinvestment funds from SRI.
The new ion optics for the slit source have been completed and mounted in the old ion
source chamber. The mechanical mount for the slit valve has also been finished, providing bothvertical adjustment, as well as rotational alignment. These two degrees of freedom are requiredto allow us to optimize the signal by adjusting the nozzle-to-laser separation, and the alignment
of the jet with respect to the laser to maximize overlap. The final step in preparing the systemfor testing is mounting of the new 1300 l/s turbomolecular pump for the source region.
The new ion optics for the slit source had been completed earlier, however, final
mounting in the old ion source chamber required several custom fabricated parts. In particular,the low pressure flight tube region must be isolated from the high pressure source region. Thisisolation is provided by a large collar that surrounds the exit of the ion source with a small ion
exit aperture leading to the flight tube. The collar must be electrically insulating and able towithstand elevated temperature, hence it is made from Teflon. A photograph of the new sourceis included with this report. The final step in preparing the system for testing is the mounting of
our new 1300 l/s turbomolecular pump on the source chamber, which also requires some customfabricated components.
During the course of Phase 2, we determined that General Valve Corporation offers a slit-
type valve based on the same electromechanical valve driver that we are currently using.Although it is not clear if the new valve design can withstand the elevated temperatures requiredfor our application, it will nonetheless allow us to rapidly assess the impact of the slit design on
our sensitivity. We therefore purchased a slit valve and plan to evaluate its performance as soonas the new ion optical system is completed.
Draft
73
Draft
74
APPENDIX C
“Development of a jet-REMPI (resonantly enhanced multiphoton ionization) continuous
monitor for environmental applications”
Harald Oser, Michael J. Coggiola, Gregory W. Faris, Steve E. Young, Bengt Volquardsen,
and David R. Crosley
Applied Optics Vol. 40, No. 6, 859-865
February 2001
Draft
75
Draft
76
Draft
77
Draft
78
Draft
79
Draft
80
Draft
81
Draft
82
APPENDIX D:
“Congener-specific detection of dioxins using jet-REMPI”
Harald Oser, Kathy Copic, Michael J. Coggiola, Gregory W. Faris, and David R. Crosley
Chemosphere Vol. 43, 469-477, 2001
Draft
83
Draft
84
Draft
85
Draft
86
Draft
87
Draft
88
Draft
89
Draft
90
Draft
91
Draft
92
APPENDIX E
“Development Of A Real-Time Continuous Emissions Monitor For Dioxins And Other
Chlorinated Aromatics”
Harald Oser, David R. Crosley, Michael J. Coggiola, and Gregory W. Faris
Organohalogen Compounds 40, 551(1999)
Draft
93
DEVELOPMENT OF A REAL-TIME CONTINUOUS EMISSIONS MONITOR FORDIOXINS AND OTHER CHLORINATED AROMATICS
Harald Oser, David R. Crosley, Michael J. Coggiola, and Gregory W. Faris
Molecular Physics LaboratorySRI International, Menlo Park, California
INTRODUCTION
Emission control strategies must ultimately rely upon a careful assessment of the link between healtheffects and ambient, human exposure levels to hazardous air pollutants (HAPs). Because polychlorinated organic
compounds in general, and dioxins and furans in particular, are among the most toxic of HAPs, SRI International isdeveloping a continuous emission monitor (CEM) for these species using the Jet-REMPI technique under supportfrom the U.S. Department of Energy (DOE). The unique capability for real-time detection and identification of these
and other toxic HAPs directly in incinerator emissions using a CEM instrument is an essential component ofemissions modeling, dispersion modeling, source apportionment, and ultimately, of human exposure modeling. Jet-REMPI is the only instrumental technique that can provide the speed, breadth, and sensitivity of measurementcapabilities that are required in support of the development of a comprehensive strategy to monitor and control
emissions of dioxins and furans from waste incinerators.
Our technique will provide real-time dioxin and furan concentrations rather than the multi-hour or multi-day averages as in the case for existing, conventional sampling and analysis methods. This capability will allow adetailed investigation of the relationship between dioxin emissions and the incinerator operating parameters and
waste feed characteristics. Such a study may reveal that “puffs” (transient pollutant emission events) account for amajority of the dioxin emissions, and hence only short-term control methods would be required to meet time-averaged regulatory emission limits. Such control strategies may be much more cost effective than full-time
emission control approaches. Tailoring the emission control strategy in response to minute-by-minute changes in theemission of hazardous pollutants can only be accomplished if a suitable CEM is available, such as our Jet-REMPIbased instrument.
MATERIALS AND METHODS
Our approach to acquiring the dioxin and furan levels is to perform direct measurement of specificcongeners using the Jet-REMPI method. Jet-REMPI is an ultra-sensitive analytical technique that can selectivelyidentify and quantify vapor-phase constituents present at ppt levels in incinerator emissions withoutpreconcentration or sample collection.
In recent years, many significant improvements have been made in the detection of hazardous, vapor-phase,organic compounds of environmental importance. Several research groups, including SRI, (1-4) DLR, (5,6) and TheTechnical University of Munich, Germany, (7,8), have demonstrated instruments or components of instruments
based on REMPI and mass spectrometry.
Ions produced by resonance enhanced multiphoton ionization (REMPI) are often detected using a time-of-flight mass spectrometer (TOF-MS) that takes advantage of the pulsed nature and well-defined temporal character of
laser ionization. The simultaneous detection by mass and wavelength yields extremely high chemical selectivity
Draft
94
crucial to identifying one trace compound in the midst of many other similar ones. Typical sensitivities of
conventional REMPI TOF-MS systems that do not use sample molecule cooling are in the mg/dscm range andhigher, which is totally insufficient either for a laboratory system or for regulatory monitoring of chlorinatedaromatics in a waste treatment process such as an incinerator.
A major improvement in sensitivity without loss in selectivity can be achieved using a pulsed gas valve that
produces a supersonic expansion. Pulsed gas valves provide a number of advantages over continuous gas inlets,including reduced gas flow and hence smaller vacuum pumps, higher local gas densities, well-defined spatialdistribution, significantly reduced translational energy distribution orthogonal to the propagation direction, andreduced internal (vibrational and rotational) temperatures leading to greatly enhanced spectroscopic resolution.
REMPI is a highly sensitive, highly species-selective, gas-phase analysis technique that has been applied tonumerous problems in molecular spectroscopy and combustion research. For REMPI of complex molecules, such asdioxins, the spectra can be simplified greatly by expansion through a nozzle. Adiabatic expansion results in low
sample temperatures, which increases the electronic ground state population and narrows the resonance line widthsthrough reduction in molecule velocities (reduced Doppler or temperature broadening) and through reduction intransition-perturbing collisions (reduced pressure broadening). These reduced linewidths lessen the ionization ofother molecular species (interferences) - leading to improved selectivity - and make the peak absorption larger -
leading to improved sensitivity. One or more lasers are used to ionize the cooled gas molecules by absorption of twoor more photons, one of which must be resonant with an electronic transition in the target molecule.
Because different isomers of a given chemical composition may have very different toxicities, it is essentialthat a measurement instrument be capable of distinguishing among isomers. Our instrument is able to do this
without any sample pre-separation, such as by gas chromatography, for example, because of the inherent ability ofoptical spectroscopy (REMPI in this case) to readily distinguish among isomers. The selectivity of the opticalspectroscopy is vastly improved through the pulsed nozzle cooling effects, as discussed above.
The mass spectrometric capabilities of our system include an upper mass range typically up to 500 amu,limited only by the size of the mass spectral data files. Typical laser-based TOF mass analyzers use a simple, linearflight path combined with a short duration, pulsed laser, ionization source. Low signal levels that may result fromthe use of a very short ion formation pulse can be compensated for by signal averaging using multiple scans. To
optimize this mode of operation, a high repetition rate ionization laser is used. Achieving good mass resolution(m/∆m) with a TOF instrument is straightforward using a pulsed laser for ionization because of the narrow spatial,
temporal, and energy spread of the nascent ions.
RESULTS AND DISCUSSION
The laser system used in our preliminary experiments described below consists of a Continuum Powerlite
Precision 9010 Nd:YAG and Sunlite EX OPO with a nominal tuning range in the visible between 445 and 710 nm, a5 ns pulse width, and a repetition rate of 10 Hz. Frequency doubling is achieved using an Inrad autotracker II. Theoptical linewidth of the system is approximately 0.1 cm-1.
The pulsed valve is an unmodified General Valve series 9 unit, with an orifice diameter of 0.5mm. Thenominal opening time was 150 µs, with a 2.5 cm separation between the exit of the valve and the ionization region.With the sample reservoir at atmospheric pressure, the two 250 l/s turbomolecular pumps (Varian Turbo V-250)maintain pressures in the ionization chamber and mass spectrometer regions of 10-5 Torr, and 5 x 10⁻⁷ Torr,
respectively.
The ionization conditions used to acquire the preliminary data included a pulse energy of approximately1mJ in a 1.5 mm diameter laser beam. Ion signals from the R. M. Jordan angular reflectron TOF-MS were amplified
Draft
95
by a Comlinear preamplifier with a gain of 10 and a 350 MHz bandwidth. Signals were recorded by a 500 MHz,
Signatec DA500A digitizer.
A sample of 1,2-dichlorobenzene was used for the initial instrument testing. To simplify these tests, asmall quantity of liquid was injected into a stainless steel tube on the upstream side of the pulsed valve, and room airwas used as a carrier gas. All components were at room temperature. 1,2-Dichlorobenzene is commonly used for
testing because of its high vapor pressure at room temperature, and it may also be an important indicator species oftotal dioxin levels (9). Moreover, the REMPI excitation spectrum is well known, so that tuning the laser toresonance line at 261.2 nm produced the mass spectrum shown in Figure 1.
145 150 1550
1000
2000
3000
4000
5000
6000
7000
Mass [amu]
Figure 1. Jet-REMPI mass spectrum of 1,2-dichlorobenzene at a wavelength of 261.2 nm.
We also performed a rapid survey of the m/z 146 ion signal strength as a function of laser wavelength to produce theREMPI excitation spectrum. That spectrum, shown in Figure 2, is in good agreement with previously reportedresults for the same molecule. Both the resonance locations and their peak heights are consistent with publishedREMPI spectra, indicating that our instrument is functioning correctly.
Draft
96
260 261 262 263 264 265 266 267 268
0
200
400
600
800
1000
Wavelength [nm]
Figure 2. Wavelength dependence of the m/z 146 ion signal for 1,2-dichlorobenzene.
Acknowledgments
This work was support by the U. S. Department of Energy, Morgantown Energy Technology Center,Morgantown, West Virginia under contract DE-AC26-98FT-40370.
References
1. Bischel, W. K., “Two Photon Detection Techniques for Atomic Fluorine,” Final Report for the Air Force Officeof Scientific Research, SRI Project PYC-8320, June, 1988.
2. Xu, E. Y., Tsuboi, T., Kachru, R., and Helm, H., Phys Rev. 1987, A36, 5645.3. Rossi M. and Eckstrom, D. J., Chem. Phys. Lett. 1985, 120, 118.4. Rossi, M. and Helm, H., J. Chem. Phys. 1987, 87, 902.5. Oser, H., Thanner, R., Grotheer, H. H., Gullett, B., Bergan French, N., Natschke, D., Proceedings, 1997 Int.
Conf. On Incineration and Thermal Treatment Technologies.6. Oser, H., Thanner, R., Grotheer, H. H., Proceedings, 1996 Int. Conf. On Incineration and Thermal Treatment
Technologies, pp. 387-392.7. Weickhardt, C., Zimmermann, R., Boesl, U., Schalg, E. W., Rapid Comm. Mass Spectrom. 1993, 7, 183.8. Zimmermann, R., Boesl, U., Lenoir, D., Kettrup, A., Grebner, Th. L., and Neusser, H. J., Int. J. Mass Spectr.
and Ion Phys. 1995, 145, 97.1. Blumenstock, M, Zimmermann, R., Lehnardt, R., Schramm, K.-W., Kaune, A., Nikolai, U., Lenoir, D., Kettrup,
A., Organohalogen Compounds 1998, 36, 47-52.
Draft
97
APPENDIX F
“Development Of A Real-Time Continuous Emissions Monitor For Hazardous Aromatic
Air Pollutants”
Harald Oser, Michael J. Coggiola, Gregory W. Faris, Bengt Volquardsen, andDavid R. Crosley
Organohalogen Compounds 45, 141 (2000)
Draft
98
DEVELOPMENT OF A REAL-TIME CONTINUOUS EMISSIONS MONITOR FORHAZARDOUS AROMATIC AIR POLLUTANTS
Harald Oser, Michael J. Coggiola, Gregory W. Faris, Bengt Volquardsen*, and David R. Crosley
Molecular Physics LaboratorySRI International, 333 Ravenswood Ave., Menlo Park, California, USA
*Fachhochschule Aachen, 52066 Aachen, Germany
Introduction
Under the 1990 Clean Air Act (CAA) Amendments, the U.S. Environmental Protection Agency (EPA) was
mandated to implement a research program providing the scientific foundation to develop a comprehensive nationalstrategy. This strategy aim to control 90%, or more of the emissions of the 30 most hazardous toxic pollutants inurban areas. This control strategy must ultimately rely on a careful assessment of the link between health effects and
ambient, human exposure levels to hazardous air pollutants (HAPs). Despite the need for such data, reliable ambient
concentrations have been measured for fewer than 40% of the 189 HAPs.1 Even these limited measurementsprovide no spatial or temporal information on HAPs levels, whose variation is inherent due to the sporadic, episodicnature of many combustion-related HAPs releases. This information cannot reliably be estimated or inferred by
typical current method, like GC-MS. It must be acquired through actual field measurements under typical, time-varying, ambient human exposure conditions.
A powerful alternative to current HAPs monitoring methods is Jet-REMPI-ToF-MS. It combines resonanceenhanced multiphoton ionization (REMPI), supersonic jet cooling, and time-of-flight mass spectrometry.
SRI International is developing a continuous emission monitor (CEM) for HAPs using the REMPItechnique under support from the U. S. Department of Energy (DoE) and the U.S. Environmental Protection Agency(EPA).
Our instrument will provide real-time HAPs at ambient and toxicological concentrations, instead of themulti-hour or multi-day averages obtained using existing, conventional sampling and analysis methods. Thisinstrument will provide the speed, breadth, and sensitivity of measurement capabilities required by EPA in supportof its development of a comprehensive national strategy to control emissions of HAPs from urban sources.
Materials and Methods
Our approach to detecting toxic organic HAPs and HAP mixtures in urban areas at the required levels is toperform direct measurement of specific isomers using the Jet-REMPI method. Jet-REMPI is an ultra-sensitiveanalytical technique that can selectively identify and quantify vapor-phase constituents at parts-per-trillion levels or
lower.
In recent years, many significant improvements have been made in the detection of hazardous, vapor-phase,organic compounds of environmental importance using Jet-REMPI. It has been demonstrated by several research
groups, including SRI2-5, DLR6, 7, and The Technical University of Munich, Germany8, 9 - under the condition ofsupersonic cooling, the two-dimensional detection scheme based on laser excitation spectrum plus mass spectra canprovide a unique method of molecular identification and structural detection.
Draft
99
In the REMPI process, one or two laser wavelengths are used to ionize gas molecules by absorption of two
photons, one of which must be resonant with an electronic transition in the target molecule. This optical resonancewith the molecular quantum state provides part of the selectivity for Jet-REMPI.
Ions produced by REMPI are detected using a time-of-flight mass spectrometer (TOF-MS) that takesadvantage of the pulsed nature and well-defined temporal character of laser ionization. The simultaneous detection
by mass and wavelength yields the extremely high chemical selectivity crucial to identifying one trace compound inthe midst of many other similar ones.
For REMPI of complex molecules, such as HAPs and even dioxins, the spectrum can simplifieddramatically by expansion of the sample through a narrow orifice. The supersonic cooling step results in low sample
temperatures, increasing the electronic ground state population and narrowing the resonance line widths throughreduction in molecular velocities and through reduction in transition-perturbing collisions. These reduced linewidthsare eliminate the ionization of other molecular species (interferences) - leading to improved selectivity - and make
the peak absorption larger - leading to improved sensitivity.
The pulsed gas valves also provide advantages over continuous gas inlets, such as reduced gas flow andhence smaller vacuum pumps and is compatible with the pulsed nature of REMPI.
Because different isomers of a given chemical composition may have very different toxicities, it is essential
that a measurement instrument be capable of distinguishing among isomers. Our instrument does this without anysample pre-separation, such as by gas chromatography, for example, because of the inherent ability of the laserexcitation step to readily distinguish among isomers.
The mass spectrometric capabilities of our system include an upper mass range typically up to 500 amu,
limited only by the size of the mass spectral data files. The TOF mass analyzers uses a simple, linear flight pathcompatible with the short pulsed laser. Achieving good mass resolution (m/∆m) with a TOF instrument is
straightforward using a pulsed laser for ionization because of the narrow spatial, temporal, and energy spread of the
nascent ions.
A more detailed description of our laboratory Jet-REMPI ToF-MS instrument is given elsewhere10.Therefore we present here just a brief summary of our instrument.
The sample is introduced into the ionization chamber through a pulsed valve (General Valve series 9) that
delivers 150 µs sample pulses at a repetition rate of 10 Hz. Residual gas pressures of 10-5 Torr in the ionization
chamber and 10-7 Torr in the mass spectrometer are achieved by the combination of sufficiently large pumps (VarianV-250 and Seiko Seki 301), the short gas injection time, a 0.5 mm orifice of the pulsed valve, and gas samples atatmospheric pressure.
The laser system consists of a Continuum Powerlite Precision 9010 Nd:YAG and Sunlite EX OPOincluding frequency doubling with a nominal tuning range in the UV between 225 and 400 nm, a 5 ns pulse width,and a repetition rate of 10 Hz. The optical linewidth of the system is approximately 0.2 cm-1.
An unfocused laser beam is used, with a beam area of about 2 mm2 and pulse energies of approximately 1
mJ. Ions were mass analyzed with a reflectron type ToF-MS (R. M. Jordan), amplified by an Ortec 9306preamplifier (gain = 85, bandwith = 1 GHz) and recorded by a 500 MHz digitizer (Signatec DA500A).
Results and Discussion
Draft
100
The effective temperature of samples in
the supersonic jet is important for sensitivity andselectivity using Jet-REMPI. Lower temperatureslead to narrower lines, which improves
selectivity. In addition, there are fewer
total lines, again improving both sensitivity andselectivity. To learn the operating conditions thatachieve the lowest temperature in combination withthe highest sensitivity from our pulsed nozzle/ion
extraction arrange-ment, we have used benzene as athermometric species. The spectroscopy of benzeneis known quite well, allowing determination of the
effective rotational temperature from measuredspectra. Measurements of a single band are shownin Fig. 1. This spectrum was taken at a distance ofabout 2.7 cm from the nozzle. The band shown is
part of the lowest singlet-singlet transition (S1 ←S0) of benzene near 259 nm. The band showncorresponds to many overlapping rotational lines.From the overall contour of these overlapping
lines, we can determine an effective rotationaltemperature of the benzene. We simulate the formof the main contour as a function of temperature.
Rotational band calculation follow the methodgiven by Callomon, et al.11 The result is alsoshown in Fig 1. The best agreement of the generalshape for the simulated band contour with the
experimental result is given at a temperature of19±1 °K. This indicates a high degree of internal
relaxation. To demonstrate the two dimensionaldetection scheme based on wavelength and mass
we used a mixture of benzene, toluene, andclorobenzene as test substances. These moleculesare known HAPs and their REMPI spectra aredefined12, 13. Due to soft ionization, only the parent
peaks at their respective masses are recorded andno cross sensitivities occur. The results in Fig. 2show that we have good optical resolution for our
measured spectra. This also indicate sufficientcooling.
This work was support by the U. S. Department of Energy, Morgantown Energy Technology Center,
Morgantown, West Virginia under contract DE-AC26-98FT-40370, and U. S. Environmental Protection Agencyunder grant R82792701.
References1. Koshland, C. P. (1996),”Impacts and Controls of Air Toxics from Combustion,” 26th Symposium (Int.) on
Combustion, p. 2049.2. Bischel, W. K. (1988), “Two Photon Detection Techniques for Atomic Fluorine,” Final Report for the Air Force
Office of Scientific Research, SRI Project PYC-8320.3. Xu, E. Y., Tsuboi, T., Kachru, R., and Helm, H. (1987), Phys Rev., A36, 5645.4. Rossi M. and Eckstrom, D. J. (1985), Chem. Phys. Lett., 120, 118.5. Rossi, M. and Helm, H. (1987), J. Chem. Phys., 87, 902.6. Oser, H., Thanner, R., Grotheer, H. H., Gullett, B., Bergan French, N., Natschke, D. (1997), Proceedings Int.
Conf. On Incineration and Thermal Treatment Technologies.7. Oser, H., Thanner, R., Grotheer, H. H. (1996), Proceedings Int. Conf. On Incineration and Thermal Treatment
Technologies, pp. 387-392.8. Weickhardt, C., Zimmermann, R., Boesl, U., Schalg, E. W. (1993), Rapid Comm. Mass Spectrom. 7, 183.9. Zimmermann, R., Boesl, U., Lenoir, D., Kettrup, A., Grebner, Th. L., and Neusser, H. J. (1995), Int. J. Mass
Spectr. and Ion Phys., 145, 97.
10. Oser, H., Copic, K., Coggiola, M. J., Faris, G. W., and Crosley, D. R. (2000), “Congenere-Specific Detection ofDioxins Using Jet-REMPI,” Chemosphere, to be published.
11. Callomon, J. H., Dunn, T. M., and Mills, I. M. (1966),”Rotational Analysis of the 2600_ Absorption System ofBenzene.” Philoso. Trans. R. Soc. London Ser. A 259, 499-532.
12. Williams, B. A., Tanada, T. N., and Cool, T. A. (1992), “Resonance Ionization Detection Limits for Hazardous
Emissions,” 24th Symposium (Int.) on Combustion, p. 1887.13. Sin, C. H., Tembreull, R., Lubman, D. M. (1984), “Resonant Two-photon Ionization spectroscopy in
Supersonic Beams for Discrimination of Disubstituted Benzenes in Mass Spectrometry,” Anal. Chem. 56, 1227.
Draft
102
APPENDIX G
“Dioxin And Furan Laboratory Measurements Using Jet-REMPI”
Harald Oser, Michael J. Coggiola, Steve E. Young, Gregory W. Faris, and
David R. Crosley
Organohalogen Compounds (2001)
Draft
103
DIOXIN AND FURAN LABORATORY MEASUREMENTSUSING JET-REMPI
Harald Oser, Michael J. Coggiola, Steve E. Young, Gregory W. Faris, and David R. Crosley
SRI International, Menlo Park, California 94025 USA
IntroductionOn-line monitoring of stack emissions to determine TEQ values requires at the minimum,sensitivities at the ppq level, which is far below the detection limit of any current continuousemission monitor. An alternative approach is the real-time measurement of indicator substances,
like lowly chlorinated DD/DF isomers, by jet-cooled, resonantly enhanced multi-photonionization (Jet-REMPI).
The use of Jet-REMPI as an indirect real time TEQ monitor requires identification of sufficientlyabundant lowly chlorinated isomers that correlate well with the TEQ values. Recent statisticalanalysis studies of TEQ values and concentrations for a subset of the mono- to tri-chlorinated
PCDD/F congeners show promising correlations, suggesting that these compounds can act asTEQ indicators1, 2. The on-line nature of Jet-REMPI provides also a valuable tool for themechanistic understanding of PCDD/F formation. This understanding may support finding
process control methods to reduce or even prevent their formation.
Under support from the U. S. Department of Energy (DoE) and the U. S. Environmental
Protection Agency (EPA), SRI International has developed a continuous emission monitor(CEM) for PCDD/F detection using the Jet-REMPI method. In an initial step, the focus of theresearch was to measure Jet-REMPI spectra for lowly chlorinated PCDD/F isomers, investigate
mixtures of these compounds, and apply a more advanced ionization scheme, namely the twocolor, two photon ionization scheme, to increase the number of REMPI accessible PCDD/Fisomers.
Materials and MethodsJet-REMPI is an ultra-sensitive, highly selective, analytical technique that can identify andquantify vapor-phase constituents at parts-per-trillion levels. In recent years successful
applications in on-line monitoring of hazardous air pollutants produced in waste incinerationhave been reported by two research groups3, 4, and many significant improvements have beenmade in the detection of hazardous, vapor-phase, organic compounds of environmental
importance using Jet-REMPI.
Draft
104
In the REMPI process, one or two laser wavelengths are used to ionize gas molecules byabsorption of two photons, one of which must be resonant with an electronic transition in thetarget molecule. This optical resonance with the molecular quantum state provides part of the
selectivity for Jet-REMPI. Ions produced by REMPI are detected using a time-of-flight massspectrometer (TOF-MS) that takes advantage of the pulsed nature and well-defined temporalcharacter of laser ionization. The simultaneous detection by mass and wavelength yields the
extremely high chemical selectivity crucial to identifying one trace compound in the midst ofmany other similar ones.
For REMPI of complex molecules, such as dioxins, the spectrum can be simplified dramaticallyby expansion of the sample through a narrow orifice. The supersonic cooling step results in lowsample temperatures, increasing the electronic ground state population and narrowing the
resonance line widths through reduction in molecular velocities and through reduction intransition-perturbing collisions. These reduced linewidths eliminate the ionization of othermolecular species (interferences) - leading to improved selectivity - and make the peak
absorption larger - leading to improved sensitivity.
A more detailed description of our laboratory Jet-REMPI TOF-MS instrument is given
elsewhere5. Therefore just a brief summary of is presented here. The sample is introduced intothe ionization chamber through a pulsed valve (General Valve series 9) that delivers 150 µs
sample pulses at a repetition rate of 10 Hz, which results in the advantage of a reduced gas flowand hence smaller vacuum pumps and is compatible with the pulsed nature of REMPI. Residualgas pressures of 10-5 Torr in the ionization chamber and 10-7 Torr in the mass spectrometer are
achieved by the combination of sufficiently large pumps (Varian V-550 and Seiko Seki 301), theshort gas injection time, a 0.5 mm orifice of the pulsed valve, and gas samples at atmosphericpressure. The laser system consists of a Continuum Powerlite Precision 9010 Nd:YAG and
Sunlite EX OPO including frequency doubling with a nominal tuning range in the UV between225 and 400 nm, a 5 ns pulse width, and a repetition rate of 10 Hz. The optical linewidth of thesystem is approximately 0.1 cm-1. For the two color excitation scheme a combination of tunable
UV from the OPO and 266 nm produced by the quadrupling of the fundamental wavelength ofthe Nd:YAG pump laser was used. The two laser beams were unfocused, with a beam area ofabout 2 mm2 and pulse energies of approximately 1 mJ for the OPO output and 0.1 mJ of the 4th
harmonic were used. Ions were mass analyzed by a reflectron type TOF-MS (R. M. Jordan) witha mass resolution of 1000, amplified by an Ortec 9306 preamplifier (gain = 85, bandwith = 1GHz) and recorded by a 500 MHz digitizer (Signatec DA500A).
Results and Discussion
Draft
105
The on-line detection of lowly chlorinated DD/DF isomers is of particular interest for
investigation of the formation chemistry of toxic PCDD/F, and indirect determination of TEQvalues1, 2. For this purpose, we investigate the Jet-REMPI spectroscopy of 2,7- and 2,8-DCDDand 2-MCDF which are proposed as potential TEQ-indicators.
Despite the fact that Jet-REMPI for the two DCDD is already known6, it has not been proven yetif Jet-REMPI is a valuable tool to discriminate these isomers. Therefore we conducted
experiments by using a sample consisting of a mixture of equal amounts of 2,7- DCDD and 2,8-DCDD, desolved in acetone. To simplify these tests, a small quantity of the liquid mixture wasinjected into a stainless steel sample flask on the upstream side of the pulsed valve, and room air
was used as a carrier gas to simulate semi realistic conditions. We estimate that the concentrationof each isomer in the sampled gas stream was approximately 1 ppb. All components in thesample stream, including the nozzle, were heated to 150°C to prevent condensation. Figure 1
shows the ion signal recorded at mass 252, corresponding to the parent ion of both isomers, as afunction of wavelength. Several
individual absorption features are labeledto show which isomer gave rise to the ionsignal. Assignment of these absorption
features was made by measuring the Jet-REMPI spectra for each isomer separatelyand by comparison with the results of
Weickardt et al.6. From an estimatedsignal-to-noise ratio of 20, we calculated acurrent detection limit of 50 ppt for both
DCDD isomers.
The wavelength dependence for 2-MCDF,
which has never been examined by Jet-REMPI, is shown in Figure 2. Thewavelength dependence shows a number
of clearly resolved peaks, however, theoverall ion signal strength was less than for
similar dioxin molecules. One common cause of low ionization probability occurs when the two
photons do not excite the neutral molecule appreciably above its ionization threshold. One majorconsideration for improving REMPI sensitivity is the use of a different wavelength (color) forthe ionization step, although one color for both the excitation and ionization steps is certainlysimpler to implement.
0
1
2
3
4
5
301.5 302.5 303.5 304.5 305.5 306.5
Ion
Sig
nal (
arb
units
)
Wavelength (nm)
2,8 DCDD
2,7 DCDD
Figure 1: Wavelength dependence of the m/z252 ion
Draft
106
However, in certain cases, using a second
color is preferable or essential.Specifically, if the excited state lies at anenergy less than half the ionization
potential then a second photon of the samewavelength will not have enough energy toionize the molecule. For example, in
tetrachlorinated dioxins (TCDD), theenergy of the S1 level is approximately halfthe ionization potential7. Thus, single-
color REMPI may or may not be effectivefor TCDD. Two-color REMPI using asecond, higher energy laser beam may be a
much more efficient technique for TCDDdetection. The second beam would not
require an additional laser. When using a Nd:YAG pumped OPO, the second color can be the
fourth harmonic at 266 nm or the fifthharmonic at 213 nm, of the Nd:YAGfundamental wavelength produced using
nonlinear crystals.
To test this possibility, we reexamined the
REMPI signal corresponding to the m/z202 parent ion under a variety ofconditions. The result is shown in Figure
3. With only the fixed wavelength (266nm) light, the signal is at baseline. Withthe addition of light at 300.41 nmcorresponding to the S0→S1 resonant
transition of 2-monochlorofuran, the two-
color REMPI signal appeared and remained constant. Turning off the 266 nm light caused theion signal, due now only to the two-photon, one-color REMPI process, to drop by a factor ofapproximately 8. Detuning the laser off resonance to 300.3 nm resulted in the signal level again
measuring zero. These results appear to confirm the hypothesis that the two-photon, one-colorscheme did not impart sufficient energy to achieve a high ionization probability.
Ion
Sig
nal [
a. u
.]
-2
0
2
4
6
8
10
12
14
Time (sec)
0 500 1000 1500 2000 2500
0.2 mJ @ 266 nm
0.5 mJ @ 300.41 nm0.2 mJ @ 266 nm
0.5 mJ @ 300.41 nm
0.5 mJ @ 300.3 nm(off resonance)
Figure 3: Measured m/z 202 ion signal for jet-REMPIdetection of 2-mono-chlorodibenzofuran usingvarious one- and two-color schemes.
Io
n S
igna
l [a.
u.]
Wavelength ( nm)
299 300 301 302 303
0
5
10
15
20
25
30
35
Fig. 2: Wavelength dependence of the m/z 202 ion
signal for jet-REMPI detection of 2-mono-
chlorodibenzofuran.
Draft
107
Acknowledgments
This work was support by the U. S. Department of Energy, National Energy Technology Laboratory,
Morgantown, West Virginia under contract DE-AC26-98FT-40370, and the U. S. Environmental Protection Agencyunder research grant R82792701.
References1. Oser, H., Thanner, R., Grotheer, H.-H., Gullett, B. K., Natschke, D., and Raghunathan, K.(1998), Comb. Sci.
and Tech., 134, 201.
2. Gullett, B. K., Wikström, E. (2000), Chemosphere, 40 1015.3. Zimmermann, R., Heger, H. J., Blumenstock, M., Dorfner, R., Schramm, K. W., Boesl, U., Kettrup, A.
(1999), Rapid Comm. Mass Spectr, 13(5), 307.
4. Thanner, R.; Oser, H.; Grotheer, H.-H. (1998), Eur. Mass Spectrom., 4(3), 215.5. Oser, H.; Coggiola, M. J.; Faris, G. W.; Young, S. E.; Volquardsen, B.; Crosley, R. D. (2001), Applied
Optics, 40, 1.6. Weickhardt, C., Zimmermann, R., Schramm, K.-W., Boesl, U., and Schlag, E. W. (1993), Rapid Comm.
Mass. Spectr., 7, 183.7. Zimmermann, R., Boesl, U., Lenoir, D., Kettrup, A., Grebner, Th. L., Neusser, H. J. (1995), Int. J. Mass.