Keywords:Biotechnology firms; Geography of opportunity; Spatial heterogeneity
1. Introduction
Industrial activity is concentrated in space. Fromthe assembly of automobiles to the weaving of tex-tiles, production in many industries occurs in geo-graphically localized clusters. The tendency of firmsto locate close to one another seems easy to explain inmarkets where the transportation of raw materials orthe outputs of production entail substantial cost—insuch instances, the basic economics of production anddistribution dictate the location of industrial activity.The fact that production concentrates geographi-cally in most high-technology industries, however,
eludes this simple explanation. The central productioninputs in these industries—intellectual property, hu-man and financial capital—weigh nothing and inprinciple should move quickly and inexpensivelythrough space. The levity of these ingredients impliesthat the choice of where to locate a high-technologyfirm should be relatively unconstrained by the spatialdistribution of inputs and end markets.
To address this conundrum, we develop an ecolog-ical and network-based account of spatial co-locationin high-technology industries and then test this the-ory by analyzing spatial heterogeneity in foundingrates and organizational performance in one hightech industry. We contend that firms concentrate inspace for two reasons: the individuals most likelyto start new companies of a particular type, as wellas the social and professional ties of these would-be
230 T. Stuart, O. Sorenson / Research Policy 32 (2003) 229–253
entrepreneurs to important resource providers, bothtend to cluster in space. Building a new organizationinvolves amassing a broad array of resources andcommitments (Stinchcombe, 1965). To establish ahigh-technology firm, the entrepreneur must persuadeinvestors to commit funds to an uncertain venture andindividuals with specialized human capital to join thefledgling enterprise. Entrepreneurs must also convinceestablished organizations to transact with their newventures in the capacity of suppliers, buyers, strategicpartners, and advisers. We assert that entrepreneurs’social relationships play an essential role in attractingthe resources to create new organizations (Shane andCable, 2002; Shane and Stuart, 2002); the potentialto discover latent opportunities and the social capitalto initiate the resource mobilization process residein the existing (and potential) relationships of theentrepreneur.
These social networks also structure the geographicdistribution of production. Sociologists have long as-serted that spatial propinquity greatly facilitates re-lationship formation, and substantial empirical worknow supports this view (e.g.Park, 1926; Bossard,1932; Zipf, 1949; Festinger et al., 1950; Blau, 1977;Kono et al., 1998; Sorenson and Stuart, 2001). To thedegree that entrepreneurial activity depends upon ac-tivating relationships that are anchored in space, thegeographic distribution of resources will significantlyinfluence the spatial distribution of industry (Sorensonand Audia, 2000). In particular, because would-be en-trepreneurs in areas that lack important resources prob-ably also lack connections to resource holders, theyoften cannot assemble the resources to start a neworganization. For this reason, the distribution of re-sources across physical space plays a crucial role indetermining where new businesses arise.
Our empirical analyses examine the biotechnol-ogy industry and establish three findings. First, weshow that the physical locations of the holders ofthe resources necessary to create new biotechnol-ogy firms affects where new ventures appear. Sec-ond, we show that proximity effects dissipate as theindustry evolves—a trend we ascribe to the emer-gence of industry-specific institutions that expandthe geographic reach of individuals’ networks. Third,we demonstrate that physical nearness to compet-ing organizations and important resources influencesthe early-life performance of biotechnology firms.
Specifically, the results will show that the most fe-cund conditions for new venture creation often donot occur in the regions best suited for fostering theperformance of these newly established ventures, al-though data limitations to some extent qualify thisfinding. We credit this discrepancy to the fact that ahighly competitive environment arises as a byproductof the relational processes that yield geographicallyconcentrated industrial spaces.
In addition to its theoretical import, understandingthe forces underlying high tech industrial clusterscan also inform policy. Urban planners have shownkeen interest in replicating the successes of estab-lished high-technology regions in new locales. Withthe loss of manufacturing jobs to countries withlower wages, policymakers increasingly look to tech-nology entrepreneurship as a stimulus for regionaldevelopment. For many urban planners, Silicon Val-ley and Boston’s Route 128 represent blueprintsfor generating employment and economic growth inan increasingly knowledge-based economy. To laythe foundations for the emergence and growth oftechnology-intensive industries, state and local gov-ernments around the world have launched variousincarnations of high-technology development (HTD)initiatives (OTA, 1984; Preer, 1992). Nevertheless,relatively few systematic empirical studies analyzespatial heterogeneity in new venture creation inhigh-technology industries, and even fewer documentthe effect of geographic location on organizationalviability. As a result, although regional policies havebeen informed by a number of careful case studiesof high-technology agglomerations (e.g.Saxenian,1994), systematic empirical evidence upon which toground policy initiatives is lacking (Galbraith, 1985).
2. Spatial proximity, local ties, and resourcemobilization
A sizable, if largely theoretical, literature in eco-nomic geography addresses the spatial concentrationof industry. Much of the recent work in this areahas focused on agglomeration economies—a formof scale economy external to any one firm but inter-nal to regions containing clusters of the same typeof enterprises—in generating spatial concentration(e.g.Marshall, 1920; Arthur, 1990; Krugman, 1991).
T. Stuart, O. Sorenson / Research Policy 32 (2003) 229–253 231
Agglomeration economies imply positive returns toscale at the regional level, such that the advantage to anorganization of locating in a particular region in-creases with the number of other firms in the area.
Several processes might generate agglomerationeconomies. One is the ‘spillover’ of knowledge be-tween geographically proximate firms. If geographicpropinquity facilitates the diffusion of technicalknowledge, high-technology startups may chooseto locate near to established organizations in theirfield to benefit from localized knowledge external-ities (Jaffe et al., 1993). A second potential sourceof increasing returns in agglomerations is the emer-gence of specialized suppliers in areas with a highconcentration of particular kinds of firms (Marshall,1920). For instance, one finds silicon wafer producersand semiconductor equipment manufactures near thecluster of Silicon Valley chip producers. Similarly,suppliers of reagents, advanced laboratory equipment,biological materials, intellectual property law, andindustry-specific consulting services have located nearto the biotechnology clusters in California and Mas-sachusetts. To the extent that high-technology firmsbenefit from proximity to these suppliers and serviceproviders, the emergence of clusters of support orga-nizations represents a second source of agglomerationeconomies.
Our emphasis in this paper differs from much of thework on industrial clusters in that we adopt a socio-logical perspective to explain the co-location of firms.Specifically, rather than examining heterogeneity in lo-cal founding rates as a function of differences betweengeographic areas in their capacities to support estab-lished businesses, we explore regional differences inthe conditions that enable entrepreneurs to assemblethe resources to start new companies as determinantsof the local founding rate.
To do so, we introduce an explicit considerationof how social networks influence the resource mo-bilization process to a conventional ecological ac-count of organizational foundings. Our argument inbrief: organizational ecologists have observed thatnewly formed ventures often experience a ‘liability ofnewness’. Because they lack committed workforces,slack resources, effective organizational designs, andrelationships with customers and suppliers, earlystage companies fail at a higher rate than do larger,more established organizations (Stinchcombe, 1965;
Baron et al., 1996). As a result, potential employees,investors, customers, and collaborators (collectively,‘resource holders’) inevitably assume some risk whenthey affiliate with a new organization. In turn, networktheorists have argued that social capital—particularlyin the form of pre-established relationships and reputa-tions with resource holders—provides the mechanismthat entrepreneurs use to overcome these uncertaintiesand to secure tangible commitments from skepticalresource holders (Zimmer and Aldrich, 1987; Portesand Sensenbrenner, 1993; Shane and Cable, 2002;Shane and Stuart, 2002). Thus, we contend that socialcapital crucially enables the organization buildingprocess. Because close social and professional rela-tionships tend to localize geographically (Festingeret al., 1950), would-be entrepreneurs often can bestleverage their existing connections to assemble andcoordinate resources when they reside close to re-source holders. Thus, we argue that entrepreneurshave difficulty starting new firms outside of areasabundant in the necessary resources. Consequently,some geographic areas afford more opportunities tocreate new ventures than do others.
To launch a technology-based startup, an en-trepreneur requires at least three kinds of resources.All three types of resources exist in space in the sensethat social actors who reside at particular locationscontrol them. First, high-technology startups typicallyrequire a new idea or foundational technology. Hence,as likely sources of ideas for new ventures, we begin byconsidering the local density of experts in a particularfield of technology as a determinant of where in spacenew ventures begin. Second, startups need capital;and given the risks associated with capital-intensivehigh-technology firms, this frequently comes in theform of venture capital (VC). Accordingly, we inves-tigate whether the proximity of an area to sourcesof VC promotes organizational foundings. Third,new technology companies require employees withhighly specialized human capital. Because existingenterprises provide sources of skilled technical andmanagerial labor and training grounds for prospectivecompany founders, areas close to many enterprises inthe focal population may experience higher rates ofnew venture founding. Treating these in turn, we ar-gue that physical distance from people with technicalexpertise, sources of specialized labor, and suppliersof VC greatly hampers organization building.
232 T. Stuart, O. Sorenson / Research Policy 32 (2003) 229–253
Founding a new technology company begins withan idea. Researchers widely believe that informationconcerning new technologies diffuseswithin the con-fines of areas containing many individuals working onsimilar technical problems. When people with com-mon professional interests cluster in physical space,informal social and professional networks emerge andserve to disseminate information (Piore and Sabel,1984; Herrigel, 1983; Saxenian, 1994; Liebeskindet al., 1996; Hedström et al., 2000; Sorenson andStuart, 2001). Hence, technologists in locationsdensely populated with other specialists in their fieldsoften can form networks that contain many close,casual, and indirect ties with colleagues. These net-works may convey information about new technologi-cal developments, important and unresolved technicalpuzzles, and emerging market opportunities.
Being situated in networks that provideexposure to diverse developments importantly influ-ences technology-based entrepreneurship, becausenew inventions stem from novel combinations ofexisting ideas and technologies (Schumpeter, 1942;Fleming, 2001). Those positioned at the intersectionof diverse information streams inhabit ideal locationsfor coming into contact with or creating the idea for anew venture (Hawley, 1986). Therefore, entrepreneursin areas with a large population of technical expertstend to occupy positions in communication networksthat lend themselves to idea generation, awarenessof promising technical opportunities, and the abil-ity to assess market opportunities. As a result, weanticipate, the rate of founding of new high-tech-nology companies increases in areas geographi-cally proximate to the developers of the underlyingtechnologies.
A second crucial resource for new venture creation,closely related to the first, is specialized human capi-tal. Prior to pitching an idea to potential investors andto starting operations, entrepreneurs must recruit themembers of the founding team and document the in-terest of the key technologists and managers who willassume senior positions at the new organization. Thus,technology-based entrepreneurship requires the abil-ity to recruit an initial staff of skilled technical andmanagerial workers.
Given the need for experienced managerial andtechnical labor, established high-technology firms of-ten provide the largest source of labor to new ventures
of like kind (Scott and Storper, 1987; Angel, 1991).To secure staff for a proposed company, entrepreneursoften leverage their networks to persuade potentialcofounders and employees to leave their current em-ployers to join their new organization (Sorenson andAudia, 2000). Because of the uncertain economicprospects of fledgling technology companies andquestions about the capacity of these organizationsto develop into operating companies, entrepreneursoften find it difficult to attract highly-skilled workersaway from secure positions at established organi-zations. Without trust in the founder of a companyand confidence in her ability and judgement, se-nior level managers and technologists will not likelyleave secure positions to join a new firm. Trust flowsthrough relationships. Assuming, as we have, that re-lationships concentrate spatially and that connectionsto workers at established firms play a large role insourcing specialized labor, then proximity to existingfirms should greatly expedite the recruitment of aworkforce.
In addition to being a source of skilled labor,established firms also serve as training grounds for—and therefore sources of—entrepreneurs. Successfulhigh-technology firms provide blueprints for the con-struction of organizations of their particular type(Meyer and Rowan, 1977; Hannan and Freeman,1989; Aldrich and Wiedenmayer, 1993; Thornton,1999). Insiders and close observers of establishedfirms in the industry have access to knowledge aboutappropriate organizational structures, strategies, andsystems for a new enterprise. Moreover, if startingthe new venture requires highly tacit and difficult totransfer knowledge, then only individuals with directtechnical experience will have the skills necessary tobegin a new company. Similarly, past experience at asuccessful company allows potential entrepreneurs toestablish the professional contacts and the reputationsnecessary to attract investors (Sorenson and Audia,2000; Shane and Cable, 2002). In addition, employ-ees of established firms often encounter unmet marketopportunities and exciting technical possibilities inthe course of their work. As laboratories for the ob-servation of organizational practice and as developersof new technology, established high-technology firmsthus provide a direct source of entrepreneurs (in ad-dition to would-be employees), making areas in thevicinity of established enterprises fecund places for
T. Stuart, O. Sorenson / Research Policy 32 (2003) 229–253 233
new venture creation.1 We predict:the rate of found-ing of new high-technology companies rises in areasgeographically proximate to established firms in afocal industry.
In addition to a foundational idea, technologicalexpertise, and a skilled labor supply, new technology-based startups require financial capital. Owing tothe difficulty of evaluating early stage technologycompanies, the prohibitive cost of technology de-velopment, and the high chance of failure amongtechnology-based startups, much of the funding fornew, technology-based concerns comes from VCfirms.
Though it might seem that investment capitalshould move easily across space, investors in earlystage ventures often consider only geographicallyproximate opportunities. Venture investors activelymonitor the firms in which they invest, and thereforeinsist upon close and frequent interactions with com-pany leaders (Gompers, 1995). Venture capitalists alsohelp portfolio companies recruit managers and cus-tomers, analyze markets, solve strategic, production,and organizational problems, identify new investorsand strategic partners, and select lawyers, consul-tants, accountants and investment banks (Bygrave andTimmons, 1992). Because of the depth and intensityof the relationship between venture capitalists and thestartups in which they invest, venture capitalists preferto fund spatially proximate ventures (Sorenson andStuart, 2001, present detailed evidence to this effect).
Venture capital firms also prefer to finance earlystage companies when principals at the VC firm havepre-established, direct or indirect relationships withentrepreneurs (Sorenson and Stuart, 2001; Shane and
1 A great deal of case-based evidence suggests that manyhigh-technology firms spawn from individuals who leave their cur-rent employers to establish new enterprises of the same type. Forinstance,Saxenian (1994)reports that former Raytheon employeesstarted close to 150 companies. Similarly, she notes that virtuallyevery Silicon Valley semiconductor firm began as an unofficialspin-off from a pre-existing chip producer.Phillips (2001) alsofinds that spin-offs account for most of the foundings in the pop-ulation of Silicon Valley law firms. In the population of biotech-nology firms, we identified 13 companies founded by former em-ployees of Hybritech, a biotech firm located in San Diego.Haug’s(1995) study of 33 Seattle area biotech firms similarly finds thatemployees of local biotech companies or members of Seattle arearesearch institutions established all but four (12%) of the firms inhis sample.
Cable, 2002; Shane and Stuart, 2002). The explanationfor this pattern centers on the fact that the transactionalrisks imposed by information asymmetries betweenentrepreneurs and venture investors shrink when thefinancial investment takes place in the context of anembedded relationship between entrepreneur and in-vestor. The presence of such a relationship may alsoprovide an extra-contractual deterrent to opportunisticbehavior when the financial contracts that govern therelationship do not deal with all possible contingen-cies that might arise. Again making the assumptionthat individuals’ networks localize geographically,this argument—and the preference of VCs to investin nearby companies—suggests that entrepreneursmay find it easier to secure funding for a new orga-nization when they reside in the vicinity of venturecapital firms. We anticipate:the rate of founding ofnew high-technology companies is greatest in areasgeographically close to VC firms.
The role of entrepreneurs’ networks in mobilizingresources offers only one of several possible reasonswhy proximity to technical experts, established firms,and venture investors accelerates new venture foun-ding rates. Unfortunately, a retrospective, population-level study cannot identify the myriad relationships ofprevious company founders; indeed, even observingthe connections of current-day entrepreneurs to all re-source holders in a population-level study would notbe possible. Therefore, we can only indirectly test howentrepreneurs’ networks affect new venture formation.
Regardless, we believe that the hypothesis that thegeographic distribution of network ties affects thespatial distribution of company formation implies aclear and unique expectation: the significance of geo-graphic proximity to resource holders should wane asthe industry evolves. This shift occurs because the ge-ographic reach of individuals’ networks expands overtime as industry-centered conferences, industry asso-ciations, and the like facilitate the formation of tiesamong geographically disparate industry participants.Moreover, when an entirely new technological fieldemerges on the heels of a radical scientific advance,the pioneers of the technology typically reside at justa few firms or universities. Effectively, new scien-tific fields are for a time ‘naturally excludable’: theyemerge from the labs of a few leading researchers,and proficiency in the new area requires the hands-ontraining from one of the technology’s pioneers (Zucker
234 T. Stuart, O. Sorenson / Research Policy 32 (2003) 229–253
et al., 1998). As universities and firms invest in thenew technology and as the scientific foundations andmethods of production for a new area become in-corporated in university curricula and corporate pro-duction processes, close proximity to the sources oftechnology may become less important and special-ized labor should become less scarce. As researcherspublish patent disclosures and academic papers, as-semble at technical and investment conferences,join and found new firms and technology consult-ing companies, knowledge disseminates more widely(Almeida and Kogut, 1997; Zucker et al., 1998).With the growth of an industry and the emergenceof events and organizations that disseminate infor-mation, knowledge of technical developments andjob and market opportunities diffuse more broadly.We expect:the effect of being near to resource hold-ers on the rate of founding of new high-technologycompanies declines as the focal industry matures.2
3. Local competition and the performanceof new ventures
Our central assertion to this point is that the un-certainty regarding new venture success coupled withthe spatial concentration of social and professionalrelationships debilitates the resource mobilizationprocess in geographic areas scarce in the essentialproduction inputs (capital, labor, and technology). Wenow shift our attention to consider how the spatialdistribution of resources affects the performance ofearly stage ventures. We believe that the factors thatpromote new venture formation differ from those thatenhance the post-entry performance of early stagecompanies. In particular, we argue that new venturesin geographically crowded areas, though benefitingfrom proximity to technical experts, suffer from the
2 In a study of geographic patterns of affiliation between aca-demic scientists and biotechnology companies,Audretsch andStephan (1996)develop a very similar prediction at the level of theindividual scientist. This paper finds that older scientists and starscientists are much more likely than young scientists to have a for-mal affiliation (e.g. membership on the scientific advisory board)with a geographically distant biotech company. They ascribe thisfinding to the greater reach of the networks of established scien-tists, and thus their argument directly parallels our hypothesis thatresource proximity effects will diminish over time as networks inthe industry extend in reach.
competition generated by a heavy concentration ofnearby competitors. Stated differently, we hypothe-size that negative ecological externalities arising fromintense competition among spatially proximate firmsmay unavoidably follow fecund founding conditions(Baum and Haveman, 1997).
Beginning with the positive dimension of geo-graphic concentration, we expect that high-technologystartups located near to many technical experts mayperform well. First, engineers and scientists likelyhave extensive professional contacts when locatedclose to many experts in their area of specialty. Pre-sumably, they can leverage these contacts to obtainquick resolutions to specific technical dilemmas. Tosucceed, high-technology startups must also recruitindividuals with strong technical skills. The presenceof a large number of technologists in the vicinity of afirm surely facilitates the recruiting of key staff mem-bers and therefore benefits firms in areas with a richsupply of highly-skilled workers. For these reasons,we expect thatspatial proximity to scientific expertswho work in the domain of high-technology startupsimproves new venture performance.
Although proximity to technical experts will likelyenhance firm performance, we expect that locatingin a geographic area crowded with many competingfirms adversely impacts startups. Despite the fact thathigh-technology firms typically face national or globalproduct markets, firms will likely compete intenselyat the local level for at least one of the key inputs toproduction: labor. It is widely understood that firms oflike kind occupy structurally equivalent positions inbuyer–supplier networks3 (McPherson, 1983; Podolnyet al., 1996; Sorenson and Audia, 2000), implyingamong other things that firms in the same industrysegment demand similar types of skilled (technicaland managerial) labor. This in turn implies high, localcompetition for one of the most important productioninputs in knowledge-based industries, particularly ifone assumes that the high transaction costs associated
3 In the social networks literature, two actors are structurallyequivalent in a network of relations when they have identical ties toidentical actors. The concept has been generalized to operationalizeorganizational niches in networks of inter-firm transactions, and ithas been extended in this context to refer to a situation in whichtwo firms interact with the sametype of alters, in addition to theexact same alters (seeDiMaggio, 1986; Burt, 1992; Podolny et al.,1996).
T. Stuart, O. Sorenson / Research Policy 32 (2003) 229–253 235
with relocation preclude the rapid equilibration of la-bor supply and demand in professional labor markets.
This position stands in direct opposition to theclaim of some researchers that open labor markets andrampant inter-firm mobility represent a distinctiveadvantage that accrues to firms in regional technol-ogy clusters (Angel, 1991; Scott and Storper, 1987;Saxenian, 1994). According to this work, recruitingmanagers and technologists from competitors benefitsfirms, because it enables them to integrate technolo-gies and competencies imported with these itinerantworkers (Baty et al., 1971; Granovetter, 1974; Aldrichand Pfeffer, 1976). Yet, in addition to the wage infla-tion generated by heavy competition for local laborand the fact that firms will lose technology from themobility of their staff as often as they gain it froma competitor, open labor markets and very high ratesof inter-firm mobility may also lead enterprises ina region to converge around particular technologiesand strategies. Recruitment from the same managerialand technical pool can lead to a reduction in strategicdiversity among the firms in a technology cluster. Forexample,Boeker (1997)found that recruiting a man-ager from a firm with a particular product portfolio in-creased the likelihood that the destination firm wouldenter the markets occupied by the firm from which themanager originated (Rao and Drazin, 2002, presentsimilar evidence from the mutual fund industry). As aresult of the strategic convergence and implicit compe-tition created by sharing the same labor pool,Sørensen(1999) has demonstrated that organizational growthsuffers when firms recruit managers from the same setof organizations.4 Particularly when holding constantthe overall supply of skilled labor in the vicinity of afocal firm—so as not to confound inter-firm mobilityrates and the size of the supply of skilled labor—weanticipate thatspatial proximity to competing firmsdetracts from new venture performance.
Lastly, we argue that locating in a region with manyVC firms may also hinder new venture performance.We anticipate that the optimal situation for a given firm
4 This implies that, even with geographically dispersed marketsfor technological end products, firms in dense industrial clustersstill may experience more intense competition inboth labor andproduct markets. The former occurs because they compete for thesame local labor supply and the latter results from the strategicconvergence that follows from the high rates of inter-firm personnelmobility and demographic similarity.
is to receive venture financing, yet do so while locatingin a region that contains few providers of VC. Venturecapital firms, although obviously not direct competi-tors of high-technology startups, can adversely affectthe performance of new ventures in two ways. First,VCs may recruit important managers and technolo-gists away from a focal organization for the purpose ofcreating a new firm. Of course, encouraging workersto leave their employers to establish new companiesneed not be predatory; a significant pool of VC in a re-gion presents a temptation for highly-skilled staff (po-tential entrepreneurs), who will find it easier to leavetheir current employers to start new companies. At aminimum, the departure of key managers and researchpersonnel will delay technology development at a firm.These departures may also lead to the formation of newcompanies that compete directly with a focal organiza-tion in the technological areas in which it specializes.Second, VC firms can undermine the performance ofestablished firms by providing funding to their com-petitors. To the extent that venture capitalists preferto fund companies located near to them (cf.Sorensonand Stuart, 2001), then proximity to many VCs im-plies that a focal organization may compete againstwell-financed rivals in local factor markets. Particu-larly when taking the funding status of a focal organi-zation into account, we predict that “spatial proximityto VC firms detracts from new venture performance”.
In summary, we hypothesize that proximity tomany of the resources anticipated to promote newventure creation in fact detracts from the performanceof newly formed companies. The exception to this isproximity to technical experts, which we suspect willbenefit startups.
4. Context and spatial measures
To test our ideas, we have gathered data on all USVC firms, all US biotechnology firms, all US researchuniversities, and all US biotechnology patents. Thus,we situate our analyses of the effects of spatial prox-imity to resources on organizational creation and per-formance in the biotechnology industry. We selectedthe biotechnology industry to study because of its (rel-ative) newness. Recentness concerns us because weneed to trace important events back to the origin of theindustry to avoid bias associated with left censoring.The analyses investigate location-specific founding
236 T. Stuart, O. Sorenson / Research Policy 32 (2003) 229–253
rates in the population of dedicated biotechnologyfirms (DBFs)—organizations founded to research, de-velop, and commercialize biotechnologies—and theimpact of location on the early-life performance of asubset of the population.
As the three central biotechnology productioninputs, we have argued that the proximity of ageographic region to experts in biotechnology, estab-lished biotechnology firms, and VC firms should af-fect founding rates in that region and the performanceof startups in the region. We have identified tech-nical experts in two ways. First, we have measuredthe continuous distance of each focal area (and eachestablished firm) to universities with departments inbiotech-relevant disciplines, including biochemistry,cellular and molecular biology, and microbiology.Second, we have identified approximately 30,000biotechnology patents developed in the United States(filed between the early 1970s and the middle 1990s).These data come from the Micropatent Patent AbstractCD series, which contains basic information on allUS patents from the mid-1970s to mid-1990s. Froma different data source (the Center for Regional Eco-nomic Issues at Case Western Reserve University),we obtained the address of the lead inventor listed oneach of these patents, which enables us to determinethe distance of physical areas and firms to the loca-tions of all lead inventors of patented biotechnologies.As we discuss below, we continuously updated theproximity measures as new patents ‘arrive’.
Next, we acquired data on the locations of VC firmsfrom the Securities Data Corporation’s (SDC) NewVentures database. The SDC database covers the entireindustry and reports the date when each VC organi-zation began operations. It also includes the foundingdates and locations of all VC firms.5
We acquired founding dates and the locationof biotechnology firms from a number of sources.First, the SDC New Ventures database covers allventure-backed biotechnology firms. Much of thedata on non-VC-backed firms came from Informagen,a biotechnology industry directory available on the
5 Some venture capital firms have established satellite offices.Unfortunately, SDC only reports the location of the headquartersoffice for each VC firm. Therefore, our calculations of the distancesof biotechnology firms and geographic areas to VCs will be biasedupward, because we cannot account for VC branch offices.
web (www.informagen.com). For additional informa-tion on the founding dates and locations of DBFs, weconsulted the Bioscan and CorpTech directories, SECfilings, the Lexis/Nexis database, and Bioworld.
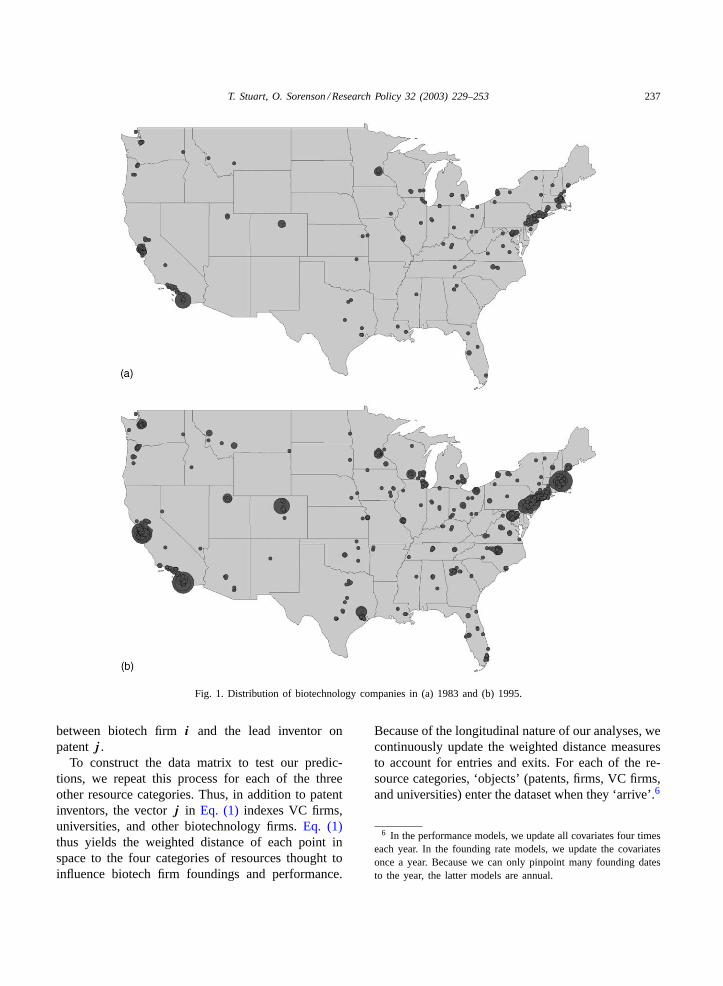
Because our analyses focus on the spatial determi-nants of firm foundings and performance, the readermay find it useful to have a sense of the geographicdistribution of the biotechnology industry.Fig. 1apor-trays the locations of all biotech firms established priorto 1983 andFig. 1billustrates the spatial configurationof the industry at the end of 1995. The figures demon-strate that the heaviest concentrations of biotechnol-ogy firms reside in the San Francisco Bay area, thegreater San Diego area, and the eastern Seaboard,primarily in Massachusetts, New York, Pennsylvaniaand New Jersey. Only two of the contiguous states—Wyoming and West Virginia—had no biotechnologyfirms at the onset of 1996.
To test the effects on the location-specific found-ing rates and performance of biotechnology firms ofbeing near to (1) other biotechnology companies; (2)the lead inventors of patented biotechnologies; (3) VCfirms; and (4) universities with leading departmentsin the biological sciences, we constructed quarterly,distance-weighted measures of the local concentrationof each of these four resource categories relative toevery focal organization and geographic area. Becauseall measures follow the same method of construction,we limit our discussion of the computation to the cre-ation of the ‘patent concentration (PC)’ variable—themeasure of proximity to the lead inventors on biotech-nology patents—with respect to focal biotech firms.We created this measure by weighting the contributionof each patent to each point in space by the inverseof the distance between the focal point in space andthe lead inventor on the patent (seeSorenson andAudia, 2000, for more detail). We then summed theseweighted contributions across all patents to yield adistance-weighted measure of the proximity of eachpoint in space to all patent inventors. Suppose that apoint in space corresponds to the location of a focalbiotech firm, which we labeli. The PC for biotechfirm i at timet can be described by the equation:
PCit = �j
{1
[1 + d(ij)]
}(1)
where j indexes all patents that do not belong toorganization i, and d(ij ) is the physical distance
T. Stuart, O. Sorenson / Research Policy 32 (2003) 229–253 237
Fig. 1. Distribution of biotechnology companies in (a) 1983 and (b) 1995.
between biotech firmi and the lead inventor onpatentj .
To construct the data matrix to test our predic-tions, we repeat this process for each of the threeother resource categories. Thus, in addition to patentinventors, the vectorj in Eq. (1) indexes VC firms,universities, and other biotechnology firms.Eq. (1)thus yields the weighted distance of each point inspace to the four categories of resources thought toinfluence biotech firm foundings and performance.
Because of the longitudinal nature of our analyses, wecontinuously update the weighted distance measuresto account for entries and exits. For each of the re-source categories, ‘objects’ (patents, firms, VC firms,and universities) enter the dataset when they ‘arrive’.6
6 In the performance models, we update all covariates four timeseach year. In the founding rate models, we update the covariatesonce a year. Because we can only pinpoint many founding datesto the year, the latter models are annual.
238 T. Stuart, O. Sorenson / Research Policy 32 (2003) 229–253
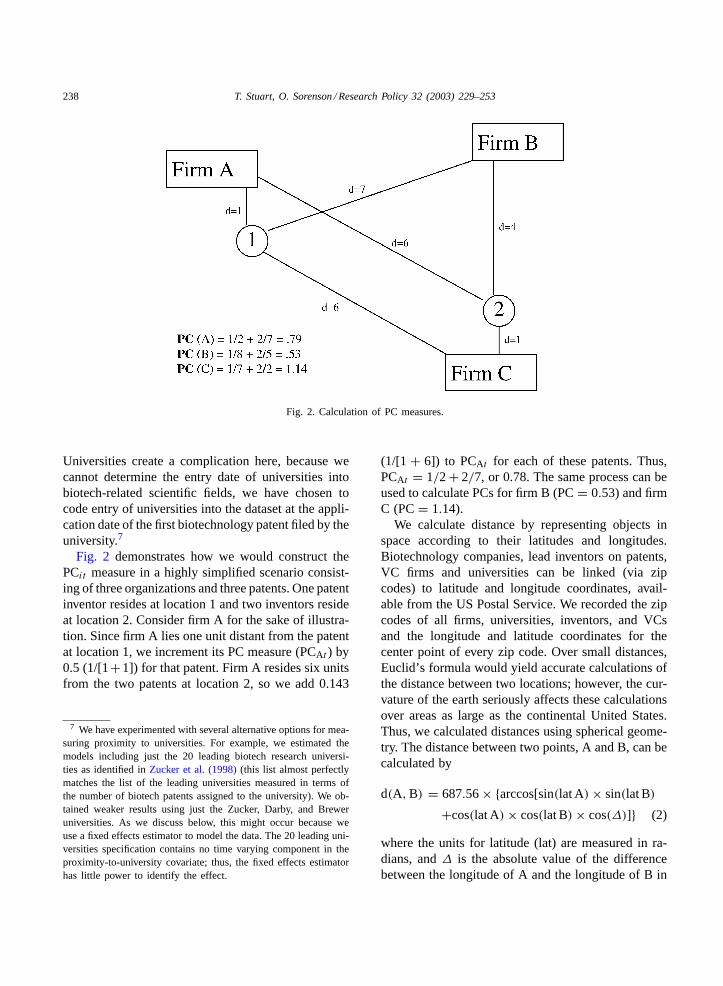
Fig. 2. Calculation of PC measures.
Universities create a complication here, because wecannot determine the entry date of universities intobiotech-related scientific fields, we have chosen tocode entry of universities into the dataset at the appli-cation date of the first biotechnology patent filed by theuniversity.7
Fig. 2 demonstrates how we would construct thePCit measure in a highly simplified scenario consist-ing of three organizations and three patents. One patentinventor resides at location 1 and two inventors resideat location 2. Consider firm A for the sake of illustra-tion. Since firm A lies one unit distant from the patentat location 1, we increment its PC measure (PCAt ) by0.5 (1/[1+1]) for that patent. Firm A resides six unitsfrom the two patents at location 2, so we add 0.143
7 We have experimented with several alternative options for mea-suring proximity to universities. For example, we estimated themodels including just the 20 leading biotech research universi-ties as identified inZucker et al. (1998)(this list almost perfectlymatches the list of the leading universities measured in terms ofthe number of biotech patents assigned to the university). We ob-tained weaker results using just the Zucker, Darby, and Breweruniversities. As we discuss below, this might occur because weuse a fixed effects estimator to model the data. The 20 leading uni-versities specification contains no time varying component in theproximity-to-university covariate; thus, the fixed effects estimatorhas little power to identify the effect.
(1/[1 + 6]) to PCAt for each of these patents. Thus,PCAt = 1/2+ 2/7, or 0.78. The same process can beused to calculate PCs for firm B (PC= 0.53) and firmC (PC= 1.14).
We calculate distance by representing objects inspace according to their latitudes and longitudes.Biotechnology companies, lead inventors on patents,VC firms and universities can be linked (via zipcodes) to latitude and longitude coordinates, avail-able from the US Postal Service. We recorded the zipcodes of all firms, universities, inventors, and VCsand the longitude and latitude coordinates for thecenter point of every zip code. Over small distances,Euclid’s formula would yield accurate calculations ofthe distance between two locations; however, the cur-vature of the earth seriously affects these calculationsover areas as large as the continental United States.Thus, we calculated distances using spherical geome-try. The distance between two points, A and B, can becalculated by
d(A, B) = 687.56× {arccos[sin(lat A) × sin(lat B)
+cos(lat A) × cos(lat B) × cos(∆)]} (2)
where the units for latitude (lat) are measured in ra-dians, and∆ is the absolute value of the differencebetween the longitude of A and the longitude of B in
T. Stuart, O. Sorenson / Research Policy 32 (2003) 229–253 239
radians. The constant, 687.56, converts the distanceinto units of 5 miles.8
5. Methods and control variables
5.1. New venture creation
To investigate the new venture founding process,we analyzed the arrival rates of new biotechnologycompanies at the level of the zip code. The analysis ofevent counts has become the standard method for in-vestigating founding rates in organizational sociology(Hannan and Freeman, 1989; Hannan and Carroll,1992). Our analysis differs from others in that it al-lows for spatial heterogeneity in founding rates anddoes so at a very fine-grained level.
Most of the work on spatial heterogeneity in orga-nizational founding and failure rates has used muchlarger regions, such as SMSA9 or states, as the unitsof analysis (e.g.Carroll and Wade, 1991; Lomi, 1995;Zucker et al., 1998; Sorenson and Audia, 2000; for anexception, seeBarnett and Sorenson, 2002). We haveopted to use the smallest geographic units we can ob-serve, zip codes, and to utilize continuous distancesrather than binary density measures.10 Looking at thespatial distribution of the firms in the industry (Fig. 1aand b), it seems clear that segmenting the population
8 The constant term we use implies that objects receive a weightof 0.5 when they lie 5 miles away from a focal point, and so onaccording to the concentration equation. The process of computingweighted distances consumes a great deal of time for a data matrixas large as ours, but we did recalculate all distance variables using10-mile units (thus, an object 10 miles from a focal point receivesa weight of 0.5). The bivariate correlations between 5- and 10-mileconcentration measures all exceeded 0.985, and the results did notsubstantively change in models using 10-mile units.
9 The US Office of Management and Budget defines and usesmetropolitan statistical areas (MSA) and standard metropolitanstatistical areas (SMSA) to report information on geographicallycontiguous regions. These regions typically include both a ‘core’city as well as the suburbs and satellite communities that layin close geographic proximity to the primary city; these regionspresumably represent communities with a substantial degree ofeconomic and social integration.10 On average, a zip code covers a considerably smaller geo-
graphic area than a MSA. In the data we analyze, the mean areaof a zip code is 27.4 square miles (S.D. = 56.9 square miles). Themean area of an MSA is 10,515 square miles (S.D. = 154,443.1square miles).
at city or state levels would result in highly arbitraryspatial boundaries, many of which would bisect tech-nology clusters and yield inaccurate measures of thetrue levels of local resource concentrations. Definingdensity variables at the SMSA or state level creates aproblem, because studies that have done this treat theseunits as self-contained populations. In these studies,density measures (such as firm density) have been in-cremented only for organizations inside the focal area(i.e. the density of objecti in regionj simply countsthe number ofi in eachj ). Local density counts ig-nore the presence of any objects that fall beyond thearbitrary geographic boundary, even if they lie verynear to the borderline.
The weighted density measures employed in theseanalyses redress the problem of arbitrary boundaries.However, because of the computational intensity ofthe method for calculating inter-object distances, wecannot investigate entry rates in all zip codes in thecountry. Thus, in the founding rate models, we con-dition our analyses on the first arrival of a biotech-nology company to a locale (i.e. we do not model thefirst founding of a biotechnology firm in a zip code;only subsequent founding events enter the analysis). Inthis sense, our models describe why some local areasgain additional firms while others do not, rather thanwhy any particular zip code has a biotechnology firm(Barnett and Sorenson, 2002, adopt a similar approachin their study of Illinois banks); in other words, we ex-amine the determinants of co-location of biotech firms.
With event count data such as organizational births,error distributions tend to be skewed, because zerobounds the lower end of the observed range. Re-searchers often estimate models on such data usingPoisson regression. This procedure assumes that aPoisson process governs the occurrence of the ob-served events. Nevertheless, the Poisson process doesnot allow for unobserved heterogeneity (the indepen-dent variables must completely determine the rate)or variation in the base rate (King, 1989). Since wesuspect that several factors that may influence therate of founding do not appear in our models, Poissonregression does not seem appropriate for our data.
To cope with unobserved heterogeneity and time-dependence in the rate, researchers typically use neg-ative binomial regression to analyze event counts. Weemploy a variant of the negative binomial estimatorthat accommodates interdependence among founding
240 T. Stuart, O. Sorenson / Research Policy 32 (2003) 229–253
events that may arise because the data contain mul-tiple observations within each geographic area. Toaccount for the possibility that some unspecified fac-tors, which vary systematically with location, mayinfluence founding rates, we employHausman et al.(1984)fixed-effects version of the negative binomialmodel. This estimator conditions on the total numberof events in a particular region. We report regressionsthat include the fixed effect at the state level.11 Statesdiffer with respect to several of the institutional factorsthought to influence entrepreneurial activity. First, cor-porate tax rates vary significantly across states. Sec-ond, the legality and the enforcement of non-competecontracts between employers and employees varyacross states and may have a major impact on thepropensity of would-be entrepreneurs to depart fromestablished firms to begin new companies (Gilson,1999; and seeStuart and Sorenson, 2002, for evi-dence). Hence, our models incorporate an implicit con-trol for the total organizational fecundity of the state.
Finally, although we know the exact date of incor-poration for a substantial number of biotechnologyfirms, we can identify only the year of founding formany of the firms in the population. As a result, we or-ganize the data as annual panels of observations on thenumber of biotechnology foundings in each zip code(conditioned on there having been a previous biotech-nology firm founding in the zip code), and we enterall covariates in the founding models as 1-year lags.
5.2. New venture performance
We follow a number of recent studies (e.g.Freeman,1999; Stuart et al., 1999; Baron et al., 2001; Shane andStuart, 2002) that examine the occurrence of an initialsale of securities on the public equity markets as a per-formance milestone for early stage technology compa-nies. We have opted to analyze the hazard of IPO fortwo reasons. First, we can observe this metric for allfirms in the sample. Alternative measures of organiza-tional performance, such as accounting-based metricsand firm growth rates, would exclude the majority offirm-years in the dataset, because private companies
11 We also report the full model with the fixed effect included atthe MSA level. We obtain very similar results using MSA-levelfixed effects, but we concentrate on the state-level models, because7.1% of the observations occur in zip codes that do not fall withinany MSA.
generally do not divulge this information. The secondreason why we model IPOs is that it represents anextremely important milestone for high-technologyfirms in general, and biotechnology firms in particular.Biotechnology firms—especially companies devel-oping human therapeutics—incur very high productdevelopment and commercialization costs. As a re-sult, these firms depend critically upon the sale ofequity to raise technology development funds.
To insure that the occurrence of an IPO provides avalid indicator of new venture performance, we haveopted to limit the time-to-IPO analyses to the subsetof firms that received venture financing. Three fac-tors contributed to this decision, and in our view theseconsiderations offset the disadvantage that limiting theperformance analyses to VC funded companies re-duces the generalizability of the results. First and fore-most, we can be certain that all VC funded biotechcompanies aspire to go public. Although VC firms mayvary in how quickly they push portfolio companies to-ward an IPO, VCs generally prefer a quick liquidityevent so they can make cash distributions to the fund’sinvestors (cf.Gompers and Lerner, 1999). Second, wepossess information on the exact time of founding onlyfor VC-backed firms. Third, VC-funded companieslook more alike than the members of the biotechnol-ogy population as a whole. The population of biotechfirms contains considerable diversity in the businessmodels and market niches represented. Restricting thesample to VC-supported companies results in a sub-stantial reduction in this heterogeneity. Since firm het-erogeneity may affect the results, to the extent thatdifferences in business models and market niches cor-relate with the weighted resource density measures,limiting this variance can dramatically improve the ac-curacy of estimation. Thus, the performance modelsonly include venture-backed companies.
We estimate the transition to public status as aninstantaneous hazard rate (Tuma and Hannan, 1984).The hazard rate (h(t)) is defined as follows:
h(t) = lim�t→0
P(IPO betweent andt + �t |private att)
�t
(3)
whereP(.) is the probability of going public (an IPO)in the period running fromt to t + �t , conditionalon the firm still being private at timet. To avoidmis-specification of age dependence, we employ
T. Stuart, O. Sorenson / Research Policy 32 (2003) 229–253 241
a piece-wise specification following the procedureused in Barron et al. (1994). The piece-wise ex-ponential model breaks time into several dummyvariables representing mutually exclusive periods inthe organization’s life. Within each of these periods,the baseline rate does not change, but the rate variesfreely across segments. This specification allows usto model age dependence without making strongassumptions regarding its functional form.
Our analysis covers the time period from 1 January1978 to 31 December 1995. A relatively small num-ber of biotechnology companies started before 1978,so we begin the analyses very shortly after the emer-gence of the industry. All covariates date back to thestart of the industry, and we have no left-censored or-ganizational or geographic histories.
The values for most of the covariates vary over thehistory of each organization. To account for this varia-tion, we used ‘spell-splitting’, the standard procedurefor incorporating time-varying covariates in eventhistory analysis (Tuma and Hannan, 1984). We splitorganizational histories into quarter-year spells, whichallowed us to update all covariates four times a year.The weighted density measures in the IPO modelsreceived quarterly updating using the same procedureas in the founding models. If the organization did nothave an IPO prior to the end of a quarter, we codedits observation during that spell as right-censored.An IPO was an absorbing state in the performanceanalyses, so firms left the risk set at the time that theyexperienced IPOs.
5.3. Control variables
We controlled for three additional environmentalcharacteristics that likely affect founding rates andfirm performance. First, the analyses included an eq-uity index representing changes in the valuation ofpublic biotechnology stocks. The index, described byLerner (1994), consists of equal dollar shares of thir-teen publicly traded, DBFs. We included this variablebecause the ability of a company to go public and theincentive of entrepreneurs and VCs to start new firmsmay depend upon equity market conditions (Ritter,1984). In the time-to-IPO models, the biotech equityindex updates quarterly. In the founding models, theindex enters as its average value during the laggedyear.
We have also included in the models the nationaldensity of DBFs. We entered this variable to link theempirical analyses to the density dependent model oflegitimation and competition, which has become thestandard founding rate model in organizational anal-ysis (Hannan and Carroll, 1992). We anticipate thatdensity will have an inverted U-shaped effect on therate of foundings and IPOs. The density dependencemodel predicts that rising legitimation increases therates of founding and IPOs with initial increases in na-tional biotech firm density, while the opposing forceof competition will eventually decrease these rates asdensity continues to rise.
The human population of each zip code in 1990 alsoenters in the models. We included this variable becausemore populated areas contain a greater number ofpotential entrepreneurs and, in all likelihood, superiorinfrastructure for starting new companies. We alsocontrol for the age of the industry in each geographicarea. This variable enters by itself and as an inter-action term with the weighted density variables todetermine if, as implied by the network-based accountof new venture formation, the effects of proximityto resources become less important as the industrymatures. To differentiate industry age from other de-velopmental processes, we also include a control forthe calendar year.
Finally, we included three firm-level controlvariables in the IPO models, each of which updatedquarterly: a cumulating sum of the dollar amountof venture funding received by each firm; a time-changing count of the number of VC financing roundsexperienced by each firm; and the number of patentsgranted to the firm, which also changes over time.Because all of the firms in the performance samplereceive venture backing and all participate in the sameindustry, these three variables should control for qual-ity differences between firms. Moreover, including allof these firm quality controls renders a more conser-vative test of the geographic proximity covariates.
6. Results
6.1. New venture creation
Table 1 reports means and standard deviationsfor the variables in the models.Table 2presents the
242 T. Stuart, O. Sorenson / Research Policy 32 (2003) 229–253
Table 1Descriptive statistics
Independent variables Mean S.D. Minimum Maximum
1990 zip code population (logged) 9.217 2.585 4.317 11.577BT equity index 3.087 0.799 1.182 4.802National BT density 828.772 354.665 35 1271Total number of financing rounds 2.134 1.762 0 10Total VC raised ($M) 8.984 13.570 0 123.937BT firm concentration 21.239 17.794 1.168 111.092BT patent concentration 343.316 285.779 1.207 1575.475VC concentration 31.034 27.934 0.780 217.637University concentration 1.926 2.561 0 16.704Calendar year 16.325 4.232 5 22Local industry age 7.005 4.767 1 35
Descriptive statistics from the founding rate dataset, with the exception of “total number of financing rounds” and “total VC raised”. Thelatter two variables reflect their values in the time-to-IPO dataset.
fixed-effects negative binomial founding rate models.In the baseline model, the national biotech densityvariable depresses founding rates. We report specifi-cations that include only a monotonic density effect,because adding the density-squared term did notimprove model fit. In both the founding rate andtime-to-IPO models, the national density effect is ex-clusively competitive. In the baseline model, neitherthe 1990 census population of the zip code nor theindex of biotech equities had a statistically significanteffect on the founding rate.
The age of the local biotech industry has a strong,positive effect in the baseline model. Two possiblefactors could explain this result. First, local indus-try age may proxy for the establishment of comple-mentary businesses, such as specialized law firms andlab equipment suppliers that likely enter an area afterbiotech firms establish themselves, that could accel-erate local founding rates. Second, local industry agemay correlate positively with the size of biotech firmsin a region. If larger firms produce more spin-offs,then industry age would have a positive effect on thefounding rate (indeed, this variable continues to havea positive effect even after entering the weighted den-sity of biotech firms).
We enter the local resource concentration variablesseparately in models 2–5. Proximity to the resourcecategories positively and significantly impacts found-ing in each of the four models; zip codes spatiallyproximate to other biotechnology firms (model 2),biotechnology patent inventors (model 3), VC firms
(model 4),12 and leading universities (model 5) all ex-perience accelerated founding rates.
Before discussing the full model, let us emphasizethat our theory of the spatial determinants of newventure creation holds that resource mobilization in-volves leveraging relationships that we have assumedto be geographically concentrated. Unfortunately, wecannot directly measure the many ties between en-trepreneurs (founders) and resource holders. We do,however, know the locations of all VC firms and allbiotechnology startups. This permits us to be morespecific about the extent to which funding relation-ships between VCs and startups localize geographi-cally. With 399 venture-backed biotech startups and1543 VC firms, we created a data set that consists ofall potential VC firm-startup pairings (i.e. dyads con-sisting of each biotech startup paired with every VCfirm). We then dummy coded all dyads by whetheror not the VC firm in each pairing invested in thefirst-round funding of the biotech startup. A total of1224 of these dyads were ‘realized’, meaning that theVC firm in the dyad participated in the target firm’sfirst funding round. In the realized dyads, the 25thpercentile of the distribution of distances betweenVC and biotech firms fell at 23 miles and the median
12 In the models inTable 2, we have computed the VC con-centration variable using all VC firms. In unreported models, wecomputed the concentration variable by excluding all VC firmsthat had not made at least one previous investment in a biotechcompany. The two variables correlate very highly and the resultsdo not change using the alternative specification.
T. Stuart, O. Sorenson / Research Policy 32 (2003) 229–253 243
244 T. Stuart, O. Sorenson / Research Policy 32 (2003) 229–253
at 304 miles. In contrast, the same descriptors of thedistance distribution for the unrealized dyads were356 miles (25th percentile) and 1057 miles (median).Thus, VC investments support to our assumption,localizing strongly in geographic space.13
Model 6 includes all four of the local concentra-tion variables entered simultaneously. In this model,three of the four weighted density variables remainpositive and statistically significant. The coefficientmagnitudes indicate that proximity to other biotechfirms has the strongest effect on the founding rate; astandard deviation increase in local firm concentra-tion multiplies the founding rate by a factor of 1.67(exp[0.0289×17.79]). For comparison, a standard devia-tion increase in either the weighted VC or universitydensity variables accelerates the founding rate by ap-proximately 20%.14
Model 7 includes two interaction effects. One in-teracts the age of the local biotech industry and theweighted density of biotech firms. The second mul-tiplies local industry age and the weighted density of
13 These differences are statistically significant. The geographicdistance between realized and unrealized dyads becomes increas-ingly similar as we move beyond the median of the distributionsof distances in the realized and unrealized dyads because of syndi-cation: most VC investments include multiple VCs and often onlythe lead investor actively nurtures and monitors the startup. Syn-dication allows VC firms far from a focal venture to participate inthat deal. If we could identify which of the VCs in a round led,we would almost surely find even stronger evidence of localiza-tion. We also estimated a probit model predicting the likelihood ofa VC-startup investment as a function of physical proximity. Thismodel included as covariates the distance between VC firms andstartups and a count of the number of investments made by eachVC firm in biotech startups. The latter variable controls for VCfirm specialization, which may be correlated with location. Theestimated coefficient for distance was negative, large, and highlysignificant (P < 0.0001). In short, geographic distance stronglyinfluences the pairing of investors and new ventures (Sorensonand Stuart, 2001, present detailed evidence relating to geographicpatterns in VC investing).14 Recall that the founding rate models condition on the first
founding of a biotechnology firm in a focal zip code. Given the tacitnature of knowledge in biotechnology, the proximity to leadinguniversities would likely have a stronger effect in models thatdo not condition on the existence of the first biotechnology firm,because academic researchers founded or transferred technologyinto many of the initial entrants into the industry (Audretschand Stephan, 1996; Zucker et al., 1998). Unreported regressionsconfirm this speculation. In short, the way we created the sampleattenuates the effect of proximity to universities on the foundingrate.
universities. We include these two interactions in thefounding rate models to test the network-based theoryof new venture formation. The prediction is that ge-ographic proximity to resource holders will have thegreatest impact on local founding rates in the earlyperiod of the industry when would-be entrepreneurshave few formal opportunities to meet members of theindustry from geographically distant locales. We antic-ipate that the geographic effects will taper as industryparticipants establish trade associations, conferencesand events that facilitate professional relationshipsbetween geographically disparate individuals.
Before reporting the findings, we first show thatindustry conferences and community-developmentorganizations emerged gradually with the evolution ofthe organizational field.Table 3reports the foundingdates of many of the biotech industry’s state and na-tional trade associations, conferences for the scientific,business, and investment communities, governmentfunding agencies, specialty consulting and law firms,and trade publications. The table illustrates that thesesocial foci—work-related forums in which individualsin the industry convene to discuss ideas and furthercollective interests—developed in tandem with theindustry. Technical specialists, experienced managersand consultants, and venture capitalists come intocontact through the activities of these unifying eventsand organizations. We expect that a byproduct of theorganizations and conferences inTable 3is an expan-sion of the geographic reach of industry participants’professional contact networks, thereby reducing theimpact of geography on population dynamics.
The results including the geography–age interac-tions appear in model 7 ofTable 2.15 The statisticallysignificant and negative interaction effects on both
15 An identical pattern of results obtains if the overall age of theindustry is used to create the interaction effects, rather than theage of the industry in a focal area. Conceptually, we prefer thelatter specification. Using local industry age affords the possibilityof a type of residual centrality effect: it allows for the (presumed)network effects to be stronger—and thus to more quickly dissipatethe importance of local resource concentrations on local foundingrates—in regions that entered the industry earlier. If one assumesrandom linkages within the industry-wide network of professionalrelationships and that some ties have durations of many years,then the individuals in the industry in older locales will on balancehave more extensive networks than industry participants in recentlyformed agglomerations. These differences are assumed away whenthe interaction effects are specified with industry age.
T. Stuart, O. Sorenson / Research Policy 32 (2003) 229–253 245
Table 3Date of establishment of biotechnology industry conferences andtrade associations
Organizations and conferences Founded
National- and state-level industry associationsASEE: Biomedical Engineering Division 1973Industrial Biotech Association 1981Massachusetts Biotechnology Council 1985Pharma 1985ASEE: Biological and Agricultural
Engineering Division1985
Association of Biotechnology Companies 1986Georgia Biomedical Partnership 1989Minnesota Biotechnology Association 1989Washington Biotechnology and Biomedical
Association1989
The Chicago Biotech Network 1989BIOCOM 1989Connecticut United for Research Excellence 1990Bay Area Bioscience Center 1990New York Biotechnology Association 1991Southern California BioMedical Council 1991Biotechnology Industry Organization (BIO) 1993Oregon Biosciences Association 1993Arkansas Biotechnology Association 1994Iowa Biotechnology Association 1994Biotechnology Council of New Jersey 1994Biotechnology Association of Maine 1996
Conferences: scientificThe Asilomar Conference 1975The Recombinant DNA Advisory
Committee (RAC)1987
International Genome Sequencing andAnalysis Conference
1988
Conference on Research in ComputationalMolecular Biology (SKB sponsor)
1997
Conferences: business communityALLICENSE 1989BIOCOM 1989Ernst and Young/Oxford Ventures National
Conference1989
Recombinant Capital/Wilson SonsiniGoodrich and Rosati
1997
Conferences: investment communityAnnual Conference in Yeast Genetics and
variables indicate that local founding rates do indeedbecome less sensitive to the presence of spatially prox-imate firms and universities over time.16 Although onecould envision other social processes that lead to adecline over time in the influence of geographic prox-imity to resource categories on the local founding rate,we believe that the network-based explanation devel-oped here is the most likely of the obvious candidates.
Finally, although we do not report the results,the coefficients in the regressions inTable 2 areconsistently in the same direction and of similar
16 We do not run the industry age interaction with local VCdensity, because one explanation for why VCs invest in spatiallyproximate companies is that it is costly to monitor investmentsthat are far away. Such costs obviously would not decline with in-dustry age. AlthoughSorenson and Stuart (2001)present evidencethat VCs extend the spatial reach of their investments when theirnetworks expand, this effect proves to be contingent on the pres-ence of syndicate partners nearby potential investment targets. Asa result, we would not predict that the effect of local VC densitywould change over time, and unreported regressions support thisview.
246 T. Stuart, O. Sorenson / Research Policy 32 (2003) 229–253
significance levels when the fixed effects are specifiedat the MSA (rather than state) level. Because slightlymore than 7% of the zip code-year observations falloutside of the spatial boundaries of any MSA, theseobservations are lost when we include MSA-level in-tercepts. Given that the results are equivalent and welose observations in the MSA-level regressions, wehave opted not to report those results.
6.2. Time-to-IPO results
Table 4reports the results from the IPO rate mod-els. In the baseline model, the biotech equity indexpositively and strongly affects the rate of IPO. Thetotal dollar amount of venture funding and the num-ber of financing rounds also significantly increase theIPO rate, as does the number of patents assigned tothe firm. The national density of biotechnology firmshas a significant, negative effect on the rate.
Models 9–12 add the four local resource concen-tration variables. Among the four, only biotechnologyinventor concentration has a statistically significantand positive effect (model 10), consistent with thenotion that proximity to a highly-skilled technicalworkforce aids firm performance. Regardless, the ge-ographic proximity effects appear more pronouncedin the regression that includes all four weighted den-sity variables together. In model 13, the local densityof patent inventors remains positive and significant.The parameter estimate suggests that a standard devi-ation increase in a firm’s proximity to biotech patentinventors raises the baseline IPO rate by a factor of1.63 (exp[0.0017×285.7]). In contrast, holding inventorconcentration constant, firms located near to manycompetitors and those in the vicinity of many VCfirms have lower predicted IPO rate multipliers. Inthe full model, the effect of proximity to universitieswith leading biotech-related departments does notdiffer significantly from zero.
Several factors might explain why proximity tobiotechnology inventors enhances new venture per-formance. One possibility is that news of recentdevelopments spreads through local networks, sothat proximity to centers of innovation increases thelikelihood of gaining early knowledge of technicaldevelopments. Also, dense local networks amongtechnologists may facilitate the quick resolution oftechnical problems, as individuals embedded in these
networks have many colleagues and friends who cancontribute to the resolution of technical roadblocks(Saxenian, 1994; Liebeskind et al., 1996). Related tothe two previous points, rumors concerning technicaladvances likely spread rapidly through dense, localnetworks. As ethnographic studies of the biotechnol-ogy industry suggest, rumors of advances at otherresearch centers can prove highly motivating for anorganization, particularly when they concern mile-stones at competing labs (Werth, 1994; Stuart, 1999,presents evidence from the chip industry).17 Thiscan accelerate the rate of technology development.Finally, spatial proximity to many biotechnology in-ventors suggests that a focal firm may have a largeand diverse labor supply. Thus, firms residing near tomany biotechnology patent holders probably find iteasier and cheaper to build a strong technical staff.
Although proximity to biotechnology inventorspositively affects performance, being close to manycompeting firms reduces the hazard of IPO. This find-ing coincides with those of other ecological studiesthat have empirically examined geographic compe-tition (e.g. Baum and Mezias, 1992; Sorenson andAudia, 2000). In the models that do not control forthe size of the local technical workforce, the nega-tive impact of being close to competing biotech firmscannot be observed because of the correlation be-tween firm and inventor concentration; however, aftercontrolling for the local concentration of biotechnol-ogy inventors, proximity to firms appears to capturethe intensity of local competition. Neighboring firmscompete directly for two reasons. First, with the sizeof the technical labor force held constant, high firmconcentration implies greater demand (and higherprices) for specialized labor with an adverse impact
17 One could draw a similar conclusion from studies of com-petition for priority in the sociology of science.Merton (1973,pp. 286–324) highlighted the motivating effect of concern aboutpriority in discovery on scientists’ productivity. A now classic il-lustration of the salience of priority concerns isWatson’s (1968)chronicle of the discovery of the helical structure of DNA. Whendescribing the year leading up to the discovery, Watson expressedconcern that Linus Pauling would identify the structure of DNAbefore him. In their search, Watson and Crick were motivated notjust by their belief in the scientific importance of the structureof DNA, but more immediately by rumors that Pauling was clos-ing in on the structure.Werth (1994)provides a detailed historyof priority contests in biotechnology (the commercialization of afamily of immunosuppressive drugs).
T.S
tua
rt,O
.S
ore
nso
n/R
ese
arch
Po
licy3
2(2
00
3)
22
9–
25
3247
248 T. Stuart, O. Sorenson / Research Policy 32 (2003) 229–253
on focal firm performance. Second, a certain degreeof strategic convergence likely occurs in areas witha heavy concentration of structurally equivalent firmsand rampant migration of personnel between firms(Boeker, 1997; Sørensen, 1999), suggesting that firmsin technology clusters may also experience intensecompetition in factor and product markets.
Model 13 also shows that biotechnology startupslocated close to many VC firms experienced lowerIPO rates relative to otherwise comparable firms.When interpreting this result, it is important to re-call that the sample analyzed in the performanceregressions consists exclusively of venture-backedcompanies. Because the models also control for thetotal amount of VC funds raised by the firms in thesample, the coefficient on the local density of VCsreflects the residual performance effects of beingnear to VC firms (i.e. it omits the potentially coun-tervailing influence of local density of VC firms onthe amount of VC support that the firms in the sam-ple received in the first place).18 With this caveat inmind, we believe that the negative effect of proximityto venture capitalist firms reflects the consequencesof a relatively high availability of funding for anorganization’s nearby, privately-held competitors. Inaddition, the weighted VC density variable likely co-varies with the attractiveness of the opportunities fora firm’s key managers and technologists to leave theircurrent employers to start a new company.
The last regression we report inTable 4 paral-lels the final model in the founding rate analysis:we include interactions between the age of the lo-cal biotech industry and the local concentration ofbiotechnology firms, and between age and universityconcentration. In model 14, neither of these interac-tion effects reaches the level of statistical significance.The insignificant coefficients on these interactioneffects lends further credence to the view that differ-ent processes underlie high local founding rates andstrong early-life performance—the explanation forwhy resource proximities impact new venture creationrelates to the spatial concentration of relationships;
18 It is almost certainly the case that the firms in the performancesample had a better chance of receiving venture funding—andthus meeting the screen that determined entry into the sample—because of their proximity to venture capital firms. The resultsmust be interpreted cautiously because of sample selection.
by contrast, the weighted density variables in theperformance models relate to the spatial ecology ofcompetitors. The explanation for the spatial effectspertaining to new venture creation loses force as net-works among industry participants expand nationally,while the ecological rationales for spatial effects inthe new venture performance should be, and is, un-affected by time. The strong interaction effects in thefounding models and the null results in the perfor-mance regressions therefore fit the theory.
Because we know the locations of universities, VCfirms, biotechnology firms and patent inventors, themodels of the determinants of new venture foundingrates and early-life performance allow us to iden-tify the areas of the country most likely to spawnnew biotechnology ventures and the areas in whichstartups will likely perform best. From the model 6estimates, one would expect zip code 02154, on route128 north of Boston, not far from Harvard, MIT andMass General, to be the most fecund area of thecountry for new biotechnology foundings. Palo Alto(94303)—the home of Stanford University and near tothe headquarters of Genentech, one of the biotechnol-ogy industry pioneers and also the source of a numberof spin-off companies came in as a close second.
By contrast, the performance models predict thatthe Bay area offers the worst location for new ventureperformance (conditional on the covariates in the re-gressions, VC-backed startups in Palo Alto have thelowest predicted IPO rates of all VC-funded firms inthe sample). The estimates fromTable 4(model 14)suggest that firms should perform best in the tri-statearea, where New Jersey, Pennsylvania, and New Yorkcome together. The advantage of the tri-state areastems from the fact that it lies at the center of thepharmaceutical cluster in the US; among many othercompanies, Merck, Johnson and Johnson, AmericanHome Products, Pfizer, and Bristol–Meyers all residein this area. As a result, the tri-state area has a largepool of technically skilled workers. Perhaps of evengreater importance, this area offers an ample supplyof seasoned executives (individuals with years ofleadership experience in pharmaceutical companies)that could be recruited into the senior ranks of startupbiotech companies. At the same time, the tri-statearea does not contain that many rival biotechnologyfirms. The details of the predicted rates aside, thefundamental point is that our findings suggest that
T. Stuart, O. Sorenson / Research Policy 32 (2003) 229–253 249
Fig. 3. Predicted entry (shaded) and IPO rates (unshaded) in 1995.
the regions in which entrepreneurs most frequentlybegan new firms were not the ones in which newlycreated organizations performed exceptionally well.Taken together, these results draw into question theargument that agglomeration economies drive thelocation of technology-based entrepreneurship.19
19 One might counter that sample selection explains the foundingrate/performance contradiction. The selection explanation contendsthat because starting a biotech firm in resource-rich geographiesis cheaper, these areas require entrepreneurs to pass a lower qual-ity threshold; thus, performance should be lower. For example,new companies not located in the vicinity of venture capital firmsmay need to be of higher quality to attract VC funding (becauseVC firms prefer to transact with companies nearby). Ideally, onewould rule out this explanation by estimating two-stage perfor-mance models with a sample selection correction. Estimating theselection equation, however, requires knowledge of the risk setof all potential entrepreneurs in each zip code, which we do notpossess. Instead, we performed analyses to determine whether thequality of the companies in the performance sample actually variedacross geographies. We estimated a series of probit models to de-termine if the resource concentration variables predicted whetheror not a biotech firm had a patent at various ages (3-month-old,6-month-old, 1-year-old). We found no effect of any of the re-source concentration variables on the likelihood of a patent, whichwe consider evidence that the quality of firms does not vary muchacross geographic areas.
To illustrate this point systematically,Fig. 3 pre-sents a map of the US biotechnology industry at theend of 1995 (a reproduction ofFig. 1b). However, inFig. 3 we weight each zip code by its predicted rateof IPO (the unshaded bars) and its rate of new ven-ture creation (the shaded bars). Large bars representhigh predicted rates; short bars indicate low predictedrates. The figure clearly shows that our models pre-dict the highest founding rates in southern California,northern California, and Boston, while IPO rates peakin eastern Pennsylvania, New Jersey, and Maryland.
7. Discussion and conclusions
In a nutshell, we argue that the spatial distribu-tion of relationships and resources limits potentialentrepreneurs’ ability to create new organizations.People almost always have more, more diverse, andstronger ties to contacts in the geographic region inwhich they reside. This suggests that the form of so-cial capital most valuable in the resource mobilizationprocess is to a large extent a geographically localizedcurrency. If, as we believe, founders must leveragemany strong and weak relationships to mobilize the
250 T. Stuart, O. Sorenson / Research Policy 32 (2003) 229–253
resources to create a new firm, then the local natureof social capital suggests that new ventures will morelikely begin in regions that offer ample supplies of thenecessary resources. Although relationships exist vir-tually everywhere in space, specialized resources suchas technical experts and VC firms do not. Thus, regionswith dense resource concentrations afford the greatestopportunities for would-be entrepreneurs to mobilizethe necessary inputs to establish a high-technologyventure. For this reason, we conclude that opportuni-ties to create new firms vary across space.
Viewed as a whole, our results show that areas withlarge populations of biotech and VC firms do enjoy a‘regional advantage’; such areas experience the high-est rates of biotechnology entrepreneurship. Althoughwe do not possess data to confirm this, these areasalso quite likely attract specialized service providers,such as biotechnology consultancies and patent lawfirms, and suppliers of industry-specific goods, suchas reagents and biological materials. In fact, the pos-itive effect of local industry age in both the foundingrate and new venture performance regressions mayoccur for this reason. Thus, the emergence of ancillaryindustries provides an additional boost to the regionaleconomies of areas with a high concentration of tech-nology firms. Nevertheless, the findings in the IPOrate models suggest that this regional advantage beliesa firm-level disadvantage; (venture-backed); startupsin close proximity to dense clusters of structurallyequivalent high-technology firms perform worse thanotherwise comparable organizations in less concen-trated areas. To be clear, however, the results do notsuggest that remote areas offer the best locationsfor new biotech startups. Biotech firms depend upona highly educated workforce with industry-specificexperience that is difficult to find in remote areas.According to our results, the most advantageous lo-cations for new biotech firms provide access to anextensive technical workforce, but do not present in-tense local competition from nearby biotech firms.The results do, however, suggest that the interests ofentrepreneurs may not align with those of regionalplanners hoping to develop high-technology districts.
Before concluding, we wish to highlight a limita-tion of the paper and a few extensions to the reportedanalyses. The salient shortcoming of this endeavor isour inability to generate direct measures of the net-work positions of potential entrepreneurs ‘at risk’ of
establishing biotechnology companies. The idealsituation would be to know who every potential en-trepreneur is, whom they know, when they met thosepeople, and how the strength of their relationshipschanged over time. Unfortunately, one can proba-bly only collect such data prospectively with anyaccuracy (and even then it would be a monumentalundertaking to identify all potential entrepreneurs inan industry). The founding rate analysis thereforerests on the assumption of a correlation between thephysical location of the holders of knowledge-basedand financial resources and the spatial concentrationof the professional relationships in which resourceholders are embedded. It also depends on the assump-tion that social capital is a necessary impetus to theresource mobilization process in technology-based,resource-intensive new venture formation. Althougha wealth of anecdotal data and some systematic evi-dence support both assumptions, we would be the firstto acknowledge that ruling out alternative mechanismsthat might yield the effects observed in the foundingrate analysis would require more direct measures offounders’ networks. In this regard, the waning effectof resource proximities in the founding rate models asthe industry matures encourages us, but we still fallshort of being able to claim that the findings defini-tively support the importance of social networks.
Finally, we wish to discuss some extensions of thereported analyses and a few theoretical implications ofour findings. First, we tested for the presence of twointeraction effects not reported or discussed above. Inthe founding rate models, we observed a large, sta-tistically significant, negative interaction between thelocal concentrations of universities and of biotechnol-ogy firms. This result suggests that the faculties ofleading universities in the biotech-related sciences es-tablish more new biotechnology firms when only a fewbiotech companies operate in the immediate vicinityof their universities. Perhaps the negative interactionoccurs because leading academic scientists find it lesstempting to create their own firms when they can es-tablish lucrative consulting contracts with local firms,when they are able to join the scientific advisoryboards of nearby firms, and when they can conve-niently choose to work in the industry on a part-timebasis.
In the performance models, we found a large, sta-tistically significant, and positive interaction between
T. Stuart, O. Sorenson / Research Policy 32 (2003) 229–253 251
the total dollars of VC funding received by a focalorganization in private financing rounds and localbiotechnology firm concentration. When coupled withthe negative main effect of local firm concentration,the interaction suggests that the competitive effect ofbeing located in a densely populated biotechnologycluster impacts poorly funded startups most strongly.The coefficient estimates suggest that the negativeeffect of local biotech firm concentration disappearsabove the 90th percentile of the total cash raiseddistribution. We believe that the most cogent expla-nation for this interaction effect is that well-fundedfirms can recruit top talent away from nearby com-petitors, perhaps because they have the resourcesto pay higher salaries and because they anticipatesuccessful IPOs. Thus, the effect of being close tomany structurally equivalent firms depends on thefinancial strength of the focal firm; local competitionhas the severest consequences for poorly financedstartups.
The findings this paper demonstrate will hope-fully convince readers of the utility of a sociologicalperspective on the location of high-technology en-trepreneurship in particular and industrial activityin general. We believe that the relational intensityof the new venture creation stands as a compellingexplanation for the strong effect of the spatial distri-bution of resources on the location of new ventures.Despite the apparent ability to transport the etherealresources necessary for entrepreneurial activity inhigh-technology markets, spatial propinquity greatlyfacilitates the formation of the social, employment,and interorganizational relationships necessary to erectnew organizations. Given the importance of socialand professional relationships in technology-basedentrepreneurship, sociology would appear to haveample opportunity to make a strong contribution tothe study of high-technology entrepreneurship.
Acknowledgements
Both authors contributed equally to this work. Wewould like to thank Joshua Lerner for supplying uswith the biotechnology equity index used in our anal-yses. The Center for Regional Economic Issues atCase Western Reserve University provided the loca-tion data for biotechnology patents used in this paper,
from a database created by Adam Jaffe and ManuelTrajtenberg under grant SBR-9320973 from theNational Science Foundation; Margaret Fernando gra-ciously obtained these data on our behalf. We thankthe University of Chicago, Graduate School of Busi-ness, and a grant from the Center for EntrepreneurialLeadership at the Ewing Marion Kauffman Founda-tion, Kansas City, MO.
References
Aldrich, H.E., Pfeffer, J., 1976. Environments and organizations.Annual Review of Sociology 2, 79–105.
Aldrich, H.E., Wiedenmayer, G., 1993. From traits to rates: anecological perspective on organizational foundings. Advancesin Entrepreneurship, Firm Emergence, and Growth 1, 145–195.
Almeida, P., Kogut, B., 1997. The exploration of technologicaldiversity and the geographic localization of innovation. SmallBusiness Economics 9, 21–31.
Angel, D.P., 1991. High-technology agglomeration and the labormarket: the case of Silicon Valley. Environment and PlanningA 23, 1501–1516.
Arthur, B., 1990. Positive feedback in the economy. ScientificAmerican. February 92–99.
Audretsch, D.B., Stephan, P.E., 1996. Company–scientist locationallinks: the case of biotechnology. American Economic Review86, 641–652.
Barnett, W.P., Sorenson, O., 2002. The red queen in organizationalcreation and development. Industrial and Corporate Change 11,289–325.
Baron, J.N., Hannan, M.T., Burton, M.D., 1996. The road taken:origins and early evolution of employment systems in emergingcompanies. Industrial and Corporate Change 5, 503–536.
Baron, J.N., Hannan, M.T., Burton, M.D., 2001. Labor pains:organizational change and employee turnover in young,high-tech firms. American Journal of Sociology 106, 960–1012.
Barron, D.N., West, E., Michael, T.H., 1994. A time to grow and atime to die: growth and mortality of credit unions in New York,1914–1990. American Journal of Sociology 100, 381–422.
Baum, J.A.C., Mezias, S.J., 1992. Localized competition andorganizational failure in the Manhattan hotel industry,1898–1990. Administrative Science Quarterly 37, 580–603.
Baum, J.A.C., Haveman, H.A., 1997. Love thy neighbor?Differentiation and agglomeration in the Manhattan hotelindustry, 1898–1990. Administrative Science Quarterly 42, 304–338.
Blau, P., 1977. Inequality and Heterogeneity. Free Press, NewYork.
Boeker, W., 1997. Executive migration and strategic change: theeffect of top manager movement on product-market entry.Administrative Science Quarterly 42, 213–236.
252 T. Stuart, O. Sorenson / Research Policy 32 (2003) 229–253
Bossard, J.S., 1932. Residential propinquity as a factor in marriageselection. American Journal of Sociology 38, 219–224.
Burt, R.S., 1992. Structural Holes: The Social Structure ofCompetition. Harvard University Press, Cambridge, MA.
Bygrave, W.D., Timmons, J.A., 1992. Venture Capital at theCrossroads. Harvard Business School Press, Boston.
Carroll, G.R., Wade, J., 1991. Density dependence in theorganizational evolution of the American brewing industryacross different levels of analysis. Social Science Research 20,217–302.
DiMaggio, P., 1986. Structural analysis of organizational fields: ablockmodel approach. In: Staw, B.M., Cummings, L.L. (Eds.),Research in Organizational Behavior. JAI Press, Greenwich,CT, pp. 335–370.
Festinger, L., Schachter, S., Back, K.W., 1950. Social Pressure inInformal Groups. Harper & Row, New York.
Freeman, J., 1999. Venture capital as an economy of time. In:Leenders, R., Gabbay, S. (Eds.), Corporate Social Capital andLiability. Kluwer Academic Publishers, Boston, pp. 460–482.
Galbraith, C.S., 1985. High technology location and development:the case of Orange County. California Management Review 28,99–109.
Gilson, R.J., 1999. The legal infrastructure of high technologyindustrial districts: Silicon Valley, Route 128, and covenants notto compete. New York University Law Review 74, 575–629.
Gompers, P.A., 1995. Optimal investment, monitoring, and thestaging of venture capital. Journal of Finance 50, 1461–1489.
Gompers, P.A., Lerner, J., 1999. The Venture Capital Cycle. MITPress, Cambridge, MA.
Granovetter, M.S., 1974. Getting a Job. Harvard University Press,Cambridge, MA.
Hannan, M.T., Carroll, G.R., 1992. Dynamics of OrganizationalPopulations. Oxford University Press, New York.
Haug, P., 1995. Formation of biotechnology firms in the greaterSeattle region: an empirical investigation of entrepreneurial,financial, educational perspectives. Environment and PlanningA 27, 249–267.
Hausman, J., Hall, B.H., Griliches, Z., 1984. Econometric modelsfor count data with an application to the patents—R&Drelationship. Econometrica 52, 909–938.
Hawley, A., 1986. Human Ecology. University of Chicago Press,Chicago.
Hedström, P., Sandell, R., Stern, C., 2000. Mesolevel networksand the diffusion of social movements: the case of the SwedishSocial Democratic Party. American Journal of Sociology 106,145–172.
Herrigel, G., 1983. Democracy at work: changing world marketsand the future of labor unions. Industrial and Labor RelationsReview 46, 742–744.
Jaffe, A., Trajtenberg, M., Henderson, R., 1993. Geographiclocalization of knowledge spillovers, as evidenced by patentcitations. Quarterly Journal of Economics 108, 577–598.
King, G., 1989. Unifying Political Methodology: The LikelihoodTheory of Statistical Inference. Cambridge University Press,Cambridge.
Kono, C., Palmer, D., Friedland, R., Zafonte, M., 1998. Lostin space: the geography of corporate interlocking directorates.American Journal of Sociology 103, 863–911.
Krugman, P., 1991. Increasing returns and economic geography.Journal of Political Economy 99, 483–499.
Lerner, J., 1994. Venture capitalists and the decision to go public.Journal of Financial Economics 35, 293–316.
Liebeskind, J.P., Oliver, A.L., Zucker, L., Brewer, M., 1996.Social networks, learning, and flexibility: sourcing scientificknowledge in new biotechnology firms. Organization Science7, 428–443.
Lomi, A., 1995. The population ecology of organizationalfounding: location dependence and unobserved heterogeneity.Administrative Science Quarterly 40, 111–144.
Marshall, A., 1920. Principles of Economics, 7th ed. Macmillan,London.
McPherson, J.M., 1983. An ecology of affiliation. AmericanSociological Review 48, 519–532.
Merton, R.C., 1973. In: Storer, N.W. (Ed.), The Sociology ofScience. University of Chicago Press, Chicago.
Meyer, J.W., Rowan, M., 1977. Institutionalized organizations:formal structures as myth and ceremony. American Journal ofSociology 83, 340–363.
OTA (Office of Technology Assessment), 1984. Technology,Innovation, and Regional Economic Development. USGPO,Washington, DC.
Park, R.E., 1926. The urban community as a spatial pattern and amoral order. In: Burgess, E.W. (Ed.), The Urban Community.University of Chicago Press, Chicago, IL, pp. 21–31.
Phillips, D.J., 2001. The parent-progeny transfer and organizationalmortality: the case of Silicon Valley law firms, 1946–1996.Working Paper, University of Chicago.
Piore, M.L., Sabel, C.F., 1984. The Second Industrial Divide:Possibilities for Prosperity. Basic Books, New York.
Podolny, J.M., Stuart, T.E., Hannan, M.T., 1996. Networks,knowledge, and niches: competition in the worldwide semicon-ductor industry, 1984–1991. American Journal of Sociology102, 659–689.
Portes, A., Sensenbrenner, J., 1993. Embeddedness andimmigration: notes on the social determinants of economicsaction. American Journal of Sociology 98, 1320–1350.
Preer, R., 1992. The Emergence of Technopolis: KnowledgeIntensive Technologies and Regional Development. Praeger,New York.
Rao, H., Drazin, R., 2002. Overcoming resource constraints onproduct innovation by recruiting talent from rivals: a study ofthe mutual fund industry, 1986–1994. Academy of ManagementJournal, June 2002, 45, 491–508.
Ritter, J.R., 1984. The hot issue market of 1980. Journal ofBusiness 57, 215–240.
Saxenian, A., 1994. Regional Advantage: Culture and Competitionin Silicon Valley and Route 128. Harvard University Press,Cambridge, MA.
Schumpeter, J.A., 1942. Capitalism, Socialism and Democracy.Harper & Row, New York.
T. Stuart, O. Sorenson / Research Policy 32 (2003) 229–253 253
Scott, A.J., Storper, M., 1987. High technology industry andregional development: a theoretical critique and reconstruction.International Social Science Journal 34, 215–232.
Shane, S., Cable, D., 2002. Social relationships and the financingof new ventures. Management Science 48, 364–381.
Shane, S., Stuart, T.E., 2002. Organizational endowments and theperformance of university start-ups. Management Science 48,154–170.
Sorenson, O., Audia, P.G., 2000. The social structure ofentrepreneurial activity: geographic concentration of footwearproduction in the United States, 1940–1989. American Journalof Sociology 106, 424–462.
Sorenson, O., Stuart, T.E., 2001. Syndication networks and thespatial distribution of venture capital investments. AmericanJournal of Sociology 106, 1546–1588.
Sørensen, J.B., 1999. Executive migration and interorganizationalcompetition. Social Science Research 28, 289–315.
Stinchcombe, A.L., 1965. Social structure and organizations. In:March, J.G. (Ed.), Handbook of Organizations. Rand McNally,Chicago, pp. 142–193.
Stuart, T.E., 1999. A structural perspective on organizationalinnovation. Industrial and Corporate Change 8, 745–775.
Stuart, T.E., Sorenson, O., 2002. Liquidity events and thegeographic distribution of organizational foundings. Mimeo,University of Chicago GSB.
Stuart, T.E., Hoang, H., Hybels, R., 1999. Interorganizationalendorsements and the performance of entrepreneurial ventures.Administrative Science Quarterly 44, 315–349.
Thornton, P.H., 1999. The sociology of entrepreneurship. AnnualReview of Sociology 25, 19–46.
Watson, J.D., 1968. The Double Helix: A Personal Account of theDiscovery of the Structure of DNA. Atheneum, New York.
Werth, B., 1994. The Billion-Dollar Molecule. Touchstone, NewYork.
Zimmer, C., Aldrich, H.E., 1987. Resource mobilization throughethnic networks: kinship and friendship ties of shopkeepers inEngland. Sociological Perspectives 30, 422–455.
Zipf, G.K., 1949. Human Behavior and the Principle of LeastEffort. Addison-Wesley, Reading, MA.
Zucker, L.G., Darby, M.R., Brewer, M.B., 1998. Intellectual humancapital and the birth of US biotechnology enterprises. AmericanEconomic Review 88, 290–306.