Page 1
Cambridge Essentials Mathematics Core 8 S1.1 Homework Answers
Original material © Cambridge University Press 2009 1
S1.1 Homework Answers
1 a D b B c C d A e E
2 a R b 61 c A spinner which is half shaded. For example,
3 a A1, A2, A3, A4 b 121 c
41
B1, B2, B3, B4
C1, C2, C3, C4
4 It is not 31 because there are not equal numbers of office workers, managers and canteen
staff, so they are not equally likely outcomes.
5 a 4 b 203 c red d yellow
Page 2
Cambridge Essentials Mathematics Core 8 S1.2 Homework Answers
Original material © Cambridge University Press 2009 1
S1.2 Homework Answers
1 a 1911 b
198
2 98%
3 0.2
4 a Because 18 + 1
2 + 14 + 1
8 = 1, so it is certain that all the balls are either red, blue,
green or yellow.
b Kerry cannot be right because 18 of 20 is not a whole number and there must be
whole numbers of red and yellow counters.
Spinner B 5 a 2 4 6 8
3 5 7 9 11 Spinner A 5 7 9 11 13 7 9 11 13 15 9 11 13 15 17
b i 0 ii 316 iii 3
16 iv 1016 or 5
8 v 1116
Page 3
Cambridge Essentials Mathematics Core 8 S1.3 Homework Answers
Original material © Cambridge University Press 2009 1
S1.3 Homework Answers
1 a 4015 or
83 b
10040 or
52
c b should be more reliable because the more trials you do, the more reliable the result.
2 Pupil’s own results in the table, graph and comments.
3 Pupil’s own experimental results and calculation.
Page 4
Cambridge Essentials Mathematics Core 8 S2.1 Homework 1 Answers
Original material © Cambridge University Press 2009 1
S2.1 Homework 1 Answers
1 a Quantitative b Qualitative c Quantitative
d Quantitative e Qualitative
2 a i £5 ii comedy (film)
b i four (wheels) ii red (bus)
c i 50 cm ii blonde (hair)
3 a Discrete b Discrete c Continuous
d Discrete e Continuous
4 a i The number of goals scored by Premier League teams and lower league teams.
ii Collect results yourself one weekend (primary).
Or use results published for the whole season (secondary).
b i Temperatures at various stages of cooling of water in metal containers and plastic
containers.
ii Carry out an experiment – check the temperature of water in both containers after
1 minute, 2 minutes etc (primary).
Or use data regarding thermal conduction of the metal and plastic from the internet
(secondary).
c i The gender of maths teachers in secondary schools.
ii Count the numbers of male and female teachers in your own school (primary).
Get in touch with the Local Education Authority for information on all schools in
your area, or use the internet to obtain nationwide statistics (secondary).
Page 5
Cambridge Essentials Mathematics Core 8 S2.1 Homework 2 Answers
Original material © Cambridge University Press 2009 1
S2.1 Homework 2 Answers
1 a The groups overlap; 10 minutes and 15 minutes are each included in two groups.
A better question would be: How long does it take you to get to school?
less than 5 minutes
less than 10 minutes but not less than 5 minutes
less than 15 minutes but not less than 10 minutes
less than 20 minutes but not less than 15 minutes
20 minutes or more
b ‘A lot’ of pocket money is a qualitative measure and is not well defined.
The question could be improved by offering a choice of amounts as shown below,
but this may be too personal and people may not answer honestly. How much pocket money do you receive each week?
£1–£5 £5.01–£10 £10.01–£15 more than £15
c The data will be easier to analyse if options are given, as shown below.
‘Exercise’ needs to be defined more precisely. In week, how many times do you do any form of exercise?
0 1–3 4–6 7–9 10 or more
2 As it is a small village, all people living there and affected by the new road could receive
a questionnaire, with free return postage so that no expense is incurred by the person
filling in the questionnaire. Alternatively a sample could be collected by using the
electoral roll and contacting every 10th person to give a sample of 100 people.
3 The population is all the pupils in Katya’s school. The sample could be selected by
picking at random a given number from each year group.
4 The first 20 spins suggest that the spinner is biased in favour of 2.
However, after 80 spins the results even out, suggesting that the spinner is not biased.
5 a There are too many values for each value to be listed.
There is no way of recording a time that is not a whole number.
b The values 15 s, 20 s etc each belongs to two groups in the table, so it is not clear
where such results should be recorded.
c It allows all times to be recorded and is not ambiguous in any way.
Page 6
Cambridge Essentials Mathematics Core 8 S2.2 Homework Answers
Original material © Cambridge University Press 2009 1
S2.2 Homework Answers
1 a Range = 38 – 10 = 28 passengers
b Mode = 28 passengers
c Mean = 268 ÷ 10 = 26.8 passengers
d Median = 28 passengers
2 a Total distance = 140 km b Mean distance = 28 km
c Total distance cycled must be 6 × 30 = 180 km. On the last day he must cycle 40 km.
3 a Median b Mode c Mean
4 a 34 years b 45 years c 36 years
5 a Adults’ viewing times
0 5 6 8 8 9 1 0 1 1 2 4 4 4 4 5 6 7 8 9 9 2 0 3 3 7 9 3 3 4
Key 2 | 3 represents 23 hours
Teenagers’ viewing times
0 0 6 1 1 2 3 4 4 5 7 8 9 9 2 0 7 8 9 9 9 9 9 3 0 1 1 5 4 0
Key 1 | 9 represents 19 hours
b Modal time is 14 hours for the adults, 29 hours for the teenagers.
c Range is 28 hours for the adults, 40 hours for the teenagers.
d Median is 14 hours for the adults, 20 hours for the teenagers.
e Mean is 15.8 hours for the adults, 21.8 hours for the teenagers.
f 50% of the adults watched TV for 14 hours or more each week; 50% of the teenagers
watched TV for 20 hours or more each week. The teenagers’ watching hours have a
Page 7
Cambridge Essentials Mathematics Core 8 S2.2 Homework Answers
Original material © Cambridge University Press 2009 2
greater range, with one teenager who did not watch TV and one who watched for 40
hours.
6 a 4 shots
b 1 + 4 + 7 + 10 = 22 golfers
c 3.8 shots
d 4 shots
e It is not difficult to reach par score or better. 73% of golfers took 4 shots or fewer.
Page 8
Cambridge Essentials Mathematics Core 8 S2.3 Homework 1 Answers
Original material © Cambridge University Press 2009 1
S2.3 Homework 1 Answers
1 a 1 Pupil = 360 ÷ 30 = 12°
b 132°
c 151
302=
d Pupils’ pie chart. Check that the angle of each sector is as follows:
Playing sport 11 × 12° = 132°
Reading 9 × 12° = 108°
Computer games 5 × 12° = 60°
Listening to music 3 × 12° = 36°
Watching TV 2 × 12° = 24°
2 a 1 person = 360 ÷ 240 = 1.5°
b 28 × 1.5° = 42°
c 12240
= 120
d Pupils’ pie chart. Check that the angle of each sector is as follows:
Comedy 86 × 1.5 = 129°
Sci-Fi 40 × 1.5° = 60°
Cartoon 64 × 1.5° = 96°
Documentary 12 × 1.5° = 18°
Drama 28 × 1.5° = 42°
Other 10 × 1.5° = 15°
Page 9
Cambridge Essentials Mathematics Core 8 S2.3 Homework 1 Answers
Original material © Cambridge University Press 2009 2
3 a There were 90 customers.
b
Vanilla Strawberry Coffee Chocolate Other
c There are of 90 customers in total, so each customer would be represented by 4°. This makes it easy to draw the pie chart.
d A bar chart shows more clearly which flavours are most popular, as they are represented by the tallest bars. A pie chart shows the proportion of each type of ice cream sold in relation to the total.
4 a
b The modal height group is 300 ≤ h < 400.
c 570
= 114
Page 10
Cambridge Essentials Mathematics Core 8 S2.3 Homework 2 Answers
Original material © Cambridge University Press 2009 1
S2.3 Homework 2 Answers
1 a £3.50
b £2.00
c Yes. Share prices can go up or down hourly/daily but the graph shows the values
only on certain dates.
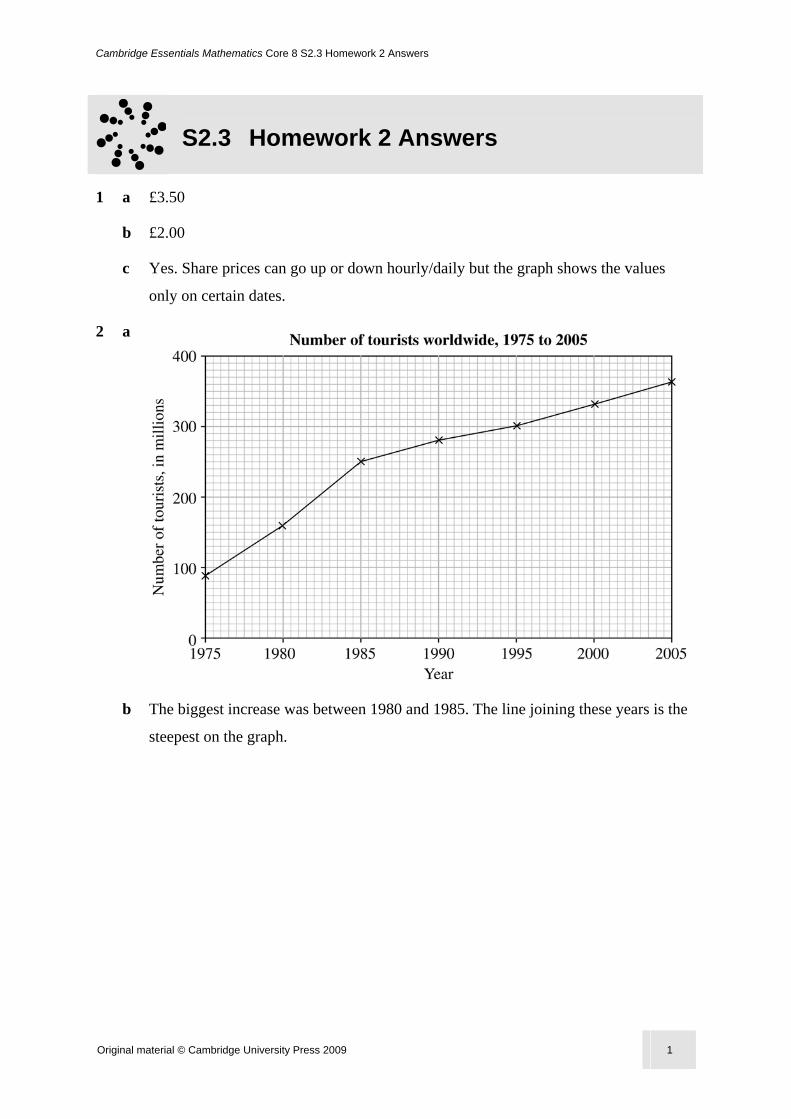
2 a
b The biggest increase was between 1980 and 1985. The line joining these years is the
steepest on the graph.
Page 11
Cambridge Essentials Mathematics Core 8 S2.3 Homework 2 Answers
Original material © Cambridge University Press 2009 2
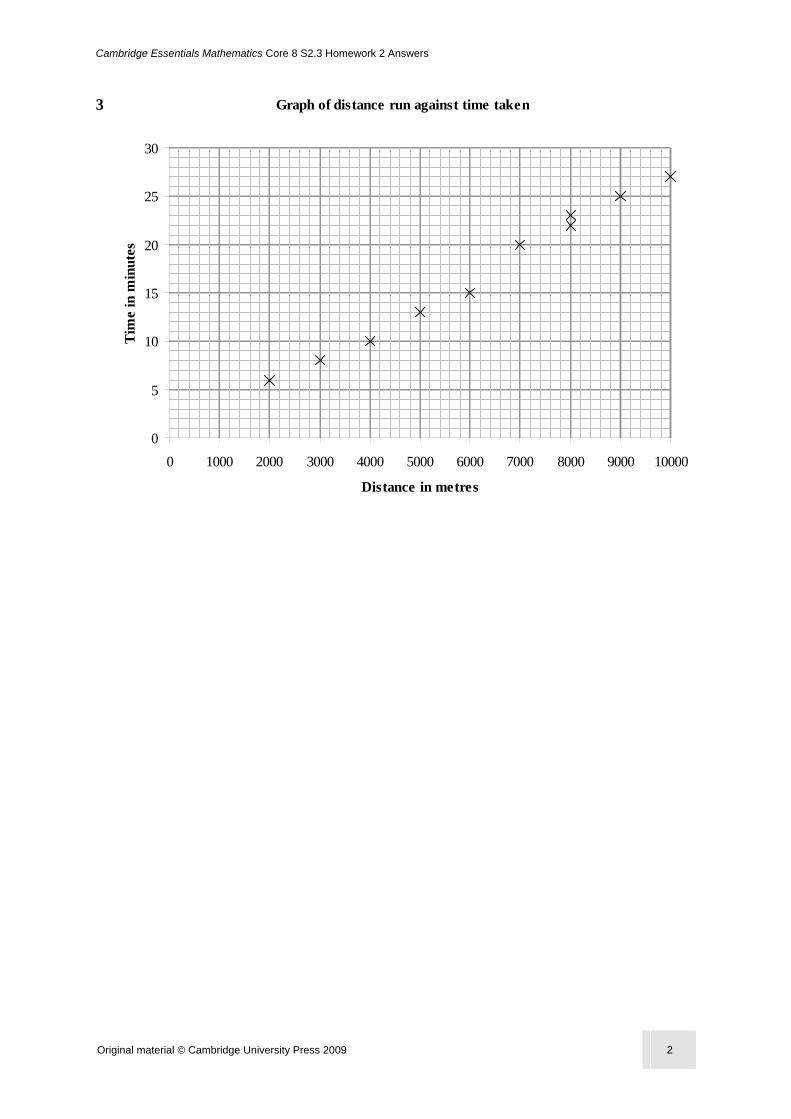
3 Graph of distance run against time taken
0
5
10
15
20
25
30
0 1000 2000 3000 4000 5000 6000 7000 8000 9000 10000
Distance in metres
Tim
e in
min
utes
Page 12
Cambridge Essentials Mathematics Core 8 S2.4 Homework Answers
Original material © Cambridge University Press 2009 1
S2.4 Homework Answers
1 a 1700 thousand = 1 700 000
b 78%
c 59%
d 1994 and 1998
e 500 000
f 3 500 000
2 a The age group 45–54 years shows the biggest difference between male and female.
This is shown by the biggest difference in the heights of the columns.
b 75+
c The graph shows a gradual increase for both males and females between the ages 19
and 55. The gap between males and females gradually widens up to age 45–54, but in
the age group 55–64 the percentages of males and females eating five or more
portions of fruit and vegetables is nearly the same. After the age of 64, the
percentage decreases for both men and women overall. Over the age of 75, less than
one-quarter of men and women eat five or more portions of fruit and vegetables each
day.
d Age (in years) is considered to be a discrete quantity.
e No. In 2004 the highest percentage is less than 35%.
Page 13
Cambridge Essentials Mathematics Core 8 S3.1 Homework Answers
Original material © Cambridge University Press 2009 1
S3.1 Homework Answers
1 Time T Tally Frequency
30 ≤ T < 35 \\ 2
35 ≤ T < 40 \\\\ \ 6
40 ≤ T < 45 \\\\ \\\\ 9
45 ≤ T < 50 \\\\ \\ 7
50 ≤ T < 55 \\\\ 5
55 ≤ T < 60 \ 1
2 Magnitude M Tally Frequency
6.0 ≤ M < 6.2 \\\\ \\\ 8
6.2 ≤ M <6.4 \\\\ 4
6.4 ≤ M < 6.6 \\\\ \\ 7
6.6 ≤ M < 6.8 \\\\ 4
6.8 ≤ M < 7.0 \\\\ 4
7.0 ≤ M < 7.2 \ 1
7.2 ≤ M <7.4 \\ 2
Page 14
Cambridge Essentials Mathematics Core 8 S3.1 Homework Answers
Original material © Cambridge University Press 2009 2
3 a This is one possible frequency table.
Height H Tally Frequency
0 ≤ H < 5 \\ 2
5 ≤ H < 10 \\\\ \ 6
10 ≤ H < 15 \\\\ \\ 7
15 ≤ H < 20 \\\\ \\\ 8
20 ≤ H < 25 \\ 2
b A possible reason is that 5 class intervals are enough to show the spread of the data
but not too many so there is very low frequency in each class interval.
Page 15
Cambridge Essentials Mathematics Core 8 S3.2 Homework Answers
Original material © Cambridge University Press 2009 1
S3.2 Homework Answers
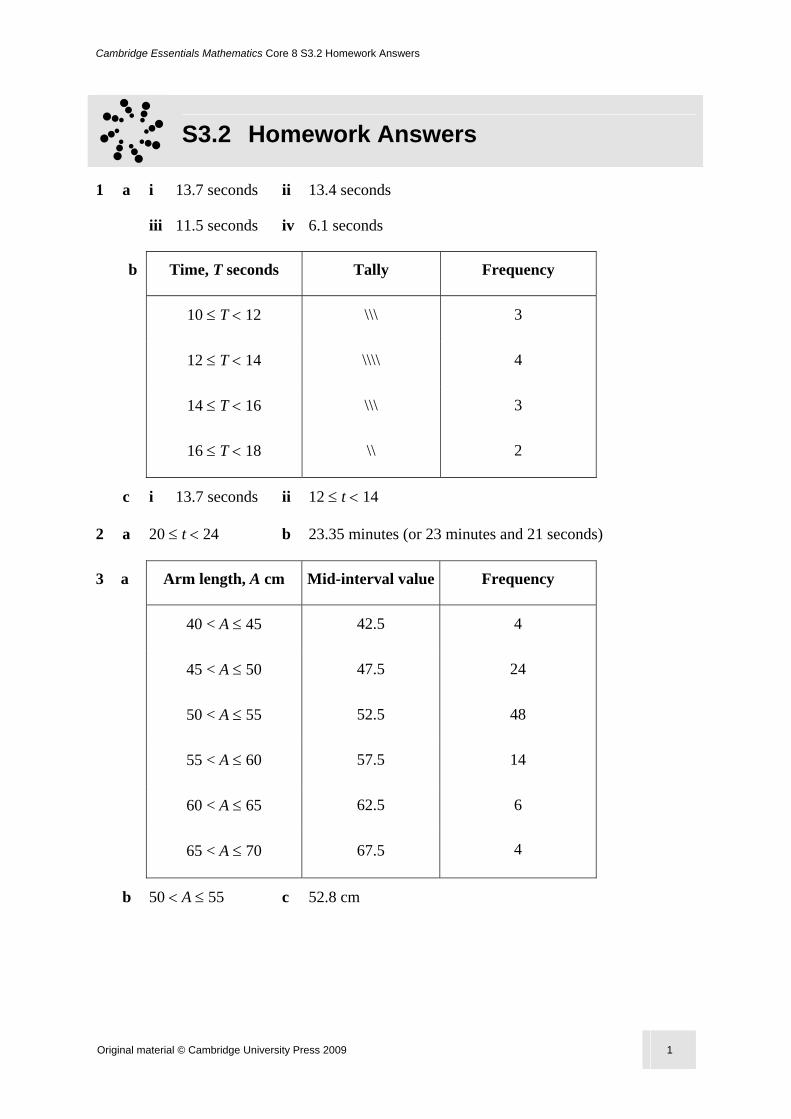
1 a i 13.7 seconds ii 13.4 seconds
iii 11.5 seconds iv 6.1 seconds
b Time, T seconds Tally Frequency
10 ≤ T < 12 \\\ 3
12 ≤ T < 14 \\\\ 4
14 ≤ T < 16 \\\ 3
16 ≤ T < 18 \\ 2
c i 13.7 seconds ii 12 ≤ t < 14
2 a 20 ≤ t < 24 b 23.35 minutes (or 23 minutes and 21 seconds)
3 a Arm length, A cm Mid-interval value Frequency
40 < A ≤ 45 42.5 4
45 < A ≤ 50 47.5 24
50 < A ≤ 55 52.5 48
55 < A ≤ 60 57.5 14
60 < A ≤ 65 62.5 6
65 < A ≤ 70 67.5 4
b 50 < A ≤ 55 c 52.8 cm
Page 16
Cambridge Essentials Mathematics Core 8 S3.3 Homework Answers
Original material © Cambridge University Press 2009 1
S3.3 Homework Answers
1 a
b 156.1 litres
2 a
b 14 ºC. It might not be accurate because the temperature was not measured then, it
was only estimated from the graph.
Page 17
Cambridge Essentials Mathematics Core 8 S3.3 Homework Answers
Original material © Cambridge University Press 2009 2
3 a
b
c 214.5 g d 188.3 g
e On average the tomatoes grown without fertiliser were a lower mass than those
grown with fertiliser.
4 Generally the trend is for life expectation to increase for both males and females from
1900 to 2030.
There was a dip in life expectation for males around 1930 – 1945. This was due to the
second world war.
In general, the life expectation for females is higher than that for males.