Transfer Function Pro (TRF-Pro) S8 Module of the KLIPPEL ANALYZER SYSTEM (Document Revision 1.4) FEATURES Detection of low energy, impulsive disturbances (clicks, rub & buzz, etc.) Higher Order Harmonic Distortion (HOHD) Full temporal fine structure of distortion (contrary to Fourier Analysis) Reveals short-time disturbances of much lower level than traditional methods Applicable to Speakers and Electronics Simple interpretation Separation from ambient noise 3D representation reveals location and physical cause of disturbance Uses active Compensation technique for revealing defects Measures deviation (impulsive and regular) from a “golden unit” Full TRF (standard) features TRF Voltage Stepping (STEP) The TRF-Pro is an enhanced version of the TRF (standard) including all standard features. A new measurement technique is provided for detecting and quantifying low energy, impulsive disturbances (such as clicks and rub & buzz effects). It reveals distortion of much lower level and with a considerably higher temporal resolution (“instantaneous distortion”) than traditional Fourier- analysis, which shows mean values only. Additionally to the common 2D representation (distortion vs. frequency) the distortion can be visualized in a 3D plot. Here the distortion are mapped vs. frequency and vs. one of the measured signals (voice coil displacement, sound pressure, etc.). This is quite useful to localize and identify the cause of the disturbance. A “golden unit” can be used to define the regular (“good”) behavior for devices under test. Measuring other drivers of the batch will reveal any deviation (impulsive or other) from the defined behavior, which are usually masked by other, dominant effects and which are not detectable using traditional measurement techniques. Article Number: 1000-910, 1000-911 Input Signal Measured Signal H(s)-1 Regular Nonlinearities Defects Noise 3V 0.1V 0.02V 2V 0.008V Linear Distortion Noise Floor Distortion from Defects Regular Distortion X N D Y R L
Transcript
Transfer Function Pro (TRF-Pro) S8 Module of the KLIPPEL ANALYZER SYSTEM (Document Revision 1.4)
Full temporal fine structure of distortion (contrary to Fourier Analysis)
Reveals short-time disturbances of much lower level than traditional methods
Applicable to Speakers and Electronics
Simple interpretation
Separation from ambient noise
3D representation reveals location and physical cause of disturbance
Uses active Compensation technique for revealing defects
Measures deviation (impulsive and regular) from a “golden unit”
Full TRF (standard) features
TRF Voltage Stepping (STEP)
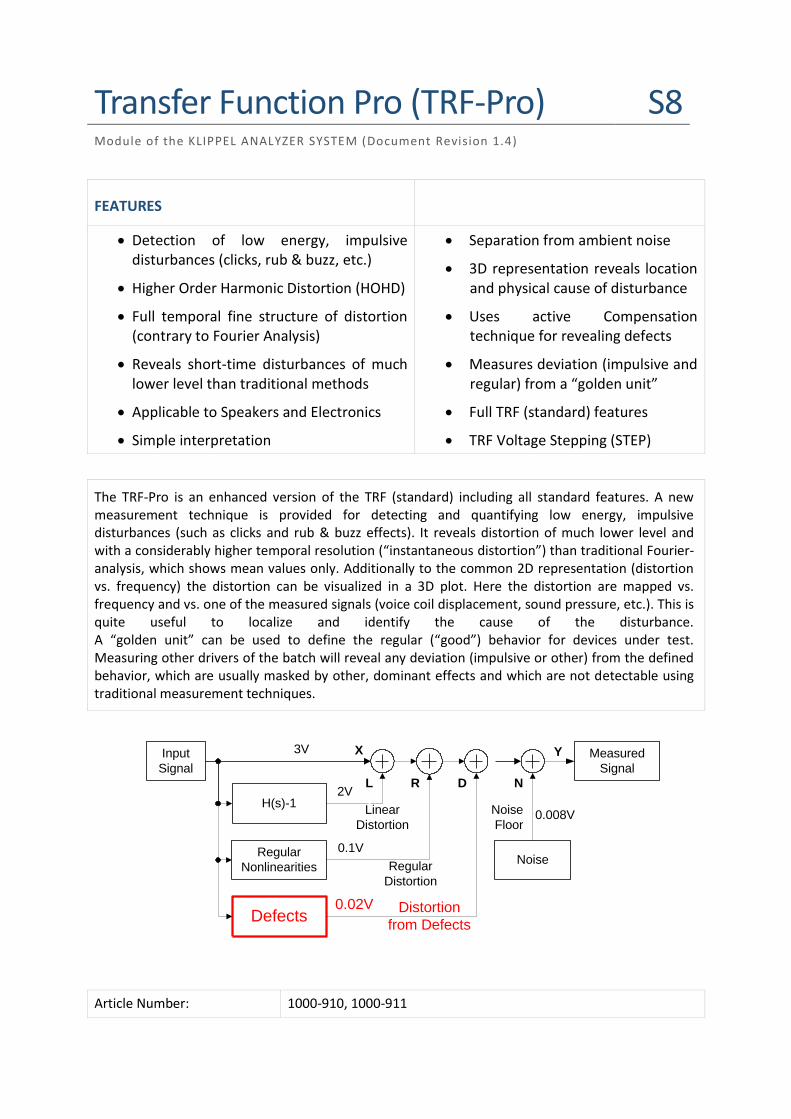
The TRF-Pro is an enhanced version of the TRF (standard) including all standard features. A new measurement technique is provided for detecting and quantifying low energy, impulsive disturbances (such as clicks and rub & buzz effects). It reveals distortion of much lower level and with a considerably higher temporal resolution (“instantaneous distortion”) than traditional Fourier-analysis, which shows mean values only. Additionally to the common 2D representation (distortion vs. frequency) the distortion can be visualized in a 3D plot. Here the distortion are mapped vs. frequency and vs. one of the measured signals (voice coil displacement, sound pressure, etc.). This is quite useful to localize and identify the cause of the disturbance. A “golden unit” can be used to define the regular (“good”) behavior for devices under test. Measuring other drivers of the batch will reveal any deviation (impulsive or other) from the defined behavior, which are usually masked by other, dominant effects and which are not detectable using traditional measurement techniques.
Article Number: 1000-910, 1000-911
Input
Signal
Measured
Signal
H(s)-1
Regular
Nonlinearities
Defects
Noise
3V
0.1V
0.02V
2V
0.008VLinear
Distortion
Noise
Floor
Distortion
from Defects
Regular
Distortion
X
ND
Y
RL
Transfer Function Pro (TRF-Pro) 1 Checking for Disturbances S8
KLIPPEL Analyzer System Page 2 of 10
CONTENT:
1 Checking for Disturbances .............................................................................................................................. 3
4 Result Windows .............................................................................................................................................. 7
Transfer Function Pro (TRF-Pro) 1 Checking for Disturbances S8
KLIPPEL Analyzer System Page 3 of 10
1 Checking for Disturbances
Target group Design engineers who want to check prototypes for unwanted impulsive
disturbances. Furthermore the deviation from defined behavior (“golden unit”)
can be checked. This reveals disturbances that are hardly audible or detectable
in the system response.
The Quality Control engineer testing samples from series production. Defective
units can be assessed to reveal problems in design, production or material. Long
term changes in production of linear and regular nonlinear behavior can be
assessed.
Principle
Input
Signal
Measured
Signal
H(s)-1
Regular
Nonlinearities
Defects
Noise
3V
0.1V
0.02V
2V
0.008VLinear
Distortion
Noise
Floor
Distortion
from Defects
Regular
Distortion
X
ND
Y
RL
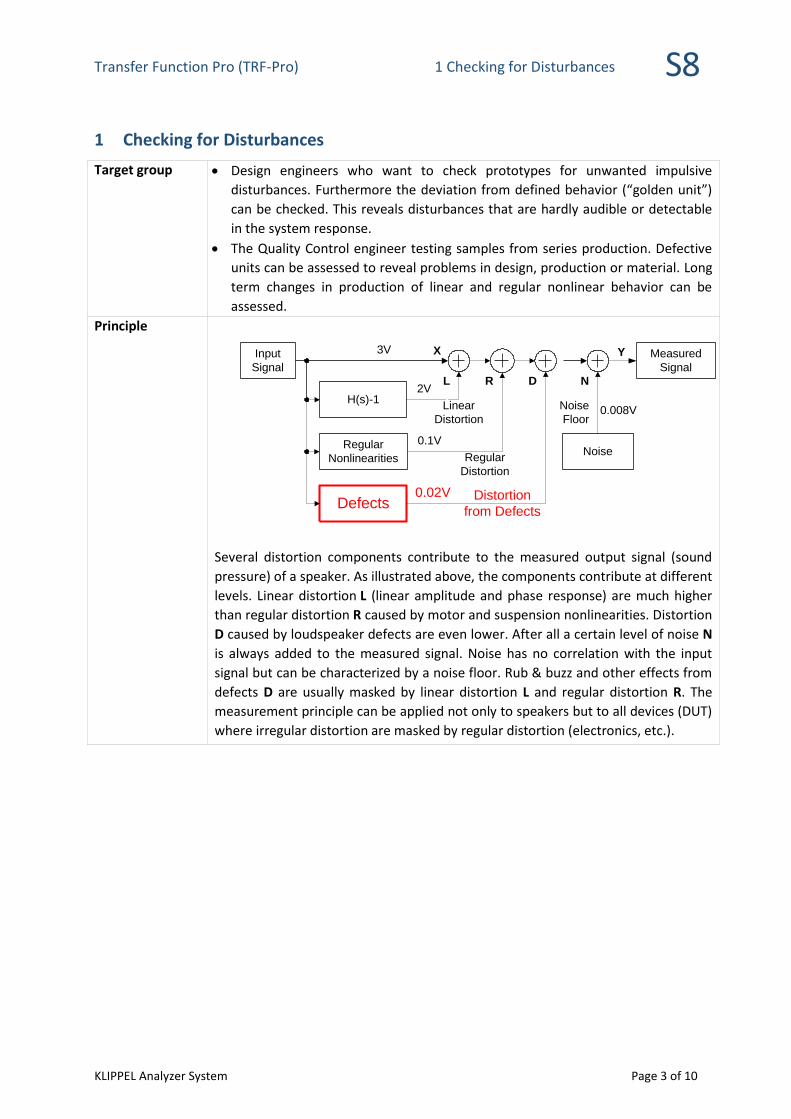
Several distortion components contribute to the measured output signal (sound
pressure) of a speaker. As illustrated above, the components contribute at different
levels. Linear distortion L (linear amplitude and phase response) are much higher
than regular distortion R caused by motor and suspension nonlinearities. Distortion
D caused by loudspeaker defects are even lower. After all a certain level of noise N
is always added to the measured signal. Noise has no correlation with the input
signal but can be characterized by a noise floor. Rub & buzz and other effects from
defects D are usually masked by linear distortion L and regular distortion R. The
measurement principle can be applied not only to speakers but to all devices (DUT)
where irregular distortion are masked by regular distortion (electronics, etc.).
Transfer Function Pro (TRF-Pro) 1 Checking for Disturbances S8
KLIPPEL Analyzer System Page 4 of 10
Signal
SourceDUT
Parameter
Estimator
Analysis
x(t) y(t)
y'(t)
e(t)
P
-
Model
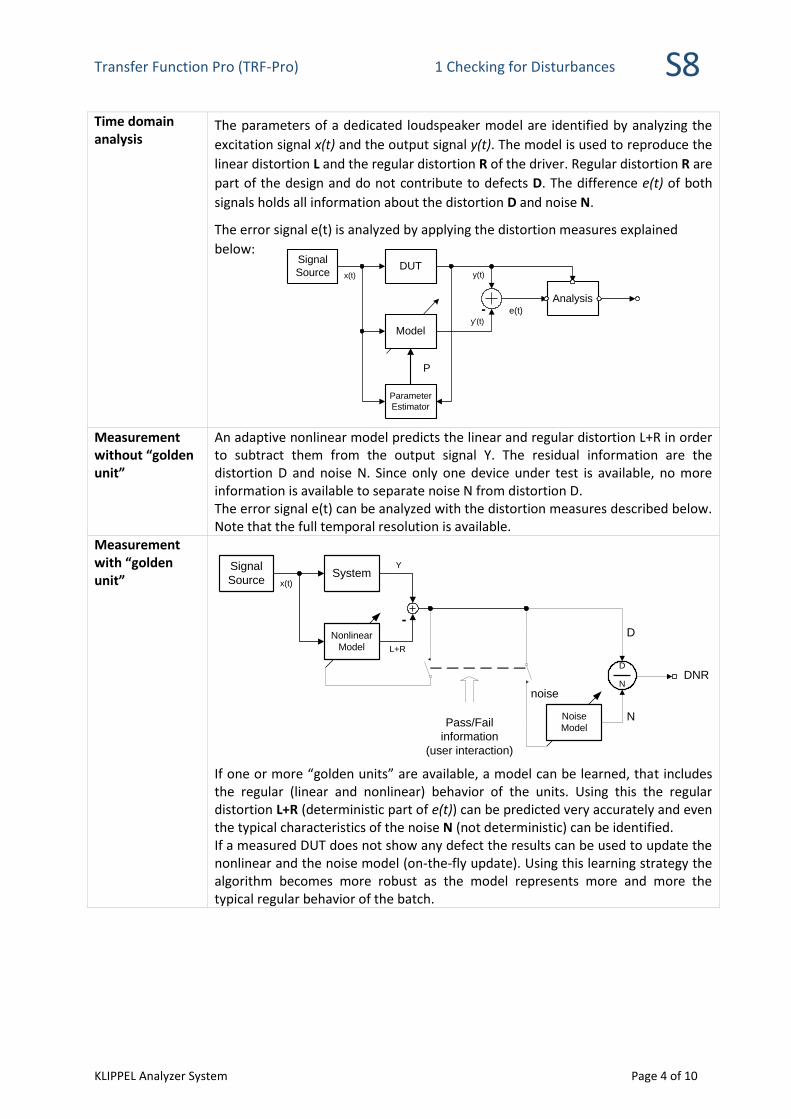
Time domain analysis
The parameters of a dedicated loudspeaker model are identified by analyzing the
excitation signal x(t) and the output signal y(t). The model is used to reproduce the
linear distortion L and the regular distortion R of the driver. Regular distortion R are
part of the design and do not contribute to defects D. The difference e(t) of both
signals holds all information about the distortion D and noise N.
The error signal e(t) is analyzed by applying the distortion measures explained
below:
Measurement without “golden unit”
An adaptive nonlinear model predicts the linear and regular distortion L+R in order to subtract them from the output signal Y. The residual information are the distortion D and noise N. Since only one device under test is available, no more information is available to separate noise N from distortion D. The error signal e(t) can be analyzed with the distortion measures described below. Note that the full temporal resolution is available.
Measurement with “golden unit”
If one or more “golden units” are available, a model can be learned, that includes the regular (linear and nonlinear) behavior of the units. Using this the regular distortion L+R (deterministic part of e(t)) can be predicted very accurately and even the typical characteristics of the noise N (not deterministic) can be identified. If a measured DUT does not show any defect the results can be used to update the nonlinear and the noise model (on-the-fly update). Using this learning strategy the algorithm becomes more robust as the model represents more and more the typical regular behavior of the batch.
Signal
SourceSystem
Nonlinear
Model
x(t)
Y
L+R
-
D
N
N
D
DNR
noise
Pass/Fail
information
(user interaction)
Noise
Model
Transfer Function Pro (TRF-Pro) 2 Post-processing S8
KLIPPEL Analyzer System Page 5 of 10
2 Post-processing
Distortion Measures
Frequency – time mapping
The TRF uses a logarithmic sine sweep as excitation signal. As at any time instant only a single frequency is excited the measurement time t can be mapped uniquely to the instantaneous excitation frequency f. Hence each distortion measure can either be plotted versus time t or frequency f, as long as the dependency is known. In case of a logarithmic sweep, the linear time scale corresponds to a logarithmic frequency scale. This mapping requires an accurate time delay determination which is done automatically by the TRF. Several distortion measures are provided. They are first calculated in the time domain by post-processing the residual signal e(t) and the measured output signal
y(t). The measurement time interval is divided into N subinterval ),[ 1kk tt ,
k=0,1,…N-1 for which RMS and peak values are calculated. For display the measures are mapped from time domain to frequency domain.
MID Mean impulsive distortion
IID Instantaneous impulsive distortion
ICID Instantaneous crest of impulsive distortion
ID Impulsive distortion
CID Crest factor of impulsive distortion
with
1
.)(1 2
1
kt
ktkk
RMS dttytt
y
1
.)(1 2
1
kt
ktkk
RMS dttett
e
)(max1
teekk ttt
peak
DNR If a “golden unit” is available, for each of the above measures the distortion to noise ratio (DNR) can be calculated. This measure indicates deviations (defects) from the behavior of the “golden unit” that are well above the noise floor.
Modes of Operation
Impulsive Distortion
This mode can be used to measure impulsive distortion according to IEC60268-21 and rub & buzz symptoms. By the chosen harmonic distortion order of 10th or 20th
the fundamental and lower order harmonic distortion are removed from the measured signal and the impulsive high frequency components will be isolated and considered for the calculation of the impulsive distortion measures. All low frequency component and reverberant sound would be removed as well.
Transfer Function Pro (TRF-Pro) 3 Graphical representation S8
KLIPPEL Analyzer System Page 6 of 10
Rub & Buzz This mode is used for rub & buzz detection if no “golden unit” is available. It measures high frequency “peaky” distortion. It can be chosen between 10th and 20th order as lower limit of considered distortion components. The measured distortion may be masked by lower order regular speaker distortion. In difference to the Impulsive Distortion, the Rub & Buzz mode includes also low frequency components that could be used to detect sub harmonics in the signal. However this mode needs a good acoustic environment, because reverberant sound will appear in the residual signal response and may affect the impulsive distortion measures.
THD + Rub & Buzz
In this mode any behavior that deviates from linear behavior is measured. Both the regular driver distortions (due to motor and suspension nonlinearities, etc.) and impulse distortions (rub & buzz) are included. This is useful to identify any nonlinear effect of the driver. No “golden unit” is needed.
Deviation all distortion
In this mode a “golden unit” is needed. The golden unit is used to remove the unavoidable regular driver distortions (due to motor and suspension nonlinearities, etc.) from the measurement. For this the golden unit has to be measured first. After the measurement has finished click the Learn button to identify a model of the golden unit. Repeat the measurement and the learning several times. The results of the different runs will be averaged to reduce the noise. If available use different golden units as well. After finishing the learning procedure you can start the “real” measurements. They will show you any deviation from the golden unit. This might be some rub & buzz effect ore some deviation of the regular nonlinearities (due to motor, suspension, etc.).
Deviation Rub & Buzz
This mode is used for rub & buzz detection if a “golden unit” is available. The golden unit is used to remove the unavoidable regular driver distortions (due to motor and suspension nonlinearities, etc.) from the measurement. For this the golden unit has to be measured first. After the measurement has finished click the Learn button to identify a model of the golden unit. Repeat the measurement and the learning several times. The results of the different runs will be averaged to reduce to noise. If available use different golden units as well. After finishing the learning procedure you can start the normal measurements.
HOHD Higher Order Harmonic Distortion (HOHD) according to the IEC 60268-21
3 Graphical representation
2D The selected distortion measure is plotted vs. frequency. 3D (state mapping)
The selected distortion measure is plotted vs. frequency and vs. one of the measured signals (state). The x-axis of the contour plot depicts the frequency, the y-axis shows the measured signal measured and the distortion measure is given in the 3rd dimension. In case of driver tests the displacement signal is of particular interest (y-axis signal). It can be used to identify the location and thereby the physical cause of the defect.
Transfer Function Pro (TRF-Pro) 4 Result Windows S8
KLIPPEL Analyzer System Page 7 of 10
4 Result Windows
The following windows are additional to the TRF (standard) result windows.
Instantaneous Distortion
2D representation of the distortion measures described above versus frequency. Each measure can be scaled in percent or in dB. The distortion measure can be derived from one of the acquired input signals.
Instantaneous Distortion 3D
Shows the selected distortion measure vs. frequency and vs. an acquired signal. The measure can be plotted in percent or in dB. A threshold value can be defined for the 3D coloration of the graph to indicate a defect.
Modeled Response
The measured output signal y(t), the modeled signal y’(t) and the residual error signal e(t) are plotted versus frequency. Over- or under-compensation effects of the error e(t)-signal can be assessed as well as the agreement between modeled and measured output signal.
5 Limit Values
Parameter Min Typ. Max Unit
Maximal frequency of nonlinear model 4 kHz Data acquisition bandwidth 88 kHz
6 Applications
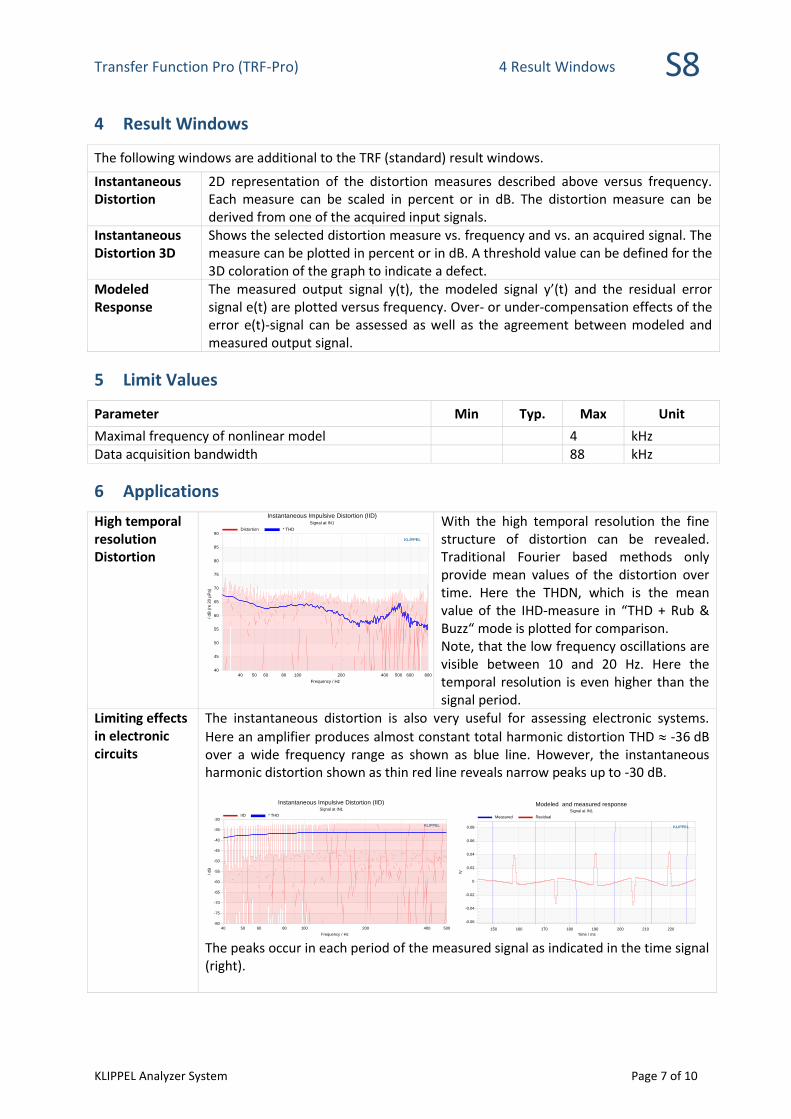
High temporal resolution Distortion
KLIPPEL
40
45
50
55
60
65
70
75
80
85
90
40 50 60 80 100 200 400 500 600 800
Instantaneous Impulsive Distortion (IID)Signal at IN1
/ dB
(re
20 µ
Pa)
Frequency / Hz
Distortion * THD
With the high temporal resolution the fine structure of distortion can be revealed. Traditional Fourier based methods only provide mean values of the distortion over time. Here the THDN, which is the mean value of the IHD-measure in “THD + Rub & Buzz“ mode is plotted for comparison. Note, that the low frequency oscillations are visible between 10 and 20 Hz. Here the temporal resolution is even higher than the signal period.
Limiting effects in electronic circuits
The instantaneous distortion is also very useful for assessing electronic systems.
Here an amplifier produces almost constant total harmonic distortion THD -36 dB over a wide frequency range as shown as blue line. However, the instantaneous harmonic distortion shown as thin red line reveals narrow peaks up to -30 dB.
KLIPPEL
-0.06
-0.04
-0.02
0
0.02
0.04
0.06
0.08
150 160 170 180 190 200 210 220
Modeled and measured responseSignal at IN1
/V
Time / ms
Measured Residual
The peaks occur in each period of the measured signal as indicated in the time signal (right).
KLIPPEL
-80
-75
-70
-65
-60
-55
-50
-45
-40
-35
-30
40 50 60 80 100 200 400 500
Instantaneous Impulsive Distortion (IID)Signal at IN1
/ dB
Frequency / Hz
IID * THD
Transfer Function Pro (TRF-Pro) 6 Applications S8
KLIPPEL Analyzer System Page 8 of 10
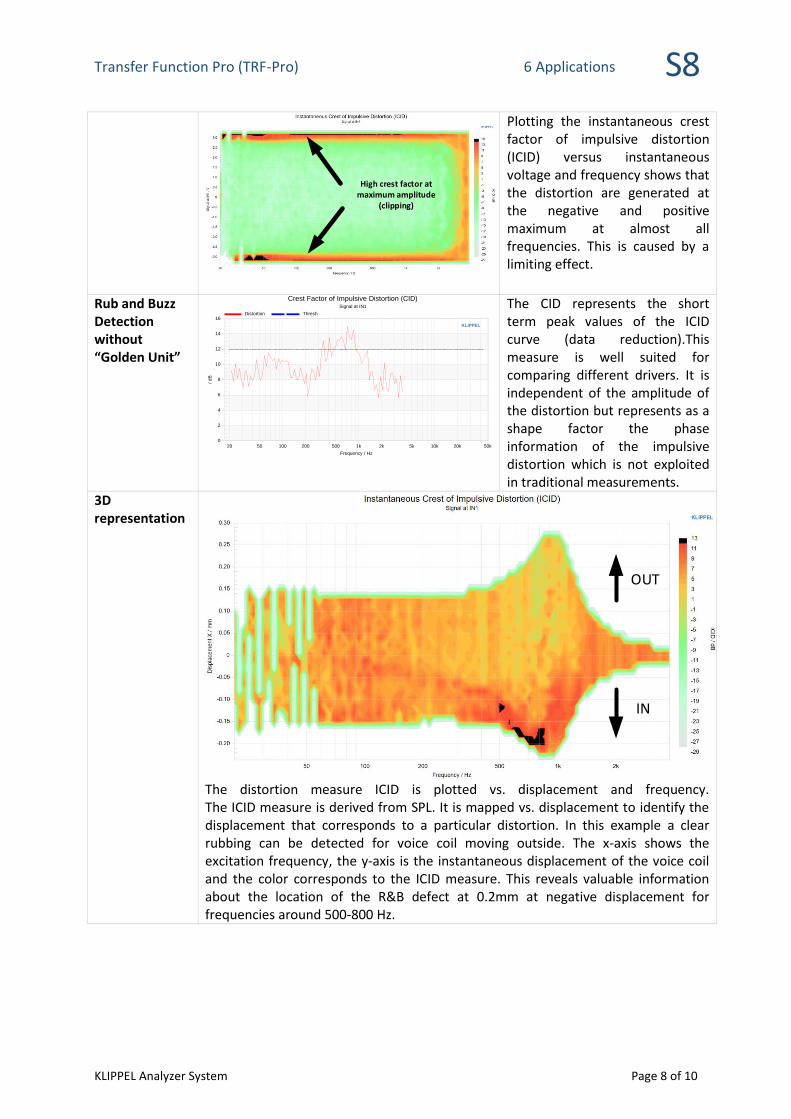
High crest factor at maximum amplitude
(clipping)
Plotting the instantaneous crest factor of impulsive distortion (ICID) versus instantaneous voltage and frequency shows that the distortion are generated at the negative and positive maximum at almost all frequencies. This is caused by a limiting effect.
Rub and Buzz Detection without “Golden Unit”
KLIPPEL
0
2
4
6
8
10
12
14
16
20 50 100 200 500 1k 2k 5k 10k 20k 50k
Crest Factor of Impulsive Distortion (CID)Signal at IN1
/ dB
Frequency / Hz
Distortion Thresh
The CID represents the short term peak values of the ICID curve (data reduction).This measure is well suited for comparing different drivers. It is independent of the amplitude of the distortion but represents as a shape factor the phase information of the impulsive distortion which is not exploited in traditional measurements.
3D representation
OUT
IN
The distortion measure ICID is plotted vs. displacement and frequency. The ICID measure is derived from SPL. It is mapped vs. displacement to identify the displacement that corresponds to a particular distortion. In this example a clear rubbing can be detected for voice coil moving outside. The x-axis shows the excitation frequency, the y-axis is the instantaneous displacement of the voice coil and the color corresponds to the ICID measure. This reveals valuable information about the location of the R&B defect at 0.2mm at negative displacement for frequencies around 500-800 Hz.
Transfer Function Pro (TRF-Pro) 6 Applications S8
KLIPPEL Analyzer System Page 9 of 10
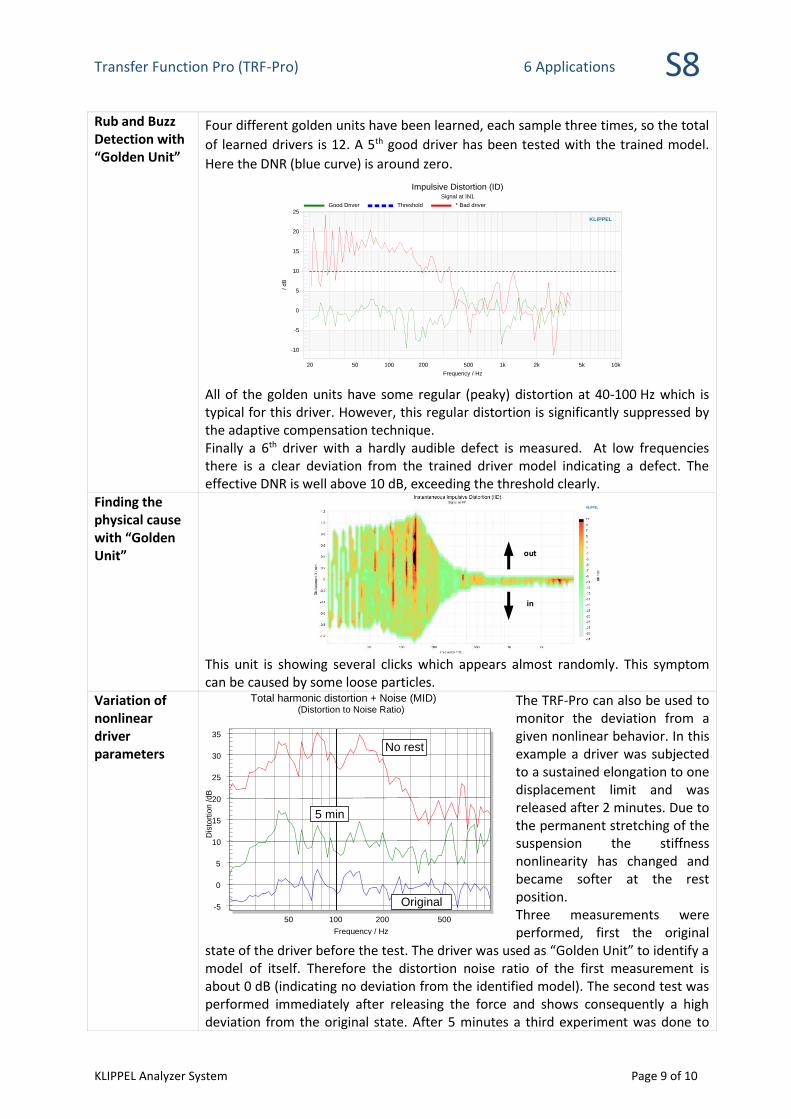
Rub and Buzz Detection with “Golden Unit”
Four different golden units have been learned, each sample three times, so the total
of learned drivers is 12. A 5th good driver has been tested with the trained model.
Here the DNR (blue curve) is around zero.
KLIPPEL
-10
-5
0
5
10
15
20
25
20 50 100 200 500 1k 2k 5k 10k
Impulsive Distortion (ID)Signal at IN1
/ dB
Frequency / Hz
Good Driver Threshold * Bad driver
All of the golden units have some regular (peaky) distortion at 40-100 Hz which is typical for this driver. However, this regular distortion is significantly suppressed by the adaptive compensation technique. Finally a 6th driver with a hardly audible defect is measured. At low frequencies there is a clear deviation from the trained driver model indicating a defect. The effective DNR is well above 10 dB, exceeding the threshold clearly.
Finding the physical cause with “Golden Unit” out
in
This unit is showing several clicks which appears almost randomly. This symptom can be caused by some loose particles.
Variation of nonlinear driver parameters
The TRF-Pro can also be used to monitor the deviation from a given nonlinear behavior. In this example a driver was subjected to a sustained elongation to one displacement limit and was released after 2 minutes. Due to the permanent stretching of the suspension the stiffness nonlinearity has changed and became softer at the rest position. Three measurements were performed, first the original
state of the driver before the test. The driver was used as “Golden Unit” to identify a model of itself. Therefore the distortion noise ratio of the first measurement is about 0 dB (indicating no deviation from the identified model). The second test was performed immediately after releasing the force and shows consequently a high deviation from the original state. After 5 minutes a third experiment was done to
50 100 200 500
Total harmonic distortion + Noise (MID) (Distortion to Noise Ratio)
Dis
tort
ion
/d
B
Frequency / Hz
-5
0
5
10
15
20
25
30
35
Original
No rest
5 min
rest
Transfer Function Pro (TRF-Pro) 6 Applications S8
KLIPPEL Analyzer System Page 10 of 10
check the recovery of the suspension from stress. A clear reduction of the deviation is obvious, however, even after 5 minutes rest the driver did not reach its performance before the test. Valuable clues about the “Memory” effect of the used suspension can be drawn. Other Applications are parameter stability in long term power tests, temperature dependency or checking the deviation of parameters for a batch of drivers (e.g. from a production line).


![[Friederike Klippel] Keep Talking Communicative F(BookFi.org)](https://static.documents.pub/doc/80x56/56d6bfe01a28ab3016980726/friederike-klippel-keep-talking-communicative-fbookfiorg.jpg)
