Updated: March 16, 2016 Klippel GmbH Mendelssohnallee 30 01309 Dresden, Germany www.klippel.de [email protected]TEL: +49-351-251 35 35 FAX: +49-351-251 34 31 Yield Statistics (YST) AN 48 Application Note to the KLIPPEL QC SYSTEM v5.0 The yield is the overall criteria of the production process. Using Klippel QC the quality of DUTs can be ensured, however, the QC-System is focused on the running process. Keeping track of the production yield can be difficult, especially when multiple testing lines are used simultaneously or when the overall yield of a factory is to be analyzed. An overview of the yield is calculated by the YieldStatistics module based on log files that were generated by the KLIPPEL QC System. Log files of multiple production lines or tests can be parsed and a quick overview is presented. The output can be tailored to a specific period of time, to operators or tests. For further analysis in 3 rd party statistics software, a merged CSV file of all log files filtered with the specified criteria (date/time range, operator, serial number, ...) can be produced easily. This application note shows several application examples in a tutorial. CONTENTS: Requirements .......................................................................................................................................... 2 Tutorial: Setup ......................................................................................................................................... 3 Tutorial: Integration................................................................................................................................ 11 More Applications .................................................................................................................................. 17 Further reading ...................................................................................................................................... 19
Yield Statistics (YST) AN 48 Application Note to the KLIPPEL QC SYSTEM v5.0
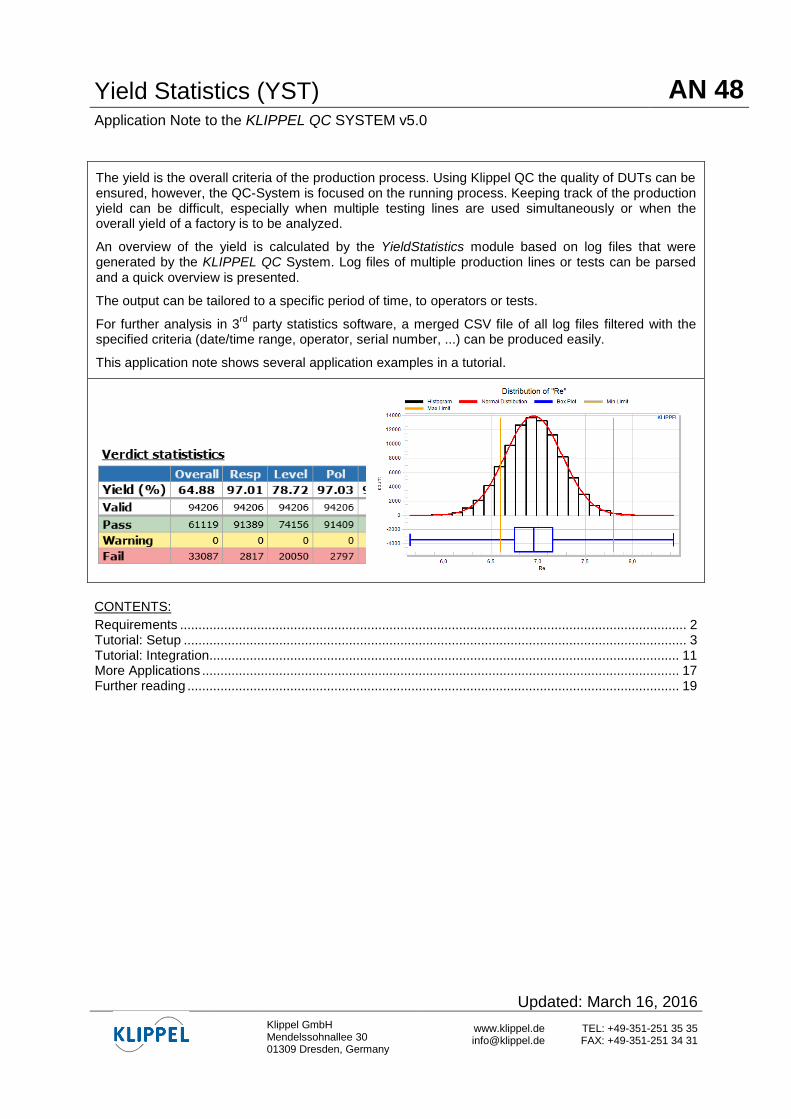
The yield is the overall criteria of the production process. Using Klippel QC the quality of DUTs can be ensured, however, the QC-System is focused on the running process. Keeping track of the production yield can be difficult, especially when multiple testing lines are used simultaneously or when the overall yield of a factory is to be analyzed.
An overview of the yield is calculated by the YieldStatistics module based on log files that were generated by the KLIPPEL QC System. Log files of multiple production lines or tests can be parsed and a quick overview is presented.
The output can be tailored to a specific period of time, to operators or tests.
For further analysis in 3rd
party statistics software, a merged CSV file of all log files filtered with the specified criteria (date/time range, operator, serial number, ...) can be produced easily.
This application note shows several application examples in a tutorial.
CONTENTS:
Requirements .......................................................................................................................................... 2 Tutorial: Setup ......................................................................................................................................... 3 Tutorial: Integration................................................................................................................................ 11 More Applications .................................................................................................................................. 17 Further reading ...................................................................................................................................... 19
Yield Statistics AN 48
Application Note for Klippel QC System page 2
Requirements
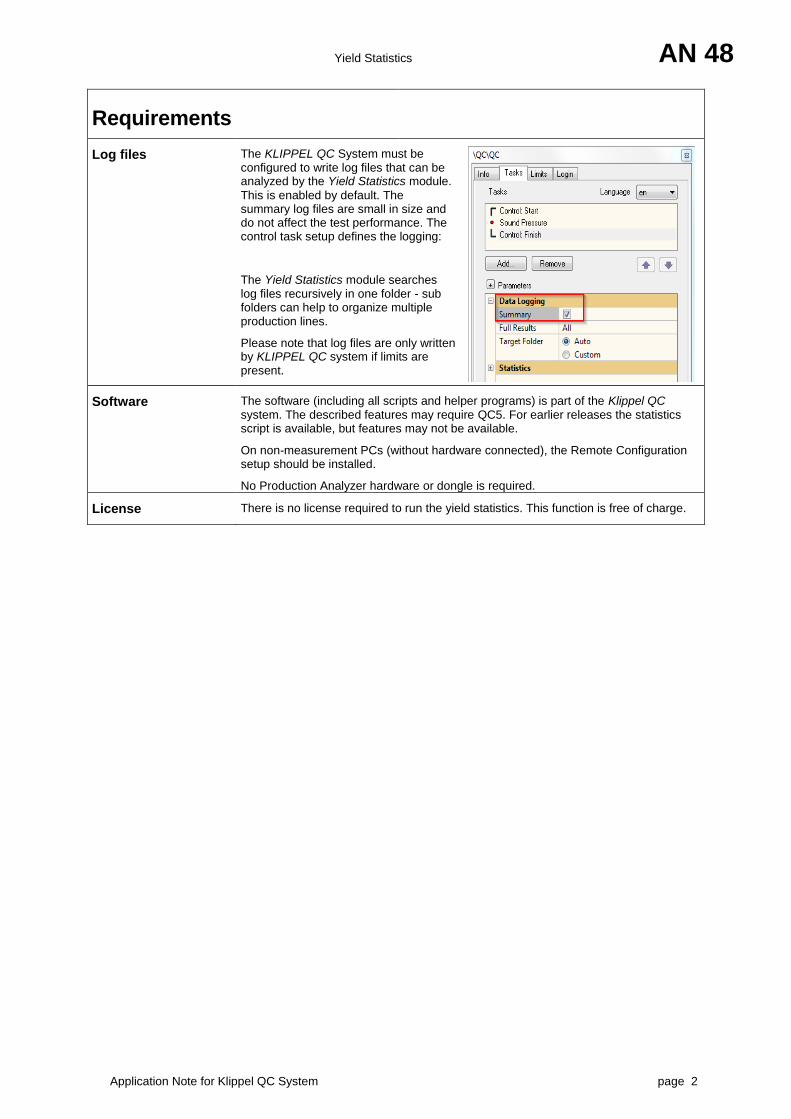
Log files The KLIPPEL QC System must be configured to write log files that can be analyzed by the Yield Statistics module.
This is enabled by default. The summary log files are small in size and do not affect the test performance. The control task setup defines the logging:
The Yield Statistics module searches log files recursively in one folder - sub folders can help to organize multiple production lines.
Please note that log files are only written by KLIPPEL QC system if limits are present.
Software The software (including all scripts and helper programs) is part of the Klippel QC system. The described features may require QC5. For earlier releases the statistics script is available, but features may not be available.
On non-measurement PCs (without hardware connected), the Remote Configuration setup should be installed.
No Production Analyzer hardware or dongle is required.
License There is no license required to run the yield statistics. This function is free of charge.
Yield Statistics AN 48
Application Note for Klippel QC System page 3
Tutorial: Setup
(Example data is delivered along with this document.)
Create a simple statistics from scratch
Note: These instructions show how to create a statistics operation from scratch. Quick access is explained below in the integration section of the tutorial.
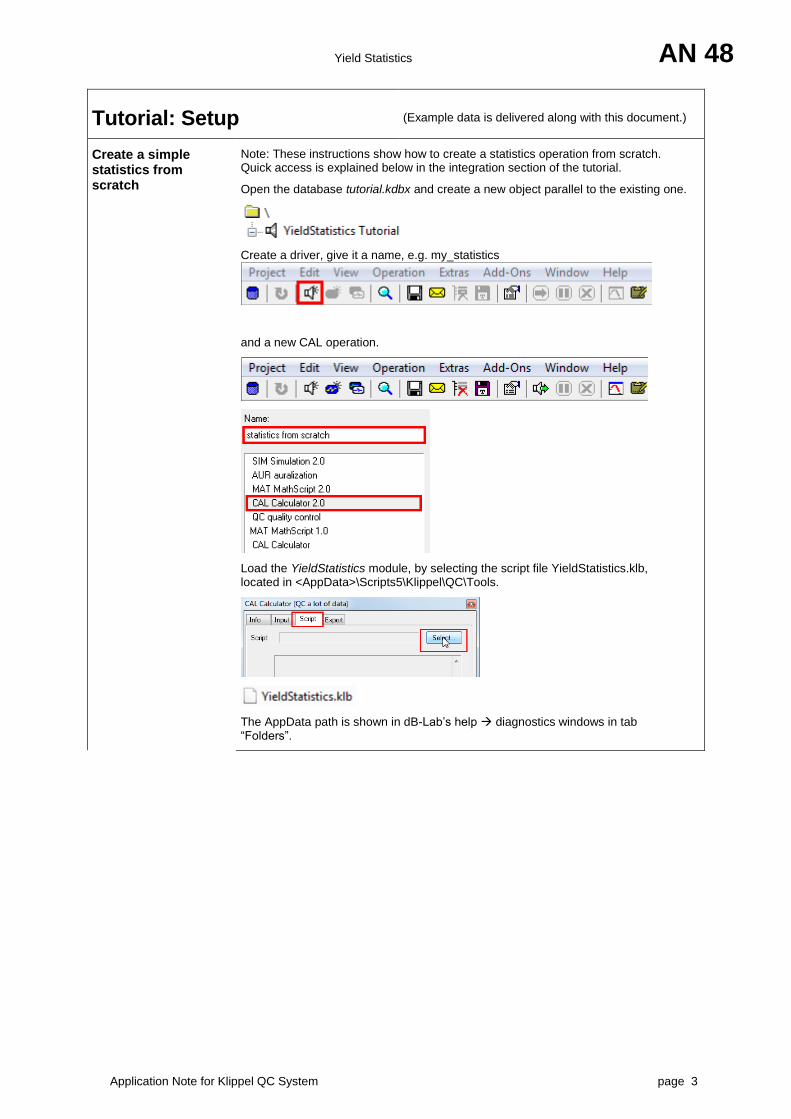
Open the database tutorial.kdbx and create a new object parallel to the existing one.
Create a driver, give it a name, e.g. my_statistics
and a new CAL operation.
Load the YieldStatistics module, by selecting the script file YieldStatistics.klb, located in <AppData>\Scripts5\Klippel\QC\Tools.
The AppData path is shown in dB-Lab’s help diagnostics windows in tab “Folders”.
Yield Statistics AN 48
Application Note for Klippel QC System page 4
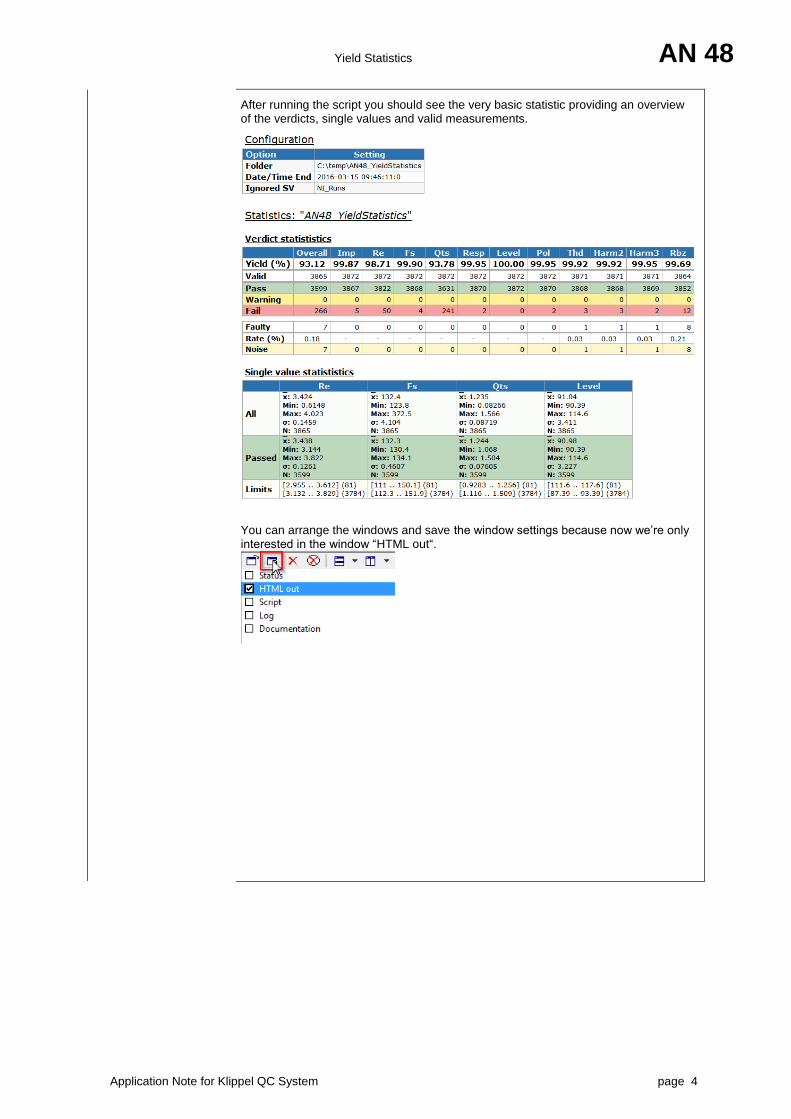
After running the script you should see the very basic statistic providing an overview of the verdicts, single values and valid measurements.
You can arrange the windows and save the window settings because now we’re only interested in the window “HTML out“.
Yield Statistics AN 48
Application Note for Klippel QC System page 5
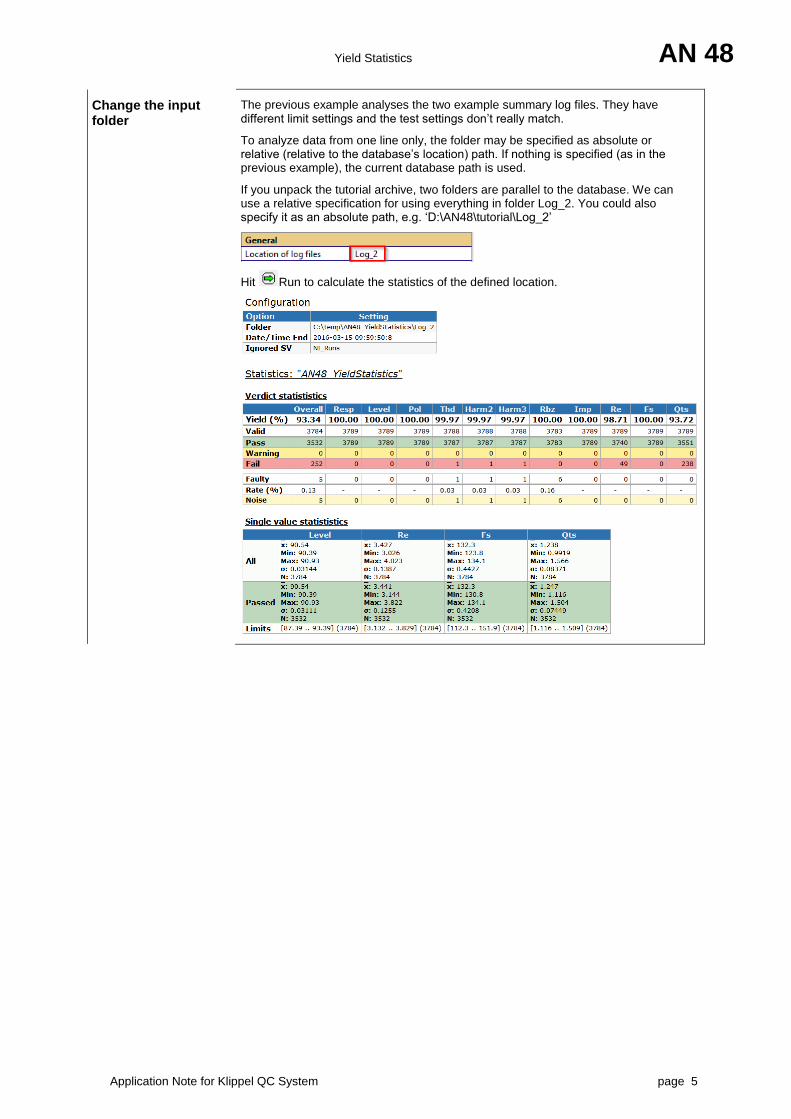
Change the input folder
The previous example analyses the two example summary log files. They have different limit settings and the test settings don’t really match.
To analyze data from one line only, the folder may be specified as absolute or relative (relative to the database’s location) path. If nothing is specified (as in the previous example), the current database path is used.
If you unpack the tutorial archive, two folders are parallel to the database. We can use a relative specification for using everything in folder Log_2. You could also specify it as an absolute path, e.g. ‘D:\AN48\tutorial\Log_2’
Hit Run to calculate the statistics of the defined location.
Yield Statistics AN 48
Application Note for Klippel QC System page 6
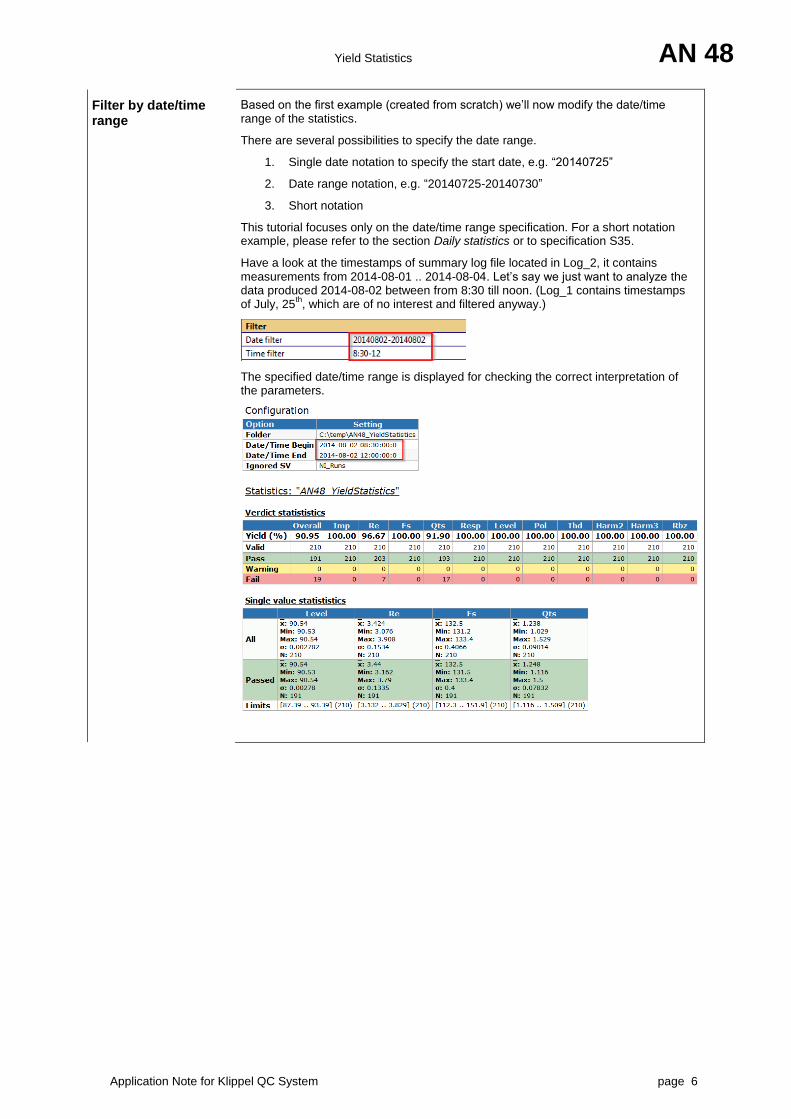
Filter by date/time range
Based on the first example (created from scratch) we’ll now modify the date/time range of the statistics.
There are several possibilities to specify the date range.
1. Single date notation to specify the start date, e.g. “20140725”
2. Date range notation, e.g. “20140725-20140730”
3. Short notation
This tutorial focuses only on the date/time range specification. For a short notation example, please refer to the section Daily statistics or to specification S35.
Have a look at the timestamps of summary log file located in Log_2, it contains measurements from 2014-08-01 .. 2014-08-04. Let’s say we just want to analyze the data produced 2014-08-02 between from 8:30 till noon. (Log_1 contains timestamps of July, 25
th, which are of no interest and filtered anyway.)
The specified date/time range is displayed for checking the correct interpretation of the parameters.
Yield Statistics AN 48
Application Note for Klippel QC System page 7
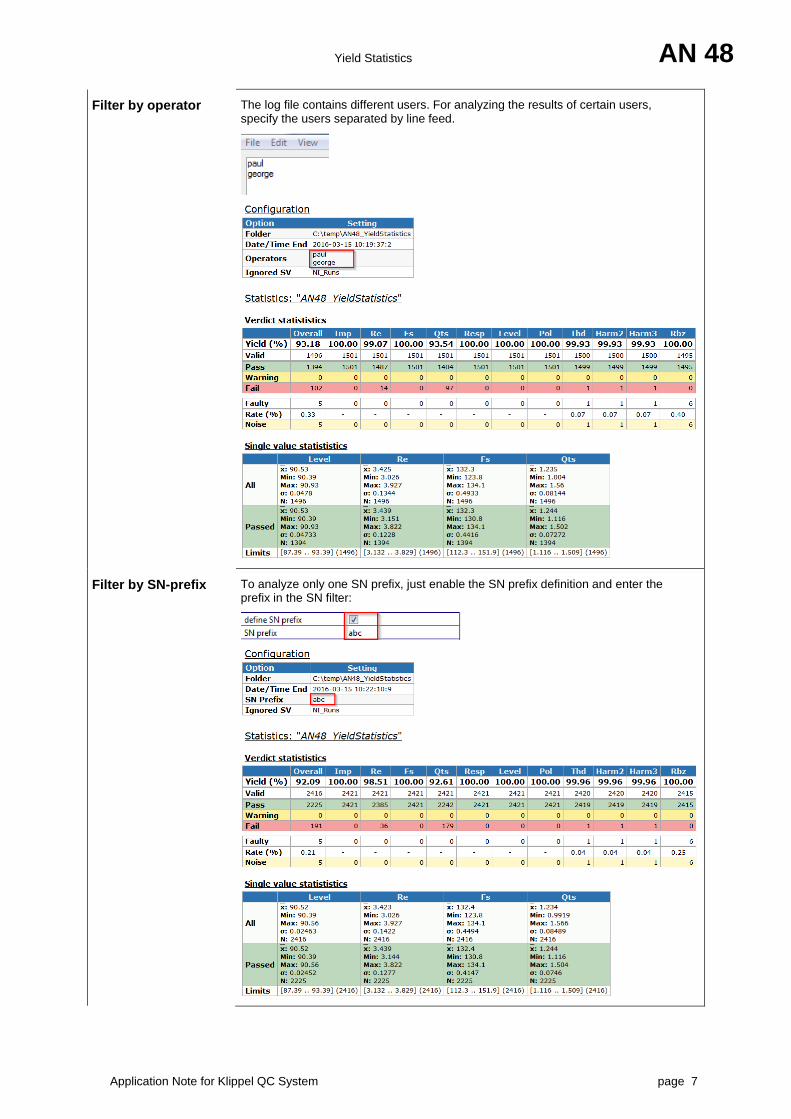
Filter by operator The log file contains different users. For analyzing the results of certain users, specify the users separated by line feed.
Filter by SN-prefix To analyze only one SN prefix, just enable the SN prefix definition and enter the prefix in the SN filter:
Yield Statistics AN 48
Application Note for Klippel QC System page 8
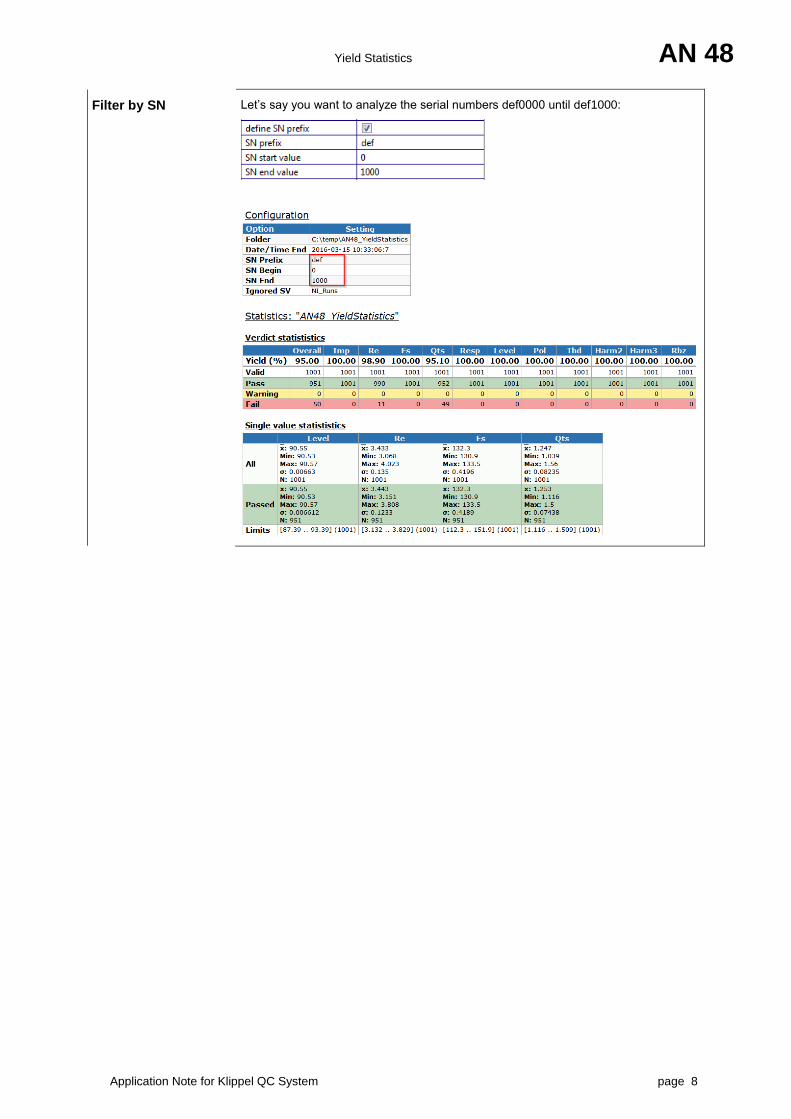
Filter by SN Let’s say you want to analyze the serial numbers def0000 until def1000:
Yield Statistics AN 48
Application Note for Klippel QC System page 9
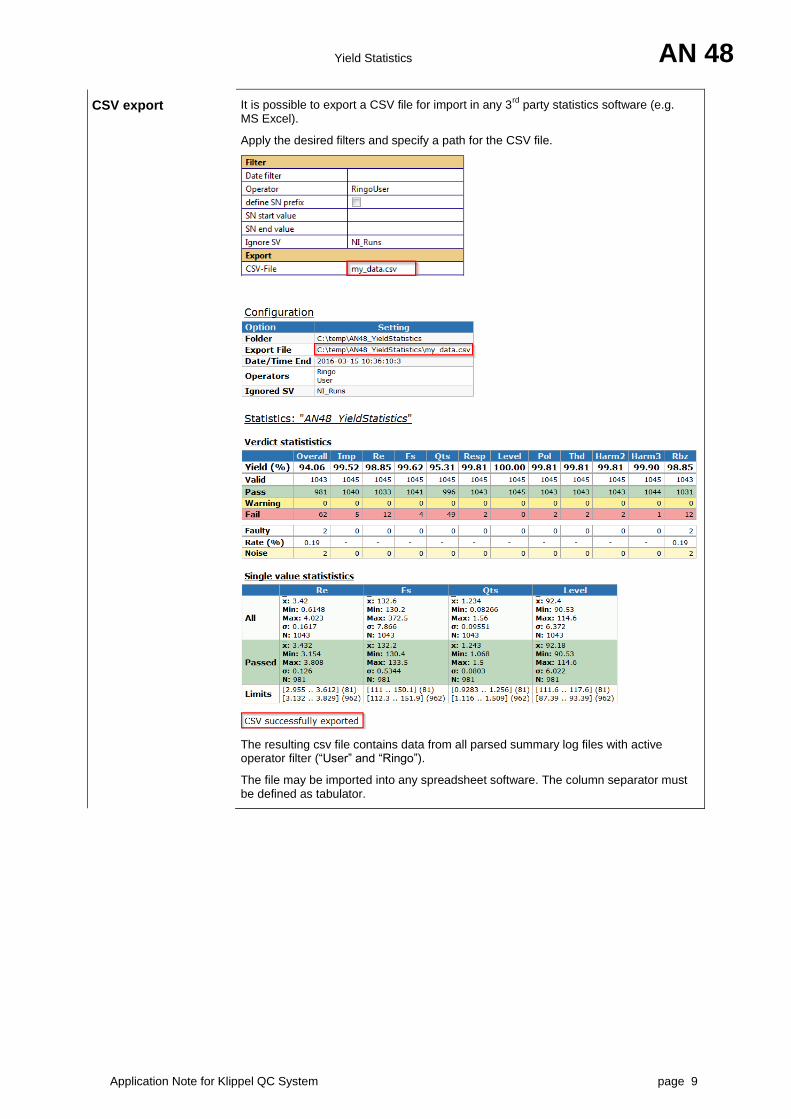
CSV export It is possible to export a CSV file for import in any 3rd
party statistics software (e.g. MS Excel).
Apply the desired filters and specify a path for the CSV file.
The resulting csv file contains data from all parsed summary log files with active operator filter (“User” and “Ringo”).
The file may be imported into any spreadsheet software. The column separator must be defined as tabulator.
Yield Statistics AN 48
Application Note for Klippel QC System page 10
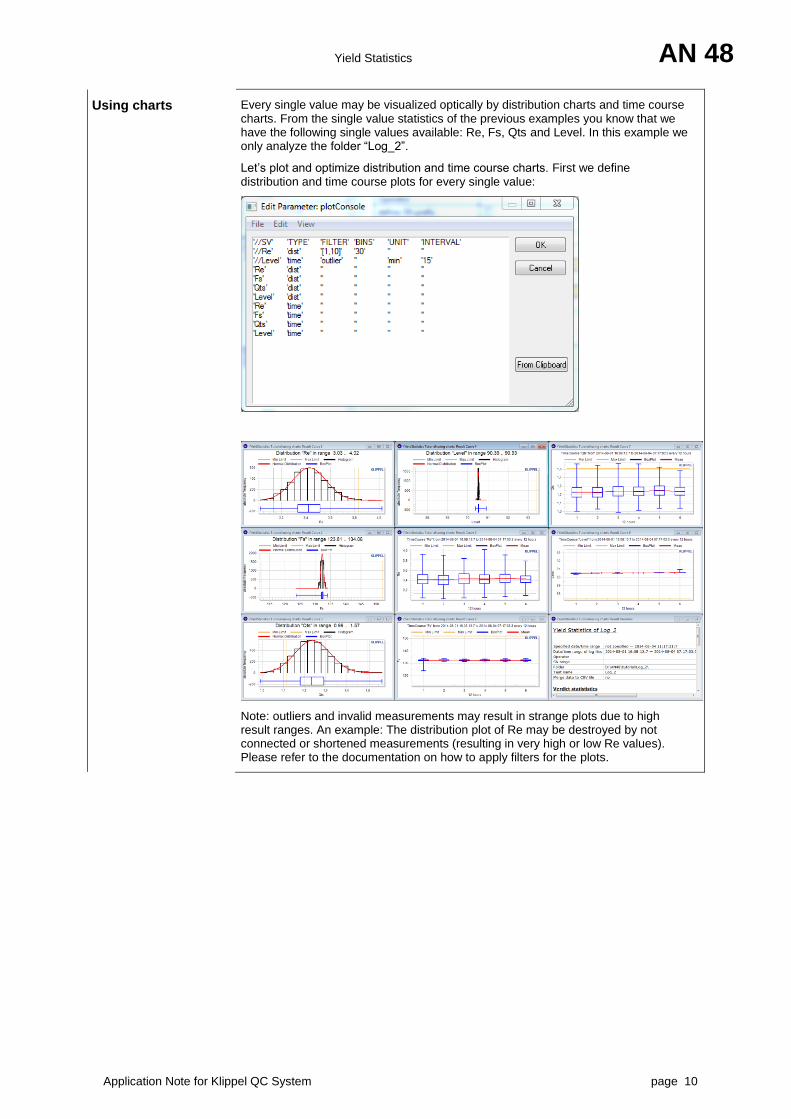
Using charts Every single value may be visualized optically by distribution charts and time course charts. From the single value statistics of the previous examples you know that we have the following single values available: Re, Fs, Qts and Level. In this example we only analyze the folder “Log_2”.
Let’s plot and optimize distribution and time course charts. First we define distribution and time course plots for every single value:
Note: outliers and invalid measurements may result in strange plots due to high result ranges. An example: The distribution plot of Re may be destroyed by not connected or shortened measurements (resulting in very high or low Re values). Please refer to the documentation on how to apply filters for the plots.
Yield Statistics AN 48
Application Note for Klippel QC System page 11
Tutorial: Integration
Integration into QC-Start and dB-Lab
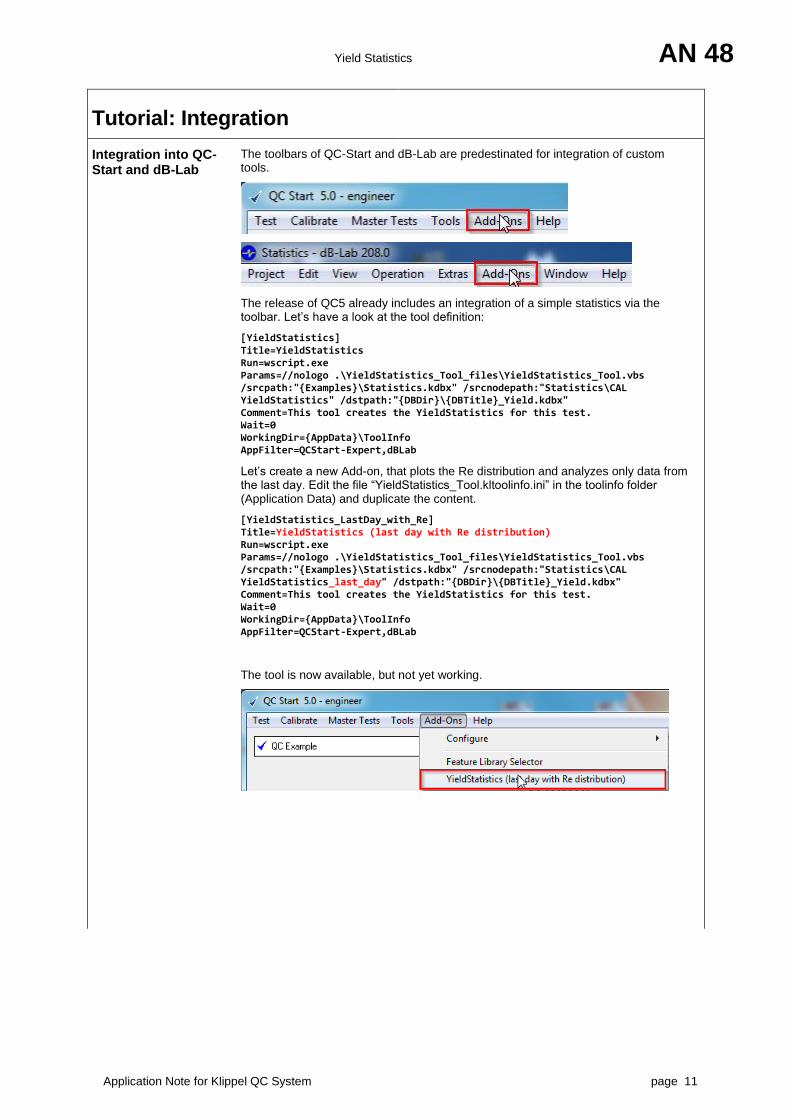
The toolbars of QC-Start and dB-Lab are predestinated for integration of custom tools.
The release of QC5 already includes an integration of a simple statistics via the toolbar. Let’s have a look at the tool definition:
[YieldStatistics] Title=YieldStatistics Run=wscript.exe Params=//nologo .\YieldStatistics_Tool_files\YieldStatistics_Tool.vbs /srcpath:"{Examples}\Statistics.kdbx" /srcnodepath:"Statistics\CAL YieldStatistics" /dstpath:"{DBDir}\{DBTitle}_Yield.kdbx" Comment=This tool creates the YieldStatistics for this test. Wait=0 WorkingDir={AppData}\ToolInfo AppFilter=QCStart-Expert,dBLab
Let’s create a new Add-on, that plots the Re distribution and analyzes only data from the last day. Edit the file “YieldStatistics_Tool.kltoolinfo.ini” in the toolinfo folder (Application Data) and duplicate the content.
[YieldStatistics_LastDay_with_Re] Title=YieldStatistics (last day with Re distribution) Run=wscript.exe Params=//nologo .\YieldStatistics_Tool_files\YieldStatistics_Tool.vbs /srcpath:"{Examples}\Statistics.kdbx" /srcnodepath:"Statistics\CAL YieldStatistics_last_day" /dstpath:"{DBDir}\{DBTitle}_Yield.kdbx" Comment=This tool creates the YieldStatistics for this test. Wait=0 WorkingDir={AppData}\ToolInfo AppFilter=QCStart-Expert,dBLab
The tool is now available, but not yet working.
Yield Statistics AN 48
Application Note for Klippel QC System page 12
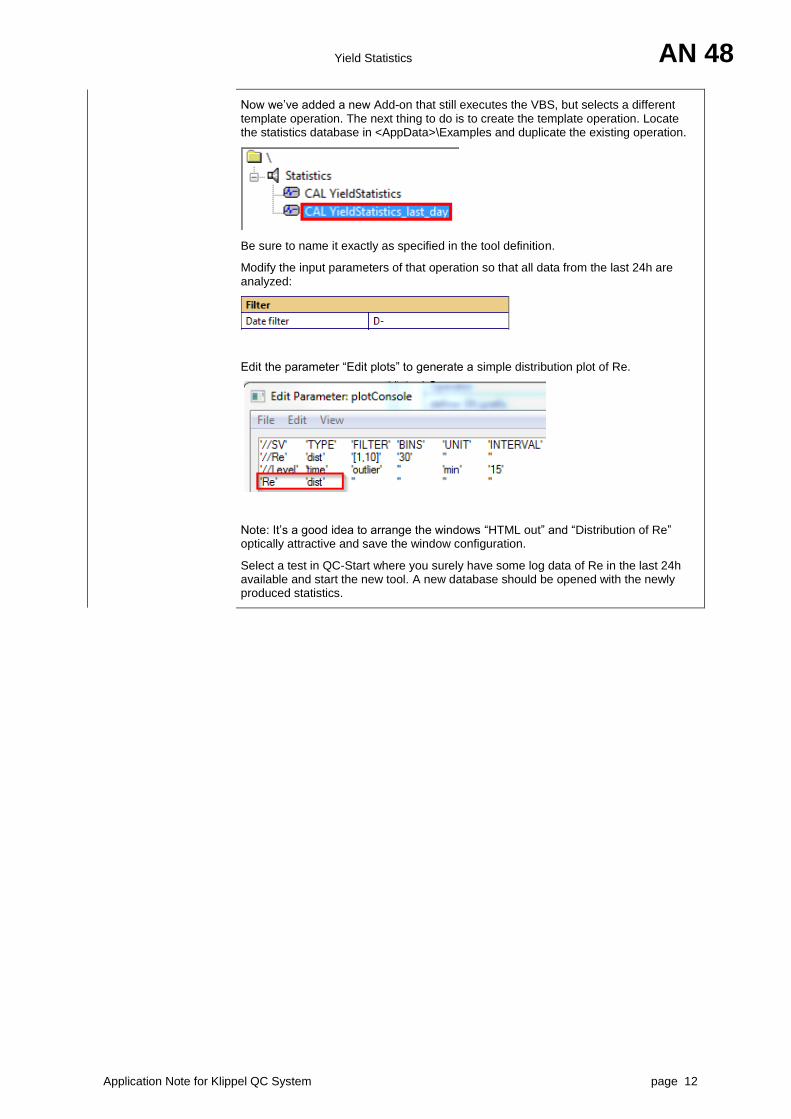
Now we’ve added a new Add-on that still executes the VBS, but selects a different template operation. The next thing to do is to create the template operation. Locate the statistics database in <AppData>\Examples and duplicate the existing operation.
Be sure to name it exactly as specified in the tool definition.
Modify the input parameters of that operation so that all data from the last 24h are analyzed:
Edit the parameter “Edit plots” to generate a simple distribution plot of Re.
Note: It’s a good idea to arrange the windows “HTML out” and “Distribution of Re” optically attractive and save the window configuration.
Select a test in QC-Start where you surely have some log data of Re in the last 24h available and start the new tool. A new database should be opened with the newly produced statistics.
Yield Statistics AN 48
Application Note for Klippel QC System page 13
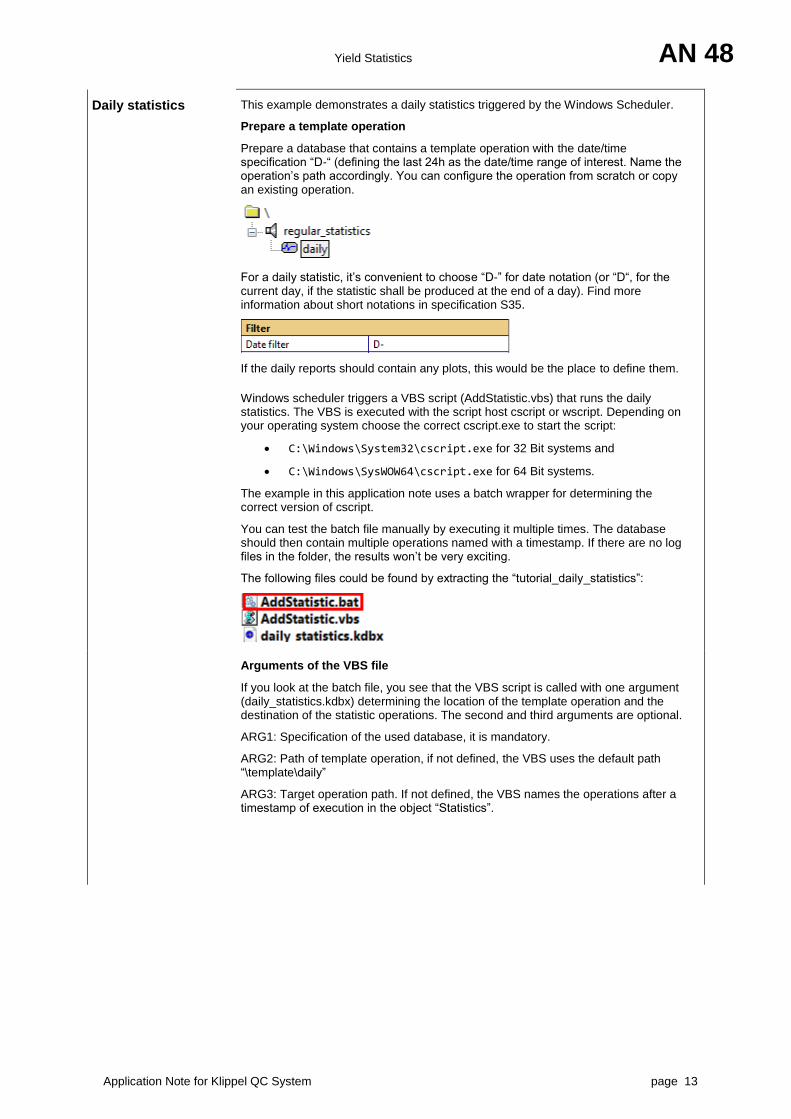
Daily statistics This example demonstrates a daily statistics triggered by the Windows Scheduler.
Prepare a template operation
Prepare a database that contains a template operation with the date/time specification “D-“ (defining the last 24h as the date/time range of interest. Name the operation’s path accordingly. You can configure the operation from scratch or copy an existing operation.
For a daily statistic, it’s convenient to choose “D-” for date notation (or “D“, for the current day, if the statistic shall be produced at the end of a day). Find more information about short notations in specification S35.
If the daily reports should contain any plots, this would be the place to define them.
Windows scheduler triggers a VBS script (AddStatistic.vbs) that runs the daily statistics. The VBS is executed with the script host cscript or wscript. Depending on your operating system choose the correct cscript.exe to start the script:
C:\Windows\System32\cscript.exe for 32 Bit systems and
C:\Windows\SysWOW64\cscript.exe for 64 Bit systems.
The example in this application note uses a batch wrapper for determining the correct version of cscript.
You can test the batch file manually by executing it multiple times. The database should then contain multiple operations named with a timestamp. If there are no log files in the folder, the results won’t be very exciting.
The following files could be found by extracting the “tutorial_daily_statistics”:
Arguments of the VBS file
If you look at the batch file, you see that the VBS script is called with one argument (daily_statistics.kdbx) determining the location of the template operation and the destination of the statistic operations. The second and third arguments are optional.
ARG1: Specification of the used database, it is mandatory.
ARG2: Path of template operation, if not defined, the VBS uses the default path “\template\daily”
ARG3: Target operation path. If not defined, the VBS names the operations after a timestamp of execution in the object “Statistics”.
Yield Statistics AN 48
Application Note for Klippel QC System page 14
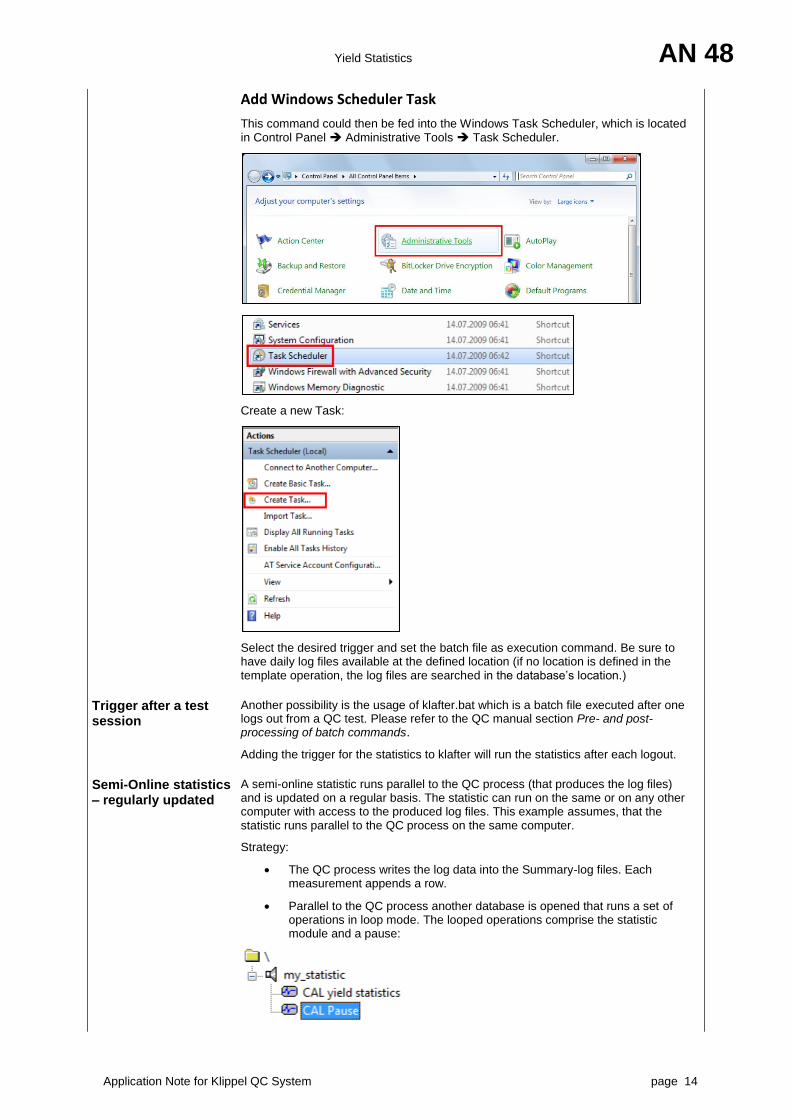
Add Windows Scheduler Task
This command could then be fed into the Windows Task Scheduler, which is located in Control Panel Administrative Tools Task Scheduler.
Create a new Task:
Select the desired trigger and set the batch file as execution command. Be sure to have daily log files available at the defined location (if no location is defined in the template operation, the log files are searched in the database’s location.)
Trigger after a test session
Another possibility is the usage of klafter.bat which is a batch file executed after one logs out from a QC test. Please refer to the QC manual section Pre- and post- processing of batch commands.
Adding the trigger for the statistics to klafter will run the statistics after each logout.
Semi-Online statistics – regularly updated
A semi-online statistic runs parallel to the QC process (that produces the log files) and is updated on a regular basis. The statistic can run on the same or on any other computer with access to the produced log files. This example assumes, that the statistic runs parallel to the QC process on the same computer.
Strategy:
The QC process writes the log data into the Summary-log files. Each measurement appends a row.
Parallel to the QC process another database is opened that runs a set of operations in loop mode. The looped operations comprise the statistic module and a pause:
Yield Statistics AN 48
Application Note for Klippel QC System page 15
Statistic operation
The statistic operation may be configured with all available parameters (explained in this application note). The example database comes with a statistic operation configuring Chart 1 as distribution plot of the measure Fs. Date and time is not restricted in the example.
Pause operation
The pause operation is used to display the statistic results for a certain amount of time before a new run of the statistic is performed. Additionally, the pause operation executes a batch file that organizes the Summary-Log files in order to optimize the performance for the yield statistic calculation.
Background
The QC system changes the Summary-Log files when adding a row for the results of every single measurement, but the YieldStatistics converts a Summary-Log file to binary format.
Before using the binary data files on subsequent runs, the YieldStatistics checks the consistency of the Summary-Log files and the corresponding binary file(s). If a file has changed, the binary data is discarded and the file is parsed again. If the consistency check reveals that the Summary-Log did not change, the binary data can be used without any parsing of the Log file.
The Pause operation copies the Summary log files to a separate location (Log_Archive). If the Summary-Log files reached a certain size, the file is moved to the separate location. The QC system creates a new file for the next measurement and the previous ones don’t change (hence the binary data may be used).
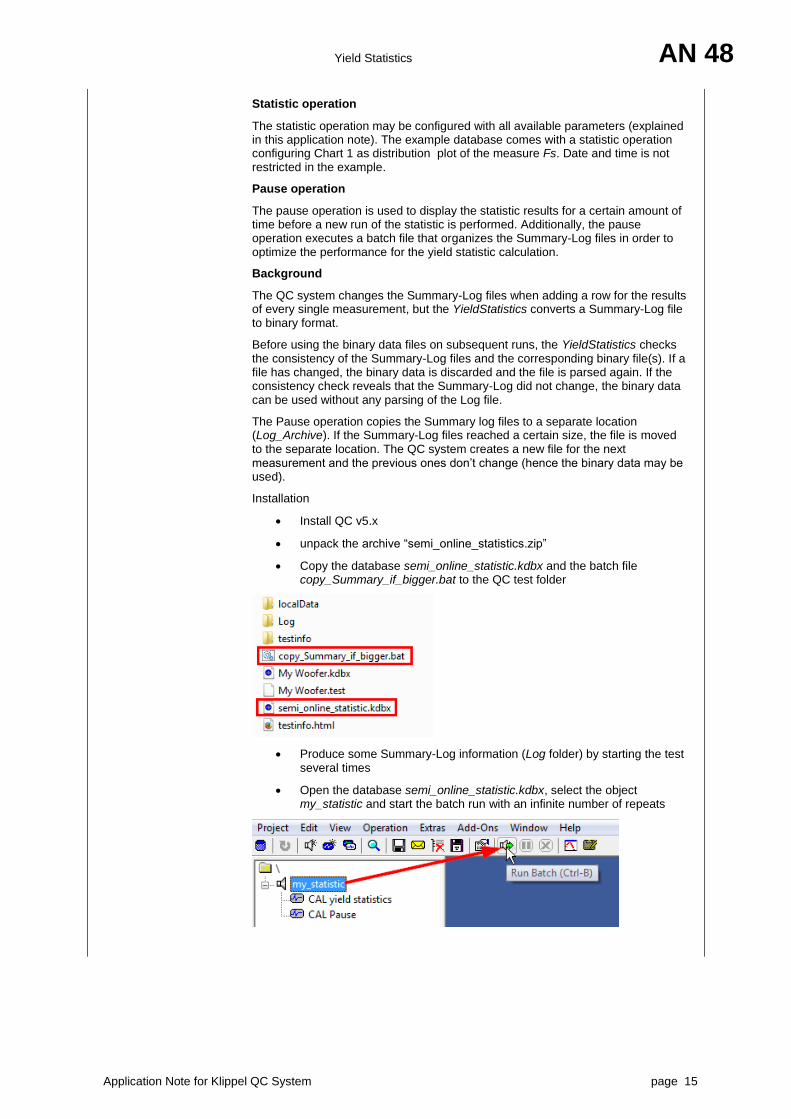
Installation
Install QC v5.x
unpack the archive “semi_online_statistics.zip”
Copy the database semi_online_statistic.kdbx and the batch file copy_Summary_if_bigger.bat to the QC test folder
Produce some Summary-Log information (Log folder) by starting the test several times
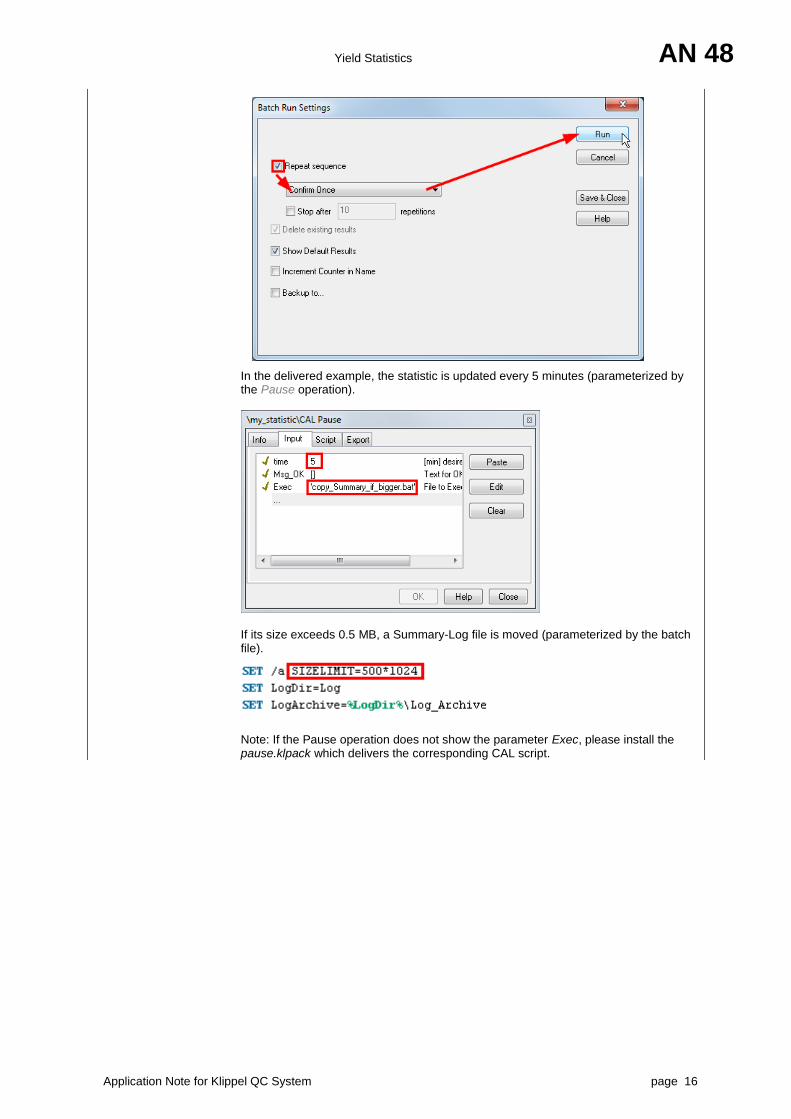
Open the database semi_online_statistic.kdbx, select the object my_statistic and start the batch run with an infinite number of repeats
Yield Statistics AN 48
Application Note for Klippel QC System page 16
In the delivered example, the statistic is updated every 5 minutes (parameterized by the Pause operation).
If its size exceeds 0.5 MB, a Summary-Log file is moved (parameterized by the batch file).
Note: If the Pause operation does not show the parameter Exec, please install the pause.klpack which delivers the corresponding CAL script.
Yield Statistics AN 48
Application Note for Klippel QC System page 17
More Applications
Single Test A comprehensive example for a single test is given in the example above.
You may also specify an alternative name for the analysis and overwrite the internally used test name.
Yield of multiple tests Basically all combinations of tests may be analyzed, as long as the summary log files (or the complete log folder) are grouped in one folder structure.
Note that the summary*.log files need to be copied / grouped only.
Yield of one production line
Simply specify the QC data root folder for the statistics. This will calculate the yield of the whole production on this computer.
Yield of factory Recursively copy all summary*.log files from all lines to one network drive.
Specify the top folder for the statistics. Note, that all summary*.log files may be located in one single folder (flat hierarchy).
Yield of operator Restricting data by operator allows counting tests and calculating the yield rate for one or more operators. Note that an operator that found many bad drivers (with lower yield rate) may be a better one than one with 100% yield (uncritical testing).
Yield of last week / month / quarter / year
Frequently requested analysis is a time restriction of an elapsed period of time. To avoid annoying change of setup, use the shortcut input for date / time using the “-“ postfix:
{H-, D-, W-, Q-, M-, Y-} will analyze the time span from NOW minus specified type of period.
Note that this is different from the last complete time span, such as last whole week from Monday till Sunday. For this mode use the number postfix (see below). Example: Y- will analyze all data within the elapsed year from NOW on.
Yield of specified week / month / quarter / year
A simple time restriction allows the analysis of numbered periods of time. To avoid entering long date specifications, use the shortcut input for date / time using the numbered postfix:
{H, D, W, Q, M, Y}{number} will analyze the data within the {number} occurrence of the time span.
Example: Y2011 will analyze all data within the year 2011.
Yield of Serial Number range
Simply specify a numerical range of serial numbers to analyze a special batch of production or use just a serial number prefix. This filter can be combined with all other restrictions.
Yield Statistics AN 48
Application Note for Klippel QC System page 18
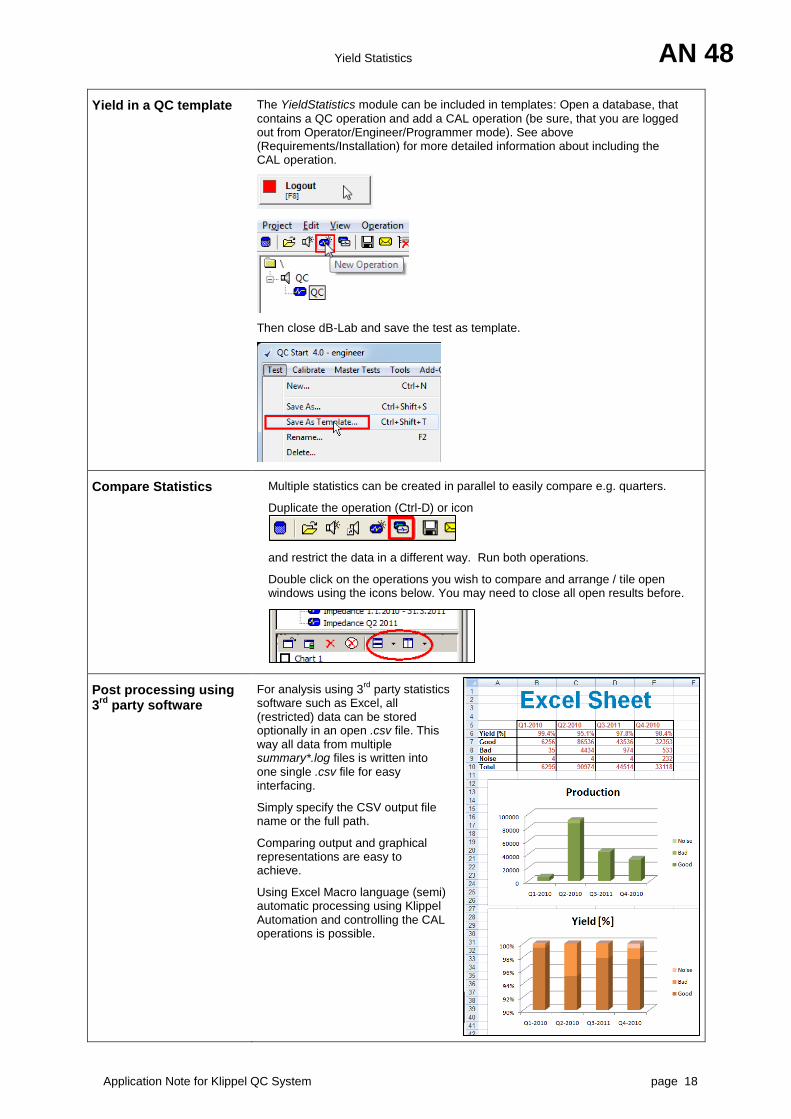
Yield in a QC template The YieldStatistics module can be included in templates: Open a database, that
contains a QC operation and add a CAL operation (be sure, that you are logged out from Operator/Engineer/Programmer mode). See above (Requirements/Installation) for more detailed information about including the CAL operation.
Then close dB-Lab and save the test as template.
Compare Statistics Multiple statistics can be created in parallel to easily compare e.g. quarters.
Duplicate the operation (Ctrl-D) or icon
and restrict the data in a different way. Run both operations.
Double click on the operations you wish to compare and arrange / tile open windows using the icons below. You may need to close all open results before.
Post processing using 3
rd party software
For analysis using 3rd
party statistics software such as Excel, all (restricted) data can be stored optionally in an open .csv file. This way all data from multiple summary*.log files is written into one single .csv file for easy interfacing.
Simply specify the CSV output file name or the full path.
Comparing output and graphical representations are easy to achieve.
Using Excel Macro language (semi) automatic processing using Klippel Automation and controlling the CAL operations is possible.
Yield Statistics AN 48
Application Note for Klippel QC System page 19
Reports All results can be exported into a nicely formatted html report. Company logo and
other additional information can be added. Such reports can be printed or stored as reference. Please refer to the manual “dB-Lab / dB-Lab Reference / The Report System” for more information.
Further reading
Automation Explore possibilities of the automation (example script at the end of the document)
Specification S12 Automation
Automated reports Explore possibilities to create automated reports out of the YieldStatistic module.


![[Friederike Klippel] Keep Talking Communicative F(BookFi.org)](https://static.documents.pub/doc/80x56/56d6bfe01a28ab3016980726/friederike-klippel-keep-talking-communicative-fbookfiorg.jpg)


