237
SAARC JOURNAL OF AGRICULTURE (SJA)
Volume 13, Issue 2, 2015
ISSN: 1682-8348 (Print), 2312-8038 (Online)
© SAC
The views expressed in this journal are those of the author(s) and do not
necessarily reflect those of SAC
Published by
SAARC Agriculture Centre (SAC) BARC Complex, Farmgate, Dhaka-1215, Bangladesh
Phone: 880-2-8141665, 8141140; Fax: 880-2-9124596
E-mail: [email protected], Website: http://www.banglajol.info/index.php/SJA/index
Editor in-Chief
Dr. Shaikh Mohammad Bokhtiar Director, SAARC Agriculture Centre
BARC Complex, Farmgate, Dhaka-1215, Bangladesh
Managing Editor
Dr. Muhammad Musa Senior Program Specialist, SAARC Agriculture Centre
BARC Complex, Farmgate, Dhaka-1215, Bangladesh
Associate Editor
Dr. Md. Nure Alam Siddiky
Senior Program Officer, SAARC Agriculture Centre
BARC Complex, Farmgate, Dhaka-1215, Bangladesh
Email: [email protected]
Printed at
Natundhara Printing Presss, 277/3, Elephant Road, Dhaka-1205, Bangladesh
Cell: 01711019691, 01911294855, E-mail: [email protected]
ISSN: 1682-8348 (Print), 2312-8038 (Online)
SAARC JOURNAL OF AGRICULTURE
VOLUME 13 ISSUE 2 DECEMBER 2015
SAARC Agriculture Centre www.sac.org.bd

EDITORIAL BOARD
Editor-in-Chief
Dr. Shaikh Mohammad Bokhtiar
Director, SAARC Agriculture Centre
BARC Complex, Farmgate, Dhaka-1215, Bangladesh
Managing Editor
Dr. Muhammad Musa Senior Program Specialist, SAARC Agriculture Centre
BARC Complex, Farmgate, Dhaka-1215, Bangladesh
Associate Editor
Dr. Md. Nure Alam Siddiky
Senior Program Officer, SAARC Agriculture Centre
BARC Complex, Farmgate, Dhaka-1215, Bangladesh
Email: [email protected]
Members
BANGLADESH:
Dr. M. A. Khaleque Mian
Professor
Department of Genetics and Plant Breeding
Bangabandhu Sheikh Mujibur Rahman
Agricultural University
Gazipur, Bangladesh
Dr. Md. Abdus Samad
Professor
Department of Veterinary Medicine
Bangladesh Agricultural University
Mymensingh-2202, Bangladesh
Dr. Khondker Shariful Islam
Professor
Department of Entomology
Bangladesh Agricultural University
Mymensingh-2202, Bangladesh
Dr. A. K. M Nowsad Alam
Professor
Fisheries Technology Department
Bangladesh Agricultural University
Mymensingh-2202, Bangladesh
BHUTAN:
Dr. Tayan Raj Gurung
Senior Program Specialist (Natural Resource
Management)
SAARC Agriculture Centre
BARC Complex, Farmgate
Dhaka-1215, Bangladesh
INDIA:
Dr. S. S. Raju
Principal Scientist (Agricultural Economics)
National Centre for Agricultural Economics
and Policy Research, New Delhi, India
Dr. D. K. Benbi
National Professor, Department of Soil Science
Punjab Agricultural University
Ludhiana- 141 004, Punjab, India
Dr. Monendra Grover
Senior Scientist (Plant Biotechnology)
Centre for Agricultural Bioinformatics
Indian Agricultural Statistics Research Institute
Pusa Campus, New Delhi- 110 012
India

Dr. K. Giridhar
Principal Scientist (Agronomy)
National Institute of Animal Nutrition and
Physiology
Adugodi, Bangalore- 560 030
Karnataka, India
NEPAL:
Dr. Bal Krishna Joshi
Scientist (Genetics and Plant Breeding)
National Agriculture Genetic Resources Centre
(Gene bank)
Nepal Agricultural Research Council
Kathmandu, Nepal
PAKISTAN:
Dr. Fayyaz-ul-Hassan
Professor
Department of Agronomy
Pir Mehr Ali Shah Arid Agriculture University
Rawalpindi, Pakistan
Dr. Anjum Munir
Director
Crop Diseases Research Institute
Department of Plant & Environmental
Protection
National Agricultural Research Centre
Islamabad, Pakistan
SRI LANKA:
Dr. H. H. D. Fonseka
Director
Horticultural Crop Research and
Development Institute
Department of Agriculture
Gannoruwa, Peradeniya 20400, Sri Lanka
Dr. Priyantha Weerasinghe
Senior Scientist (Soil Science)
Horticultural Crop Research and Development
Institute
Department of Agriculture
Gannoruwa, Peradeniya 20400, Sri Lanka
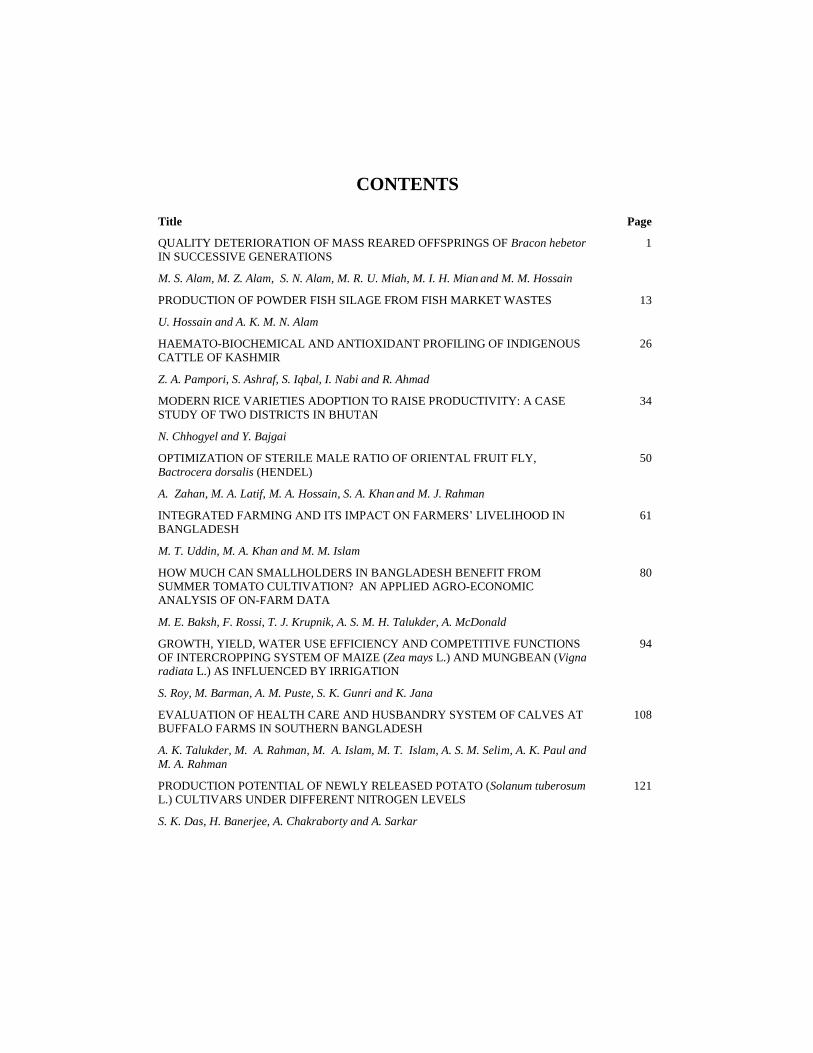
CONTENTS
Title Page
QUALITY DETERIORATION OF MASS REARED OFFSPRINGS OF Bracon hebetor
IN SUCCESSIVE GENERATIONS
M. S. Alam, M. Z. Alam, S. N. Alam, M. R. U. Miah, M. I. H. Mian and M. M. Hossain
1
PRODUCTION OF POWDER FISH SILAGE FROM FISH MARKET WASTES
U. Hossain and A. K. M. N. Alam
13
HAEMATO-BIOCHEMICAL AND ANTIOXIDANT PROFILING OF INDIGENOUS
CATTLE OF KASHMIR
Z. A. Pampori, S. Ashraf, S. Iqbal, I. Nabi and R. Ahmad
26
MODERN RICE VARIETIES ADOPTION TO RAISE PRODUCTIVITY: A CASE
STUDY OF TWO DISTRICTS IN BHUTAN
N. Chhogyel and Y. Bajgai
34
OPTIMIZATION OF STERILE MALE RATIO OF ORIENTAL FRUIT FLY,
Bactrocera dorsalis (HENDEL)
A. Zahan, M. A. Latif, M. A. Hossain, S. A. Khan and M. J. Rahman
50
INTEGRATED FARMING AND ITS IMPACT ON FARMERS’ LIVELIHOOD IN
BANGLADESH
M. T. Uddin, M. A. Khan and M. M. Islam
61
HOW MUCH CAN SMALLHOLDERS IN BANGLADESH BENEFIT FROM
SUMMER TOMATO CULTIVATION? AN APPLIED AGRO-ECONOMIC
ANALYSIS OF ON-FARM DATA
M. E. Baksh, F. Rossi, T. J. Krupnik, A. S. M. H. Talukder, A. McDonald
80
GROWTH, YIELD, WATER USE EFFICIENCY AND COMPETITIVE FUNCTIONS
OF INTERCROPPING SYSTEM OF MAIZE (Zea mays L.) AND MUNGBEAN (Vigna
radiata L.) AS INFLUENCED BY IRRIGATION
S. Roy, M. Barman, A. M. Puste, S. K. Gunri and K. Jana
94
EVALUATION OF HEALTH CARE AND HUSBANDRY SYSTEM OF CALVES AT
BUFFALO FARMS IN SOUTHERN BANGLADESH
A. K. Talukder, M. A. Rahman, M. A. Islam, M. T. Islam, A. S. M. Selim, A. K. Paul and
M. A. Rahman
108
PRODUCTION POTENTIAL OF NEWLY RELEASED POTATO (Solanum tuberosum
L.) CULTIVARS UNDER DIFFERENT NITROGEN LEVELS
S. K. Das, H. Banerjee, A. Chakraborty and A. Sarkar
121

Title Page
EFFECT OF INTEGRATED NUTRIENT MANAGEMENT IN BORO RICE
CULTIVATION
B. Roy, M. A. R. Sarkar and S. K. Paul
131
IMPACT OF NITROGEN NUTRITION ON PRODUCTIVITY AND NUTRIENT USE
EFFICIENCY OF POTATO (Solanum tuberosum L.) IN AN INCEPTISOL OF WEST
BENGAL, INDIA
H. Banerjee, K. Ray, S. Sarkar, A. M. Puste, M. Mozumder and L. Rana
141
DIETARY BLACK CUMIN (Nizella sativa) SEED MEAL ON GROWTH AND MEAT
YIELD PERFORMANCE OF BROILERS
M. S. Jahan, M. Khairunnesa, S. Afrin and M. S. Ali
151
EFFECT OF DEEP PLACEMENT OF NITROGEN FERTILIZERS ON RICE YIELD
AND N USE EFFICIENCY UNDER WATER REGIMES
S. Das, M. R. Islam, M. Sultana, H. Afroz and M. A. Hashem
161
SCREENING SUGARCANE SOMACLONES AND THEIR PARENT VARIETIES
AGAINST RED ROT (Colletotrichum falcatum) AND ASSESSMENT OF
VARIABILITY BY RAPD AND SSR MARKERS
Kuasha Mahmud, K. M. Nasiruddin, M. A Hossain and L. Hassan
172
SOIL FERTILITY AND PRODUCTIVITY OF SUGARCANE INFLUENCED BY
ENRICHED PRESSMUD COMPOST WITH CHEMICAL FERTILIZERS
S. M. Bokhtiar, S. Roksana and A. Z. M. Moslehuddin
183
GENETIC PARAMETERS OF TWO BC2F1 POPULATIONS FOR DEVELOPMENT
OF SUPERIOR MALE STERILE LINES PERTAINING TO MORPHO-FLORAL
TRAITS FOR AEROBIC RICE (Oryza sativa L.)
Raghavendra P and S. Hittalmani
198
INFLUENCE OF SEEDLING AGE ON CUCUMBER (Cucumis sativus L.)
PRODUCTION
G. Jellani, M. J. Atif, H. Ullah, M. Ali and M. Musa
214
Guidelines for Authors 222

SAARC J. Agri., 13(2):1-12 (2015)
QUALITY DETERIORATION OF MASS REARED
OFFSPRINGS OF Bracon hebetor IN SUCCESSIVE
GENERATIONS
M. S. Alam*1, M. Z. Alam,
2 S. N. Alam
3, M. R. U. Miah,
2
M. I. H. Mian 2 and M. M. Hossain
2
Entomology Division, Bangladesh Agricultural Research Institute, Gazipur, Bangladesh
ABSTRACT
A study was undertaken to determine the generation-wise parasitizing efficiency of mass reared Bracon hebetor on wax moth (Galleria mellonella). Two experiments were conducted to achieve the objectives. In the first experiment, the host larvae and parasitoid were released in the field micro plot during first generation and reared in the laboratory in subsequent generations. In another experiment, all generations were developed in the laboratory. In the first experiment, generation showed significant variation on sex ratio of adult progeny production. The male sex ratio increased with the range of 62.89 to 74.58% and female sex ratio declined ranging from 39 to 25% with the advancement of generations. The percent parasitization and adult progeny production was not influenced appreciably with the progress of generation. In the second experiment parasitization and adult progeny production did not vary significantly in successive generations. However there was a decreasing trend in parasitization from 95 to 55% by Bracon hebetor and adult progeny production by 47.5 to 15.5 adultsfemale
-110 larvae
-1 over
generation. The sex ratio of adult progeny was significantly influenced by inbreed generation in laboratory reared population. Female decrease in sex ratio from first to sixth generation was 39.25 to 16.88%.
Keywords: Bracon hebetor, inbreeding, quality, fitness
INTRODUCTION
Bracon hebetor Say (Hymenoptera: Braconidae) is an efficient gregarious
larval parasitoid of many lepidopteran storage and vegetable pests. Artificial release
* Corresponding author email: [email protected] 1 Vertebrate Pest Division, Bangladesh Agricultural Research Institute, Gazipur, Bangladesh 2 Bangabandhu Sheikh Mujibur Rahman Agricultural University, Gazipur, Bangladesh 3 Entomology Division, Bangladesh Agricultural Research Institute, Gazipur, Bangladesh
Received: 15.02.2015
2 S. M. Alam et al.
of this parasitoid has the ability to control many devastating pests like Leucinodes
orbonalis, Spodoptera sp., Helicoverpa armigera, Maruca vitrata, Corcyra
cephalonica etc (Thanavendan and Jeyarani, 2010; Nikim and Pawar, 1993; Amir-
Maafi and Chi, 2006). Genetic variation in Hymenoptera reduced genetic variability
due to the production of diploid males from fertilized eggs. At least two mechanisms
of sex determination occur among Hymenoptera. Whiting (1943) proposed single-
locus complementary sex determination (sl-CSD) based on his studies of Bracon sp.
Sex is determined by multiple alleles at a single locus, homozygosity leads to males
and heterozygosity to females. All Hymenoptera (over 200000 species of ants, bees
and wasps) are haplodiploid. Arrhenotoky is the most prevalent mode of
reproduction, i.e. males develop parthenogenetically from unfertilized haploid eggs
while females develop from fertilized diploid eggs (Cook, 1993; Cook and Crozier,
1995; Beukeboom et al., 2000 and Salin et al., 2004).
Complementary sex determination (CSD) is detected through inbreeding by
mother-son and brother-sister mating. Homozygous diploid males can arise through
inbreeding. Diploid male production can represent a significant load since diploid
males are usually sterile (Cook and Crozier, 1995; Henshaw et al., 2002) and often
non-viable (Petters and Mettus, 1980). Presence of diploid males is strongly
correlated with inbreeding and constitutes a genetic load for the population as it
results in a male biased sex-ratio {(females mated to diploid males, like unmated
females, produce only male offspring) Cook, 1993}.
Most studies on B. hebetor indicated that wasps produce a female-biased sex
ratio (Benson, 1973; Rotary and Gerling, 1973; Taylor, 1988; Strand and Godfray,
1989). Local mate competition is an important factor leading to female-biased sex
ratios in other species of gregarious parasitoids and is an obvious candidate to explain
the basis found in B. hebetor. However, in species with this type of sex determination
was found in B. hebetor, mating between sibling (mother-son and brother-sister
mating) leads to the production of diploid males and a substantial drop in fitness
(Galloway and Grant, 1989).
In North American B. hebetor, few diploid males survived to become adults
and of these around 90% were sterile (Whiting, 1925; Torvik, 1931). This sterility
was caused by an inability of most diploid sperm to penetrate the eggs (MacBride,
1946). Occasionally some sperm successfully fertilized an egg, but the resulting
triploid females were also sterile (Torvik, 1931). In B. hebetor, a much smaller
percentage (20-40%) of diploid males was sterile. Diploid males of Habrobracon
serinopae (Cherian) males did not have a higher mortality, but their fertility was
unknown (Petters & Mettus, 1980). Henter (2003) showed that an outbreeding
haplodiploid wasp Uscana semifumipennis (Hymenoptera: Trichogrammatidae)
suffers substantial inbreeding depression. Longevity was 38% shorter, fecundity was
32% lower, and sex ratio was 5% more male for experimentally inbred wasps when
compared to outbreed controls. Zhou et al. (2007) studied the three fitness traits (i.e.,

QUALITY OF Bracon hebetor OFFSPRING GENERATION AFTER GENERATION 3
development time, brood size and body size), as well as sex ratio, between
experimentally imposed inbred and outbred populations on Cotesia glomerata, a
gregarious parasitoid of diamond back moth. Results recorded by other investigator
show that one generation of full-sib mating in C. glomerata resulted a significantly
higher proportion of males (43%) compared to outbred control (29%), and the sex
ratio shifts are largely in agreement with sl-CSD (single locused complementary sex
determination) model (Petters and Mettus, 1980).
However, the parasitizing efficiency of mass reared parasitoid in the laboratory
may be decreased, so it is important to determine the generation wise parasitizing
efficiency of mass reared B. hebetor to maintain the quality of the laboratory
population for effective biological control program. Considering the above facts the
present study was undertaken
MATERIALS AND METHODS
The study was undertaken in the micro plot of brinjal field and in the
laboratory of Entomology Division, BARI, Gazipur during February 2011 to July
2011. Two experiments were conducted.
Parasitization of host larvae in the field and subsequently in the laboratory
Ten host larvae of wax moth, Galleria mellonella were released on the plant in
the caged micro plot (1.5 m x 1 m) of brinjal field. Three brinjal plants were grown in
each micro plot. The plants were then encircled with 32 mesh nylon net. Ten Bracon
hebetor adult (6 female and 4 male) were then released on the plant in the caged
micro plot. After 2-3 days the parasitized larvae were collected from the field and
kept in the petridishes. The numbers of parasitoid adults were recorded and kept in
test tube (10 cm x 2 cm) containing honey solution. The successive generations (up to
7 generations) were continued in the laboratory. Ten last instars (5-6 instar) wax
moth, Galleria mellonella L. larvae were released in a plastic jar (1000 ml) having a
corrugated paper sheet. The full-fed larvae took position on the corrugated paper
sheet for pupation. Two B. hebetor adults (1 male and 1 female) emerged from field
collected paralyzed G. mellonella were released in the plastic jar with honey solution
on the cotton ball for their food. The mouth of the plastic jar was closed with black
cloth. The plastic jars with wax moth larvae and B. hebetor were kept on a rack in the
laboratory for 8-10 days for parasitization, egg laying, pupation and emergence of
adult B. hebetor. The experiment was conducted four times. Data on generation-wise
parasitization, total adults emergence per female and sex ratio were recorded
carefully.
Parasitization of host larvae in the laboratory
Ten last instars (5-6 instar) wax moth, Galleria mellonella L. larvae were
released in a plastic jar (1000 ml) having a corrugated paper sheet inside. The full-fed
larvae took position on the corrugated paper sheet within the plastic jar for pupation.

4 S. M. Alam et al.
One pair laboratory reared adults of B. hebetor (1 male and 1 female) were released
in the plastic jar having honey solution soaked in cotton ball for their food. The
mouth of the jar was closed with black cloth. The jar containing wax moth larvae and
B. hebetor were placed on a rack in the laboratory for 8-10 days for parasitization,
egg laying, pupation and adult emergence of parasitoid. The experiment was
continued for successive 6 generations. Data on generation-wise parasitization, total
adults per female and sex ratio were recorded.
Data analysis
Data on parasitism, offspring production and sex ratio were analyzed
statistically using one-way analysis of variance (ANOVA) following SPSS 16
software and means were compared following Tukey,s Honestly Significant Different
Test. The percent data were transformed to arcsine before analysis. Relationship of
percent parasitization, adult progeny production and sex ratio with generation were
measured by regression analysis.
RESULTS
In the first experiment; percent parasitization by B. hebetor at first generation
collected from the caged micro plot on the host (G. mellonella) larvae did not vary
significantly with the progress of generations (Figure 1). However, parasitization
efficiency was more or less similar up to 5th generation (80%) and decreased sharply
from 6th generation showing the lowest parasitization at 6th generations. Similarly
progeny production was not varied significantly with generations (Figure 2). The
total adult progeny production was maximum at generation 5th (54 adult female
-1 10
larvae-1
) generation followed by 4th
(47.25 adults female-1
10 larvae-1
), 1st (39.75
adults female-1
10 larvae-1
) and 7th (38.75 adults female
-1 10 larvae
-1) generations. The
lowest adult progeny production was recorded in generation 6th (30.25 adults female
-1
10 larvae-1
) (Figure 2).
Generation showed considerable influence of sex ratio of adult progeny
production. The proportion of male increased gradually with the advancement of
generation. On the other hand a decreasing trend was observed in female sex ratio
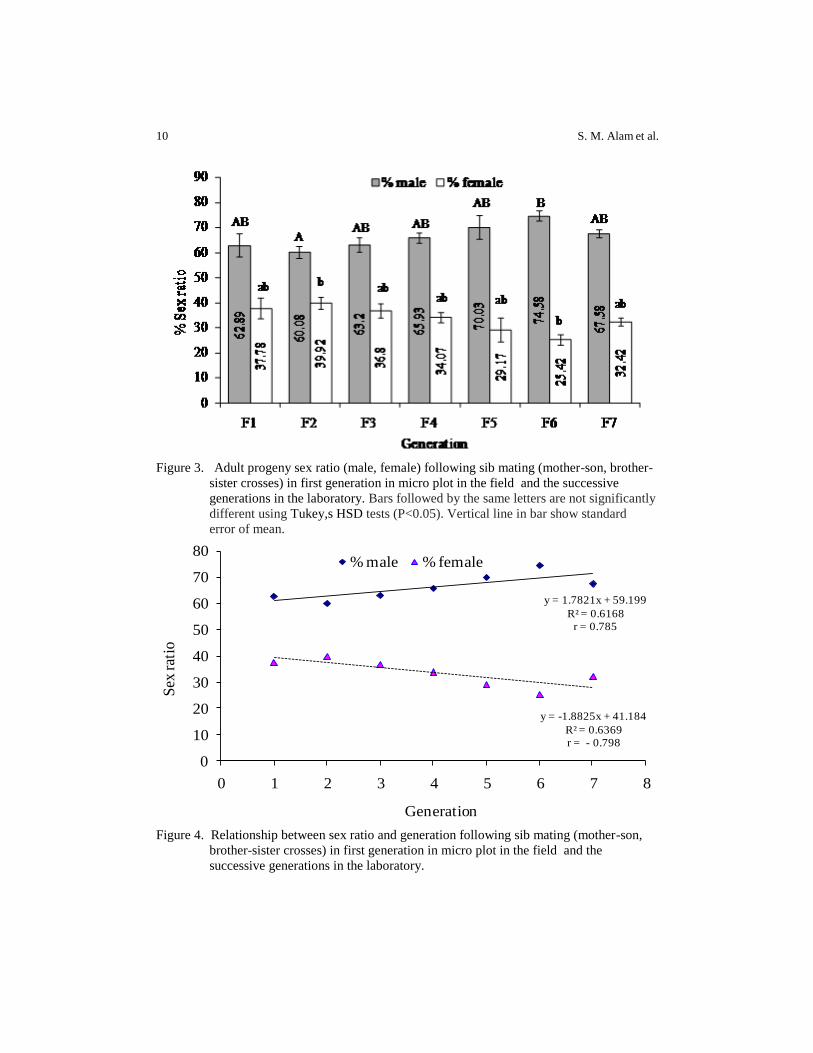
with advancement of generation within the range of 39 to 25% (Figure 3). The
relationship of male sex ratio (r = 0.785) was positive and female sex ratio (r = -
0.798) was negative with generations (Figure 4).
In the second experiment; generation wise parasitization by B. hebetor reared
in laboratory ranged between 55 to 95%. Significantly highest percent parasitization
was recorded from first generation (95%) followed by third (80%) and fourth (72%)
generations. The lowest parasitization was found in sixth generation (55%) followed
by fifth and second generations. Difference in parasitization at second, third and
fourth generations were not significant. Similarly, the parasitization at third, fourth
and fifth generation was statistically similar. The parasitization decreased with the
progress of generation. Their relationship was linear, negative significant (r = –

QUALITY OF Bracon hebetor OFFSPRING GENERATION AFTER GENERATION 5
0.841). The R2 values (0.712) indicate that influence of generation on the variation of
parasitization is 71.20% (Figure 5).
Total adult progeny production ranged 15.5-47.5 female-1
from firs to sixth
generations. The trend in total adult progeny production was more or less similar to
parasitism by B. hebetor. The first generation produced 47.50 adult female-1
10
larvae-1
, which was statistically similar to 2nd (42.25 adults female-1
10 larvae-1
) and
3rd (32.75 adults female-1
10 larvae-1
) generations. The lowest adult progeny (15.5
adults female-1
10 larvae-1
) recorded at 6th generation, which was statistically similar
to 4th and 5th generations. The relationship between total adult progeny production (r
= – 0.96) and generation was linear, negative and significant (Figure 6).
Prevalence of male and female at first (F1) to sixth generation (F6) ranged
from 67.75-83.12 and 16.88-39.25% among adult progeny produced per 10 host
larvae, respectively. The highest and lowest percentages of male and lowest and
highest percentage of female were recorded from F6 and F1, respectively. However,
the percentage of male was higher compared to male at every generation. Regression
analysis showed that relationship of male population (r = 0.976) was positively and
that of female was negatively correlated (r = – 0.97) with sib mating generation
(Figure 7).
DISCUSSIONS
Results of the present study revealed that population of male increased and that
of female decreased gradually and considerably with the progress of generations of
Bracon hebetor. At each generation, prevalence of male was considerably higher than
that of female. Similar results have been reported by many other investigators. Henter
(2003) studied the inbreeding depression in solitary parasitoid tricogrammatids wasp,
Uscana semifumipennis, which suffers it substantially. Longevity was 38% shorter,
fecundity was 32 % lower and sex ratio was 5% more male for experimentally inbred
wasp when compared to outbreed control. In another study, inbreeding lead to an
increase in the proportion of male offspring due to the production of diploid sons.
This study was done on a gregarious parasitoid, Cotesia glomerata by comparing
three fitness traits (i.e., development time, brood size and body size, as well as sex
ratio) between inbred and outbreed population (Henter, 2003).
Results showed that one generation of full sib mating in C. glomerata resulted
in a significantly higher proportion of male (43%) compared with outbreed control
(29%) and sex ratio shifts are largely in agreement with sl-CSD model. When inbred
level increased over four generation brood sex ratios become male-biased (70%)
(Zhou et al., 2007). Sibling mating increases the production of males, leading to the
male-biased sex ratio of broods in the laboratory which was responsible for sl-CSD
mechanism (Zhou et al., 2006). Braconid wasp Bracon hebetor; a gregarious
parasitoid in which sl-CSD was first described by whiting (1943). In single-locus sex
determination (sl-CSD), the sex of an individual is determined by alleles at a single

6 S. M. Alam et al.
sex locus. Diploid individuals that are heterozygous at the sex locus develop into
females, individuals that are hemizygous or homozygous at the sex locus become
males (Whiting, 1943). Since in most cases diploid males are inviable or sterile, their
production imposes a genetic load on the population. sl-CSD is considered to be
incompatible with inbreeding as it will enhance the chance of homozygosity at the
sex determination locus, and thus lead to the increased production of diploid males
(Bruckner, 1978; Cook and Crozier, 1995). The production of diploid males under
inbreeding has been suggested to be partly responsible for the failures in biological
control with Ichneumonidae and Braconidae species (Stouthamer et al., 1992).
Single-locus sex determination substantially influences the sex ratio and the
population growth of parasitoid species. Both factors affect the biological control
potential of parasitoids. Clearly, single-locus sex determination has the potential to
impede biological control severely if appropriate precautions are not taken (Cook,
1993; Zhou and Dorn, 2007; Heimpel and de Boer, 2008; Elias et al., 2010).
Southamer et al. (1992) suggested two approaches to maximize the diversity of
different sex alleles during laboratory propagation and mass rearing: (1) the wasps
can be maintained as one large population, or (2) they can be kept as a large number
of isolated subpopulations. The first approach reduces the rate at which alleles are
lost. The second approach results in many alleles being lost in each subpopulation,
but at least two sex alleles are retained.
CONCLUSION
There was a decreasing trend in parasitization from 95 to 55% by B. hebetor
and adult progeny production by 47.5 to 15.5 adultsfemale-1
10 larvae-1
over
generation in laboratory reared population. The sex ratio of adult progeny had been
significantly influenced by inbreed generation in laboratory reared population.
Female decrease in sex ratio from first to sixth generation was 39.25 to 16.88%.
ACKNOWLEDGEMENTS
This is a part of Ph. D work. This work has been financially supported by the
Bangladesh Agricultural Research Institute strengthening fund phase-2, Ministry of
Agriculture, The Government of the Peoples Republic of Bangladesh. The author is
grateful to financial authority.
REFERENCES
Amir-Maafi, M and Chi, H. 2006. Demography of Habrobracon hebetor (Hymenoptera:
Braconidae) on Two Pyralid Hosts (Lepidoptera: Pyralidae). Annals Entomological
Society of America, 99(1): 84-90
Benson, J. F. 1973. Intraspecific competition in the population dynamics of Bracon hebetor
Say. Journal of Animal Ecology, 42:193-197

QUALITY OF Bracon hebetor OFFSPRING GENERATION AFTER GENERATION 7
Beukeboom, L. W., Ellers, J. and Van Alphen, J. J. M. 2000. Absence of single locus
complementary sex determination in the braconid wasps Asobara tabida and Alysia
manducator. Heredity, 84: 29–36
Bruckner, D. 1978. Why are there inbreeding effects in haplodiploid system? Evolution, 32:
456–458
Cook, J. M. and Crozier. R. H. 1995. Sex determination and population biology in the
Hymenoptera. Trends Ecological Evolution, 10: 281-286
Cook, J. M. 1993. Sex determination in the Hymenoptera: A review of models and evidence.
Heredity, 71: 421-435
Elias, J., Dorn, S., Mazzi, D. 2010b. Inbreeding in a natural population of the gregarious
parasitoid wasp Cotesia glomerata. Molecular Ecology, 19: 2336–2345
Galloway, K. S., Grant, B. 1989. Reverse sex ratio adjustment in an apparently outbreeding
wasp, Bracon hebetor. Evolution, 43: 465-468
Heimpel, G. E., de Boer, J. G. 2008. Sex Determination in the Hymenoptera. Annual Review
of Entomology, 53:209–230
Henshaw, M. T, Queller, D. C. and Strassmann, J. E. 2002. Control of male production in the
swarm-founding wasp, Polybioides tabidus. Journal of Evolution Biology, 15: 262-268
Henter, H. J. 2003. Inbreeding depression and haplodiploidy: experimental measures in a
parasitoid and comparisons across diploid and haploid insect taxa. Evolution, 57(8):
1793–1803
MacBride, D. H. 1946. Failure of sperm of Habrobracon diploid males to penetrate the eggs.
Genetics, 31: 224
Nikim, P. K. and Powar, C. V. 1993. Life tables and intrinsic rate of natural increase of
Bracon hebetor (Say)(Hymenoptera: Braconidae) population on Corcyra cephalonica
(Staint)(Lepidoptera: Pyralidae), a key parasitoid of Helicoverpa armigera (hubner)
(Lepidoptera: Noctuidae). Journal of Applied Entomology, 115(2): 210-213
Petters, R. M. and Mettus, R. V. 1980. Decreased diploid male viability in the parasitic
wasp, Bracon hebetor. Journal of Heredity, 71:353-356
Rotary, N. and Gerling, D. 1973. The influence of some external factors upon the sex ratio of
Bracon hebetor Say (Hymenoptera: Braconidae). Environmental Entomology, 2: 134-
138
Salin. C., Deprez, B., Van Bockstaele, D. R., Mahillon, J., Hance, T. 2004. Sex determination
mechanism in the hymenopteran parasitoid Aphidius rhopalosiphi De Stefani-Peres
(Braconidae : Aphidiinae). Belgium Journal of Zoology, 134 (2/1): 15-21
Stouthamer, R., Luck, R. F. and Werren, J. H. 1992. Genetics of sex determination and the
improvement of biological control using parasitoids. Environmental Entomology, 21:
427–435
Strand, M. R. and Godfray, H. C. J. 1989. Superparasitism and ovicide in parasitic
Hymenoptera: theory and a case study of the ectoparasitoid Bracon hebetor. Behavior
of Ecological Sociobiology, 24: 421-432

8 S. M. Alam et al.
Taylor, A. D. 1988. Host effects on larval competition in the gregarious parasitoid Bracon
hebetor. Journal of Animal Ecology, 57: 163-172
Thanavendan, G. and Jeyarani, S. 2010. Effect of different temperature regimes on the
biology of Bracon brevicornis Wesmael (Braconidae: Hymenoptera) on different host
larvae. Journal of Bio-pesticide, 3(2): 441-444
Torvik, M. M. 1931. Genetic evidence for diploid is in of biparental males in Habrobracon.
Biological Bulletin, 61: 139-156
Whiting, A. R. 1925. The inheritance of sterility and of other defects induced by abnormal
fertilization in the parasitic wasp, Habrobracon juglandis. Genetics, 10: 33-58
Whiting, P. W. 1943. Multiple alleles complementary sex determination of Habrobracon.
Genetics, 28: 365-382
Zhou, Y., Gu, H. and Dorn, S. 2007. Effects of inbreeding on fitness components of Cotesia
glomerata, a parasitoid wasp with single-locus complementary sex determination (sl-
CSD). Biological Control, 40:273–279
Zhou, Y., Gu, H. and Dorn, S. 2006. Single-locus sex determination in the parasitoid wasp
Cotesia glomerata (Hymenoptera: Braconidae). Heredity, 96: 487–492

QUALITY OF Bracon hebetor OFFSPRING GENERATION AFTER GENERATION 9
0
20
40
60
80
100
F1 F2 F3 F4 F5 F6 F7
% P
aras
itiz
atio
n (
mea
n ±
SE
)
Generation
Figure 1. Generation wise mean parasirism (%) by Bracon hebetor in first generation
parasitism in the caged micro plot in the field and the successive generations in the
laboratory. Vertical line in line graph show standard error of mean.
0
10
20
30
40
50
60
F1 F2 F3 F4 F5 F6 F7
To
tal ad
ult
s fe
mal
e-1 1
0 lar
vae
-1
Generation
Figure 2. Generation wise mean number of offspring per female of Bracon hebetor in first
generation in micro plot in the field and the successive generations in the
laboratory. Vertical line in line graph show standard error of mean.
10 S. M. Alam et al.
Figure 3. Adult progeny sex ratio (male, female) following sib mating (mother-son, brother-
sister crosses) in first generation in micro plot in the field and the successive
generations in the laboratory. Bars followed by the same letters are not significantly
different using Tukey,s HSD tests (P<0.05). Vertical line in bar show standard
error of mean.
y = 1.7821x + 59.199
R² = 0.6168
r = 0.785
y = -1.8825x + 41.184
R² = 0.6369
r = - 0.798
0
10
20
30
40
50
60
70
80
0 1 2 3 4 5 6 7 8
Sex
rat
io
Generation
% male % female
Figure 4. Relationship between sex ratio and generation following sib mating (mother-son,
brother-sister crosses) in first generation in micro plot in the field and the
successive generations in the laboratory.

QUALITY OF Bracon hebetor OFFSPRING GENERATION AFTER GENERATION 11
y = 96.54e-0.08xR² = 0.712
r = - 0.844
0
20
40
60
80
100
120
F1 F2 F3 F4 F5 F6
% p
aras
itiz
atio
n
Generation
b
ab ab abab
a
Figure 5. Generation wise mean parasirism by Bracon hebetor due to sib mating (mother-son,
brother-sister crosses) through sixth generations in the first and successive
generationcare in laboratory. Line followed by the same letters are not significantly
different using Tukey,s HSD tests (P<0.05). Vertical line in line graph show
standard error of mean.
Figure 6. Generation wise total number of adult progeny Bracon hebetor produced per female
Bracon hebetor following sib mating (mother-son, brother-sister crosses) from first
to sixth generations in the laboratory. Line followed by the same letters are not
significantly different using Tukey,s HSD tests (P<0.05). Vertical line in line graph
show standard error of mean.

12 S. M. Alam et al.
60
.75
67
.24
70
.42
73
.44
74
.95
83
.12
39
.25
32
.77
29
.59
24
.06
25
.05
16
.88
y = 3.9429x + 57.853
R² = 0.9532
r = 0.976
y = -4.0154x + 41.987
R² = 0.9415
r = - 0.97
0
20
40
60
80
100
F1 F2 F3 F4 F5 F6
% S
ex r
atio
Generation
% male % female Linear (% male) Linear (% female)
B
B AB ABAB
A
b
aab
ab ab
a
Figure 7. Male and female percentages of adult progeny of Bracon hebetor after sib mating
(mother-son, brother-sister crosses) from first to sixth generations in laboratory.
Bars followed by the same letters are not significantly different using Tukey,s HSD
tests (P<0.05). Vertical line in bar show standard error of mean.
SAARC J. Agri., 13(2):13-25 (2015)
PRODUCTION OF POWDER FISH SILAGE FROM
FISH MARKET WASTES
U. Hossain*1
and A. K. M. N. Alam2
Department of Fisheries Technology, Bangladesh Agricultural University, Mymensingh-2202
ABSTRACT
This study was undertaken to investigate the suitability of using fish market wastes (viscera) as raw material for powder fish silage production. Fish viscera contained 14.01±0.68% protein, 20.00±1.04% lipid, 4.75±0.64% ash, 60.62±2.15% moisture and 0.62±0.08% Nitrogen Free Extract (NFE). The pH of fish viscera was 6.21±0.07. For liquid fish silage production, 2, 3, 4 and 5% formic acid were added in blended viscera, of which 4% formic acid was found better that had a pH value of 3.77±0.07. Liquid silage contained 12.00±0.89% protein, 17.26±1.49% lipid, 3.73±0.81% ash, 66.41±3.07% moisture and 0.60±0.09% NFE. For neutralizing liquid fish silage, various concentrations, viz. 1, 2, 3, 4, 5 and 6% Na2CO3 were added. The pH value (6.32±0.01) was better when mixing with 4% Na2CO3. To produce powder fish silage 20, 30, 40 and 50% rice bran were mixed in liquid fish silage. Powder silage made with 30% rice bran was found better to improve the nutritional quality of the product that contained 20.84±0.12% protein, 33.73±0.14% lipid, 14.05±0.27% ash, 10.83±0.19% moisture, 6.61±0.10% crude fiber and 13.94% carbohydrate. The pH value was 6.54±0.01. After preparation, powder fish silage was packaged. The packaged powder fish silage was then stored for 4 months at room temperature (20-30
0C). After four
months of storage, the contents of protein, lipid, ash, moisture, crude fiber, carbohydrate and pH reached at 20.30±0.13, 32.41±0.16, 13.49±0.33, 10.98±0.28, 6.32±0.07, 16.50% and 6.76±0.09, respectively. It was found that nutritional value of powder fish silage was very high and can be used in fish feed to reduce feed cost and enhance aquaculture production.
Keywords: Fish market wastes, powder fish silage preparation, quality
of fish feed, room temperature storage.
* Corresponding author email: [email protected] 1 MS fellow, Department of Fisheries Technology, Bangladesh Agricultural University, Mymensingh 2202,
Bangladesh 2 Professor of Fish Processing & Quality Control, Department of Fisheries Technology, Bangladesh Agricultural
University, Mymensingh 2202, Bangladesh
Received: 18.02.2015
14 U. Hossain and A. K. M. N. Alam
INTRODUCTION
Fish market wastes (viscera, fin, skin and flesh) contain high amount of
protein, lipid and minerals. There is a need for developing methods for use of these
valuable wastes into human food or animal feed to reduce aqua-production costs and
increase benefit. Considering the easy method involved and low-cost inputs required,
fish wastes can be advantageously upgraded into powder fish silage. Fish silage is a
liquid product produced from the whole fish or parts of it, to which acids, enzymes or
lactic acid-producing bacteria are added, with the liquefaction of the mass provoked
by the action of enzymes from the fish (FAO, 2003). Liquid silage can be dried with
rice bran to prepare powder silage. Powder fish silage can be vitally used as a feed
supplement in aquaculture to convert nutrients into flesh. Inclusion of fish silage in
fish diets increased body weight gain, total body length and specific growth rate
without any adverse effects on survival and water quality (Enke et al., 2009). About
12% of the total fish weight is viscera i.e. 3,00,000-4,00,000 metric tons of viscera
can be obtained every year from the fish produced in Bangladesh. By using these
viscera, it is possible to produce 2,00,000 metric tons powder fish silage, market
value of which is about 5,000 million taka @ 25 taka per kg. Thus, it is possible to
reduce the pressure of fish meal in fish feed by converting wastes into powder fish
silage. In this experiment, a noble approach is proposed to produce good quality of
powder silage with increased nutritional value and long shelf life.
METHODOLOGY
Duration of the study, period and place
The study was conducted for a period of 1 year from May 2013 to May 2014,
in the Fish Processing Laboratory of the Department of Fisheries Technology of
Bangladesh Agricultural University, Mymensingh, Bangladesh.
Preparation of powder fish silage
Fish wastes (mixed viscera of rui, catla, mrigal, tilapia and pangas) collected
from fish markets were blended with an electric blender. Immediately after blending,
different concentration of formic acid (2, 3, 4 and 5%) were added. The mixture was
stirred to mix acid can mix properly and then kept for several days (5, 4, 3 and 2 days
with 2, 3, 4 and 5% formic acid respectively) at room temperature (25-30°C) for
complete liquefaction. Now various concentrations of Na2CO3 (1, 2, 3, 4, 5 and 6%)
were added to the liquid neutralize the pH at 6.0-7.0. Thus the liquid silage was
prepared where rice bran at different compositions (20, 30, 40, and 50%) was mixed.
The mixture was dried under the sun for two days. Dried product was ground in an
ordinary flour mill and dried by an electric oven at 350C for few hours so that the

PRODUCTION OF POWDER FISH SILAGE 15
moisture content was adjusted to 10-12%. Powder silage thus prepared was packaged
in air-tight polythene packets with packet sealing machine. Packets were clearly
labeled according to existing regulations and with a sell-by or consume-by date.
Packets were stored in clean and dry plastic container at room temperature for a year
but shelf life of the product was rigorously monitored for 4 months.
Analytical procedures
Analysis of crude protein, lipid, ash, moisture, crude fiber and carbohydrate
were carried out according to AOAC (2000) methods with slight modifications while
NFE was measured by substracting the sum of total protein, lipid, ash, moisture and
crude fiber from 100. The pH was measured by using a microprocessor pH meter.
Data analysis
The data obtained were analyzed and graphically presented by MS Excel 2007.
RESULTS AND DISCUSSION
Proximate composition of silage and its ingredients
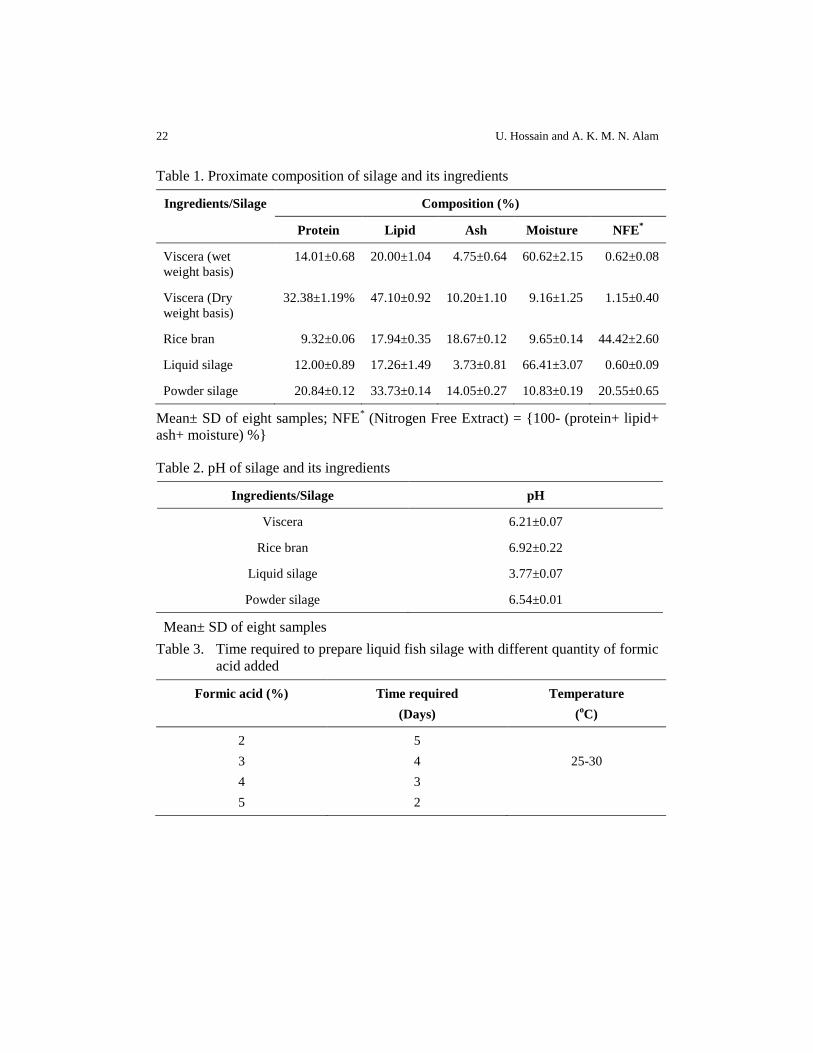
Fish viscera contained 14.01±0.68% protein, 20.00±1.04% lipid, 4.75±0.64
ash, 60.62±2.15% moisture (Table 1). The value of protein obtained in the present
study was in consistent with Bechtel (2003), who obtained 13.0-15.3% protein in fish
viscera. Similar result was also given by Mahboob and Sheri (1998), Mesa and Magie
(2004), Ahmad et al. (2012), Taheri et al. (2013) and Permata et al. (2014). The value
of lipid obtained was in consistent with Bechtel (2003), who obtained an average of
19.1% lipid in fish viscera. The value of ash obtained in the present study was in
consistent with that of Mahboob and Sheri (1998), who obtained 3.96-6.95% ash in
viscera of Indian major carps. The moisture data was in consistent with Bhaskar and
Mahendrakar (2007), who obtained 58.6% moisture in viscera of Indian major carp
Catla catla. In another study conducted by Mahboob and Sheri (1998), it was found
that Indian major carp viscera contained 65.24-81.17% moisture, which also supports
the present result. Moisture data indicated that 39.38% dry matter was present in fish
viscera. Similar result was given by Rahmi et al. (2008), who obtained 39.40% dry
matter in fish viscera.
Dry viscera contained an average of 32.38±1.19% protein, 47.10±0.92% lipid,
10.20±1.10% ash, 9.16±1.25% moisture and 1.15±0.40% Nitrogen Free Extract
(NFE) (Table 1). Almost similar results were given by Folador et al. (2006).
Rice bran contained an average of 9.32±0.06% protein, 17.94±0.35% lipid,
18.67±0.12% ash, 9.65±0.14% moisture and 44.42% NFE (Table 1). The value of
protein in rice bran obtained in the present study was in consistent with Okai et al.
(2003), who obtained 5.23-9.74% protein in rice bran. Similar result was obtained by
Rashid et al. (2013). The value of ash obtained in the present study was in agreement
with Mahmud et al. (2012), who obtained 14.79 to 18.84 % ash in rice bran. Similar
16 U. Hossain and A. K. M. N. Alam
result was also given by Cicero and Derosa (2005). The value of NFE content
obtained in rice bran was in consistent with Okai et al. (2003), who found 44.07 and
47.01% NFE in rice bran obtained from medium and long grain respectively. Similar
results were also given by Rosniyana et al. (2009).
Liquid silage contained an average of 12.00±0.89% protein, 17.26±1.49%
lipid, 3.73±0.81% ash and 66.41±3.07% moisture (Table 1). The value of protein
obtained in the present study was in consistent with Rahmi et al. (2008) and Abowei
and Tawari (2011). The values of ash obtained in the present study were in consistent
with Abowei and Tawari (2011). The values of moisture obtained in the present study
were also in consistent with Rahmi et al. (2008).
The nutrient contents of liquid silage were similar to raw viscera. There were
slight decrease in protein, lipid, ash and NFE contents in liquid silage than viscera,
might be due to breakdown of nutrient components during hydrolysis. This can also
be attributed to the low pH, which enhanced the action of fish digestive and muscle
enzymes on fish nutrients. Whereas, the moisture content of liquid silage is slightly
higher than viscera. It might be due to liquefaction of viscera during silage
preparation.
It was found that the powder fish silage has a good nutritive value. It was
fortified with protein, lipid, ash, crude fiber and carbohydrate contents. The protein,
lipid, ash, moisture, crude fiber and carbohydrate contents of powder silage were
20.84±0.12, 33.73±0.14, 14.05±0.27, 10.83±0.19, 6.61±0.10 and 13.94%,
respectively (Table 1). The quantity of protein obtained would be suitable for the
growth of fish and other aquatic animals. The values of lipid were slightly higher but
if De-oiled Rice Bran was used, then lipid content will be reduced. It was, however,
expected that it would not be harmful for animals as major portion of fish lipid
consist of unsaturated fatty acid. The ash content would be very suitable to fulfill the
mineral requirements of fish and other animals. The moisture data said that there
would be no chance of mold attack in the feed prepared from silage and the product
may be kept stable at room temperature for long time. The NFE was not very high
but within the suitable range for growing fish and other animals.
pH of silage and its ingredients
The pH of fresh fish viscera was found to be 6.21±0.07 (Table 2). The value of
pH obtained in the present study was in consistent with Bhaskar and Mahendrakar
(2007), who found a pH value of 6.18 in viscera of Indian major carp Catla catla.
The pH of rice bran was nearly neutral. The pH values of liquid silage made with 4%
formic acid was 3.77±0.07. The pH obtained was, although, most suitable for silage
production but a lower dry matter (33.59 g/100 g) was obtained. When pH of fish
silage was increased, the dry matter content was also increased. The highest dry
matter content obtained was 39.38 g/100 g of original viscera sample, which occurred
when the pH was at 6.21±0.07. A further disadvantage of higher pH is the rapid
microbial spoilage (Oulavallickal, 2010). Most of the bacteria are neutrophiles, with

PRODUCTION OF POWDER FISH SILAGE 17
an optimal growing pH between 5.5 and 8.0 whereas most fungi prefer a pH range
between 4 and 6. After excluding samples kept at the higher pH on grounds that they
may not be microbiologically safe or stable, the values for dry matter content
indicated that processing at pH 3.5 or pH 4 would to be satisfactory because these
samples had the higher solid content. These findings also supported the idea that
appropriate pH for making fish silage should be 3.5-4.0, as also obtained by
Oulavallickal (2010). The pH value of powder silage (6.54±0.01) was found to be
nearly neutral. So, it would not affect the ingestion rate of the feed (Mousavi et al.,
2013).
Effect of formic acid content on silage preparation
Time required to prepare fish silage from viscera depends on the quantity of
formic acid added to blended viscera and temperature of the environment. At 25-
30°C temperature, fish viscera took 5, 4, 3 and 2 days for complete liquefaction into
fish silage with 2, 3, 4 and 5% formic acid, respectively (Table 3). Increasing the
amount of formic acid decreased the time required to prepare fish silage. On obvious
reason, at 5% formic acid, lowest time was required for liquefaction of viscera. But
5% formic acid would also increase cost of production and ultimately, the feed cost.
It was possible to liquefy viscera by using 2% formic acid but it would require more
time to complete the silage production. There was a risk of bacterial contamination
also. So considering all the limitations and options, it was found reasonable to
prepare fish silage with 4% formic acid that would, at the same time, minimize cost
and save production period.
Initial pH of liquid fish silage varied with the quantity of formic acid added to
blended viscera. Maintenance of acidity in fish silage had the added advantage of
keeping the product more hygienic and safe by inhibiting the growth of pathogenic
organisms. In the present study, the pH of the viscera decreased significantly from
the initial pH of 6.21±0.07 to 3.22±0.09 with respect to progressive increase in
concentration of 2 to 5% formic acid. At the end of the silage preparation, the pH
levels of silages were recorded to be 4.72±0.07, 4.32±0.03, 3.73±0.04 and 3.22±0.09
at 2, 3, 4 and 5% formic acid respectively. It was found that the pH of fish silage
made with 4% formic acid was within the standard range of 3.6 to 4.0. Silage made
with 2% formic acid had a pH of 4.72±0.07 which exceeded the standard range. On
the other hand, silage made with 5% formic acid had a lower pH than the standard
range. Incorporation of 5% formic acid would increase the cost and again more
Na2CO3 would be required to neutralize the pH. These would further increase feed
cost. Therefore, considering the optimum time to be required to prepare fish silage
with acceptable pH value, in order to keep the cost minimum but quality high, it was
observed rational to prepare fish silage with 4% formic acid.
Role of Na2CO3 in neutralizing liquid silage
With increasing quantity of formic acid, there is a need to neutralize liquid
silage to make it edible for fish and animals. The pH value of liquid fish silage
18 U. Hossain and A. K. M. N. Alam
increased with increasing value of sodium carbonate. In the present study, the pH of
liquid silage increased significantly from the initial value of 3.77±0.07 to 6.81±0.11
with respect to progressive increase in concentration of 1 to 6% Na2CO3. The pH
level of silage was recorded to be 4.47±0.07, 5.34±0.26, 5.89±0.08, 6.32±0.01,
6.58±0.18 and 6.81±0.11 at 1, 2, 3, 4, 5 and 6% Na2CO3, respectively (Figure 1). The
rate of neutralization was not uniform with the quantity of Na2CO3 .The rate of
neutralization was increased up to 2% and then decreased slowly. Addition of 4%
Na2CO3 transformed the pH value of liquid fish silage to nearly neutral, making it
safer to feed the animals. It was possible to make it totally neutral (pH 7) by adding
more sodium carbonate. But the cost of feed production would be increased with
increasing quantity of Na2CO3. In order to keep the cost of feed at reasonable level, it
was observed effective to neutralize liquid silage at 4% Na2CO3.
Effect of rice bran on powder silage quality
Different trials were made to ensure 20% protein in powder fish silage. For this
purpose different combination of rice bran were used. Proximate composition of
powder fish silage made with different quantity of rice bran by weight of liquid silage
is given in Table 4. With decreasing the quantity of rice bran, the levels of protein,
lipid and moisture were increased but that of ash and NFE were decreased. From
table 4, it was found that at 40 and 50% rice bran the nutrient contents became very
low. At 30% rice bran it was found that the protein content was enhanced to about
20% and other nutrient contents were also comparatively acceptable for animal
feeding. It was possible to increase protein content more by decreasing the quantity
of rice bran to 20%. But it might be difficult to dry the wet mixture due to lesser
content of dry matter and there would be a probability of mold attack. The product
with lower rice bran will not be stable for long time use. Therefore, considering all
options and limitations, it was found rational to prepare powder fish silage with 30%
rice bran by weight of liquid silage.
Comparative analysis of ingredients and silage
As far as the materials are concerned, viscera, formic acid, sodium carbonate
and rice bran were used for preparing powder fish silage. Fish viscera although
contained valuable nutrients, it is not possible to use as feed directly without
processing. Rice bran contained lower level of protein which would not fulfill the
nutritional requirements of many domesticated animals. As a result, rice bran cannot
be used as feed singly. Therefore to provide a nutritionally balanced diet, fish viscera
and rice bran were used for preparing powder fish silage. On average 665.57±1.76 g
powder silage could be prepared by using 1000±0.0 g viscera, 40±0.0 ml. formic
acid, 39.41±0.14 g sodium carbonate and 307.41±1.08 g rice bran (Table 5). So,
preparation of 1 kg powder fish silage required 1502.47 g viscera, 60.10 ml. formic
acid, 59.21 g sodium carbonate and 461.87 g rice bran.
PRODUCTION OF POWDER FISH SILAGE 19
Self life of powder silage
To observe the quality changes of powder fish silage during storage, proximate
composition, pH and physical characteristics were observed for four months. Most of
the compositions of packaged powder silage were unchanged during the storage
period. A slow decrease in protein, ash, crude fiber and lipid, and a slow increase in
carbohydrate and moisture were observed during the storage. The protein contents
were recorded to be 20.70±0.19, 20.61±0.18, 20.43±0.31 and 20.30±0.13% in the 1st,
2nd
, 3rd
and 4th month, respectively (Table 6). These data indicate that protein content
of powder silage can be stable for long time, perhaps up to one year without any
change in quality. The mineral content in term of ash decreased from an initial value
of 14.05±0.27 to 13.91±0.11, 13.73±0.29, 13.62±0.12 and 13.49±0.33% in the 1st,
2nd
, 3rd
and 4th month, respectively. The crude fiber content decreased from an initial
value of 6.61±0.10 to 6.56±0.08, 6.50±0.08, 6.43±0.13 and 6.32±0.07% in the 1st, 2
nd,
3rd
and 4th month, respectively. Result of ash and crude fiber contents in the present
experiment showed no significant variation with respect to increase in storage life.
The lipid content was recorded to be 33.45±0.31, 33.03±0.28, 32.77±0.35 and
32.41±0.16% in the 1st, 2
nd, 3
rd and 4
th month, respectively. The rate of lipid
degradation was slightly higher than protein, ash and fiber content. Results display a
significant decrease of lipid content in powder fish silage with corresponding
increase of storage. The moisture level increased from an initial value of 10.83±0.19
to 10.87±0.30, 10.84±0.24, 10.92±0.15 and 10.98±0.28% in the 1st, 2
nd, 3
rd and 4
th
month, respectively. The results indicated the importance of proper packaging that
make powder fish silage nutritious. The carbohydrate content was recorded to be
14.51, 15.29, 15.83 and 16.50% in the 1st, 2
nd, 3
rd and 4
th month, respectively.
The pH value of powder fish silage after four month of storage remained
almost unchanged. The pH value was recorded to be 6.58±0.03, 6.63±0.02, 6.71±0.06
and 6.76±0.09 in the 1st, 2
nd, 3
rd and 4
th month, respectively (Table 6). Data indicated
that the quality of powder fish silage was almost similar to that of the initial product
before packaging.
The physical characteristics of powder fish silage was monitored for 1 year but
rigorously analysed for 4 months though physical and sensory observations, the
results being presented in table 7. No change in physical quality was observed during
storage for four month. The powder silage remained highly dried all along the storage
period with no sign of moisture absorbance and mold attack. The product obtained a
lovely sweet flavor with appealing fragrance. The color remains bright brown all
along the storage.
CONCLUSION
Fish viscera could be a suitable substitute for costly fishmeal in producing high
quality and nutrient-rich powder fish silage. Powder fish silage could be stored up to
1 year without the loss of major nutrient components. It was found possible to

20 U. Hossain and A. K. M. N. Alam
partially replace expensive fish meal in fish and animal feed preparation. Powder fish
silage should be tested for the growth performance of fish and other animals in farm
culture condition. Research needed to be carried out on appropriate packaging of
such product for local marketing.
REFERENCES
Abowei, J. F. N. and Tawari, C. C. 2011. Some basic principles of fish processing in Nigeria.
Asian Journal of Agricultural Sciences, 3 (6): 437-452
Ahmed, M., Qureshi, T. A. and Singh, A. B. 2012. Effect of dietary protein, lipid and
carbohydrate contents on the viscera composition and organ Indices of Cyprinus carpio
communis fingerlings. African journal of Biotechnology, 11 (33): 8361-8366
AOAC. 2000. Official methods of Analysis. 17th
end. Association of Official Analysis
Chemists, Washington DC. pp.2200
Bechtel, P. J. 2003. Properties of different fish processing by-products from pollock, cod and
salmon. Journal of Food Processing and Preservation, 27 (2): 101-116
Bhaskar, N. and Mahendrakar, N. S. 2007. Chemical and microbiological changes in acid
ensiled visceral waste of Indian major carp Catla catla (Hamilton) with emphasis on
proteases. Indian Journal of Fish, 54 (2): 217-225
Enke, D. B. S., Lopes, P. S., Kich, H. A., Britto, A. P., Soquetta, M. and Pouey, J. L. O. F.
2009. Use of fish silage meal in diets for juvenile jundia fish. Ciencia Rural, 39 (3):
871-877
FAO, 2003: Animal feed resources information system. Retrieved March 11, 2014 from
http://www.fao.org.
Folador, J. F., Lilienthal, L. K. K., Parsons, C. M., Bauer, L. L., Utterback, P. L., Schasteen,
C. S., Bechtel, P. J. and Fahey, J. G. C. 2006. Fish meals, fish components and fish
protein hydrolysates as potential ingredients in pet foods. Journal of Animal Science,
84: 2752-2765
Mahboob, S. and Sheri, A. N. 1998. Proximate composition of viscera of major, common and
some Chinese carps under the effect of different fertilization scheme and feed
supplement in composite culture system. Asian-Australasian Journal of Animal
Sciences, 11 (2): 196-200
Mahmud, N. A., Hasan, M. D. R., Hossain, M. B. and Minar, M. H. 2012. Proximate
composition of Fish feed ingredients available in Lakshmipur region, Bangladesh.
American- Eurasian Journal of Agricultural & Environmental Science, 12 (5): 556-560
Mesa, M. G. and Magie, C. D. 2004. Evaluation of energy expenditure in adult spring chinook
salmon migrating upstream in the Columbia river basin: an assessment based on
sequential proximate analysis. Portland, Oregon.
Mousavi, S. L., Mohammadi, G., Khodadadi, M. and Keysami, M. A. 2013. Silage production
from fish waste in cannery factories of Bushehr city using mineral acid, organic acid,
and biological method. International Journal of Agriculture and Crop Sciences, 6 (10):
610-616

PRODUCTION OF POWDER FISH SILAGE 21
Okai, D. B., Nyannor, E. K. D. and Tandoh, I. 2003. Nutrient composition, insect pests and
microbial population in rice bran samples from some mills in Kumasi and its environs.
Journal of Science and Technology, 23 (1): 1-6
Oulavallickal, T. 2010. Using koi carp to produce fish silage. M. Sc. (Engg.) thesis. The
University of Waikato, New Zealand
Permata, R. R. T. F., Suseno, S. H., Jacoeb, A. M., Nugraha, R., Hayati, S. and Saraswati
2014. Natural taurine extraction of escolar (Lepidocybium flavobrunneum) as deep sea
fish from southern Java ocean. Global Journal of Biology, Agriculture and Health
Sciences, 3(1): 251-253
Rahmi, M., Faid, M., Yachioui, M. E., Berny, E. H., Fakir, M. and Ouhssine, M. 2008.
Protein rich Ingredients from fish waste for sheep feeding. African Journal of
Microbiology Research, 2: 73-77
Rashid, M. M. U., Belton, B., Phillips, M. and Rosentrater, K. A. 2013. Improving
aquaculture feed in Bangladesh: From feed ingredients to farmer profit to safe
consumption. Working Paper. World Fish, Penang, Malaysia. pp.12
Rosniyana, A., Hashifah, M. A. and Norin, S. A. S. 2009. Nutritional content and storage
stability of stabilized rice bran– MR 220. Journal of Tropical Agriculture and Food
Science, 37(2): 163–170
Taheri, A., Anvar, S. A. A., Ahari, H. and Fogliano, V. 2013. Comparison the functional
properties of protein hydrolysates from poultry byproducts and rainbow trout
(Onchorhynchus mykiss) viscera. Iranian Journal of Fisheries Sciences, 12(1): 154-
169
22 U. Hossain and A. K. M. N. Alam
Table 1. Proximate composition of silage and its ingredients
Ingredients/Silage Composition (%)
Protein Lipid Ash Moisture NFE*
Viscera (wet
weight basis)
14.01±0.68 20.00±1.04 4.75±0.64 60.62±2.15 0.62±0.08
Viscera (Dry
weight basis)
32.38±1.19% 47.10±0.92 10.20±1.10 9.16±1.25 1.15±0.40
Rice bran 9.32±0.06 17.94±0.35 18.67±0.12 9.65±0.14 44.42±2.60
Liquid silage 12.00±0.89 17.26±1.49 3.73±0.81 66.41±3.07 0.60±0.09
Powder silage 20.84±0.12 33.73±0.14 14.05±0.27 10.83±0.19 20.55±0.65
Mean± SD of eight samples; NFE* (Nitrogen Free Extract) = {100- (protein+ lipid+
ash+ moisture) %}
Table 2. pH of silage and its ingredients
Ingredients/Silage pH
Viscera 6.21±0.07
Rice bran 6.92±0.22
Liquid silage 3.77±0.07
Powder silage 6.54±0.01
Mean± SD of eight samples
Table 3. Time required to prepare liquid fish silage with different quantity of formic
acid added
Formic acid (%) Time required
(Days)
Temperature
(oC)
2
3
4
5
5
4
3
2
25-30

PRODUCTION OF POWDER FISH SILAGE 23
Table 4. Proximate composition of powder fish silage made with different quantity
of rice bran
Rice bran
(%)
Composition (%)
Protein Lipid Ash Moisture NFE*
20
30
40
50
21.75±0.19
20.84±0.12
19.87±0.12
18.73±0.25
34.71±0.28
33.73±0.14
32.88±0.21
30.74±0.19
13.36±0.23
14.05±0.27
14.28±0.14
14.55±0.25
11.68±0.17
10.83±0.19
10.17±0.25
9.66±0.21
18.50±0.92
20.55±0.35
22.80±0.48
26.32±0.76
Mean± SD of three replicates; NFE* (Nitrogen Free Extract) = {100- (protein+ lipid+ ash+ moisture) %}
Table 5. Quantity of raw materials and ingredients used in final fish silage
preparation
Lots Viscera
(g)
Formic
acid
added
@ 4 ml.
/100 g
viscera
(ml.)
Liquid
silage
obtained
(g)
Sodium
carbonate
added
@ 4 g
/100 g
liquid
silage (g)
Sodium
carbonate
mixed
liquid
silage (g)
Rice
bran
(g)
Powder
silage
obtained
(g)
1
2
3
4
5
6
7
8
1000
1000
1000
1000
1000
1000
1000
1000
40
40
40
40
40
40
40
40
985.53
989.07
984.84
980.95
990.03
983.71
987.34
980.75
39.42
39.56
39.39
39.24
39.60
39.35
39.49
39.23
1024.95
1028.63
1024.23
1020.19
1029.63
1023.06
1026.83
1019.98
307.49
308.59
307.27
306.06
308.89
306.92
308.05
305.99
665.81
667.15
664.50
663.72
668.55
665.52
666.07
663.25
Average 1000
±0.0
40±
0.00
985.28
±3.45
39.41
±0.14
1024.69
±3.58
307.41
±1.08
665.57
±1.76
Mean± SD of eight samples

24 U. Hossain and A. K. M. N. Alam
Table 6. Change in proximate composition and pH of packaged powder silage during
storage
Storage
period
(month)
Composition (%) pH
Protein
Lipid
Ash
Moisture
Fiber
Carbohy-
drate
0
1
2
3
4
20.84±0.12
20.70±0.19
20.61±0.18
20.43±0.31
20.30±0.13
33.73±0.14
33.45±0.31
33.03±0.28
32.77±0.35
32.41±0.16
14.05±0.27
13.91±0.11
13.73±0.29
13.62±0.12
13.49±0.33
10.83±0.19
10.87±0.30
10.84±0.24
10.92±0.15
10.98±0.28
6.61±0.10
6.56±0.08
6.50±0.08
6.43±0.13
6.32±0.07
13.94
14.51
15.29
15.83
16.50
6.54±0.01
6.58±0.03
6.63±0.02
6.71±0.06
6.76±0.09
Mean± SD of three replicates
Table 7. Physical quality of powder silage during storage
Storage life
( month)
Moistness* Occurrence of
mold
Flavor Color**
0
1
2
3
4
1
1
1
1
1
Nil
Nil
Nil
Nil
Nil
Sweet
Sweet
Sweet
Sweet
Sweet
5
5
5
5
5
*Moistness scale: 1 to 5 with 1 being very dry and 5 being highly moist; ** Color scale: 1 to 5 with 1
being ashy dark and 5 being bright brown.

PRODUCTION OF POWDER FISH SILAGE 25
Figure 1. Changes in pH of liquid silage during neutralization with Na2CO3
SAARC J. Agri., 13(2): 26-33 (2015)
HAEMATO-BIOCHEMICAL AND ANTIOXIDANT
PROFILING OF INDIGENOUS CATTLE OF KASHMIR
Z. A. Pampori*, S. Ashraf, S. Iqbal, I. Nabi and R. Ahmad
Division of Veterinary Physiology, SKUAST- Kashmir, Shuhama, Alusteng, Srinagar – 190006-India
ABSTRACT
Kashmir falls in the great north-western complex of the Himalayan ranges, at 34
o North and 76
o East with an average altitude of 1850
metres amsl. Indigenous cattle constitute 51% of total cattle population of the State. The evaluation of some important blood parameters in indigenous cattle for assessment of animal health status as well as course of variation in blood parameters in these animals was undertaken during summer to autumn, 2014. Twenty two indigenous cattle from different pockets of Kashmir valley were studied for haemato-biochemical and anti-oxidative parameters. The values recorded for Hb, PCV and MCV (10.97 ±0.22 g dl
-1, 36.45±0.55 %, and 67.71±1.76 fl)
respectively were on the higher side when compared to crossbreds or exotic cattle. TBARS and FRAP, measures of oxidant-antioxidant balance were 5.90 ±0.39 n ML
-1 and 548.16±23.78 µ ML
-1 respectively,
the values were on higher side when compared to exotic breeds. Similarly total protein, albumin and globulin levels reported were -8.27±0.22 g dl
-1, 3.31±0.07 g dl
-1 and 4.95±0.20 gdl
-1 respectively that
stands higher when compared to the reference values for cattle.Plasma biochemical analytes urea, creatinine, triglycerides, AST and ALT recorded in present study were comparable to the reference values for cattle. All these parameters provide complementary information about the homeostasis of indigenous cattle and indicate its good health status, higher disease resistance and good metabolic defence as compared to exotic or crossbred cattle in its temperate climate.
Keywords: Antioxidant status, blood constituents, indigenous cattle, plasma analytes,
INTRODUCTION
Cattle are one of the India’s greatest biological resource (199.1 million,
Livestock Census, 2007), which constitute nearly 13% of the world’s total cattle
population (Arjava Sharma, 2013). Many of the native breeds of cattle in India are
giving way to the exotic and cross-bred animals. Exotic breeds like Holstein Friesian,
*Corresponding author email: [email protected]
Received: 06.04.2015
HAEMATO-BIOCHEMICAL PROFILING OF CATTLE 27
Jersey and their cross-breds are predominant in Northern parts of India including
temperate regions of J & K State (Mahima et al., 2013). Thirty recognised breeds in
India constitute around 20 per cent of the country’s total cattle population while
around 80% of the cattle population is still non-descript. The existing indigenous
cattle breeds have evolved over the centuries through natural selection for adoption to
harsh climatic conditions, resistance to common diseases with ability to thrive under
extreme nutritional stress. Under Intensive Cattle Development Project during fourth
five year plan local cattle of the State were cross bred with Jersey and HF that
resulted into 49% of cattle population presently in the State as crossbreeds. Realising
the importance of indigenous germplasm, Indigenous Breeds Project (IBP) was
undertaken in the country for preservation of indigenous breeds. About 70% of
human population inhabits rural areas with domestic livestock like cow, sheep & goat
playing important role in their socio-economic status. The preservation of indigenous
livestock has been now foreseen in Indian scenario because of being a low input and
low output production system that can provide sustainability, food security, protein
nutrition and even the empowerment to the rural families. Present study on blood
physiology in indigenous cattle of Kashmir valley was undertaken because blood is
of crucial importance for the maintenance of physiological equilibrium in the body.
Certain blood biochemical constituents reflect the nutritional status/metabolic health
of dairy herds with, or without, the manifestation of clinical abnormalities (Radostits
et al., 2003). Further haematological and clinical chemical analysis of blood of
animals is a potentially valuable diagnostic tool in animal health care for diagnosing
various pathological and metabolic disorders that can adversely affect the productive
and reproductive performance of animals, therefore, various studies (Dutt et al.,
1988; Pampori et al., 2010 and Pampori et al., 2011) have documented hemato-
biochemical parameters in domestic species. The present study in Kashmiri
indigenous cattle could provide the reference values of haemato-biochemical
parameters that are important for the clinical interpretation of laboratory data and a
valuable diagnostic tool in animal health care.
MATERIALS AND METHODS
The present study was conducted in 22 apparently healthy indigenous Kashmiri
cows of 4-6 years age, from remote pockets of Kangan and Bandipora areas of the
Kashmir valley. The study was conducted in summer and autumn monthsduring the
year 2014. The indigenous character of animals under study was ascertained on basis
of the inputs from owners and their morphology (Plate-1). Seven millilitre of blood
was collected with a 20 gauge needle from jugular vein in heparinised vacutainers
after taking all necessary aseptic and ethical measures. Blood samples were
transported to the laboratory on ice. Haematological parameters were studied
immediately within 24 hours whereas plasma was separated by centrifugation and
stored at -20 0C for study of chemistry. Haemoglobin (Hb) and packed cell volume
(PCV) were estimated by cyanmethemoglobin method and microhematocrit method
28 Z. A. Pampori et al
respectively. Total erythrocyte count (TEC) and total leukocyte count (TLC), Mean
corpuscular volume (MCV), mean corpuscular haemoglobin (MCH) and mean
corpuscular haemoglobin concentrations (MCHC) were determined as described by
Feldman et al. (2000).
Plasma was evaluated for a wide range of analytes _ viz total protein (TP),
albumin (Alb), urea, creatinine, triglycerides, aspartate aminotransferase (AST),
alanine aminotransferase (ALT) using kits from Coral Clinical Systems, India.
Thiobarbituric acid reactive substance (TBARS), an index of oxidative stress, was
evaluated by the method described by Asakawa and Matsushita (1980). The ferric
reducing ability of plasma (FRAP), a measure of antioxidant power, was determined
by a method described by Benzie and Strain (1996).
Data recorded were subjected to statistical analysis using Microsoft office
Excel 2007 software and values are presented as mean ± standard error.
RESULTS AND DISCUSSION
The mean values recorded for Hb, PCV, TEC, TLC, MCH, MCHC and MCV
are presented in table 1. The values recorded in present study for Hb and PCV were
on the higher side when compared to the values reported in crossbred cows (Mir et
al., 2008, Kumar and Pachauri, 2000 and Khan et al., 2011) and in exotic cattle
(Sattar and Mirza, 2009). However present recorded values for haematology in
indigenous cattle were similar to the reported values in Haryana cattle (Mahima et al.,
2013). Haemoglobin and packed cell volume were included in metabolic profile tests
amongst other biochemical constituents (Payne et al., 1970), hence, present findings
indicate a good metabolic status of indigenous Kashmiri cattle. Present values for
erythrocyte indices MCV and MCH were also on higher side when compared to the
values in Haryana (Mahima et al., 2013), in crossbred cattle (Kumar and Pachauri,
2000) and in Sahiwal (Ahmad, 1995). The importance of erythrocyte indices in
interpretation of metabolic profile tests in cattle was discussed by Jazbec et al.
(1993). Higher PCV in present study could be directly related to higher MCV which
is an index of RBC volume and probably indigenous cattle had larger erythrocyte
volume with high corpuscular haemoglobin. Further higher MCH reported in present
study in indigenous cattle may be an adaptation to the high altitude topography of
Kashmir with its TEC not much different from the reference values for cattle
(Pampori, 2003).
The mean values for oxidative stress markers TBARS and FRAP and plasma
biochemical analytes urea, creatinine, TP, Albumin, Globulin, A/G ratio, ALT, AST
and TG recorded in local cattle are presented in table 2.
TBARS and FRAP a measure of lipid peroxidation and antioxidant status
respectively have now been extensively studied to assess the oxidative stress which
provides a good reference of animal homeostasis. Evaluation of oxidative stress has
contributed increasingly to our knowledge of the fundamental mechanisms involved

HAEMATO-BIOCHEMICAL PROFILING OF CATTLE 29
in metabolic challenges, especially important in domestic animals in which many
physiological process like lactation, pregnancy impose physiological demands on
animal homeostasis (Castillo et al., 2006 and Pampori & Pandita, 2013). The
antioxidant status recorded as FRAP in Kashmiri indigenous cattle was on higher
side when compared to the values in buffaloes (Pampori & Pandita, 2013). However
TBARS recorded in present study in local cattle were on higher side when compared
to the reported values in crossbred Holstein cattle (Chaiyabutr et al., 2011).The use of
TBARS and FRAP values, measures of oxidant-antioxidant balance, could provide
complementary information about the homeostasis of the animal than conventional
metabolic parameters alone. Higher antioxidant capability reported in local Kashmiri
cattle supports the view that local cattle are more resistant to extreme stress
condition.
The plasma concentration of various biochemical analytes reported in
indigenous cattle of Kashmir valley were comparable to the reference values for
cattle (Mary, 2004 and Pampori, 2003). However total protein and globulin levels
reported in present study were on higher side even higher than the values reported in
Yak hybrids of Kashmir (Pampori et al., 2010). The higher concentration of globulin
fraction may account for higher disease resistance in local cattle as compared to
crossbred, further holds the view that local cattle are more disease resistant than
exotic. The levels of creatinine and total proteins reported in indigenous cattle of
Bangladesh by Mamun et al. (2013) were higher and lower respectively as compared
to the values reported in present study that suggests a healthy status of indigenous
cattle of Kashmir.
CONCLUSION
Present study documented the baseline values for various important blood
parameters in indigenous cattle of Kashmir which were not available and can serve
indices in diagnosis of various productive and reproductive ailments. From the
present study it gets established that the antioxidant status on indigenous cattle was
on higher side as compared to crossbreds and European breeds which confers higher
resistance to these animals against stresses thus more sustainable.
REFERENCES
Ahmad, I. 1995. Antibody titer and hematology following vaccination and immune-
potentiation of Sahiwal cows in last trimester of pregnancy. Ph. D.Diss. University of
Agriculture, Faisalabad, Pakistan
Arjava Sharma. 2013. Project Directorate on Cattle. Indian Council of Agricultural Research.
Grass Farm Road, Meerut Cantt. (U.P.), India. (htpp://www.pdcattle.org.in)
Asakawa, T. and Matsushita, S. 1980. Coloring conditions of thiobarbituric acid test for
detecting lipid hydroperoxides. Lipids, 15: 137-140

30 Z. A. Pampori et al
Benzie, I. F. F. and Strain, J. J. 1996. The Ferric Reducing Ability of Plasma (FRAP) as a
measure of ‘‘antioxidant power’’ The FRAP Assay. Analytical Biochemistry, 239: 70–
76
Castillo, C., Herna´ndeza, J., Valverde, I., Pereira, V., Sotillo, J., Lo´pez Alonso, M. and
Benedito, J. L. 2006. Plasma malonaldehyde (MDA) and total antioxidant status (TAS)
during lactation in dairy cows. Research in Veterinary Science, 80: 133–139
Chaiyabutr, N., Chanchai, W., Boonsanit, D., Sitprija, S. and Chanpongsang, S. 2011.
Different responses of oxidative stress index in the plasma of crossbred Holstein cattle during
cooling and supplemental recombinant bovine somatotropin. Journal of Animal and
Veterinary Advances, 10: 1045-1053
Dutta, J. C., Baruah, R. N., Dutta, L. and Talukar, S. C. 1988. Blood biochemical studies in
anoestrus and normal cyclic cattle. Indian Veterinary Journal, 65: 239–41
Feldman, B. F., Zinkl, J. G. and Jain, N. C. 2000. Schalm’s Veterinary Haematology.
Lippincott Williams and Wilkins. USA
Jazbec, I., Zadnik, T., Modic, T., Lobnik, R., Praprotnik, A., Klinkon, M. and Nemec, M.
1993. Haematological, biochemical and carpological profile in dairy cows of Radlje.
Znanost in Praksa v Govedoreji (Slovenia), 17: 185–196
Khan, I. A., Khan, A., Hussain, A., Riaz, A. and Aziz, A. 2011. Hemato-biochemical
alterationsin cross bred cattle affected with bovine theileriosis in semi-arid zone.
Pakistan Veterinary Journal, 31: 137-140
Kumar, B. and Pachauri, S. P. 2000. Haematological profile of crossbred dairy cattle to
monitor herd health status at medium elevation in Central Himalayas. Research in
Veterinary Science, 69: 141-145
Mahima Singh, K. V., Verma, A. K., Kumar, V., Singh, S. K. and Roy, D. 2013.
Hematological and serum biochemical profile of apparently healthy Haryana cattle
heifers in Northern India. Pakistan Journal of Biological Science, 16: 1423-1425
Mamun, M. A., Hassan, M. M., Shaikat, A. H., Islam, S. K. M. A., Hoque, M. A., Uddin, M.
and Hossain, M. B. 2013.Biochemical analysis of blood of native cattle in the hilly area of
Bangladesh. Bangladesh Journal of Veterinary Medicine, 11: 51-56
Mary Anna Thrall. 2004. Veterinary Hematology and Clinical Chemistry. Lippincott
Williams and Wilkins, Philadelphia
Mir, M. R., Pampori, Z. A., Iqbal, S., Javeed, I. A., Pal, M. A. and Manzoor, A. K. 2008.
Hemato-biochemical indices of crossbred cows during different stages of pregnancy.
International Journal of Dairy Science, 3(3): 154-159
Pampori, Z. A. 2003.Field cum Laboratory Tests in Animal Health Care. Daya Publications,
New Delhi, India
Pampori, Z. A., Iqbal, S., Hasin, D. and Iqbal, M. 2010. Haematology and serum chemistry of
Zomo, Tulmo and Garmo (Yak hybrids). Indian Journal of Dairy Science, 63(1): 74-78
Pampori, Z. A., Iqbal, S., Khan, M. Z. and Kirmani, N. A. 2011. Blood constituents and
morphology of Yarqandi double humped camel. Indian Veterinary Journal, 88(4): 19-
20
HAEMATO-BIOCHEMICAL PROFILING OF CATTLE 31
Pampori, Z. A. and Pandita, S. 2013. Gender and age bias in immune competence and
oxidative stress markers in Murrah buffaloes (Bubalusbubalis). Indian Journal of
Animal Science, 83: 717-724
Payne, J. M., Dew, S. M., Manston, R. I. and Margaret, F. 1970. The use of a metabolic
profile test in dairy herds. Veterinary Record, 87: 150–158
Radostits, O. M., Gay, C. C., Blood, D. C. and Hinchciliff, K. W. 2003.Veterinary Medicine.
Elsvier Science Ltd. USA
Sattar, A. and Mirza, R. H. 2009. Haematological parameters in exotic cows during gestation
and lactation under subtropical conditions. Pakistan Veterinary Journal, 29(3): 129-
132

32 Z. A. Pampori et al
Table 1. Haematology of indigenous Kashmiri cattle
Parameters Values ((Mean ±SE)
Hb(g dl-1
) 10.97 ±0.22
PCV (%) 36.45 ±0.55
TEC (106) 5.44 ±0.12
MCV (fL) 67.71 ±1.76
MCH (pg) 20.45 ±0.57
MCHC (g%) 30.28 ±0.66
TLC (103) 5.46 ±0.22
Table 2. Plasma chemistry and oxidant-antioxidant markers of indigenous Kashmiri
cattle
Parameters Values ((Mean ±SE)
Urea (mg dl-1
) 30.10 ±1.47
Creatinine (mg dl-1
) 1.70 ±0.02
Total Protein (g dl-1
) 8.27 ±0.22
Albumin (g dl-1
) 3.31 ±0.07
Globulin (g dl-1
) 4.95 ±0.20
A/G ratio 0.69 ±0.03
TG (mg dl-1
) 59.71 ±3.26
AST (U ml-1
) 169.36 ±2.05
ALT (U ml-1
) 53.47 ±2.83
TBARS (n ML-1
) 5.90 ±0.39
FRAP (µ ML-1
) 548.16 ±23.78
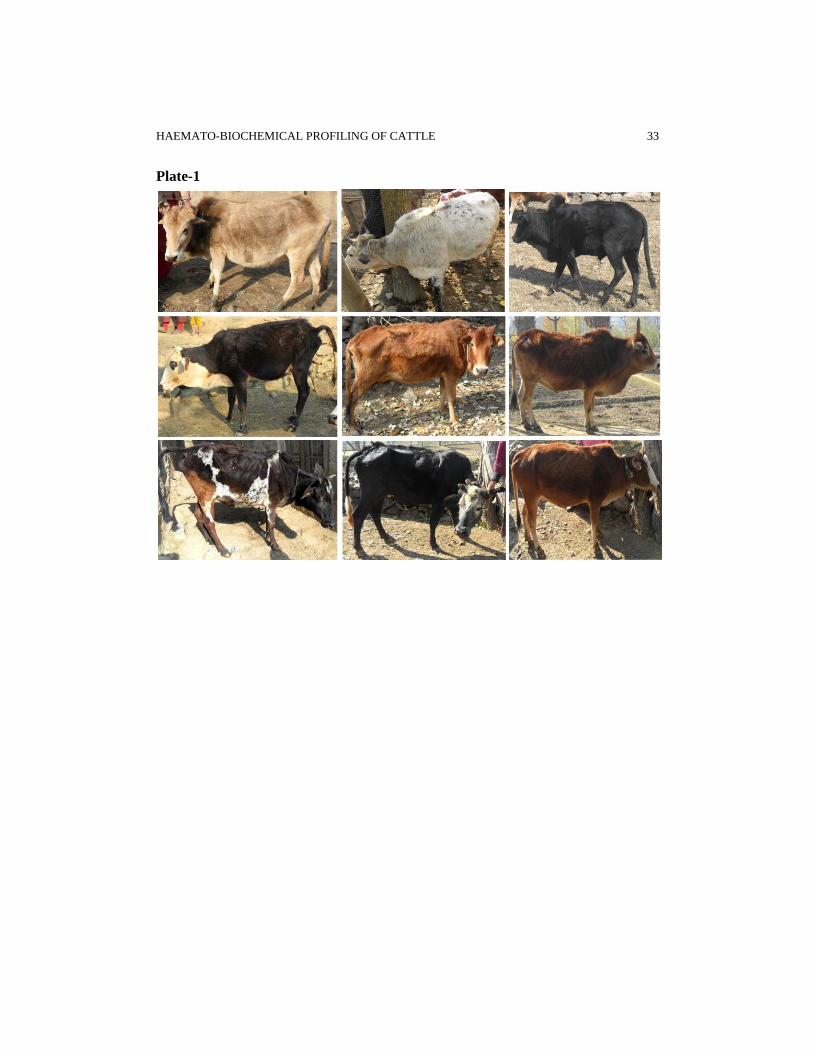
HAEMATO-BIOCHEMICAL PROFILING OF CATTLE 33
Plate-1
SAARC J. Agri., 13(2): 34-49 (2015)
MODERN RICE VARIETIES ADOPTION TO RAISE
PRODUCTIVITY: A CASE STUDY OF TWO DISTRICTS
IN BHUTAN
N. Chhogyel*1
and Y. Bajgai1
Renewable Natural Resources Research and Development Centre
Department of Agriculture, Bajo, Wangdue, Bhutan
ABSTRACT
Rice (Oryza sativa L.) is one of the main staple crops of Bhutan and is grown in all 20 districts of the country. Due to its key role in national food security, a number of development interventions like promotion of modern rice varieties is carried out. To assess the impact of such development interventions, this study investigated whether the farmers in two main rice growing districts, Punakha and Wangdue, have adopted the promoted rice varieties. Within a district, ten main rice growing geogs (administrative units) were chosen for the study. Representing the study area a questionnaire farming-household survey of 580 was carried out in 2014. The study found that the farming household level variety adoption rate was 68% and 62% in Wangdue and Punakha, respectively. The main modern varieties adopted by the surveyed farming households were IR-64, Khangma Maap, Bajo Maap, Bajo Kaap, No. 11 and IR-20913. In terms of area coverage, 54.50% of the area in Wangdue was covered by improved varieties and that in Punakha was 56.71%. Among the adopted varieties, the most widely grown variety in both the districts was IR-64 that accounts for about 55% adoption. However, the least adopted variety was IR-20913 which stood at just 0.2% in Wangdue and 2% in Punakha. Yield increase due to improved varieties over local ones, 80% of households in Wangdue and 91% of households in Punakha reported achieving 25% and 33% increases together. In Wangdue 80% of the households reported yield increase and in Punakha it was 91%, which corresponded to 25% and 33% increases, respectively. This surveyed finding can be validated by crop-cut yield data which was greater than or equal to 26% yield increase, on an average, by improved varieties over local ones. In terms of farmers’ adoption rate of modern rice varieties and area covered by the modern varieties, the findings showed that there is a major impact of rice development interventions in Punakha-Wangdue valley to support food security of the farming households as well as for adding to the national food basket.
* Corresponding author email: [email protected] 1 Renewable Natural Resources Research and Development Centre-Bajo, Department of Agriculture
Received: 19.05.2015

MODERN RICE CULTIVATION IN BHUTAN 35
Keywords: Modern rice varieties, adoption rate, comparative productivity, Bhutan
INTRODUCTION
Rice (Oryza sativa L.) is the number one staple crop in Bhutan. For Bhutanese
populace, rice is the most preferred cereal food. Owing to the important role it plays,
rice may be considered as synonymous to the national food security or the food self
sufficiency state of the country. Over the years, Department of Agriculture, Ministry
of Agriculture and Forests, has put in place strategic initiatives to enhance sustainable
rice production. Currently the National Rice Commodity Program commands the
largest annual budgetary share amongst the other cereal crops development programs
in the country. It is grown in all the 20 districts of Bhutan in altitude range of about
150 m in the South to about 2600 m in the North. Rice is grown in approximately
23,000 ha area with production of little over 78,000 tons (DoA, 2012). This meets
less than 50% of Bhutan’s rice requirement and rest is imported from neighboring
India. Thus, promotion of modern rice varieties was imperative as one key
intervention to enhance rice production towards improving national food security.
The green revolution in Asia was driven by revolution of technologies which
included package of modern inputs such as improved seeds, irrigation, fertilizers and
pesticides leading to dramatic yield increase (Pandey et al., 2012).
The trends in rice production and productivity over the years showed some
gradual increases but Bhutan’s rice industry has been beset by numerous challenges.
The rice areas are under tremendous pressure from the forces of development and
urbanization. Rice production in Bhutan is also being hit very hard by the effects of
climate change and global warming. The irrigation water sources are seen to be
drying out, precipitation is getting more and more erratic, and potential rice fields are
getting fallowed or are converted to urban centres and other land uses. In the face of
all such challenges, Department of Agriculture targets to enhance production and
improve national rice self-sufficiency level using strategic interventions. In the past,
there were several projects and initiatives which led to development and release of
high yielding HYVs. All such interventions have contributed immensely to
promotion and use of modern rice varieties. Most recent and one noteworthy
initiative was the Accelerated Bhutan Socio-economic Development (ABSD)
initiative for rice production which targeted to bring about 70% of the potential rice
area under various forms of interventions (DoA, 2013; RNR RDC Bajo, 2012). The
ABSD initiative targeted seven most potential rice-growing districts or the clusters
viz. Wangdue-Punakha valley, Tsirang-Dagana, Sarpang, Samtse, Samdrup Jongkhar
and others. Of these, Wangdue-Punakha valley was one of the most important
clusters which constitutes about 25% of the total rice production and is an important
lifeline for rice trade in the country. The two districts are famous for the highest rice
productivity in the country along with Paro district.

36 N. Chhogyel and Y. Bajgai
As Bhutan moves away from subsistence level of production to commercial
mode of production, modern farming technologies should be adopted. Thus, the use
of input intensive modern varieties must be vigorously pursued along with other
green revolution technologies. To increase rice productivity, interventions like
vigorous promotion of modern varieties, providing increased access to irrigation
water and farm mechanization, capacity development of farmers and extension staff,
and so on are pursued. Despite all the efforts and initiatives, technology adoption is
still quite low and use of modern rice varieties needed a thorough review to re-
energize and launch intensified rice development program in the major rice growing
areas. The need of the hour is to have higher yielding varieties with resilience to
biotic and abiotic stresses. The national rice variety adoption rate is 42% (Ghimiray,
2012) and it is imperative to assess the impacts of technology promotion drives
initiated and implemented over the years. Since the promotion of modern varieties
was the cornerstone of the development agenda, this article investigates the rate of
adoption of modern rice varieties, an important impact of the various initiatives.
Specifically, the objectives of the current study were (1) to assess the impacts of rice
development initiatives on the adoption of modern rice varieties by the farmers of
Wangdue-Punakha valley, and (2) to assess and identify locations requiring
immediate attention for enhancing rice production and productivity. To capture the
situation in representative rice growing districts, Wangdue and Punakha districts
were chosen because these two districts together accounts for 25% of rice production
in the country (DoA, 2013) and sometimes referred to as a rice bowl of Bhutan.
MATERIALS AND METHODS
Site description
A questionnaire survey was conducted in ten major rice growing geogs
(blocks) of Wangdue and Punakha districts in West-central region of the country
(Figure 1). These two districts are also more often referred to as Wangdue-Punakha
valley and the valley is one of the most important rice growing areas in Bhutan. The
Wangdue-Punakha valley is the rice bowl of Bhutan and is well known for domestic
rice trade constituting both improved and local varieties of rice. These areas fall in
warm temperate to dry subtropical zone and constitute major mid-altitude rice
growing area which stretches to the extremes of temperate climate. The research sites
fall under the dry sub-tropical agro-ecological zone of broad national classification
for Bhutan. That is, the Punakha-Wangdue valley generally has sub-tropical climate
with dry winters and wet summers. Normally, the summers become hot with
temperature reaching over 30 degree centigrade and the winters are dry and windy
with frost in the morning. The maximum temperature is over 34oC in the month of
May and the minimum is 0.5oC in the month of December. Similarly the maximum
rainfall is about 125 mm in the month of August and the minimum rainfall can be as
low as zero mm in the month of December.
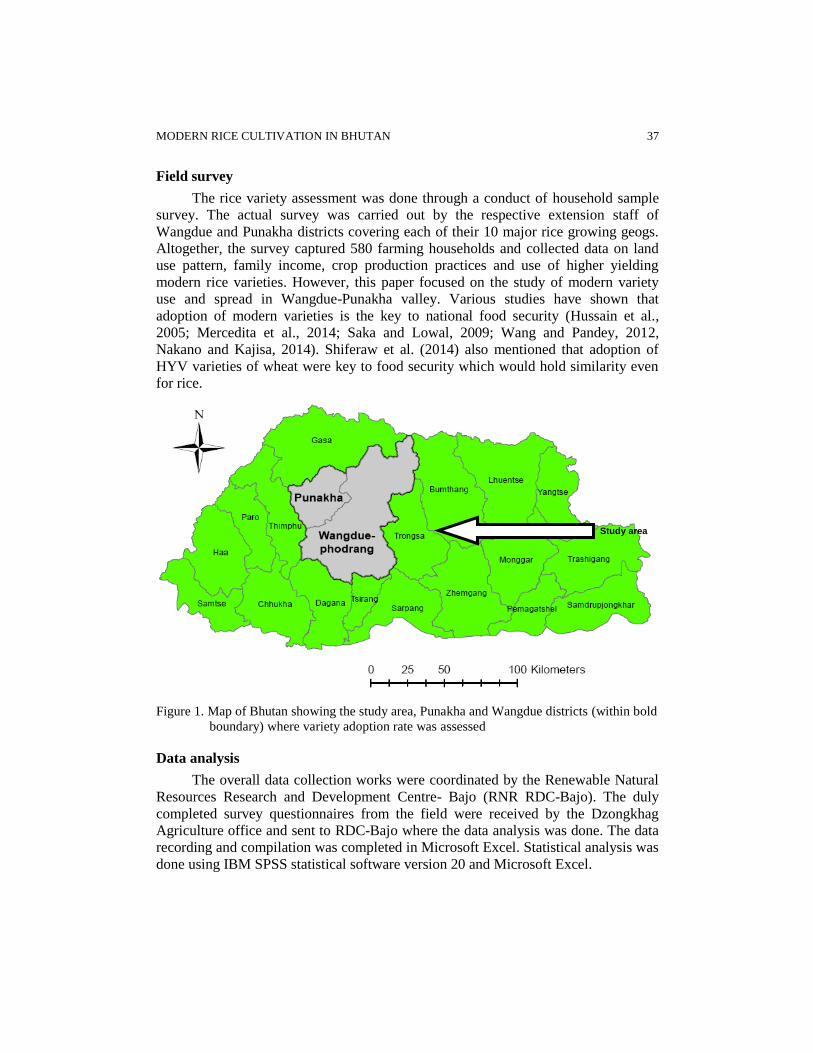
MODERN RICE CULTIVATION IN BHUTAN 37
Field survey
The rice variety assessment was done through a conduct of household sample
survey. The actual survey was carried out by the respective extension staff of
Wangdue and Punakha districts covering each of their 10 major rice growing geogs.
Altogether, the survey captured 580 farming households and collected data on land
use pattern, family income, crop production practices and use of higher yielding
modern rice varieties. However, this paper focused on the study of modern variety
use and spread in Wangdue-Punakha valley. Various studies have shown that
adoption of modern varieties is the key to national food security (Hussain et al.,
2005; Mercedita et al., 2014; Saka and Lowal, 2009; Wang and Pandey, 2012,
Nakano and Kajisa, 2014). Shiferaw et al. (2014) also mentioned that adoption of
HYV varieties of wheat were key to food security which would hold similarity even
for rice.
Figure 1. Map of Bhutan showing the study area, Punakha and Wangdue districts (within bold
boundary) where variety adoption rate was assessed
Data analysis
The overall data collection works were coordinated by the Renewable Natural
Resources Research and Development Centre- Bajo (RNR RDC-Bajo). The duly
completed survey questionnaires from the field were received by the Dzongkhag
Agriculture office and sent to RDC-Bajo where the data analysis was done. The data
recording and compilation was completed in Microsoft Excel. Statistical analysis was
done using IBM SPSS statistical software version 20 and Microsoft Excel.
Study area
38 N. Chhogyel and Y. Bajgai
RESULTS AND DISCUSSION
HH level variety adoption rate
The average modern rice variety adoption rates at household level in Wangdue
and Punakha Dzongkhags were assessed to be 68% and 62%, respectively. This
worked out to a healthy average of 65% for Wangdue-Punakha Valley. However,
there were great variations in household variety adoption rate among the different
rice growing geogs (Table 1). The household variety adoption rates among the geogs
ranged from the low of 36% to high of 100% showing that there is a need to continue
with crop varietal promotion works in a more strategic way so as to reduce the gap
between the two. A couple of geogs like Thedtsho under Wangdue and Baap under
Punakha Dzongkhag recorded HH variety adoption rate of 100%. On the other hand,
few geogs like Kashi and Gase Tsho Gom under Wangdeue, and Toewang and
Toebsa under Punakha Dzongkhags had comparatively low HH variety adoption
rates (below 50%). Such variations could be attributed to the difference in farmers’
preference and social settings. Variety adoption rates are determined by many factors
such as the nature of land endowment and farmers preference to a specific quality
trait (Pandey et al., 2012). The variations could also be attributed to the department’s
variations in levels of support among the geogs and Dzongkhags. Under the rice
commercialization program of the department, more focus was given to potential
geogs with large rice areas. Nevertheless, the overall variety adoption rate was quite
commendable and the credit goes to the Department’s vigorous promotion of
improved varieties in the last few years (DoA, 2012, RDC-Bajo, 2013, Chhogyel et
al., 2014). The improved varieties adopted by the farmers included mid-altitude
varieties like IR-64, Bajo Maap 1, Bajo Maap 2, Bajo Kaap 1, Bajo Kaap2, and a
high altitude variety Khangma Maap. As the Department continues with rice
commercialization program, the spread of improved varieties is going to increase in
the near future increasing rice yield in the valley. One of the strategies of sustainable
rice production for improving food security status is farmers’ adoption of modern
varieties (FAO, 2014).
Variety adoption rate in terms of area
Area under modern varieties, more or less followed the trends in variety
adoption rate at household level. The average modern rice adoption rate in terms of
acreage for Wangdue-Punakha valley was satisfactory, at 56%. The area under
modern varieties in Wangdue was 54.5 % while it was 56.7% for Punakha
Dzongkhag indicating that the variety adoption rates in the two dzongkhags were
about similar. Ghimiray (2012) reported that the area under improved varieties in
Bhutan was 42% which was almost 33% lower than what was recorded in the current
study. It was also reported that the area under modern rice varieties in the mid-
altitude zones of Bhutan which also includes Wangdue-Punakha valley was about
37.5% (Shrestha, 2004). This indicated that the Department’s rice commercialization
program which promoted 44.50 t seeds comprising of six different improved varieties
MODERN RICE CULTIVATION IN BHUTAN 39
over three years was effective in spread of varieties across all the major rice growing
geogs of the valley (Chhogyel et al., 2014). Over the years, the variety adoption rate
has increased manifold portraying that the farmers are having increased surplus rice
for sale in the market. One case in point which requires to be seriously viewed is to
look at individual geogs and carry out need- based support programs. This is to raise
the economic status of the backward geogs. According to Table 2, the geogs like
Baap (Punakha) and Thedtsho (Wangdue) had 96% and 94% of the rice area under
improved varieties, respectively. These geogs also recorded cent percent adoption
rate in terms of households. There were also geogs, whose area under modern
varieties registered as low as 36% (Toewang) under Punakha and 40% (Gasetsho
Gom and Nahi) under Wangdue Dzongkhag. Thus, there is a need to bring all the
geogs at same level through major shift in target areas and improved channeling of
resources. Table 3 shows paddy production from the ten major rice growing geogs of
Wangdue-Punakha valley as per the records maintained with the RNR RDC-Bajo.
Among the varietal coverage in terms of area, the most popular and widely
spread variety was IR-64 followed by Khangma Maap and Bajo Maap (Figure 2).
Earlier studies by Ghimirey (2012) and Shrestha (2004) have also reported that IR-64
was widely grown in the mid-altitude zone of Wangdue-Punakha valley. Records
show that IR-64 rice variety in Bhutan was released in 1989 (Ghimiray, 2008). Since
then, it has started to make inroad to other agro-ecological zones of the country,
maximum being in the mid-altitude regions of Wangdue and Punakha valley. IR 64 is
the most widely grown indica rice in South and Southeast Asian countries as it
possesses many positive agronomic characteristics which include high yield
potential, wider adaptability, tolerance to biotic stresses and good eating quality (Wu
et al., 2005). Coverage of IR-64 in Wangdue and Punakha Dzongkhags was 54.7%
and 57%, respectively registering average coverage of about 56% (Figure 2). The
other popular top three improved varieties in the valley were Khangma Maap, Bajo
Maap and Bajo Kaap. The variety IR20913 is also being grown on a small scale as
short duration crop in chilly-rice and rice-rice cropping system. This variety has also
been grown as a potential variety for second crop while the variety No. 11 is being
grown as the first crop in rice-rice cropping system (double cropping) in Wangdue–
Punakha valley (Chhogyel et al., 2014).
To provide wider varietal choices to the farmers, many varieties are at different
stages of evaluation with few being already in the farmers’ field (Chhogyel et al.,
2013). Higher yielding varieties were promoted packaged with other supports such as
need based training of farmers and staff on specific topics (seed selection, fertilizer
application, nursery development, plant protection, etc.) including farm
mechanization through hiring services (DoA, 2012; RNR RDC- Bajo, 2013).
Rice yield and production
Farmers grow both improved and local varieties. On an average, a farmer
grows two kinds of rice, local and improved, or two local varieties annually. The

40 N. Chhogyel and Y. Bajgai
reason as to why the farmers grow more than one variety is to fulfill varied needs
such as for self-consumption, sale, and use for rituals and ceremonies. Being an
important part of their tradition and culture, the farmers have developed special
attachment to their local varieties. It has also been reported that the sale value of the
local varieties were higher and always considered as specialty rice for cash income
and household traditional cultures as well as religious functions. However, in term of
yield performance, the farmers unanimously rated superiority of improved varieties
over their local ones. In both the Dzongkhags, the yields from the improved varieties
were reported to be about 25% to 50% higher as compared to the local varieties. In
Wangdue Dzongkhag, majority of the farmers in geogs like Thetsho, Ruepisa, and
Athang reported yield increase of about 33% over their local varieties. In the same
Dzongkhag, there were also farmers who reported yield increase of 50 % from the
adoption of modern varieties. Likewise, some respondents also reported yield
increase of about 25 % from adoption of improved varieties. Similarly, majority of
the geogs under Punakha Dzongkhag reported yield increase of 25% to 33% from the
adoption of improved varieties and close to about 1-2% of the farmers reported that
the yield increases from the improved varieties were about 50%. Specifically, 3% to
17% of the farmers growing improved varieties in Punakha had reported yield
increase of 50% (Table 4). On the other hand, there were also farmers in geogs like
Chhubu, Dzome, and Toebsa which had less percent of farmers who reported
increased levels of yield. In general, such information corroborated well with the
crop cut based yield reports maintained at RDC-Bajo (Table 5). The yield reports
from crop cuts conducted by the researchers and extension officials have showed that
the yield gains from improved varieties were quite commendable at farmers’ level of
management practices.
As the DoA emphasizes on rice commercialization, variety adoption rate are
targeted to be increased and more vigorous promotion will have to be continued
targeting specific and needy geogs.
Though the improved varieties were seen to be gaining a strong foothold in all
the geogs, the use of local varieties is going to continue for some time. However,
going by the current level of crop promotion program and supply of seeds made to
the farmers, the adoption rate for improved varieties is only going to increase. In the
current project impact study, farmers’ views on the improved varieties were sought
and it was found that the reasons for adopting improved varieties were many. From
the generalized perspective, the following were the major reasons provided by the
farmers:
1. The local varieties are low yielding and they wanted to cultivate improved
varieties in some areas,
2. The local varieties are highly susceptible to diseases and pests and interested
to cultivate both local and improved varieties,

MODERN RICE CULTIVATION IN BHUTAN 41
3. The seeds of the improved varieties were made more freely than the local
varieties, and
4. Technical advice from the extension agents to grow more of improved
varieties citing many advantages over the local ones.
The average yield of local and improved varieties on table 5 shows that
improved varieties yield 31% and 26% higher in Wangdue and Punakha districts,
respectively. For yield increase due to improved varieties over local ones, 80%
households in Wangdue and 91% of households in Punakha reported achieving 25%
and 33% increases together (Table 4). This surveyed finding can be validated by
crop-cut yield data which was greater than or equal to 26% yield increase, on an
average, by improved varieties over local ones. The least number of farmers reported
50% yield increase due to adoption of improved varieties.
CONCLUSION
The study concludes that the geog-wise average farming households adopting
modern rice varieties was 68% in Wangdue and 62% in Punakha districts. The study
found that at least five promoted modern varieties are adopted by farmers. About 55
% of the rice area in the two districts of Wangdue and Punakha are grown to modern
rice varieties. The maximum number of households in both districts reported to have
achieved yield increase of 33% by improved varieties compared with the local ones.
In terms of farmers’ adoption rate of modern rice varieties and area coverage, it is
concluded that there is a major impact of rice development interventions in Punakha-
Wangdue valley to support food security of the farming households as well as for
adding to the national food basket. As the national rice program moves ahead, the
identified locations (e.g. Kashi, Toeb) with low variety adoption rates be targeted
strategically. These farming communities should receive top priority and need-based
interventions such vigorous promotion of HYVs, mechanization, irrigation and other
technical support. This is expected to contribute to adoption of improved
technologies so as to enhance the livelihood of the farmers.
REFERENCES
Chhogyel, N., Ghimiray, M., Dorji, C., Gyem, L., Dema, Y. and Legjay. 2014. Impact of
decentralized rural development project on rice program in Wangdue-Punakha Valley.
Renewable Natural Resources Research and Development Centre-Bajo. Department of
Agriculture, Ministry of Agriculture and Forests. 80p
Chhogyel, N., Gyem, L. and Dorji, C. 2013. Performance evaluation of improved rice
varieties at RDC Bajo. Journal of Renewable Natural Resources of Bhutan, 9: 33-39
Chhogyel, N. Dorji, C. and Bajgai, Y. 2014. Reaping the bounties of growing rice twice a
year: In Sonam Drupdey, fruits of labour. An annual RNR magazine, 4: 27-28
42 N. Chhogyel and Y. Bajgai
DoA. 2013. Annual Report 2011-2012. Agriculture Development Highlights of Department of
Agriculture, Thimphu, Bhutan. Ministry of Agriculture and Forests. Bhutan. 63p
DoA. 2012. Agriculture Statistics. Department of Agriculture, Thimphu, Bhutan. Ministry of
Agriculture and Forests. 123p
FAO. 2014. A regional rice strategy for sustainable food security in Asia and the Pacific.
Food and Agriculture organization of the United nations, Regional Office for Asia and
the Pacific, Bangkok Thailand.38p
Ghimiray, M. 2012. An analysis of rice varietal improvement and adoption rate by farmers in
Bhutan. Council for RNR Research of Bhutan, Ministry of Agriculture and Forests,
Thimphu, Bhutan, 8 (1): 12-14
Ghimiray, M., Dorji, K.D., Katwal, T.B., Penjore, U., Dorji, S., Pem, S., Tenzin, G., Pradhan,
K. 2008. Rice in Bhutan- a resource book. Council for RNR Research of Bhutan.
Ministry of Agriculture, Thimphu, Bhutan. 192p
Hussain, M., Naheri, F. and Shahabuddin. 2005. Food security and nutrition in Bangladesh:
progress and determinants. Electronic Journal of Agricultural and Development
Economics. Agricultural Development Economics, FAO. Bangladesh: 2 (2):103-132
Mercedita, A., Sombilla. and Quilloy, K. 2014. Strengthening the Phuilippine rice seed
system. International Food Policy Research Institute. Washington, USA. Policy note
10.pp.4.
Nakano, Y. and Kajisa, K. 2014. What extent does the adoption of modern variety increase
productivity and income? A case study of the rice sector in Tanzania. An empirical
Analysis of expanding rice production in sub-Sahara Africa. Japan International
Cooperation Agency Working Paper: Paper No. 71. Japan International Cooperation
Agency Research Institute 10-15, Ichigaya Honmura-cho Shinjuku-ku. Japan.
Pandey, S. et al., 2012. Rice in Global Economy: Strategic Research and Policy Issues for
Food Security, Los Banos (Philipines), International Rice Research Institute. 477p.
RDC–Bajo. 2012. Renewable Natural Resources Research and Development Centre-Bajo,
Annual Report 2011-2012. Department of Agriculture. Ministry of Agriculture and
Forests. Wangdue Phordan, Bhutan.
RDC-Bajo. 2013. Renewable Natural Resources Research and Development Centre-Bajo.
Annual Report 2012-2013. Department of Agriculture. Ministry of Agriculture and
Forests. Wangdue Phordang, Bhutan.
Shiferaw, B., Kassie, M., Jaleta, M. and Yirga, C. 2014. Adoption of improved wheat
varieties and impact on household food Security in Ethopia. Food Policy. 44: 272-284
Shrestha, S. 2004. An economic assessment of the the rice research program in Bhutan. Los
Banos (Philippines). International Rice Research Institute. 51p.
Saka, J. O. and Lowa, L. B.O. 2009. Determinants of adoption and productivity of improved
rice varieties in South Western Nigeria. African Journal of Biotechnology. Institute of
Agricultural Research and Training, Moor Plantation, Ibadhan, Nigeria. 19: 4923-4932

MODERN RICE CULTIVATION IN BHUTAN 43
Wang, H., Pandey, S., Velarde, O., Hardy, B., editors. 2012. Patterns of varietal adoption and
economics of rice production in Asia. Los Baños, Philippines: International Rice
Research Institute. 130p.
Wu, J. Li., Wu, C., Lei, C., Baraoidan, M., Bordeos, A., Madamba, M. R., Pamplona, M. R.,
Mauleon, R., Portugal, A., Ulat, V. J., Bruskiwich, R., Wang, G., Leach, J., Kush, G.
and Leung, H. 2005. Chemical and irradiation induced mutants of indica rice IR-64 for
forward and reverse genetics. Plant Molecular Biology, 59: 85-97

44 N. Chhogyel and Y. Bajgai
Table 1. Household level rice variety adoption rate (%) in twenty geogs of Wangdue
and Punakha Dzongkhags
Sl.No Wangdue Punakha
Geogs % HH* Geogs % HH*
1 Athang 62 Baap 100
2 Bjena 63 Chhubu 50
3 Daga 67 Dzomi 59
4 GaseTsho Gom 44 Goenshari 57
5 Kashi 36 Guma 76
6 Nahi 60 Kabjisa 70
7 Nyisho 80 Limbukha 76
8 Phangyuel 85 Shengana 50
9 Ruepisa 78 Toebsa 49
10 Thedtsho 100 Toewang 38
Average % HH 68 62
Std. Deviation 19.09 18.12
N*=significant at 0.05% (Adoption rate between the geogs is significant)
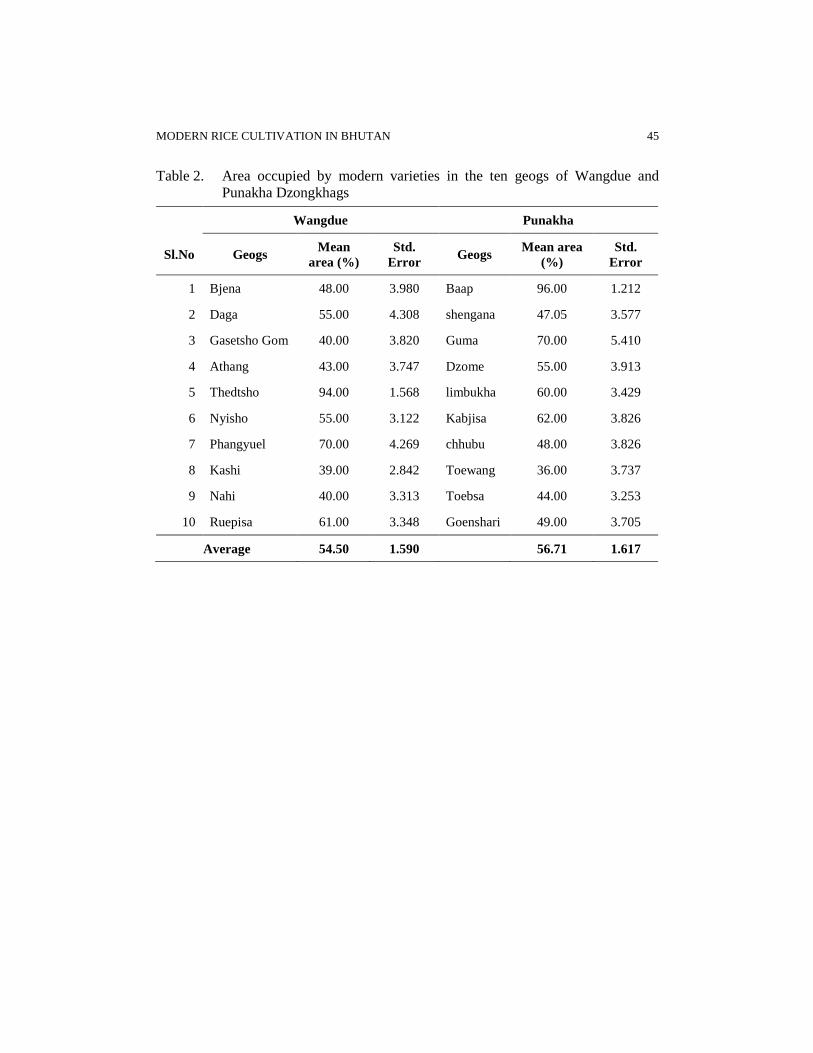
MODERN RICE CULTIVATION IN BHUTAN 45
Table 2. Area occupied by modern varieties in the ten geogs of Wangdue and
Punakha Dzongkhags
Wangdue Punakha
Sl.No Geogs Mean
area (%)
Std.
Error Geogs
Mean area
(%)
Std.
Error
1 Bjena 48.00 3.980 Baap 96.00 1.212
2 Daga 55.00 4.308 shengana 47.05 3.577
3 Gasetsho Gom 40.00 3.820 Guma 70.00 5.410
4 Athang 43.00 3.747 Dzome 55.00 3.913
5 Thedtsho 94.00 1.568 limbukha 60.00 3.429
6 Nyisho 55.00 3.122 Kabjisa 62.00 3.826
7 Phangyuel 70.00 4.269 chhubu 48.00 3.826
8 Kashi 39.00 2.842 Toewang 36.00 3.737
9 Nahi 40.00 3.313 Toebsa 44.00 3.253
10 Ruepisa 61.00 3.348 Goenshari 49.00 3.705
Average 54.50 1.590 56.71 1.617
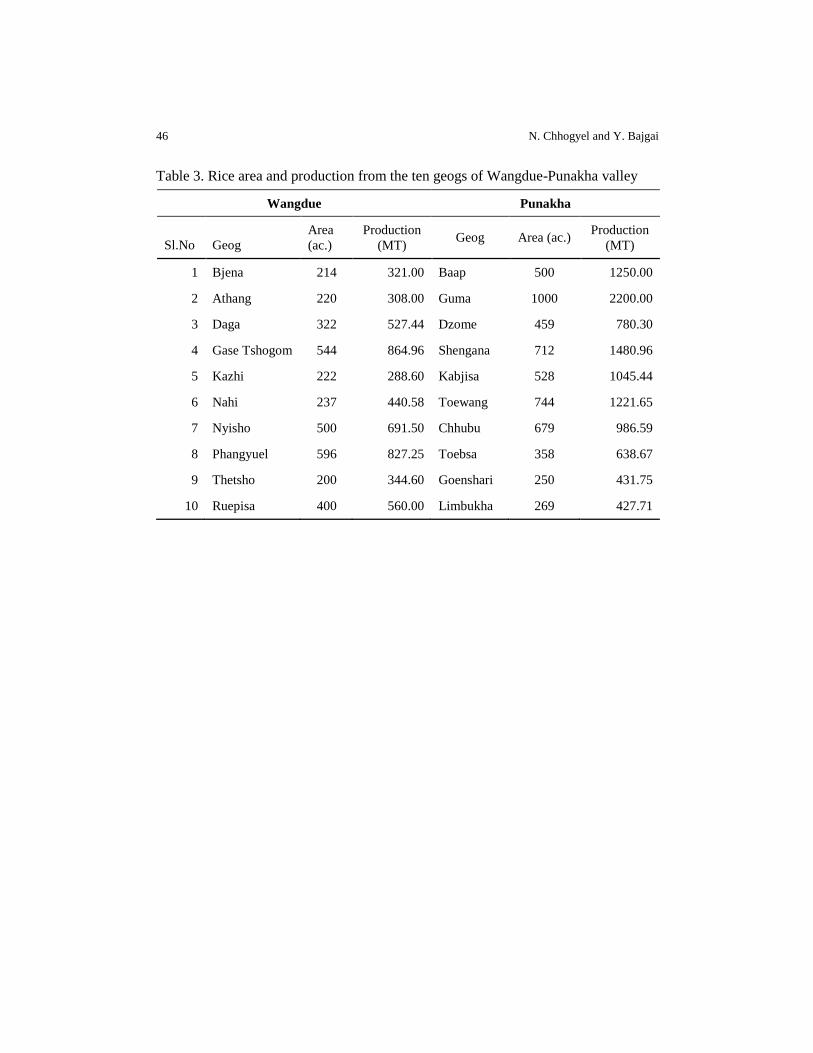
46 N. Chhogyel and Y. Bajgai
Table 3. Rice area and production from the ten geogs of Wangdue-Punakha valley
Wangdue Punakha
Sl.No Geog
Area
(ac.)
Production
(MT) Geog Area (ac.)
Production
(MT)
1 Bjena 214 321.00 Baap 500 1250.00
2 Athang 220 308.00 Guma 1000 2200.00
3 Daga 322 527.44 Dzome 459 780.30
4 Gase Tshogom 544 864.96 Shengana 712 1480.96
5 Kazhi 222 288.60 Kabjisa 528 1045.44
6 Nahi 237 440.58 Toewang 744 1221.65
7 Nyisho 500 691.50 Chhubu 679 986.59
8 Phangyuel 596 827.25 Toebsa 358 638.67
9 Thetsho 200 344.60 Goenshari 250 431.75
10 Ruepisa 400 560.00 Limbukha 269 427.71

MODERN RICE CULTIVATION IN BHUTAN 47
Table 4. Farmers’ view on levels of yield increases from the cultivation of modern
varieties in various geogs of Wangdue and Punakha Dzongkhags
Wangdue Levels of yield increase
Punakha Levels of yield increase
25% 33% 50% 25% 33% 50%
Athang 5 21 4 Baap 12 17 0
Bjena 3 5 0 Chhubu 8 3 3
Daga 5 7 8 Dzomi 2 5 0
Gasetshogom 0 7 3 Goenshari 9 6 0
Kashi 0 5 0 Guma 1 17 0
Nahi 12 4 0 Kabjisa 1 3 2
Nyisho 10 3 6 Limbukha 2 10 3
phangyuel 9 9 4 Shengana 4 2 4
Rubesa 8 10 1 Toebsa 4 7 0
Thetsho 0 20 9 Toewang 0 11 0
Total 52 91 35 43 81 12
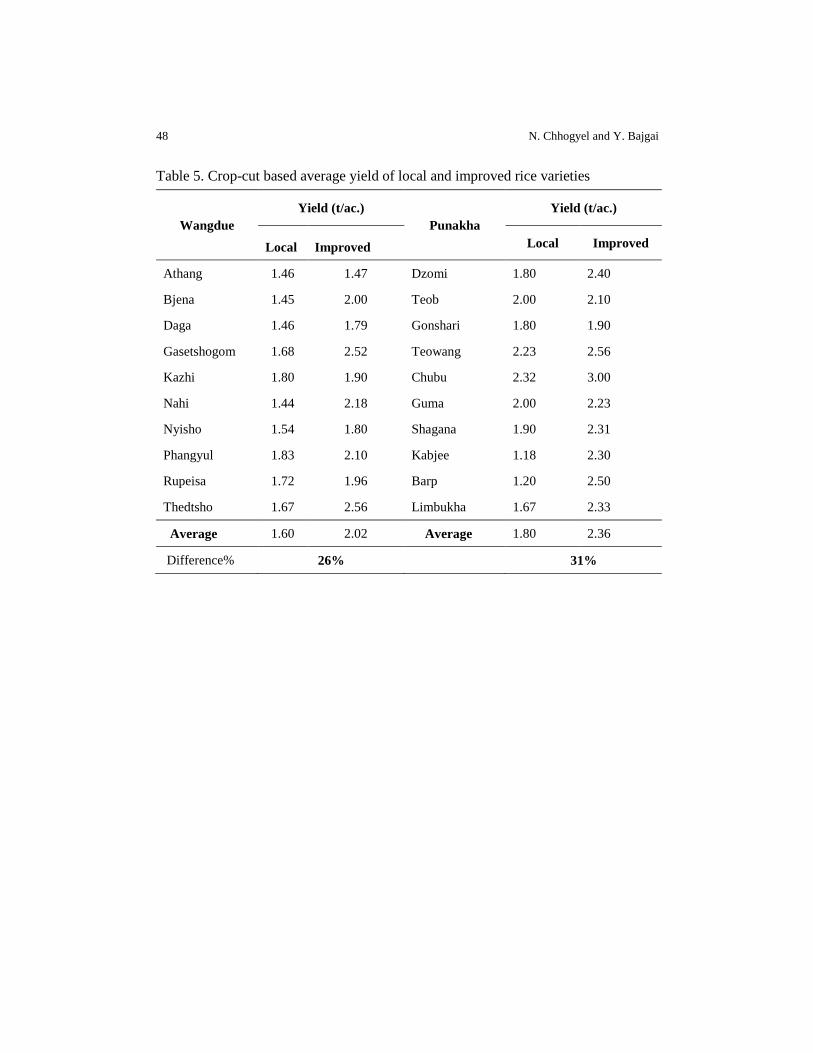
48 N. Chhogyel and Y. Bajgai
Table 5. Crop-cut based average yield of local and improved rice varieties
Wangdue
Yield (t/ac.)
Punakha
Yield (t/ac.)
Local Improved Local Improved
Athang 1.46 1.47 Dzomi 1.80 2.40
Bjena 1.45 2.00 Teob 2.00 2.10
Daga 1.46 1.79 Gonshari 1.80 1.90
Gasetshogom 1.68 2.52 Teowang 2.23 2.56
Kazhi 1.80 1.90 Chubu 2.32 3.00
Nahi 1.44 2.18 Guma 2.00 2.23
Nyisho 1.54 1.80 Shagana 1.90 2.31
Phangyul 1.83 2.10 Kabjee 1.18 2.30
Rupeisa 1.72 1.96 Barp 1.20 2.50
Thedtsho 1.67 2.56 Limbukha 1.67 2.33
Average 1.60 2.02 Average 1.80 2.36
Difference% 26% 31%
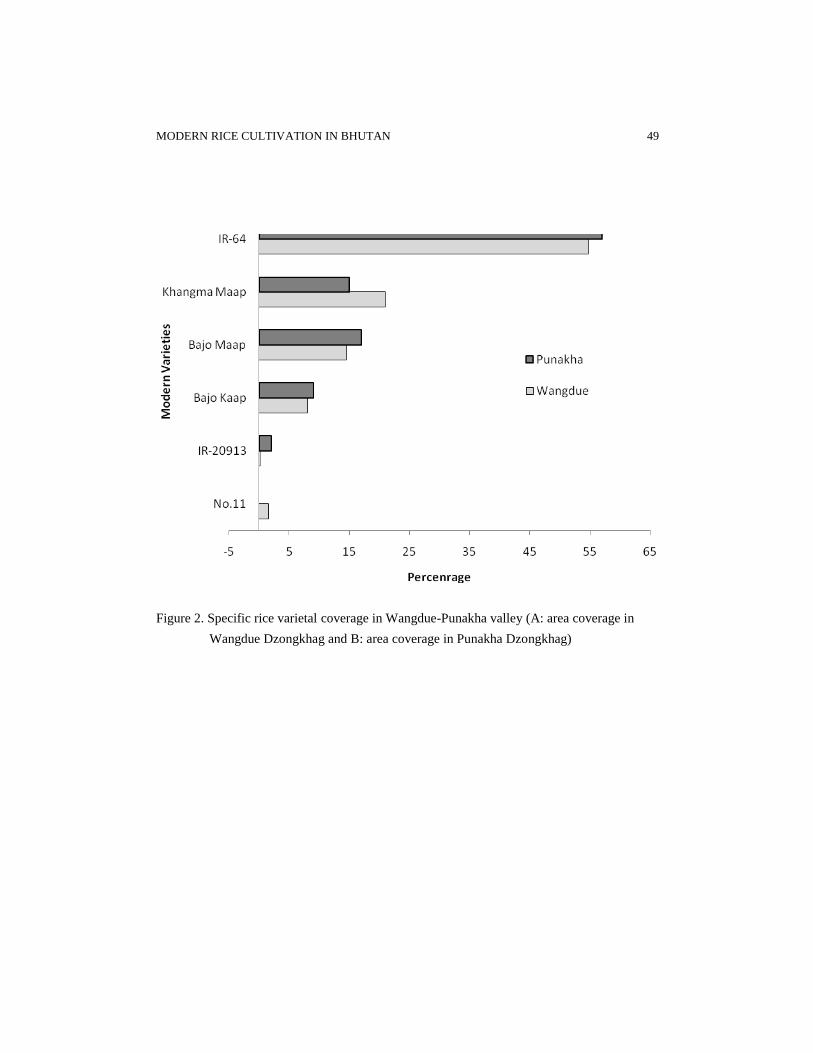
MODERN RICE CULTIVATION IN BHUTAN 49
Figure 2. Specific rice varietal coverage in Wangdue-Punakha valley (A: area coverage in
Wangdue Dzongkhag and B: area coverage in Punakha Dzongkhag)

SAARC J. Agri., 13(2): 50-60 (2015)
OPTIMIZATION OF STERILE MALE RATIO OF
ORIENTAL FRUIT FLY, Bactrocera dorsalis (HENDEL)
A. Zahan*1
, M. A. Latif2, M. A. Hossain
3, S. A. Khan
3 and M. J. Rahman
2
Department of Entomology, Sher-e-Bangla Agricultural University
Sher-e-Bangla Nagar, Dhaka-1207, Bangladesh
ABSTRACT
The study was conducted to establish the Sterile Insect Technique (SIT) method of controlling oriental fruit fly, Bactrocera dorsalis (Hendel). The sterile male ratio of oriental fruit fly was optimized for possible field application of Sterile Insect Technique. Several batches of 5 and 6-day-old pupae were irradiated at 30, 40, 50 and 60 Gray (Gy) to optimize the radiation dose of sterilization. Highest pupal duration and abnormal adults were found after imposing gamma radiation in 5-day-old pupae treated with 60 Gy dose. Radiation significantly increased the nonemergence percentage and decreased the normal emergence of oriental fruit fly. The sterilizing doses were recorded as 60 Gy for 5-day-old pupae. Fixed number of virgin females of oriental fruit flies were allowed to mate with unirradiated and irradiated males at 1:1, 1:2, 1:5 and 1:9 ratios in different cages to find out the rate of suppression against wild population. Minimum pupal recovery and percent normal emergence observed at 1:9 ratio. Deformed and undeveloped (not emerged) population increased with the ratio of irradiated males. The 1:9 ratio was found as the best for suppression of wild population of B. dorsalis.
Keywords: Irradiation, ratio optimization, sterile insect technique (SIT), sterile insect release method (SIRM)
INTRODUCTION
Fruit flies are responsible for taking a heavy toll of various types of fruits and
vegetables. The oriental fruit fly is a very important group of pests for many
countries due to their potential to cause damage in fruits, vegetables and to their
potential to restrict access to international markets for plant products that can host
* Corresponding author email: [email protected] 1 Senior Sector Specialist, Bangladesh Rural Advancement Committee, Dhaka, Bangladesh 2 Department of Agronomy, Sher-e-Bangla Agricultural University, Sher-e-Bangla Nagar, Dhaka-1207, Bangladesh 3 Insect Biotechnology Division (IBD), Institute of Food and Rediation Biology (IFRB), Atomic Energy Research
Establishment (AERE), Savar, Dhaka, Bangladesh
Received: 26.05.2015
MALE RATIO OF FRUIT FLY 51
fruit flies. Flies in the genus Bactrocera are of particular concern in most part of
Asia and Australia, where they constitute a significant threat to agricultural resources
(Kinnear et al., 1998 and Kim et al., 1999). The genus Bactrocera of the family
Tephritidae having more or less 440 species is distributed principally in tropical Asia,
the South Pacific and Australia (White and Elson-Harris, 1994). Eighty seven species
of the genus Bactrocera in India caused heavy damage to fruits and vegetables in
Asia (Nagappan et al., 1971). In Bangladesh oriental fruit fly, Bactrocera dorsalis is
recognized as a destructive pest species where the production of vegetables and fruits
is much less than the requirement (Add ref.). A preliminary survey showed that a
large amount of quality fruits including apricot, banana, mango, guava, papaya,
avocado, citrus, litchi, pineapple, and seasonal vegetables are being lost due to fruit
fly infestation in Bangladesh (Alim et al., 2012). A conservative estimate indicated
that 10 to 15% of crops are destroyed by fruit flies every year (Awal, 2005).
The classical use of pesticides has been well-established as a fully dependable
weapon in crop protection as it causes environmental pollution and health hazards to
the pesticide applicators as well as consumers of agricultural produces. The sterile
insect technique (SIT) has been well-established as a successful method of
controlling key pests of agricultural importance (Snow, 1988 and Vagras, 1989). SIT
is a species specific environmentally safer process and when applied successfully
could eradicate the target pests from a definite area (Dowell and Siddiqui, 2000). The
sterile insect technique is a method of biological control whereby overwhelming
number of sterile insects are released. The released insects are normally male. The
sterile male competes with wild male for pairing with female insects, if female mates
with a sterile male then it will not produce offspring and thus the next generation
population will be reduced. The dosage of radiation applied must have no significant
adverse effect on the male’s longevity, searching behavior and mating ability (Barry
and Morse, 2004). Sterile insects are not self-replicating and therefore cannot be
established in the environment. SIT does not introduce exotic species into an
ecosystem. Considering the above facts in mind, the experiment was undertaken to
optimize the sterile male ratio of oriental fruit fly for suppression of B. dorsalis
population.
MATERIALS AND METHODS
The present study was conducted in the laboratory and experimental field of
Insect Biotechnology Division (IBD), Institute of Food and Radiation Biology
(IFRB), Atomic Energy Research Establishment (AERE), Savar, Dhaka during
January 2012 to February 2013.
Stock culture
About 5,000 adult flies were maintained in steel framed cages (76 66 76
cm) covered with wired net. The flies were supplied with protein based artificial diets
viz., (i) baking yeast: sugar: water at 1:3:4 ratio, and (ii) casein: yeast extract: sugar at
52 A. Zahan et al
1:1:2 ratio. Water was supplied in a conical flask socked with cotton ball.
Temperature (°C) and relative humidity (RH) of the rearing room was maintained at
27 ± 2°C and 75 ± 5%, respectively by using air conditioner (Model No. Movincool
Classic Plus 26, USA).
Pupae collection and irradiation
Eggs were collected and washed with distilled water and sieved with a very
fine screen and then measured volumetrically. Larvae of oriental fruit fly were reared
in the laboratory using artificial standard larval diet and kept in larger bowls
contained 1.5 to 4 cm thick sawdust used for pupation. Sawdust was sieved and
collected pupae were transferred into Petri dishes and irradiated by exposing them to
gamma radiation from a radioactive Cobalt-60 source. To optimize the radiation dose
of sterilization several batches of 5 and 6-day-old pupae were irradiated at 30, 40, 50
and 60 Gy dose.
Sterility dose determination
To determine the sterilizing dose 50 male flies were collected from each of 30,
40, 50 and 60 Gy treated 5-day-old pupae and 50 females were also isolated from
control batch and allowed to mate with individual dose treated males in small rearing
cages. After 4 days of mating, small pieces of banana were placed in each cage as an
oviposition medium. The piece of banana was removed after 24 hours from the adult
cage and placed in a small plastic bowl with sawdust for further larval development.
After subsequent days the total number of pupa and pupal duration were counted and
recorded. This experiment was repeated 5 times. Before adult emergence, 100 pupae
were placed in a Petri dish and allowed to emerge freely in a small screened cage.
After completing emergence fully emerged, not emerged and deformed flies were
counted and the percentage of emerging flies was calculated for each replication. Ten
replicates of 100 pupae from each group (originating from different emergence dates)
were performed.
Male ratio optimization
The male adults of B. dorsalis emerged from 5-day-old pupae irradiated with
60 Gy gamma radiation was segregated into separate cage. The males were allowed
to mate 1:2, 1:5 and 1:9 (normal male: irradiated male) ratios with virgin females in
separate adult cages. Control batches were maintained for the experiment. In field
cage trials, 9-day-old 300 virgin females with corresponding number of irradiated
and unirradiated males were released in the netted area (25 10 12.5 cm) in the
natural environment. A piece of banana (200 g) was placed in cage as oviposition
medium on the 4th day after mating. Ratio between irradiated males and unirradiated
males with unirradiated females was optimized by recording the number of pupal
recovery, normal adult emergence, deformed flies emergence and nonemergence
percentage and compared with each other.
MALE RATIO OF FRUIT FLY 53
Statistical analysis
The recorded data were compiled and tabulated for statistical analysis. Data
was analyzed according to Gomez and Gomez (1984) and mean values were
compared by Least Significant Difference (LSD) test.
RESULTS AND DISCUSSION
Sterility Dose Determination of Male Bactrocera dorsalis
Pupal durations after imposing gamma radiation at different pupal ages are
presented in table 1. In case of 5-day-old pupae, the highest pupal duration was
11.333±1.52 days when irradiated with 60 Gy and the lowest was 8±1 days in control
batch. In case of 6-day-old pupae, the highest pupal duration was 11±1 days when
irradiated with 60 Gy and the lowest was 7.667±0.58 days in control batch. Between
5-day-old and 6-day-old pupae the highest pupal duration was 11.333±1.52 days
when irradiated with 60Gy at 5-day-old pupae.
Normal adult emergence, deformed flies emergence and nonemegence flies
percentage after imposing gamma radiation at 5-day-old pupae were presented in
table 2. The percentage of normal emergence showed that the highest normal
emergence (93.12%) was obtained from the control batch and the lowest (0%) from
the pupae irradiated with 60Gy was which significantly differed from those of other
radiation doses. After imposing gamma radiation abnormalities consisted mainly of
wrinkled wings or wingless that failed to expand upon emergence. The percentage of
deformed flies emergence showed that the highest deformed flies emerged (18.38%)
from the pupae irradiated with 40 Gy which significantly differed from those of other
radiation doses and the lowest deformed flies emerged (1.593%) from the control
batch. The highest percent not emerged flies (94.44%) was found from the pupae
irradiated with 60 Gy which was significantly different from those of other radiation
doses and the lowest deformed flies emerged (5.287%) was found from the control
batch.
Pupal recoveries recorded at different doses of gamma irradiation are presented
in figure 1. The highest number of pupal recovery (984±9.08) was found from 6-day-
old pupae at control. This happned because not a single of oriental fruit fly emerged
from the 5-day-old pupae treated with 60 Gy which was selected as sterilizing dose.
Islam et al. (2012) reported that in case of 5-day-old pupae of fruit fly the sterility
percentage was 100 at 60 Gy. The reasons to have reduced number of pupal recovery
at higher doses are related to the damage of genetic materials (Heather and Hallman,
2008). Significant prolongation of pupal duration following radiation may be due to
hyper stimulation of the mechanism of repair to slightly damaged tissues (Balock et
al., 1963). The sterilizing dose for male B. cucurbitae was reported by Balock et al.
(1963) and Wadud et al. (2005) as 50-60 Gy which is almost similar to our present
findings with B. dorsalis.

54 A. Zahan et al
Optimization of the ratios between irradiated and unirradiated males for
effective field application of SIT
In field cage trials number of pupae produced from different mating ratios of
un-irradiated and irradiated males with the virgin females of Bactrocera dorsalis are
shown in table 3. The results showed that the pupal recovery varied from 1:2, 1:5, 1:9
ratios and control batch. The highest pupal recovery was found at control batch and
the lowest pupal recovery was found in 1:9 ratio. In case of normal emergence
percentage the highest result was found in control and the lowest in 1:9 ratio (Table
4). The result showed that the number of pupal recovery and normal emergence
percentage is inversely correlated with the ratio having high irradiated male oriental
fruit fly i.e. the higher the ratio with irradiated males applied, the lower the number
of pupal recovery normal emergence percentage observed. The result agrees with
Singh et al. (2000) but they worked on melon fruit fly.
Deformed flies percentage and nonemegence percentage of oriental fruit fly
from different mating ratios of un-irradiated and irradiated males with virgin females
of Bactrocera dorsalis in field cage trials are shown in table 5 and 6. The result
showed that the percent deformed flies and nonemegence varied from 1:2, 1:5, 1:9
ratios and control batch. The highest result was observed at 1:9 ratio and the lowest
was found in control. The percent deformed flies and nonemegence at different ratios
differed significantly. The result showed that the deformed flies and nonemegence
percentage are positively correlated with the ratio having high irradiated male fruit
fly i.e. the higher the ratio with irradiated males applied, the higher the percentage of
deformed and not emerged flies observed. This finding has a good agreement with
the result of Islam et al. (2012) where percentage of normal adult emergence,
deformed flies and percent nonemegence of B. tau varied significantly at 1:1, 1:2,
1:5 and 1:9 ratios from control batches. Krishnakumar and Maheswari (2007) studied
the optimization of wild and sterile male ratio for the suppression of red palm weevil,
Rhynchophorus ferrugineus in cotton and reported that the optimal wild to sterile
male ratio was 1:10. Islam et al. (2012) optimized normal versus sterile male ratio of
B. tau and reported that on an average, 534, 235, 118 and 84 pupae were recovered
from 1:1, 1: 2, 1:5 and 1:9 ratios respectively and the pupal recovery from control
group was 3,562. The results agree with that of our present findings though the
species was different. According to above parameters, 1:9 ratio (unirradiated
male:irradiated male) of oriental fruit fly is apparently an effective ratio for releasing
sterilized male fly in nature for possible field application of SIT.
CONCLUSION
Sterile Insect Technique (SIT) of pest control using area-wide releases of
sterile insects was found to be effective in controlling reproduction of oriental fruit
fly in a field population. So, it can be concluded that releasing irradiated males of
Bactrocera dorsalis treated with 60 Gy in nature at 1:9 ratio (unirradiated
MALE RATIO OF FRUIT FLY 55
male:irradiated male) could be the optimum ratio to suppress the wild population of
oriental fruit flies without rendering any adverse impact on agro-ecosystem.
REFERENCES
Alim, M. A., Hossain, M. A., Khan, A., Khan, S. A., Islam, M. S. and Khalequzzaman, M.
2012. Seasonal variations of melon fly, Bactrocera cucurbitae (Coquillett) (Diptera:
Tephritidae) in different agricultural habitats of Bangladesh. ARPN Journal of
Agricultural and Biological Science, 7(11): 905-911
Awal, M. A. 2005. Role of Quarantine in the Impot and Export of the Plants and Plants
products, Proc. First Natl. Seminer on Use of Irradiation for Quarantine treatment of
Fresh fruits and Vegetables. 19 September, 2005. Pp. 5-13. Atomic Energy Centre,
Dhaka
Balock, J. W., Burditt, A. K. and Christenson, L. D. 1963. Effects of gamma radiation on
various stages of three fruit fly species. Journal of Economic Entomology, 59: 42-46
Barry, J. D., Blessinger, T. and Morse, J. G. 2004. Recapture of sterile Mediterranean fruit
flies (Diptera: Tephritidae) in California's preventative release program. Journal of
Economic Entomology, 97(5): 1554- 1562
Dowell, R. V., Siddiqui, I. A., Meyer, F. and Spaugy, E. L. 2000. Mediterranean fruit fly
preventative release programme in southern California, pp. 369–375. In: Tan, K. H.
(ed.). Proceedings: Area-Wide Control of Fruit Flies and Other Insect Pests.
International Conference on Area-Wide Control of Insect Pests, and the 5th
International Symposium on Fruit Flies of Economic Importance, 28 May–5 June
1998, Penang, Malaysia. Penerbit Universiti Sains Malaysia, Pulau Pinang, Malaysia
Gomez, K. A. and Gomez, A. 1984. Statistical procedure for agricultural research, pp. 1-68
Heather, N. H. and Hallman, G. J. 2008. Pest management and phytosanitary trade barriers,
CAB International, Oxfordshire OX108DE, UK, p. 257
Islam, M. Z., Hossain, M. A., Alim, M. A., Khan, M. and Khan, S. A. 2012. Determination of
male sterility dose and optimization of male ratios of Pumpkin fly, Bactrocera tau
(Walker) (Diptera:Tephritidae) in support of sterile insect technique application.
Bangladesh Journal of Entomology, 22(2): 93-101
Kim, T. H., Kim, J. S. and Mun, J. H. 1999. Distribution and bionomics of Bactrocera
(Paradacus) depressa (Shriaki) in Chonbuk province. Korean journal of soil zoology,
4: 26–32
Kinnear, M. W., Bariana, H. S., Sved, J. A. and Frommer, M. 1998. Polymorphic
microsatellite markers for population analysis of a tephritid pest species, Bactrocera
tryoni. Molecular Ecology, 7: 1489–1495
Krishnakumar, R. and Maheswari, P. 2007. Area-wide control of insect pests. Springer
Publisher, The Netherlands, p. 485
Nagappan, K., Kamalnathan, S., Santharaman, T. and Ayyasamy, M. K. 1971. Insecticidal
trials for the control of the melon fruit fly, Dacus cucurbitae Coq. infesting snake
gourd, Trichosanthes anguina. The Madras Agricultural Journal, 58: 688–690

56 A. Zahan et al
Singh, S. V., Mishra, A., Bisan, R. S., Malik, Y. P. and Mishra, A. 2000. Host preference of
red pumpkin beetle, Aulacophora foveicollis and melon fruit fly, Dacus cucurbitae.
Indian Journal of Entomology, 62: 242–246
Snow, J. W. 1988.Radiation Insect and Eradication in North America: An overview from
screw worm to boll worm. IAEA-SM-301/29
Vagras, R. I. 1989. Alternative egg collection system for mass production of the
Mediterranean fruit fly (Diptera: Tephritidae). Journal of Economic Entomology, 77:
1064-1169
Wadud, M. A., Hossain, M. A and Islam, M. S. 2005. Sensitivity of the melon fruit fly, Dacus
cucurbitae. Indian Journal of Entomology, 62: 242-246
White, I. M. and Elson-harris, M. M. 1994. Fruit Flies of Economic Significance: Their
Identification and Bionomics, Commonwealth Agriculture Bureau International, Oxon,
UK. pp. 1–601
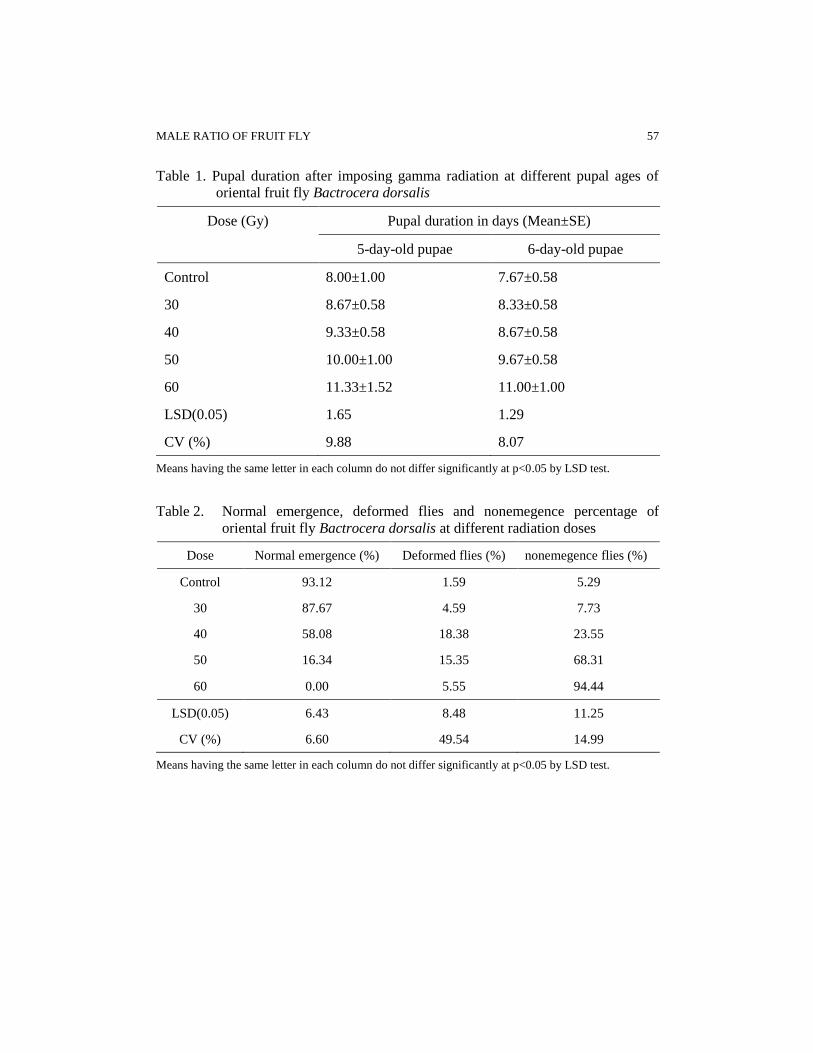
MALE RATIO OF FRUIT FLY 57
Table 1. Pupal duration after imposing gamma radiation at different pupal ages of
oriental fruit fly Bactrocera dorsalis
Dose (Gy) Pupal duration in days (Mean±SE)
5-day-old pupae 6-day-old pupae
Control 8.00±1.00 7.67±0.58
30 8.67±0.58 8.33±0.58
40 9.33±0.58 8.67±0.58
50 10.00±1.00 9.67±0.58
60 11.33±1.52 11.00±1.00
LSD(0.05) 1.65 1.29
CV (%) 9.88 8.07
Means having the same letter in each column do not differ significantly at p<0.05 by LSD test.
Table 2. Normal emergence, deformed flies and nonemegence percentage of
oriental fruit fly Bactrocera dorsalis at different radiation doses
Dose Normal emergence (%) Deformed flies (%) nonemegence flies (%)
Control 93.12 1.59 5.29
30 87.67 4.59 7.73
40 58.08 18.38 23.55
50 16.34 15.35 68.31
60 0.00 5.55 94.44
LSD(0.05) 6.43 8.48 11.25
CV (%) 6.60 49.54 14.99
Means having the same letter in each column do not differ significantly at p<0.05 by LSD test.

58 A. Zahan et al
Table 3. Number of pupae produced from different mating ratios of unirradiated
and irradiated males with the virgin females (300) of oriental fruit fly
Bactrocera dorsalis in field cage trials
Means having the same letter in each column do not differ significantly at p<0.05 by LSD test.
Table 4. Percent normal emergence of oriental fruit fly Bactrocera dorsalis from
different mating ratios in field cage trials
Means having the same letter in each column do not differ significantly at p<0.05 by LSD test.
Ratios
Adult age (days)
14th 15th 16th 17th 18th 19th 20th
Control 857.00±7.55 905.67±5.69 826.00±20.07 871.33±27.06 937.00±18.25 875.33±14.57 902.00±10.00
1:02 660.33±10.02 587.33±11.68 578.67±16.29 658.67±26.31 598.67±22.01 566.00±5.29 653.33±21.73
1:05 230.67±15.14 243.33±4.62 193.00±25.00 217.33±24.66 199.67±37.98 236.33±21.22 185.67±28.04
1:09 44.00±7.21 64.33±22.59 52.67±4.51 67.67±19.01 65.00±9.54 74.00±2.65 47.67±11.59
LSD (0.05) 19.99 24.02 41.44 52.97 53.94 28.42 43.18
CV (%) 2.23 2.67 5.03 5.84 6.00 3.25 4.83
Ratios Adult age (days)
14th 15th 16th 17th 18th 19th 20th
control 99.96 99.93 99.43 99.84 99.71 99.60 99.70
1:02 97.53 96.87 97.31 96.68 96.82 97.55 97.96
1:05 68.42 68.86 51.49 73.50 67.88 72.65 66.45
1:09 52.61 56.54 55.11 59.04 58.54 55.03 54.88
LSD (0.05) 1.02 6.51 29.80 6.62 3.39 5.90 3.42
CV (%) 5.06 4.04 19.67 4.03 2.10 3.64 2.15

MALE RATIO OF FRUIT FLY 59
Table 5. Percent deformed flies of oriental fruit fly Bactrocera dorsalis from
different mating ratios in field cage trials
Means having the same letter in each column do not differ significantly at p<0.05 by LSD test.
Table 6. Percent nonemergence of oriental fruit fly Bactrocera dorsalis from
different mating ratios in field cage trials
Means having the same letter in each column do not differ significantly at p<0.05 by LSD test.
Ratios
Adult age( days)
14th 15th 16th 17th 18th 19th 20th
control 0.00 0.07 0.11 0.15 0.07 0.17 0.03
1:02 0.73 1.04 0.88 1.03 0.92 0.87 1.08
1:05 20.09 18.04 18.32 16.08 21.47 15.85 18.97
1:09 28.75 27.17 29.25 28.64 29.86 26.95 25.84
LSD
(0.05) 2.21 4.20 2.52 5.43 1.71 4.89 2.33
CV (%) 8.94 18.17 10.41 23.68 6.55 22.34 10.18
Ratios
Adult age( days)
14th 15th 14th 17th 14th 19th 14th
control 0.04 0.00 0.45 0.00 0.21 0.10 0.26
1:02 1.72 2.07 1.87 2.27 2.24 1.56 0.94
1:05 12.05 13.08 12.18 12.40 10.62 11.49 14.56
1:09 18.61 16.36 15.63 12.31 11.58 18.01 18.48
LSD(0.05) 2.50 4.07 3.66 5.40 3.52 1.89 3.08
CV (%) 15.43 25.85 24.34 10.08 28.56 12.17 17.99

60 A. Zahan et al
Figure 1. Mean number of pupal recovery of oriental fruit fly, Bactrocera dorsalis irradiated
at different doses (Gy) of gamma radiation

SAARC J. Agri., 13(2):61-79 (2015)
INTEGRATED FARMING AND ITS IMPACT ON
FARMERS’ LIVELIHOOD IN BANGLADESH
M. T. Uddin*1
, M. A. Khan2 and M. M. Islam
3
Department of Agricultural Economics, Bangladesh Agricultural University
Mymensingh-2202, Bangladesh
ABSTRACT
The study was conducted to identify the present status of integrated farming and its impacts on farmers’ livelihood in comparison to mixed farming. Following two stages sampling procedure, a total of 420 farmers (210 for integrated farming and 210 for mixed farming) were selected from seven study areas of six districts on the basis of having intervention from different NARS institutes and without having any intervention from any organization. Descriptive statistics like sum, average, percentage, etc. were derived and calculated for analyzing the socioeconomic data. Propensity score matching (PSM) were applied with Kernel matching and Radius matching methods to evaluate the impact of integrated farming on farmers’ employment creation and income generation. The highest employment duration for male was 152.5 man-days/year for the farming system C-L-P-F-H under integrated farms and for mixed farms, it was 104.5 man-days/year. The average total income of the integrated farms was Tk. 124839 and for mixed farms, it was Tk. 99641. Average calorie intake of food secure households was 2927.83 kcal and 2839.14 kcal for integrated farming and mixed farming which is higher than the national average calorie intake (i.e., 2122 kcal). To assess the livelihood pattern through asset pentagon approach, noteworthy improvement was found based on different capitals of farm households practicing integrated farming in comparison to mixed farming. Finally, based on different problems, a constraint facing index was calculated in order to suggest policy recommendations.
Keywords: Employment, income, integrated farming, livelihood, mixed farming, poverty
* Corresponding author email: [email protected]
1 Professor, Department of Agricultural Economics, Bangladesh Agricultural University, Mymensingh-2202,
Bangladesh 2 Associate Professor, Department of Agricultural Finance, Bangladesh Agricultural University, Mymensingh-2202,
Bangladesh 3 Lecturer, Department of Agricultural Economics, Bangladesh Agricultural University, Mymensingh-2202,
Bangladesh
Received: 26.05.2015

62 M. T. Uddin et al
INTRODUCTION
It is often argued that the future development of Bangladesh depends
particularly on the agriculture sector which is the mainstay of the economy and also
considered as the prominent source of employment for the incremental labour force.
However, farmers’ are engaged in producing field crops and homestead farming like
vegetables and fruit production, fish culture, livestock and poultry rearing along with
some other non-farm activities. These activities are interlinked and together they
constitute integrated farming. Integrated farming is a concept and principle of two or
more farm enterprises in a farm having strong cohesive and interactive relationship
for production and consumption activities and in sharing and utilizing resources
(Hossain et al., 2002). To increase farm income, the adoption of integrated farming is
being encouraged in Bangladesh under various development programmes.
Since there is no scope to increase the area under cultivated land, the only way
to increase employment, farm production and income and thereby to improve
livelihood of the farming community is to increase the productivity of land through
integrated farming. It is a way to supply necessary commodities to the households
and to maximize farm income as well as to maintain environment friendly farming.
The National Agricultural Research Systems and the Bangladesh Agricultural
University have been conducting farming system research and development since
1980s under the umbrella of the Bangladesh Agricultural Research Council and a
compendium of technologies prepared from the research findings and technology
bulletins were prepared for the farmers. But all these studies were intervention
oriented and location specific mainly devoted to technology generation and practice
development. A modest attempt has been made here to review the previous research
studies which are: Sharmin et al. (2012) conducted a study on socioeconomic
analysis of alternative farming systems in improving livelihood security of small
farmers in selected areas of Bangladesh which revealed that small farmers included
more enterprises in farm practices to have better food security, higher income and
improving livelihood. Uddin and Takeya (2006) examined a study on employment
patterns and income generation of farm households in integrated farming of
Bangladesh. The finding implied that integrated farming is important not only for
employment creation, but also for promoting the overall economic condition.
The above review indicates that most of the studies discussed the performance
of the integrated farming along with technical development, farmers’ livelihood
changes, agro-economic practices and production of different crops, livestock,
poultry and fishery. Very little attempts have so far been made to examine the nature,
extent and impact of integrated farming on farm households’ livelihood. Therefore,
the present study makes substantial contribution to the literature in this field. The
overall goal of this research is to identify the present status of integrated farming and
its impact on farmers’ livelihood in comparison to mixed farming in Bangladesh. The
specific objectives of the research were as follows: (i) to identify the present status of

INTEGRATED FARMING AND ITS IMPACT 63
integrated farming in relation to mixed farming; (ii) to assess the impacts of
integrated farming on farmers’ employment creation, income generation, poverty
reduction and livelihood patterns in comparison to mixed farming; and (iii) to suggest
policy options for overcoming constraints and exploring possible opportunities.
MATERIALS AND METHODS
The present study was conducted at farming system research (FSR) sites of
four institutions of Bangladesh. Altogether 420 sample farmers were interviewed for
the study. Firstly, 210 farmers practicing integrated farming under different
institutions from seven selected FSR sites (i.e., 30 farmers from each site) and
secondly, 210 farmers practicing mixed farming from the village after the next one of
each FSR site (i.e., 30 farmers from each village) were selected for data and
information. All possible efforts were made to ensure the collection of reasonably
accurate data from the selected farmers through face-to-face interview on recall basis.
Moreover, focus group discussions (FGD) were conducted in every selected location.
The primary data for one year farming operations (January-December 2013, which
covered three rice crop seasons namely, Aus, Aman and Boro as well as other farm
enterprises such as, livestock rearing, poultry rearing, fish culture and homestead
enterprise) along with non-farm activities were collected. Secondary information
sources in the form of handouts, reports, publications, notifications, etc. having
relevance with this study were also consulted.
Model specification
A combination of descriptive statistics, mathematical and statistical techniques
was used to achieve the objectives. Descriptive statistics like sum, average,
percentage and ratio were calculated to examine the socioeconomic characteristics of
the sample farmers.
Impact evaluation
To evaluate the impact of integrated farming on farmers’ employment creation
and income generation, techniques of propensity score matching (PSM) were applied
with Kernel and Radius matching methods.
Kernel matching method
Kernel matching is simply a Kernel density function. In this method, all of the
observations in the comparison group inside the common support region are used.
Kernel matching method can be written as follows:

64 M. T. Uddin et al
where T is the set of observations that are in the project (treatment group), and
N is the number of treated cases; Yi,1 and Xi,1 are the dependent and independent
variables for the treated case; and are the dependent and independent
variables for the comparison/control case that is within the neighbourhood of
treatment case i, i.e., for which < bw/2; is the number of
comparison cases within the neighbourhood of i; K(•) is a kernel function; and bw is
a bandwidth parameter. In practice, the choices of K (•) and bw are somewhat
arbitrary.
Radius matching method
Radius matching method can be written as follows:
Where, the weights wj are defined as ;
YT = Output of treated individual; and
YC
indicates output of control individual.
Poverty measure
The mathematical representations are as follows:
Zi = Yi/R
Where,
Zi = Food security index for i-th household which takes the value of 1
for food secure and that of 0 for food insecure householdsand, that is
Zi = 1 for Yi is greater than or equal to R; and Zi = 0 for Yi less than R.
Yi = Daily per capita calorie intake of i-th households;
R = Daily per capita calorie required for i-th households; and
i = 1, 2, 3………., 30.
Based on the household food security index (Z), food insecurity gap/ surplus index
(P) and the head count ratio (H) were calculated. Food insecurity gap measures the
extent to which households are food insecure and surplus index measures the extent
by which food secure households exceeded food security line. This index is given as:
P =
Where,
P = Food insecurity gap or surplus index;
M = Number of households that are food secure (for surplus index) or

INTEGRATED FARMING AND ITS IMPACT 65
food insecure (for food insecurity gap); and
Gi = Per capita calorie intake deficiency (or surplus) faced by i-th
household.
Gi =
The head count ratio (H) measures the percentage of the population of households
that are food secure or insecure. This is defined as:
H =
Where,
H = head count ratio;
M = Number of households that are food secure (for surplus index) or
food insecure (for food insecurity gap); and
N = Number of households in the sample.
Constraint facing index
An overall constraints score in integrated and mixed farming was computed for each
farmer by adding their constraint scores in all 15 constraint items. The possible range
of constraints facing score for each constraint could be 0 to 3 and possible range of
overall constraints facing for score for 15 constraints could range from 0 to 45. A
constraint facing index (CIF) for each 15 selected constraints was computed by using
the following formula:
CFI = (Ch × 3) + (Cm × 2) + (Cl × 1) + (Cn X 0)
Where,
Ch= Number of responses indicating high constraint;
Cm= Number of responses indicating medium constraint;
Cl = Number of responses indicating low constraint; and
Cn= Number of responses indicating no constraint.
Constraint facing index (CFI) for any of the selected constraint could range from 0 to
495 for integrated farming, where, 0 indicated no constraint facing and 495 indicated
highest constraint facing and 0 to 477 for mixed farming, where, 0 indicated no
constraint facing and 477 indicated highest constraint facing.
RESULTS AND DISCUSSION
Socioeconomic Characteristics and Status of Integrated and Mixed Farming
To identify the status of integrated farming in relation to mixed farming, it is
essential to know the socioeconomic characteristics of the sample farmers. This part
provides information on socioeconomic characteristics of selected farm households
66 M. T. Uddin et al
such as area and number of farm enterprises and educational attainment for the
members of selected households.
Distribution of sample farm households
Fourteen types of farming systems were found in the research sites among
which five farming systems were common in both integrated farming and mixed
farming (Table 1). These farming systems were: crop–livestock–poultry–fish–
homestead, crop–livestock–poultry–homestead, crop–livestock–fish–homestead,
crop–poultry–fish–homestead, and crop–livestock–homestead. As most of the
farmers were practicing these five types of farming systems, these are considered as
major farming systems. Remaining nine types of farming systems are treated as
minor farming systems. From the table 1, it is found that crop–livestock–poultry–
homestead farming system was the most popular in both integrated farming and
mixed farming systems and their percentage were 37.1 and 27.6, respectively. This
result is supported by Islam et al. (2012) where the authors found that C-L-P-FC, C-
L-FC-LS, FC-LS-C-L, C-L-FC, C-LP were the major farming systems in Dingapota
haor area of Netrokona district.
Area and number of farm enterprises of sample farm households
Agricultural enterprises cultivated by the farm households are shown in Table 2
which includes both major and minor categories of farming systems. The average
crop area under integrated and mixed farm was 0.43 ha and 0.50 ha for major farming
systems and 0.38 ha and 0.45 ha for minor farming systems, respectively. The
number of livestock and poultry bird was higher in integrated farm than in mixed
farm. The results also supported by Ahmed et al. (2011). The researchers found that
the highest average farm size was 0.33 ha in integrated farming followed by rice
monoculture 0.31 ha and alternate farming 0.29 ha.
Educational status of sample farm households
All sample farmers were divided into five categories i.e., illiterate, primary,
secondary, higher secondary and graduation and above education. It was evident that
18.2 percent integrated farms and 23.3 percent mixed farms were illiterate. A
majority of the sample farmers (38.2 percent and 42.1 percent for integrated farms
and mixed farms, respectively) had only primary level of education. A negligible
portion of members had higher secondary and graduation and above.
Incentives provided by different institutes to FSR sites
It was found from the study areas that farmers under integrated farming got
different types of facilities from the NARS institutes namely, Bangladesh
Agricultural Research Institute, Bangladesh Rice Research Institute, Bangladesh
Sugarcane Research Institute, etc. This facility included cash incentives and kind
incentives. Cash incentives included free crop and vegetables seed, fertilizer, chick,
fingerlings, lime and medicine, fruit plants, etc. and kind incentives included training,
monitoring, motivation and veterinary services. On an average, integrated farms
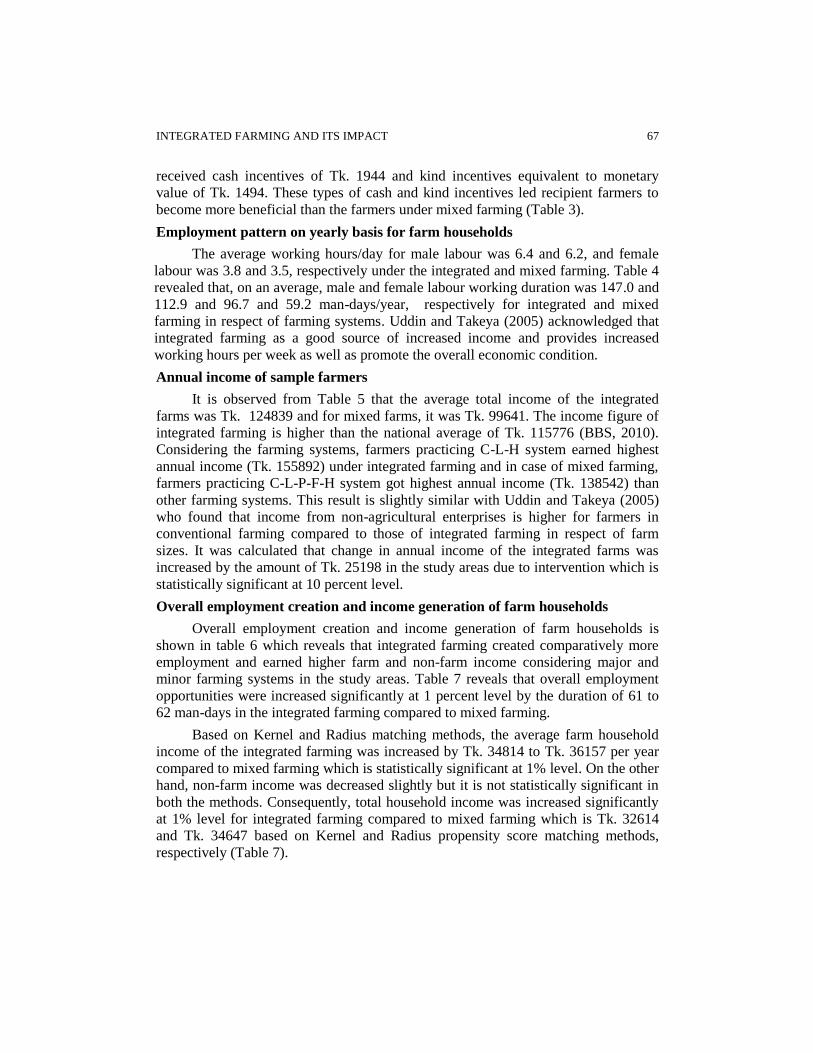
INTEGRATED FARMING AND ITS IMPACT 67
received cash incentives of Tk. 1944 and kind incentives equivalent to monetary
value of Tk. 1494. These types of cash and kind incentives led recipient farmers to
become more beneficial than the farmers under mixed farming (Table 3).
Employment pattern on yearly basis for farm households
The average working hours/day for male labour was 6.4 and 6.2, and female
labour was 3.8 and 3.5, respectively under the integrated and mixed farming. Table 4
revealed that, on an average, male and female labour working duration was 147.0 and
112.9 and 96.7 and 59.2 man-days/year, respectively for integrated and mixed
farming in respect of farming systems. Uddin and Takeya (2005) acknowledged that
integrated farming as a good source of increased income and provides increased
working hours per week as well as promote the overall economic condition.
Annual income of sample farmers
It is observed from Table 5 that the average total income of the integrated
farms was Tk. 124839 and for mixed farms, it was Tk. 99641. The income figure of
integrated farming is higher than the national average of Tk. 115776 (BBS, 2010).
Considering the farming systems, farmers practicing C-L-H system earned highest
annual income (Tk. 155892) under integrated farming and in case of mixed farming,
farmers practicing C-L-P-F-H system got highest annual income (Tk. 138542) than
other farming systems. This result is slightly similar with Uddin and Takeya (2005)
who found that income from non-agricultural enterprises is higher for farmers in
conventional farming compared to those of integrated farming in respect of farm
sizes. It was calculated that change in annual income of the integrated farms was
increased by the amount of Tk. 25198 in the study areas due to intervention which is
statistically significant at 10 percent level.
Overall employment creation and income generation of farm households
Overall employment creation and income generation of farm households is
shown in table 6 which reveals that integrated farming created comparatively more
employment and earned higher farm and non-farm income considering major and
minor farming systems in the study areas. Table 7 reveals that overall employment
opportunities were increased significantly at 1 percent level by the duration of 61 to
62 man-days in the integrated farming compared to mixed farming.
Based on Kernel and Radius matching methods, the average farm household
income of the integrated farming was increased by Tk. 34814 to Tk. 36157 per year
compared to mixed farming which is statistically significant at 1% level. On the other
hand, non-farm income was decreased slightly but it is not statistically significant in
both the methods. Consequently, total household income was increased significantly
at 1% level for integrated farming compared to mixed farming which is Tk. 32614
and Tk. 34647 based on Kernel and Radius propensity score matching methods,
respectively (Table 7).

68 M. T. Uddin et al
Poverty situation of the sample households
The food security index for integrated farm households was 1.12 and for mixed
farm households, it was 0.92; the value of this index for food secure households was
1.37 for integrated farming and for mixed farming, it was 1.33 whereas for food
insecure households, it was 0.90 and 0.92, respectively. Both the integrated and
mixed farm households in the study areas could be regarded as food secure given the
fact that 89.0 percent integrated farms and 78.0 percent mixed farms of the sample
households were able to meet the required calorie intake of 2,122 kcal per capita per
day while 11.0 percent and 22.0 percent as food insecure households, respectively
(Table 8). Average calorie intake of food secure households was 2927.83 kcal and
2839.14 kcal for integrated farming and mixed farming which is higher than the
national average calorie intake (i.e., 2122 kcal). The food insecurity gap/surplus
index shows that the food secure households exceeded the food poverty line by 6.0
percent for integrated farming and 10.0 percent for mixed farming, while food
insecure households fell short of required calorie intake by 8.0 percent and 7.0
percent, respectively. Ahmed et al. (2011) found that integrated rice-fish farming can
play an important role in increasing food production, as the integrated farming
system is better than rice monoculture in terms of resource utilization, diversity,
productivity and both the quality and quantity of the food produced.
Livelihood patterns of farm households
A livelihood comprises the capabilities, assets (stores, resources, claims and
access) and activities required for a means of living: a livelihood is sustainable which
can cope with and recover from stresses and shocks, maintain or enhance it
capabilities and assets and provide sustainable livelihood opportunities for the next
generation and which contributes net benefits to other livelihoods at the local and
global levels in the long and short term (Chambers et al., 1992).
The asset pentagon approach shows that there is a noteworthy improvement
based on different capitals (namely, human capital, social capital, natural capital,
physical capital and financial capital) of farm households practicing integrated
farming in comparison to mixed farming (Table 9).
Human capital: Table 9 represents the changing nature of different
components of human capital in farmers’ livelihoods. Majority of the farmers under
integrated farming reported that quality of the components of human capital has
increased over the periods through gaining education and knowledge, improving
health condition, more access to information, better training and development of skill
in all the selected areas.
Social capital: In this study, involvement in social group, political
involvement, self-managerial capability and social access were considered as the
components of social capital. Table 9 shows the positive trends of social assets in the
integrated farm households. Almost all the farmers’ involvements in different social

INTEGRATED FARMING AND ITS IMPACT 69
groups, their managerial capacity through integrated farming had improved.
Natural capital: Cultivable land, using open water resources and forests were
addressed to determine the changing natural capital aspect. Quantity of cultivable
land had increased in integrated farm households whereas in mixed farm households,
it fluctuated over time. Access to open water resources also showed increasing trend
in integrated farmers. Majority of the farm households had constant access to
different types of natural capital.
Financial capital: Table 9 shows the changing trend of financial capital of the
integrated farm households. Cash in hand, savings and liquid assets had increased for
the integrated farm households. However, the rate of increase was not estimated.
Farmers’ income had increased and they were able to have more cash savings and
liquid assets through integrated farming. Remittances and donation were constant for
the integrated farm households.
Physical capital: The changing state of physical assets has been shown in table
9. Almost all the asset category showed positive trends in the integrated farm
households. In all of the farming systems, most of the farmers had tin roofed houses.
Percentages of respondents having decreased trend of straw roof houses increased
gradually with time. Likely, percentages of farm households having tube-well, pucca
and kacha toilet increased significantly in all the research sites. Maximum
respondents were found to have electricity facilities.
Constraint facing index (CFI)
The computed CFI of the 15 constraints ranged from 70 to 276 for integrated
farming and 130 to 334 for mixed farming. Majority of the farmers mentioned that
low price of outputs, non-availability and high price of HYV seed and scarcity of
concentrate feed and fodder arethe serious problems in the study areas and the
computed value of CFI was 276, 264 and 235 for integrated farming and for mixed
farming these were, 334, 295, and 28, respectively. The extent of high price of
fertilizers and pesticides and non-availability and high price of fingerlings are also
more remarkable problems for mixed farming than the integrated farming. Due to
lack of education and training facilities, farmers were using traditional method of
cultivation and getting lower yield. The high price of irrigation was another problem
of cultivating different crops. This problem arises mainly due to high price of
electricity.
Non-farm employment opportunity has been created to a large extent and
labourers in the study areas migrated from agriculture farming to non-farm activities
for higher income. Therefore, the scarcity of labour along with their higher wage rate
is found to a large extent in mixed farming compared to integrated farming in
different cropping seasons that ultimately hamper the whole process of cultivation.
To prevent certain diseases and to run livestock and poultry production smoothly,
farmers required medicine and vaccine timely.

70 M. T. Uddin et al
CONCLUSIONS AND POLICY RECOMMENDATIONS
The study reveals that crop–livestock–poultry–homestead farming system was
the most popular in both integrated and mixed farming systems. The study also
concludes that integrated farming has the potential of increasing farmers’ income and
employment creation over the mixed and traditional farming practices in the study
areas. The study also reveals that the extent of food security situation was much better
among the integrated farm households than the mixed farm households. Poverty was
decreased in case of integrated farming compared to mixed farming. Worth
mentioning improvements were found based on different capitals (namely, human
capital, social capital, natural capital, physical capital and financial capital) of farm
households practicing integrated farming in comparison to mixed farming.
Considering the findings of the study, some important policy recommendations have
been arisen which are: special incentives from Department of Agricultural Extension
(DAE) on irrigation and fertilizer for small and marginal farmers are necessary to
enhance the productivity and profitability. Department of Fisheries (DoF) should
monitor seed and feed company/hatchery to ensure good quality fingerlings; and
veterinary services for dairy cattle and poultry birds should be ensured by Department
of Livestock Services (DLS) timely at village level. Training program on production
technologies, harvesting, processing, storage and transportation should be offered by
different institutes for increasing skill of the farmers so that they can obtain and apply
knowledge for field crops, livestock production and fish culture as well.
REFERENCES
Ahmed, N. and Garnett, S. T. 2011. Integrated rice-fish farming in Bangladesh: meeting the
challenges of food security. Food Security, Original Paper, Springer, 3 (1), Pp. 81-92
BBS, 2010. Statistical Yearbook of Bangladesh, Bangladesh Bureau of Statistics, Statistics
Division, Ministry of Planning, Government of the People’s Republic of Bangladesh,
Dhaka
Chambers, R. and Conway, G. 1992. Sustainable rural livelihoods: practical concepts for the
21st century. Discussion paper 296, Institute of Development Studies, Brighton, UK:
IDS
Hossain, S. M. A., Ahmed, S., Halim, A., Talukder, M. S., Islam, M. S. and Bhuiya, M. S. U.,
2002. Fact searching and intervention 1999-2001. Studies on integrated farming. FSES
Publication No. 78. Farming Systems and Environmental Studies, Bangladesh
Agricultural University, Mymensingh
Islam, S., Uddin, M. T., Akteruzzaman, M., Rahaman, M. and Haque, M. A., 2011.
Profitability of alternate farming systems in Dighapota haor area of Netrokona district.
Progressive Agriculture, 22 (1&2) Pp. 223-239
Mahmud, H., 1998. A comparative analysis of rice-cum-fish-prawn and fish-cum prawn
culture in some selected areas under sadarthana of Gopalgong district. M.S. Thesis,
Department of Agricultural Economics, Bangladesh Agricultural University,
Mymensingh

INTEGRATED FARMING AND ITS IMPACT 71
Sharmi, S., Islam, M. S. and Hasan, M. K., 2012. Socioeconomic analysis of alternative
farming systems in improving livelihood security of small farmers’ in selected areas of
Bangladesh. The Agriculturists, 10 (1) Pp. 51-63
Uddin, M. T. and Takeya, H., 2005. Economic analysis of integrated farming by agricultural
enterprise in Mymensingh district of Bangladesh. Journal of Rural Development
Studies, 16 (1) Pp. 40-49
Uddin, M. T. and Takeya, H., 2006. Comparative study on integrated farming in Bangladesh
and other countries. Bangladesh Journal of Agricultural Economics, 29 (1&2) Pp. 81-
92
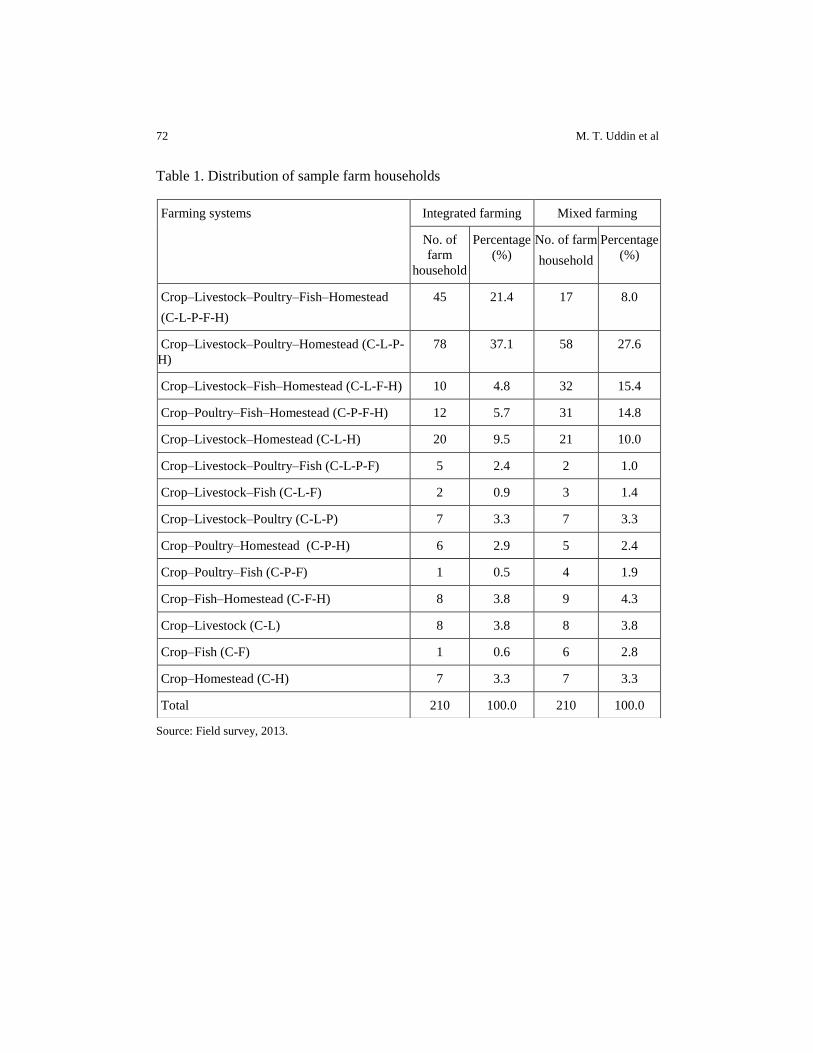
72 M. T. Uddin et al
Table 1. Distribution of sample farm households
Source: Field survey, 2013.
Farming systems Integrated farming Mixed farming
No. of
farm
household
Percentage
(%)
No. of farm
household
Percentage
(%)
Crop–Livestock–Poultry–Fish–Homestead
(C-L-P-F-H)
45 21.4 17 8.0
Crop–Livestock–Poultry–Homestead (C-L-P-
H)
78 37.1 58 27.6
Crop–Livestock–Fish–Homestead (C-L-F-H) 10 4.8 32 15.4
Crop–Poultry–Fish–Homestead (C-P-F-H) 12 5.7 31 14.8
Crop–Livestock–Homestead (C-L-H) 20 9.5 21 10.0
Crop–Livestock–Poultry–Fish (C-L-P-F) 5 2.4 2 1.0
Crop–Livestock–Fish (C-L-F) 2 0.9 3 1.4
Crop–Livestock–Poultry (C-L-P) 7 3.3 7 3.3
Crop–Poultry–Homestead (C-P-H) 6 2.9 5 2.4
Crop–Poultry–Fish (C-P-F) 1 0.5 4 1.9
Crop–Fish–Homestead (C-F-H) 8 3.8 9 4.3
Crop–Livestock (C-L) 8 3.8 8 3.8
Crop–Fish (C-F) 1 0.6 6 2.8
Crop–Homestead (C-H) 7 3.3 7 3.3
Total 210 100.0 210 100.0
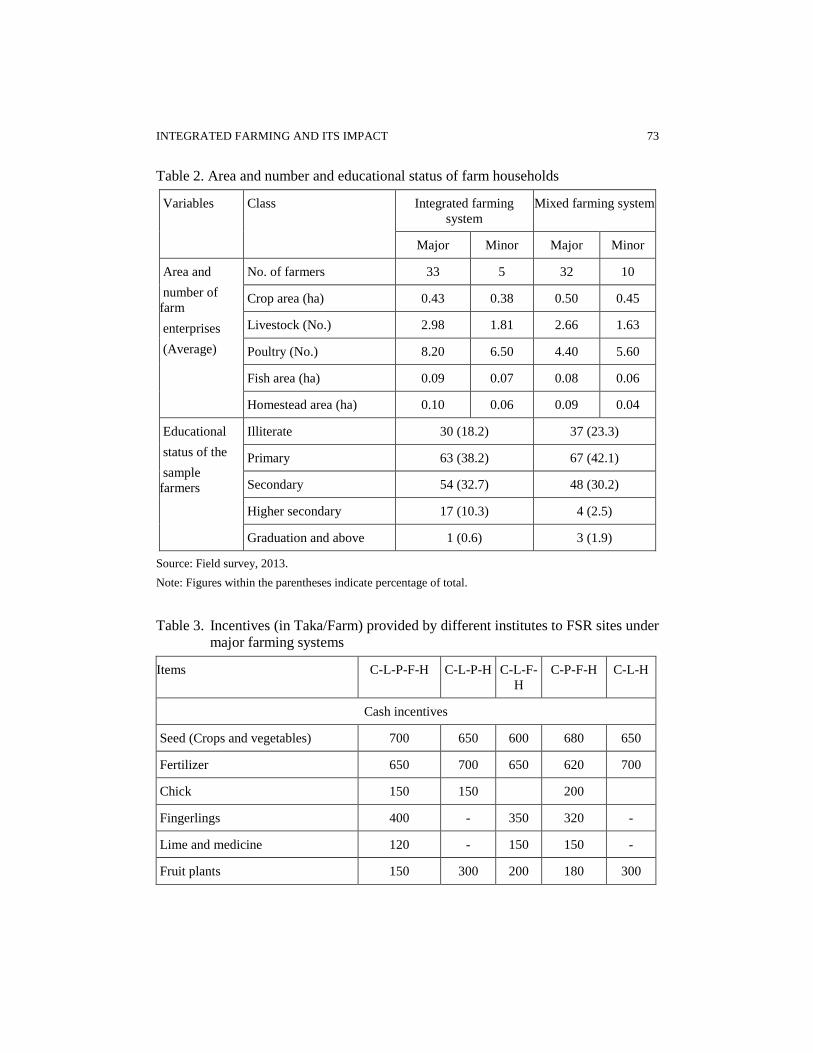
INTEGRATED FARMING AND ITS IMPACT 73
Table 2. Area and number and educational status of farm households
Variables Class Integrated farming
system
Mixed farming system
Major Minor Major Minor
Area and
number of
farm
enterprises
(Average)
No. of farmers 33 5 32 10
Crop area (ha) 0.43 0.38 0.50 0.45
Livestock (No.) 2.98 1.81 2.66 1.63
Poultry (No.) 8.20 6.50 4.40 5.60
Fish area (ha) 0.09 0.07 0.08 0.06
Homestead area (ha) 0.10 0.06 0.09 0.04
Educational
status of the
sample
farmers
Illiterate 30 (18.2) 37 (23.3)
Primary 63 (38.2) 67 (42.1)
Secondary 54 (32.7) 48 (30.2)
Higher secondary 17 (10.3) 4 (2.5)
Graduation and above 1 (0.6) 3 (1.9)
Source: Field survey, 2013.
Note: Figures within the parentheses indicate percentage of total.
Table 3. Incentives (in Taka/Farm) provided by different institutes to FSR sites under
major farming systems
Items C-L-P-F-H C-L-P-H C-L-F-
H
C-P-F-H C-L-H
Cash incentives
Seed (Crops and vegetables) 700 650 600 680 650
Fertilizer 650 700 650 620 700
Chick 150 150 200
Fingerlings 400 - 350 320 -
Lime and medicine 120 - 150 150 -
Fruit plants 150 300 200 180 300
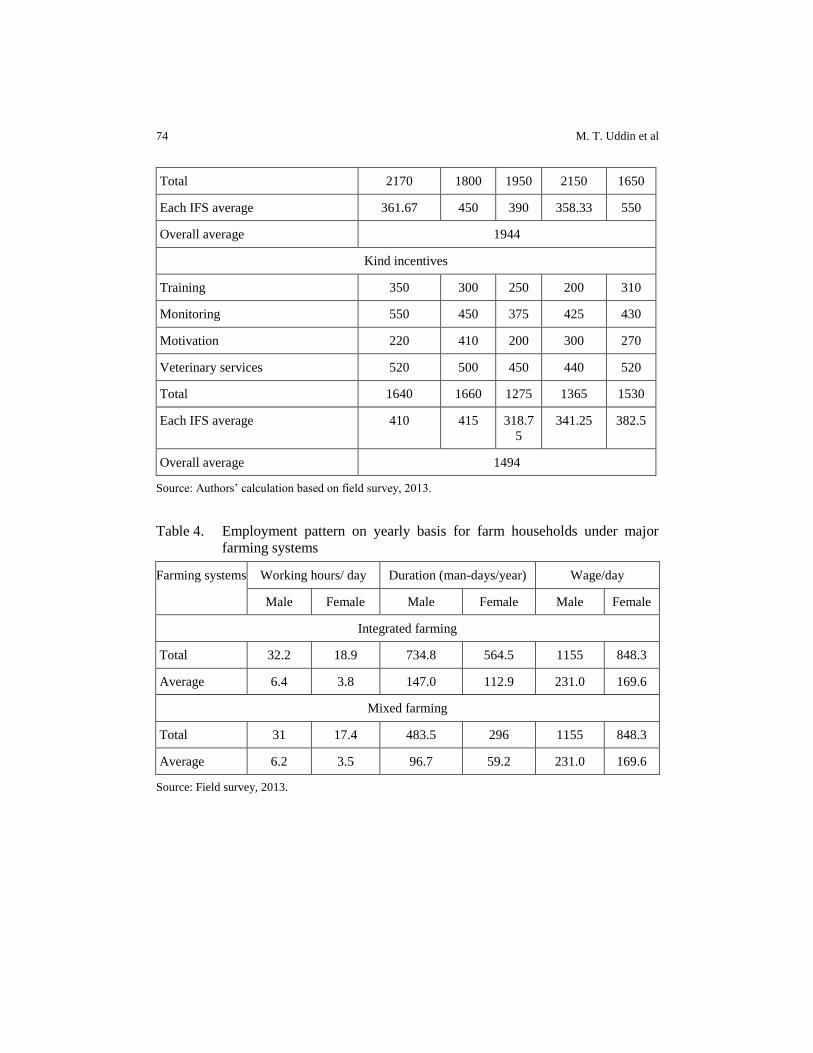
74 M. T. Uddin et al
Total 2170 1800 1950 2150 1650
Each IFS average 361.67 450 390 358.33 550
Overall average 1944
Kind incentives
Training 350 300 250 200 310
Monitoring 550 450 375 425 430
Motivation 220 410 200 300 270
Veterinary services 520 500 450 440 520
Total 1640 1660 1275 1365 1530
Each IFS average 410 415 318.7
5
341.25 382.5
Overall average 1494
Source: Authors’ calculation based on field survey, 2013.
Table 4. Employment pattern on yearly basis for farm households under major
farming systems
Farming systems Working hours/ day Duration (man-days/year) Wage/day
Male Female Male Female Male Female
Integrated farming
Total 32.2 18.9 734.8 564.5 1155 848.3
Average 6.4 3.8 147.0 112.9 231.0 169.6
Mixed farming
Total 31 17.4 483.5 296 1155 848.3
Average 6.2 3.5 96.7 59.2 231.0 169.6
Source: Field survey, 2013.
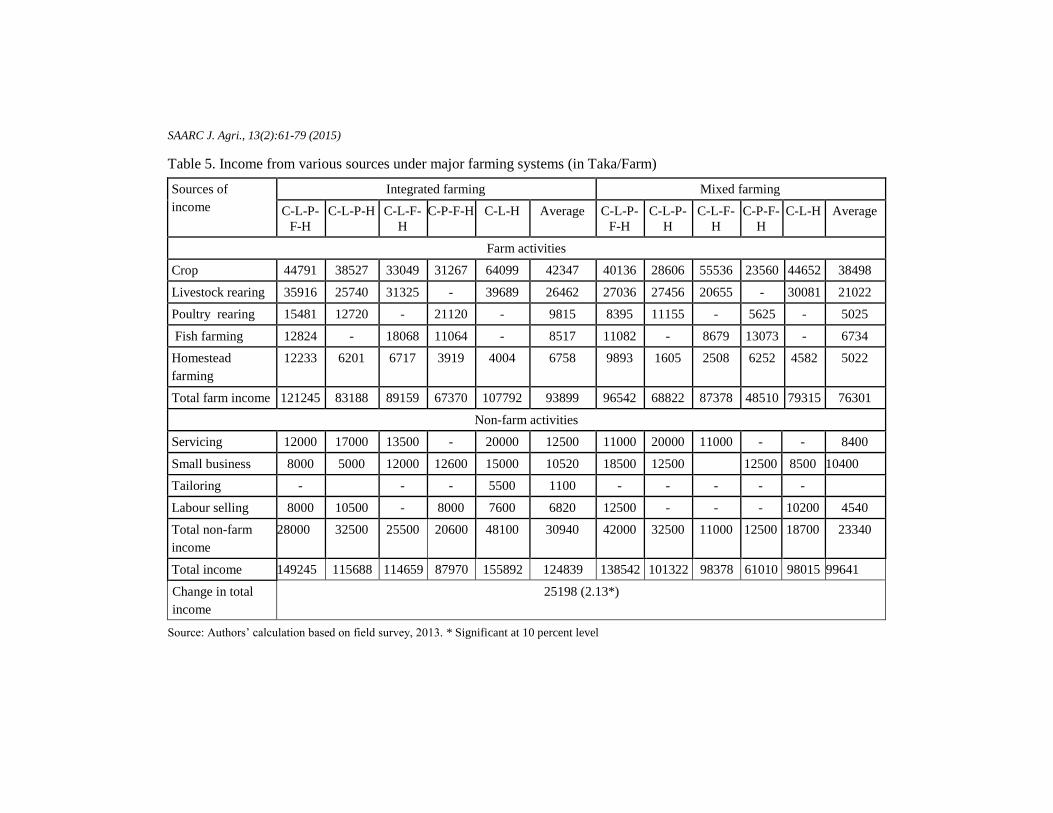
SAARC J. Agri., 13(2):61-79 (2015)
Table 5. Income from various sources under major farming systems (in Taka/Farm)
Sources of
income
Integrated farming Mixed farming
C-L-P-
F-H
C-L-P-H C-L-F-
H
C-P-F-H C-L-H Average C-L-P-
F-H
C-L-P-
H
C-L-F-
H
C-P-F-
H
C-L-H Average
Farm activities
Crop 44791 38527 33049 31267 64099 42347 40136 28606 55536 23560 44652 38498
Livestock rearing 35916 25740 31325 - 39689 26462 27036 27456 20655 - 30081 21022
Poultry rearing 15481 12720 - 21120 - 9815 8395 11155 - 5625 - 5025
Fish farming 12824 - 18068 11064 - 8517 11082 - 8679 13073 - 6734
Homestead
farming
12233 6201 6717 3919 4004 6758 9893 1605 2508 6252 4582 5022
Total farm income 121245 83188 89159 67370 107792 93899 96542 68822 87378 48510 79315 76301
Non-farm activities
Servicing 12000 17000 13500 - 20000 12500 11000 20000 11000 - - 8400
Small business 8000 5000 12000 12600 15000 10520 18500 12500
12500 8500 10400
Tailoring - - - 5500 1100 - - - - -
Labour selling 8000 10500 - 8000 7600 6820 12500 - - - 10200 4540
Total non-farm
income
28000 32500 25500 20600 48100 30940 42000 32500 11000 12500 18700 23340
Total income 149245 115688 114659 87970 155892 124839 138542 101322 98378 61010 98015 99641
Change in total
income
25198 (2.13*)
Source: Authors’ calculation based on field survey, 2013. * Significant at 10 percent level
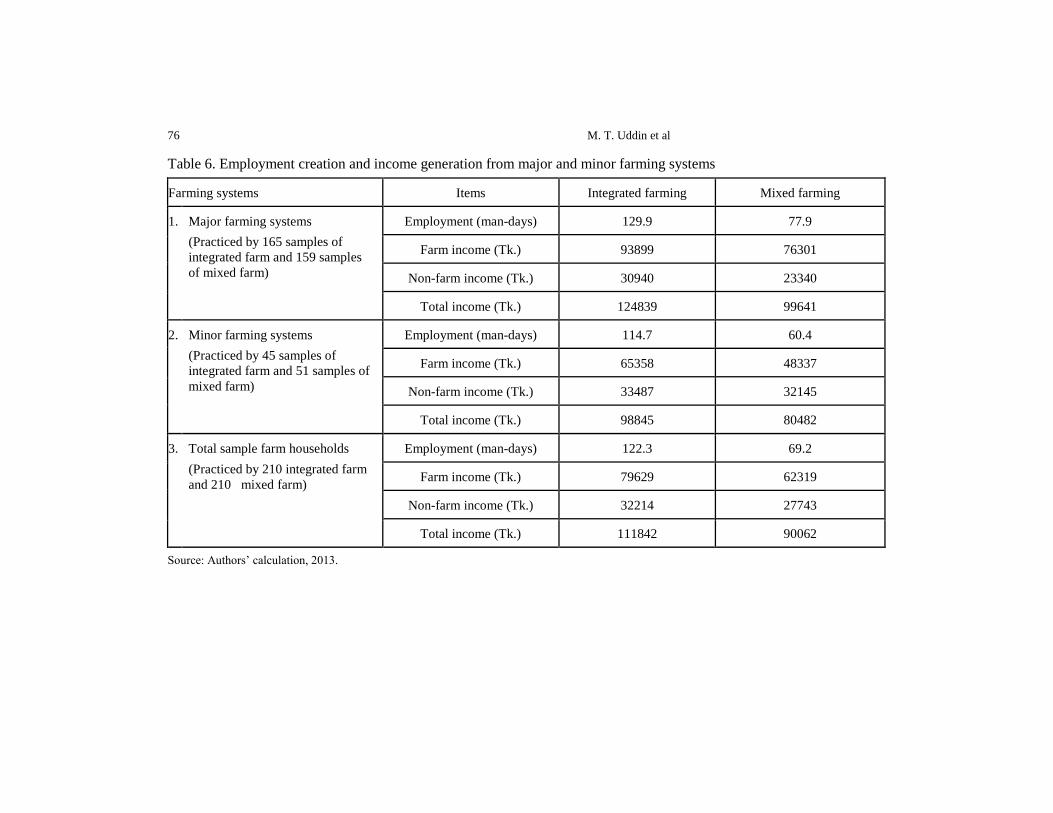
76 M. T. Uddin et al
Table 6. Employment creation and income generation from major and minor farming systems
Farming systems Items Integrated farming Mixed farming
1. Major farming systems
(Practiced by 165 samples of
integrated farm and 159 samples
of mixed farm)
Employment (man-days) 129.9 77.9
Farm income (Tk.) 93899 76301
Non-farm income (Tk.) 30940 23340
Total income (Tk.) 124839 99641
2. Minor farming systems
(Practiced by 45 samples of
integrated farm and 51 samples of
mixed farm)
Employment (man-days) 114.7 60.4
Farm income (Tk.) 65358 48337
Non-farm income (Tk.) 33487 32145
Total income (Tk.) 98845 80482
3. Total sample farm households
(Practiced by 210 integrated farm
and 210 mixed farm)
Employment (man-days) 122.3 69.2
Farm income (Tk.) 79629 62319
Non-farm income (Tk.) 32214 27743
Total income (Tk.) 111842 90062
Source: Authors’ calculation, 2013.

SAARC J. Agri., 13(2):61-79 (2015)
Table 7. Impact on farmers’ employment creation and income generation
Matching method and
outcome
Average treatment on treated
(ATT)
Standard error t-value
Employment (man-days)
Kernel matching 61 20.88 2.89
Radius matching 62 20.31 3.05
Farm income (Tk.)
Kernel matching 34814* 6778 6.03
Radius matching 36157* 7150 5.44
Non-farm income (Tk.)
Kernel matching -2688 6576 -0.31
Radius matching -746 7822 -0.09
Total household income (Tk.)
Kernel matching 32614 5282 3.77
Radius matching 34647 5394 3.93
Source: Authors’ calculation based on field survey, 2013.
Note: * Significant at 10 percent level.

78 M. T. Uddin et al
Table 8. Food security index for integrated farming and mixed farming
Farming
system
Food security indices Food secure
households
Food insecure
households
All
Integrated
farming
Food security index 1.37 0.90 1.12
Head count index 0.89 0.11 -
Per capita daily calorie availability
(kcal)
2927.83 1963.10 2290.99
Food insecurity gap/Surplus index 0.06 -0.08 -
Mixed
farming
Food security index 1.33 0.92 0.92
Head count index 0.78 0.22 -
Per capita daily calorie availability
(kcal)
2839.14 2027.32 2240.62
Food insecurity gap/Surplus index 0.10 -0.07 -
Source: Authors’ estimation, 2013.
Table 9. Livelihood status of sample farmers (percentages of farmers reported)
Asset categories Integrated farmers (Increased) Mixed farmers (Increased)
Human capital 77.60 28.40
Social capital 62.25 28.50
Natural capital 75.70 41.70
Physical capital 77.70 36.10
Financial capital 65.30 15.70
Source: Authors’ estimation, 2013.
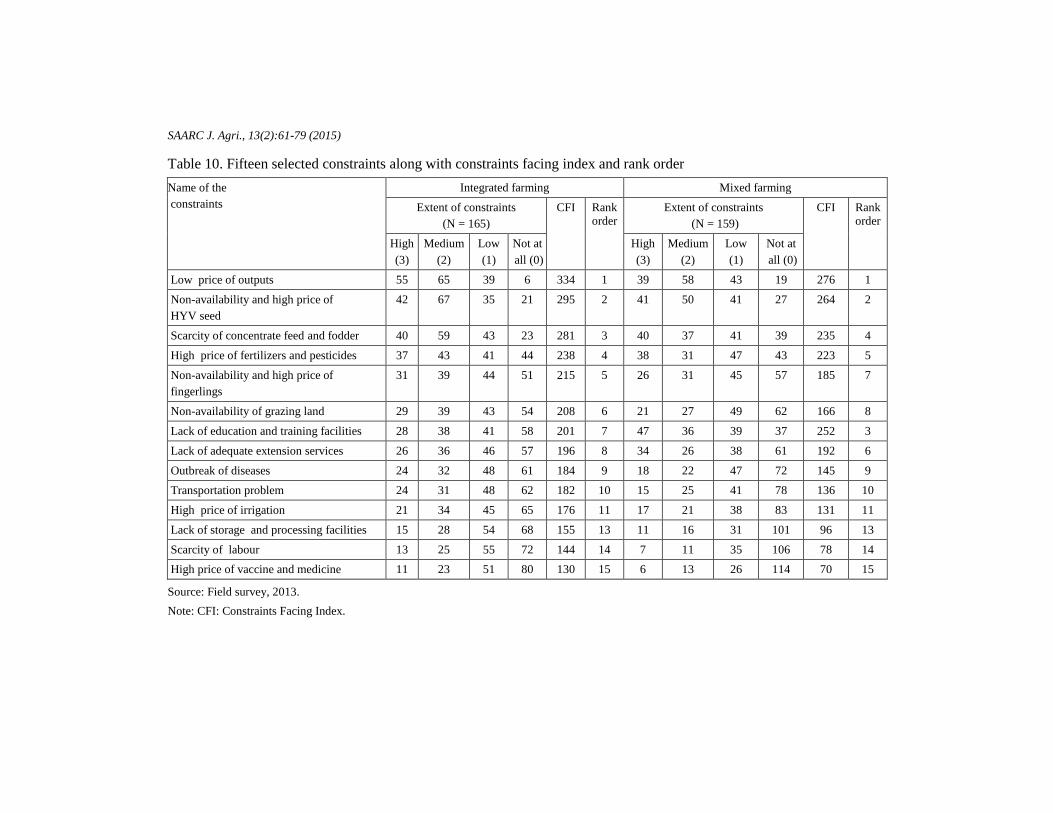
SAARC J. Agri., 13(2):61-79 (2015)
Table 10. Fifteen selected constraints along with constraints facing index and rank order
Name of the
constraints
Integrated farming Mixed farming
Extent of constraints
(N = 165)
CFI Rank order
Extent of constraints
(N = 159)
CFI Rank order
High
(3)
Medium
(2)
Low
(1)
Not at
all (0)
High
(3)
Medium
(2)
Low
(1)
Not at
all (0)
Low price of outputs 55 65 39 6 334 1 39 58 43 19 276 1
Non-availability and high price of
HYV seed
42 67 35 21 295 2 41 50 41 27 264 2
Scarcity of concentrate feed and fodder 40 59 43 23 281 3 40 37 41 39 235 4
High price of fertilizers and pesticides 37 43 41 44 238 4 38 31 47 43 223 5
Non-availability and high price of
fingerlings
31 39 44 51 215 5 26 31 45 57 185 7
Non-availability of grazing land 29 39 43 54 208 6 21 27 49 62 166 8
Lack of education and training facilities 28 38 41 58 201 7 47 36 39 37 252 3
Lack of adequate extension services 26 36 46 57 196 8 34 26 38 61 192 6
Outbreak of diseases 24 32 48 61 184 9 18 22 47 72 145 9
Transportation problem 24 31 48 62 182 10 15 25 41 78 136 10
High price of irrigation 21 34 45 65 176 11 17 21 38 83 131 11
Lack of storage and processing facilities 15 28 54 68 155 13 11 16 31 101 96 13
Scarcity of labour 13 25 55 72 144 14 7 11 35 106 78 14
High price of vaccine and medicine 11 23 51 80 130 15 6 13 26 114 70 15
Source: Field survey, 2013.
Note: CFI: Constraints Facing Index.
SAARC J. Agri., 13(2): 80-93 (2015)
HOW MUCH CAN SMALLHOLDERS IN BANGLADESH
BENEFIT FROM SUMMER TOMATO CULTIVATION?
AN APPLIED AGRO-ECONOMIC ANALYSIS OF ON-
FARM DATA
M. E. Baksh1, F. Rossi
*1, T. J. Krupnik
1, A. S. M. H. Talukder
2, A. McDonald
3
International Center for the Improvement of Maize and Wheat (CIMMYT), Dhaka-1212, Bangladesh
ABSTRACT
Cultivating summer (monsoon season) tomatoes in Bangladesh holds promise as a profitable enterprise with which farmers can augment existing cropping patterns, since only small amounts of land are required. Using on-farm production data collected from 18farmers in Jessore District,gross margin and other economic indicators were estimated. Results indicate that, with careful management implemented early in the crop season, small farmers can earn impressive profits if they harvest summer tomatoes at least twice (two fruiting stages). With an average gross margin equivalent to US$13,737 ha
-1, for example, a smallholder
that owns or leases only 0.028 ha (approximately 7 decimals) could earn more than US$ 350. In addition a very high rate of return over investment (5.66) was calculated for farmers harvesting four times during the seven month cultivation period. Nevertheless, additional research remains to fine-tune farmers’ management of the summer tomato crop in order increase profits further by lowering the costs associated with key inputs (e.g., more efficient hormone application), or by utilizing the inputs more effectivetly (e.g., timing the spraying of hormones to coincide fruitsetting with periods of high demand). Since summer grown tomatoes are also disease and pest risk prone, the development of effective integrated pest mangement strategies are also required in order to reduce the high level of chemical use observed.
Keywords: Agronomic management, Bangladesh, economic assessment, gross margin, marginal rate of return, profitability, summer tomato, tomato production
* Corresponding author email: [email protected] 1 International Center for the Improvement of Maize and Wheat (CIMMYT), Dhaka-1212, Bangladesh 2 University of Adelaide, School of Agriculture, Food and Wine, Adelaide, South Australia, 5005 Australia 3 International Center for the Improvement of Maize and Wheat (CIMMYT), South Asia Regional Office,
Kathmandu, Nepal
Received: 01.06.2015
SUMMER TOMATO CULTIVATION IN BANGLADESH 81
INTRODUCTION
Widely grown throughout the world, the tomato plant (Solanum lycopersicum)
produces a very popular and nutritious fruit that contains high levels of a vitamins A
and C, as well as the carotenoid phytochemical lycopene-one of the most potent anti-
oxidants known (Milind et al., 2011). According to FAOSTAT (2015), in 2013
tomato ranked 10th worldwide in terms of production value (US$ 59.9 billion)
amongst all crops and was the 11th most-produced food commodity, with 164 million
tones (t) produced. China was the largest producer in 2013, followed by India and the
United States. Bangladeshi farmers produced only 251,000 t in 2013 (FAOSTAT,
2015), and are often reluctant to cultivate horticultural crops during the summer
monsoon season (June to October) for fear of crop damage due to strong rains and
wind, and localized flooding. This is especially true for tomatoes, the majority of
which are produced in the winter season; for this reason, tomato production in
Bangladesh lags behind anincreasing demandthat is driven by both the expanding
population and rising incomes of urban consumers. The resulting scarcity in the
market drives up the price (especially during the Eid holidays), making tomatoe
production attractive to farmers – if only they are able to tackle various production
constraints.
A key limitation to tomato production in Bangladesh during the summer season
is that the setting of the fruits is interrupted at temperatures above 26/20° C
(day/night), and can becompletely arrested above 38/27°C (Stevens and Rudich,
1978; El-Ahmadi and Stevens, 1979; Kuo et al., 1979). Additionally, Charles and
Harris (1972) reported that fruit-setting of tomatoes requires night temperatures of
15-20°C, which do not prevail anywhere in Bangladesh during May to September.
Within this context, the Horticulture Research Center of the Bangladesh Agricultural
Research Institute (BARI) developed two heat-tolerant, hybrid tomato varieties
(BARI Tomato 4; BARI Tomato5) released in 1996, and two hybrid varieties (BARI
Tomato10; BARI Tomato13) released in 1998 (BARI, 2008). These deveopments
resulted in the potential for cultivating tomatoes in new areas of Bangladesh
throughout the year, with significant economic benefits available for those able to
adopt the technology (especially small-scale farmers with limited land resources).
Summer tomato cultivation requires complex agronomic management that is
reliant on relatively high levels of labor and material inputs, in addition to skill and
knowledge. This research examines key production practices with a view to
improving both yield and overall economic performance of the enterprise through
efficient input usage, best-bet practices, and the timing of management decisions. It
also assesses the economics of summer tomato cultivation in Bangladesh in terms of
gross margin and benefit-cost analyses, derived from actual on-farm production and
sales data collected from producing households. The remainder of the article is
structured as follows: the next section provides a brief description of the production
system, after which the study location and methods employed for the economic

82 F. Rossi et al
assessment are summarized. Results are then presented with associated discussion,
while the closing section offers some conclusions and recommendations that can
guide further study as well as improve the application of the summer tomato
technology in farmers‘ fields.
MATERIALS AND METHODS
Basic details of the production system
The typical size of a summer tomato plot in the greater Jessore area is only
about 10 decimals, or 0.04 hectare (ha). Farmers generally plant summer tomato
seedbeds in mid-May before the advent of the monsoon rains, although some may
plant up to mid-June; seedlings are typically transplanted into the field after one
month of age. Raised beds are formed upon which farmers transplant the seedlings
because the moisture level in the soil must be moderated to avoid water logging. The
cultivation period can potentially last into February of the following year, but doing
so prevents an alternative Rabi (winter) season crop to be grown. Therefore, many
farmers tend to cultivate summer tomato up to December (six to seven months
duration), during which time as many as four distinct fruiting periods may be
realized.
In order to protect tomato plants from damage caused by intense precipitation
events, farmers construct a framework made of bamboo poles and slats onto which a
hoop-shaped roof of polyethylene is attached (at about 2 metres height). When the
rainy season passes in late September, farmers remove the polythene roof to allow
the tomato plants to continue trellising past the top of the structure. To provide
support to the plants, and to avoid direct contactof fruit and foliage with the soil, a
smaller bamboo trellis structure is placed within the larger superstructure. Staking
can increase fruit yield and size; it also reduces the incidence of soil-borne diseases
and makes pest control and harvesting easier.
Cultivation of tomato in the Bangladeshi summer faces several difficulties
besides the risk of storm damage and extreme temperatures. Because of the unique
climactic and soil conditions under which summer tomato is grown, the crop is more
susceptible to pest and disease infestation than tomato grown during the cooler, dryer
winter season. Key insect pests encountered include white flies (Bemisia spp.), which
are capable of vectoring yellow tomato leaf-curl virus and which can be particularly
problematic for the crop. Less significant, yet present, is a complex of Lepidopteran
tomato fruit borer species including Spodopera spp.and Helicoveroa spp. The
perception of farmers in terms of yield-loss risk is particulatly stronggiven their
investment in the crop, however, and they therefore frequently resort to the use of
insecticides to control pests. The problem is that the agro-chemicals employed, and
their rates and frequency of application, are typically based on improper
recommendations from dealers (Rashid et al., 2003), as well as calendar-based
spraying intervals regardless of actual need. As such, one objective of this study is to

SUMMER TOMATO CULTIVATION IN BANGLADESH 83
assess the economic consequences of insecticide use in summer tomato production as
as tarting point for building an appropriate and responsive framework for improved
management in the future, one which optimizes cultural (rather than chemical)
control, as with integrated pest management (IPM) principles.
Growth hormones are employed to ensure fruit setting under excessive
temperatures. This is a key component of the production process and helps the farmer
obtain larger fruit and higher yields; even under favorable growing conditions (15–
25°C), hormone spraying can increase crop yields (Chen and Hanson, 2001). While
insecticides can pose serious environmental and human health risks when used
improperly, hormone application is relatively benign although it is potentially costly
for farmers if not applied efficiently.
Study Area / Evaluation Metrics Employed
During 2011, the Cereal Systems Initiative for South Asia in Bangladesh
project provided basic training to farmers in Jessore Sadar and Monirampur upazilas
(i.e., subdistricts of Jessore District) in an attempt to scale-out, learn from, and refine
summer tomato production. Subsequently, 18 of these farmers established summer
tomato plots in the Arabpur union under Jessore Sardar upazila. These farmers agreed
to provide detailed production information in order to analyse the constraints and
opportunities presented by summer tomato; as such, the agro-economic data analyzed
herein allow estimation of the economic profitability of summer tomato cultivation
under actual field conditions. For the purposes of this study, the 18 farmers are
stratified by the number of fruiting periods (flowering events) from which they
harvested tomatoes during the course of the year: 7 farmers harvested fruits from all
four flowering events possible; while 4, 5, and 2 farmers harvested respectively from
3, 2, and 1 fruit flowerings.
The economic analyses presented in this article are based upon the calculation
of average returns from the yield and sales of tomatoes, and average cost values for
all labour and material inputs, for all 18 farmers collectively and asstratified by the
number of flowerings. Concurrent input-output market prices reported by the farmers
were considered as the basis for the cost and return analysis; all monetary values
presented in the article are converted to US dollars at an exchange rate of US$ 1 = 80
Bagladeshi Taka (BDT). All empirical data are presented on a per hectare basis,
although it should be noted that the land area employed for cultivating summer
tomatoes is typically very small (often 0.04 ha or less).
Benefit-cost ratios were calculated for each of the flowering stages, and
collectively for all 18 farmers. Salvage values were considered for the material costs
incurred for the construction of the bamboo infrastructure by assuming two years
longevity of the basic inputs (e.g., polyethylene plastic sheeting, bamboo).
Profitability was also estimated by calculating the gross margin (i.e., total revenue
over variable cost) and the marginal rate of return. Data were analyzed using
marginal analysis (MA) under a partial budgeting system. MA is the process of
84 F. Rossi et al
calculating marginal rates of return between treatments options (or different tillage
options for machinery studies) by proceeding in steps from a lower cost treatment to
that of the next higher cost, and comparing those rates of return to the minimum rate
of return acceptable to farmers. The marginal rate of return (MRR) is the ratio of
marginal gross margin (i.e., the change in net benefits) and the marginal cost (i.e., the
change in net costs) expressed as a percentage. The MRR can easily be interpreted as
the percent return to invested capital, after the capital has been repaid. Additionally, a
comparative profitability assessment was made with respect to transplanted rainy
season‗Aman‘rice (T.Aman), which is the primary crop grownduringthe late-
summer/autumn cropping season during which summer tomato is cultivated.
RESULTS AND DISCUSSION
Cultivated area and input usage
Farmers planted seedlings during the period 17 May to 10 June 2011, using the
BARI Tomato 4 variety on land that was 0.025 ha in size, on average (see Table 1);
the range was 0.008-0.162 ha. Note that the average cultivated area was double (0.05
ha) for the seven farmers who continued harvesting through the fourth flowering; the
average area was much less for the other 11 farmers.
The addition of compost at rates between 10-15 t ha-1
are typically
recommended for summer tomato production. However, the farmers studiedapplied
much lower rates, averaging 3.69 t ha-1
. Only three farmers approached or exceeded
the minimum recommendation, while all others applied less than 4 t ha-1
. Urea, triple
super phosphate (TSP), and murate of potash (MoP) were applied at the rates of 235,
536, 181 kg ha-1
, respectively, compared to the recommended doses of 550, 450, and
250 kg ha-1
for winter tomato production. Since no standard recommendations
currently exist for fertility management for summer tomato, these results must
therefore be interpreted with caution. Indeed, because the yield potential of summer
tomato is typically lower than winter grown tomato, this adaptation is likely sensible
to hedge against production risk given anticipated lower yields. There is clearly an
urgent need for research to establish best-bet summer tomato soil fertility
management practices across the gradient of soil types and environments in which it
is currently being grown.
To control insects, viruses, and diseases, farmers frequently applied different
types of insecticides and fungicides. The average number of sprayings for
insecticides and fungicides were 19.1 and 21.9, respectively, which equals five and
six times per month (respectively) during the fruit bearing period. In total, farmers
applied six different types of insecticides- although Imidacloprid (10ml 200-l )[trade
name: Premier SL] was by far the most used in terms of quantity. Whereas 10
different kinds of fungicides are applied, Metalaxyl-M (4%) +Mancozeb (64%)
[Ridomil Gold MZ 68 WG], Mancozeb (80%) [DithaneM-45], Quinalphos [Corolux
25 EC], and Propineb (600g kg-1
)+Iprovalicarb (90g kg-1) [Melody Duo 69 WP] were
SUMMER TOMATO CULTIVATION IN BANGLADESH 85
the most widely used.
There are possible alternatives to these chemicals that warrant further
exploration by agricultural researchers in Bangladesh. White flies, and the
transmission of yellow tomato leaf curl virus, are the most problematic issues for
tomatoes early in the season. As such, some of the pesticides applied can be avoided
entirely with the use of fine-mesh netting that can completely exclude arthropods
from tomato seedbeds. The use of Neem (Azadirachta indica) extract to make less
toxic alternatives to conventional insecticides may also be promising. Neem can be
produced locally by farmers, but rarely at the volumes and concentrations needed to
make such efforts profitable; commercial neem extracts may therefore be necessary.
Work conducted by the Asian Vegetable Research and Development Centre
(AVRDC) in similar regions of the tropics indicates that Spodoptera spp. and
Helicovera spp. are effectively controlled by rotating neem application with
conventional insecticides, in order to achieve dramatic reductions in the latter without
a consequent impact on yield (Ramasamy, personal communication). However,
commercial neem extracts are not currently available in southern Bangladesh, which
creates a barrier for adoption unless research blended with advocacy and public-
private partnerships can secure low-cost markets for this and similar biopesticide
products.
The application of growth hormones is importantfor summer tomato
production to ensure improved fruit set despite high temperature, sub-optimal
growing conditions. Thus, hormones with trade names such as PGR King areutilized
to promote and/or enhance fruit setting. All of the farmers applied PGR King,
followed by Zoar, which was applied by approximately 55% of the farmers. Growth
hormones account for 29% of the total cost of production, the largest share of all
inputs (Figure 1). In comparison, Karim et al. (2009) found that summer tomato
farmers in the Bagherpara area of Jessore District reported hormone use to be only
approximately 10% of total costs. The difference is due to improper spraying
techniques because the study farmers employed blanket-spraying of the plants instead
of targeting individual flower buds, and suggests that, like the use of
pesticides/fungicides, the study farmers are applying excessive amounts of hormones.
Harvesting and yield
Two months after tranplanting, farmers began harvesting the first flush of fruit
from mid-July to early-August. Farmers collecting multiple flushes of fruit (FF)
continued harvesting until the final days of December 2011. As shown in table 1, the
average yield obtained was equivalent to 35.2 t ha-1
. The range varied from 2.7 t ha-1
,
from a farmer that cultivated until August (with only one FF) because his crop was
severely damaged due to disease infestation, to 66.5 t ha-1
obtained by one farmer
who harvested four FF.
86 F. Rossi et al
Economic performance
The average variable cost for summer tomato cultivation is equivalent to US$
3,491ha-1
. Costs are relatively high for the hormone use in particular, as mentioned
above, accounting for nearly a third of the total variable cost of production. There is
thus an opportunity to reduce this cost by improving the application method; rather
than spraying indiscriminantly, targeted application using locally-made equipment to
direct the hormone can be implemented. Farmers can also be trained on the optimal
timing of hormone applications. For example, they are best applied late in the day
(Chen and Hanson, 2001), although most farmers were unaware of this. Additionally,
sprayings can be timed to coincide fruit setting with major holidays and relegious
festivals in Bangladesh, during which the price for tomatoes and other agricultural
produce usually rises.
Insecticide (13%) and fungicides (13%) together comprise more than a quarter
of all variable costs. As such, the integration of cultural control for insect pests, IPM,
and knowing when it is profitable to intervene in pest control and when it is not, will
likely reduce these costs substatially and increase net returns as a result. Labour
comprised 12% of total costs, which is equivalent to 102 person-days per hectare, on
average. The construction of bamboo sheds and internal staking (11%), seedling
raising and transplanting (10%), and chemical fertilizers (8%) are the other
significant variable cost components. Figure 1 illustrates the relative shares of the
items comprising the total variable cost of production, while table 2 presents the
underlying data in more detail.
The average gross margin was equivalent to US$ 13,737 ha-1
(Table 2). The
range was US$ 936 ha-1
, on the low end (which was impacted by disease), to US$
24,695 ha-1
for the most profitable farmer. The two farmers that harvested only one
FF had proportionately much lower yields and lower gross margins than the rest of
the farmers who continued harvesting multiple times (Figure 2). The average benefit-
cost ratio (BCR) for all 18 farmers was calculated as 4.63, which indicates that the
cultivation of summer tomatoes is highly profitable. Table 2 also reveals one of the
key findings of this research: small farmers can earn impressive profits if they harvest
summer tomatoes at least twice (two fruiting stages), which should be possible if
careful management is implemented early in the crop season. Moreover, there
isample scope to increase profit further by lowering the costs associated with some
key inputs (e.g., more efficient hormone application), or by making better use of the
inputs (e.g., spraying hormones at the right time to ensure fruits set at periods of high
market demand and price).
Data were also analyzed using marginal analysis (MA) under a partial
budgeting system, the results of which are presented in table 3. The FF Stage 2 gave
the highest MRR on investment (3,359%), followed by FF Stage 4 (1,249%); MRR
FF Stage 3 (245%) was the lowest. This analysis confirms the key finding mentioned
in the previous paragraph (i.e.farmers will maximize the rate of return to their

SUMMER TOMATO CULTIVATION IN BANGLADESH 87
capitalif they harvest twice), and even adds a further dimension: if farmers decide to
harvest more than twice, they would be better off harvesting four times instead of
thrice. Note that such conclusions require further study to establish their validity and
wider applicability, however, given the small sample size and the fact that the results
are based on data fromonly one year (2011).
Since the main cropping pattern in the study area is T. Aman rice, followed by
dryseason Boro rice (followed by a brief fallow period), a comparison with the
principal competing crop during the rainy season, T. Aman rice, is justified. The
estimated results are also presented in table 3, and show that the gross margin of
summer tomato is 1,571% higher than T. Aman rice clearly demonstrating that
summer tomato cultivation is much more profitable than growing the principal crop
that it replaces (Razzaque and Rafiquzzaman, 2007). One does not expect farmers to
convert all of their T. Aman area into summer tomato, however, because rice is the
staple crop in Bangladesh and South Asia, and as such will always be important for
maintaining food security. Nevertheless, the introduction of summer tomato on a
small proportion of a farmer‘s field can provide an effective income generating crop
for farmers having the proper land, knowledge, technical ability, and financial capital
to adopt this cropping option.
CONCLUSIONS AND RECOMMENDATIONS
The results suggest that small holders who cultivate summer tomatoes can earn
(on average) a profit equivalent to US$ 13,737 ha-1
, which indicates that devoting
only 0.028 ha to summer tomato cultivation would allow adopting farmers to earn
more than US$ 350 per year. While not every farmer is in a position to grow summer
tomatoes (e.g. low-lying land is not suitable, start-upcostscan be prohibitive), this
intesive cropping alternative remains within the reach of even very small holders that
own 0.2 ha or less provided they receive the requisite training and the sine qua non
investment capital, which will likely have to be supplied through micro-credit
financing (e.g. from local NGOs) for farmers who are unable to cover initial costs
themselves. For those that do adopt summer tomato cultivation, however, this income
generating crop can help to diversify farm production and generate additional income
for households otherwise reliant upon T. Aman rice in the rainy season; it thus
appears to hold promise for large numbers of farmers, given suitable soil conditions,
elevation, and access to inputs.
Much work still needs to be done to improve both the agronomic best practices
and the economic efficiency of this crop, however. For example, in order to control
insects and viruses, farmers had to frequently apply 16 different
insecticides/fungicides 41 times in a season, which constituted approximately 26% of
the total cost of production. This not only has an impact on the profitability of the
enterprise, but it exemplifies the heavy reliance on pesticides for which the vegetable
farmers of Bangladesh are known (Rashid et al., 2003). For the sake of farmer,
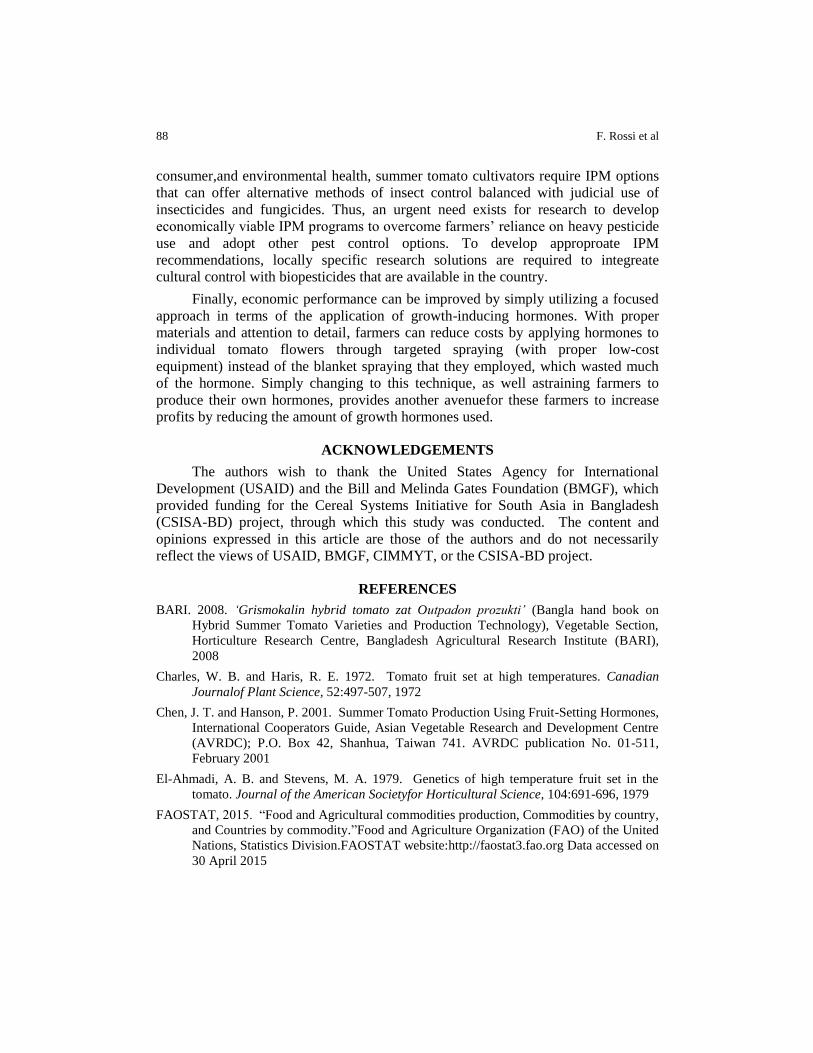
88 F. Rossi et al
consumer,and environmental health, summer tomato cultivators require IPM options
that can offer alternative methods of insect control balanced with judicial use of
insecticides and fungicides. Thus, an urgent need exists for research to develop
economically viable IPM programs to overcome farmers‘ reliance on heavy pesticide
use and adopt other pest control options. To develop approproate IPM
recommendations, locally specific research solutions are required to integreate
cultural control with biopesticides that are available in the country.
Finally, economic performance can be improved by simply utilizing a focused
approach in terms of the application of growth-inducing hormones. With proper
materials and attention to detail, farmers can reduce costs by applying hormones to
individual tomato flowers through targeted spraying (with proper low-cost
equipment) instead of the blanket spraying that they employed, which wasted much
of the hormone. Simply changing to this technique, as well astraining farmers to
produce their own hormones, provides another avenuefor these farmers to increase
profits by reducing the amount of growth hormones used.
ACKNOWLEDGEMENTS
The authors wish to thank the United States Agency for International
Development (USAID) and the Bill and Melinda Gates Foundation (BMGF), which
provided funding for the Cereal Systems Initiative for South Asia in Bangladesh
(CSISA-BD) project, through which this study was conducted. The content and
opinions expressed in this article are those of the authors and do not necessarily
reflect the views of USAID, BMGF, CIMMYT, or the CSISA-BD project.
REFERENCES
BARI. 2008. ‘Grismokalin hybrid tomato zat Outpadon prozukti’ (Bangla hand book on
Hybrid Summer Tomato Varieties and Production Technology), Vegetable Section,
Horticulture Research Centre, Bangladesh Agricultural Research Institute (BARI),
2008
Charles, W. B. and Haris, R. E. 1972. Tomato fruit set at high temperatures. Canadian
Journalof Plant Science, 52:497-507, 1972
Chen, J. T. and Hanson, P. 2001. Summer Tomato Production Using Fruit-Setting Hormones,
International Cooperators Guide, Asian Vegetable Research and Development Centre
(AVRDC); P.O. Box 42, Shanhua, Taiwan 741. AVRDC publication No. 01-511,
February 2001
El-Ahmadi, A. B. and Stevens, M. A. 1979. Genetics of high temperature fruit set in the
tomato. Journal of the American Societyfor Horticultural Science, 104:691-696, 1979
FAOSTAT, 2015. ―Food and Agricultural commodities production, Commodities by country,
and Countries by commodity.‖Food and Agriculture Organization (FAO) of the United
Nations, Statistics Division.FAOSTAT website:http://faostat3.fao.org Data accessed on
30 April 2015
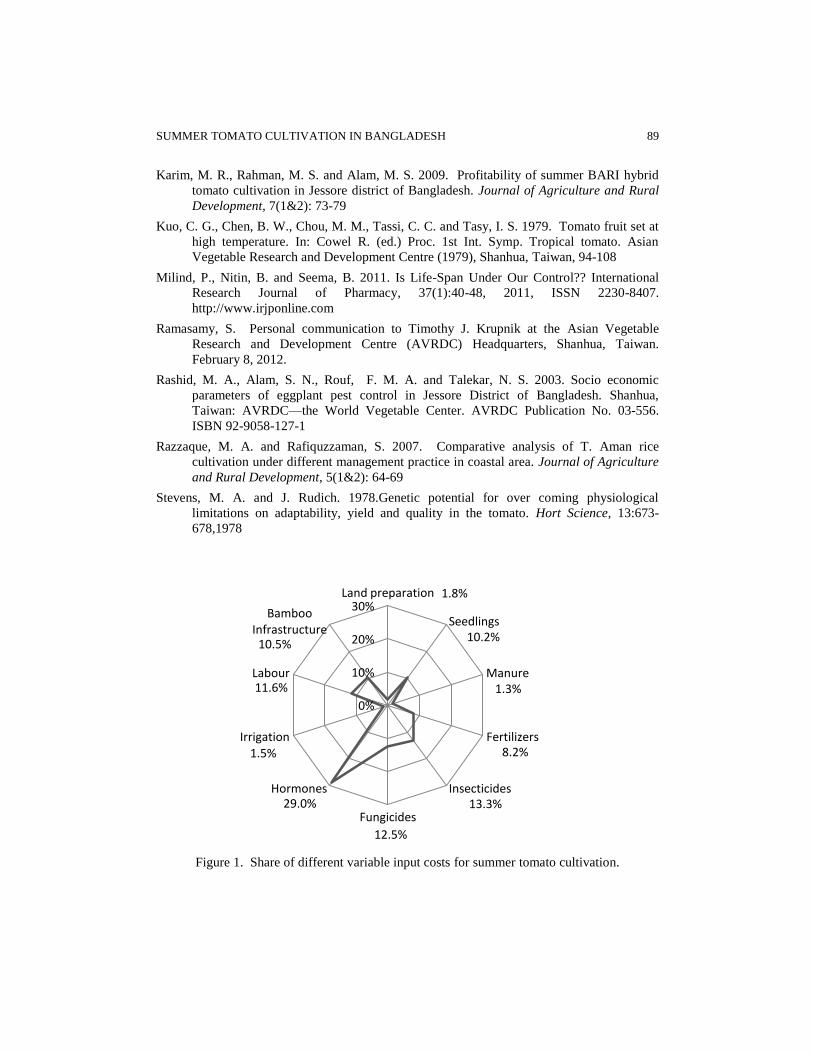
SUMMER TOMATO CULTIVATION IN BANGLADESH 89
Karim, M. R., Rahman, M. S. and Alam, M. S. 2009. Profitability of summer BARI hybrid
tomato cultivation in Jessore district of Bangladesh. Journal of Agriculture and Rural
Development, 7(1&2): 73-79
Kuo, C. G., Chen, B. W., Chou, M. M., Tassi, C. C. and Tasy, I. S. 1979. Tomato fruit set at
high temperature. In: Cowel R. (ed.) Proc. 1st Int. Symp. Tropical tomato. Asian
Vegetable Research and Development Centre (1979), Shanhua, Taiwan, 94-108
Milind, P., Nitin, B. and Seema, B. 2011. Is Life-Span Under Our Control?? International
Research Journal of Pharmacy, 37(1):40-48, 2011, ISSN 2230-8407.
http://www.irjponline.com
Ramasamy, S. Personal communication to Timothy J. Krupnik at the Asian Vegetable
Research and Development Centre (AVRDC) Headquarters, Shanhua, Taiwan.
February 8, 2012.
Rashid, M. A., Alam, S. N., Rouf, F. M. A. and Talekar, N. S. 2003. Socio economic
parameters of eggplant pest control in Jessore District of Bangladesh. Shanhua,
Taiwan: AVRDC—the World Vegetable Center. AVRDC Publication No. 03-556.
ISBN 92-9058-127-1
Razzaque, M. A. and Rafiquzzaman, S. 2007. Comparative analysis of T. Aman rice
cultivation under different management practice in coastal area. Journal of Agriculture
and Rural Development, 5(1&2): 64-69
Stevens, M. A. and J. Rudich. 1978.Genetic potential for over coming physiological
limitations on adaptability, yield and quality in the tomato. Hort Science, 13:673-
678,1978
Figure 1. Share of different variable input costs for summer tomato cultivation.
1.8%
10.2%
1.3%
8.2%
13.3%
12.5%
29.0%
1.5%
11.6%
10.5%
0%
10%
20%
30%Land preparation
Seedlings
Manure
Fertilizers
Insecticides
Fungicides
Hormones
Irrigation
Labour
Bamboo Infrastructure
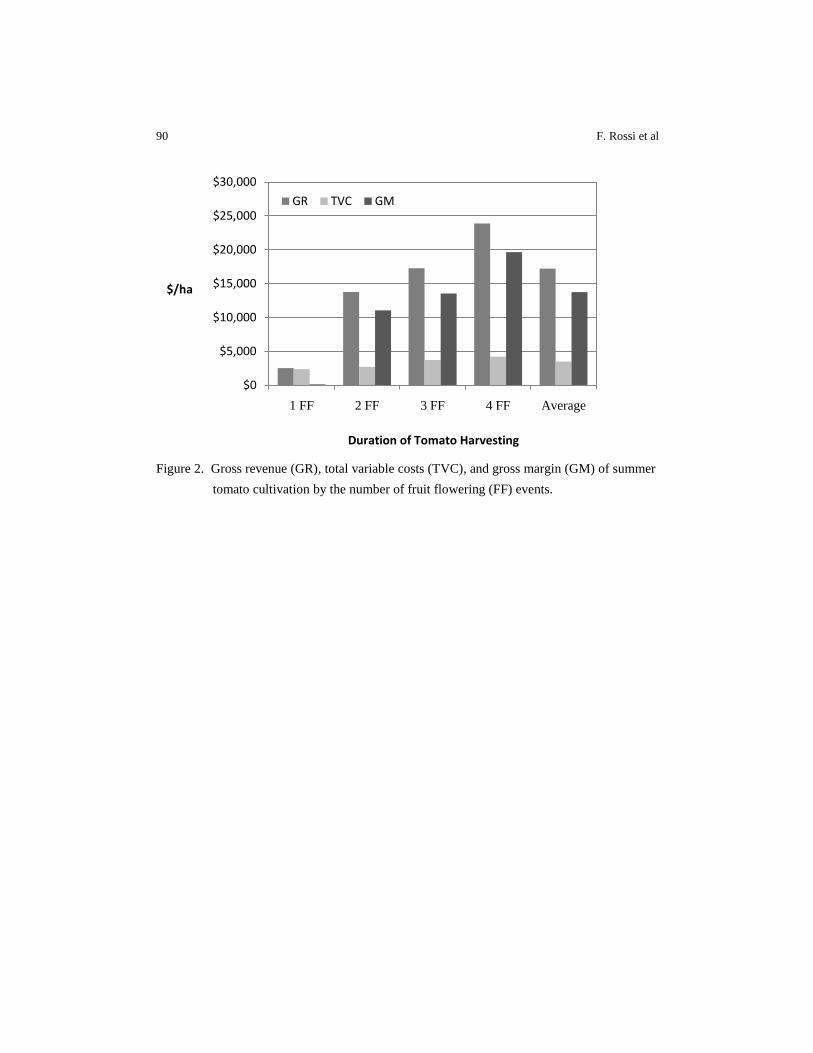
90 F. Rossi et al
Figure 2. Gross revenue (GR), total variable costs (TVC), and gross margin (GM) of summer
tomato cultivation by the number of fruit flowering (FF) events.
$0
$5,000
$10,000
$15,000
$20,000
$25,000
$30,000
1 FF 2 FF 3 FF 4 FF Average
$/ha
Duration of Tomato Harvesting
GR TVC GM
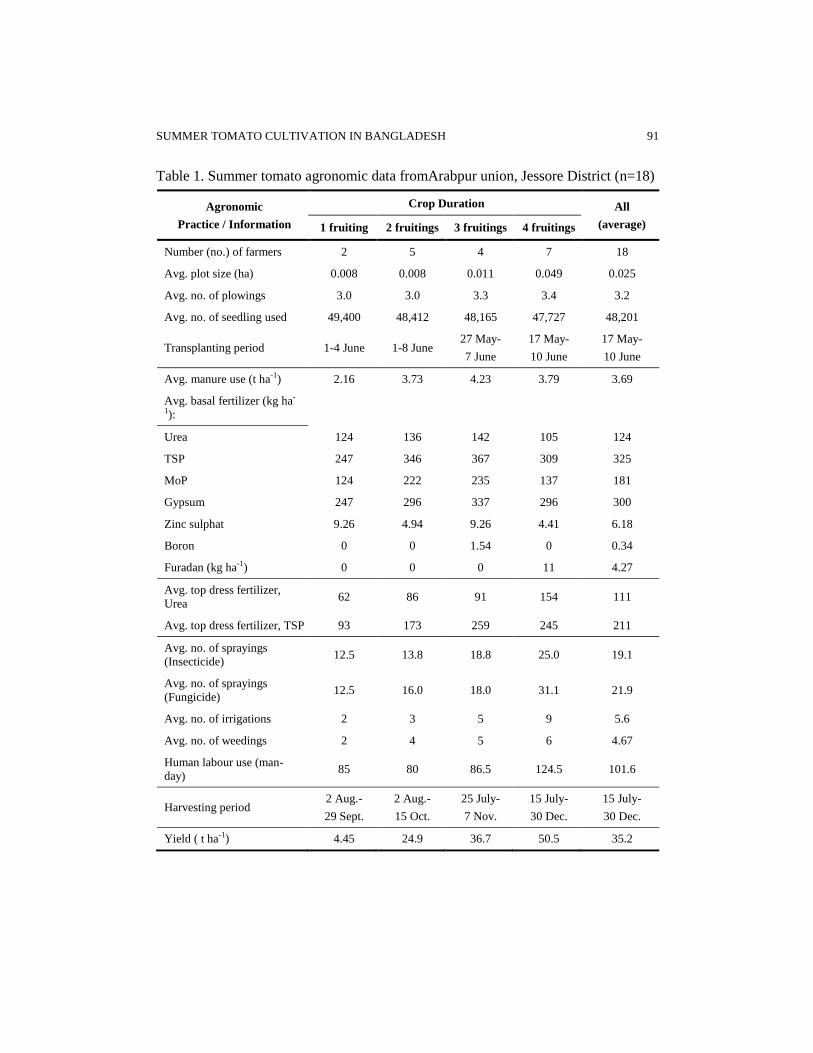
SUMMER TOMATO CULTIVATION IN BANGLADESH 91
Table 1. Summer tomato agronomic data fromArabpur union, Jessore District (n=18)
Agronomic
Practice / Information
Crop Duration All
(average) 1 fruiting 2 fruitings 3 fruitings 4 fruitings
Number (no.) of farmers 2 5 4 7 18
Avg. plot size (ha) 0.008 0.008 0.011 0.049 0.025
Avg. no. of plowings 3.0 3.0 3.3 3.4 3.2
Avg. no. of seedling used 49,400 48,412 48,165 47,727 48,201
Transplanting period 1-4 June 1-8 June 27 May-
7 June
17 May-
10 June
17 May-
10 June
Avg. manure use (t ha-1) 2.16 3.73 4.23 3.79 3.69
Avg. basal fertilizer (kg ha-
1):
Urea 124 136 142 105 124
TSP 247 346 367 309 325
MoP 124 222 235 137 181
Gypsum 247 296 337 296 300
Zinc sulphat 9.26 4.94 9.26 4.41 6.18
Boron 0 0 1.54 0 0.34
Furadan (kg ha-1) 0 0 0 11 4.27
Avg. top dress fertilizer,
Urea 62 86 91 154 111
Avg. top dress fertilizer, TSP 93 173 259 245 211
Avg. no. of sprayings
(Insecticide) 12.5 13.8 18.8 25.0 19.1
Avg. no. of sprayings
(Fungicide) 12.5 16.0 18.0 31.1 21.9
Avg. no. of irrigations 2 3 5 9 5.6
Avg. no. of weedings 2 4 5 6 4.67
Human labour use (man-
day) 85 80 86.5 124.5 101.6
Harvesting period 2 Aug.-
29 Sept.
2 Aug.-
15 Oct.
25 July-
7 Nov.
15 July-
30 Dec.
15 July-
30 Dec.
Yield ( t ha-1) 4.45 24.9 36.7 50.5 35.2
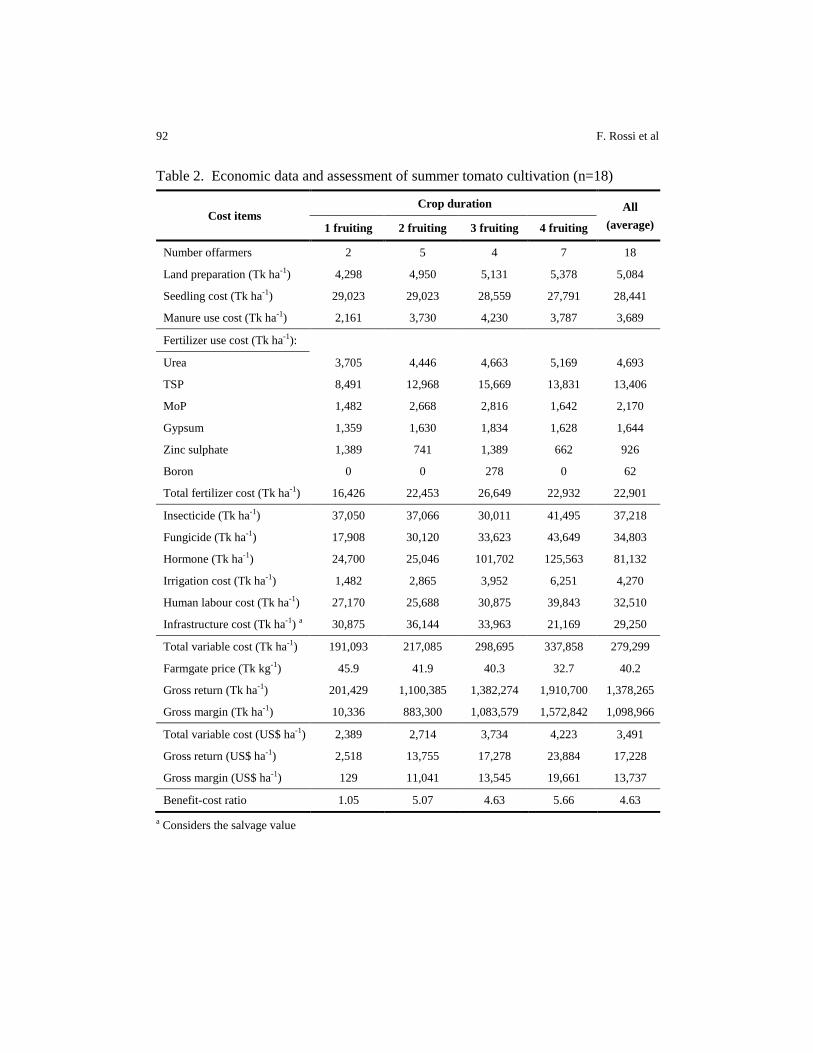
92 F. Rossi et al
Table 2. Economic data and assessment of summer tomato cultivation (n=18)
Cost items Crop duration All
(average) 1 fruiting 2 fruiting 3 fruiting 4 fruiting
Number offarmers 2 5 4 7 18
Land preparation (Tk ha-1) 4,298 4,950 5,131 5,378 5,084
Seedling cost (Tk ha-1) 29,023 29,023 28,559 27,791 28,441
Manure use cost (Tk ha-1) 2,161 3,730 4,230 3,787 3,689
Fertilizer use cost (Tk ha-1):
Urea 3,705 4,446 4,663 5,169 4,693
TSP 8,491 12,968 15,669 13,831 13,406
MoP 1,482 2,668 2,816 1,642 2,170
Gypsum 1,359 1,630 1,834 1,628 1,644
Zinc sulphate 1,389 741 1,389 662 926
Boron 0 0 278 0 62
Total fertilizer cost (Tk ha-1) 16,426 22,453 26,649 22,932 22,901
Insecticide (Tk ha-1) 37,050 37,066 30,011 41,495 37,218
Fungicide (Tk ha-1) 17,908 30,120 33,623 43,649 34,803
Hormone (Tk ha-1) 24,700 25,046 101,702 125,563 81,132
Irrigation cost (Tk ha-1) 1,482 2,865 3,952 6,251 4,270
Human labour cost (Tk ha-1) 27,170 25,688 30,875 39,843 32,510
Infrastructure cost (Tk ha-1) a 30,875 36,144 33,963 21,169 29,250
Total variable cost (Tk ha-1) 191,093 217,085 298,695 337,858 279,299
Farmgate price (Tk kg-1) 45.9 41.9 40.3 32.7 40.2
Gross return (Tk ha-1) 201,429 1,100,385 1,382,274 1,910,700 1,378,265
Gross margin (Tk ha-1) 10,336 883,300 1,083,579 1,572,842 1,098,966
Total variable cost (US$ ha-1) 2,389 2,714 3,734 4,223 3,491
Gross return (US$ ha-1) 2,518 13,755 17,278 23,884 17,228
Gross margin (US$ ha-1) 129 11,041 13,545 19,661 13,737
Benefit-cost ratio 1.05 5.07 4.63 5.66 4.63
a Considers the salvage value
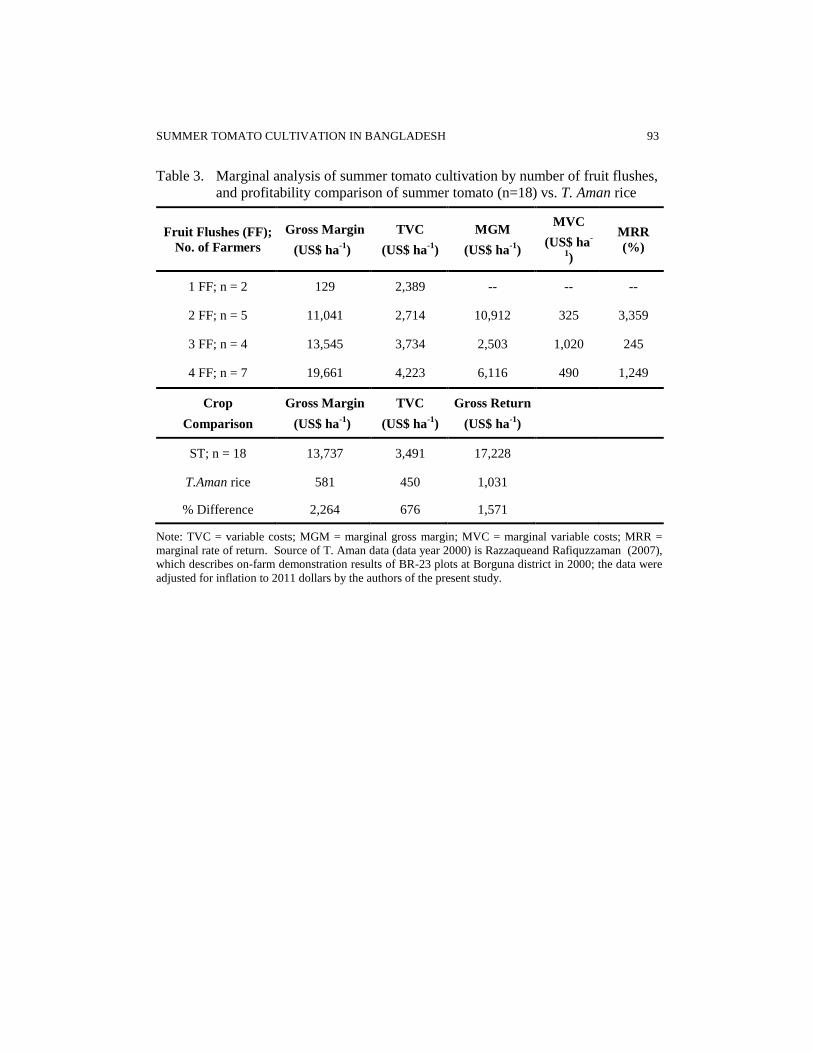
SUMMER TOMATO CULTIVATION IN BANGLADESH 93
Table 3. Marginal analysis of summer tomato cultivation by number of fruit flushes,
and profitability comparison of summer tomato (n=18) vs. T. Aman rice
Fruit Flushes (FF);
No. of Farmers
Gross Margin
(US$ ha-1
)
TVC
(US$ ha-1
)
MGM
(US$ ha-1
)
MVC
(US$ ha-
1)
MRR
(%)
1 FF; n = 2 129 2,389 -- -- --
2 FF; n = 5 11,041 2,714 10,912 325 3,359
3 FF; n = 4 13,545 3,734 2,503 1,020 245
4 FF; n = 7 19,661 4,223 6,116 490 1,249
Crop
Comparison
Gross Margin
(US$ ha-1
)
TVC
(US$ ha-1
)
Gross Return
(US$ ha-1
)
ST; n = 18 13,737 3,491 17,228
T.Aman rice 581 450 1,031
% Difference 2,264 676 1,571
Note: TVC = variable costs; MGM = marginal gross margin; MVC = marginal variable costs; MRR =
marginal rate of return. Source of T. Aman data (data year 2000) is Razzaqueand Rafiquzzaman (2007),
which describes on-farm demonstration results of BR-23 plots at Borguna district in 2000; the data were
adjusted for inflation to 2011 dollars by the authors of the present study.
SAARC J. Agri., 13(2): 94-107 (2015)
GROWTH, YIELD, WATER USE EFFICIENCY AND
COMPETITIVE FUNCTIONS OF INTERCROPPING
SYSTEM OF MAIZE (Zea mays L.) AND MUNGBEAN
(Vigna radiata L.) AS INFLUENCED BY IRRIGATION
S. Roy1, M. Barman
1, A. M. Puste*
2, S. K. Gunri
2 and K. Jana
2
Department of Agronomy, Bidhan Chandra Krishi Viswavidyalaya, West Bengal, India
ABSTRACT
Field experiment was conducted at Instructional Farm, Jaguli (Mohanpur), Bidhan Chandra Krishi Viswavidyalaya, West Bengal, India during two consecutive summer seasons of 2010-11, and 2011-12. The experiment was laid out in split-plot design having 4 levels of irrigation–rainfed without mulch, rainfed with mulch, irrigation at IW (depth of irrigation water) / CPE (Cumulative pan evaporation) ratios of 0.5 and 0.75 in main-plot and 4 inter cropping systems, sole maize, sole mungbean, maize + mungbean (1:1 row ratio) and maize + mungbean (3:2 row ratio) considered as sub-plot treatments replicated thrice. Results revealed that application of irrigation and intercropping systems markedly influenced the growth, yield and yield components (number of cobs/plant, number of grains/cob in case of maize and number of pods/plant and number of seeds/pod in case of mungbean) where the maximum value of these components were recorded with the application of irrigation at IW/CPE ratio 0.75 in sole crop. Maize-mungbean in 3:2 row ratio yielded higher than that of 1:1 intercropping system which might be due to less light interception and more competition for water and nutrition between both the crops. CU of water increased with the increasing levels of irrigation and the maximum value (17.75 kg ha
-1 mm
-
1) of WUE (water use efficiency) was observed with irrigation at IW: CPE
ratio 0.75 under intercropping system of maize : mungbean in 3:2 row ratio followed by IW: CPE ratio 0.50. Among the sole crop, maximum WUE was with IW/CPE ratio 0.75 might be due to more consumption of water corresponding to production potential of maize, while, it was more under rainfed with mulch in mungbean. The relative crowding coefficient (RCC) also revealed both the intercropping systems were advantageous and the land equivalent ratio (LER) increased with the level of irrigation.
*Corresponding author email: [email protected] 1 Post Graduate Student, Department of Agronomy, B.C.K.V., Mohanpur - 741 252, West Bengal, India 2 Associate & Assistant Professor, Department of Agronomy, B.C.K.V., Mohanpur - 741 252, West Bengal, India
Received: 15.06.2015
IRRIGATION AND INTERCROPPING SYSTEM OF MAIZE-MUNGBEAN 95
Thus, maize grown in association with mungbean (3:2 row ratio) were found to be more profitable (B:C ratio of 2.58) with higher monetary advantage as compared to sole crop of maize (B:C ratio of 1.98) with the application of irrigation at IW: CPE ratio of 0.75 in new alluvial zone of West Bengal.
Keywords: Intercropping system, maize-mungbean, irrigation, growth,
yield, water use efficiency, competitive functions
INTRODUCTION
Intercropping is considered the best means of stabilizing yield, crop production
by increasing the productivity of land and also minimizing the risk of crop failure in
dry lands. Many instances of better insect-pest and disease control have also been
reported by Mandal et al. (1990) and Banik and Sharma (2009) through intercropping
system. In India, agriculture is mainly based on monsoon that is mostly uncertain and
unevenly distributed over the sub-continent. So, in such situation, proper scheduling
of irrigation maintains the soil moisture at levels up to the crop needs. Maize (Zea
mays L.) is one of the most important cereals after rice and wheat that shows great
adaptability to wide range of agro-climatic regions and soil types. Among the pulse
crops, mungbean (Vigna radiata L.) being leguminous, short duration pre-kharif crop
with high quality protein (nearly 25%) could be well fitted in various intercropping
systems. In view of the above context, this experiment was undertaken with the
objectives to study the growth, yield and water use efficiency of maize and
mungbean grown as sole and intercrop as influenced by levels of irrigation in this
agro-zone.
MATERIALS AND METHODS
The experiment was conducted during two consecutive pre-kharif or summer
seasons of 2010-11 and 2011-12 at Instructional Farm, Jaguli (Mohanpur), Bidhan
Chandra Krishi Viswavidyalaya, West Bengal, India in upland situation. The soil of
the region was nearly neutral with pH of 6.45 and sandy loam in texture. Physico-
chemical properties of the experimental soil up to the depth of 15 cm were studied to
know the initial status before conducting the experiment (Table 1). The soil of
experimental field was sandy loam in texture with moderate drainage facilities having
medium fertility status and neutral in reaction (pH 6.45). The important
characteristics were medium organic matter and total nitrogen content of 0.059%.
The values of available P and K were determined 8.71 kg and 104.9 kg ha-1
,
respectively. Besides, bulk densities values of soil at depths (0-15) cm, (15-30) cm,
(30-45) cm and (45-60) cm were measured 1.45, 1.47, 1.49 and 1.52 g cc-1
,
respectively.
Cultivars of maize and mungbean used were ‘Deccan 105’ and ‘Sonali’,
respectively. Field experiment was carried out under irrigated conditions laid out in
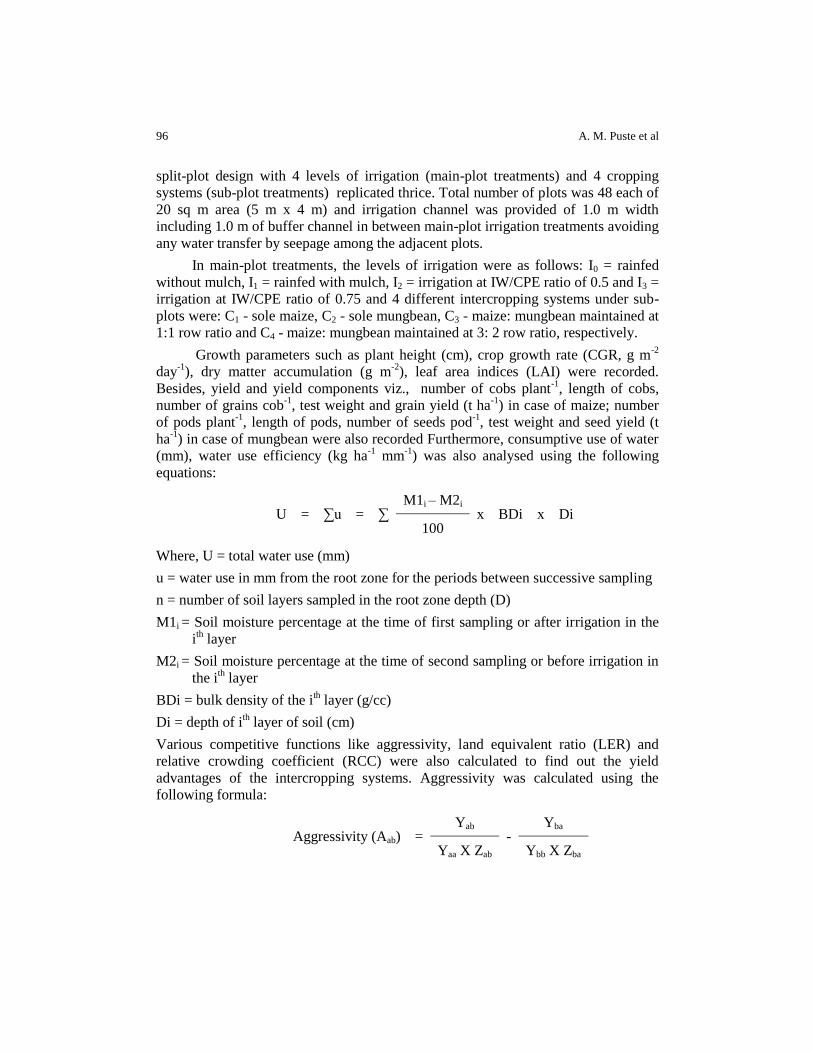
96 A. M. Puste et al
split-plot design with 4 levels of irrigation (main-plot treatments) and 4 cropping
systems (sub-plot treatments) replicated thrice. Total number of plots was 48 each of
20 sq m area (5 m x 4 m) and irrigation channel was provided of 1.0 m width
including 1.0 m of buffer channel in between main-plot irrigation treatments avoiding
any water transfer by seepage among the adjacent plots.
In main-plot treatments, the levels of irrigation were as follows: I0 = rainfed
without mulch, I1 = rainfed with mulch, I2 = irrigation at IW/CPE ratio of 0.5 and I3 =
irrigation at IW/CPE ratio of 0.75 and 4 different intercropping systems under sub-
plots were: C1 - sole maize, C2 - sole mungbean, C3 - maize: mungbean maintained at
1:1 row ratio and C4 - maize: mungbean maintained at 3: 2 row ratio, respectively.
Growth parameters such as plant height (cm), crop growth rate (CGR, g m-2
day-1
), dry matter accumulation (g m-2
), leaf area indices (LAI) were recorded.
Besides, yield and yield components viz., number of cobs plant-1
, length of cobs,
number of grains cob-1
, test weight and grain yield (t ha-1
) in case of maize; number
of pods plant-1
, length of pods, number of seeds pod-1
, test weight and seed yield (t
ha-1
) in case of mungbean were also recorded Furthermore, consumptive use of water
(mm), water use efficiency (kg ha-1
mm-1
) was also analysed using the following
equations:
U = ∑u = ∑ M1i – M2i
x BDi x Di 100
Where, U = total water use (mm)
u = water use in mm from the root zone for the periods between successive sampling
n = number of soil layers sampled in the root zone depth (D)
M1i = Soil moisture percentage at the time of first sampling or after irrigation in the
ith layer
M2i = Soil moisture percentage at the time of second sampling or before irrigation in
the ith layer
BDi = bulk density of the ith layer (g/cc)
Di = depth of ith layer of soil (cm)
Various competitive functions like aggressivity, land equivalent ratio (LER) and
relative crowding coefficient (RCC) were also calculated to find out the yield
advantages of the intercropping systems. Aggressivity was calculated using the
following formula:
Aggressivity (Aab) = Yab
- Yba
Yaa X Zab Ybb X Zba
IRRIGATION AND INTERCROPPING SYSTEM OF MAIZE-MUNGBEAN 97
Where, Aab = Aggressivity of species ‘a’ in presence of species ‘b’
Yab = Intercrop yield of species ‘a’ in presence of species ‘b’
Yaa = Pure stand yield of species ‘a’
Yba = Intercrop yield of species ‘b’ in presence of species ‘a’
Ybb = Pure stand yield of species ‘b’
Zab = Sown proportion of species ‘a’ (intercropped with ‘b’)
Zba = Sown proportion of species ‘b’ (intercropped with ‘a’)
LER was calculated using the below stated equation:
LER = Yab
+ Yba
Yaa Ybb
RCC was calculated from the following equation:
Kab = Yab
x Zba
Yaa - Yab Zab
Where, Kab = Co-efficient of species ‘a’ in presence of species ‘a’
Kba = Yba
x Zab
Ybb – Yba Zba
Where, Kba = Co-efficient of species ‘b’ in presence of species ‘a’ and the yield
advantage was decided from the product of the co-efficient i.e., K = Kab x Kba
And finally the economic analysis revealed the monetary advantage of the
intercropping systems.
Statistical analyses of data were carried out by using MSTAT and critical differences
at 5% level of significance were calculated following Gomez and Gomez (1984).
RESULTS AND DISCUSSION
Growth characteristics of maize and mungbean
Among the growth attributing characters, plant height, dry matter
accumulation, CGR (crop growth rate) and LAI (leaf area index) of both the crops
were observed (Table 2 & 3). The different frequencies of irrigation influenced the
plant height of both maize and mungbean particularly during the later stages showing
positive response over the rainfed treatments. Plant height increased with increased
levels of irrigation at 60 and 90 DAS (days after sowing) and harvest in maize
whereas in case of mungbean 60 DAS and at harvest. Among the irrigation levels,
irrigation at IW: CPE ratio of 0.75 (I3) resulted in tallest plants in both the crops and

98 A. M. Puste et al
shortest plants were observed in no irrigation without mulch. Alam et al. (1985) and
Prasad et al. (1987) found increased plant growth due to frequent watering of field
crops. However, plant height values in I3 were at par with I2 (irrigation at IW: CPE
ratio of 0.50).
Among the inter cropping systems, maize and mungbean maintaining row ratio
of 3:2 (C4) recorded the maximum plant height followed by 1:1 row ratio (C3) and
sole maize (C1). This might be due to the presence of mungbean in the intercropped
situations that being leguminous in nature added to the nitrogen reserves of the soil.
On the contrary, mungbean plants showed maximum plant height in sole crop (C2)
followed by C3 and C4 treatments where C2 treatment, comprises of mungbean faced
no competition. Irrigation had favourable influence on LAI of both the crops and I3
(IW: CPE of 0.75) treatment maintained the greatest LAI value which increased with
crop age and decreased at maturity (Table 2 and 3). Singh and Sridhar (1989) also
reported similar results. Lowest LAI was recorded in rainfed and no mulch
conditions. The highest LAI was shown by maize grown in 3:2 row ratio, while, sole
mungbean gave maximum value at 60 DAS. CGR (crop growth rate) values of the
crops showed similar trend as the leaf area indices value
Yield attributes and yields of maize and mungbean
Among the yield components, application of irrigation water at IW: CPE ratio
of 0.75 (I3) had favourable influence on LAI and dry matter accumulation resulting in
greater number of cobs per plant in maize and pods per plant in mungbean (Table 4).
These results were in conformity with those observed by Roy and Tripathi (1987).
Length of the cob and number of grains per cob was recorded highest in I3 treatment.
Bajwa et al. (1987) also reported the same trend. However, no significant variations
were observed in the test weight values of both the crops due to treatment effects,
which might be the genetical characteristics of plants, although highest value was
with I3 irrigation level (Table 4).
Irrigation improved the grain and seed yield of maize and mungbean,
respectively due to improvement in their yield attributing characteristics. The highest
grain yield was recorded in case of I3 irrigation level because irrigation was given at
critical physiological stages of both the crops. Similar results were reported by
Trivedi et al. (1994). However in mungbean yield difference between I3 and I2
treatments were negligible.
With respect to the intercropping systems, treatments C4 (3:2 row ratio) in case
of maize and sole mungbean (C2) significantly had higher values of yield components
and thereby increased yield. Between the two intercropping systems, 3:2 yielded
higher than of 1:1 row ratio because maize was more dominating crop than that of
mungbean. The values of maize yield as affected by intercropping system were
similar to that stated by Shahbazi et al. (2012).
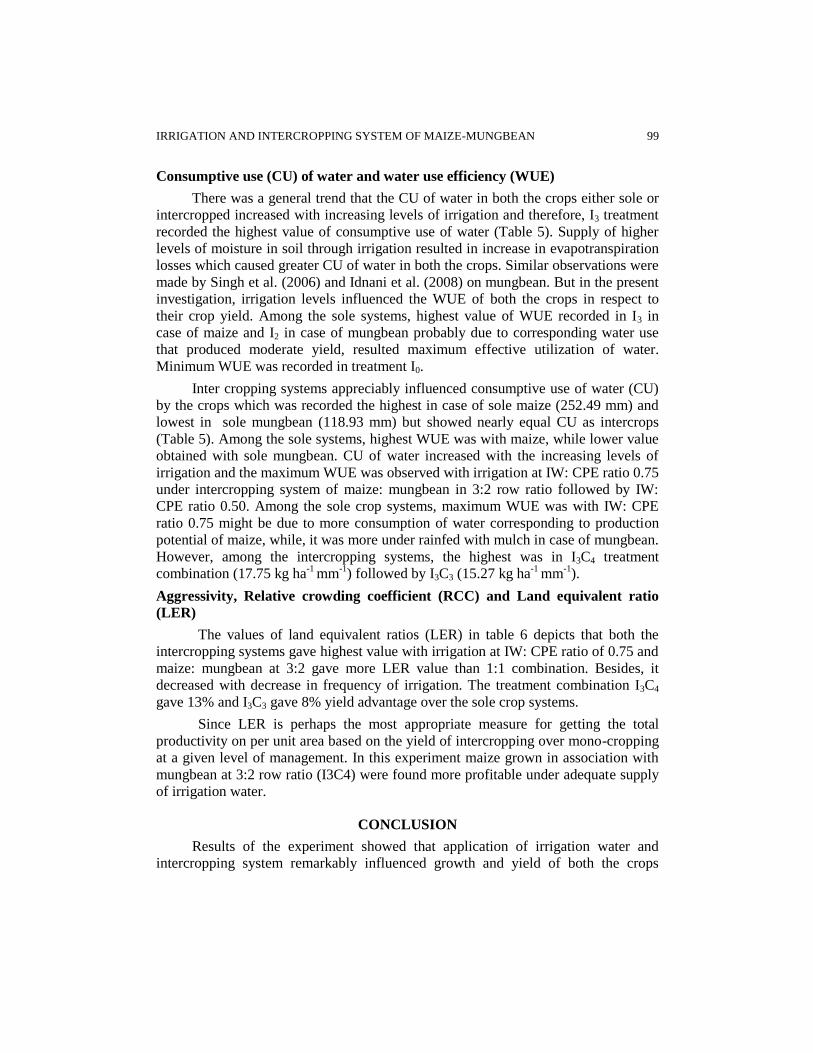
IRRIGATION AND INTERCROPPING SYSTEM OF MAIZE-MUNGBEAN 99
Consumptive use (CU) of water and water use efficiency (WUE)
There was a general trend that the CU of water in both the crops either sole or
intercropped increased with increasing levels of irrigation and therefore, I3 treatment
recorded the highest value of consumptive use of water (Table 5). Supply of higher
levels of moisture in soil through irrigation resulted in increase in evapotranspiration
losses which caused greater CU of water in both the crops. Similar observations were
made by Singh et al. (2006) and Idnani et al. (2008) on mungbean. But in the present
investigation, irrigation levels influenced the WUE of both the crops in respect to
their crop yield. Among the sole systems, highest value of WUE recorded in I3 in
case of maize and I2 in case of mungbean probably due to corresponding water use
that produced moderate yield, resulted maximum effective utilization of water.
Minimum WUE was recorded in treatment I0.
Inter cropping systems appreciably influenced consumptive use of water (CU)
by the crops which was recorded the highest in case of sole maize (252.49 mm) and
lowest in sole mungbean (118.93 mm) but showed nearly equal CU as intercrops
(Table 5). Among the sole systems, highest WUE was with maize, while lower value
obtained with sole mungbean. CU of water increased with the increasing levels of
irrigation and the maximum WUE was observed with irrigation at IW: CPE ratio 0.75
under intercropping system of maize: mungbean in 3:2 row ratio followed by IW:
CPE ratio 0.50. Among the sole crop systems, maximum WUE was with IW: CPE
ratio 0.75 might be due to more consumption of water corresponding to production
potential of maize, while, it was more under rainfed with mulch in case of mungbean.
However, among the intercropping systems, the highest was in I3C4 treatment
combination (17.75 kg ha-1
mm-1
) followed by I3C3 (15.27 kg ha-1
mm-1
).
Aggressivity, Relative crowding coefficient (RCC) and Land equivalent ratio
(LER)
The values of land equivalent ratios (LER) in table 6 depicts that both the
intercropping systems gave highest value with irrigation at IW: CPE ratio of 0.75 and
maize: mungbean at 3:2 gave more LER value than 1:1 combination. Besides, it
decreased with decrease in frequency of irrigation. The treatment combination I3C4
gave 13% and I3C3 gave 8% yield advantage over the sole crop systems.
Since LER is perhaps the most appropriate measure for getting the total
productivity on per unit area based on the yield of intercropping over mono-cropping
at a given level of management. In this experiment maize grown in association with
mungbean at 3:2 row ratio (I3C4) were found more profitable under adequate supply
of irrigation water.
CONCLUSION
Results of the experiment showed that application of irrigation water and
intercropping system remarkably influenced growth and yield of both the crops
100 A. M. Puste et al
which resulted in maximum with irrigation applied at IW: CPE ratio 0.75 obtaining
higher value of water use efficiency. Among intercropping systems, maize-mungbean
maintained in 3:2 row ratio yielded better than that of others including sole system.
Aggressivity study indicated that maize was the dominant species over mungbean
and more advantageous in respect to other associated characters. Thus, maize grown
in association with mungbean in 3:2 row ratio was found to be more profitable and
advantageous due to more land sharing under intercropping system as well as
application of irrigation at IW: CPE ratio of 0.75 in new alluvial zone of West
Bengal.
ACKNOWLEDGEMENT
Authors are grateful to the University Research and Instructional Farm for
providing land where the field experiment was carried out and also the laboratory
facilities of the Department of Agronomy of the university where both chemical and
physical analysis of the related samples were done well as for analysing the related
samples.
REFERENCES
AOAC. 1995. Official Methods of Analysis, 16th
edition. Association of Official Analytical
Chemists, Washington, DC
Alam, A. N. M. M. U. 1985. Evapotranspiration and yield of corn as related to irrigation
timing during silking. Dissertation Abstract International B (Science and Engineering),
6(6): 1749B-1750B
Bajwa, M. S., Akhtar, A., Hussain, M. R. and Rajan, M. B. 1987. Effect of irrigation
frequencies and nitrogen rates on the yield and protein contents of maize. Pakistan
Journal of Agricultural Research, 8(3): 325-329
Banik, P. and Sharma, R. C. 2009. Yield and resource utilization efficiency in babycorn -
legume - intercropping system in the Eastern Plateau of India. Journal of Sustainable
Agriculture, 33(4): 379-395
Brown, A. J. and Warncke, D. 1988. In: Recommended chemical soil test procedures for the
North Carolina Region, 499. (Dahnke, W.C. Ed.). North Dakota Agricultural
Experimental Station Bulletin. pp. 15-16
Dastane, N. G. 1972. A practical manual for water use research in agriculture. 2nd edition.
Poona, Navabharat Prakashan
Gomez, K. A. and Gomez, A. A. 1984. Statistical Procedures for Agricultural Research,
second edition, John Wiley and Sons, New York
Idnani, L. K. and Gautam, H. K. 2008. Water economization in summer greengram (Vigna
radiata var radiata) as influenced by irrigation regimes and configurations. The Indian
Journal of Agricultural Sciences, 78(3): 214-219
Jackson, M. L. 1973. Soil Chemical Analysis. Asia Publishing House, New Delhi

IRRIGATION AND INTERCROPPING SYSTEM OF MAIZE-MUNGBEAN 101
Mandal, B. K., Rajak, S., Mandal, B. B. and Nandy, S. K. 1990. Yield and economics as
influenced by intercrops of maize (Zea mays L.), groundnut (Arachis hypogaea L.) and
greengram (Phaseolus radiatus L.). The Indian Journal of Agricultural Sciences, 60(3):
209-211
Olsen, S. R., Cole, C. V., Watanale, F. S. and Dean, L. A. 1954. Estimation of available
phosphorus in phosphorus in soils by extraction with sodium bicarbonate. United
States Department of Agriculture, Washington, DC
Piper, C. S. 1966. Mechanical Analysis. Soil and Plant Analysis (reprint for Asia). Hans
Publishers, Mumbai, India. pp: 47-49
Prasad, U. K., Thakur, H. C., Pandey, R. D. and Sharma, N. N. 1987. Effect of irrigation and
nitrogen on winter maize in calcareous saline alkali soil. Indian Journal Agronomy,
32(3): 217-220
Roy, R. K. and Tripathi, R. S. 1987. Effect of irrigation and fertilizer on yield, water use
efficiency and nutrient concentration in winter maize. Indian Journal Agronomy, 32(4):
314-318
Shahbazi, M. and Sarajuoghi, M. 2012. Evaluating Maize Yield in Intercropping with
Mungbean. Annals of Biological Research, 3(3): 14-34
Singh, R.J., Idnani, L.K. and Rai, R.K. 2006. Grain yield, water use efficiency, economics and
soil moisture extraction pattern of summer greengram (Vigna radiata L.) as influenced
by planting and irrigation methods, irrigation schedules and VAM inoculation. Annals
of Agricultural Research, 27(3): 306-310.
Sridhar, V. and Singh, R. A. 1989. Effect of irrigation levels on growth on rabi maize. Annals
of Plant Physiology, 3(2): 212-221
Trivedi, S. J., Savalia, S. G., Ahlawat, R. P. S. and Patel, D. U. 1994. Effect of irrigation
schedules, depth of ploughing and mulches on growth and yield of summer greengram.
Legume Research, 17(2): 93-95
Walkley, A., Black, I. A. 1934. An examination of the deggaraff method for determining soil
organic matter and a proposed modification of the chromic and titration method. Soil
Science 37: 29-38

102 A. M. Puste et al
Table 1. Physico-chemical properties of experimental soil (0-15 cm depth)
Soil property Value Method
Sand (%) 40.2
International Pipette method (Piper, 1966)
Silt (%) 37.5
Clay (%) 22.3
Textural class Sandy Loam
pH 6.45 Blackman’s pH meter (Jackson, 1973)
Organic carbon (%) 0.63 Walkley and Black method, 1934
Total N content (%) 0.059 Micro-Kjeldahl’s method (AOAC, 1995)
Available P (kg ha-1
) 8.71 Olsen’s method, 1954
Available K (kg ha-1
) 104.9 Brown and Wamcke method, 1988
Bulk density (g cc-1
) 0-15 15-30 30-45 45-60 Field method using
core sampler (Dastane,
1972) 1.45 1.47 1.49 1.52
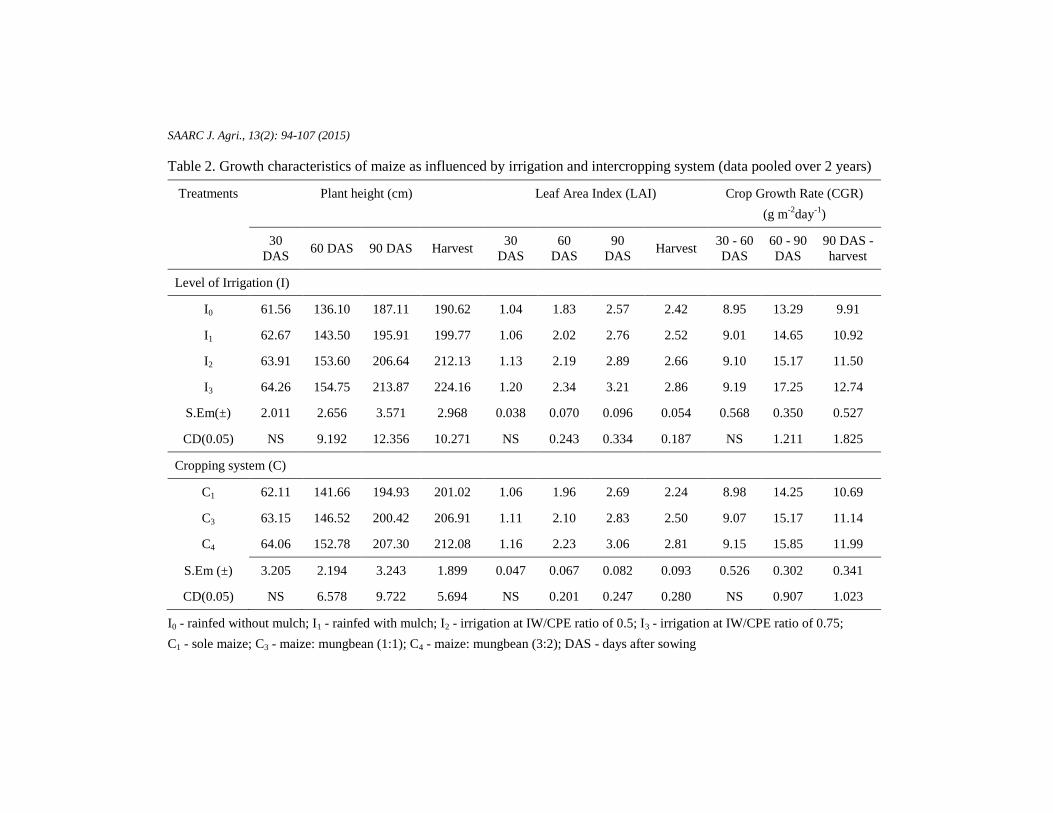
SAARC J. Agri., 13(2): 94-107 (2015)
Table 2. Growth characteristics of maize as influenced by irrigation and intercropping system (data pooled over 2 years)
Treatments Plant height (cm) Leaf Area Index (LAI) Crop Growth Rate (CGR)
(g m-2
day-1
)
30
DAS 60 DAS 90 DAS Harvest
30
DAS
60
DAS
90
DAS Harvest
30 - 60
DAS
60 - 90
DAS
90 DAS -
harvest
Level of Irrigation (I)
I0 61.56 136.10 187.11 190.62 1.04 1.83 2.57 2.42 8.95 13.29 9.91
I1 62.67 143.50 195.91 199.77 1.06 2.02 2.76 2.52 9.01 14.65 10.92
I2 63.91 153.60 206.64 212.13 1.13 2.19 2.89 2.66 9.10 15.17 11.50
I3 64.26 154.75 213.87 224.16 1.20 2.34 3.21 2.86 9.19 17.25 12.74
S.Em(±) 2.011 2.656 3.571 2.968 0.038 0.070 0.096 0.054 0.568 0.350 0.527
CD(0.05) NS 9.192 12.356 10.271 NS 0.243 0.334 0.187 NS 1.211 1.825
Cropping system (C)
C1 62.11 141.66 194.93 201.02 1.06 1.96 2.69 2.24 8.98 14.25 10.69
C3 63.15 146.52 200.42 206.91 1.11 2.10 2.83 2.50 9.07 15.17 11.14
C4 64.06 152.78 207.30 212.08 1.16 2.23 3.06 2.81 9.15 15.85 11.99
S.Em (±) 3.205 2.194 3.243 1.899 0.047 0.067 0.082 0.093 0.526 0.302 0.341
CD(0.05) NS 6.578 9.722 5.694 NS 0.201 0.247 0.280 NS 0.907 1.023
I0 - rainfed without mulch; I1 - rainfed with mulch; I2 - irrigation at IW/CPE ratio of 0.5; I3 - irrigation at IW/CPE ratio of 0.75;
C1 - sole maize; C3 - maize: mungbean (1:1); C4 - maize: mungbean (3:2); DAS - days after sowing
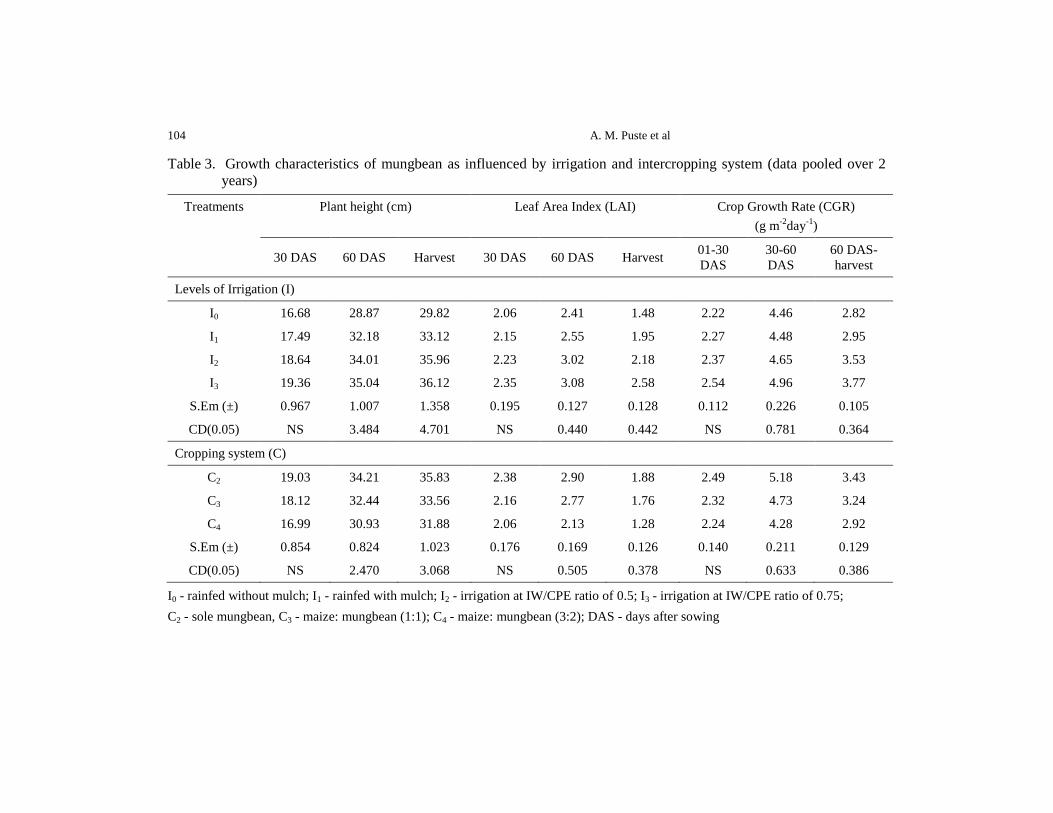
104 A. M. Puste et al
Table 3. Growth characteristics of mungbean as influenced by irrigation and intercropping system (data pooled over 2
years)
Treatments Plant height (cm) Leaf Area Index (LAI) Crop Growth Rate (CGR)
(g m-2
day-1
)
30 DAS 60 DAS Harvest 30 DAS 60 DAS Harvest 01-30
DAS
30-60
DAS
60 DAS-
harvest
Levels of Irrigation (I)
I0 16.68 28.87 29.82 2.06 2.41 1.48 2.22 4.46 2.82
I1 17.49 32.18 33.12 2.15 2.55 1.95 2.27 4.48 2.95
I2 18.64 34.01 35.96 2.23 3.02 2.18 2.37 4.65 3.53
I3 19.36 35.04 36.12 2.35 3.08 2.58 2.54 4.96 3.77
S.Em (±) 0.967 1.007 1.358 0.195 0.127 0.128 0.112 0.226 0.105
CD(0.05) NS 3.484 4.701 NS 0.440 0.442 NS 0.781 0.364
Cropping system (C)
C2 19.03 34.21 35.83 2.38 2.90 1.88 2.49 5.18 3.43
C3 18.12 32.44 33.56 2.16 2.77 1.76 2.32 4.73 3.24
C4 16.99 30.93 31.88 2.06 2.13 1.28 2.24 4.28 2.92
S.Em (±) 0.854 0.824 1.023 0.176 0.169 0.126 0.140 0.211 0.129
CD(0.05) NS 2.470 3.068 NS 0.505 0.378 NS 0.633 0.386
I0 - rainfed without mulch; I1 - rainfed with mulch; I2 - irrigation at IW/CPE ratio of 0.5; I3 - irrigation at IW/CPE ratio of 0.75;
C2 - sole mungbean, C3 - maize: mungbean (1:1); C4 - maize: mungbean (3:2); DAS - days after sowing

IRRIGATION AND INTERCROPPING SYSTEM OF MAIZE-MUNGBEAN 105
Table 4. Yield attributing characters, yield of maize and mungbean as influenced by irrigation and intercropping system
(data pooled over 2 years)
Treatments Maize Mungbean
No. of
cobs plant-
1
No. of
grains cob-
1
Test wt
(g)
Length of
cob (cm)
Grain
yield
(t ha-1)
No. of pods
plant-1
No. of
seeds pod-
1
Test wt (g) Pod length
(cm)
Seed
yield
(t ha-1)
Levels of Irrigation (I)
I0 0.65 218.93 235.93 16.54 1.437 15.65 5.12 22.09 5.29 0.294
I1 0.72 225.74 241.93 18.55 1.728 16.80 6.10 22.56 5.54 0.405
I2 0.99 243.53 244.14 18.58 3.015 18.09 7.75 22.67 5.88 0.582
I3 1.07 257.63 298.63 21.13 3.545 20.92 8.79 23.74 6.07 0.596
S.Em(±) 0.047 5.222 3.148 0.762 0.153 1.026 0.458 0.996 0.072 0.035
C.D.(0.05) 0.161 18.072 NS 2.637 0.531 3.549 1.584 NS 0.248 0.123
Cropping system (C)
C1 0.59 207.88 236.35 17.45 2.970 - - - - -
C2 - - - - - 19.56 7.68 23.11 5.91 0.804
C3 0.76 221.13 239.83 19.94 1.928 16.48 6.38 22.95 5.69 0.347
C4 1.23 250.37 244.31 18.72 2.396 15.55 6.21 21.80 5.48 0.257
S.Em(±) 0.047 0.067 0.082 0.093 0.449 0.767 0.324 0.905 0.113 0.027
C.D.(0.05) NS 0.201 NS 0.280 0.148 2.300 0.970 NS 0.339 0.082
I0 - rainfed without mulch; I1 - rainfed with mulch; I2 - irrigation at IW/CPE ratio of 0.5; I3 - irrigation at IW/CPE ratio of 0.75;
C1 - sole maize, C2 - sole mungbean, C3 - maize: mungbean (1:1); C4 - maize: mungbean (3:2)
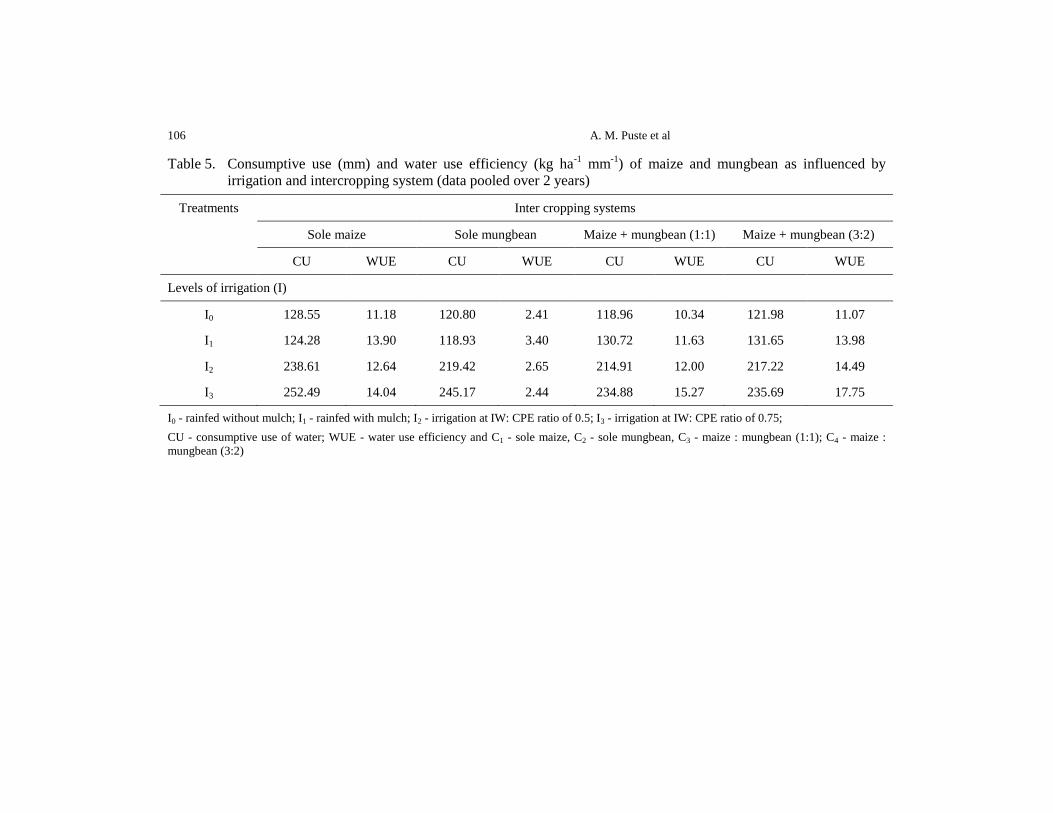
106 A. M. Puste et al
Table 5. Consumptive use (mm) and water use efficiency (kg ha-1
mm-1
) of maize and mungbean as influenced by
irrigation and intercropping system (data pooled over 2 years)
Treatments Inter cropping systems
Sole maize Sole mungbean Maize + mungbean (1:1) Maize + mungbean (3:2)
CU WUE CU WUE CU WUE CU WUE
Levels of irrigation (I)
I0 128.55 11.18 120.80 2.41 118.96 10.34 121.98 11.07
I1 124.28 13.90 118.93 3.40 130.72 11.63 131.65 13.98
I2 238.61 12.64 219.42 2.65 214.91 12.00 217.22 14.49
I3 252.49 14.04 245.17 2.44 234.88 15.27 235.69 17.75
I0 - rainfed without mulch; I1 - rainfed with mulch; I2 - irrigation at IW: CPE ratio of 0.5; I3 - irrigation at IW: CPE ratio of 0.75;
CU - consumptive use of water; WUE - water use efficiency and C1 - sole maize, C2 - sole mungbean, C3 - maize : mungbean (1:1); C4 - maize :
mungbean (3:2)
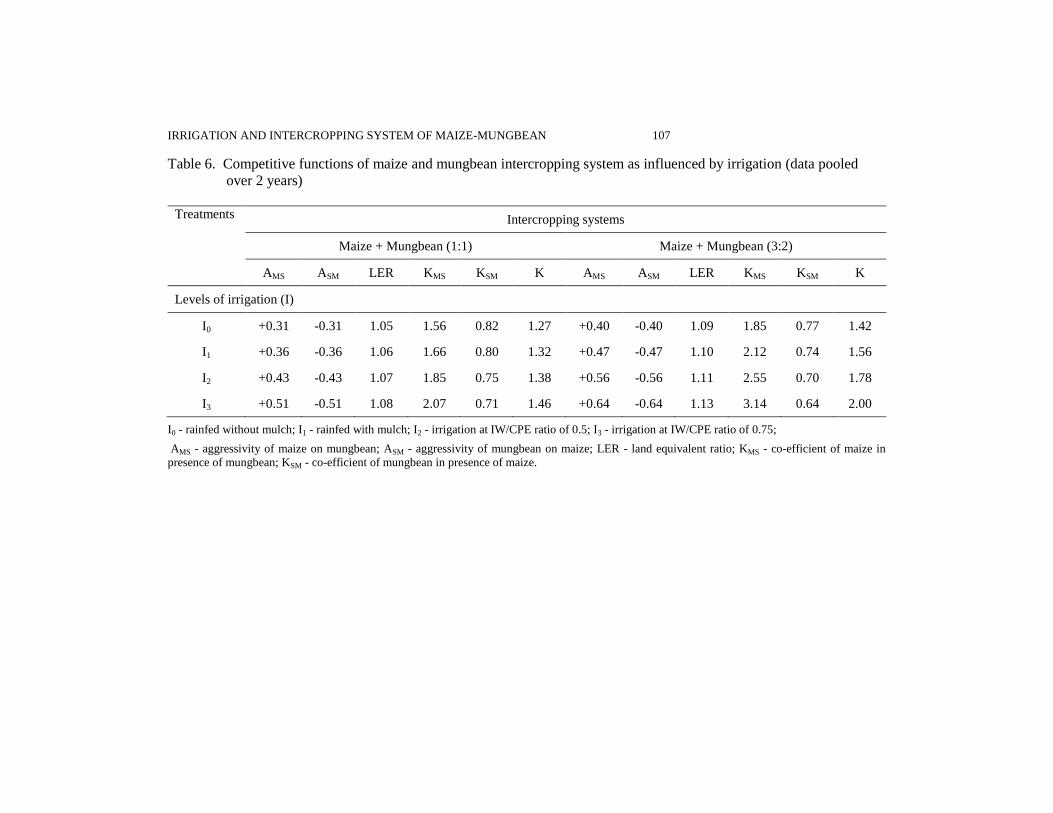
IRRIGATION AND INTERCROPPING SYSTEM OF MAIZE-MUNGBEAN 107
Table 6. Competitive functions of maize and mungbean intercropping system as influenced by irrigation (data pooled
over 2 years)
Treatments Intercropping systems
Maize + Mungbean (1:1) Maize + Mungbean (3:2)
AMS ASM LER KMS KSM K AMS ASM LER KMS KSM K
Levels of irrigation (I)
I0 +0.31 -0.31 1.05 1.56 0.82 1.27 +0.40 -0.40 1.09 1.85 0.77 1.42
I1 +0.36 -0.36 1.06 1.66 0.80 1.32 +0.47 -0.47 1.10 2.12 0.74 1.56
I2 +0.43 -0.43 1.07 1.85 0.75 1.38 +0.56 -0.56 1.11 2.55 0.70 1.78
I3 +0.51 -0.51 1.08 2.07 0.71 1.46 +0.64 -0.64 1.13 3.14 0.64 2.00
I0 - rainfed without mulch; I1 - rainfed with mulch; I2 - irrigation at IW/CPE ratio of 0.5; I3 - irrigation at IW/CPE ratio of 0.75;
AMS - aggressivity of maize on mungbean; ASM - aggressivity of mungbean on maize; LER - land equivalent ratio; KMS - co-efficient of maize in
presence of mungbean; KSM - co-efficient of mungbean in presence of maize.

SAARC J. Agri., 13(2): 108-120 (2015)
EVALUATION OF HEALTH CARE AND HUSBANDRY SYSTEM OF
CALVES AT BUFFALO FARMS IN SOUTHERN BANGLADESH
A. K. Talukder*1
, M. A. Rahman2, M. A. Islam
3, M. T. Islam
4, A. S. M. Selim
5, A.
K. Paul6 and M. A. Rahman
6
Department of Gynecology, Obstetrics and Reproductive Health
Bangabandhu Sheikh Mujibur Rahman Agricultural University, Gazipur 1706, Bangladesh
ABSTRACT
Calves with optimum health play a crucial role for sustainability of the dairy farms. This study was conducted to evaluate the present status of calf health care and husbandry system on 140 buffalo farms in southern Bangladesh. The data were collected during farm visit and recorded in prepared questionnaire. The results of the present study revealed that significantly lower number of farms (15.0%) had calves with good body condition (p<0.05) during farm visit. Navel cord disinfection to the newly born calves was not practiced in all these farms. Colostrum was fed to calves soon after birth in significantly lower number (4.3%) of farms (p<0.05). Furthermore, 13.6% farmers dewormed their buffalo calves (p<0.05) and calves in 11.4% farms were vaccinated against anthrax and foot and mouth disease (p<0.05). Sick calves were treated by buffalo owner themselves in significantly higher proportion of buffalo farms (59.3%) compared with treated by veterinarian (12.9%) and quack (27.8%) (p<0.05). Overall, the buffalo calf mortality was recorded 14.5% of which higher mortality (74.5%) was observed in first three months of age in comparison to other age groups. Moreover, the number of calves died was affected by herd size in the farms (R
2=0.938, p<0.001). The
helminthiasis (20.3%) was identified as most prevalent disease in buffalo calves followed by malnutrition (13.2%), indigestion (12.4%) and navel ill (9.3%). It can be concluded that health care and management system of buffalo calves in these dairies are extremely unsatisfactory and buffalo farmers need proper education and training about scientific knowledge of calf rearing practice.
* Corresponding author email: [email protected]
1Department of Gynecology, Obstetrics and Reproductive Health, BSMRAU, Gazipur-1706, Bangladesh 2 Department of Surgery and Radiology, BSMRAU, Gazipur-1706, Bangladesh 3 Department of Medicine, BSMRAU, Gazipur 1706, Bangladesh 4 Department of Pathobiology, BSMRAU, Gazipur-1706, Bangladesh 5 Department of Animal Science and Nutrition, BSMRAU, Gazipur-1706, Bangladesh 6 Department of Medicine, Surgery and Obstetrics, Faculty of Animal Science and Veterinary Medicine, Patuakhali
Science and Technology University, Babugonj, Barisal-8210, Bangladesh
Received: 23.08.2015
HEALTH CARE AND MANAGEMENT PRACTICES OF BUFFALO CALVES 109
Keywords: Buffalo calf, health care, husbandry system, southern
Bangladesh
INTRODUCTION
One emerging trend in Bangladesh is increasing number of the dairy farms.
This is because; increased mechanization of crop production has resulted in a gradual
reduction in the need for draft animals (Shamsuddin et al., 2006). Bangladesh has
about 1.39 millions buffalo (Osmani, 2012); those are found in the Bramhaputra-
Jamuna flood plain of central Bangladesh and Ganges-Meghna flood–plain of
southern Bangladesh. Buffaloes are mainly raised under an extensive system in the
coastal and hilly areas where large scale pasture land and enough green forage are
available. Other than those, rests are mostly raised under a semi-intensive system on
plane and marshy land where there is limited pasture land. The buffalo farming has
now got popularity because of their outstanding productivity performance in
comparison to that of cows in Bangladesh. It is reported that farmers’ yearly net
income per lactating buffalo (US$ 361±147) is eight times more than that from an
indigenous lactating cow (US$ 47±25) under smallholder dairy farming system at
Kanihari union of Mymensingh district in Bangladesh (Talukder et al., 2008).
Calves are the asset of buffalo farms which first replace the culled cows as
dairy replacement heifers in farm and finally go for production. Health management
and proper nutrition to the calves are considered as two important aspects of the calf
rearing practice (Tiwari et al., 2007). Many research studies have revealed the poor
condition of calves in the buffalo farms wherein the farmers were not much aware
about the scientific management practices of calf (Khan et al., 2007; Tiwari et al.,
2007; Maousami et al., 2013; Matondi et al., 2014). Apart from that, higher calf
mortality is a major impediment to the buffalo farms (Tiwari et al., 2003). Therefore,
it appears that the proper veterinary health care and husbandry practices of calves in
the buffalo farms are essential for sustainable development of the dairying in any
country.
Although, buffalo farming has been an indispensible part for the livelihoods of
buffalo owners in southern region of Bangladesh; however, there is a dearth of
information available on present status of buffalo calf health care and management
practices in these farms. Therefore, this study was conducted to evaluate the present
health care and management system of calves at the buffalo farms in southern region
of Bangladesh.
MATERIALS AND METHODS
Study location and period
This study was conducted in four districts of southern Bangladesh (Barisal
Division) namely Barisal (Bakergonj Upazilla), Patuakhali (Galachipa and Bauphal
110 A. K. Talukder et al
Upazilla), Jhalokati (Nolchiti Upazilla) and Bhola (Char-fassion Upazilla) during the
period from July 2011 to June 2012.
Data collection
One hundred 40 buffalo farms (35 from each district) were included in this
study. A questionnaire was developed to record the relevant information on the
selected parameters. Interview with buffalo owners was made for collection of data
during visit of these farms. The major parameters observed in this study include calf
population, general body condition of calves at farms, health care system (navel care,
deworming practice, vaccination and treatment policy), husbandry practices
(colostrum feeding, milk feeding, housing and bedding), calf mortality and
prevalence of diseases in calves.
Data analysis
Collected data were entered into Microsoft Excel Worksheet 2007.
Descriptive statistical analysis was carried out using Statistical Package for Social
Sciences SPSS version 14.0. One way ANOVA analysis was applied to compare the
data among the groups. Linear regression analysis was carried out to see the effect of
farm size on number of calves died (absolute calf mortality).
RESULTS AND DISCUSSION
Buffalo population
The number of buffalo population per farm is shown in table 1. Barisal had
higher number of buffaloes constituting 48.5 per farm with 18.4 lactating buffaloes
and 15.7 buffalo calves. In Patuakhali, number of buffaloes was 38.9 per farm having
13.7 lactating cows and 11.7 calves. The number of buffaloes, lactating cows and
calves were 22.9, 6.7 and 5.7 per farm, respectively in Bhola District. Buffalo
population was found lower in number in Jhalokati compared to other Districts
(Table 1). The low population of buffaloes in Bhola and Jhalokati Districts might be
due to limited pasture land, high price of concentrate and low access to sell the milk
in these areas. The buffaloes were reared in loose house system and lactating cows
were milked two times daily with their calves used for stimulating milk letdown.
Calves survived on residual milk after the hand milking. Control weaning was not
practiced. The buffaloes were fed mainly on pasture land with limited rice straw, cut-
and-carry grasses and milling by-products as concentrate (crashed rice and/or
sometimes mustard oil cake).
Health condition of buffalo calves
The general body condition and appearance of buffalo calves found in
buffalo farms is presented in table 2. Calves having good body condition were
observed only in 15.0% farms during farm visit. Calves with average body condition
were observed in 50.0% farms, while in 35.0% farms, calves were weak and
emaciated and this difference is statistically significant (p<0.05). Restricted milk
HEALTH CARE AND MANAGEMENT PRACTICES OF BUFFALO CALVES 111
feeding, high prevalence of endoparasitic diseases and overall faulty management
system might lead to higher number of unhealthy calves in these farms.
Health care to calves in buffalo farm
Navel health care practice of newborn buffalo calves is figured out in this
study. No buffalo owners did cut and disinfect the naval cord after birth of calves
(Table 3a). Similar findings have been reported by Kumar (2002) and Tiwari et al.
(2006) who found that buffalo owners in the smallholder buffalo farms also did not
cut and disinfect the naval cord of the calves due to lack of knowledge about the
navel care. Naval cord is a passage through which microorganisms can enter into the
blood or underlying tissues leading navel ill and later joint ill in newly born calves.
Therefore, it is very essential that the buffalo owners should take proper care of the
naval cord immediately after birth of calves. Sharma and Mishra (1987)
recommended cutting the cord with a sterile blade and then dipping the cord in a mild
antiseptic solution. Lack of navel care might be a cause of high prevalence of navel
ill in calves in this study (Figure 2).
This study identifies poor deworming program of buffalo calves by the farmers
(Table 3b). In 13.6% farms, calves were dewormed and remaining 86.4% farms did
not deworm their calves (p<0.05). Unexpectedly, owners did not follow the
recommended deworming schedule when they dewormed their calves. Buffalo
farmers usually dewormed their calves in diseased conditions particularly when the
calves were in anorectic condition or farmers observed worms in the feces. Many
other researchers also reported that the buffalo owners did not deworm their calves
timely due to which the health condition of the calves was poor in the smallholder
buffalo production system (Farook et al., 1999, Singh and Singh, 2000 and Das,
2001). Deworming in calves is essential and regular deworming cycle should be
followed against parasitic infections. This practice should be started on or before two
weeks of age, followed after 21 days and should be repeated three to four times in a
year at regular interval (Tiwari et al., 2007). A major reason of calf mortality is the
parasitic load in the calves due to which their health deteriorates and the calf often
dies (Sharma and Mishra, 1987). Poor deworming practice by farmers might have led
to highest prevalence of helminthiasis in this present study (Figure 2).
The vaccination practice in buffalo calves is shown in table 3(c). In 88.6%
farms, calves were not vaccinated against any infectious diseases and calves of rest
11.4% farms were vaccinated against anthrax and foot and mouth disease (p<0.05).
The result is in agreement with the finding of Mustufa et al. (2009) who reported that
100.0% smallholder buffalo farmers did not vaccinate their calves against any
disease.
Table 3(d) indicates that majority of the dairy owners did not provide proper
medication to the calves which is very much important particularly in neonatal
period. In this study, significantly higher number of buffalo farms (59.3 %) treated
sick calves by buffalo owner themselves and if not cured then called veterinarian
112 A. K. Talukder et al
(p<0.05). Sick calves were treated by registered veterinarian only in 12.9% farms and
by quack (veterinary compounder) in 27.8% farms. Similar to our result, Tiwary et al.
(2007) reported that 64.4% farmers treated their sick calves by themselves in Uttar
Pradesh of India.
Management practices of buffalo calves
Colostrum was fed timely that means soon after birth in significantly
(p<0.05) lower number (4.3%) of farms (Table 4(a)). Calves were not allowed to feed
colostrum in high percentage (42.9%) of buffalo farms. Moreover, colostrum was fed
after release of placenta (after 12 hours of parturition) in 52.8% farms. Results
revealed that buffalo farmers did not feed the colostrum and even in wrong time
when fed. Several authors have reported the similar results (Verma and Sastry, 1994;
Malik and Nagpaul, 1999; Singh et al., 2003; Tiwari et al., 2007). They reported that
buffalo owners feed colostrum to calves only after release of placenta with the belief
that immediate colostrum feeding leads to problem in release of the placenta.
Moreover, Kumar (2002) reported that farmers did not feed colostrum as they
thought that colostrum feeding may lead to diarrhoea in calves. It is the most crucial
period when calves should receive colostrum immediately after birth. Colostrum
should be fed within two to three hours after birth because delay in feeding of
colostrum lead to lowered effectiveness of the colostrum in terms of providing
immunity to calves (Sharma and Mishra, 1987).
This study revealed that milk was fed to calves before and after milking in
significantly higher number (90.7%) of farms (p<0.05). Farmers left one teat full for
calves in few farms (3.5%) and half teat in 5.8% farms (Table 4(b)). Similar to this
present study, Tiwari et al. (2007) observed that 97.8 % farmers provided the milk to
the calves before and after milking only. Milk is more or less a complete food for
young calf, to which gastrointestinal system is adopted for digestion of nutrients
present in it. It has been emphasized that a calf must receive sufficient milk during
first three months or a minimum of 110 liters of whole milk to be fed over a period of
four to five weeks, along with a calf starter having a good quality protein and low
fiber content (Sharma and Mishra, 1987). In our study, the calves were used only to
stimulate milk let down and not for providing the milk to them. Even, after milking,
farmers did not leave enough milk in the udder required for the survival of the calf.
Inadequate milk supply to calves could be a cause of high prevalence of malnutrition
in these farms (Figure 2).
The housing condition for calves is important for optimum health. Calves
were kept in the corner of shed in 85.7% farms and without any bedding material in
55.0% farms. Individual space for calf was provided in 5.7% farms. Straw as bedding
material was provided in 45.0% farms (Table 4(d)). The finding is supported by
result of Tiwari et al. (2007) who reported that majority of the dairy owners (92.2%)
neither had a separate shed for the calves nor provided any bedding material (70.0%).
The housing conditions of the livestock greatly affects their health and productive
HEALTH CARE AND MANAGEMENT PRACTICES OF BUFFALO CALVES 113
performance specially the calves which are more prone to diseases as their immunity
level is low. Furthermore, exposure to extreme climatic variations such as extreme
heat and extreme cold leads to physical stress and the body of calves is not adapted to
bear such stress and the calves may collapse (Tiwari et al. 2007).
Mortality of buffalo calf
Table 5 shows the mortality rate of buffalo calves. During the period from
July 2010 to June 2011, a total of 482 buffalo calves were born of which 70 died
(14.5%). Mortality rate was higher (10.8%) during first three months age of the
calves compared with other age groups. However, mortality rate did not vary
according to sex of the calves and seasons, which is in agreement with the finding of
Khan et al. (2007). On the other hand, mortality number of the buffalo calves was
significantly affected by total buffalo population in the farms (R2=0.938, p<0.001)
(Figure 1). This could be due to farmers were not able to manage and care calves
because of difficulties in maintaining large number of buffaloes in large farms. Calf
mortality in our study is lower than that of Khan et al. (2007) who recorded 17.98%
mortality in buffalo calves but similar to our finding they reported that calf mortality
rate was higher during the first three months of age, while lower at the age group of
three months and above. Moreover, Maousami et al. (2013) reported 22.48% buffalo
calf mortality at Bareilly and Surguja districts of Uttar Pradesh in India. The variation
of calf mortality might be due to different buffalo breeds and management system
adopted by the local farmers. However, improper colostrum feeding, lack of navel
care, inappropriate deworming plan, inadequate vaccination practice and above all
treatment of ill calves by buffalo owner themselves or quack could be a cause of calf
mortality of 14.5% in the buffalo farms in this present study.
Prevalence of buffalo calf diseases
The frequency of occurrence of general disease and disease conditions of
buffalo calves is presented in figure 2. The helminthiasis (20.3%) was identified as
most prevalent disease in buffalo calves followed by malnutrition (13.2%),
indigestion (12.4%) and navel ill (9.3%). The prevalence of metabolic disorder,
diarrhoea, anorexia, and eye diseases were 7.8%, 5.7%, 5.3%% and 3.4%,
respectively. Pneumonia and ectoparasitic infestations both had 4.5% prevalence rate.
Tiwari et al. (2006) reported the most common and frequent occurring disease in
buffalo calves was diarrhoea (82.2%) followed by endoparasite infestation (80.0%),
ectoparasite infestation (78.9%), naval ill (66.7%) and pneumonia (26.7%). The
variation on pattern of disease occurrence could be due to variation of buffalo breeds,
season and geographical location of the study and management system of the farms.
CONCLUSION
The results of the present study concluded that health care and management
practices of calves in dairy farms is highly neglected and pattern of calf rearing is
almost similar in four districts of southern region of Bangladesh. Buffalo farmers

114 A. K. Talukder et al
need proper education, training and extension works about scientific management of
calf health care and husbandry practice to ensure the best quality of germplasm of
buffalo for the sustainable dairy development of Bangladesh.
ACKNOWLEDGEMENTS
We are thankful to Postgraduate Studies and Research (PGSR) of Patuakhali
Science and Technology University, Dumki, Patuakhali, Bangladesh for financial
support (Grant No. PGS-PSTU-06). Sincere gratitude is also extended to the buffalo
farmers for their cooperation.
REFERENCES
Das, S. 2001. Small scale buffalo production systems and their sustainability: A case analysis.
M .V. Sc. Thesis. Indian Veterinary Research Institute, Izatnagar, India
Farooq, M. K., Abdul, Q. and Qudoos, A. 1999. Constraints in the adoption of modern
livestock practices. Pakistan Veterinary Journal, 19: 53-55
Khan, Z. U., Khan, S., Ahmad, N. and Raziq, A. 2007. Investigation of mortality incidence
and managemental practices in buffalo calves at commercial dairy farms in Peshawar
city. Journal of Agricultural and Biological Science, 2: 16-22
Kumar, S. 2002. Livestock production system of the resources poor in Mirzapur District
(U.P.). M.V.Sc. Thesis. Indian Veterinary Research Institute, Izatnagar, India
Malik, D. S. and Nagpaul, P. K. 1999. Studies on milking and calf rearing management
practices of Murrah buffalo in its home tract of Haryana. Indian Journal of Animal
Production and Management, 15: 52-54
Maousami, B. P., Singh, R., Kumar, V. and Dohare, A. 2013. Analysis of buffalo calf
management practices followed by buffalo owners. Journal of Animal Science
Advances, 3: 129-133
Matondi, G. H. M., Nyamushamba, G. B., Motsi, T. T. and Masama, E. 2014. Evaluation of
smallholder dairy calf rearing systems in Zimbabwe. Livestock Research for Rural
Development, 26 (3)
Mustafa, M. Y., Younus, M., Saleem, K. and Mehmood, B. 2009. Management practices and
health care of buffalo calf in District Sheikhupura: a field study. International Journal
of Advanced Veterinary Medical Science, 3: 25-30
Osmani, M. G. 2012. Vision 2021: Role of veterinarian in Bangladesh. Bangladesh
Veterinarians’ Directory, pp 90-103
Shamsuddin, M., Goodger, W. J., Hossein, M. S., Bennett, A. T. and Nordlund, K. 2006. A
survey to identify economic opportunities for smallholder dairy farms in Bangladesh.
Tropical Animal Health Production, 38: 131-40
Sharma, M. C. and Mishra, R. R.1987. Livestock health and management. Khanna Publishers,
New Delhi

HEALTH CARE AND MANAGEMENT PRACTICES OF BUFFALO CALVES 115
Singh, B. P., Tiwari, R. and Arya, H. P. S. 2003. Technology adoption behaviour of buffalo
owners- A participatory study. In proceedings of the 4th Asian buffalo congress, held at
New Delhi during 25-28 Feb, 59
Singh, R. and Singh, N. 2000. Influence of socio-economic variables on adoption of buffalo
calf rearing management practices in rural Haryana. Indian Journal of Animal
Sciences, 70: 325-326
Talukder, A. K., Bhattacharjee, J., Rahman, M. B. and Shamsuddin, M. Shamsuddin. 2008. A
community-based productivity veterinary service to smallholder dairy farmers in
Mymensingh. In proceedings of Fourteenth Annual Scientific Conference, Bangladesh
Society for Veterinary Education and Research, 33: 35
Tiwari, R., Singh, B. P. and Arya, H. P. S. 2003. Buffalo rearing practices in small farms:
Few case studies. In proceedings of the 4th Asian Buffalo Congress, held at New Delhi
during 25-28 Feb: 67
Tiwari, R., Sharma, M. C. and Singh, B. P. 2006. Studies on buffalo health and production
practices in small farms. Indian Journal of Veterinary Medicine, 26: 62-64
Tiwari, R., Sharma, M. C. and Singh, B. P. 2007. Buffalo calf health care in commercial dairy
farms: a field study in Uttar Pradesh (India). Livestock Research for Rural
Development, 19 (3)
Verma, A. K. and Sastry, N. S. R. 1994. Milking management of Murrah buffaloes followed
in rural India. In proceedings of the 4th world buffalo congress, held at Sao Paulo,
Brazil, Volume 2
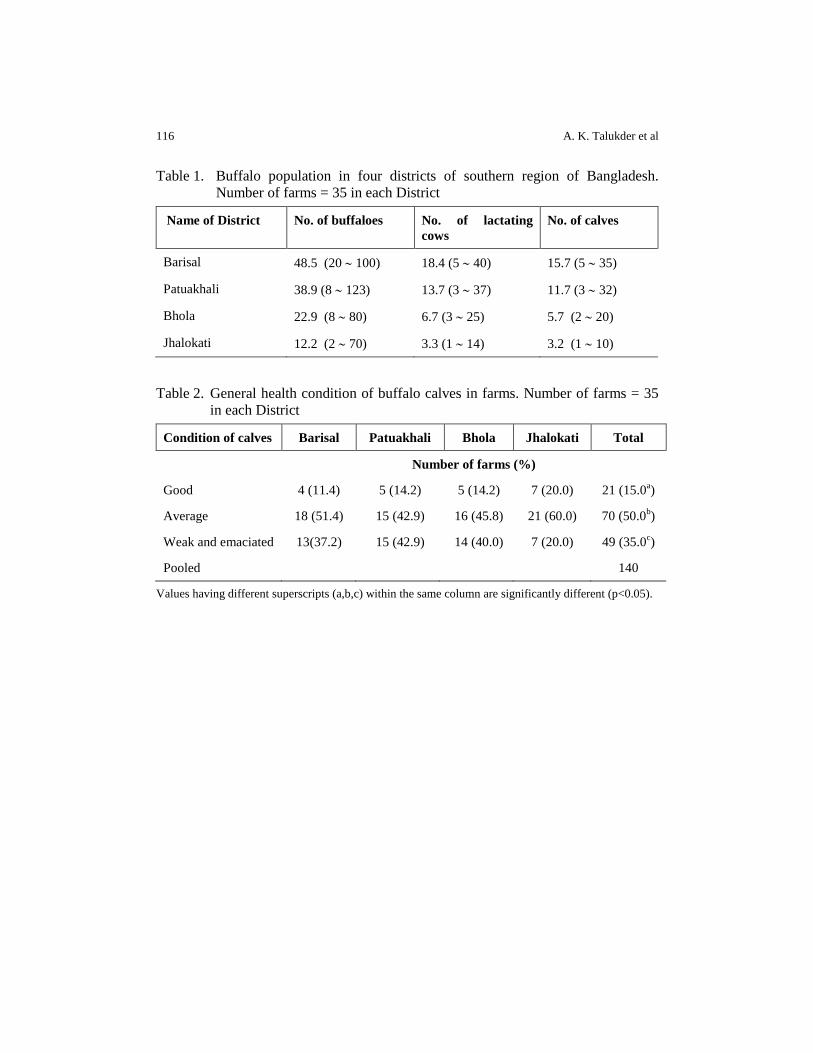
116 A. K. Talukder et al
Table 1. Buffalo population in four districts of southern region of Bangladesh.
Number of farms = 35 in each District
Name of District No. of buffaloes No. of lactating
cows
No. of calves
Barisal 48.5 (20 100) 18.4 (5 40) 15.7 (5 35)
Patuakhali 38.9 (8 123) 13.7 (3 37) 11.7 (3 32)
Bhola 22.9 (8 80) 6.7 (3 25) 5.7 (2 20)
Jhalokati 12.2 (2 70) 3.3 (1 14) 3.2 (1 10)
Table 2. General health condition of buffalo calves in farms. Number of farms = 35
in each District
Condition of calves Barisal Patuakhali Bhola Jhalokati Total
Number of farms (%)
Good 4 (11.4) 5 (14.2) 5 (14.2) 7 (20.0) 21 (15.0a)
Average 18 (51.4) 15 (42.9) 16 (45.8) 21 (60.0) 70 (50.0b)
Weak and emaciated 13(37.2) 15 (42.9) 14 (40.0) 7 (20.0) 49 (35.0c)
Pooled 140
Values having different superscripts (a,b,c) within the same column are significantly different (p<0.05).
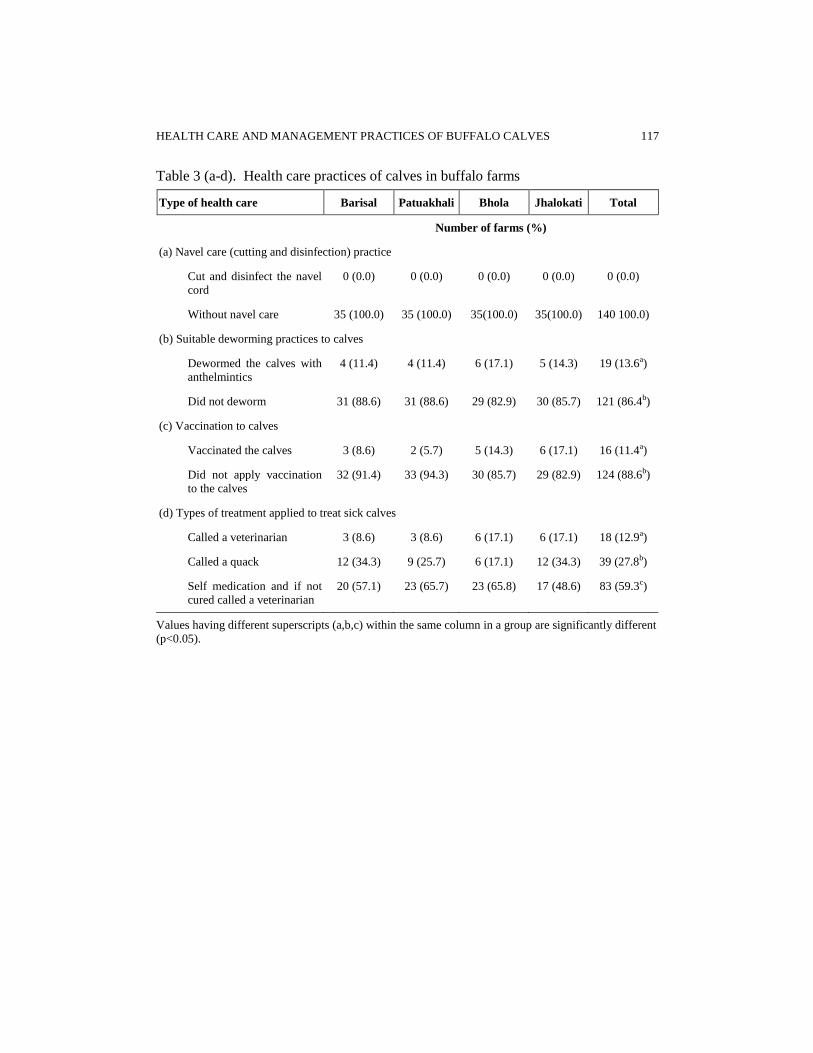
HEALTH CARE AND MANAGEMENT PRACTICES OF BUFFALO CALVES 117
Table 3 (a-d). Health care practices of calves in buffalo farms
Type of health care Barisal Patuakhali Bhola Jhalokati Total
Number of farms (%)
(a) Navel care (cutting and disinfection) practice
Cut and disinfect the navel
cord
0 (0.0) 0 (0.0) 0 (0.0) 0 (0.0) 0 (0.0)
Without navel care 35 (100.0) 35 (100.0) 35(100.0) 35(100.0) 140 100.0)
(b) Suitable deworming practices to calves
Dewormed the calves with
anthelmintics
4 (11.4) 4 (11.4) 6 (17.1) 5 (14.3) 19 (13.6a)
Did not deworm 31 (88.6) 31 (88.6) 29 (82.9) 30 (85.7) 121 (86.4b)
(c) Vaccination to calves
Vaccinated the calves 3 (8.6) 2 (5.7) 5 (14.3) 6 (17.1) 16 (11.4a)
Did not apply vaccination
to the calves
32 (91.4) 33 (94.3) 30 (85.7) 29 (82.9) 124 (88.6b)
(d) Types of treatment applied to treat sick calves
Called a veterinarian 3 (8.6) 3 (8.6) 6 (17.1) 6 (17.1) 18 (12.9a)
Called a quack 12 (34.3) 9 (25.7) 6 (17.1) 12 (34.3) 39 (27.8b)
Self medication and if not
cured called a veterinarian
20 (57.1) 23 (65.7) 23 (65.8) 17 (48.6) 83 (59.3c)
Values having different superscripts (a,b,c) within the same column in a group are significantly different
(p<0.05).
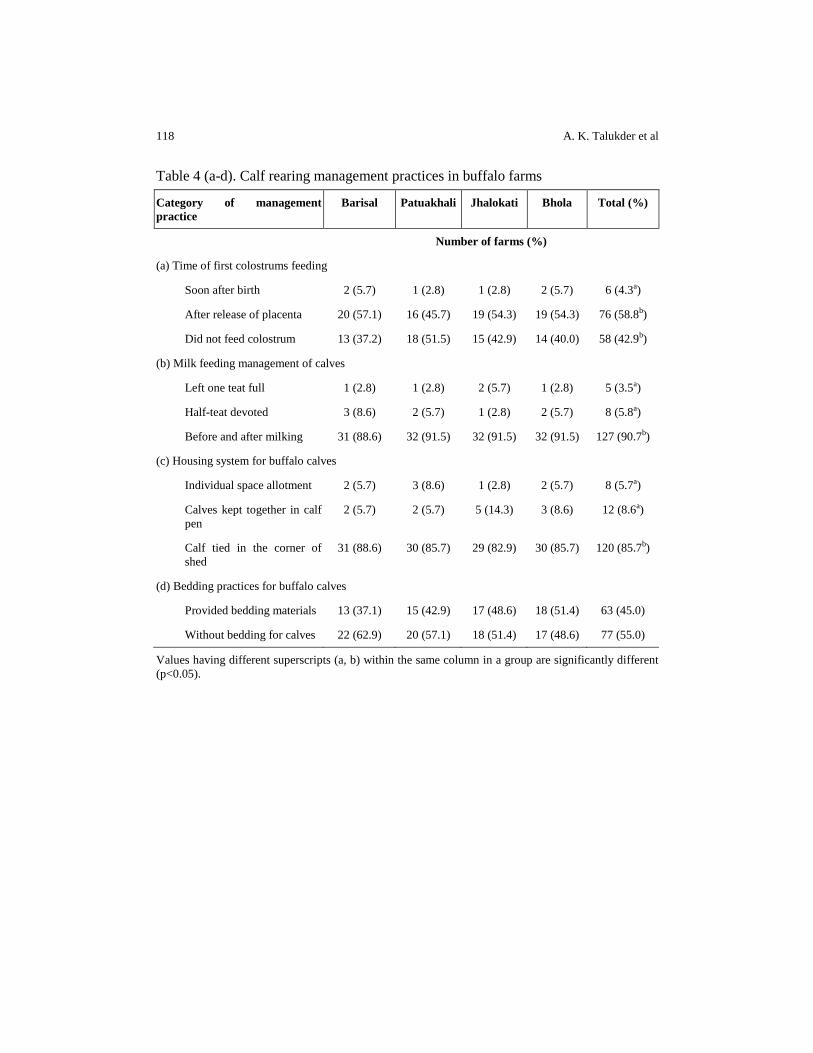
118 A. K. Talukder et al
Table 4 (a-d). Calf rearing management practices in buffalo farms
Category of management
practice
Barisal Patuakhali Jhalokati Bhola Total (%)
Number of farms (%)
(a) Time of first colostrums feeding
Soon after birth 2 (5.7) 1 (2.8) 1 (2.8) 2 (5.7) 6 (4.3a)
After release of placenta 20 (57.1) 16 (45.7) 19 (54.3) 19 (54.3) 76 (58.8b)
Did not feed colostrum 13 (37.2) 18 (51.5) 15 (42.9) 14 (40.0) 58 (42.9b)
(b) Milk feeding management of calves
Left one teat full 1 (2.8) 1 (2.8) 2 (5.7) 1 (2.8) 5 (3.5a)
Half-teat devoted 3 (8.6) 2 (5.7) 1 (2.8) 2 (5.7) 8 (5.8a)
Before and after milking 31 (88.6) 32 (91.5) 32 (91.5) 32 (91.5) 127 (90.7b)
(c) Housing system for buffalo calves
Individual space allotment 2 (5.7) 3 (8.6) 1 (2.8) 2 (5.7) 8 (5.7a)
Calves kept together in calf
pen
2 (5.7) 2 (5.7) 5 (14.3) 3 (8.6) 12 (8.6a)
Calf tied in the corner of
shed
31 (88.6) 30 (85.7) 29 (82.9) 30 (85.7) 120 (85.7b)
(d) Bedding practices for buffalo calves
Provided bedding materials 13 (37.1) 15 (42.9) 17 (48.6) 18 (51.4) 63 (45.0)
Without bedding for calves 22 (62.9) 20 (57.1) 18 (51.4) 17 (48.6) 77 (55.0)
Values having different superscripts (a, b) within the same column in a group are significantly different
(p<0.05).

HEALTH CARE AND MANAGEMENT PRACTICES OF BUFFALO CALVES 119
Table 5. Mortality of buffalo calves during the period from July 2010 to June 2011.
Number of calves born = 482
Factors No. of calves died Mortality rate (%)
(a) Effect of age (month) on calf mortality
1-3 52 10.8
4-6 13 2.7
>6-12 5 1.0
Pooled 70 14.5
(b) Effect of sex on calf mortality
Male 38 7.9
Female 32 6.6
(c) Effect of season on calf mortality
Summer 23 4.8
Autumn 21 4.4
Winter 26 5.3

120 A. K. Talukder et al
(R2=0.938, p<0.001).
Figure 1. Relationship between number of calves died (absolute calf mortality) in the farms
and farm size.
Figure 2. Frequency of general disease and disease conditions of buffalo calves. Total
number of buffalo calves = 236.
y = 0.331x + 0.483
R² = 0.938
0
5
10
15
20
25
30
35
40
45
0 25 50 75 100 125 150
Nu
mb
er o
f ca
lves
die
d
Farm size
7.6 5.7 4.5 5.31.8
13.2
20.3
7.812.4
4.5 3.49.3
3.40.8
05
10152025
Fev
er
Dia
rrhoea
Pneu
monia
Anore
xia
Cal
f sc
our
Mal
nutr
itio
n
Hel
min
thia
sis
Met
aboli
c …
Indig
esti
on
Ect
opar
asit
…
Eye
dis
ease
s
Nav
ell
ill
Wound
Absc
ess
% o
f si
ck c
alves
General disease and disease conditions
SAARC J. Agri., 13(2): 121-130 (2015)
PRODUCTION POTENTIAL OF NEWLY RELEASED
POTATO (Solanum tuberosum L.) CULTIVARS UNDER
DIFFERENT NITROGEN LEVELS
S. K. Das*, H. Banerjee, A. Chakraborty and A. Sarkar
AICRP on Potato, Directorate of Research, Bidhan Chandra Krishi Viswavidyalaya, Kalyani- 741235,
Nadia, West Bengal, India
ABSTRACT
Field experiments were conducted during rabi seasons of 2011-12, 2012-13, 2013-14 and 2014-15 at C-unit research farm of Bidhan Chandra Krishi Viswavidyalaya, Kalyani, Nadia, West Bengal, India to study the effects of different levels of nitrogen on the productivity of newly released potato (Solanum tuberosum L.) cultivars under lower Gangetic plains of West Bengal. The experiment was laid out in a factorial randomized block design with four replications having ten treatment combinations viz. two levels of newly released cultivars (V1 -Kufri Himalini and V2 - Kufri Shailja) as factor A and five levels of nitrogen (N0 -0 kg ha
-1, N75 -75 kg ha
-1, N150 -150 kg ha
-1 N225-225 kg ha
-1
N300 -300 kg ha-1
) as factor B. Experimental results revealed that highest tuber yield (25.77 t ha
-1) was recorded with Kufri Himalini receiving 300
kg N ha-1
followed by 24.64 t ha-1
and 23.64 t ha-1
with 225 kg N ha-1
and 150 kg N ha
-1 respectively which is quite higher than the state average of
22.02 t ha-1
obtained from the state recommended dose of 200 kg N ha
-1,
150 P2O5 ha-1
and150 K2O ha-1
. Thus recently released variety Kufri
Himalini, having moderate resistance against late blight, which is a serious problem in the state at present can be a better option for the farmers of the state to raise the potato production. Kufri Himalini produced significantly higher (14.1%) total tuber yield over Kufri Shailja and it was found to be more acceptable to the farmers in terms of production of marketable tuber (> 75 g grade). Grade wise tuber yield of potato was significantly influenced by N levels. Irrespective of cultivars application of 300 kg N ha
-1 along with recommended dose of P and K
recorded the highest total potato tuber yield (23.55 t ha-1
) which was found statistically at par with the application of 225 kg N ha
-1 and 150 kg
N ha-1
. Nitrogen fertilization improved the tuber yield of potato by 49.5 to 82.1% over control. Kufri Himalini was more responsive to fertilizer nitrogen than Kufri Shailja as it recorded higher agronomic efficiency
* Corresponding author email: [email protected]
Received: 09.09.2015
122 S. K. Das et al
(AEN), apparent recovery (REN) and physiological efficiency (PEN) at all nitrogen levels. There was a positive balance of nitrogen found in all treatments. Net gain of soil N was highest with ‘Kufri Himalini’ receiving 150 kg N ha
-1. Kufri Himalini gave highest net return with 300 kg N ha
-1.
Keywords: Cultivars, economics, nitrogen balance, nitrogen uptake efficiency, potato, tuber yield
INTRODUCTION
West Bengal is the second largest potato growing state in India with a
production of 9.0 million tonnes from an area of 409.7 thousand hectares, while the
productivity was 22.02 t ha-1
during 2013-14 (Directorate of Agriculture, WB, 2014).
The state accounts for one-third of the country’s total potato production. The
problems in potato cultivation in this area are lack of quality seed, new fertilizer
responsive cultivar and appropriate doses of fertilizers. This situation can be
overcome by using improved potato cultivars having better yield potential and also
adopting proper nutrient management practices. The two new potato cultivars ‘Kufri
Himalini’ and ‘Kufri Shailja’, having higher yield potential may provide stability to
potato cultivation where late blight disease is a recurring feature. Potato crop being
highly exhaustive and responsive, and having high rate of production per unit area
and time, requires higher amount of nutrients especially nitrogen (N). On an average,
a 90 days potato crop producing 20 tonnes tubers per hectare requires about 100 kg
nitrogen to be removed in the form of tuber and haulm. Nitrogen uptake on per day
basis is sometime even more than 1.5 kg ha-1
during active growth period (Kumar and
Trehan, 2012). Nitrogen plays an important role in crop growth and development
resulting in increased size and number of tubers ultimately enhancing total yield
(Kumar et al., 2007). In addition, under or oversupply of N may affect tuber
production. Moreover, maintaining an adequate supply of N in the root zone of potato
without leaching is important for optimal production of marketable quality tubers. On
the contrary, excessive application leads to delayed maturity, poor tuber quality and
occasional reduction in tuber yield (Alva, 2004). Agronomic research on macro-
nutrient management aspect showed that some newly released potato cultivars for
processing requires approximately 150% higher nitrogen and potassium over current
table-purpose potato cultivars. Recent diagnostic survey also indicates that in many
intensively cultivated areas, farmers have resorted to use of greater than the
recommended dose of fertilizer (RDF), particularly N to maintain crop productivity.
Potato cultivars differ in their growth behaviour and yield potential, and therefore, it
is important to evaluate each genotype for its attributes. Keeping the above facts in
view, this experiment was initiated with the objective to investigate the effects of
different levels of nitrogen on the productivity, nitrogen uptake efficiency, nitrogen
balance and economics of two newly released potato (Solanum tuberosum L.)
cultivars under lower Gangetic plains of West Bengal.

PRODUCTION POTENTIAL OF POTATO 123
MATERIALS AND METHODS
Field experiments were conducted for four years at C-unit research farm
(Kalyani) of Bidhan Chandra Krishi Viswavidyalaya, Nadia, West Bengal, India
situated at 22º58’ N latitude and 88º3’E longitude with an altitude of 9.75m above
mean sea (MSL) during rabi 2011-12, 2012-13, 2013-14 and 2014-15. The soil of the
experimental field was sandy loam in texture and slightly alkaline in reaction (pH
7.2) having an organic carbon content of 0.56%, 183.26 kg available N ha-1
, 16.8 kg
available P2O5 ha-1
, 132 kg available K2O ha-1
. The experiment was laid out in a
factorial randomized block design with four replications having ten treatment
combinations viz. two levels of cultivars (V1 -Kufri Himalini and V2 - Kufri Shailja)
as factor A and five levels of nitrogen (N0 -0 kg ha-1
, N75 -75 kg ha-1
, N150 -150 kg ha-1
N225-225 kg ha-1
N300 -300 kg ha-1
) as factor B with a plot size of 5 m X 3 m. The crop
was planted on fourth week of November, 2011-12, 2012-13, 2013-14 and 2014-15
respectively. Tubers weighing 30–40 g each were planted in the furrows with a depth
of planting of 3–4 cm and spacing of 60 cm X 20 cm and finally covered with soil.
Phosphorus and potassium were applied at their recommended doses i.e. 150 kg ha-1
.
Nitrogen (N), phosphorus (P) and potassium (K) were applied through urea, single
super phosphate and muriate of potash respectively. Half of N, full dose of P and K
were applied as basal. Rest half N was top dressed at 30 days after planting (DAP)
followed by earthing up. Pre-emergence application of Sencor (Metribuzin) @ 0.75
kg a.i. ha-1
was done at 3 DAP followed by 1 hand-weeding at 20 DAP to promote
early crop growth. As a prophylactic measure, spraying (twice) with Dithane M-45
(Mancozeb) @ 0.2% at 40 and 60 DAP was done against late blight. Dimethoate
(Rogor) @ 0.1% was also sprayed (twice) at 45 and 65 DAP for controlling aphids
and other insects. Haulms were cut in the last week of February in all the three
seasons after the crop attained maturity. Harvesting was done 15 days after haulm
cutting, and the crop lines were opened with the help of plough. Potato tubers were
dug out from each plot manually. Data on grade wise tuber yield (t ha-1
) and total
tuber yield (t ha-1
) were recorded at harvest from each net plot area. Nitrogen
efficiency was calculated using following formulae cited by Singh and Singh (2012).
Agronomic efficiency of N (AEN) = YN-YC / Na
Apparent recovery of N (REN) = UN-UC / Na
Physiological efficiency of N (PEN) = YN-YC / UN-UC
where, Y and U refer to yield of potato and nitrogen uptake by potato and
subsequently N and C refer to nitrogen fertilizer and control plots respectively. Na is
nutrient added. All values are in kg ha-1
. Estimation of nutrient-use efficiencies
followed the framework described by Cassman et al. (1998). Soil and plant samples
were analysed for total N following standard procedures. The economic parameters
(cost of cultivation, gross returns and net returns) were worked on the basis of
prevailing market prices of inputs and outputs. Nutrient uptake was calculated by
multiplying the yield with the concentration of particular nutrient. Analysis of
124 S. K. Das et al
variance of the data in the experimental design and comparison of means at p≤0.05
were carried out, using MSTAT-C software.
RESULTS AND DISCUSSION
Performance of cultivars
Experimental results revealed that plant emergence of potato was not
significantly influenced by cultivars. It was 92.83% in case of Kufri Himalini and
91.21% in Kufri Shailja. Irrespective of nitrogen levels the variety Kufri Himalini
recorded significantly higher plant height (75.15 cm), number of shoots per plant
(5.17) and leaf area index (0.83) at 50 DAP (Table 1). Experimental results also
revealed that grade wise tuber production was significantly influenced by the
cultivars (Table. 2). Kufri Himalini recorded significantly higher tuber yield with
respect to 0-25 g grade tubers (3.25 t ha-1
) and > 75 g grade tubers (8.90 t ha-1
) but
both the cultivars were found statistically at par with respect to yield of 25-50 g grade
tubers and 50-75 g grade tubers. Thus, it was evident that Kufri Himalini would be
more acceptable to the farmers in terms of production of marketable tuber i.e. > 75 g
grade. Kufri Himalini also produced significantly higher (14.1%) total tuber yield
(21.45 t ha-1
) over Kufri Shailja (18.80 t ha-1
) might be owing to higher LAI acted
over the tuber bulking period resulting in increased dry-matter accumulation and
greater tuber bulking rate as reported my Mozumder et al. (2014).
Effect of nitrogen
Experimental results revealed that plant emergence of potato was not
significantly influenced by nitrogen (N) levels. It ranged from 90.31 to 93.85%.
Irrespective of cultivars, plant height of potato was significantly influenced by
nitrogen levels. Application of 225 kg N ha-1
recorded highest plant height (81.28
cm) which was found at par with application of 300 kg N ha-1
(Table.1). Application
of nitrogen at different doses increased the plant height of potato by 41.4 to 68.7%.
Different N levels significantly increased the number of shoots per plant and leaf area
index over control. Highest number of shoots per plant (5.00) was recorded with the
application of 150 kg N ha-1
and highest LAI (1.01) at 50 DAP was recorded with
300 kg N ha-1
though it was at par with the application of 225 kg N ha-1
,150 kg N ha-1
and 75 kg N ha-1
. Experimental results revealed that grade wise tuber yield of potato
was significantly influenced by N levels (Table. 2). Application of 300 kg N ha-1
recorded highest amount of 0-25 g grade tubers (3.52 t ha-1
), 50-75 g grade tubers
(5.92 t ha-1
) and > 75 g grade tubers (9.89 t ha-1
) whereas, application of 225 kg N ha-
1 recorded highest amount of 25-50 g grade tubers (5.32 t ha
-1). Thus, it was evident
that application of 300 kg N ha-1
produced more amount of marketable tubers i.e. 50-
75 g grade and >75 g grade tubers. Application of nitrogen fertilizer significantly
increased the total tuber yield of potato. Response to higher fertilization may be
linked to the increase in total leaf area which in turn increased the amount of solar
radiation intercepted, and more photo-assimilate might have been produced and
PRODUCTION POTENTIAL OF POTATO 125
assimilated to the tubers (Baishya et al., 2013). Minimum total tuber yield was
recorded in the control (12.93 t ha-1
). Total tuber yield showed increasing trend with
the increase in N levels up to 300 kg N ha-1
. This result corroborated with the
findings of Sarkar et al. (2011), Jatav et al. (2013) and Vaezzadeh and
Naderidarbaghshahi (2012). Among the nitrogen levels, application of 300 kg N ha-1
along with recommended dose of P and K recorded the highest total potato tuber
yield (23.55 t ha-1
) which was found statistically at par with the application of 225 kg
N ha-1
and 150 kg N ha-1
along with recommended dose of P and K. Similar findings
was also reported by Mozumder et al. (2014). Nitrogen fertilization improved the
tuber yield of potato by 49.5 to 82.1% over control.
Interaction effect
Experimental results revealed that maximum tuber yield for both the
cultivars was obtained with 300 kg N ha-1
. Plant emergence of potato, plant height,
number of shoots per plant and LAI were not significantly influenced by interaction
of cultivars and N-levels (Table 1). It was also observed that grade wise tuber
production was not significantly influenced by the interaction of cultivars and N-
levels except in case of 25-50 g tuber grade (Table 2). Interaction effect of these two
factors had no significant impact on the total potato tuber yield. However, highest
tuber yield (25.77 t ha-1
) was recorded with Kufri Himalini receiving 300 kg N ha-1
followed by 24.64 t ha-1
and 23.64 t ha-1
with 225 kg N ha-1
and 150 kg N ha-1
respectively with the same variety which is quite higher than the state average of
22.02 t ha-1
obtained from the state recommended dose of 200 kg N ha
-1, 150 P2O5 ha
-
1 and150 K2O ha
-1. Thus recently released variety Kufri Himalini, having moderate
resistance against late blight can be a better option for the farmers of the state to raise
the potato production. Lowest tuber yield (12.86 t ha-1
) was recorded with Kufri
Shailja grown under control plot. It was also observed that Kufri Himalini was more
responsive to fertilizer nitrogen than Kufri Shailja (Figure 1).
Nitrogen uptake efficiencies
Agronomic efficiency (AEN) was higher in ‘Kufri Himalini’ potato at all
levels of N compared to ‘Kufri Shailja’ (Table 3). Agronomic efficiency was the
maximum at 75 kg N ha-1
, and decreased to lowest at highest N dose (300 kg N ha-1
).
It decreased linearly with every incremental dose of N, confirming the findings of
Love et al. (2005), Kumar et al. (2008) and Mozumder et al. (2014). Among the
cultivars under study, maximum AEN was observed when minimum dose of N was
applied. This was due to the fact that input-output relationship follows the law of
diminishing return as far as the relationship between N and yield is concerned. In
general, agronomic use efficiency decreased with increasing dose of N. The efficient
cultivars gave higher tuber yield under nutrient stress (i.e. with less dose of N) than
less efficient cultivars. The main reason for higher nitrogen efficiency in the presence
or absence of N was the capacity of a genotype to use/ absorb more N per unit from
soil (Trehan, 2009). Thus ‘Kufri Himalini’ produced more yield with less dose of

126 S. K. Das et al
nitrogen. Apparent recovery (REN) was higher in ‘Kufri Himalini’ at all levels of N
compared to ‘Kufri Shailja’. Highest apparent recovery for both the cultivars were
recorded at 150 kg N ha-1
and lowest with 225 kg N ha-1
. Physiological efficiency
(PEN) was recorded higher in ‘Kufri Himalini’ at all levels of N compared to ‘Kufri
Shailja’. In both the cultivars, physiological efficiency decreased with the increase in
N level from 75 to 300 kg N ha-1
. Data also revealed that both the cultivars showed
lower PEN (42.1 and 37.2) with highest N level (300 kg N ha-1
).
Nitrogen balance
There was a positive balance of nitrogen in all treatments (Table 4). Fixed
nitrogen might have been made available to potato and enriched the soil, resulting in
positive balance of N observed in these treatments (Mozumder et al., 2014). Net gain
(+) of N was highest in plots with ‘Kufri Himalini’ receiving N 150 kg N ha-1
. The
lowest nitrogen balance was recorded in the plots with Kufri Shailja receiving 300 kg
N ha-1
. In case of Kufri Shailja the nitrogen balance or net gain of soil nitrogen
gradually decreased with the increase in the levels of nitrogen application, which was
mainly due to increased N-uptake by the crop with the increase in the levels of
nitrogen application resulting in to increased tuber yield.
Economics
The results showed that cultivation of newly released variety ‘Kufri
Himalini’ is more profitable than ‘Kufri Shailja’ as Kufri Himalini gave highest net
return (Rs. 56,704) with 300 kg N ha-1
(Table. 5). Next best net return (Rs. 50,902)
was recorded with the same variety receiving 225 kg N ha-1
. Higher economic returns
were obtained with ‘Kufri Himalini’ at higher N doses because of increased
marketable and total tuber yield realized at higher N application.
CONCLUSION
It can be concluded that cultivation of ‘Kufri Himalini’ is more profitable
than ‘Kufri Shailja’ as the cultivar met all the necessary requirements, especially
higher yield, highest net returns and higher nitrogen uptake efficiency under new
alluvial zone of West Bengal. Being more responsive to fertilizer nitrogen Kufri
Himalini may be grown along with 300 kg N ha-1
to get the maximum net return.
ACKNOWLEDGEMENT
The authors are thankful to All India Co-ordinated Research Project on Potato,
ICAR for their valuable guidance and financial support during the period of this
research programme. The author is also thankful to Director of Research, Bidhan
Chandra Krishi Viswavidyalaya, Kalyani, Nadia, W. B. India.
PRODUCTION POTENTIAL OF POTATO 127
REFERENCES
Alva, A. 2004. Potato nitrogen management. Journal of Vegetable Crop Production, 10(1):
97–130
Baishya, L. K., Kumar, M., Ghosh, M. and Ghosh, D. C. 2013. Effect of integrated nutrient
management on growth, productivity and economics of rainfed potato in Meghalaya
hills. International Journal of Agriculture, Environment and Biotechnology, 6(1): 69–
77
Cassman, K. G., Peng, S., Olk, D. C., Ladha, J. K., Reichardt, W., Dobermann, A. and Singh,
U. 1998. Opportunities for increased nitrogen use efficiency from improved resource
management in irrigated rice systems. Field Crops Research, 56(1–2): 7–39
Directorate of Agriculture, W. B. 2014. Economic Review. Evaluation wing, Directorate of
Agriculture, West Bengal, pp. 65
Jatav, M. K., Kumar, M., Trehan, S. P., Dua, V. K. and Kumar, S. 2013. Effect of nitrogen
and varieties of potato on yield and agronomic N use efficiency in north-western plains
of India. Journal of Potato, 40(1): 55-59
Kumar, M. and Trehan, S. P. 2012. Influence of potato cultivars and N levels on contribution
of organic amendments to N nutrition. Journal of Potato, 39(2): 133–44
Kumar, M., Trehan, S. P., Jatav, M. K. and Lal, S. S. 2008. Efficacy of potato (Solanum
tuberosum) cultivars under varying levels of nitrogen and growth duration in eastern
Indo-Gangeticplains. Indian Journal of Agronomy, 54(1): 63–68
Kumar, P., Pandey, S. K., Singh, B. P., Singh, S. V. and Kumar, D. 2007. Effect of nitrogen
rate on growth, yield, economics and crisps quality of Indian potato processing
cultivars. Potato Research, 50(2): 143–55
Love, S. L., Stark, J. C. and Salaiz, T. 2005. Response of four potato cultivars to rate and
timing of nitrogen fertilizer. American Journal of Potato Research, 82(1): 21–30
Mozumder, M., Banerjee, H., Ray, K. and Paul, T. 2014. Evaluation of potato (Solanum
tuberosum) cultivars for productivity, nitrogen requirement and eco-friendly indices
under different nitrogen levels. Indian Journal of Agronomy, 59 (2): 327-335
Sarkar, A., Sarkar, S., Zaman, A. and Devi, W. P. 2011. Productivity and profitability of
different cultivars of potato (Solanum tuberosum) as affected by organic and inorganic
sources of nutrients. Indian Journal of Agronomy, 56(2): 159-63
Singh, A. K. and Singh, R. S. 2012. Effect of phosphorus and bioinoculants on yield, nutrient
uptake and economics of long duration pigeon pea (Cajanus cajan). Indian Journal of
Agronomy, 57(3): 265–69
Trehan, S. P. 2009. Improving nutrient use efficiency by exploiting genetic diversity of
potato. Journal of Potato, 36(3-4): 121-35
Vaezzadeh, M. and Naderidarbaghshahi, M. 2012. The effect of various nitrogen fertilizer
amounts on yield and nitrate accumulation in tubers of two potato cultivars in cold
region of Iran. International Journal of Agriculture and Crop sciences, 4(22): 1688-
1691
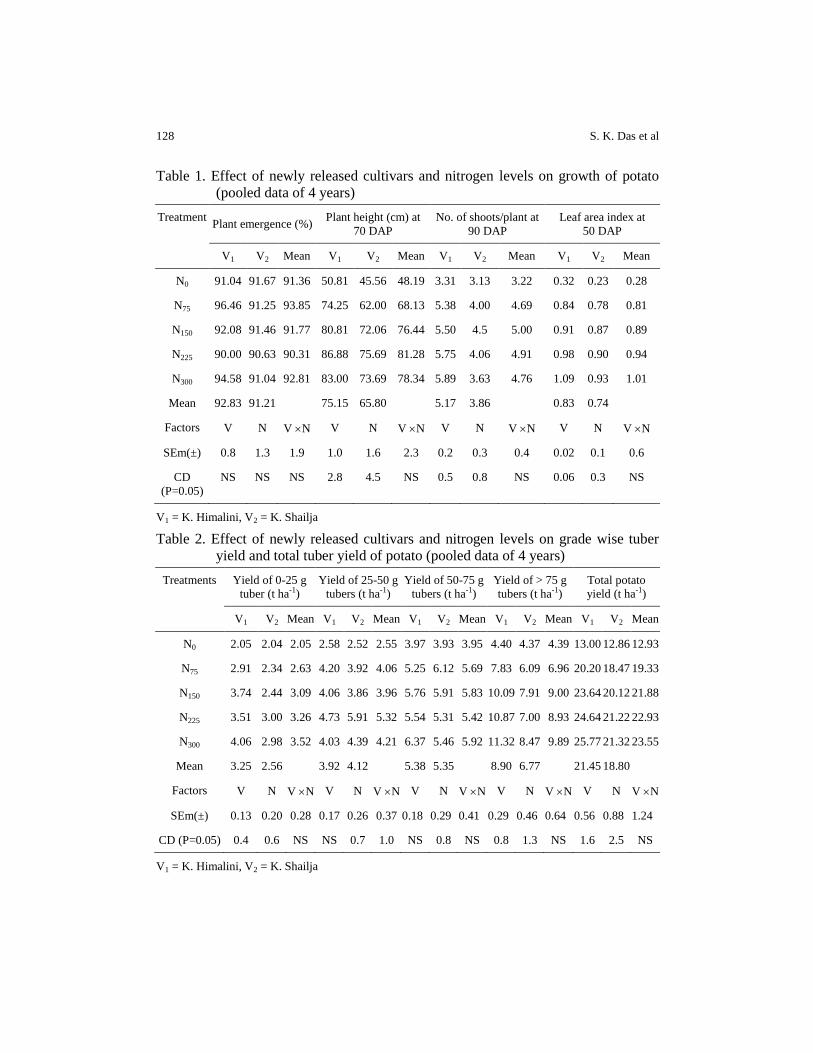
128 S. K. Das et al
Table 1. Effect of newly released cultivars and nitrogen levels on growth of potato
(pooled data of 4 years)
Treatment Plant emergence (%)
Plant height (cm) at
70 DAP
No. of shoots/plant at
90 DAP
Leaf area index at
50 DAP
V1 V2 Mean V1 V2 Mean V1 V2 Mean V1 V2 Mean
N0 91.04 91.67 91.36 50.81 45.56 48.19 3.31 3.13 3.22 0.32 0.23 0.28
N75 96.46 91.25 93.85 74.25 62.00 68.13 5.38 4.00 4.69 0.84 0.78 0.81
N150 92.08 91.46 91.77 80.81 72.06 76.44 5.50 4.5 5.00 0.91 0.87 0.89
N225 90.00 90.63 90.31 86.88 75.69 81.28 5.75 4.06 4.91 0.98 0.90 0.94
N300 94.58 91.04 92.81 83.00 73.69 78.34 5.89 3.63 4.76 1.09 0.93 1.01
Mean 92.83 91.21 75.15 65.80 5.17 3.86 0.83 0.74
Factors V N V N V N V N V N V N V N V N
SEm(±) 0.8 1.3 1.9 1.0 1.6 2.3 0.2 0.3 0.4 0.02 0.1 0.6
CD
(P=0.05)
NS NS NS 2.8 4.5 NS 0.5 0.8 NS 0.06 0.3 NS
V1 = K. Himalini, V2 = K. Shailja
Table 2. Effect of newly released cultivars and nitrogen levels on grade wise tuber
yield and total tuber yield of potato (pooled data of 4 years)
Treatments Yield of 0-25 g
tuber (t ha-1)
Yield of 25-50 g
tubers (t ha-1)
Yield of 50-75 g
tubers (t ha-1)
Yield of > 75 g
tubers (t ha-1)
Total potato
yield (t ha-1)
V1 V2 Mean V1 V2 Mean V1 V2 Mean V1 V2 Mean V1 V2 Mean
N0 2.05 2.04 2.05 2.58 2.52 2.55 3.97 3.93 3.95 4.40 4.37 4.39 13.00 12.86 12.93
N75 2.91 2.34 2.63 4.20 3.92 4.06 5.25 6.12 5.69 7.83 6.09 6.96 20.20 18.47 19.33
N150 3.74 2.44 3.09 4.06 3.86 3.96 5.76 5.91 5.83 10.09 7.91 9.00 23.64 20.12 21.88
N225 3.51 3.00 3.26 4.73 5.91 5.32 5.54 5.31 5.42 10.87 7.00 8.93 24.64 21.22 22.93
N300 4.06 2.98 3.52 4.03 4.39 4.21 6.37 5.46 5.92 11.32 8.47 9.89 25.77 21.32 23.55
Mean 3.25 2.56 3.92 4.12 5.38 5.35 8.90 6.77 21.45 18.80
Factors V N V N V N V N V N V N V N V N V N V N
SEm(±) 0.13 0.20 0.28 0.17 0.26 0.37 0.18 0.29 0.41 0.29 0.46 0.64 0.56 0.88 1.24
CD (P=0.05) 0.4 0.6 NS NS 0.7 1.0 NS 0.8 NS 0.8 1.3 NS 1.6 2.5 NS
V1 = K. Himalini, V2 = K. Shailja

PRODUCTION POTENTIAL OF POTATO 129
Table 3. Nitrogen uptake efficiencies of potato as influenced by the cultivars and
levels of N (Mean data of 4 years)
Nitrogen
levels
(kg ha-1)
Agronomic Efficiency (AEN) Apparent Recovery (REN) Physiological Efficiency
(PEN)
K. Himalini K. Shailja K. Himalini K. Shailja K. Himalini K. Shailja
N0 - - - - - -
N75 96.0 74.8 1.08 0.86 89.2 87.0
N150 70.9 48.4 1.17 0.90 60.7 56.2
N225 51.7 37.2 0.97 0.75 53.5 49.4
N300 42.6 28.2 1.01 0.76 42.1 37.2
Table 4. Nitrogen balance (kg N ha-1
) in soil after harvest of potato as influenced by
cultivars and N levels (Mean data of 4 years)
Treatment
combination
Initial soil
N status
(a)
N added
through
fertilizer
(b)
Total N
(c=a+b)
Crop
uptake
(d)
Expected
balance
(e=c-d)
Actual
balance
(f)
Net gain
(+) or
loss (-)
(f-e)
V1N0 183.26 0 183.26 127.4 55.86 131.2 75.34
V1N75 183.26 75 258.26 208.1 50.16 126.1 75.94
V1N150 183.26 150 333.26 302.6 30.66 132.1 101.44
V1N225 183.26 225 408.26 345 63.26 134.8 71.54
V1N300 183.26 300 483.26 430.4 52.86 137.4 84.54
V2N0 183.26 0 183.26 125.1 58.16 133.5 75.34
V2N75 183.26 75 258.26 189.6 68.66 129.2 60.54
V2N150 183.26 150 333.26 254.2 79.06 135.3 56.24
V2N225 183.26 225 408.26 294.2 114.06 138.8 24.74
V2N300 183.26 300 483.26 352.8 130.46 142.3 11.84
V1 = K. Himalini, V2 = K. Shailja
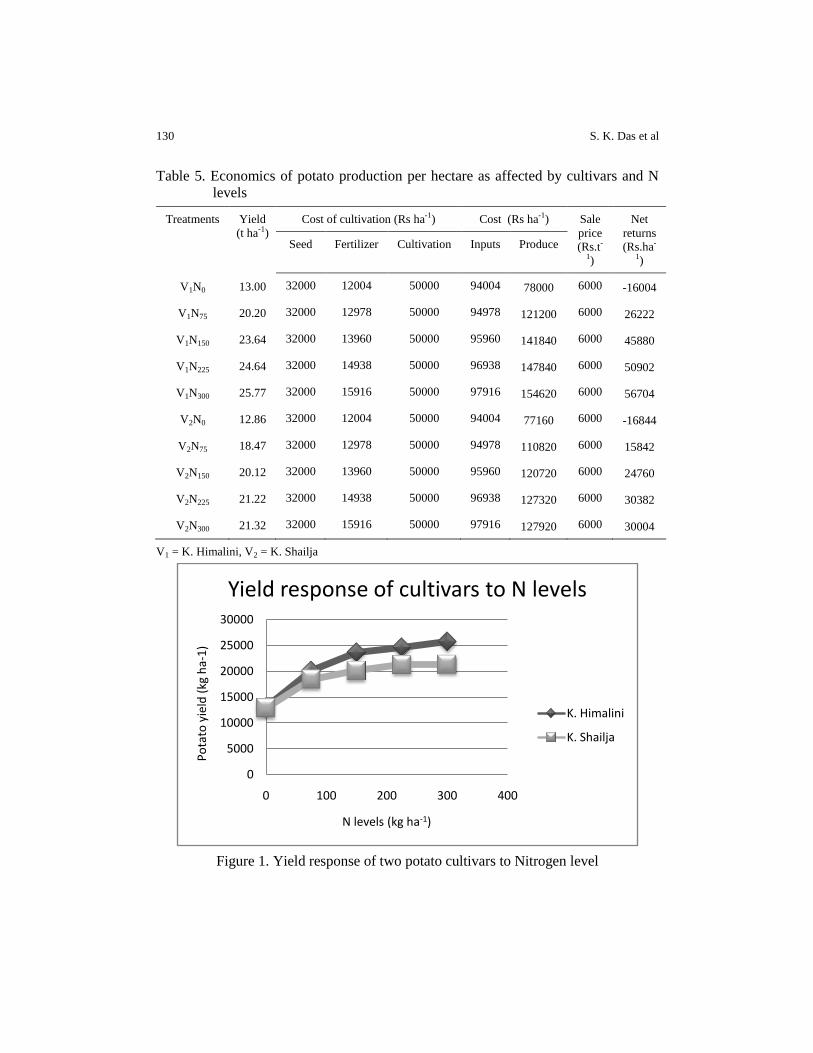
130 S. K. Das et al
Table 5. Economics of potato production per hectare as affected by cultivars and N
levels
Treatments Yield
(t ha-1)
Cost of cultivation (Rs ha-1) Cost (Rs ha-1) Sale
price
(Rs.t-
1)
Net
returns
(Rs.ha-
1)
Seed Fertilizer Cultivation Inputs Produce
V1N0 13.00 32000 12004 50000 94004 78000 6000 -16004
V1N75 20.20 32000 12978 50000 94978 121200 6000 26222
V1N150 23.64 32000 13960 50000 95960 141840 6000 45880
V1N225 24.64 32000 14938 50000 96938 147840 6000 50902
V1N300 25.77 32000 15916 50000 97916 154620 6000 56704
V2N0 12.86 32000 12004 50000 94004 77160 6000 -16844
V2N75 18.47 32000 12978 50000 94978 110820 6000 15842
V2N150 20.12 32000 13960 50000 95960 120720 6000 24760
V2N225 21.22 32000 14938 50000 96938 127320 6000 30382
V2N300 21.32 32000 15916 50000 97916 127920 6000 30004
V1 = K. Himalini, V2 = K. Shailja
Figure 1. Yield response of two potato cultivars to Nitrogen level
0
5000
10000
15000
20000
25000
30000
0 100 200 300 400
Po
tato
yie
ld (
kg h
a-1
)
N levels (kg ha-1)
Yield response of cultivars to N levels
K. Himalini
K. Shailja

SAARC J. Agri., 13(2): 131-140 (2015)
EFFECT OF INTEGRATED NUTRIENT MANAGEMENT IN
BORO RICE CULTIVATION
B. Roy, M. A. R. Sarkar and S. K. Paul*
Department of Agronomy, Bangladesh Agricultural University, Mymensingh-2202, Bangladesh
ABSTRACT
An experiment was carried out in the farmer’s field of village Boira under
Kotoali Thana, District-Mymensingh in Boro season (Jannuary to May
2013) to find out the effect of integrated nutrient management in Boro rice
cv. BRRI dhan29 cultivation. The experiment consisted of the following
treatments- control (no manure and no fertilizer) (T1), recommended
dose of prilled urea and PKSZn (T2), 50% of the recommended dose of
prilled urea and PKSZn + cowdung 5 t ha-1
(T3), 50% of recommended
dose of prilled urea and PKSZn + poultry manure 2.5 t ha-1
(T4), 50% of
recommended dose of prilled urea and PKSZn + cowdung 10 t ha-1
(T5),
50% of recommended dose of prilled urea and PKSZn + poultry manure
5 t ha-1
(T6), cowdung 10 t ha-1
(T7), poultry manure 5 t ha-1
(T8), full dose
of USG (2.7g) + recommended dose of PKSZn (T9), full dose of USG
(2.7g) + cowdung 10 t ha-1
(T10), full dose of USG (2.7g) + poultry
manure 5 t ha-1
(T11), full dose of USG (2.7g) + cowdung 5 t ha-1
(T12),
full dose of USG (2.7g) + poultry manure 2.5 t ha-1
(T13), USG (1.8g) +
poultry manure 5 t ha-1
(T14), USG (1.8g) + poultry manure 2.5 t ha-1
(T15)
and farmer’s practice (Urea 250 kg ha-1
, TSP 220 kg ha-1
, MoP 130 kg
ha-1
, gypsum 130 kg ha-1
) (T16). The experiment was laid out in a
randomized complete block design with three replications. Results of the
experiment showed that integrated nutrient management had significant
effect on yield contributing characters and yield of BRRI dhan29. The
tallest plant (93.33 cm) was found in T2 treatment (recommended dose of
prilled urea and PKSZn), the highest number of total tillers hill-1
(16.85)
and effective tillers hill-1
(15.90) were obtained in T11 treatment (USG
(2.7g) + poultry manure 5 t ha-1
). The highest 1000-grain weight
(22.40g), grain yield (7.19 t ha-1
) and straw yield (8.08 t ha-1
) were
recorded in T10 treatment (full dose of USG (2.7g) + cowdung 10 t ha-1
)
and the lowest grain yield (4.43 t ha-1
) and straw yield (5.21 t ha-1
) were
obtained in T7 treatment (cowdung 10 t ha-1
). From the study, it can be
concluded that inorganic fertilizer along with manure greatly influence the
* Corresponding author email: [email protected]
Received: 09.09.2015
132 S. K. Paul et al
yield contributing characters and yield of Boro rice and full dose of USG
(2.7g) with cowdung (10 t ha-1
) appears as the promising combination for
Boro rice (cv. BRRI dhan29) cultivation.
Keywords: Integrated nutrient management, boro rice, yield
ITRODUCTION
Rice (Oryza sativa L.) is the major food crop in Bangladesh. Boro rice covers
about 48.97% of total rice area and contributes to 38.14% of total rice production in
the country (BBS, 2012). Rice production area is decreasing due to high population
pressure. Cultivation of improved varieties and proper nutrient management are the
most effective means to meet the demand. For maximizing yield, nutrient
management is the key element in rice farming. Depletion of soil fertility has been
identified as a major constraint for higher crop yield. The role of fertilizers and
manures in increasing the productivity of crop is well known. Repeated use of
inorganic fertilizer alone fails to sustain desired yield, impairs the physical condition
and reduce the organic matter content of soils (Rabindra et al., 1985; Bhatia and
Shukla, 1982; Lal and Mathur, 1988). Integrated use of organic and inorganic
fertilizer has been found to be promising for sustainable crop production. This has
been amply proved by the long term fertilizer experiments (Nambiar and Abrol,
1989). This indicates that an integrated use of organic and inorganic fertilizers
proposed to be an effective approach for sustainable crop production, which is agreed
with the opinion of Rabindra et al. (1985), and Bhatia and Shukla (1982).
Nitrogen is the key nutrient required in the largest quantities while urea is the
principal nitrogenous fertilizer. Urea is the most commonly used N fertilizer in
Bangladesh, but its efficiency is very low. Wetland soil promotes N losses through
ammonia volatilization, denitrification, leaching and surface runoff when it is applied
as prilled form in the soil surface. Urea super granules (USG) is a fertilizer that can
be applied in the rice root zone at 8-10 cm depth of soil which can save 30%N
compared to prilled urea, increases absorption rate, improves soil health and
ultimately increases rice yield (Savant et al., 1991). Among the various factors
responsible for increasing yield quality, fertilizer management is of paramount
importance (Novoa and Loomis, 1981). Use of fertilizer and manures is an essential
component of modern farming with about 50% of the world crop production
(Prodhan, 2002). Selection of potential variety, planting in appropriate method and
application of optimum amount of nutrient elements, can play important role to
increase growth and yield of Boro rice. Based on the above information, the
experiment was undertaken to study the effect of integrated nutrient management in
Boro rice (cv. BRRI dhan29) cultivation.

NUTRIENT MANAGEMENT IN BORO RICE 133
MATERIALS AND METHODS
The experiment was carried out in the farmer’s field of village Boira under
Kotoali Thana, District-Mymensingh in Boro season (Jannuary to May 2013). The
experimental site belongs to the Sonatala series of Old Brahmaputra Floodplain
Agroecological Zone (AEZ-9) having non-calcareous dark grey floodplain soils. The
soil was silt loam having pH 6.5. Soil contained 1.67% organic matter, 0.10% total
N, 26.0 ppm available P, 0.14 (me %) exchangeable K and 13.9 ppm available S. The
experiment consisted of the following treatments- control (no manure and no
fertilizer) (T1), recommended dose of prilled urea + PKSZn (T2), 50% of
recommended dose of prilled urea and PKSZn + cowdung 5 t ha-1
(T3), 50% of
recommended dose of prilled urea and PKSZn + poultry manure 2.5 t ha-1
(T4), 50%
of recommended dose of prilled urea and PKSZn + cowdung 10 t ha-1
(T5), 50% of
recommended dose of prilled urea and PKSZn + poultry manure 5 t ha-1
(T6),
cowdung 10 t ha-1
(T7), poultry manure 5 t ha-1
(T8), full dose of USG (2.7g) +
recommended dose of PKSZn (T9), full dose of USG (2.7g) + cowdung 10 t ha-1
(T10), full dose of USG (2.7g) + poultry manure 5 t ha-1
(T11), full dose of USG
(2.7g) + cowdung 5 t ha-1
(T12), full dose of USG (2.7g) + poultry manure 2.5 t ha-1
(T13), USG (1.8g) + poultry manure 5 t ha-1
(T14), USG (1.8g) + poultry manure 2.5 t
ha-1
(T15) and farmer’s practice (Urea 250 kg ha-1
, TSP 220 kg ha-1
, MoP 130 kg ha-1
,
gypsum 130 kg ha-1
) (T16). The experiment was laid out in a randomized complete
block design with three replications. Each block was divided into 16 unit plots where
the treatment combinations were allocated at random. The size of each unit plot was
4.0m × 2.5m. The land was first opened with a tractor drawn plough and finally
prepared by ploughing and cross ploughing with country plough followed by
laddering. Weeds and stubble were removed from the field as much as possible after
leveling. The land was finally prepared and the experiment was laid out on 29
January 2013. Cowdung and poultry manure were applied as basal dose (as per
treatment) on 30 January before transplanting of rice seedlings. Urea, triple super
phosphate, muriate of potash, gypsum and zinc sulphate @ 250, 130, 120, 60 and 10
kg ha-1
, respectively were applied where applicable. The whole amounts of triple
super phosphate, muriate of potash, gypsum and zinc sulphate were applied at final
land preparation as per experimental specification. Urea was applied in 3 equal splits
at 15, 30, and 45 days after transplanting (DAT). As per experimental specification
urea super granules (USG) were placed manually (depth 6-8 cm) at the centre of four
hills of two adjacent rows i.e. once at 10 days after transplanting (DAT) in every
alternate row. Thirty seven-day old seedlings were uprooted carefully from the
nursery and transplanted on the experimental plots on 01 February 2013 maintaining
25 cm x 15 cm spacing between the rows and hills, respectively. Weeding was done
at 25 and 40 DAT. The crop was irrigated as and when necessary. There was rice
stem borer infestation at active tillering stage and it was controlled by Regent (G)
applied @ 12.50 kg ha-1
. On the other hand, at milk stage of rice, it was attacked by
leaf roller and the insect was successfully controlled by applying Malathion @ 1 ml

134 S. K. Paul et al
per liter of water. The crops were harvested at full maturity. Maturity of crops was
determined when 90% of the grains became golden yellow in color. The crop was
harvested on 29 May 2013. Then the harvested crop of each plot was bundled
separately, properly tagged and brought to threshing floor. The crop was then
threshed and the fresh weights of grain and straw were recorded plot-wise. The grains
were cleaned and finally the weight was adjusted to 14% moisture content. The straw
was sun dried and the yields of grain and straw plot-1
were recorded and converted to
t ha-1
. Harvest index was calculated with the following formula:
.100yield Biological
yieldGrain (%)index Harvest
The collected data were analyzed by using “Analysis of Variance” technique
and the differences among treatment means were adjudged by the Duncan's Multiple
Range Test (Gomez and Gomez, 1984).
RESULTS AND DISCUSSION
Crop characters, yield contributing characters and yield of Boro rice were
studied as affected by integrated nutrient management. The maximum plant height
(93.33 cm) was found in T2 treatment (recommended dose of prilled urea and
PKSZn) followed by T8 (poultry manure 5 t ha-1
) and T9 (full dose of USG (2.7g) +
recommended dose of PKSZn ), while the lowest plant height (77.60 cm) was found
in T3 treatment (50% of recommended dose of prilled urea and PKSZn + cowdung 5 t
ha-1
) which was statistically identical to T4 (50% of recommended dose of prilled
urea and PKSZn + poultry manure 2.5 t ha-1
) and T6 (50% of recommended dose of
prilled urea and PKSZn + poultry manure 5 t ha-1
) (Figure 1). Haga and Dayag
(1989) also reported similar results. The highest number of total tillers hill-1
(16.85)
was obtained with T11 treatment (2.7g USG + poultry manure 5t ha-1
) which was
statistically identical to T9 (full dose of USG ( 2.7g) + recommended dose of PKSZn
) and T 13 (full dose of USG (2.7g) + poultry manure 2.5 t ha-1
) that was the lowest
(8.13) with T4 treatment (50% of recommended dose of prilled urea and PKSZn +
poultry manure 2.5 t ha-1
) (Table 1). Total tillers hill-1
was positively correlated with
level of nitrogen application as reported by BRRI (1991) and Kamal et al. (1999).
The highest number of effective tillers hill-1
(15.90) was obtained in T11 treatment
(USG 2.7g + poultry manure 5 t ha-1
) followed by T 13 (full dose of USG (2.7g) +
poultry manure 2.5 t ha-1
) and T9 (full dose of USG (2.7g) + recommended dose of
PKSZn) and that was the lowest (7.23) in T4 treatment (50% of recommended dose of
prilled urea and PKSZn + poultry manure 2.5 t ha-1
) (Figure 2). Combined
application of inorganic fertilizer and manure increased effective tillers hill-1
was
reported by Islam et al. (2015). Ahmed and Rahman (1991) differing in view that
organic and inorganic fertilizers increased tiller number hill-1
. Adequacy of nitrogen
as USG probably favoured the cellular activities during panicle development, which
led to increased number of effective tillers hill-1
. The highest number of non-effective

NUTRIENT MANAGEMENT IN BORO RICE 135
tillers hill-1
(1.41) was obtained in T9 treatment (USG 2.7g + recommended dose of
PKSZn) which was statistically identical to T7 (cowdung 10 t ha-1
) and T12 (full dose
of USG (2.7g) + cowdung 5 t ha-1
) and the lowest (0.67) in T16 treatment (farmer’s
practice: Urea-TSP-MoP-Gypsum @ 250-220-130-130 kg ha-1
) (Table 1). The
highest length of panicle (26.77cm) was obtained with T2 treatment (recommended
dose of prilled urea and PKSZn) followed by T16 treatment (farmer’s practice: Urea-
TSP-MoP-Gypsum @ 250-220-130-130 kg ha-1
) and the lowest one was recorded in
T1 (control) treatment (23.20cm) (Table 1). Nassai and Vargas (1982) found shorter
panicle length in lower doses of fertilizer. The highest panicle weight (4.31g) was
found in T14 treatment (USG 1.8g + poultry manure 5 t ha-1
) and the lowest panicle
weight (1.40g) was found in T2 treatment (recommended dose of prilled urea and
PKSZn). The number of grains panicle-1
was maximum (205.30) in T9 treatment (full
dose of USG (2.7g) and recommended dose of PKSZn) which was as good as T13
(full dose of USG (2.7g) + poultry manure 2.5t ha-1
) and minimum (122.0) in T5
treatment (50% of recommended dose of prilled urea and PKSZn + cowdung 10 t ha-
1). Nitrogen helped in proper filling of seeds, which resulted higher produced plump
seeds and thus the number of grains panicle-1
. Islam et al. (2014) reported that the
number of grains panicle-1
increased significantly with increments in level of
nitrogen. Similar observation was also reported elsewhere (Jisan et al., 2014;
Salahuddin et al., 2009; ). Combined application of manures and fertilizers increased
number of grains panicle-1
(Malika, 2011; Rahman et al., 2007 and Parvez et al.,
2008). The number of sterile spikelets panicle-1
was maximum (27.95) in T2 treatment
(recommended dose of prilled urea and PKSZn) and minimum (9.04) in T9 treatment
(full dose of USG (2.7g) and recommended dose of PKSZn). The highest 1000-grain
weight (22.40g) was found at T10 treatment (Full dose of USG (2.7g) + cowdung 10 t
ha-1
) which was statistically identical to T15 (1.8g USG + poultry manure 2.5 t ha-1
),
T14 (1.8g USG + poultry manure 5 t ha-1
), T13 (full dose, 2.7g USG + poultry manure
2.5 t ha-1
) and T9 treatment (USG 2.7g and recommended dose of PKSZn), while
the lowest one (17.41 g) was found in T1 treatment (control) (Table 1). The weight of
1000-grain increased significantly with increasing nitrogen levels, which was also
reported by Baligar and Ganin (2001). Application of manure and fertilizers
increased 1000-grain weight, also reported by Rahman et al. (2007) and Parvez et al.
(2008). The highest grain yield (7.19 t ha-1
) was recorded from T10 treatment (2.7g
USG + cowdung 10 t ha-1
) followed by T2 (recommended dose of prilled urea and
PKSZn) and the lowest grain yield (4.43 t ha-1
) was recorded in T7 treatment
(cowdung 10 t ha-1
) (Figure 3). The highest grain yield was favored by crop
characters like effective tillers hill-1
and number of grains panicle-1
. This result is in
conformity with the findings of Sarkar et al. (2014) and Singh and Pillar (1996). The
highest straw yield (8.09 t ha-1
) was found inT2 treatment (recommended dose of
prilled urea and PKSZn) which was statistically identical to T10 (full dose of USG
(2.7g) + cowdung 10 t ha-1
) and T15 (1.8g USG + poultry manure 2.5 t ha-1
) (Table 1)
while the lowest straw yield (5.21 t ha-1
) was recorded in T7 treatment (cowdung 10 t
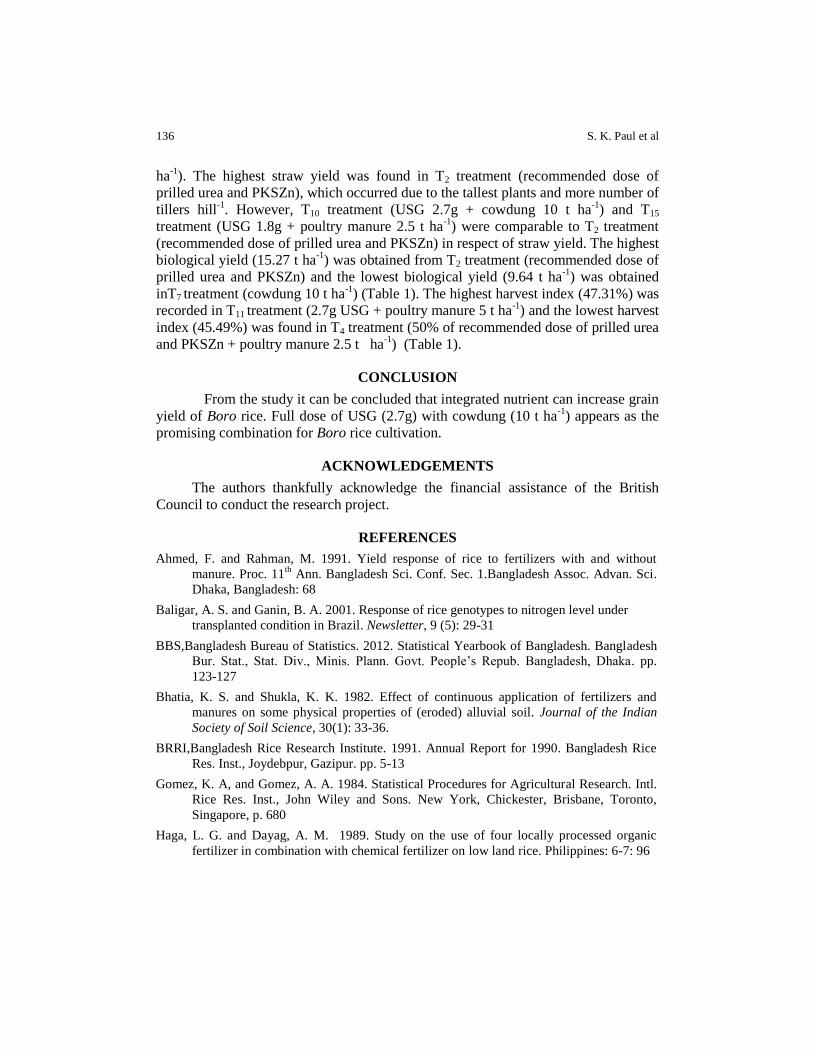
136 S. K. Paul et al
ha-1
). The highest straw yield was found in T2 treatment (recommended dose of
prilled urea and PKSZn), which occurred due to the tallest plants and more number of
tillers hill-1
. However, T10 treatment (USG 2.7g + cowdung 10 t ha-1
) and T15
treatment (USG 1.8g + poultry manure 2.5 t ha-1
) were comparable to T2 treatment
(recommended dose of prilled urea and PKSZn) in respect of straw yield. The highest
biological yield (15.27 t ha-1
) was obtained from T2 treatment (recommended dose of
prilled urea and PKSZn) and the lowest biological yield (9.64 t ha-1
) was obtained
inT7 treatment (cowdung 10 t ha-1
) (Table 1). The highest harvest index (47.31%) was
recorded in T11 treatment (2.7g USG + poultry manure 5 t ha-1
) and the lowest harvest
index (45.49%) was found in T4 treatment (50% of recommended dose of prilled urea
and PKSZn + poultry manure 2.5 t ha-1
) (Table 1).
CONCLUSION
From the study it can be concluded that integrated nutrient can increase grain
yield of Boro rice. Full dose of USG (2.7g) with cowdung (10 t ha-1
) appears as the
promising combination for Boro rice cultivation.
ACKNOWLEDGEMENTS
The authors thankfully acknowledge the financial assistance of the British
Council to conduct the research project.
REFERENCES
Ahmed, F. and Rahman, M. 1991. Yield response of rice to fertilizers with and without
manure. Proc. 11th
Ann. Bangladesh Sci. Conf. Sec. 1.Bangladesh Assoc. Advan. Sci.
Dhaka, Bangladesh: 68
Baligar, A. S. and Ganin, B. A. 2001. Response of rice genotypes to nitrogen level under
transplanted condition in Brazil. Newsletter, 9 (5): 29-31
BBS,Bangladesh Bureau of Statistics. 2012. Statistical Yearbook of Bangladesh. Bangladesh
Bur. Stat., Stat. Div., Minis. Plann. Govt. People’s Repub. Bangladesh, Dhaka. pp.
123-127
Bhatia, K. S. and Shukla, K. K. 1982. Effect of continuous application of fertilizers and
manures on some physical properties of (eroded) alluvial soil. Journal of the Indian
Society of Soil Science, 30(1): 33-36.
BRRI,Bangladesh Rice Research Institute. 1991. Annual Report for 1990. Bangladesh Rice
Res. Inst., Joydebpur, Gazipur. pp. 5-13
Gomez, K. A, and Gomez, A. A. 1984. Statistical Procedures for Agricultural Research. Intl.
Rice Res. Inst., John Wiley and Sons. New York, Chickester, Brisbane, Toronto,
Singapore, p. 680
Haga, L. G. and Dayag, A. M. 1989. Study on the use of four locally processed organic
fertilizer in combination with chemical fertilizer on low land rice. Philippines: 6-7: 96

NUTRIENT MANAGEMENT IN BORO RICE 137
Islam, M. S., Paul, S. K. and Sarkar, M. A. R. 2014. Varietal performance of modern transplant
Aman rice subjected to level of nitrogen application. Journal of the Bangladesh
Agricultural University, 12 (1): 55-60
Islam, S. M. M., Paul, S. K. and Sarkar, M. A. R. 2015. Effect of weeding regime and
integrated nutrient management on yield contributing characters and yield of BRRI
dhan49. Journal of Crop and Weed, 11: 193-197
Jisan, M. T., Paul, S. K. and Salim M. 2014. Yield performance of some transplant aman ric
varieties as influenced by different levels of nitrogen. Journal of the
BangladeshAgricultural University, 12 (2): 321-324
Kamal, A. M. A., Islam, M. R. and Chowdhury, B. L. D. 1999. Growth performance protein
content and nutrient uptake by modern varieties of rice under irrigated condition in
Bangladesh. Thai Journal of Agricultural Science, 32(1): 105-110
Lal, S. and B. S. Mathur. 1988. Effect of long term manuring, fertilization and liming on crop
yield and some physical properties of acid soil. Journal of the Indian Society of Soil
Science, 36:113-119
Malika, M. 2011. Combined use of manures and fertilizers for maximizing the growth and
yield of BINA dhan7. M. S. thesis, Department of Soil Science, Bangladesh
Agricultural University, Mymensingh
Nambiar, K. K. M. and Abrol, I. P. 1989. Long term fertilizer experiments in India an
overview. Fertilizer News, 34(4): 11-20
Nassai, K. K. M. and Vargas, I. P. 1982. Long term fertilizer experiments in India an
overview. Fertilizer News, 34(4): 11-20
Novoa, R. and Loomis, R. S. 1981. Nitrogen and plant production. Plant and Soil. 58: 177-
204. NPK combinations on the yield contributing characters of rice. Bangladesh
Journal of Agricultural Sciences, 15(1): 105-110
Parvez, M. S., Islam, M. R., Begum, M. S., Rahman, M. S., and Abedin Miah, M. J. 2008.
Integrated use of manure and fertilizers for maximizing the of BRRI dhan30. Journal
of Bangladesh Society of Agricultural Science and Technology, 5 (1 & 2): 257-260
Prodhan, S. B. 2002. “Status of fertilizer use in developing countries of Asia and the pacific
region”: Proc. Regi. FADINAP seminar, Chiang Mai, Thailand. pp. 37-47
Rabindra, B., Narayanawamy, G.V., Janardhan, N.A. and Shivanagappa. 1985. Long range
effect of manure and fertilizers on soil physical properties and yield of sugarcane.
Journal of the Indian Society of Soil Science, 33:704-706
Rahman, M. S., Islam, M. R., Naser, H. M., Hoque, M. M and Hossain, A. (2007). Effects of
combined use of manures and fertilizers on the yield and nutrient uptake by BRRI
dhan30. Journal of Bangladesh Society of Agricultural Science and Technology, 4 (3
& 4): 37-40
Sarkar, S. K., Sarkar, M. A. R., Islam, N. and Paul, S. K. 2014. Yield and quality of aromatic
fine rice as affected by variety and nutrient management. Journal of the Bangladesh
Agricultural University, 12 (2): 279-284

138 S. K. Paul et al
Savant, A. C., Thorat, S. T., Khadse, R. R. and Bhosale, R. J. 1991. Response of early rice
varieties to nitrogen levels and spacing in coastal Maharashtra. Journal of Maharashtra
Agricultural University, 11(2):182-184
Salahuddin, K. M., Chowdhury, S. H., Munira, S., Islam, M. M. and Parvin, S. 2009.
Response of nitrogen and plant spacing transplanted aman rice. Bangladesh Journal
of Agricultural Research, 34(2): 279- 285
Singh, A. S. and Pillar, N. 1996. Nitrogen fertilizer in transplant rice. International Rice
Research Newsleller, 8(5): p. 27
Figure 1. Effect of integrated nutrient management on plant height

NUTRIENT MANAGEMENT IN BORO RICE 139
Figure 2. Effect of integrated nutrient management on no. of effective tillers hill-1
Figure 3. Effect of integrated nutrient management on grain yield
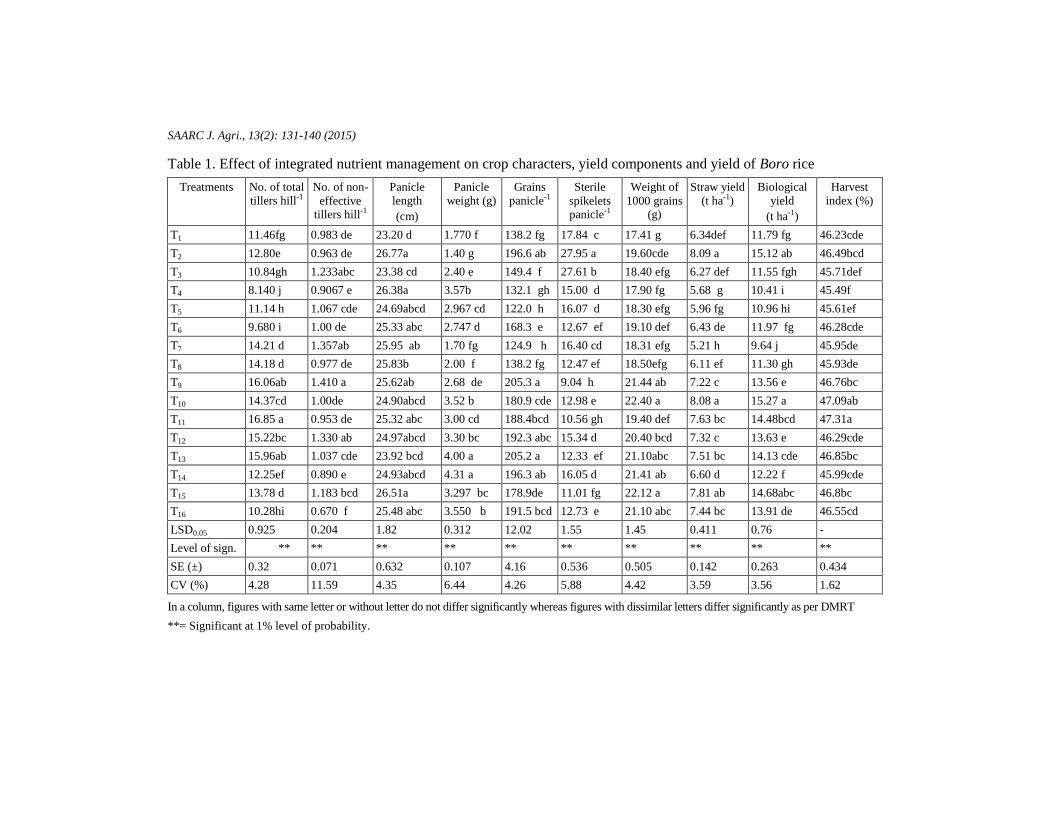
SAARC J. Agri., 13(2): 131-140 (2015)
Table 1. Effect of integrated nutrient management on crop characters, yield components and yield of Boro rice
Treatments No. of total
tillers hill-1
No. of non-
effective tillers hill-1
Panicle
length
(cm)
Panicle
weight (g)
Grains
panicle-1
Sterile
spikelets panicle-1
Weight of
1000 grains (g)
Straw yield
(t ha-1)
Biological
yield
(t ha-1)
Harvest
index (%)
T1 11.46fg 0.983 de 23.20 d 1.770 f 138.2 fg 17.84 c 17.41 g 6.34def 11.79 fg 46.23cde
T2 12.80e 0.963 de 26.77a 1.40 g 196.6 ab 27.95 a 19.60cde 8.09 a 15.12 ab 46.49bcd
T3 10.84gh 1.233abc 23.38 cd 2.40 e 149.4 f 27.61 b 18.40 efg 6.27 def 11.55 fgh 45.71def
T4 8.140 j 0.9067 e 26.38a 3.57b 132.1 gh 15.00 d 17.90 fg 5.68 g 10.41 i 45.49f
T5 11.14 h 1.067 cde 24.69abcd 2.967 cd 122.0 h 16.07 d 18.30 efg 5.96 fg 10.96 hi 45.61ef
T6 9.680 i 1.00 de 25.33 abc 2.747 d 168.3 e 12.67 ef 19.10 def 6.43 de 11.97 fg 46.28cde
T7 14.21 d 1.357ab 25.95 ab 1.70 fg 124.9 h 16.40 cd 18.31 efg 5.21 h 9.64 j 45.95de
T8 14.18 d 0.977 de 25.83b 2.00 f 138.2 fg 12.47 ef 18.50efg 6.11 ef 11.30 gh 45.93de
T9 16.06ab 1.410 a 25.62ab 2.68 de 205.3 a 9.04 h 21.44 ab 7.22 c 13.56 e 46.76bc
T10 14.37cd 1.00de 24.90abcd 3.52 b 180.9 cde 12.98 e 22.40 a 8.08 a 15.27 a 47.09ab
T11 16.85 a 0.953 de 25.32 abc 3.00 cd 188.4bcd 10.56 gh 19.40 def 7.63 bc 14.48bcd 47.31a
T12 15.22bc 1.330 ab 24.97abcd 3.30 bc 192.3 abc 15.34 d 20.40 bcd 7.32 c 13.63 e 46.29cde
T13 15.96ab 1.037 cde 23.92 bcd 4.00 a 205.2 a 12.33 ef 21.10abc 7.51 bc 14.13 cde 46.85bc
T14 12.25ef 0.890 e 24.93abcd 4.31 a 196.3 ab 16.05 d 21.41 ab 6.60 d 12.22 f 45.99cde
T15 13.78 d 1.183 bcd 26.51a 3.297 bc 178.9de 11.01 fg 22.12 a 7.81 ab 14.68abc 46.8bc
T16 10.28hi 0.670 f 25.48 abc 3.550 b 191.5 bcd 12.73 e 21.10 abc 7.44 bc 13.91 de 46.55cd
LSD0.05 0.925 0.204 1.82 0.312 12.02 1.55 1.45 0.411 0.76 -
Level of sign. ** ** ** ** ** ** ** ** ** **
SE (±) 0.32 0.071 0.632 0.107 4.16 0.536 0.505 0.142 0.263 0.434
CV (%) 4.28 11.59 4.35 6.44 4.26 5.88 4.42 3.59 3.56 1.62
In a column, figures with same letter or without letter do not differ significantly whereas figures with dissimilar letters differ significantly as per DMRT
**= Significant at 1% level of probability.
SAARC J. Agri., 13(2): 141-150 (2015)
IMPACT OF NITROGEN NUTRITION ON
PRODUCTIVITY AND NUTRIENT USE EFFICIENCY OF
POTATO (Solanum tuberosum L.) IN AN INCEPTISOL OF
WEST BENGAL, INDIA
H. Banerjee1, K. Ray
2, S. Sarkar
2, A. M. Puste*
2, M. Mozumder
2 and L. Rana
2
Regional Research Station (CSZ), Bidhan Chandra Krishi Viswavidyalaya
Kakdwip, West Bengal, India
ABSTRACT
The experiment was carried out at the District Seed Farm, Adisaptagram, Hooghly (West Bengal), India during two consecutive winter seasons of 2011-12 and 2012-13 to find out optimum N dose of potato cultivars for getting higher yield as well as to identity efficient potato cultivars regarding N use. Average yield of potato cultivars increased significantly with increase in N supply up to 225 kg N ha
-1, then tended to decrease
slightly as nitrogen levels increased further. Tuber yield of cultivars Kufri Shailja and Kufri Jyoti was increased significantly with increase in nitrogen level up to 225 kg N ha
-1 and further addition of N decreased
yield. Yield of Kufri Himalini was increased with increase in N level up to 300 kg N ha
-1 but the yield increment from 225 kg N ha
-1 to 300 kg N ha
-1
was not significant. Application of less N decreased average potato tuber yield by 5.3, 18.7 and 65.1% with 150, 75 and 0 kg N ha
-1 respectively,
compared to 225 kg N ha-1
. Nitrogen use efficiency (NUE) decreased towards higher N levels for all cultivars. NUE of Kufri Himalini was higher at all N levels. The results revealed that irrespective of cultivar 225 kg N ha
-1 was the optimum for getting higher tuber yield of potato and cultivar
Kufri Himalini was the most efficient in case of N use.
Keywords: Potato cultivars, nitrogen recovery, NUE, productivity
INTRODUCTION
In India, more than 89% of the potato crop is raised in Gangetic plains during
winter season (October to March). Although West Bengal accounts for one-third of
the country’s total potato production but potato growers for the last few years face
some problems mainly due to lack of knowledge about new cultivar and appropriate
* Corresponding author email: [email protected] 1 Regional Research Station (CSZ), Bidhan Chandra Krishi Viswavidyalaya, Kakdwip, West Bengal, India 2 Department of Agronomy, Bidhan Chandra Krishi Viswavidyalaya, Mohanpur, West Bengal, India
Received: 09.09.2105
142 A. M. Puste et al
doses of fertilizers. The best way to get rid of this situation would be introduction of
improved potato cultivars having better yield potential and nutrient management
practices. The new potato hybrids cv. ‘Kufri Himalini’ and ‘Kufri Shailja’ have
primarily been developed with higher level of resistance to late blight and exhibited
higher yield potential than existing popular variety of the region cv. ‘Kufri Jyoti’.
Potato is nutrient exhaustive crop and responds well to the higher levels of
fertilizer (Meena et al., 2013). Nitrogen determines the quantity and structure of
potato yield, its chemical composition and tuber quality (Kolodziejczyk, 2014).
Application of more N increased size and number of tubers ultimately enhancing
total yield (Kumar et al., 2007). In addition, under- or over supply of N may affect
total number of tubers. Excessive application of N leads to delay maturity, produce
poor quality tuber and reduce tuber yield (Alva, 2004). However, nitrogen
management is particularly relevant to the dry environment where nitrogen is
inherently deficient and careful N supply is required to ensure high crop yield (Badr
et al., 2012). In order to optimize crop production and minimize the risk of N
leaching into groundwater, modern fertilizer practices involve optimization of N.
Potato cultivars differ in their growth behaviour, N requirement and yield potential.
Therefore, this experiment was conducted to find out optimum N dose of potato
cultivars for getting higher yield as well as to identify efficient potato cultivars
regarding N use.
MATERIALS AND METHODS
A field experiment was conducted at the District Seed Farm (23°26′N latitude,
88°22′E longitude and 12 m above mean sea level), Adisaptagram, Hooghly (West
Bengal), India during two consecutive winter seasons (November-March) of 2011-12
and 2012-13 in an inceptisol (Great group Fluvaquents). The soil of the experimental
site was loamy in texture (44, 30 and 26% of sand, silt and clay), with a slightly
acidic (pH 6.34), EC of 0.25 dS m-1
, 0.60% organic carbon and the available N, P and
K were 183.3, 24.1 and 614.03 kg ha-1
, respectively. The experiment was laid out in
factorial randomized complete block design consisting of combinations of three
potato cultivars (cv. Kufri Himalini, Kufri Shailja and Kufri Jyoti) and five nitrogen
levels (0, 75, 150, 225 and 300 kg N ha-1
) with four replications. The unit plot size
was 5m × 3m. Tubers weighing 30-40 g each were hand planted on 25th and 27
th
November during year 1 and year 2, respectively with a density of about 83,333
plants ha-1
(60 cm × 20 cm). Regarding the application of plant nutrients, half of
nitrogen (urea) was broadcasted as basal and rest ½ of nitrogen was top dressed at 30
days after planting (DAP) followed by earthing up. All treatments received 150 kg P
ha-1
(Single super phosphate) and 150 kg K ha-1
(muriate of potash) as basal.
At harvest, haulm and tuber tissues were separated and dried at 70°C in a
forced air oven for subsequent dry weight determination. Dried plant samples were
then ground to pass through a 0.5 mm sieve and total N was determined by the micro-
NITROGEN NUTRITION IN POTATO 143
Kjeldahl method (Bremner and Mulvaney, 1982). For taking yield components viz.,
average tuber number per plant and average tuber weight per plant, plants from three
linear metre from each plot were collected and total tuber yield was estimated from it.
Lifting of potato tubers was done from each plot manually on 5th and 7
th March
during year 1 and year 2, respectively and tubers were graded into four categories
namely, 0-25, 26-50, 51-75 and > 75g followed by counting and weighing of grade-
wise tubers. Nitrogen use efficiency (NUE) was calculated using the following
equation (Badr et al., 2012):
Where,
Yt = total tuber yield under treatment (kg ha-1
)
Yo = total tuber yield under control (kg ha-1
) and
N = applied nitrogen (kg ha-1
)
Post-harvest N recovery was calculated using the following equation (Badr et al.,
2012):
Where,
Nt = total N uptake by crop (haulm + tuber) under treatment (kg ha-1
)
No = total N uptake under control (kg ha-1
) and
N = applied nitrogen (kg ha-1
).
Data were subjected to analysis of variance as factorial 3 × 5 on randomized
complete block design by using Windows-based SPSS software (ver 10.0, SPSS Inc
1996). The variance over years was estimated homogeneously by performing
Bartlett’s chi-square test and pooled analyses of observations are presented to draw
logical conclusions. The Microsoft Excel software (version 2007, Microsoft Inc.,
WA, USA) was used to draw figures.
RESULTS AND DISCUSSION
Total tuber yield and yield components of potato
Average tuber yield of potato increased significantly with increase in N levels
up to 225 kg N ha-1
, then decreased slightly as nitrogen levels increased further
(Table 1). Tuber yield of Kufri Shailja and Kufri Jyoti increased up to 225 kg N ha-1
,
then declined at higher N levels. On the contrary, tuber yield of Kufri Himalini
increased significantly with increase in N levels up to 225 kg N ha-1
; further addition
of N (up to 300 kg N ha-1
) increased yield but the increment from 225 kg N ha-1
to
300 kg N ha-1
was not significant. Due to application of less amount of nitrogen,

144 A. M. Puste et al
average potato yield decreased by 5.3, 18.7 and 65.1% with 150, 75 and 0 kg N ha-1
,
respectively compared to 225 kg N ha-1
. Average tuber number per plant and average
tuber weight per plant increased with the increase in N levels up to 225 kg N ha-1
and
then decreased at the highest N level (300 kg N ha-1
). Tuber number per plant of
Kufri Himalini was responsive up to 300 kg N ha-1
but that of Kufri Shailja and Kufri
Jyoti were responsive up to 225 kg N ha-1
. On the other hand, tuber weight per plant
of Kufri Himalini and Kufri Jyoti was responsive up to 300 kg N ha-1
, while that of
Kufri Shailja was responsive up to 225 kg N ha-1
. Tuber number per plant was more
stable to N deficit than tuber weight per plant. So, tuber yield in different treatments
depend mainly on tuber weight per plant. More tuber yield with increasing fertilizer
dose was also reported by Sarkar et al. (2011). The higher N increase leaf area which
in turn intercepted more solar radiation and produced more photo-assimilate and
stored in tubers (Baishya et al., 2013).
The correlation between tuber yield and tuber number per plant was moderate
(R2=0.73), indicating that the tuber number per plant contributed less in tuber yield
(Figure 1a). On the other hand, the correlation between tuber yield and tuber weight
per plant was very strong (R2=0.86) indicated that the increase in tuber yield in
different treatments was attributed mainly to the increase in tuber weight per plant
(Figure 1b). Badr et al. (2012) also stated that tuber number and tuber weight per
plant jointly increased tuber yield. This findings implies that increasing N level under
irrigated situation will be effective up to a certain level, beyond that an adverse effect
of excessive N on yields is obvious.
Grade-wise tuber yield of potato
The cultivar Kufri Himalini produced significantly higher yield of small grade
(29.46% over Kufri Shailja and 56.85% over Kufri Jyoti) and large grade (39.05%
over Kufri Shailja and 56.41 % over Kufri Jyoti) tubers (Table 2). Diengdoh et al.
(2012) also found better growth of the above ground parts lead to more
photosynthetic formation and their translocation and accumulation in the sink (tuber)
resulting in higher yield of cv. Kufri Himalini. On the contrary, Kufri Shailja gave
higher yield of semi-medium grade (34.18% over Kufri Himalini and 51.69% over
Kufri Jyoti, respectively) as well as medium grade tubers (23.17% over Kufri
Himalini and 38.86% over Kufri Jyoti). Grade-wise tuber yield was significantly
influenced by N levels, except small grade tubers (Table 2). Yield of semi-medium,
medium, and large grade tubers was increased with increase in N level. Nitrogen at
225 kg N ha-1
produced maximum yield of semi-medium grade tubers, while medium
and large grade tubers production was maximum with 300 kg N ha-1
. Mean yield of
bigger size tubers (large grade) was significantly higher with 300 kg N ha-1
.
Interaction effect was also significant. Bigger size (large grade) tuber production was
increased significantly with increase in N level up to 300 kg N ha-1
for cv. Kufri
Himalini and Kufri Shailja, and 225 kg N ha-1
for cv. Kufri Jyoti. Both Kufri
Himalini and Kufri Shailja produced significantly higher yield of large grade tubers

NITROGEN NUTRITION IN POTATO 145
with 300 kg N ha-1
(87.89 and 65.89 % over control respectively) while Kufri Jyoti
gave significantly higher large grade tuber yield with 225 kg N ha-1
(61.92 % over
control). Zaman et al. (2011) also had a similar opinion that inorganic source of
nutrient was in favour of producing large and very large sized tubers, regardless of
cultivar.
Nitrogen use efficiency, total N uptake and N recovery by potato cultivars
Nitrogen use efficiency (NUE) was influenced greatly by the amount of N, the
most efficient treatments being those which received less amount of N indicating that
NUE was inversely proportional to the amount of N applied (Table 3). The higher
NUE values of 260, 147, 116, 90 kg yield kg N-1
with 75, 150, 225 and 300 kg N ha-1
, respectively were recorded in cv. Kufri Himalini, indicated that Kufri Himalini was
the most efficient in case of NUE. Similar trend was observed by Cabello et al.
(2009) who found that plants grown under limiting nitrogen supply extracted more N
from the soil.
In terms of total N uptake by the crop (Table 3), there was an important
difference between N75 and N300 at full irrigation supply (230.7 versus 363 kg N ha-1
).
Such a large uptake was due to higher N contents in the haulms and tubers as well as
higher dry matter. However, N uptake decreased with increase in N level indicating
luxury consumption of N. Although this luxury consumption of N no longer
contributes to physiological processes but may be accumulated in storage organs
(Marschner, 1995). As a proportion of the N recovery, the lowest N level (75 kg N
ha-1
) gave the most satisfactory values of 173, 272 and 124% for cv. Kufri Himalini,
Kufri Shailja and Kufri Jyoti, respectively (Table 3). This higher utilization may be
attributed to extraction of more nitrogen under N-stress conditions (Badr et al., 2012).
CONCLUSION
The results showed that potato yield and its components were significantly
affected by N level. Tuber weight per plant was more sensitive to nitrogen deficit
than tuber number per plant, and the decrease in tuber yield in N deficit treatments
was mainly due to a decrease in tuber weigh per plant. Tuber yield at full irrigation
supply increased with increase in N level. The NUE decreased with increase in N
level for all the cultivars. The results revealed that irrespective of cultivar 225 kg N
ha-1
was the optimum for getting higher tuber yield of potato and cultivar Kufri
Himalini was the most efficient in case of N use.
REFERENCES
Alva A. 2004. Potato nitrogen management. Journal of Vegetable Crop Production, 10: 97-
130
Badr, M. A., El-Tohamy, W. A. and Zaghloul, A. M. 2012. Yield and water use efficiency of
potato grown under different irrigation and nitrogen levels in an arid region.
Agricultural Water Management, 110: 9-15
146 A. M. Puste et al
Baishya, L. K., Kumar, M., Ghosh, M. and Ghosh, D. C. 2013. Effect of integrated nutrient
management on growth, productivity and economics of rainfed potato in Meghalaya
hills. International Journal of Agriculture, Environment and Biotechnology, 6: 69-77
Bremner, J. M. and Mulvaney, C. S. 1982. Nitrogen-total. In: Page A.L. et al. (Eds.), Methods
of Soil Analysis. Part II. Agronomy Monograph, 2nd
ed. ASA and SSSA, Madison, WI,
pp. 595-624
Cabello, M. J., Castellanos, M. T., Romojaro, F., Martinez-Madrid, C. and Ribas, F. 2009.
Yield and quality of melon grown under different irrigation and nitrogen rates.
Agricultural Water Management, 96: 866-874
Diengdoh, L. C., Rai R., Srivastava, A. K. and Bag, T. K. 2012. Optimizing crop geometry for
potato mini-tuber multiplication in net-house. International Journal of Agriculture,
Environment and Biotechnology, 5: 113-115
Kolodziejczyk, M. 2014. Effect of nitrogen fertilization and microbial populations on potato
yielding. Plant Soil and Environment, 60: 379-386
Kumar, P., Pandey, S. K., Singh, B. P., Singh, S. V. and Kumar, D. 2007. Effect of nitrogen
rate on growth, yield, economics and crisps quality of Indian potato processing
cultivars. Potato Research, 50: 143-155
Marschner, H. 1995. Mineral Nutrition of Higher Plants. Academic Press Inc., San Diego, CA
Meena, B. P., Kumar, A., Meena, S. R., Dhar, S., Rana, D. S. and Rana, K. S. 2013. Effect of
sources and nutrients on growth and yield behaviour of pop corn (Zea mays) and potato
(Solanum tuberosum) sequence. Indian Journal of Agronomy, 58: 474-479
Sarkar, A., Sarkar, S., Zaman, A. and Devi, W. P. 2011. Productivity and profitability of
different cultivars of potato (Solanum tuberosum) as affected by organic and inorganic
sources of nutrients. Indian Journal of Agronomy, 56: 159-163
Zaman, A., Sarkar, A., Sarkar, S. and Devi, W. P. 2011. Effect of organic and inorganic
sources of nutrients on productivity, specific gravity and processing quality of potato
(Solanum tuberosum). Indian Journal of Agricultural Sciences, 81: 1137-1142

NITROGEN NUTRITION IN POTATO 147
Table 1. Total tuber yield, tuber number and tuber weight per plant of different
potato cultivars grown under different nitrogen levels (data pooled over 2
years)
Cultivars Nitrogen levels (kg ha-1
)
N0 N75 N150 N225 N300 Mean
Total tuber yield (t ha-1
)
Kufri Himalini 12.38 31.88 34.40 38.40 39.50 31.32
Kufri Shailja 12.06 31.26 32.72 32.74 24.06 26.57
Kufri Jyoti 11.44 20.34 30.18 31.58 26.91 24.09
Mean 11.96 27.83 32.43 34.24 30.16
Tuber number plant-1
Kufri Himalini 3.00 6.25 7.50 8.00 8.50 6.45
Kufri Shailja 3.75 8.50 8.75 9.50 6.75 7.45
Kufri Jyoti 3.75 3.50 6.00 7.75 7.25 5.65
Mean 3.50 6.08 7.42 8.08 7.50
Tuber weight (g plant-1
)
Kufri Himalini 30.99 117.66 144.23 149.29 155.28 117.49
Kufri Shailja 43.09 139.02 153.01 163.01 108.14 121.25
Kufri Jyoti 51.80 48.21 113.85 126.04 131.02 94.18
Mean 41.96 101.63 137.03 142.78 131.48
LSD (P<0.05)
Factor Total
yield
Tuber
number
Tuber
weight
Cultivar 3.64 NS NS
Nitrogen 4.70 2.01 38.08
Interaction NS NS NS
NS, Non-significant

148 A. M. Puste et al
Table 2. Grade-wise tuber yield of potato as influenced by the cultivars and levels
of N (data pooled over 2 years)
Cultivars Nitrogen levels (kg ha-1
)
N0 N75 N150 N225 N300 Mean
0-25g (small) tuber yield (t ha-1
)
Kufri Himalini 3.27 1.89 2.47 2.37 2.06 2.41
Kufri Shailja 1.71 1.61 1.04 2.32 1.82 1.70
Kufri Jyoti 0.96 1.27 1.00 1.13 0.84 1.04
Mean 1.98 1.59 1.50 1.94 1.57
26-50g (semi-medium) tuber yield (t ha-1
)
Kufri Himalini 3.00 2.88 2.99 3.85 2.86 3.12
Kufri Shailja 2.19 4.49 3.85 7.84 5.33 4.74
Kufri Jyoti 1.63 1.47 3.18 2.19 2.99 2.29
Mean 2.27 2.95 3.34 4.63 3.72
51-75g (medium) tuber yield (t ha-1
)
Kufri Himalini 2.90 3.76 4.83 4.03 6.04 4.31
Kufri Shailja 2.92 7.25 6.30 5.91 5.70 5.61
Kufri Jyoti 1.78 3.48 3.72 3.52 4.64 3.43
Mean 2.53 4.83 4.95 4.48 5.46
>75g (large) tuber yield (t ha-1
)
Kufri Himalini 1.20 7.48 13.02 11.75 16.09 9.91
Kufri Shailja 2.06 4.67 8.30 5.66 9.50 6.04
Kufri Jyoti 2.14 3.31 5.06 5.62 5.50 4.32
Mean 1.80 5.15 8.79 7.68 10.36
LSD (P<0.05)
Factor 0-25g 26-50g 51-75g >75g
Cultivar 0.40 0.90 0.86 1.24
Nitrogen NS 1.16 1.10 1.60
Interaction NS 2.01 NS 2.77
NS, Non-significant
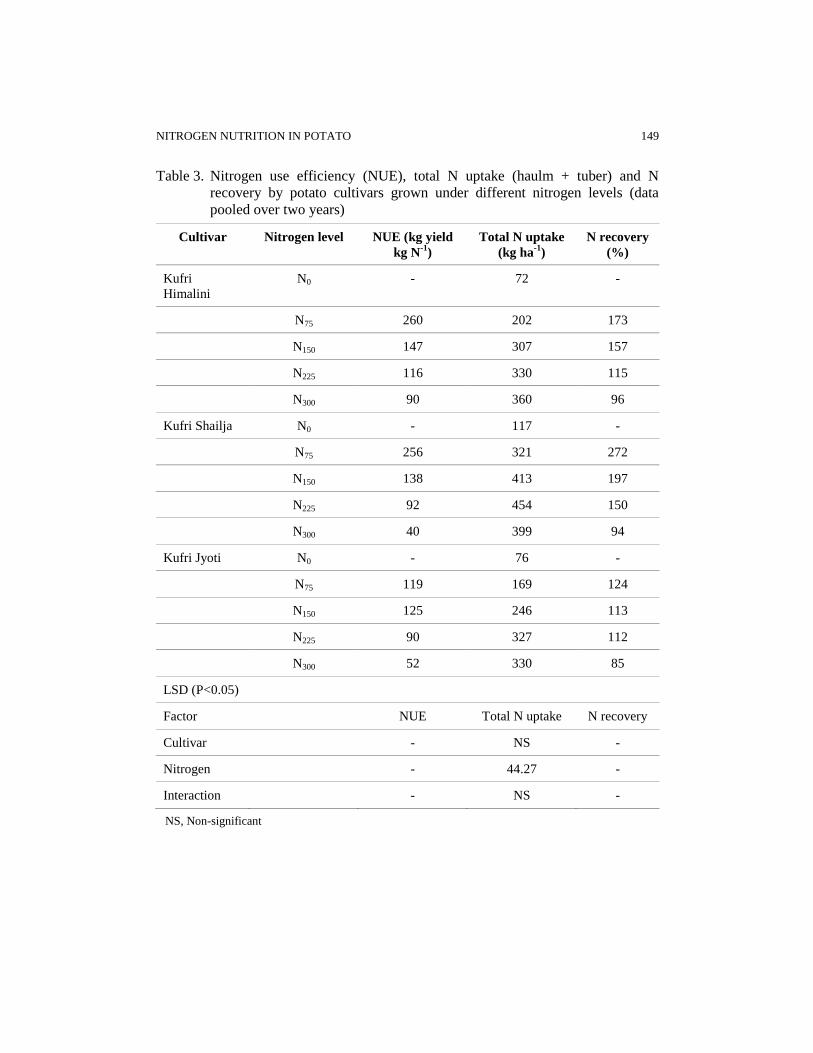
NITROGEN NUTRITION IN POTATO 149
Table 3. Nitrogen use efficiency (NUE), total N uptake (haulm + tuber) and N
recovery by potato cultivars grown under different nitrogen levels (data
pooled over two years)
Cultivar Nitrogen level NUE (kg yield
kg N-1
)
Total N uptake
(kg ha-1
)
N recovery
(%)
Kufri
Himalini
N0 - 72 -
N75 260 202 173
N150 147 307 157
N225 116 330 115
N300 90 360 96
Kufri Shailja N0 - 117 -
N75 256 321 272
N150 138 413 197
N225 92 454 150
N300 40 399 94
Kufri Jyoti N0 - 76 -
N75 119 169 124
N150 125 246 113
N225 90 327 112
N300 52 330 85
LSD (P<0.05)
Factor NUE Total N uptake N recovery
Cultivar - NS -
Nitrogen - 44.27 -
Interaction - NS -
NS, Non-significant
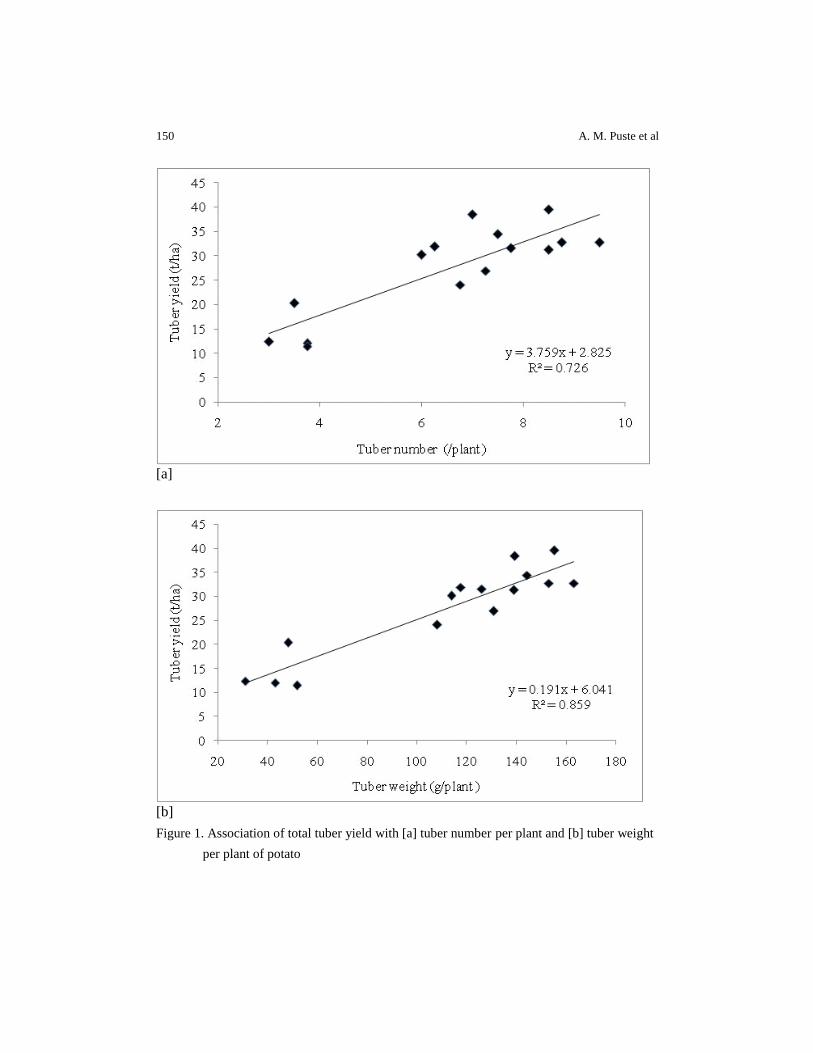
150 A. M. Puste et al
[a]
[b]
Figure 1. Association of total tuber yield with [a] tuber number per plant and [b] tuber weight
per plant of potato

SAARC J. Agri., 13(2): 151-160 (2015)
DIETARY BLACK CUMIN (Nizella sativa) SEED MEAL ON
GROWTH AND MEAT YIELD PERFORMANCE OF
BROILERS
M. S. Jahan*1
, M. Khairunnesa2, S. Afrin
3 and M. S. Ali
4
Department of Poultry Science, Bangladesh Agricultural University, Mymensingh-2202, Bangladesh
ABSTRACT
A total of 144, day old as hatched Cobb-500 broilers were fed adlibitum basis on a diet with 0%, 0.5%, 1.0% and 1.5% of Black Cumin Seed Meal up to 35 days of age to compare the effect of BCSM as herbal growth promoters on growth performance, meat yield characteristics and profitability of broilers. The experimental diets consisted of broiler starter and broiler grower, which were fed from 0-16 and 17-35 days of age, respectively. Diets supplemented with 1.5% BCSM showed significant effect on live weight at 21, 28 and 35 days of old in broilers in various groups as compared to that of control group. Better feed conversion (2.02) also noticed at 1.5% level of BCSM at early stage (14 days of old) of broilers. There was no significant difference (P>0.05) among the average live weight, dressing yield, thigh meat, wing meat, heart, gizzard liver, at 0%, 0.5%, 1.0% and 1.5% level of BCSM diet. But difference found within breast meat, drumstick meat, abdominal fat and skin of broilers at 1.5% level of BCSM diet. It may be concluded that supplementation of BCSM at 1.5% had the highest significant effect (P<0.01) on feed cost (Tk kg
-1 b), production cost (Tk kg
-1 b) and profit
(Tk kg-1
b) and lower mortality. So that 1.5% BCSM in diets can be used for economic and efficient broiler production than 0.5% and 1.0 % level.
Keywords: Black cumin, growth promoter, herbal, broiler.
INTRODUCTION
Poultry farming is one of the most successful and fast growing industry that
provides high quality protein at economic price. However, tremendous improvement
already recorded in broilers by genetic approaches and balancing of diet. Antibiotic
* Corresponding author email: [email protected] 1 Scientific officer, Bangladesh Livestock Research Institute, Savar , Dhaka 2 Lecturer, Dairy and Poultry Science Department, Bangabandhu Sheikh Mujibur Rahman Agricultural University,
Gazipur-1706, Bangladesh 3 Lecturer, Poultry Science Department, Bangladesh Agricultural University, Mymensingh-2202 4 Professor, Poultry Science Department, Bangladesh Agricultural University, Mymensingh-2202.
Received: 13.09.2015
152 M. S. Jahan et al
used in poultry production for more than 50 years to treat and prevent potential
diseases. AGP were supposed to increase growth, improve gut health, better nutrient
utilization and feed conversion (Visek, 1978). One potential problem is the increased
resistance of pathogenic bacteria to the approved antibiotics used for growth
promotion. The occurrence of AGP-associated resistant bacteria has lead to concerns
of human health risks. Therefore, the use of antibiotic growth promoters (AGP) has
been banned in many countries and these led to investigations of alternative feed
additives in animal production. The demand of organic products that are alternatives
of AGP should be safe and economic. Therefore, there is great interest in developing
natural alternatives to AGP in order to maintain both broiler performance and health.
Many biological trials of certain herbal products were conducted as growth promoter.
Encouraging results were demonstrated in respect to growth, feed conversion,
increased survivability, immunity and livability in poultry (Kumar, 1991). Herbal
growth promoters also exerted therapeutic effects against liver damage (Ghosh,
1992). Natural medicinal products from herbs and spices have also been used as feed
additives for poultry diet (Guo, 2003). Plant-derived products have proven to be less
toxic, residue free and are accepted as ideal feed additives in poultry diet (Wang et
al., 1998). Advances in chemistry and identification of plant compounds are effective
in treating certain diseases and renewed the interest in herbal medicines. Black cumin
(BC) belonging to Nigella sativza (NS) is an annual spicy herb native to
Mediterranean regions. BC is used for medicinal purposes, as herb and pressed oil.
BC is traditionally used for a variety of conditions and treatments related to
respiratory health, stomach and intestinal health, kidney and liver functions,
circulatory and immune system support and for general well being. Therefore, in the
past many observations were made for testing various alternative substances suitable
to replace AGPs in poultry diets. Herbal products are used as growth promoters in the
poultry diet like BC (Ahmad, 2005 and Ihsan, 2003). Including 2.5 or 5.0% BSC in
the diets of broilers has no deleterious effects on their performance, immunity, serum
biochemical constituents or haematological indices (Sohail et al., 2012). However, no
study was conducted to evaluate the comparative as well as synergistic effects of BC
seeds on broiler health and performance of different economic traits, related to heart
and liver functions. Under prevailing conditions, the current study was designed to
assess the effect of BC seeds on broiler performance and survivability at different
inclusion level and economic use of BC in broiler.
MATERIALS AND METHODS
This study was carried out with 144 day old as hatched Cobb 500 broilers for a
period of 35 days at Bangladesh Agricultural University (BAU) Poultry Farm,
Mymensingh to find out the effect of dietary levels of black cumin seed meal
(BCSM) on feed consumption, weight gain, FCR, mortality, cost of production of
BCSM in diet formulation to maximize the performance of broilers. Day old broilers
(Cobb 500) were purchased from a commercial hatchery “Nourish Poultry and
DIETARY BLACK CUMIN (Nizella sativa) SEED MEAL 153
Hatchery Ltd” of Shreepur, Gazipur and black cumin was purchased from local
market, Mymensingh. A total of 144 day old broilers were randomly distributed to 4
dietary groups each having 4 replications. The treatment groups were having 0%,
0.5%, 1% and 1.5% BCSM. There were 9 chicks in each replication.
Locally available ingredients were used to formulate ration for the broilers. The
diets were prepared by hand mixing. All ingredients except BCSM were purchased
from the local market of Mymensingh town. Major ingredients were thoroughly
mixed at first and then micro-ingredients. The diets were prepared with 4 different
levels of BCSM (0%, 0.5%, 1% and 1.5%). Broilers were fed two diets, starter (0-14
days) and grower (15-35 days). Ration formulated according to the standard nutrient
requirement of Cobb 500 individual strain recommended by BSTI. The nutrient
percentage in prepared starter and grower ration were showed in the (Table 1).
The experimental rooms was properly cleaned and disinfected first by phenyl
solution later with vircon S. After drying, the experimental house was divided into 16
equal sized pens, separated by bamboo materials and wire net partitions according to
treatments and replications. Pen and wire net partitions were disinfected by phenyl
solution after cleaning and washing.
The experiment was conducted in a gable type open sided tin-shed house. The
proper management procedures were followed during experimental period and
identical management practices were maintained. The house was partitioned into 16
pens using wire-net (90cm height) where a group of 9 broilers were randomly
allocated to each pen. Floor space for each broiler was 900cm2 for comfort ability of
broilers during summer. One trough (90cm × 11.5cm ×6cm) feeder and one pot
drinker with a capacity of one litter were provided in each pen up to 35days. Feeders
were cleaned every week and drinkers were cleaned every morning. Fresh clean
drinking water was provided twice daily up to 35 days. Just after arrival, chicks were
supplied with a solution containing glucose, electrolytes. Saw dust was used as litter
at a depth of 5 cm. After third week previous litter was replaced by new dry saw dust.
Every two days interval litter was stirred to prevent ammonia gas and maggot
formation. All of the experimental broilers were vaccinated against New Castle
disease and Infectious Bursal Disease at the age of day 5th
and 12th
respectively. All
the vaccines were administered as per recommendation of the manufacturer.
Temperature was maintained at 300C as brooding temperature which was decreased
gradually in subsequent weeks @ 2.50C/week until the broilers were adjusted to
environmental temperature. Each pen was provided two electric bulbs (100wt).
Broilers were exposed to 24 hours continuous light in first 7days. Strict bio-security
measures were taken during the experimental period. Entrance of personnel was
restricted. Before entrance, shoes were changed and feet were dipped in a footbath
containing disinfectant solution (potassium permanganate) and the footbath was at
the entrance point of the experimental house. No birds died during the entire
experimental period.
154 M. S. Jahan et al
At the end of the experiment, 16 broilers; one broiler from each replicate
groups weighing average of pen weight were selected to determine meat yield
characteristics. To facilitate processing, all broilers’ feed was withdrawn 12 hours
prior to killing. After complete bleeding, the slaughtered broilers were immersed in
water heated to 51-55°C for 120 seconds in order to loosen the feathers of the
carcasses. Each broiler was slaughtered, bled, skulled, eviscerated, dressed and
dissected by following standard method. The thigh, wing, heart, gizzard and liver
breast, drumstick, abdominal fat, skin and viscera of each broiler were weighed
individually by using electric balance very carefully.
Parameters recorded
During dressing the following parameters were recorded; live weight, blood
weight, feather weight, head weight, dressed weight, abdominal fat, viscera weight,
liver weight, drumstick weight, heart weight and skin weight. The following records
were kept throughout the experimental period; body weight, body weight gain, feed
consumption, feed conversion ratio (FCR), mortality, production cost and
profitability, records of dressing yield and dressing percentage. Records were kept for
each week.
Statistical analysis
Analysis of Variance (ANOVA) was performed to compare growth
performance, profitability and meat yield parameters. A SAS system was used for
analysis of all data and all significant and non-significant effects were identified by
Ducan’s Multiple Range Test.
RESULTS AND DISCUSSION
Live weight
Generally live weight s increased with the age of birds. (Table 2). Live weights
of broiler were similar on levels of at 7, 14 days of age. However, significant
differences appeared at 21, 28 and 35 (P<0.05) days of age where live weight
increased within linear pattern at the increasing level of dietary black cumin seed
meal (BC). Ziad et al. (2008), Al-Homidan et al. and Osman (2002), Siddig and
Abdelati (2001), AL-Beitawi and El-Ghousein (2008), Abu-Dieyeh and Abu-
Darwish (2008) supported that broilers fed on 1.5% crushed black cumin had higher
(P<0.05) live body weight and body weight gain in broiler diet. The improvement in
weight gain of the broilers using BC in their diets may probably be due to the fact
that ethyl ether extracts of BC. It inhibits growth of intestinal bacteria such as S.
aureus and E. coli as reported by (Hanafy and Hatam, 1991). The improvement in
weight gain of the broilers using BCSM in their diets may probably be for its
antioxidant properties which act as natural growth promoter.
DIETARY BLACK CUMIN (Nizella sativa) SEED MEAL 155
Feed intake
There was no difference in feed intake at early stage. Feed intake normally
decreased with the increasing level of BCSM in diet. But feed intake at 21 days of
age was differed on different diets. Feed intake appeared to be slightly (P>0.05)
higher on diet with 1.5% BCSM at 21 days of age. This result is coinciding with the
finding of Abbas and Ahmed (2010) who mentioned that, addition of 1or 2% ground
black cumin to the broiler diet significantly (P< 0.05) decreased feed intake. A
similar result was obtained by Halle et al. (1999) who explained that the addition of
essential oil from black cumin affected feed intake in broilers. The experiment was
conducted when the temperature was high. It may be one of the reasons to vary in
feed intake.
Feed conversion
Weekly feed conversion (FC) of broilers on 0.0, 0.5, 1.0 and 1.5% dietary
BCSM were more or less similar (p<0.05) except 14 days of age. Higher FC was
obtained from 1.5% BCSM diet which partially coincided with Al-Homidan et al.
(2002), AL-Beitawi and El-Ghousein (2008), Abu-Dieyeh and Abu-Darwish (2008)
and Durrani et al., 2007. It was (P<0.05) better in comparison with 0, 0.5 and 1%
BCSM at 14 days of age. The increase FC obtained in broilers impressed for the diet
with increasing level of BCSM. Such relationship indicates that, BCSM may content
some lypolytic agents in the diet.
Meat yield characteristics
Dietary BCSM did not affect the average live weight, dressing yield, thigh
meat, wing meat, gizzard, head, heart, liver, and neck with different supplementation
of BCSM based diet (Table 3). Highly significant (P<0.05) differences were obtained
for the percentage of breast meat, drumstick meat, skin and abdominal fat at different
diets. Breast meat, drumstick meat and skin percent of broilers almost increase in the
diet in a linear fashion with the increase of BCSM. Abdominal fat also decreased
with increasing level of BCSM. It was contradictory to Durrani et al. (2007) who
noticed that birds fed on rations supplemented with black cumin revealed no
significant (P> 0.05) effect on abdominal fat. The present investigation was almost
similar with the Abbas and Ahmed (2010), Siddig and Abdelati (2001); El-Bagir et
al. (2006); Durrani et al. (2007) who found that the addition of 40 g kg-1
in black
cumin to broiler ration resulted in increased weight of thigh and breast meat. The
most significant differences are noticed (P> 0.05) in abdominal fat percentage for the
lypolytic effect of BCSM. Relatively higher breast and drumstick meat may have an
effect in live weight gain attributed to slaughter weight.
Production cost and profit
Feed cost and total production cost per broiler and per kg broiler increased by
1.5 % BCSM than control (P<0.01) (Table 4). Such pattern of increasing feed cost is
almost in linear fashion with increasing different level of supplementation of BCSM.
156 M. S. Jahan et al
Profit per broiler was highest on 0.5% and 1.5% BCSM and declined almost in a
linear fashion (P<0.05) between diets 1 and 1.5% differ from higher group. On the
other hand, there was no difference (P>0.05) in cost per kg diet at different level of
BCSM. However there was a tendency of increasing profit margin of using BCSM
based diet in broiler. The experimented results for cost analysis coincided with
Ahmad (2005) and Ihsan (2003). Ahmad (2005), who reported supplementation of
BCSM at 0.5%, was more beneficial and profitable in broiler production than 1.0%
level. Ihsan (2003) also reported that the broilers fed diets with BCSM, fetched more
profit than the rations without supplementation of this herbal growth promoter.
Increase in the profit margin of the birds fed rations containing herbal growth
promoters may be attributed to the better efficiency of feed utilization, which resulted
in more growth and better feed conversion which ultimately leading to higher profit
margin in the broilers reared on BCSM diets.
Mortality
Overall mortality was 1.25% which is lower than accepted limit of commercial
broiler. Only one bird from control and one from 0.5% dietary BCSM group died
during the whole experimental period and no treatment related adverse effect was
detected. Mortality was detected only from heart failure, which was frequently
observed in rapid growing of broilers.
CONCLUSION
Based on the above findings, it has been concluded that black cumin seed
meal can be included at 1.5% level in the broiler diet as natural growth promoter for
broiler to improve feed conversion ratio, carcass yield and survivability.
REFERENCES
Abbas, T. E. and Ahmed, M. E. 2010. Black cumin for poultry feed. World's Poultry Science
Journal, 23: 66-80
Abu-Dieyeh, Z. H. M. and Abu-Darwish, M. S. 2008. Effect of feeding powdered black
cumin seeds (Nigella sativa L.) on growth performance of 4-8 week-old broilers.
Journal of Animal and Veterinary Advances, 7: 286-290
Al-Betawi, N. and El-Ghousein, S. S. 2008. Effect of feeding different levels of Nigella sativa
seeds (black cumin) on performance, blood constituents, and carcass characteristics of
broiler chicks. International Journal of Poultry Science, 7: 715-721
Al-Homidan, A., Al-Qarawi, A. A., Al-Waily, S. A. and Adam, S. E. I. 2002. Response of
broiler chicks to dietary Rhazya strica and Nigella sativa. British Poultry Science, 43:
291-296
Ahmad, S., 2005. Comparative efficiency of garlic, turmeric and kalongi as growth promoter
in broiler. Department Poultry Sciences. University of Agriculture, Faisalabad,
Pakistan
DIETARY BLACK CUMIN (Nizella sativa) SEED MEAL 157
Durrani, F. R., Chand, N., Zaka, K., Sultan, A., Khattak, F. M. and Durrani, Z. 2007. Effect of
different levels of feed added black seed on the performance of broiler chicks. Pakistan
Journal of Biological Science, 10: 4164-4167
El-Bagir, N. M., Hama, A. Y., Hamed, R. M., Rahim, A. G. A. and Beyenen, A. E. 2006.
Lipid composition of egg yolk and serum in laying hens fed diets containing black
cumin (Nigella sativa). International Journal of Poultry Science, 5: 574-578
Ghosh, T. K. 1992. Efficiency of liver herbal product on counteracting aflatoxin on broiler
birds. Indian Poultry Review, 32: 33–34
Halle, I., Thomann, R. and Flachowsky, G. 1999. Effect of ethereal (essential) oil and oil
seeds on the growth of broilers, Germany. 23: 469-472
Hanafy, M. S. and Hatem, M. E. 1991. Studies on the antimicrobial activity of Nigella sativa
seeds (Black cumin). Journal of Ethopharmacol, 34: 275-278
Ihsan, K. 2003. Effect of different levels of kalongi (N. sativa) seeds on the performance of
broilers. M. Sc. (Hons.) Thesis, Department of Poultry Sciences, University of
Agriculture, Faisalabad, Pakistan
Kumar, O. M. 1991. Effect of Liv-52 syrup on broiler performance in North Eastern Region.
Indian Poultry Review, 31: 37–38
Sidding, R. M. and Abdelati, K. 2001. Effect of dietary vitamin A and Nigella sativa on
broiler performance. Proceedings of the 10th International Conference of the
Association of Institution for Tropical Veterinary Medicine Livestock, Community and
Environment, Copenhagen, Denmark
Sohail, H. K., Jahanzeb, A., Ahsan U. H. and Ghulam, A. 2012. Black cumin seeds as
phytogenic product in broiler diets and its effects on performance, blood constituents,
immunity and caecal microbial population. Italian Journal of Animal Science, 11:438-
444
Visek, W. J. 1978. The mode of growth promotion by antibiotics. Journal of Animal Science,
46:1447-1469
Wang, R. D. and Bourne, S. 1998. Can 2000 years of herbal medicine history help us solve
problems in the year 2000? Biotechnology in the Feed Industry: Proceedings of
Alltech`s 14th Annual Symposium, Kentucky, USA. 22: 273-291
Ziad, H. M., Abu-Dieyeh, Mohammad, S. and Abu-Darwish. 2008. Effect of feeding
powdered Black Cumin Seeds (Nigella sativa L.) on growth performance of 4-8 week-
old broilers. Journal of Animal and Veterinary Advances, 7(3): 286 – 290
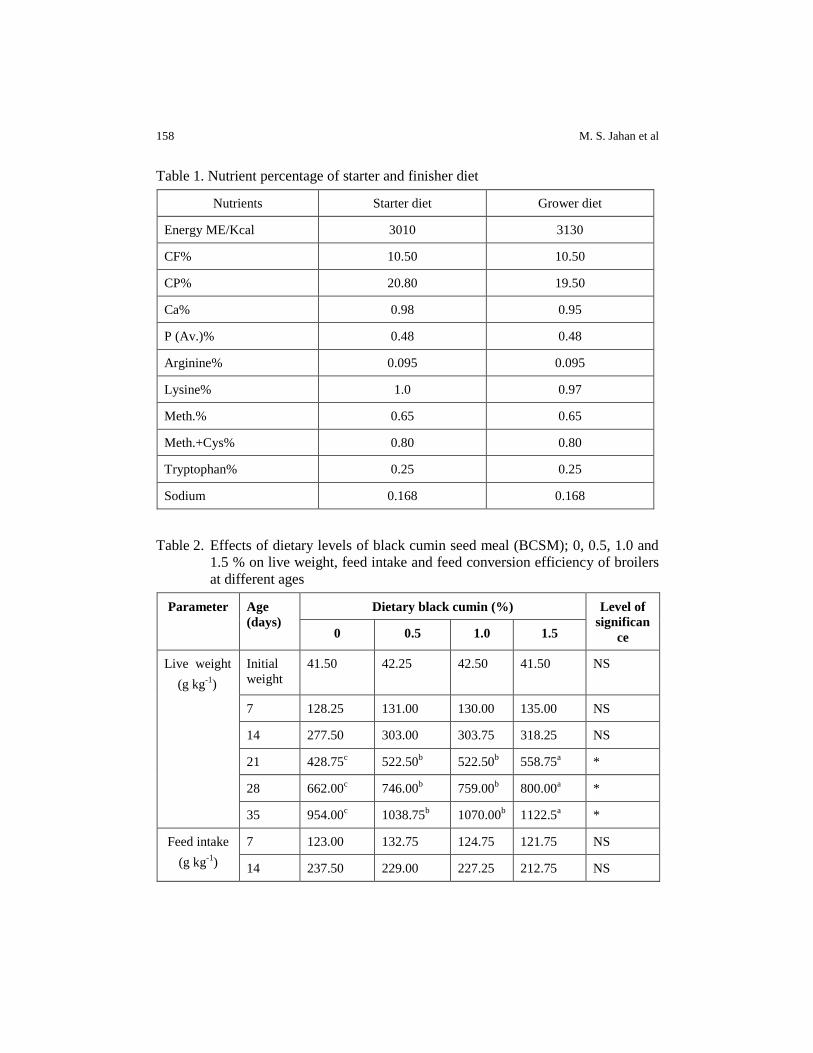
158 M. S. Jahan et al
Table 1. Nutrient percentage of starter and finisher diet
Nutrients Starter diet Grower diet
Energy ME/Kcal 3010 3130
CF% 10.50 10.50
CP% 20.80 19.50
Ca% 0.98 0.95
P (Av.)% 0.48 0.48
Arginine% 0.095 0.095
Lysine% 1.0 0.97
Meth.% 0.65 0.65
Meth.+Cys% 0.80 0.80
Tryptophan% 0.25 0.25
Sodium 0.168 0.168
Table 2. Effects of dietary levels of black cumin seed meal (BCSM); 0, 0.5, 1.0 and
1.5 % on live weight, feed intake and feed conversion efficiency of broilers
at different ages
Parameter Age
(days)
Dietary black cumin (%) Level of
significan
ce 0 0.5 1.0 1.5
Live weight
(g kg-1
)
Initial
weight
41.50 42.25 42.50 41.50 NS
7 128.25 131.00 130.00 135.00 NS
14 277.50 303.00 303.75 318.25 NS
21 428.75c 522.50
b 522.50
b 558.75
a *
28 662.00c 746.00
b 759.00
b 800.00
a *
35 954.00c 1038.75
b 1070.00
b 1122.5
a *
Feed intake
(g kg-1
)
7 123.00 132.75 124.75 121.75 NS
14 237.50 229.00 227.25 212.75 NS

DIETARY BLACK CUMIN (Nizella sativa) SEED MEAL 159
21 297.50b 393.25
a 387.00
a 404.50
a *
28 483.75 429.50 430.50 418.00 NS
35 658.50 619.00 660.75 650.00 NS
Feed
Conversion
7 1.41 1.49 1.43 1.29 NS
14 1.59b
1.37ab
1.32ab
1.13a
*
21 2.04 1.82 1.79 1.72 NS
28 2.09 1.95 1.81 1.73 NS
35 2.29 2.14 2.13 2.02 NS
abc, mean values with dissimilar superscripts are significantly different; NS; *; P<0.05.
Table 3. Effect of feeding BCSM diets to broilers on meat yield characteristics of
broiler at different ages
Variable (%) Dietary black cumin (%) Level of
significance 0 0.5 1.0 1.5
Live weight
(g/broiler)
952.5 1026.25 1055.5 1107.5 NS
Dressing yield 57.90 57.32 59.77 60.19 NS
Breast meat 14.49b 15.28
ab 15.73
b 16.12
a *
Thigh meat 5.65 5.48 5.81 6.02 NS
Drumstick meat 2.48b 2.63
b 2.70
ab 2.88
a *
Wing meat 1.88 1.56 1.96 1.77 NS
Abdominal fat 1.58b 1.12
b 1.08
b 0.94
a *
Gizzard 1.88 1.80 1.94 1.89 NS
Head 2.86 3.03 2.86 2.74 NS
Heart 0.47 0.44 0.45 0.48 NS
Liver 2.58 2.26 2.44 2.31 NS
Neck 2.69 2.45 2.39 2.76 NS
Skin 13.88b 13.24
ab 12.33
ab 11.67
a *
abc, mean values with dissimilar superscripts are significantly different; NS; *; P<0.05

160 M. S. Jahan et al
Table 4. Effects of dietary black cumin seed meal at 0, 0.5, 1.0 and 1.5% on cost of
production and profit of broilers
Parameters
Dietary black cumin (%) Sig.
0 0.5 1.0 1.5
Feed cost (Tk kg-1
broiler) 57.24ab
62.94b
66.83b
73.55a
**
Production cost (Tk kg-1
broiler) 132.60c
145.00b
151.40b
162.20a
**
Sale (Tk kg-1
broiler) 160.00 160.00 160.00 160.00 NS
Sale (Tk kg-1
broiler) 152.60 166.20 171.20 179.60 NS
Profit (Tk kg-1
broiler) 13.60c
26.60b
29.70b
35.10a
*
Profit (Tk kg-1
broiler) 20.04a
21.20a
19.84b
17.37b
**
abc, mean values with dissimilar superscripts are significantly different; NS; *, P<0.05; **, P<0.01.

SAARC J. Agri., 13(2): 161-172 (2015)
EFFECT OF DEEP PLACEMENT OF NITROGEN
FERTILIZERS ON RICE YIELD AND N USE EFFICIENCY
UNDER WATER REGIMES
S. Das, M. R. Islam*, M. Sultana, H. Afroz and M. A. Hashem
Department of Soil Science, Bangladesh Agricultural University, Mymensingh-2202, Bangladesh
ABSTRACT
The experiments were conducted at the Soil Science Field Laboratory of Bangladesh Agricultural University, Mymensingh during boro season of 2013 to evaluate the effect of deep placement of nitrogen (N) fertilizers on rice yield and N use efficiency under two different water regimes [continuous flooding (CF) and alternate wetting and drying (AWD)]. After deep placement of USG and NPK briquettes and each split application of PU, the water samples were collected for five consecutive days and analyzed for ammonium-Nitrogen (NH4-N) concentration. In both water regimes the floodwater NH4-N concentration gave highest value at the second day of PU application followed by gradual decrease with time and in continuous flooding condition the release of NH 4-N was higher compared to AWD condition. Deep placement of N fertilizers also increased grain yield under AWD compared to CF condition and the maximum value was obtained in treatment T5 [USG 78 kg N ha
-1 + PM 3 t ha
-1] statistically similar to T3 [USG, 156 kg N ha
-1].
Due to application USG and NPK briquettes, the N uptake and N use efficiency also gave higher values in AWD compared to CF condition. The results revealed that the deep placement of USG with poultry manure performed better in terms yield, N uptake and N use efficiency by BRRI dhan29 under AWD condition. So, the deep placement of USG under AWD condition could be recommended for higher production of boro rice.
Keywords: Deep placement of N, flood water ammonium, rice yield, nitrogen use efficiency, continuous flooding (CF), alternate wetting and drying (AWD)
INTRODUCTION
In Bangladesh, rice is grown under diverse irrigated, rainfed and deep water
conditions in the three distinct seasons, namely Aus, Aman and Boro. Out of total
*Corresponding author email: [email protected]
Received: 13.09.2015
162 M. R. Islam et al
rice production in this country about 43% comes from boro and the rest comes from
Aman and Aus crops (BBS, 2011). For cultivation of rice, farmers of Bangladesh
solely depend on urea fertilizer and 50% of the total demand is fulfilled by import
which costs a huge amount of foreign currency (BBS, 2012). On the other hand,
excessive N fertilization is one of the major concerns in sustainable agriculture for its
decreased N-utilization efficiency by crops and increased N release to the
environment, resulting atmosphere and water pollution (Zhu et al., 1997). The
volatilization loss of prilled urea (PU) is very high and farmers lose a huge amount of
money for N fertilizer. Therefore, the deep placement of urea super granule (USG)
might be a good option to minimize the production cost as well as to increase crop
yield. Ammonia volatilization losses in the flooded soils range from negligible to
almost 60% of the applied N (Xing and Zhu, 2000). Deep placement of N fertilizers
into the anaerobic soil zone is an effective method to reduce volatilization loss
(Mikkelsen et al., 1978).
Again, water shortage during the boro season in Bangladesh is a growing
problem due to climatic change and upstream water regulation of the major rivers in
Bangladesh. One major recent advance in rice water management is termed Alternate
Wetting and Drying (AWD) which combines the beneficial aspects of both aerobic
and anaerobic cultivation. For AWD practices, the fields are managed as irrigated
lowland rice but the top soil layer is allowed to dry out to some degree before
irrigation is applied again (Belder et al., 2004).
The number of days under non-flooded soil conditions can vary depending on
plant development stages and availability of water. The AWD irrigation causing
alternating oxic and anoxic conditions in top soil may lead to increased N losses from
coupled nitrification-denitrification (Nicolaisen et al., 2004; Liu et al., 2010).
Denitrification loss could be enhanced under AWD irrigation system but ammonia
(NH3) volatilization is the major N loss pathway from irrigated rice field (De Datta et
al., 1991). Ventura and Yoshida (1977) reported reduced NH3 volatilization under
AWD than continuous flooded condition. AWD can lower water use for irrigated rice
by 35% (Zhang et al., 2009), increase rice yield by ~10% relative to permanent
flooding (Yang et al., 2009; Zhang et al., 2009). Hence, the effect of deep placement
of N fertilizer on yield and nitrogen use efficiency of boro rice under two different
water regimes were examined in this study.
MATERIALS AND METHODS
Two experiments were conducted under continuous flooded (CF) and AWD
conditions with similar N fertilizer treatment at the Soil Science Field Laboratory of
Bangladesh Agricultural University, Mymensingh to evaluate the effect of water
regimes on the yield and N use efficiency in boro rice. The soil belongs to Sonatala
series under the AEZ-9 (Old Brahmaputra Floodplain). The soils were silt loam in
texture. In AWD condition, the soil had pH 6.07, organic matter content 1.10%,
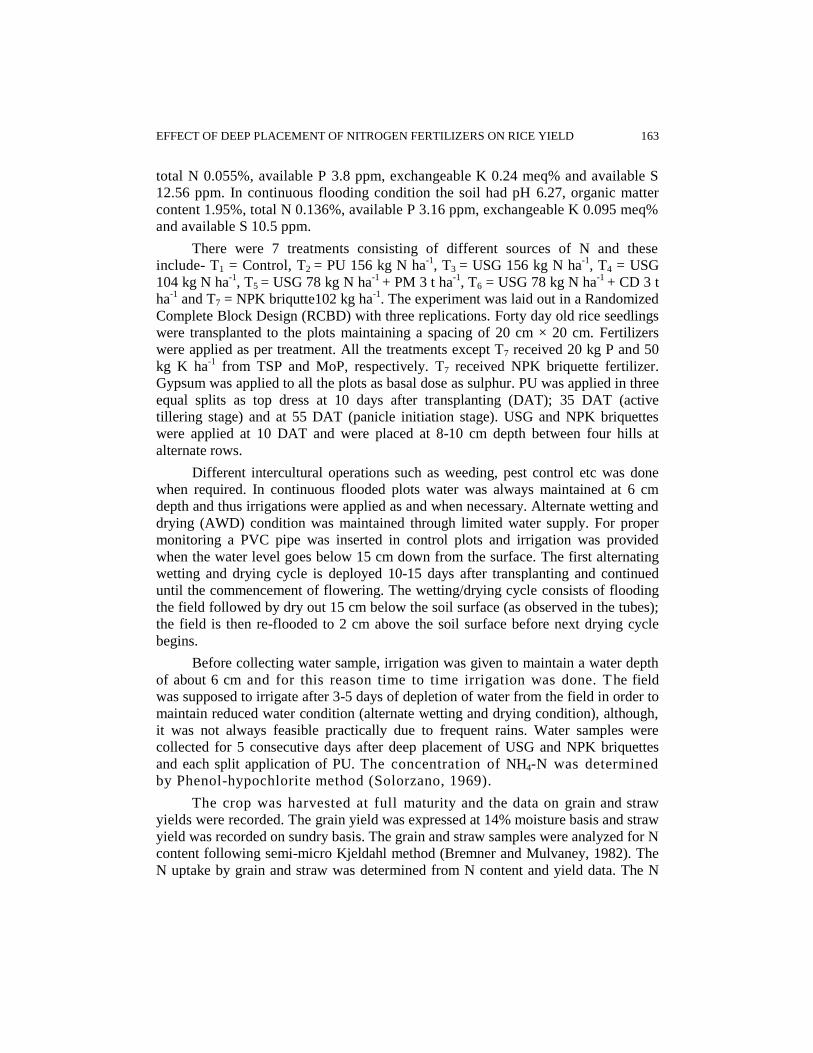
EFFECT OF DEEP PLACEMENT OF NITROGEN FERTILIZERS ON RICE YIELD 163
total N 0.055%, available P 3.8 ppm, exchangeable K 0.24 meq% and available S
12.56 ppm. In continuous flooding condition the soil had pH 6.27, organic matter
content 1.95%, total N 0.136%, available P 3.16 ppm, exchangeable K 0.095 meq%
and available S 10.5 ppm.
There were 7 treatments consisting of different sources of N and these
include- T1 = Control, T2 = PU 156 kg N ha-1
, T3 = USG 156 kg N ha-1
, T4 = USG
104 kg N ha-1
, T5 = USG 78 kg N ha-1
+ PM 3 t ha-1
, T6 = USG 78 kg N ha-1
+ CD 3 t
ha-1
and T7 = NPK briqutte102 kg ha-1
. The experiment was laid out in a Randomized
Complete Block Design (RCBD) with three replications. Forty day old rice seedlings
were transplanted to the plots maintaining a spacing of 20 cm × 20 cm. Fertilizers
were applied as per treatment. All the treatments except T7 received 20 kg P and 50
kg K ha-1
from TSP and MoP, respectively. T7 received NPK briquette fertilizer.
Gypsum was applied to all the plots as basal dose as sulphur. PU was applied in three
equal splits as top dress at 10 days after transplanting (DAT); 35 DAT (active
tillering stage) and at 55 DAT (panicle initiation stage). USG and NPK briquettes
were applied at 10 DAT and were placed at 8-10 cm depth between four hills at
alternate rows.
Different intercultural operations such as weeding, pest control etc was done
when required. In continuous flooded plots water was always maintained at 6 cm
depth and thus irrigations were applied as and when necessary. Alternate wetting and
drying (AWD) condition was maintained through limited water supply. For proper
monitoring a PVC pipe was inserted in control plots and irrigation was provided
when the water level goes below 15 cm down from the surface. The first alternating
wetting and drying cycle is deployed 10-15 days after transplanting and continued
until the commencement of flowering. The wetting/drying cycle consists of flooding
the field followed by dry out 15 cm below the soil surface (as observed in the tubes);
the field is then re-flooded to 2 cm above the soil surface before next drying cycle
begins.
Before collecting water sample, irrigation was given to maintain a water depth
of about 6 cm and for this reason time to time irrigation was done. The field
was supposed to irrigate after 3-5 days of depletion of water from the field in order to
maintain reduced water condition (alternate wetting and drying condition), although,
it was not always feasible practically due to frequent rains. Water samples were
collected for 5 consecutive days after deep placement of USG and NPK briquettes
and each split application of PU. The concentration of NH4-N was determined
by Phenol-hypochlorite method (Solorzano, 1969).
The crop was harvested at full maturity and the data on grain and straw
yields were recorded. The grain yield was expressed at 14% moisture basis and straw
yield was recorded on sundry basis. The grain and straw samples were analyzed for N
content following semi-micro Kjeldahl method (Bremner and Mulvaney, 1982). The
N uptake by grain and straw was determined from N content and yield data. The N
164 M. R. Islam et al
use efficiency (kg grain yield increase kg-1
N applied) was determined by the
following formula: NUE = (Gy + N - GyON) / FN, Where Gy + N = grain yield in
treatment with N application; GyON = grain yield in treatment without N application
and FN = amount of fertilizer N applied (kg ha-1
). The apparent N recovery was
calculated by the following formula: ANR (kg ha-1
) = (UN + N - UN0N) /FN; where,
UN +N is total N uptake (kg ha-1
) with grain and straw; UN0N is the N uptake (kg ha-1
)
in control; FN is amount of fertilizer N applied (kg ha-1
). All the data were
statistically analyzed by F-test and the mean differences were ranked by DMRT at
5% level (Gomez and Gomez, 1984).
RESULTS AND DISCUSSION
NH4-N in flood water
Ammonium concentration in the water sample was significantly influenced by
the application of different treatments have been depicted in figure A. Due to
application of PU, USG and NPK briquettes, the concentration of NH4-N in flood
water varied widely. According to figure 1, NH4+ concentration rocketed just after the
application of first split of PU and in the second day, NH4+ concentration in both CF
and AWD conditions reached at its peak. On the other hand, NH4+ concentration
remained stable in all USG and NPK briquettes treated plots (T3, T5, T6, and T7)
except T5 in CF condition and T7 in AWD condition. After fourth day the
concentration of ammonium in the all treatments became almost similar. This reveals
that the USG and NPK briquettes treated plots (T3, T4, T5, T6, 7) had much lower
concentration of ammonium in flood water.
Figure B shows the effect of USG, PU and NPK briquette on NH4+
concentration of water sample collected during 10-14 March, 2013. After two days of
N fertilizer application the highest amount of NH4+ concentration (6 ppm in CF and 8
ppm in AWD) was recorded for the treatment T2 [PU, 156 kg N ha-1
]. After second
day, the NH4+ concentration started to decrease slowly in PU treated plot and at fifth
day it was around 1-2 ppm in both CF and AWD condition. The NH4+ concentration
in T3, T4, T5, T6, and T7 remain around 1ppm for the whole time.
Figure C shows the effect of PU, USG and NPK briquettes on NH4+
concentrations in water samples collected during 1-5 April, 2013. At the second day
of N fertilizer application, the highest amount of NH4+
concentrations was produced
for the treatment T2 (PU, 156 kg N ha-1
). After that, NH4+
concentration decreased
slowly and at fifth day, the concentration in all treatments became almost similar.
The treatment T2 gave higher NH4+
concentrations compared to the plots treated with
USG (T3, T4, T5, and T6) and NPK briquettes (T7).
The results on ammonium concentration of boro rice field water demonstrate
that the PU treated plots (T2) had much higher concentration of ammonium in water
compared to the plots treated with USG (T3, T4 , T5, and T6) and NPK briquette (T7) as
shown in figure 1. The treatment T2 (PU, 156 kg N ha-1
) showed the maximum NH4-N
EFFECT OF DEEP PLACEMENT OF NITROGEN FERTILIZERS ON RICE YIELD 165
concentration followed by treatment T4 (USG, 104 kg N ha-1
). Within five days, the NH4-
N concentration in all the treatments became almost similar. The USG treated plots (T3, T4,
T5 and T6) and NPK briquette treated plots (T7) had much lower concentration of
ammonium in flood water indicating that deep placement of urea fertilizer can reduce N
loss by ammonia volatilization. Deep placement of N reduces ammonium N in
floodwater. This not only improves N use efficiency in rice but also minimizes N loss
resulting from ammonia volatilization and denitrification (Savent and Stangel, 1990;
Mohanty et al., 1999). This finding is also accorded with Xiang et al. (2013). There
were sharp decline in the amount of NH4-N; 2 to 3 days after broadcasting of PU may
be attributed to volatilization loss, diffusion of NH4-N into soil, and / or nitrification
losses.
Grain yield
The grain yield boro rice was responded significantly due to water management
and the application of PU, USG and NPK briquette (Figure 2). In AWD condition the
grain yield ranged from 3033 to 6714 kg ha-1
and in continuous flooded condition it
was varied from 3261 to 6425 kg ha-1
. In both condition, the highest grain yield was
recorded in T5 (USG 78 kg N ha-1
+ PM 3 t ha-1
) and the lowest in T1 (control). USG
with poultry manure followed by USG performed better in increasing grain yield of
rice compared to PU and NPK briquette alone. On the other hand, higher grain yield
is found with AWD condition compared to CF condition in every treatment except T1
and T7.
Straw yield
Straw yield of boro rice also responded significantly to different treatments
(Figure 3). In AWD condition, the highest straw yield (6516 kg ha-1
) was found in T5
(USG, 78 kg N ha-1
+ PM 3 t ha-1
) and the lowest value (3214 kg ha-1
) in T1 (control).
The straw yield produced by the treatment T3 was identical to T5. In case of
continuous flooded condition, the maximum straw yield (7428 kg ha-1
) was obtained
from the treatment T5 which was identical with that of treatment T2 (PU, 156 kg N ha-
1), T3 and T4 (USG, 104 kg N ha
-1). Every treatment except T3 under CF condition
gave better straw yield compared to AWD condition.
Nitrogen uptake
It was revealed from the figure 4 that the total N uptake by boro rice was
influenced significantly by the application of PU, USG and NPK briquettes under CF
and AWD condition. In CF condition, the highest total N uptake was observed in
treatment T6 (78 k g N ha-1
from USG + CD 3 t ha-1
) was statistically identical to T7
(102 kg N ha-1
as NPK briquette), T5 (78 kg N ha-1
from USG + PM 3 t ha-1
) and T3
(156 kg N as USG). In AWD condition, the maximum total N uptake was recorded in
T5 [USG, 78 kg N ha-1
+ PM 3 t ha-1
] followed by T3 [USG, 156 kg N ha-1
]. On the
other hand, treatments T2 (PU, 156 kg N ha-1
), T4 (USG, 104 kg N ha-1
) and T6 (USG,
78 kg N ha-1
+ CD 3 t ha-1
) gave statistically similar total N uptake. The results

166 M. R. Islam et al
revealed that that the total N uptake by rice grain and straw was increased
significantly with the deep placement of USG combined with organic manure in all
the treatments but T7 and T1 gave significantly higher N uptake in AWD condition
compared to CF.
Apparent N recovery
The apparent N recovery (ANR) indicates the absorption efficiency of applied
N. According to figure 5 mean apparent recovery of N by rice ranged from 36.26 to
55.79% in different treatments under AWD condition and 26.97 to 52.77% in CF.
The maximum value of ANR was obtained with the application of USG in treatment
T5 (USG, 78 kg N ha-1
+ PM 3 t ha-1
) followed by T3 (USG, 156 kg N ha-1
) under
AWD condition whereas (78 kg N as USG + CD 3 t) followed by T7 (102 kg N as
NPK briquette) gave the maximum ANR value under CF condition. The data clearly
indicate that the deep placement of USG enhanced the recovery of applied N
compared to broadcast application of NPK fertilizers.
Nitrogen use efficiency
Nitrogen use efficiency (NUE) represents the response of rice plant in terms of
grain yield to N fertilizer. NUE responded significantly due to different treatment
combinations in CF and AWD condition. The range of NUE varied from 12.86 to 28
kg grain increase per kg N applied (Figure 6) in CF condition. The maximum value
(28 kg grain increase per kg N applied) was obtained in T7 (102 kg N ha-1
from NPK
briquette) followed by T5 (25.11 kg grain increase per kg N applied), T6 (24.06 kg
grain increase per kg N applied), T4 (18.29 kg grain increase per kg N applied) and
the lowest value in T3 (156 kg N ha-1
from USG). In AWD condition, the maximum
value of NUE (29.21 kg grain increase per kg N applied) was obtained in T5 (USG,
78 kg N ha-1
+ PM 3 t ha-1
) followed by T4 (25.57 kg grain increase per kg N
applied), T6 (25.57 kg grain increase per kg N applied), T3 (23.54 kg grain increase
per kg N applied), T7 (20.82 kg grain increase per kg N applied) and the minimum
value was found in T2 (18.62 kg grain increase per kg N applied). These results
indicates that application of NPK briquettes and USG in combination with organic
manure in rice field decreases the losses of N or the rate of N, leading to efficient
uptake and utilization of applied N under AWD condition compared to CF condition.
CONCLUSION
The overall results indicate that the treatment comprising T2, T3, T4, T5
produced the higher grain yield under AWD condition. Similarly, the highest N
recovery and N use efficiency were also found in the same treatments as compared to
CF condition. This reveals that the deep placement of USG fertilizer under AWD
condition enhanced the N use efficiency. On the other hand, T6, T7 gave the
maximum grain yield, N recovery and N use efficiency under CF condition compared
to AWD condition.

EFFECT OF DEEP PLACEMENT OF NITROGEN FERTILIZERS ON RICE YIELD 167
ACKNOWLEDGEMENT
This research was partially supported by the Ministry of Science and
Technology, Government of the People’s Republic of Bangladesh.
REFERENCES
BBS, Bangladesh Bureau of Statistics. 2011. Statistical Year Book of Bangladesh. Statistical
Division, Ministry of Planning, Govt. People’s Republic Bangladesh
BBS, Bangladesh Bureau of Statistics. 2012. Monthly Statistical Bulletin of Bangladesh.
Statistics Div. Ministry of Planning, Govt. People’s Republic Bangladesh
Belder, P., Bouman, B. A. M., Cabangon, R., Guoan, L., Quilang, E. J. P., Yuanhua, L.,
Spiertz, J. H. J. and Tuong, T. P. 2004. Effect of water-saving irrigation on rice yield
and water use in typical lowland conditions in Asia. Agricultural Water Management,
65: 193-210
De Datta, S. K., Samson, M. I., Obcemea, W. N., Real, J. G. and Buresh, R. J. 1991. Direct
measurement of ammonia and denitrification fluxes from urea applied to rice. Soil
Science Society of American Journal, 55 :543-548
Gomez, K. A. and Gomez, A. A. 1984. Statistical Procedures for Agricultural Research. 2nd
Edition, John Wiley and Sons, New York. pp. 97-111
Liu, S., Qin, Y., Zou, J. and Liu, Q. 2010. Effects of water regime during rice-growing season
on annual direct N2O emission in a paddy rice-winter wheat rotation system in
southeast China. Science of the Total Environment, 408: 906-913
Nicolaisen, M. H., Risgaard-Petersen, N., Revsbech, N. P., Reichardt, W. and Ramsing, N. B.
2004. Nitrification-denitrification dynamics and community structure of NH3-oxidizing
bacteria in a high yield irrigated Philippine rice field. FEMS Microbiology Ecology.
49: 359-369
Mikkelsen, D. S., De Datta, S. K. and Obcemea, W. N. 1978. Ammonia volatilization losses
from flooded rice soils. Soil Science Society of American Journal, 42:725–730
Mohanty, S. K., Singh, U., Balasubramanian, V., Jha, K. P. 1999. Nitrogen deep placement
technologies for productivity, profitability and environmental quality of rainfed low
land rice systems. Nutrient Cycling in Agro-ecosystems, 53: 43-57
Savant, N. K. and Stangel, P. J. 1990. Deep placement of urea super granule in transplanted
rice: principles and practices. Nutrient Cycling in Agro-ecosystems, 25: 1-83
Solorzano, L. 1969. Determination of Ammonia in Natural Waters by the Phenolhypochloride
Method. Limnology and Oceanography. 14: 799-801
Ventura, W. B. and Yoshida, T. 1977. Ammonia volatilization from a flooded tropical soil.
Plant and Soil. 46: 521-531
Xiang, J., Haden, V. R., Bouman, A. M. and Zhu, D. 2013. Effect of deep placement of
nitrogen fertilizer on growth, yield and nitrogen uptake of aerobic rice. Australian
Journal of Crop Science, 7(6): 870-877

168 M. R. Islam et al
Yang, J. C., D. Huang., H, Duan., Tan, G. and Zhang, J. 2009. Alternate wetting and moderate
drying increase grain yield and reduces cadmium accumulation in rice grains. Journal
of the Science of Food and Agriculture, 89: 1728–1736
Zhang, H., Xue, Y., Wang, Z. Yang, J. and Zhang, J. 2009. Alternate wetting and moderate
soil drying improves root and shoot growth in rice. Crop Science, 49: 2246–2260
Zhu, Z. L., Wen, Q. X. and Freney, J. R. 1997. Nitrogen in Soils of China. Kluwer Academic
Publishers, Dordrecht

EFFECT OF DEEP PLACEMENT OF NITROGEN FERTILIZERS ON RICE YIELD 169
Figure 1. Ammonium concentration in floodwater after deep placement of N fertilizers under
Continuous Flooding (CF) and Alternate Wetting and Drying (AWD) Condition.
[A: First Sampling; B: Second Sampling; C: Third Sampling]
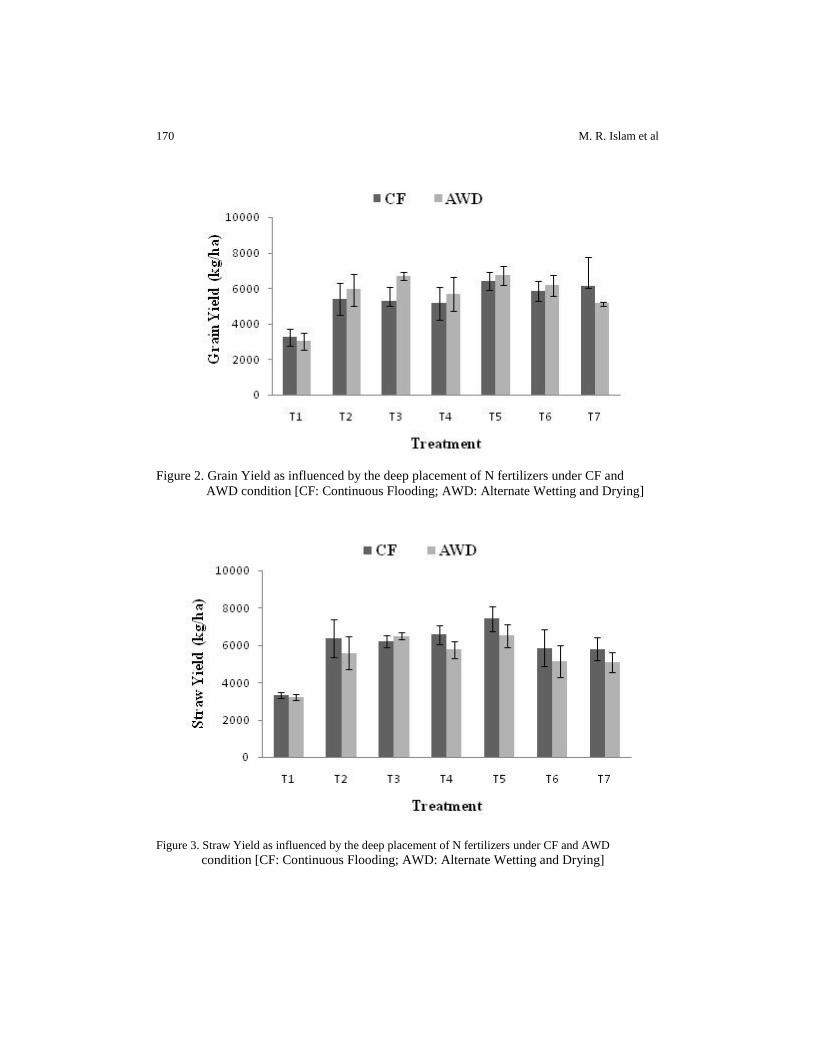
170 M. R. Islam et al
Figure 2. Grain Yield as influenced by the deep placement of N fertilizers under CF and
AWD condition [CF: Continuous Flooding; AWD: Alternate Wetting and Drying]
Figure 3. Straw Yield as influenced by the deep placement of N fertilizers under CF and AWD
condition [CF: Continuous Flooding; AWD: Alternate Wetting and Drying]

EFFECT OF DEEP PLACEMENT OF NITROGEN FERTILIZERS ON RICE YIELD 171
Figure 4. Total N Uptake as influenced by the deep placement of N fertilizers under CF and
AWD condition [CF: Continuous Flooding; AWD: Alternate Wetting and Drying]
Figure 5. Apparent Nitrogen Recovery (ANR) as influenced by the deep placement of N
fertilizers under CF and AWD condition [CF: Continuous Flooding; AWD:
Alternate Wetting and Drying]
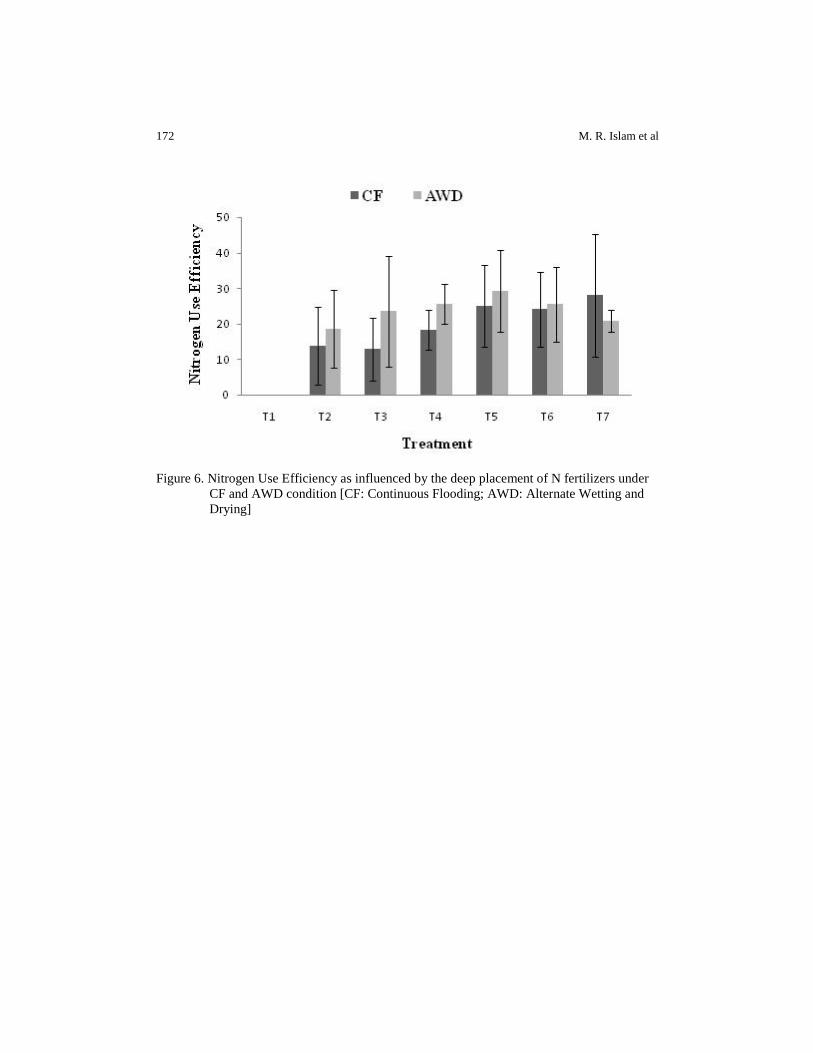
172 M. R. Islam et al
Figure 6. Nitrogen Use Efficiency as influenced by the deep placement of N fertilizers under
CF and AWD condition [CF: Continuous Flooding; AWD: Alternate Wetting and
Drying]

SAARC J. Agri., 13(2): 173-182 (2015)
SCREENING SUGARCANE SOMACLONES AND THEIR
PARENT VARIETIES AGAINST RED ROT (Colletotrichum
falcatum) AND ASSESSMENT OF VARIABILITY BY RAPD
AND SSR MARKERS
Kuasha Mahmud1*
, K. M. Nasiruddin2, M. A Hossain
3 and L. Hassan
4
Department of Biotechnology, Bangladesh Agricultural University, Mymensingh-2202
ABSTRACT
The experiment was conducted to find out red rot disease causing pathogenic reactions of somaclones (R0) and their respective parents at BSRI farm in the cropping season 2011-2012. A total number of sugarcane genotypes 24 including 4 sugarcane varieties viz. Isd 37, Isd 38, Isd 39 and also Isd 40 were inoculated to screen red rot resistant levels (R = Resistant, MR = Moderately Resistant) to susceptible levels (S = Susceptible, MS = Moderately Susceptible, HS = Highly Susceptible) after 7 months of planting. As a result, Isd 37 variety (source/parent) and its somaclones CC–37–12 and CC–37–86 were found to be resistant while 7 somaclones showed moderately resistant reaction. Furthermore, somaclones of Isd 38 variety viz. CC–38–2 as moderately resistant, CC–38–10 as moderately susceptible and also CC–11(38)–8 as susceptible reaction were recorded while Isd 38 variety showed resistant reaction. On the other hand, Isd 39 and Isd 40 source varieties with their somaclones were found as resistant reaction against red rot pathogen. Some somaclones showed different reaction from their source varieties such as moderately resistant somaclones were obtained from resistant source variety Isd 37 while somaclones CC–38–2 as moderately resistant, CC–38–10 as moderately susceptible and somaclone CC–38–8 as susceptible were obtained from resistant source variety Isd 38 against red rot pathogens respectively. Besides, some somaclones showed similar reaction from their resistant source varieties Isd 37, Isd 39 and also Isd 40. It revealed that reaction against red rot pathogen, induced somaclones showed variation with their source varieties. Red rot resistance somaclones were isolated and assessed for
* Corresponding author email: [email protected] 1 PSO, Biotechnology Division, Bangladesh Sugarcrop Research Institute, Ishurdi, Pabna 2 Prof. Dept. of Biotechnology, Bangladesh Agricultural University, Mymensingh 3 CSO, Biotechnology Division, Bangladesh Sugarcrop Research Institute, Ishurdi, Pabna 4 Prof. Dept. of Genetics & Plant Breeding, Bangladesh Agricultural University, Mymensingh
Received: 20.09.2015
174 K. Mahmud et al
the presence of variability through RAPD and SSR markers. Cluster and sub cluster formation verified the presence of variability in the red rot resistance somaclones with respect to the parent.
Keywords: Fungus, inoculation, red rot disease, resistant, sugarcane and susceptible
INTRODUCTION
Worldwide, Sugarcane (Saccharum officinarum L) is a major source of
commercial sugar along with many other value added products and by-product. Red
rot is the most destructive disease of sugarcane in Bangladesh. The genus Saccharum
contains three cultivated (Saccharum officinarum, Saccharum sinensis and
Saccharum barbari) and two wild (Saccharum robustum and Saccharum
spontanium) species (Kochhar, 1998). Somaclonal variation has been used by various
scientists to recover improved plantlets from a number of genotypes. Somaclones
may show variation for different parameters like yield, sugar recovery, disease
resistance, maturity, drought and salt tolerance. It is not controversial that tissue
culture techniques are playing their part in sugarcane improvement and at the same
time for a plant breeder assessment of genetic diversity, they are very essential in
tissue culture derived plants. Production of disease-free large number seedlings
during the planting season is laborious and time consuming. Development of more
efficient methods for large-scale production of pathogen free planting material would
contribute significantly to the overall productivity of the sugar industry. Tissue
culture offers an opportunity to mass produce disease free planting material and is
now used to supplement commercial sugarcane propagation in many countries
including Brazil, the United States, India and Cuba (Lakshmanan et al., 2006). Red
rot (Colletotrichum falcatum Went.) disease is the most dreadful disease of
Bangladesh. It causes the greatest loss to sugarcane industry. Moreover, most of the
newly released cultivars to replace the susceptible ones succumb to the pathogen
almost as soon as they become popular due to the frequent emergence of new
variants of the pathogen. Management of the disease by the use of disease-free seed
canes for planting is impractical due to the difficulty in diagnosing the dormant
infections of the fungus in seed canes under field conditions (Viswanathan &
Samiyappan, 2002). Modern sugarcane cultivars are known to have one of the most
complex genomes. Since, most traits in sugarcane are multigenic and/or multi-allelic
and are quantitatively inherited, they thus represent a particular challenge for
breeding, genetics and gene cloning purposes (Butterfield et al., 2001). Considerable
progress has been made in the mapping of the sugarcane genome and its progenitors
(Aitken et al., 2005). Somaclones and their sources varieties were screened for their
reaction to isolates of red rot pathogen to get resistant genotypes. Therefore,
screening of sugarcane genotypes against red rot pathogen is a pre-requisite in the
varietal improvement. Hence, this experiment was conducted to find out the level of
SCREENING SUGARCANE SOMACLONES AND THEIR PARENT VARIETIES 175
resistance of induced somaclones and their sources varieties against red rot pathogen
(Colletotrichum falcatum Went.).
MATERIAS AND METHODS
The leaf sheath explants were collected from 8-10 months old field grown
sugarcane from Bangladesh Sugarcrop Research Institute (BSRI) experimental field
at Ishurdi, Pabna. At first MS medium supplemented with green coconut water (10%)
containing 3 mg l-1
of 2, 4-D was prepared for callus induction. After five weeks of
explantation, the calli were inoculated for shooting on MS medium supplemented
with concentration BAP (2 mg l-1
) + Kinetin (1 mg l-1
) and maintained by sub-
culturing every two weeks and then regenerated shoots were inoculated for rooting
by sub-culturing every two weeks on MS medium supplemented with 5 mg l-1
NAA.
Callus culture derived somaclones (R0) and their parent varieties were planted at
BSRI Biotechnological experimental field on February, 2011. Isolates of
Colletortichum falcatum of different cane growing zones were used for inoculation.
The pathogen was collected from different zones and maintained in the oat meal
slant. Artificial inoculation with different isolates was done on 7-8 months old
induced somaclones along with sources varieties. Eight to ten days old sporulating
cultures of the fungus were used for inoculation. Inoculation was made with
individual as well as with mixed isolates of Colletotrichum falcatum. Ten healthy
canes of each somaclone and their sources varieties were inoculated by spore
suspension (spore conc.106 ml
-1) of red rot disease causing fungus (colletotrichum
falcatum) with the help of hypodermic syringe method. After two months of
inoculation, data on disease development in the canes were recorded. On the basis of
disease index (Table 2) the somaclones and their parents were categorized (Table 1)
as Resistant (R), Moderately Resistant (MR), Moderately Susceptible (MS),
Susceptible (S) and Highly Susceptible (HS) to this disease. Red rot inoculation
result sheets (Appendix VI) were used for screening somaclones and their parents as
Resistant (R), Moderately Resistant (MR), Moderately Susceptible (MS), Susceptible
(S) and Highly Susceptible (HS) to red rot disease. For molecular studies, young
meristem cylinder from 2 somaclones and their donor parents were taken from R0
regeneration and grinded using extraction buffer solution and amount of chemicals
were important considerations for DNA isolation. DNA was extracted from
sugarcane using the method modified and combined from the methods of Aljanabi et
al. (1999) and mini-prep method adopted from Hossain et al. (2006) and Shahnawaz
(2006). The DNA concentration was determined by Nano drop Spectrophotometer
(2000/2000c, Thermo Scientific, USA) and was diluted to a concentration of 50 ng
μl-1
. Samples were stored at -200C for further use. Polymorphism was studied using
Random Amplified Polymorphic DNA (RAPD) as illustrated by Mondal et al. (2009)
which supported by Williams et al. (1990). Six RAPD and nine SSR primers (Operon
Technologies, Inc., Alameda, California, USA) were used. The reaction mixtures 10
μl was amplified for each DNA sample in a Thermal Cycler (Genius, Techne,
176 K. Mahmud et al
Cambridge Limited). Agarose gel (1.4% and 2%, w/v) were used for RAPD and SSR
electrophoresis. The Ethidium Bromide at 10 mg ml-1
was added in gel for detection.
Bands were viewed under ultraviolet trans-illuminator and documentation
(FluorChem FC2, Cell Biosciences, USA). The presence and absence of a DNA
fragment was considered as basis of polymorphism. DNA loci if present were scored
as ‘1’ and if not were scored as ‘0’. Dendrograms were constructed by using
Uweighted Pair Group Method of Arithmetic Means (UPGMA) algorithm (Sneath
and Sokal, 1973) provided in the software (Statistica computer package 2006,
STA_CLU).
RESULTS AND DISCUSSIONS
Reaction of inoculated fungus for red rot disease on four varieties and their
somaclones are shown in table 3. Four varieties namely Isd 37, Isd 38, Isd 39, Isd 40
and their 20 somaclones were inoculated for red rot disease. As a result, Isd 37
variety (source/parent) was found to be resistant (R) while its somaclones CC–37–12
and CC–37–86 also showed resistant (R) reaction. Besides, somaclones of source
variety (parent) Isd 37 were obtained as moderately resistant (MR) reaction.
Furthermore, somaclones of Isd 38 variety viz. CC–38–2 as moderately resistant
(MR), CC–38–10 as moderately susceptible (MS) and also CC–11(38)–8 as
susceptible (S) reaction were recorded respectively, while Isd 38 variety showed
resistant reaction. On the other hand, Isd 39 and Isd 40 source varieties (parents) with
their somaclones were found as resistant reaction against red rot pathogen (Table 3).
Some somaclones showed different reaction from their source varieties (parents) for
example moderately resistant (MR) somaclones were obtained from resistant (R)
source variety Isd 37 (parent) while somaclones CC–38–2 as moderately resistant
(MR), CC–38–10 as moderately susceptible (MS) and somaclone CC–38–8 as
susceptible (S) were obtained from resistant (R) source variety Isd 38 (parent) against
red rot pathogens respectively. Besides, some somaclones showed similar reaction
from their resistant source varieties (parents) Isd 37, Isd 39 and also Isd 40. It
revealed that in case of reaction against red rot pathogen, induced somaclones
showed variation with their source varieties. Similar finding was observed by Ali et
al., 2007; Singh et al., 2008 and Jayashree et al., 2010. Red rot infected plant and
stem after two months of inoculated by red rot causing virus are shown in the plates
1.
Dendrogram for resistant and moderately resistant genotypes based on RAPD
Genetic relationship among the 2 red rot resistant sugarcane varieties and their
somaclones (red rot resistant and moderately resistant) produced some different
cluster at the linkage distance range from 21 to around 35. Dendrogram based on
linkage distance using Unweighted Pair Group Method of Arithmetic Means
(UPGMA) indicated segregation of the two red rot resistant sugarcane verities and
their somaclones into two main clusters C1 (Isd 39 red rot resistant) and C2 at linkage
SCREENING SUGARCANE SOMACLONES AND THEIR PARENT VARIETIES 177
distance of 35 (Figure 1). Cluster C2 produced sub–cluster SC1 (CC–39–5 red rot
resistant) and SC2 at the linkage distance 24.5. On the other hand, Sub–cluster SC2
produced sub–cluster SC3 (CC–38–2 moderately resistant) and SC4 (Isd 38 resistant)
at the linkage distance of 21.
Dendrogram for resistant and moderately resistant genotypes based on SSR
Genetic relationship among the 2 red rot resistant sugarcane varieties and their
somaclones (red rot resistant and moderately resistant) produced some different
cluster at the linkage distance range from 9.0 to 12.3. Dendrogram based on linkage
distance using Unweighted Pair Group Method of Arithmetic Means (UPGMA)
indicated segregation of the two red rot resistant sugarcane verities and their
somaclones into two main clusters C1 (Isd 38 red rot resistant) and C2 at linkage
distance of 12.3 (Figure 2). Cluster C2 produced sub–cluster SC1 (CC–38–2
moderately resistant) and SC2 at the linkage distance 11.5. On the other hand, Sub–
cluster SC2 produced sub–cluster SC3 (Isd 39 resistant) and SC4 (CC–39–5 resistant)
at the linkage distance of 9. Besides, somaclones and their parents showed different
types of fingerprinting in case of RAPD and SSR markers. Actually the result
indicates that the genetic variability did occur in all the phytohormone treatments and
also showed genetic variability. This similar result was reported by Khan et al.
(2009).
CONCLUSION
Some somaclones showed similar reaction from their resistant source varieties
Isd 37, Isd 39 and also Isd 40. Besides, it is possible to get variation using tissue
culture technique containing 2, 4-D with MS media. It revealed that in case of
reaction against red rot pathogen, induced somaclones showed variation with their
source varieties. Cluster and sub cluster formation using results of RAPD and SSR
markers verified the presence of variability in the red rot resistance somaclones with
respect to the parent.
REFERENCES
Ali, A., Naz, S., Siddiqui, F. A. and Iqbal, J. 2008. Rapid clonal multiplication of sugarcane
(Saccharum officinarum) through callogenesis and organogenesis. Pakistan Journal
Botany, 40(1): 123–138
Aljanabi, S. M., Forget, L. and Dookun, A. 1999. An improved rapid protocol for the isolation
of polysaccharide and polyphenol–free sugarcane DNA. Plant Molecular Biology
Reporter, 17: 1–8
Aitken, K. S., Jackson, P. A. and Mclntyre, C. L. 2005. A combination of AFLP and SSR
markers provides extensive map coverage and identification of homo(eo)logous
linkage groups in a sugarcane cultivar. Theoretical and Applied Genetics, 110: 789-801
178 K. Mahmud et al
Butterfield, M. K., D’Hont, A. and Berding, N. 2001. The sugarcane genome: a synthesis of
current understanding and lessons for breeding and biotechnology. Proceeding of South
African Sugarcane Technology Association, 75: 1-5
Hossain, M. A., Shaik, M. M., Shahnawaz, R. M. S., Islam, N. and Miah, M. A. S. 2006. Quality
DNA isolation using different methods of sugarcane (Saccharum officinarum L.).
Bangladesh Journal of Sugarcane, 28: 65–69
Jayashree, J., Selvi, A. and Nair, N. V. 2010. Characterization of resistance gene analog
polymorphisms in sugarcane cultivars with varying levels of red rot resistance. Electronic
Journal Plant Breeding, 1(4): 1191–1199
Kochhar, S. L. 1998. Economic Botany in the tropics. Second Edition Macmillan. India Ltd.,
pp. 1-476
Khan, I. A., Dahot, M. U., Seema, N., Yasmin, S., Bibi, S., Raza, G., Khatri, A. and Naqvi, M. H.
2009. Direct regeneration of sugarcane plantlets: A tool to unravel genetic heterogeneity.
Pakistan Journal of Botany, 41(2): 797–814
Lakshmanan, P., Geijskes, R. J., Wang, L., Elliott, A., Grof, C. P. L., Berding, N. and Smith,
G. R. 2006. Development and hormonal regulation of direct shoot organogenesis and
somatic embryogenesis in sugarcane (Saccharum spp. Interspecific hybrids) leaf
culture. Plant Cell Reports, 25: 1007-1015
Mondal, S., Sutar, S. R. and Badigannavar, A. M. 2009. Assesssment of genetic diversity in
cultivated groundnut (Arachis hypogaea L) with differential responses to rust and late spot
using ISSR markers. Journal of Genetics and Plant Breeding, 63(3): 219–224
Shahnawaz, R. M. S. 2006. DNA isolation, quantification and fingerprinting using RAPD
markers of sugarcane (Saccharum officinarum L.). A thesis of Master’s of Science (M.
Sc) in Biotechnology and Genetic Engineering Dept., Islamic University, Kushtia,
Bangladesh
Singh, G., Sandhu, S. K., Meeta, M., Singh, K., Gill, R. and Gosal, S. S. 2008. In vitro induction
and characterization of somaclonal variation for red rot and other agronomic traits in
sugarcane. Euphytica, 160(1): 35–47
Sneah, P. H. A. and Sokal, R. R. 1973. Numerical taxonomy. W.H., Freeman and Co., San
Francisco, CA. pp. 21–28
Viswanathan, R. and Samiyappan, R. 2002. Induced systemic resistance by fluorescent
pseudomonads against red rot disease of sugarcane caused by Colletotrichum falcatum.
Crop Protection, 21: 1-10
Williams, J. G. K., Kubelik, A. R., Livak, K. J., Rafalski, J. A. and Tingey, S. V. 1990. DNA
polymorphisms amplified by arbitrary primers are useful as genetic markers. Nucleic Acids
Research, 18: 6531–6535

SCREENING SUGARCANE SOMACLONES AND THEIR PARENT VARIETIES 179
Table 1. Criteria for determination of diseases index for screening sugarcane
somaclones and their sources varieties
Sl. No. Criteria/Characters Numerical rating/score
1 Lesions width above the inoculated internode (0-3)
a) Vary rare lesion or no lesion developed 0
b) Rare lesion (1/3rd
or less spread full width) 1
c) Medium lesion (1/3rd
to 2/3rd
spread of full width) 2
d) High lesion (covered the full width) 3
2 Nodal transgression (0-3)
a) Lesion restricted in the inoculated internode 0
b) One node crossed 1
c) Two nodes crossed 2
d) Tree or more nodes crossed 3
3 Presence of white patches (0-2)
a) White patch absent 0
b) White patch restricted 1
c) white patch progressive 2
4 Condition of top (0-1)
a) Green 0
b) Yellow/dry 1
Table 2. Disease index of Red rot
Disease Index Disease reaction
0–2.0 R
2.1–4.0 MR
4.1–6.0 MS
6.1–8.0 S
8.1–above HS
Note: R= Resistant, MR= Moderately Resistant, MS= Moderately Susceptible
S= Susceptible and HS= Highly Susceptible
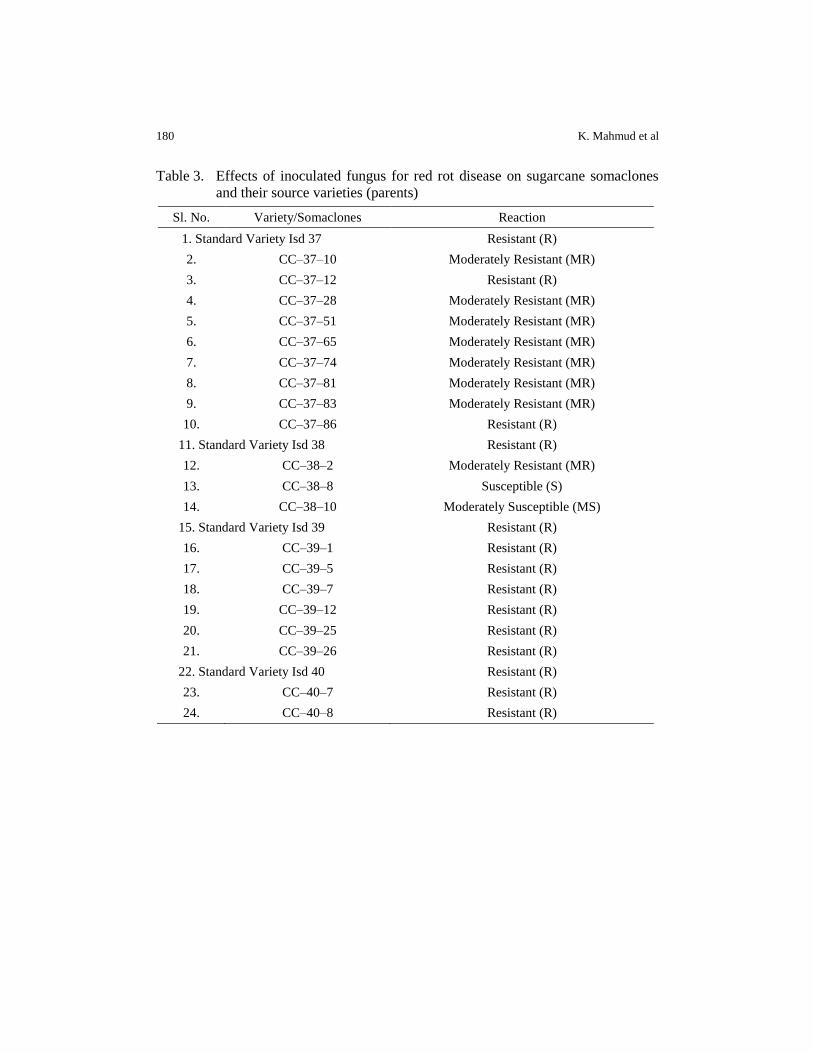
180 K. Mahmud et al
Table 3. Effects of inoculated fungus for red rot disease on sugarcane somaclones
and their source varieties (parents)
Sl. No. Variety/Somaclones Reaction
1. Standard Variety Isd 37 Resistant (R)
2. CC–37–10 Moderately Resistant (MR)
3. CC–37–12 Resistant (R)
4. CC–37–28 Moderately Resistant (MR)
5. CC–37–51 Moderately Resistant (MR)
6. CC–37–65 Moderately Resistant (MR)
7. CC–37–74 Moderately Resistant (MR)
8. CC–37–81 Moderately Resistant (MR)
9. CC–37–83 Moderately Resistant (MR)
10. CC–37–86 Resistant (R)
11. Standard Variety Isd 38 Resistant (R)
12. CC–38–2 Moderately Resistant (MR)
13. CC–38–8 Susceptible (S)
14. CC–38–10 Moderately Susceptible (MS)
15. Standard Variety Isd 39 Resistant (R)
16. CC–39–1 Resistant (R)
17. CC–39–5 Resistant (R)
18. CC–39–7 Resistant (R)
19. CC–39–12 Resistant (R)
20. CC–39–25 Resistant (R)
21. CC–39–26 Resistant (R)
22. Standard Variety Isd 40 Resistant (R)
23. CC–40–7 Resistant (R)
24. CC–40–8 Resistant (R)

SCREENING SUGARCANE SOMACLONES AND THEIR PARENT VARIETIES 181
Tree Diagram for 2 Varieties and Their 2 Somaclones Based on 6 RAPD Markers
Unw eighted pair-group average
Squared Euclidean distances
Linkage Distance
ISD_39
CC_39_5
CC_38_2
ISD_38
18 20 22 24 26 28 30 32 34 36
C1
C2
SC1
SC2
SC3
SC4
Plate 1. Somaclones showing A) Red rot resistance and B) Red rot susceptibility
Figure 1. Cluster analysis by Unweighted Pair Group Method of Arithmetic means (UPGMA)
of 2 sugarcane varieties and their 2 somaclones based on 6 RAPD
A B
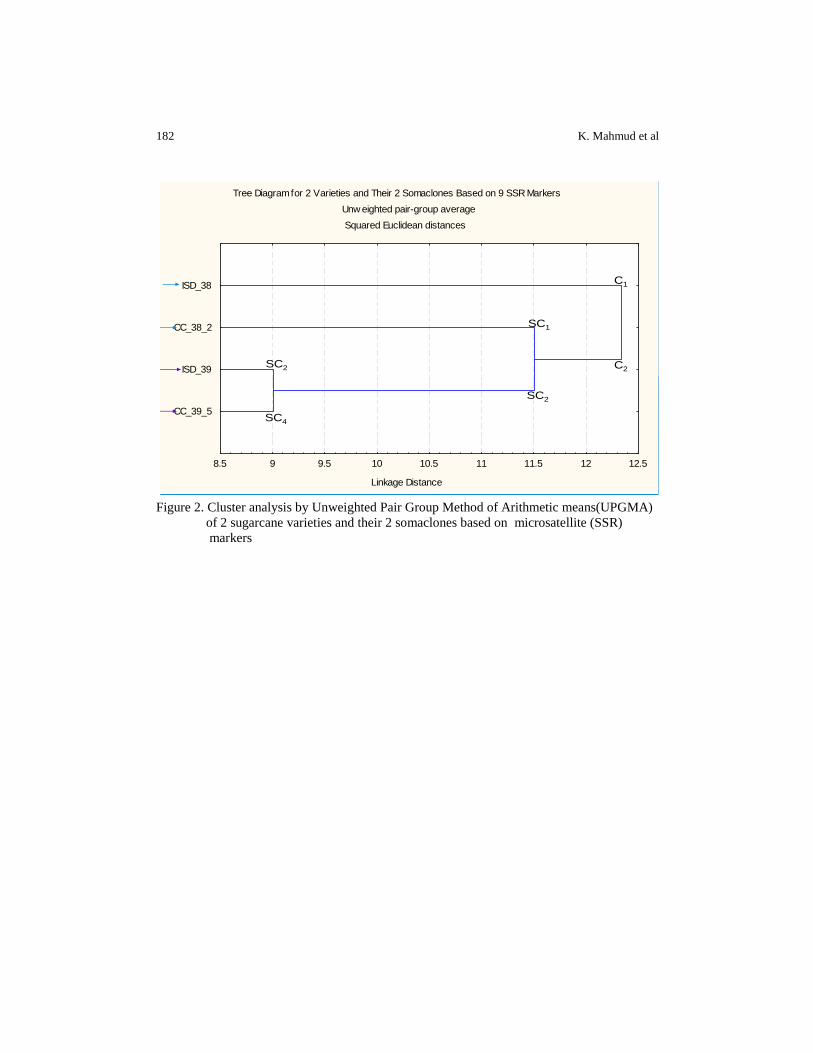
182 K. Mahmud et al
Tree Diagram for 2 Varieties and Their 2 Somaclones Based on 9 SSR Markers
Unw eighted pair-group average
Squared Euclidean distances
Linkage Distance
CC_39_5
ISD_39
CC_38_2
ISD_38
8.5 9 9.5 10 10.5 11 11.5 12 12.5
C1
C2
SC1
SC2
SC2
SC4
Figure 2. Cluster analysis by Unweighted Pair Group Method of Arithmetic means(UPGMA)
of 2 sugarcane varieties and their 2 somaclones based on microsatellite (SSR)
markers
SAARC J. Agri., 13(2): 183-197 (2015)
SOIL FERTILITY AND PRODUCTIVITY OF SUGARCANE
INFLUENCED BY ENRICHED PRESSMUD COMPOST
WITH CHEMICAL FERTILIZERS
S. M. Bokhtiar*1
, S. Roksana2 and A. Z. M. Moslehuddin
2
Bangladesh Sugarcrop Research Institute, Ishurdi, Pabna, Bangladesh
ABSTRACT
A field experiment was conducted at Bangladesh Sugarcrop Research Institute, Ishurdi, Pabna, Bangladesh to examine the effects of enriched compost with chemical fertilizers on soil fertility and productivity of sugarcane. The experiment was laid out in Randomized Complete Block Design (RCBD) with 16 treatments comprising four levels of inorganic fertilizers (100%, 75%, 50% and 0%) and four levels of pressmud (enriched by Trichoderma harzianum @ 7.5 t ha
-1, T. viride @ 7.5 t ha
-1,
untreated raw pressmud @ 10 t ha-1
and control). It was observed that germination (90.34%), total chlorophyll content (2.58 mg g
-1), leaf area
index (5.00), dry matter (3.41 kg m-2
), tiller (137.94 × 000 ha-1
), millable cane stalk (99.15 × 000 ha
-1) and yield (111.32 t ha
-1) were found
maximum in 100% recommended fertilizer (N150 P50 K90 S35 and Zn4 kg ha
-1) with enriched pressmud which was statistically identical in
comparison with 75% and 50% of recommended chemical fertilizers with enriched pressmud. The N (1.47%), K (1.24%) and S (0.17%) contents of leaf tissues were slightly increased with chemical fertilizers + enriched pressmud compared to chemical fertilizer alone. Soil Organic C, total N, P, K and S were higher with pressmud application compared to non pressmud application. Microbial enrichment of pressmud with Trichoderma sp. could save 2.5 t ha
-1 of pressmud and 25% of
recommended fertilizers. It can be concluded that enriched pressmud is more effective than raw pressmud in increasing sugarcane yield and maintain soil fertility in High Ganges River Floodplain soils.
Keywords: Enriched pressmud, Trichoderma sp., fertility, productivity,
sugarcane
* Corresponding author email: [email protected] 1 Natural Resources Management Division, Bangladesh Agricultural Research Council, Dhaka 1215 2 Soil Science Department, Bangladesh Agricultural University, Mymensingh- 2202, Bangladesh
Received: 28.09.2015
184 S. M. Bokhtiar et al
INTRODUCTION
In Bangladesh, sugarcane (Saccharum officinarum L.) is cultivated in 0.12
million hectares with an average cane yield of 41 t ha-1
(BBS, 2011). The
productivity is much lower compared to average productivity of world 71.5 t ha-1
(FAOSTAT, 2009). Despite a favourable land, soil type and agro-climatic condition,
per hectare yield of sugarcrop in Bangladesh is very low. This low yield and recovery
of sugar is mainly due to management factors at the production level. Most soils in
Bangladesh are low in organic matter (OM) generally containing 1.5% OM, while 2.5
to 3.0% OM is necessary for sustainable crop production. Because of its large
biomass yield and long growth period, sugarcane requires a considerable amount of
plant nutrients for its vegetative growth and development. Due to significant
depletion of soil nutrients, sugarcane soils become less fertile and fail to produce
higher yield. Hence, nutrient replenishment through the addition of fertilizer and
manures in the soil is indispensable for achieving sustainable cane production.
Results indicate addition of organic matter increases organic carbon, aggregate
stability, moisture retention capacity and infiltration rate of the surface soil while
reducing bulk density (Sarker et al., 2003). This valuable component of soils in
Bangladesh is likely to be declined with time due to poor attention for its
improvement and maintenance.
Integrated use of chemical and organic fertilizers are found to be more
beneficial for sustainable sugarcane production. The combined use of organic and
inorganic fertilizer gave significantly higher sugarcane yield and economic benefit
(Paul et al., 2007). Pressmud is one such source of organic matter produced as
industrial waste which can be profitably utilized for sugarcane production. Pressmud
is a good source of organic matter, NPK and important micronutrients and has
established its importance in improving fertility, productivity and other physical
properties of agricultural soils (Rangaraj et al., 2007; Kumar and Verma, 2002).
Moisture content of fresh pressmud is around 60% and oven dried pressmud
contained 20% Organic C, 2.35% total N, 0.13% available P, 0.54% exchangeable K,
0.56% available S, 6.64% Ca, 0.46% Mg, 128 ppm Cu, 6300 ppm Fe, 308 ppm Mn
and 883 ppm Zn (Bokhtiar and Sakurai, 2007). Like other organic manures, pressmud
has great potential to supply nutrients in addition to its favorable effects on physico-
chemical and biological properties of soil. Bokhtiar et al., 2007 observed 25%
reduction of fertilizer application was possible with the use of FYM or pressmud @
15 t ha-1.
The production of pressmud amounts to about 3 percent of cane crashed in
the sugar factory. Being an excellent source of nutrients adds organic matter;
pressmud addition leads to better nitrogen nutrition and promotes cation exchange
capacity. By virtue of the chemical composition and high content of organic carbon,
the usefulness of pressmud as a valuable organic manure has been reported by several
workers (Nehra and Hooda, 2002; Jamil et al., 2008; Ramaswamy, 1999). However,
these studies did not include enriched pressmud combined with chemical fertilizers.
Hence, a study was conducted to evaluate pressmud enrichment with Trichoderma
PRODUCTIVITY OF SUGARCANE INFLUENCED BY ENRICHED PRESSMUD COMPOST 185
sp. and chemical fertilizers on sugarcane for improving the soil fertility and
productivity.
MATERIALS AND METHODS
Experimental site and soil characteristics
The experiment was conducted at the experimental farm of the
Bangladesh Sugarcrop Research Institute, Ishurdi, Pabna during January 2011 to
January 2012. The experimental site represents the High Ganges River Flood
Plain soils under the Agro-ecological Zone 11. The soil belongs to Sara series. The
soil was loamy in texture having pH 7.62, organic C 0.46%, total N 0.060%,
available phosphorus 15.0 ppm, exchangeable potassium 0.18 meq /100g soil,
available sulphur 24.0 ppm and available zinc 0.64 ppm.
Treatments and experimental design
Sixteen treatments having Four levels of inorganic fertilizers (100%, 75%,
50% and 0% of recommended fertilizer dose) and four levels of pressmud enrichment
(Trichoderma harzianum @ 7.5 t ha-1
, T. viride @ 7.5 t ha-1
, untreated raw pressmud
@ 10 t ha-1
and no pressmud) were laid out in Randomized Complete Block Design
(RCBD) with three replications. The treatment details are given in table 1. The unit plot-
size was 6m × 6m. Recommended rates of inorganic fertilizers (urea, triple super
phosphate, muriate of potash, gypsum and zinc sulphate) and pressmud were used.
Two microorganisms (Trichoderma harzianum and Trichoderma viride) were used
for enrichment of pressmud.
Preparation of enriched pressmud
Pressmud was composted by spreading in layers of 15 cm thickness inter
mixed with microbial inoculants Trichoderma harzianum and T. viride. One litre of
Trichoderma bio-agent was mixed with 20 litre of water for making 2 tons of
pressmud. The material was heaped to a height of 3 feet and pulverized at an interval
of 15 days. The entire lot was left for 40 days for decomposition. Sufficient moisture
level was maintained by periodically sprinkling water over the heap. Untreated heap
served as control. After 40 days, the samples were collected for analysis.

186 S. M. Bokhtiar et al
Table 1. Details of treatments evaluated on sugarcane
Treatments Inorganic source Organic source pressmud
T1 : RFD + Pm.Th7.5 150-50-90-34-3.5 NPKSZn kg ha-1
(100% recommended fertilizer)
Enriched Pressmud by
Trichoderma harzianum 7.5 t ha-
1
T2 : RFD + Pm.Tv7.5 150-50-90-34-3.5 NPKS kg ha-1
Enriched Pressmud by
Trichoderma viride 7.5 t ha-1
T3 : RFD + Pm.R10 150-50-90-34-3.5 NPKS kg ha-1
Raw pressmud 10 t ha-1
T4 : RFD 150-50-90-34-3.5 NPKS kg ha-1
0
T5 : 0.75RFD +
Pm.Th7.5
112-37-68-26-2.6 NPKS kg ha-1
(75% recommended fertilizer)
Enriched Pressmud by
Trichoderma harzianum 7.5 t ha-
1
T6: 0.75RFD +
Pm.Tv7.5
112-37-68-26-2.6 NPKS kg ha-1
Enriched Pressmud by
Trichoderma viride 7.5 t ha-1
T7 : 0.75RFD +
Pm.R10
112-37-68-26-2.6 NPKS kg ha-1
Raw pressmud 10 t ha-1
T8 : 0.75RFD 112-37-68-26-2.6 NPKS kg ha-1
0
T9 : 0.5RFD +
Pm.Th7.5
75-25-45-17-1.8 NPKSZn kg ha-1
(50% recommended fertilizer)
Enriched Pressmud by
Trichoderma harzianum 7.5 t ha-
1
T10: 0.5RFD +
Pm.Tv7.5
75-25-45-17-1.8 NPKSZn kg ha-1
Enriched Pressmud by
Trichoderma viride 7.5 t ha-1
T11: 0.5RFD + Pm.R10 75-25-45-17-1.8 NPKSZn kg ha-1
Raw pressmud 10 t ha-1
T12 : 0.5RFD 75-25-45-17-1.8 NPKSZn kg ha-1
0
T13: 0.0RFD +
Pm.Th7.5
0 Enriched Pressmud by
Trichoderma harzianum 7.5 t ha-
1
T14: 0.0RFD +
Pm.Tv7.5
0 Enriched Pressmud by
Trichoderma viride 7.5 t ha-1
T15: 0.0RFD + Pm.R10 0 Raw pressmud 10 t ha-1
T16 : 0.0RFD + Pm.0.0 0 0
Notes: RFD = Recommended Fertilizer dose for sugarcane (150-50-90-34-3.5 NPKSZn kg ha-1);
Pm.Th7.5 = Enriched Pressmud by Trichoderma harzianum 7.5 t ha-1; Pm.Tv7.5= Enriched Pressmud
by Trichoderma viride 7.5 t ha-1; Pm.R10 = Raw Pressmud 10 t ha-1.

PRODUCTIVITY OF SUGARCANE INFLUENCED BY ENRICHED PRESSMUD COMPOST 187
Fertilizer application
Treatment wise fertilizers were applied as per recommended urea, triple
supper phosphate, muriate of potash, gypsum and zinc sulphate @ 150, 50, 90, 34
and 3.4 kg ha-1
, respectively. Full dose of triple supper phosphate, gypsum, zinc
sulphate and 1/3rd of muriate of potash and urea were applied in trenches and mixed
with soil prior to planting of setts as basal. The rest amount of urea and muriate of
potash were applied as top dressing in two equal splits at 120 and 180 days after
planting (DAP). After each application, fertilizers were incorporated into the soil by
spade. Full amount of pressmud was applied in furrows during final land preparation
before sett placement
Planting technique, cultural practices and data collection
Following conventional method, three budded setts (variety Isd 37) were
planted end to end in furrows. Each plot contains six lines of 6.0 m long. Twenty six
setts were placed in each line. Prior to planting regent 3GR was applied in the trenches
@ 33 kg ha-1 to control termite and Furadan 5G was applied as a preventive measure
against borers in two times at 90 and 150 DAP at 40 kg ha-1
for each time. Apart
from chemical, cultural and mechanical control measures were done for insect-pests
and disease management as and when required. In the main field, flood irrigation was
given in trenches just after planting of the setts. Also supplementary irrigation was
done during the dry period depending on the crop growth and whenever required.
The soil in the trenches was loosened twice at 30 and 60 DAP to free the plants from
soil compaction. All the plots were kept weed free up to 140 days after plantation, as
the period is considered to be the critical period for crop-weed competition for
sugarcane. Earthing-up around cane plant and propping of sugarcane were done at
150 days after planting to protect the cane stalks from lodging against the possibility
of strong wind.
Soil and plant analyses
Soil textural class was determined by hydrometer method and soil pH was
measured in a 1:2.5 soil water suspension by glass electrode pH meter. Total N was
determined by macro Kjeldahl procedure and organic carbon by the Walkley and
Black method. Available soil P was extracted with 0.5M NaHCO3 and the amount
was determined by spectrophotometry. Exchangeable K (1N NH4OAc extractable)
was determined by flame photometry and available S by turbidimetric method
(Black, 1965) for soil and plant leaf. Elements like Ca, Mg, Cu, Zn, Mn and Fe were
performed using an atomic absorption spectrometry (Shimadzu AA-6300) following
Petersen (2002). The chlorophyll contents of cane leaf were determined at grand
growth phase i.e., 220 DAP. Midribs were removed from the leaf blade. For
extraction in 80% ethanol, small pieces of green leaves were stored in darkness at
room temperature and humidity until extracts were completed. All extracts were
assayed for absorbance at 663 and 645 nm to measure chlorophyll a (Chl a) and
chlorophyll b (Chl b) content (mg g−1
fresh weight) respectively after using the

188 S. M. Bokhtiar et al
formula of Arnon (1949). Leaf area index and total dry matter production were
calculated following the method given by Shimabuku et al. (1980). Sugarcane was
harvested at maturity stage after 12 month of planting.
Statistical analysis
The collected data were statistically analyzed using the "Analysis of
variance" (ANOVA) technique and the significance of mean differences were
adjusted by the Duncan's New Multiple Range Test (DMRT) (Gomez and Gomez,
1984) with the help of MSTAT-C programme.
RESULTS AND DISCUSSION
Nutrient composition of enriched and raw pressmud
Enriched pressmud after 40 days of Trichoderma sp. incorporation and raw
pressmud were analyzed for different nutritional status and the data is presented in
table 2. Enrichment of pressmud by microorganisms exerted beneficial effect for
some elements. The amount of nitrogen, phosphorus, potassium and sulphur were
higher in T. harzianum enriched pressmud than T. viride enriched pressmud or raw
pressmud. However phosphorus, potassium and sulphur contents were higher in T.
viride enriched pressmud than raw pressmud. The organic matter content and other
elements were almost same as raw pressmud or enriched pressmud by Trichoderma
sp.
Germination and yield parameters of sugarcane
There was significant effect of the different treatments on germination
percentage of sugarcane (Table 3). However, the variation among the treatments
was not wide. The treatment T1 with enriched pressmud by Trichoderma
harzianum @ 7.5 t ha-1
along with 100% recommended fertilizer (RFD)
produced the highest germination of sugarcane (90.34 %) which was statistically
similar with T2 to T11 except T8. The lowest germination (68.05 %) was
recorded in T15 treatment which was statistically on par with T1 and T7. There
was significant difference in tillering of sugarcane at 150 days after planting due to
different treatments (Table 3). The treatment T1 having enriched pressmud by
Trichoderma harzianum @ 7.5 t ha-1
plus 100% RFD produced significantly higher
number of tillers (139.10 × 10³ ha
-1 ) and it was statistically on par with T2 to T11
except T8, and T14. The T16 (control) produced significantly lower number of tillers
(102.9 × 10³ ha
-1) than any other treatments. However, it was statistically similar to
T12, T13 and T15. The application of enriched pressmud by two microorganisms along
with inorganic fertilizer had some beneficial effects on cane length and the effect was
also statistically significant. The treatment T2 with enriched pressmud by T. viride at
7.5 t ha-1
plus 100% RFD produced the tallest cane (3.897m). The treatment T15
produced the lowest cane length which was statistically on par with other treatments
except T2, T9 and T10. Results of different treatments on cane girth was significant but
PRODUCTIVITY OF SUGARCANE INFLUENCED BY ENRICHED PRESSMUD COMPOST 189
variation was not much. The cane girth varied from 1.80 cm in T16 treatment to 2.08
cm in T9 treatment. The treatment T9 produced the highest cane girth (2.08 cm) was
statistically onpar to all other treatments. The findings confirms with the results of
Shahid et al. (2011). There was no significant effect of different treatments on
millable cane production of sugarcane.
Cane yield
There was a significant effect of different treatments of using chemical
fertilizer and pressmud on sugarcane yield (Table 3). The cane yield ranged from
59.06 t ha-1
in T16 (control) to 111.9 t ha-1
in T3 treatment. The treatment T3
having raw pressmud 10 t ha-1
plus 100% RFD produced the highest cane yield
which was statistically on par with T1, T2, T6 and T12. Application of 100% RFD
alone (T4) gave less cane yield than 100% RFD with enriched pressmud by
microorganisms or raw pressmud (T1 to T3 which were statistically similar to each
other). The T3 treatment having 100% RFD plus raw pressmud @ 10 t ha-1
produced
higher but statistically similar yield with T1 and T2 where enriched pressmud @ 7.5 t
ha-1
with same amount of inorganic fertilizer was used. Thus it is clear that, with
enrichment of pressmud by using Trichoderma sp. use of pressmud could be reduced
by 2.5 t ha-1
in sugarcane. The increased amount of N, P, K and S contents in
enriched pressmud could be the reason behind the need of its less amount over raw
pressmud. Again, 75% RFD plus enriched pressmud by T. viride (T6) produced
higher cane yields (100.7 tha-1
) than with the pressmud enriched by T. harzianum or
with raw pressmud (T5 and T7 : 97.67 and 97.39 t ha-1
, respectively) or even 75%
RFD alone (T8) without any pressmud. Although, all cane yields from T5 to T8 were
statistically similar to each other, the value of T6 was similar to the T1 to T3, where
100% RFD was used with pressmud. Thus, it could save 25% of inorganic fertilizer.
The result obtained with the T12, seems to be unusually high, which might be
contributed by a higher level of soil fertility of the soil. Again, pressmud enriched
with T. harzianum @ 7.5 t ha-1
without any chemical fertilizer (T13) produced higher
yield than enriched pressmud by T. viride (T14) or raw pressmud (T15). Shankaraiah
and Murthy (2005) also observed similar findings and reported that the addition of
enriched pressmud cake @10 t ha-1
saved fertilizer NPK by 50% which was
comparable with raw pressmud at 15 t ha-1
. However, it is clear that the combined
application of enriched pressmud or raw pressmud with chemical fertilizers improved
the cane yield and the effect was more pronounced at higher fertilizer level (100%
RFD). Application of enriched pressmud or raw pressmud with 50% RFD or 75%
RFD recorded yields at par with 100% RFD as chemical fertilizers alone,
respectively. The present findings corroborates with findings of Rakkiyappan et al.
(2001).
Total chlorophyll content, dry matter and leaf area index
There was a significant effect of different treatments of using chemical
fertilizer and pressmud on chlorophyll content (Table 4). The chlorophyll content
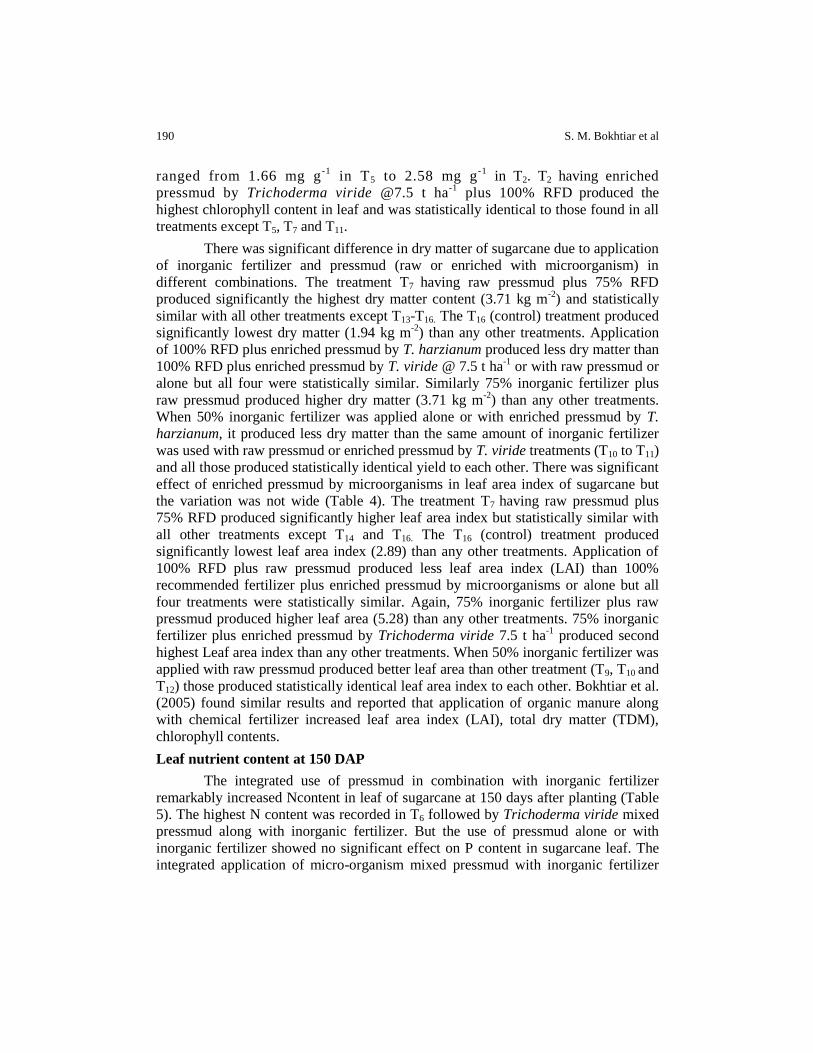
190 S. M. Bokhtiar et al
ranged from 1.66 mg g-1
in T5 to 2.58 mg g-1
in T2. T2 having enriched
pressmud by Trichoderma viride @7.5 t ha-1
plus 100% RFD produced the
highest chlorophyll content in leaf and was statistically identical to those found in all
treatments except T5, T7 and T11.
There was significant difference in dry matter of sugarcane due to application
of inorganic fertilizer and pressmud (raw or enriched with microorganism) in
different combinations. The treatment T7 having raw pressmud plus 75% RFD
produced significantly the highest dry matter content (3.71 kg m-2
) and statistically
similar with all other treatments except T13-T16. The T16 (control) treatment produced
significantly lowest dry matter (1.94 kg m-2
) than any other treatments. Application
of 100% RFD plus enriched pressmud by T. harzianum produced less dry matter than
100% RFD plus enriched pressmud by T. viride @ 7.5 t ha-1
or with raw pressmud or
alone but all four were statistically similar. Similarly 75% inorganic fertilizer plus
raw pressmud produced higher dry matter (3.71 kg m-2
) than any other treatments.
When 50% inorganic fertilizer was applied alone or with enriched pressmud by T.
harzianum, it produced less dry matter than the same amount of inorganic fertilizer
was used with raw pressmud or enriched pressmud by T. viride treatments (T10 to T11)
and all those produced statistically identical yield to each other. There was significant
effect of enriched pressmud by microorganisms in leaf area index of sugarcane but
the variation was not wide (Table 4). The treatment T7 having raw pressmud plus
75% RFD produced significantly higher leaf area index but statistically similar with
all other treatments except T14 and T16. The T16 (control) treatment produced
significantly lowest leaf area index (2.89) than any other treatments. Application of
100% RFD plus raw pressmud produced less leaf area index (LAI) than 100%
recommended fertilizer plus enriched pressmud by microorganisms or alone but all
four treatments were statistically similar. Again, 75% inorganic fertilizer plus raw
pressmud produced higher leaf area (5.28) than any other treatments. 75% inorganic
fertilizer plus enriched pressmud by Trichoderma viride 7.5 t ha-1
produced second
highest Leaf area index than any other treatments. When 50% inorganic fertilizer was
applied with raw pressmud produced better leaf area than other treatment (T9, T10 and
T12) those produced statistically identical leaf area index to each other. Bokhtiar et al.
(2005) found similar results and reported that application of organic manure along
with chemical fertilizer increased leaf area index (LAI), total dry matter (TDM),
chlorophyll contents.
Leaf nutrient content at 150 DAP
The integrated use of pressmud in combination with inorganic fertilizer
remarkably increased Ncontent in leaf of sugarcane at 150 days after planting (Table
5). The highest N content was recorded in T6 followed by Trichoderma viride mixed
pressmud along with inorganic fertilizer. But the use of pressmud alone or with
inorganic fertilizer showed no significant effect on P content in sugarcane leaf. The
integrated application of micro-organism mixed pressmud with inorganic fertilizer
PRODUCTIVITY OF SUGARCANE INFLUENCED BY ENRICHED PRESSMUD COMPOST 191
produced higher K content in leaf. The use of pressmud along with inorganic
fertilizer showed higher S content and comparatively better Zncontent in leaves of
sugarcane. Bokhtiar et al. (2001) obtained similar results from their studies.
Soil fertility
Use of micro-organism mixed pressmud alone or in combination with
inorganic fertilizer remarkably increased soil carbon, total N, available P, S and Zn
and exchangeable K (Table 6). The results in the present study revealed that organic
carbon, total N, available P, exchangeable K, available S and Zn were built up in soils
with microorganism mixed pressmud combined with inorganic fertilizers in sugarcane
compared to control plots. The findings were in line with the results obtained by
Venkatakrishnan et al. (2007).
CONCLUSION
It was observed that soil organic C, total N, P, K and S were higher with
pressmud application compared to non pressmud application. Microbial enrichment
of pressmud with Trichoderma sp. could save 2.5 t ha-1
of pressmud and 25% of
recommended fertilizers. It can be concluded that enriched pressmud is more
effective than raw pressmud in increasing sugarcane yield and maintain soil fertility
in High Ganges River Floodplain soils.
ACKNOWLEDGEMENT
The author is pleased to extend gratefulness to the Ministry of Science and
Information & Communication Technology, Government of the People’s Republic of
Bangladesh for financial support for the research work.
REFERENCES
Arnon, D. I. 1949. Copper enzymes in isolated chloroplast polyphenoloxidase in Beta
vulgaris. Plant Physiology, 24: 1–15
BBS, Bangladesh Bureau of Statistics. 2011. Yearbook of Agricultural Statistics of
Bangladesh. Bangladesh Bureau of Statistics. Statistics and Informatics Division,
Ministry of Planning. Government of the peoples’ Republic of Bangladesh. pp.112
Black, C. A. 1965. Methods of soil analysis. Part 2: Chemical and microbiological properties.
Agronomy series No.9, Madison Wisconsin, USA. American Society of Agronomy
and American Society for Testing and Materials
Bokhtiar, S. M. and Sakurai, K. 2007. Effects of integrated nutrient management on plant
crop and successive first and second ratoon crops of sugarcane in Bangladesh. Journal
of Plant Nutrition, 30: 135–147
Bokhtiar, S. M. and Sakurai, K. 2005. Integrated use of organic manure and chemical
fertilizer on growth, yield, and quality of sugarcane in High Ganges River Floodplain
soils of Bangladesh. Communications in Soil Science and Plant Analysis, 36(13/14):
1823-1837

192 S. M. Bokhtiar et al
Bokhtiar, S. M., Islam, M. J. and Chowdhury, S. N. A. 2000. Effect of pressmud along with
inorganic fertilizers on sugarcane yield and fertility status of soil. Bangladesh Journal
of Training and Development, 13(1/2): 175-180
Bokhtiar, S. M., Paul, G. C., Rashid, M. A. and Rahman, A. B. M. M. 2001. Effect of press
mud and inorganic fertilizer on soil fertility and yield of sugarcane grown in High
Ganges River Floodplain soils of Bangladesh. Indian Sugar, LI (IV): 235-241
FAOSTAT. 2009. Food and Agricultural Organization of the United Nations: Economic and
Social Department: The Statistical Division. pp.567
Gomez, K. A. and Gomez, A. A. 1984. Statistical Procedure for Agricultural Research. John
Willey and Sons. New York, Brisbane. Singapore. pp. 139-240
Jamil, M., Qasim, M. and Zia, M. S. 2008. Utilization of pressmud as organic amendment to
improve physic-chemical characteristics of calcareous soil under two legume crops.
Journal of the Chemical Society of Pakistan, 30(4): 577-582
Kumar, V. and Verma, S. K. 2002. Influence of use of organic manure in combination with
inorganic fertilizers on sugarcane and soil fertility. Indian Sugar, 52(3): 177-181
Paul, G. C., Bokhtiar, S. M., Rashed, M. A. and Mannan, M. A. 2007. Integrated nutrient
management for sustainable sugarcane production in different agro-ecological zones of
Bangladesh. Planter, 83(977): 529-538
Petersen, L. 2002. Analytical method: Soil, water, plant material, fertilizer. Soil Resource
Management and Analytical Services. Soil Resource Development Institute, Dhaka.
Bangladesh
Rakkiyappan, P., Thangavelu, S., Malathi, R. and Radhamani, R. 2001. Effect of biocompost
and enriched pressmud on sugarcane yield and quality. Sugar Technology, 3(3): 92-96
Ramaswamy, P. P.1999. Recycling of agricultural and agro-industry waste for sustainable
agricultural production. Journal of the Indian Society of Soil Science, 47 (4): 661–665
Rangaraj, T., Somasundaram, E. M., Amanullah, M., Thirumurugan, V. Ramesh, S. and
Ravi, S. 2007. Effect of agro-industrial wastes on soil properties and yield of irrigated
finger miller (Eleusine coracana L. Gaertn) in coastal soil. Research Journal of
Agriculture and Biological Sciences, 3(3): 153-156
Sarkar, S., Singh, S. R. and Singh, R. P.2003. The effect of organic and inorganic fertilizers
on soil physical condition and the productivity of a rice–lentil cropping sequence in
India. The Journal of Agricultural Science, 140: 419-425
Shahid, Z., Ahmed, A. U. and Javeed, H. M. R. 2011. Integrated application of fertilizers and
biocane (organic fertilizers) to enhance the productivity and juice quality of autumn
planted sugarcane (Saccharum officinarum L.). African Journal of Agricultural
Research, 6(21): 4857-4861
Shankaraiah, C. and Murthy, K. N. K. 2005. Effect of enriched pressmud cake on growth,
yield and quality of sugarcane. Sugar Technology, 7(2/3): 1-4
Shimabuku, M., Kudo, M. and Miyagi, Y. 1980. Study on the dry matter production of
sugarcane. Part.1.Character of dry matter production in the process of growth in
autumn planting of sugarcane. Bulletin of the Okinawa Agricultural Experiment
Station, 5:1-15
Venkatakrishnan, D. and Ravichandran, M. 2007. Influence of nutrient management on
growth and yield of sugarcane. Plant Archives, 7(1): 99-102

PRODUCTIVITY OF SUGARCANE INFLUENCED BY ENRICHED PRESSMUD COMPOST 193
Table 2. Composition of different nutrients of raw pressmud and enriched pressmud
Elements
(%)
Raw pressmud Enriched pressmud
by Trichoderma
harzianum
Enriched pressmud
by
T. viride
Moisture 23.43 29.30 29.13
Organic matter 39.59 38.90 39.59
N 2.95 3.28 2.81
P 0.31 0.46 0.38
K 0.54 0.58 0.56
S 0.59 0.75 0.72
Zn 0.016 0.016 0.015
Fe 0.15 0.15 0.15
Mn 0.04 0.04 0.04
Ca 5.52 5.66 5.61
Mg 0.235 0.235 0.236
Cu 0.011 0.011 0.010
Ni 0.0006 0.0007 0.0006
Cd 0.00014 0.00014 0.0002
Pb 0.002 0.002 0.002

194 S. M. Bokhtiar et al
Table 3. Effect of different treatments on cane germination, tiller production, length,
girth and millable cane
Treatments Germination
(%)
Tiller at 150
DAP
(×103 ha-1)
Cane
length
(m)
Cane
girth (cm)
Number of
millable
cane
(×103 ha-1)
Cane
yield
(t ha-1)
T1 : RFD + Pm.Th7.5 90.34 139.1 3.60 1.98 96.38 107.80
T2 : RFD + Pm.Tv7.5 75.85 135.3 3.90 1.95 99.15 102.70
T3 : RFD + Pm.R10 79.49 137.9 3.56 1.95 99.15 111.90
T4 : RFD 77.18 128.3 3.51 1.93 96.48 93.86
T5 : 0.75RFD +
Pm.Th7.5
78.37 126.5 3.45 1.89 93.62 97.67
T6: 0.75RFD + Pm.Tv7.5 79.43 127.0 3.59 1.90 94.09 100.07
T7 : 0.75RFD + Pm.R10 87.50 125.9 3.58 1.96 95.81 97.39
T8 : 0.75RFD 72.35 119.6 3.59 1.93 92.38 91.94
T9 : 0.5RFD + Pm.Th7.5 77.71 137.9 3.69 2.08 88.95 85.68
T10: 0.5RFD + Pm.Tv7.5 77.64 128.3 3.71 1.96 98.29 95.18
T11: 0.5RFD + Pm.R10 75.46 123.7 3.58 1.99 97.05 99.53
T12 : 0.5RFD 70.42 117.4 3.54 1.94 92.28 101.90
T13: 0.0RFD + Pm.Th7.5 71.49 116.9 3.42 1.99 96.62 93.07
T14: 0.0RFD + Pm.Tv7.5 69.77 121.6 3.48 1.97 85.80 85.54
T15: 0.0RFD + Pm.R10 68.05 114.0 3.29 1.91 85.80 72.58
T16 : 0.0RFD + Pm.0.0 70.76 102.9 3.34 1.80 83.13 59.06
LSD (P=0.05) 13.85 14.99 0.28 0.20 NS 10.81
Notes: RFD = Recommended Fertilizer dose for sugarcane (150-50-90-34-3.5 NPKSZn kg ha-1);
Pm.Th7.5 = Enriched Pressmud by Trichoderma harzianum 7.5 t ha-1; Pm.Tv7.5= Enriched Pressmud
by Trichoderma viride 7.5 t ha-1; Pm.R10 = Raw Pressmud 10 t ha-1.
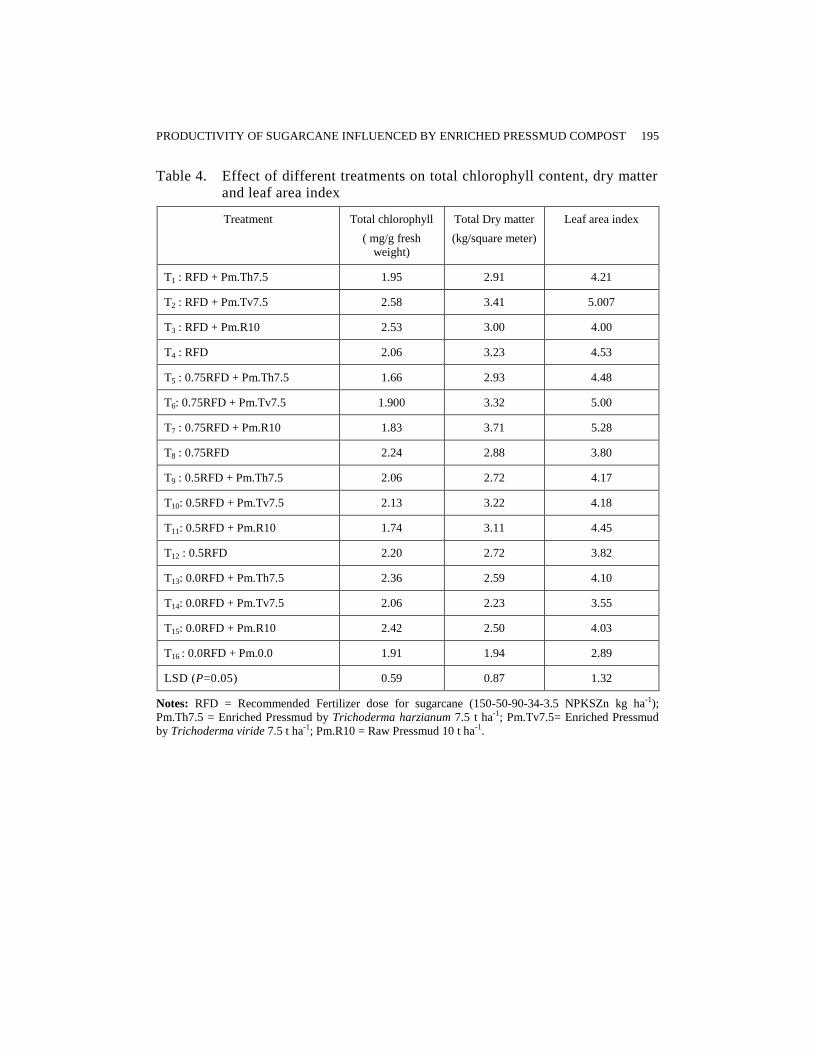
PRODUCTIVITY OF SUGARCANE INFLUENCED BY ENRICHED PRESSMUD COMPOST 195
Table 4. Effect of different treatments on total chlorophyll content, dry matter
and leaf area index
Treatment Total chlorophyll
( mg/g fresh
weight)
Total Dry matter
(kg/square meter)
Leaf area index
T1 : RFD + Pm.Th7.5 1.95 2.91 4.21
T2 : RFD + Pm.Tv7.5 2.58 3.41 5.007
T3 : RFD + Pm.R10 2.53 3.00 4.00
T4 : RFD 2.06 3.23 4.53
T5 : 0.75RFD + Pm.Th7.5 1.66 2.93 4.48
T6: 0.75RFD + Pm.Tv7.5 1.900 3.32 5.00
T7 : 0.75RFD + Pm.R10 1.83 3.71 5.28
T8 : 0.75RFD 2.24 2.88 3.80
T9 : 0.5RFD + Pm.Th7.5 2.06 2.72 4.17
T10: 0.5RFD + Pm.Tv7.5 2.13 3.22 4.18
T11: 0.5RFD + Pm.R10 1.74 3.11 4.45
T12 : 0.5RFD 2.20 2.72 3.82
T13: 0.0RFD + Pm.Th7.5 2.36 2.59 4.10
T14: 0.0RFD + Pm.Tv7.5 2.06 2.23 3.55
T15: 0.0RFD + Pm.R10 2.42 2.50 4.03
T16 : 0.0RFD + Pm.0.0 1.91 1.94 2.89
LSD (P=0.05) 0.59 0.87 1.32
Notes: RFD = Recommended Fertilizer dose for sugarcane (150-50-90-34-3.5 NPKSZn kg ha-1);
Pm.Th7.5 = Enriched Pressmud by Trichoderma harzianum 7.5 t ha-1; Pm.Tv7.5= Enriched Pressmud
by Trichoderma viride 7.5 t ha-1; Pm.R10 = Raw Pressmud 10 t ha-1.
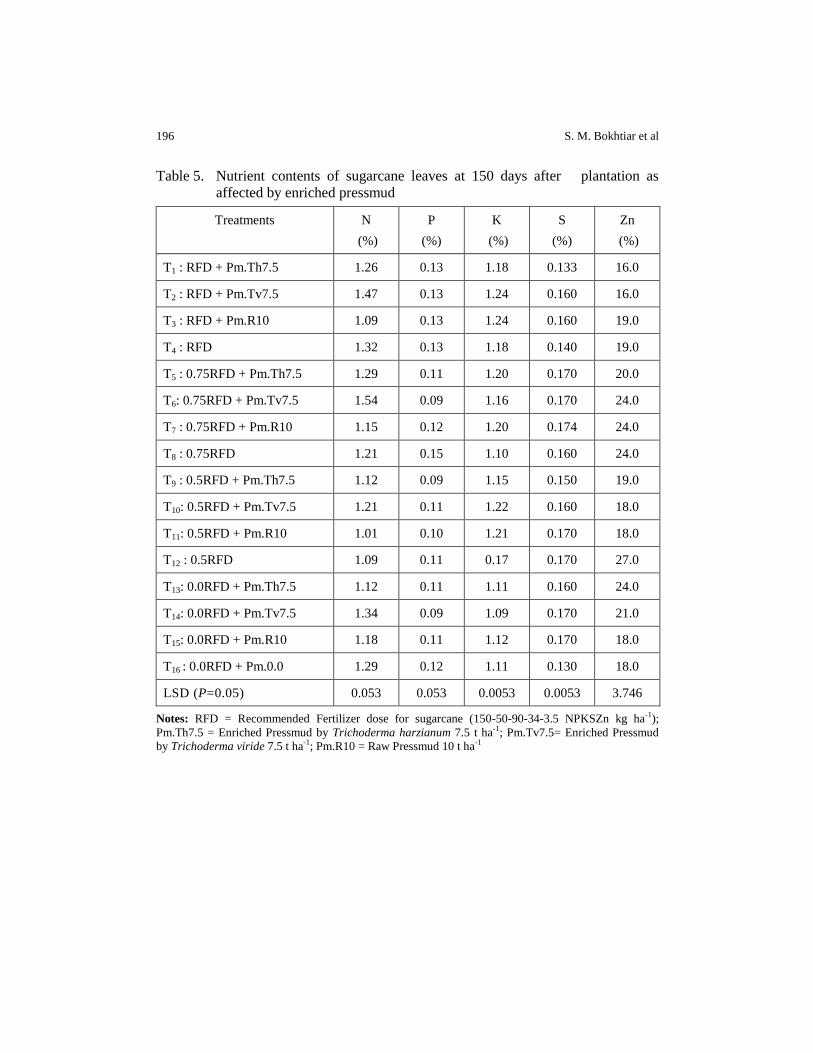
196 S. M. Bokhtiar et al
Table 5. Nutrient contents of sugarcane leaves at 150 days after plantation as
affected by enriched pressmud
Treatments N
(%)
P
(%)
K
(%)
S
(%)
Zn
(%)
T1 : RFD + Pm.Th7.5 1.26 0.13 1.18 0.133 16.0
T2 : RFD + Pm.Tv7.5 1.47 0.13 1.24 0.160 16.0
T3 : RFD + Pm.R10 1.09 0.13 1.24 0.160 19.0
T4 : RFD 1.32 0.13 1.18 0.140 19.0
T5 : 0.75RFD + Pm.Th7.5 1.29 0.11 1.20 0.170 20.0
T6: 0.75RFD + Pm.Tv7.5 1.54 0.09 1.16 0.170 24.0
T7 : 0.75RFD + Pm.R10 1.15 0.12 1.20 0.174 24.0
T8 : 0.75RFD 1.21 0.15 1.10 0.160 24.0
T9 : 0.5RFD + Pm.Th7.5 1.12 0.09 1.15 0.150 19.0
T10: 0.5RFD + Pm.Tv7.5 1.21 0.11 1.22 0.160 18.0
T11: 0.5RFD + Pm.R10 1.01 0.10 1.21 0.170 18.0
T12 : 0.5RFD 1.09 0.11 0.17 0.170 27.0
T13: 0.0RFD + Pm.Th7.5 1.12 0.11 1.11 0.160 24.0
T14: 0.0RFD + Pm.Tv7.5 1.34 0.09 1.09 0.170 21.0
T15: 0.0RFD + Pm.R10 1.18 0.11 1.12 0.170 18.0
T16 : 0.0RFD + Pm.0.0 1.29 0.12 1.11 0.130 18.0
LSD (P=0.05) 0.053 0.053 0.0053 0.0053 3.746
Notes: RFD = Recommended Fertilizer dose for sugarcane (150-50-90-34-3.5 NPKSZn kg ha-1);
Pm.Th7.5 = Enriched Pressmud by Trichoderma harzianum 7.5 t ha-1; Pm.Tv7.5= Enriched Pressmud
by Trichoderma viride 7.5 t ha-1; Pm.R10 = Raw Pressmud 10 t ha-1
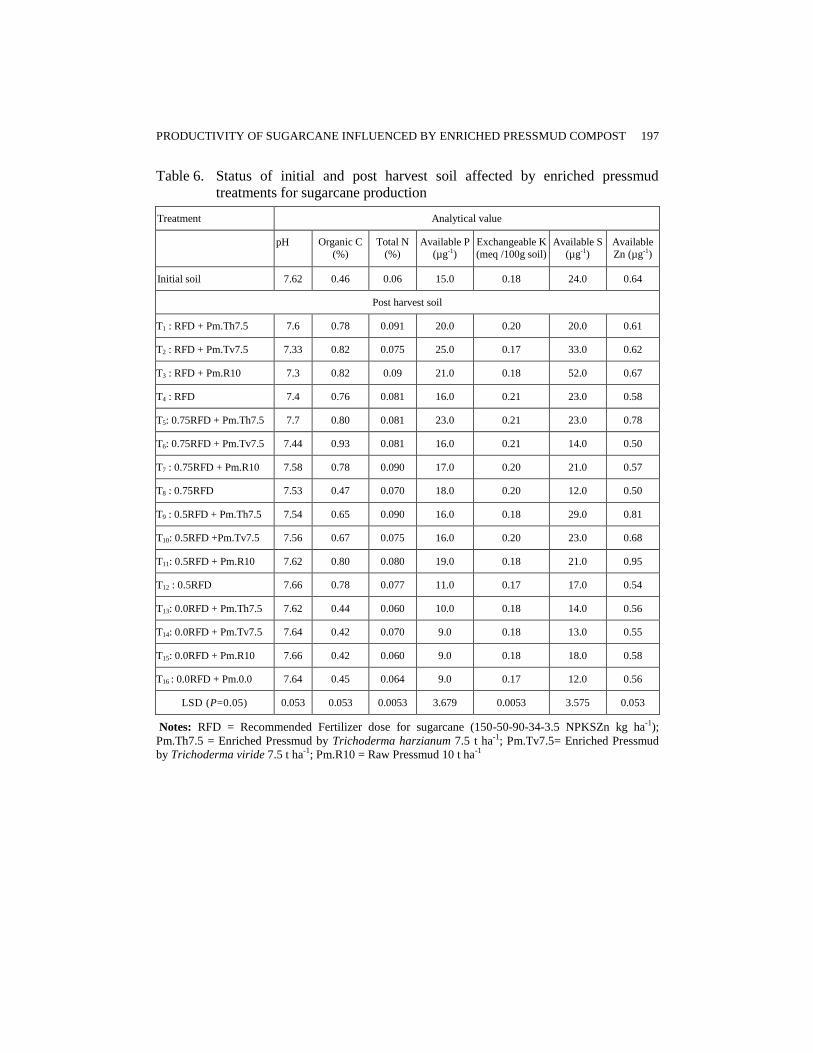
PRODUCTIVITY OF SUGARCANE INFLUENCED BY ENRICHED PRESSMUD COMPOST 197
Table 6. Status of initial and post harvest soil affected by enriched pressmud
treatments for sugarcane production
Treatment Analytical value
pH Organic C
(%)
Total N
(%)
Available P
(µg-1)
Exchangeable K
(meq /100g soil)
Available S
(µg-1)
Available
Zn (µg-1)
Initial soil 7.62 0.46 0.06 15.0 0.18 24.0 0.64
Post harvest soil
T1 : RFD + Pm.Th7.5 7.6 0.78 0.091 20.0 0.20 20.0 0.61
T2 : RFD + Pm.Tv7.5 7.33 0.82 0.075 25.0 0.17 33.0 0.62
T3 : RFD + Pm.R10 7.3 0.82 0.09 21.0 0.18 52.0 0.67
T4 : RFD 7.4 0.76 0.081 16.0 0.21 23.0 0.58
T5: 0.75RFD + Pm.Th7.5 7.7 0.80 0.081 23.0 0.21 23.0 0.78
T6: 0.75RFD + Pm.Tv7.5 7.44 0.93 0.081 16.0 0.21 14.0 0.50
T7 : 0.75RFD + Pm.R10 7.58 0.78 0.090 17.0 0.20 21.0 0.57
T8 : 0.75RFD 7.53 0.47 0.070 18.0 0.20 12.0 0.50
T9 : 0.5RFD + Pm.Th7.5 7.54 0.65 0.090 16.0 0.18 29.0 0.81
T10: 0.5RFD +Pm.Tv7.5 7.56 0.67 0.075 16.0 0.20 23.0 0.68
T11: 0.5RFD + Pm.R10 7.62 0.80 0.080 19.0 0.18 21.0 0.95
T12 : 0.5RFD 7.66 0.78 0.077 11.0 0.17 17.0 0.54
T13: 0.0RFD + Pm.Th7.5 7.62 0.44 0.060 10.0 0.18 14.0 0.56
T14: 0.0RFD + Pm.Tv7.5 7.64 0.42 0.070 9.0 0.18 13.0 0.55
T15: 0.0RFD + Pm.R10 7.66 0.42 0.060 9.0 0.18 18.0 0.58
T16 : 0.0RFD + Pm.0.0 7.64 0.45 0.064 9.0 0.17 12.0 0.56
LSD (P=0.05) 0.053 0.053 0.0053 3.679 0.0053 3.575 0.053
Notes: RFD = Recommended Fertilizer dose for sugarcane (150-50-90-34-3.5 NPKSZn kg ha-1);
Pm.Th7.5 = Enriched Pressmud by Trichoderma harzianum 7.5 t ha-1; Pm.Tv7.5= Enriched Pressmud
by Trichoderma viride 7.5 t ha-1; Pm.R10 = Raw Pressmud 10 t ha-1
SAARC J. Agri., 13(2): 198-213 (2015)
GENETIC PARAMETERS OF TWO BC2F1 POPULATIONS
FOR DEVELOPMENT OF SUPERIOR MALE STERILE
LINES PERTAINING TO MORPHO-FLORAL TRAITS
FOR AEROBIC RICE (Oryza sativa L.)
Raghavendra P and S. Hittalmani*
Department of Genetics and Plant Breeding, University of Agricultural Sciences
GKVK, Bangalore-560 065, India
ABSTRACT
The behaviour of introgressed male-sterilility with respect to various morphological traits is based on its superior performance in segregating backcross populations. In this study a maiden attempt has been made to identify male sterile lines suitable for developing aerobic rice hybrids. Two BC2F1 populations derived from IR70369A x MAS 99 and KCMS31A x MAS 99 crosses were evaluated for various morpho-floral traits. Pollen and spikelet fertility test revealed that all plants of these populations were completely male sterile. Genetic variability studies indicated high heritability for most of the traits (>60%). Narrow variation between Phenotypic Co-efficient of variation (PCV) and Genotypic Coefficient of Variation (GCV) was observed for most traits. Stigma exertion, Panicle exertion, Tiller number and Spikelet per panicle recorded moderate heritability with wider differenced between PCV and GCV. Negatively skewed platykurtic distribution was observed for most of the traits in both BC2F1 populations. The identified new male sterile lines will be stabilised, and they could serve as potential A lines for development of rice hybrids for aerobic condions.
Keywords: Aerobic rice, backcross, cytoplasmic male sterility, floral
traits, variability.
INTRODUCTION
CMS (cytoplasmic male sterility) is the cornerstone of hybrid rice
technology (Ahmadikhah et al., 2015) by which heterotic hybrids are
developed. Rice breeders need to develop wide range of CMS lines for
successful exploitation of heterosis breeding for various situations (Virmani,
* Corresponding author email: [email protected]
Received: 30.09.2015

GENETIC PARAMETERS OF TWO BC2F1 POPULATIONS 199
et al., 1997). In the process of new CMS line development, introgression of
CMS trait from existing male sterile lines into desired background can
diversify CMS lines. Though there are many CMS lines developed, they are
mostly suitable for irrigated puddled ecosystem. Off late due to the shortage
of rainfall, water for irrigated rice in the present form of cultivation of rice is
becoming a limiting factor. Under these circumstances, rice cultivation has to
be modified in order to keep the pace of rice production with limited water
available. Aerobic rice cultivation is one such choice wherein the water
required is half of that of irrigated puddled rice, without compromising the
productivity (Gandhi et al., 2011a). Though varieties have been developed
exclusively for aerobic cultivation (Gandhi et al., 2011a; Gandhi et al.,
2011b), developing hybrids for such situation would further increase the water
productivity and boost the rice yields in the receding water situation (Naresh
2010), Hence, an attempt has been made to convert the existing CMS lines in
the background of MAS 99, an elite aerobic rice variety by backcross
breeding using two popular A lines. The two backcross populations were
advanced to BC2F1generation and evaluated for various genetic factors.
Variation in new CMS lines could be useful for further selection to develop
superior hybrids in rice (Das et al., 2013). Behaviour of CMS lines with
respect to various morphological traits is judged precisely (Ali et al., 2013) for
selection of superior and the suitability of CMS lines. The success of hybrid
rice breeding depends on the extent of natural out crossing on CMS lines
(Hittalmani and Shivashankar, 1987). Rice, being an autogamous plant, does
not encourage out crossing naturally. Floral morphology and flowering
behaviour of CMS lines is important (Ali et al., 2013; Ghadi et al., 2013). Out
crossing depends on number of floral characters, viz. percentage of panicle
exertion, style length, stigma length, stigma area and stigma exertion etc.
Hence, assessing and understanding the genetic variability and the inheritance
pattern of floral traits is essential for proper choice of CMS lines (Sheeba et
al., 2006). On the other hand, variability parameters viz. range, phenotypic
coefficient of variation (PCV), genotypic co-efficient of variation (GCV) and
heritabilitywill be useful for efficient exploitation of variability (Kishore et al,
2015). Hence, the present investigation was undertaken to study the variability
in the two male sterility introgressed BC2F1 populations of rice there by
selecting superior male sterile plants in back cross generations.
200 Raghavendra P and S. Hittalmani
MATERIAL AND METHODS
Plant material and experimental site
The study was conducted in experimental fields of University of
Agricultural Sciences, GKVK, Bangalore, India. The two BC2F1 populations
along with parents were evaluated for morpho-floral traits in Kharif 2014. The
experimental material composed of 150 BC2F1 progenies, among them
100plants from IR70369A×MAS99 cross and other 50 pants were derived
from KCMS31A×MAS99 cross. IR70369A and KCMS31A are popular male
sterile lines, while MAS 99 is a promising short duration aerobic rice
genotype. Procedure followed to develop BC2F1 population is shown in figure
1.
Aerobic rice cultivation
Aerobic rice cultivation involves direct sowing of seeds in un-puddled
land with a spacing of 30 cm × 25 cm. Irrigation was given at 5 days interval
to maintain soil moisture at field capacity throughout the crop growth. The
soil is maintained under aerobic condition unlike the anaerobic condition in
puddled soils with standing water in irrigated transplanted rice. During
reproductive stage the irrigation is given once in 3 days interval. Remaining
cultural practices were done as per recommended package of practices for
aerobic rice developed by UAS, Bangalore (Gandhi et al., 2011b).
Observations recorded
The observations were recorded as per Standard Evaluation system
(SES) for rice (1996). Plant growth parameters recorded were, plant height
after 45 days (cm), plant height at maturity (cm), total number of tillers, days
to 50% flowering and days to maturity. Floral characters included were stigma
length(mm), pollen sterility (%), style length (mm), spikelet fertility (%),
panicle exertion (cm), stigma exertion (%), grain related traits, number of
panicles plant-1
, panicle length (cm), number of spikelets panicle-1
. Soil Plant
Analysis Development (SPAD) using chlorophyll meter reading was carried
out to determine the chlorophyll content.
Statistical analysis
Descriptive statistics such as mean, range and genetic parameters
PCV, GCV and heritability (Robinson, 1949) were estimated using MS Excel
program. Skewness and kurtosis were estimated as per Snedecor and Cochran
(1994) to understand the nature of distribution of BC2F1 population for growth
and related traits under aerobic condition. The mean values of quantitative

GENETIC PARAMETERS OF TWO BC2F1 POPULATIONS 201
traits of above cross was used to estimate coefficients of skewness and
kurtosis using ‘SPSS’ software program. Kurtosis indicates the relative
number of genes controlling the traits (Robson, 1956). Three types of kurtosis
are recognized based on the kurtosis value which depends on distribution
curve. If kurtosis value is 3 it is Mesokurtic. If kurtosis value > 3 it is
Leptokurtic, if kurtosis value < 3 it is Platykurtic. Similarly, the lack of
symmetry i.e., skewness was recognized based on the co-efficient of skewness
values which range from -3 to +3. The type of distribution based on the
skewness values were as follows. If skewness value is zero then, it is called as
symmetrical distribution, if skewness value is negative, it is negatively
skewed distribution and if skewness value is positive then it is positively
skewed distribution.
RESULTS AND DISCUSSION
Success of any plant breeding programme largely depends upon
genetic variability present for the character under improvement. The
genotypic coefficient of variation measures the range of variability available
in a crop and also enables to compare the amount of variability present in
different characters. The phenotypic expression of the character is the result of
interaction between genotype and environment. Hence, the total variance
needs to be partitioned into heritable and non-heritable components to assess
the inheritance pattern of the particular character under study. The pollen and
spikelet fertility test revealed that all the plants were completely male sterile
in both the BC2F1 populations.
Mean and range
Among the traits studied wide range was observed for spikelets
panicle-1, 90.6 to 154.6 with the mean of 128.3 in cross A and 105.2 to 151.2
with the mean of 130.28 in cross B. Stigma exertion % 18.51 to 43.46% with
the mean of 30.19% in cross A, 15.31% to 30.38% with the mean of 24.78%
in cross B was observed. Between these two populations, cross A had wider
range for most of the traits. The range was very narrow for stigma length i.e.
0.79mm to 1.29mm with the mean of 1.07mm in cross A and 0.85mm
to1.27mm with the mean of 1.06mm in cross B. The details of range and mean
for each trait of BC2F1 populations derived from both the crosses are
presented in table 1. Studies on range indicated existence of variability among
the CMS plants. Banumathy et al. (2002); Hasan et al. (2011) and Ingle et al.
(2008) also found that the variability for various traits existed in the rice CMS
lines.
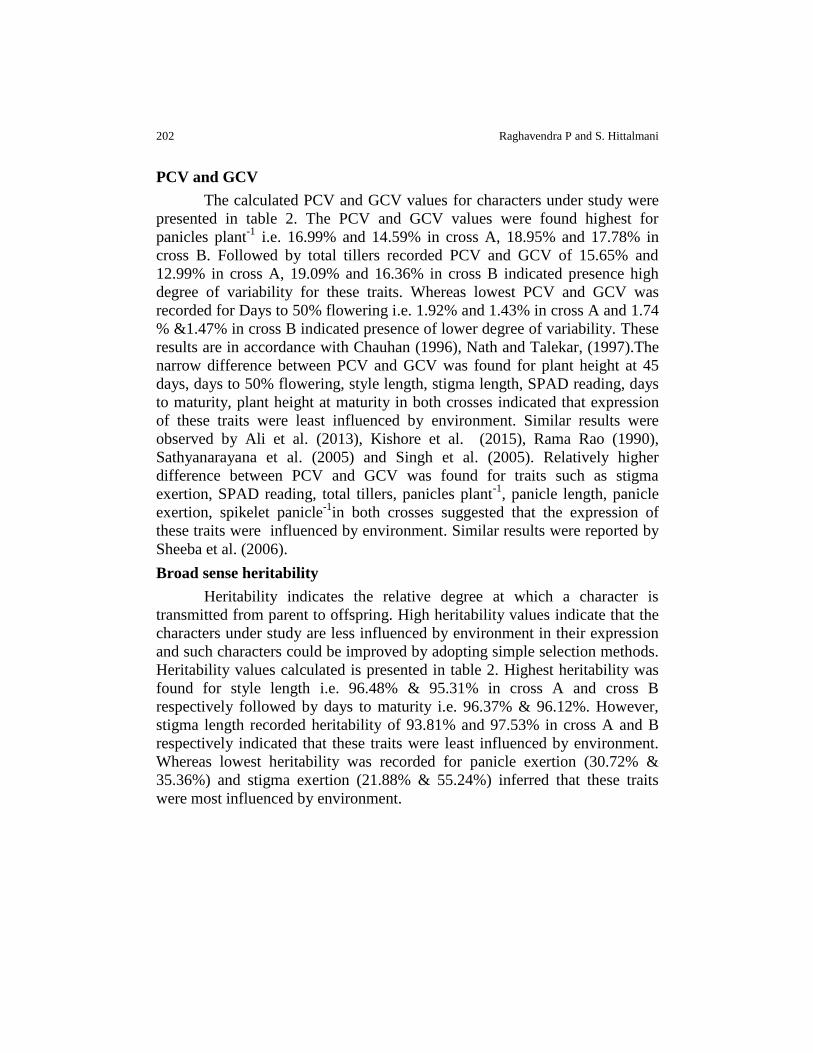
202 Raghavendra P and S. Hittalmani
PCV and GCV
The calculated PCV and GCV values for characters under study were
presented in table 2. The PCV and GCV values were found highest for
panicles plant-1
i.e. 16.99% and 14.59% in cross A, 18.95% and 17.78% in
cross B. Followed by total tillers recorded PCV and GCV of 15.65% and
12.99% in cross A, 19.09% and 16.36% in cross B indicated presence high
degree of variability for these traits. Whereas lowest PCV and GCV was
recorded for Days to 50% flowering i.e. 1.92% and 1.43% in cross A and 1.74
% &1.47% in cross B indicated presence of lower degree of variability. These
results are in accordance with Chauhan (1996), Nath and Talekar, (1997).The
narrow difference between PCV and GCV was found for plant height at 45
days, days to 50% flowering, style length, stigma length, SPAD reading, days
to maturity, plant height at maturity in both crosses indicated that expression
of these traits were least influenced by environment. Similar results were
observed by Ali et al. (2013), Kishore et al. (2015), Rama Rao (1990),
Sathyanarayana et al. (2005) and Singh et al. (2005). Relatively higher
difference between PCV and GCV was found for traits such as stigma
exertion, SPAD reading, total tillers, panicles plant-1
, panicle length, panicle
exertion, spikelet panicle-1
in both crosses suggested that the expression of
these traits were influenced by environment. Similar results were reported by
Sheeba et al. (2006).
Broad sense heritability
Heritability indicates the relative degree at which a character is
transmitted from parent to offspring. High heritability values indicate that the
characters under study are less influenced by environment in their expression
and such characters could be improved by adopting simple selection methods.
Heritability values calculated is presented in table 2. Highest heritability was
found for style length i.e. 96.48% & 95.31% in cross A and cross B
respectively followed by days to maturity i.e. 96.37% & 96.12%. However,
stigma length recorded heritability of 93.81% and 97.53% in cross A and B
respectively indicated that these traits were least influenced by environment.
Whereas lowest heritability was recorded for panicle exertion (30.72% &
35.36%) and stigma exertion (21.88% & 55.24%) inferred that these traits
were most influenced by environment.

GENETIC PARAMETERS OF TWO BC2F1 POPULATIONS 203
Third (Skewness) and fourth (Kurtosis) degree statistics in BC2F1 back
cross populations
The study on distribution properties such as coefficients of skewness
and kurtosis provides insight about the nature of gene action and number of
genes controlling the traits respectively. They are more powerful than first and
second degree statistics which reveal interaction genetic effects. The skewness
and kurtosis values for each trait is presented in table 3. It infers that for most
of traits frequency distribution was negatively skewed and platykurtic (<3) in
both crosses except for style length, SPAD reading, total tillers were
positively skewed and platykurtic (<3). Whereas for panicle length
distribution was positively skewed (0.97) in cross A but negatively skewed (-
0.096) in cross B. For panicles plant-1 negatively skewed (-0.31) for cross A
but positively skewed (0.44) in cross B (Table 3; Figure 2; Figure 3; Figure 4).
The difference in the skewness and kurtosis values for each traits and for each
population is the result of linkage and variable crossing over leads to varied
genome recovery of parents. Negatively skewed platykurtic distribution
indicated that these traits were governed by large number of genes and
majority of them displaying dominant and dominant based duplicate
epistasis.Hence, mild selection is expected to result in rapid genetic gain for
that traits. Whereas positively skewed platykurtic distribution suggested that
these traits were governed by large number of genes and majority of
displaying dominant and dominant based complementary epistasis. Hence,
intense selection is required for rapid genetic gain in these traits (Pooni et al.,
1977).
CONCLUSIONS
Back cross breeding is one of the powerful methods for trait
introgression. It helps to recover the genome as well as create some variability
in the subsequent generations so that a more desirable genotype can be
selected. In this study it was found that there was presence of adequate
genetic variability for various morpho-floral traits. The individuals of
backcross populations with the introgression of male sterility and possessing
superior floral characters were identified that will help further in identifying
new R lines for hybrid seed production in rice for aerobic situation. Based on
the phenotypic acceptance of male sterile plants with highest stigma exertion,
panicle exertion and short duration,plants viz., A09, A27, A42, A45, A78 in
cross A and B16, B22, B31, B43, B48 in cross B were selected as superior
male sterile plants and advanced to BC3F1generation. The identified new male

204 Raghavendra P and S. Hittalmani
sterile plants will be stabilised and further they could be utilised to develop
rice hybrids suitable for aerobic condition with suitable R lines.
REFERENCES
Ahmadikhah, A., Mehdi, M., Mohammad, H. P. and Leila, N. 2015. Marker-assisted
backcrossing (MABC) using CMS-specific, SSR and ISSR markers to develop
an elite CMS line in rice. The Plant Genome, 31:1-78
Ali, M., Hossain M. A., Kulsum M. U., Sharma N. and Mian, M. A. K. 2013.
Variability in quasi CMS lines of aromatic rice (Oryza sativa L.) in BC3
generation and their phenotypic acceptability. Eco-friendly Agriculture
Journal, 6 (05): 78-82
Banumathy, S., Thiyagarajan, K. and Vaidyanathan, P. 2002. Genetic variability for
floral traits and their association with outcrossing in rice, Crop Research,
23(3): 507-509.
Chauhan, J. S. 1996. Segregation analysis and estimation of genetic parameters for
some quality traits in F2 generation in rice. Oryza, 33: 168-173
Das, P., Chand K. S., Sankar M. B., Mukherjee and Tapash D. 2013. Genetic
variability in cytoplasmic male sterile lines in rice (Oryza sativa L.). Journal of
Agriculture and Veterinary Science, 3(5): 95-100
Gandhi, V. R., Shivamurthy, M., Rudresh, N. S. and Hittamani, S. 2011a.
Performance and adaption of new aerobic rice variety MAS946-1 (Sharada) in
southern Karnataka. Karnataka Journal of Agricultural Sciences, 25(1):5-8
Gandhi, V. R., Hittamani, S. and Shivamurthy, M. 2011b. Performance and adaption
of Direct seeded aerobic rice variety MAS26 (Onasiri) in Southern
Karnataka. Journal of Extension Education, 23(3): 4684-4690
Ghadi, A., Babaeian, J. N., Bagheri. 2013. Evaluation of improved rice CMS lines
according sterility, fertility and allogamy characteristics (Oryza sativa l.)
Modern Genetics, 31(7): 397- 408
Hasan, M. J., Umma Kulsum, M. H., Rahman, M., Hazrat and Julfiquar, A. W. 2011.
Genetic variability of some cytoplasmic male sterilelines (CMS) of rice (Oryza
sativa l.) genotypes, Bangladesh Journal Agricultural Research, 36(2): 263-
270
Hittalmani, S. and Shivashankar, G. 1987. Out crossing on male sterile lines of rice.
Mysore Journal of Agriculture Sciences, 21:158-160
Ingale, B. V., Waghmode, B. D. and Hodawadekar, S. S., 2008. Identification of
restorers and maintainers for different CMS lines of rice. Madras Agricultural
Journal, 95(7/12): 266-277

GENETIC PARAMETERS OF TWO BC2F1 POPULATIONS 205
Kishore, N. S. Srinivas, T. Nagabhushanam, U. Pallavi, M. and Sameera, S. K. 2015.
Genetic variability, correlation and path Analysis for yield and yield
components in Promising rice (oryzasatival.) Genotypes. SAARC Journal of
Agriculture, 13 (1):99-108
Nath and Talukdar, P. 1997. Genetic variability and correlation studies in segregating
populations of indigenous scented x high yielding non scented crosses of rice.
Oryza. 34: 91-93
Naresh Babu, N. 2010. Identification of Restorers and maintainers for the
development of aerobic rice hybrids (Oryza sativa L.) and Validation of SSR
markers linked to fertility (Rf) locus. M.Sc. Thesis, University Agricultural
Sciences, Bangalore
Pooni, H. S., Jinks, J. L. and Cornish, M. A. 1977. The causes and consequences of
non-normality in pretending the properties of recombinant inbred lines.
Heredity, 38: 329-338
Rama Rao, M. 1990. Genetic analysis for yield and its components in rice crosses
(Oryza sativa L.). M. Sc. (Ag) thesis, Acharya N. G. Ranga Agricultural
University, Rajendranagar, Hyderabad (India).
Robinson, H. F., Comstock, R. E. and Harvey, P. H. 1949. Estimation of heritability
and degree of dominance in Corn. Agronomy Journal, 41: 353-359
Robson, D. S. 1956. Application of K4 statistics to genetic variance component
analysis. Biometrics, 12: 433-444
Satyanarayana, P. V., Srinivas T, Reddy, P. R., Madhavilatha, L. and Suneetha, 2005.
Studies on variability, correlation and path coefficient analysis for restorer lines
in Rice. Research on Crops, 6 (1): 80-84
Sheeba, A.,Vivekanandan P. and Ibrahim, S. M. 2006. Genetic variability for floral
traits influencing outcrossing in the CMS lines of rice, Indian Journal of
Agricultural Research, 40 (4) : 272 – 276
Singh, I., Dey, K., Sanjeev, S. and Shani, J. P. 2005. Variability, heritability, genetic
advance and genetic divergence in induced mutants of irrigated basmati rice
(Oryza sativa L.). Oryza, 42(3): 210-213
Snedecor, G. W. and Cochran, W. G. 1994. statistical methods. Fifth edition. Iowa
State University Press. Ames. Iowa, USA.
Standard Evaluation System for Rice. 1996. Prepared by INGER – Genetic
Resources Center, International Rice Research Institute, Manila, Philippines.
Pp.1-39.
Virmani, S. S., Viraktamath, B. C., Casal C. L., Toledo, R. S., Lopez, M. T. and
Manalo, J. O. 1997. Hybrid Rice Breading Manual. Int. Rice Research
Institute. Los Banos,Leguna, Philippines. pp.155

206 Raghavendra P and S. Hittalmani
Table 1. Estimates of range and mean of two BC2F1 populations derived from
IR70369A × MAS99 and KCMS31A × MAS99 crosses in rice
Traits
IR70369A × MAS99 (cross A) KCMS31A × MAS99 (cross B)
Range
Mean
Range
Mean Min Max Min Max
1) Plant height at 45 days (cm) 31 44 37.54 27 42 36.46
2) Days to 50% flowering 89 98 94.78 94 100 96.9
3) Style length (mm) 0.68 1.24 0.93 0.75 1.17 0.93
4) Stigma length (mm) 0.79 1.29 1.07 0.85 1.27 1.06
5) Stigma exertion (%) 18.51 43.46 30.19 15.31 30.38 24.78
6) SPAD chlorophyll meter reading 28.1 48.5 34.65 27.5 42.1 33.24
7) Days to maturity 121 134 128.2 126 136 132.38
8) Total tillers 14 30 22.01 15 32 22.06
9) Panicles plant-1 7 28 19.93 13 29 20.02
10 Plant height at maturity (cm) 59 83 73.68 64 79 72.53
11 Panicle length (cm) 14.38 24.66 17.73 12.36 22.82 17.66
12 Panicle exertion (cm) -8.68 -3.6 -6.22 -7.58 -4.92 -6.32
13 Spikelet panicle-1 90.6 154.6 128.3 105.2 151.2 130.28

GENETIC PARAMETERS OF TWO BC2F1 POPULATIONS 207
Table 2. PCV, GCV and heritability of two BC2F1 populations derived from
IR70369A × MAS99 and KCMS31A × MAS99 crosses in rice
Traits
Phenotypic
coefficient of
variation
Genotypic coefficient of
variation
Broad sense heritability
IR70369A
× MAS99
KCMS31A
× MAS99
IR70369A
× MAS99
KCMS31A
× MAS99
IR70369A
× MAS99
KCMS31A
× MAS99
1) Plant height at 45 days
(cm)
8.19 8.13 7.52 7.68 84.15 89.18
2) Days to 50% flowering 1.92 1.74 1.43 1.47 54.89 71.7
3) Style length (mm), 11.72 10.18 11.51 9.94 96.48 95.31
4) Stigma length (mm), 9.74 9.82 9.43 9.7 93.81 97.53
5) Stigma exertion (%) 15.78 13.69 7.38 10.17 21.88 55.24
6) SPAD chlorophyll meter
reading
9.26 9.49 7.99 8.59 74.5 81.85
7) Days to maturity 2.24 1.92 2.2 1.88 96.37 96.12
8) Total tillers 15.65 19.09 12.99 16.36 68.83 73.49
9) Panicles plant-1 16.99 18.95 14.59 17.78 73.82 88.06
10) Plant height at maturity
(cm)
5.79 4.25 5.46 3.7 89 75.8
11) Panicle length (cm) 10.76 12.11 8.64 10.08 64.38 69.35
12) Panicle exertion (cm) 13.81 9.51 7.65 5.66 30.72 35.36
13) Spikelet panicle-1 10.35 7.52 7.25 5.1 49.07 46.04

208 Raghavendra P and S. Hittalmani
Table 3. Skewness and Kurtosis of BC2F1 populations derived from
IR70369A × MAS99 and KCMS31A × MAS99 crosses in rice
Traits Skewness Kurtosis
IR70369A ×
MAS99
KCMS31A ×
MAS99
IR70369A ×
MAS99
KCMS31A ×
MAS99
1) Plant height at 45
days (cm)
0.01 -0.774 -0.47 1.54
2) Days to 50%
flowering
-0.41 -0.132 0.02 -0.94
3) Style length (mm) 0.36 0.485 0.34 0.04
4) Stigma length (mm) -0.56 -0.215 -0.03 -0.92
5) Stigma exertion (%) 0.15 -0.486 0.1 0.23
6) SPAD chlorophyll
meter reading
0.86 0.912 2.35 0.95
7) Days to maturity -0.39 -0.86 -0.19 0.45
8) Total tillers 0.15 0.39 -0.57 -0.41
9) Panicles plant-1
-0.31 0.443 1.1 -0.2
10) Plant height at
maturity (cm)
-0.56 -0.401 0.84 0.13
11) Panicle length (cm) 0.97 -0.096 1.66 0.46
12) Panicle exertion
(cm)
-0.05 -0.024 0.48 -0.11
13) Spikelet panicle-1
-0.27 -0.299 -0.156 0.29
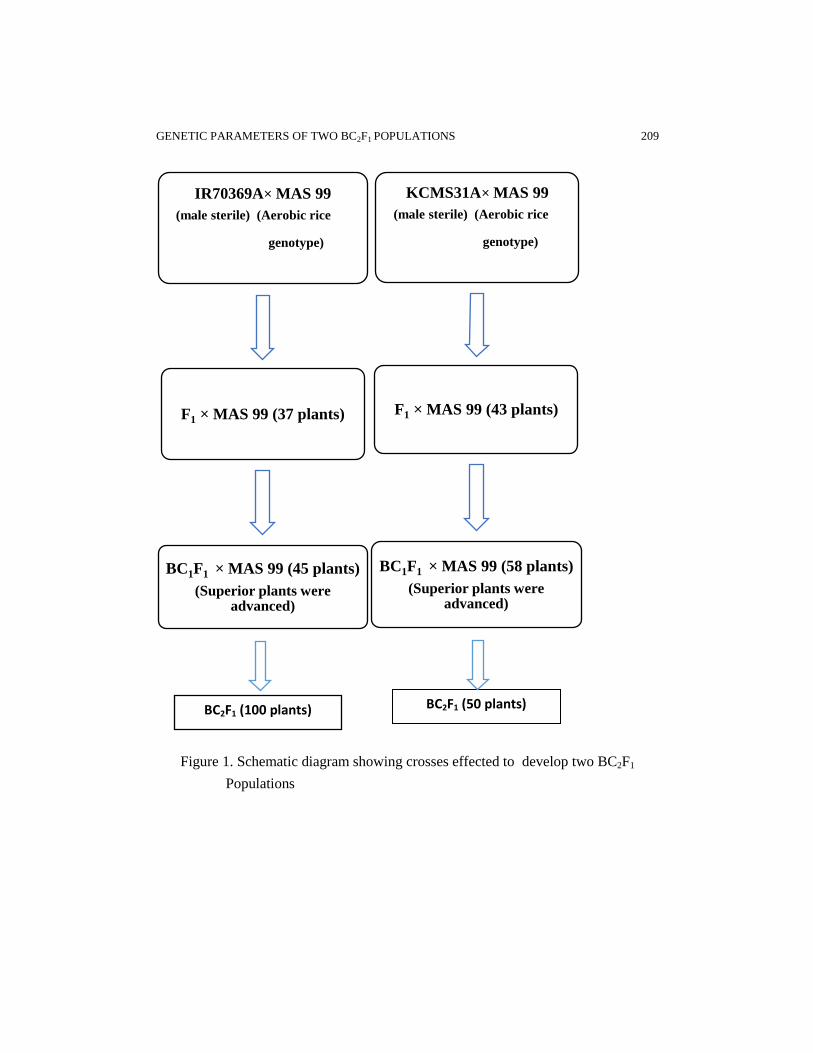
GENETIC PARAMETERS OF TWO BC2F1 POPULATIONS 209
BC2F1 (100 plants) BC2F1 (50 plants)
Figure 1. Schematic diagram showing crosses effected to develop two BC2F1
Populations
IR70369A× MAS 99
(male sterile) (Aerobic rice
genotype)
F1 × MAS 99 (37 plants)
BC1F1 × MAS 99 (45 plants)
(Superior plants were advanced)
KCMS31A× MAS 99
(male sterile) (Aerobic rice
genotype)
F1 × MAS 99 (43 plants)
BC1F1 × MAS 99 (58 plants)
(Superior plants were advanced)
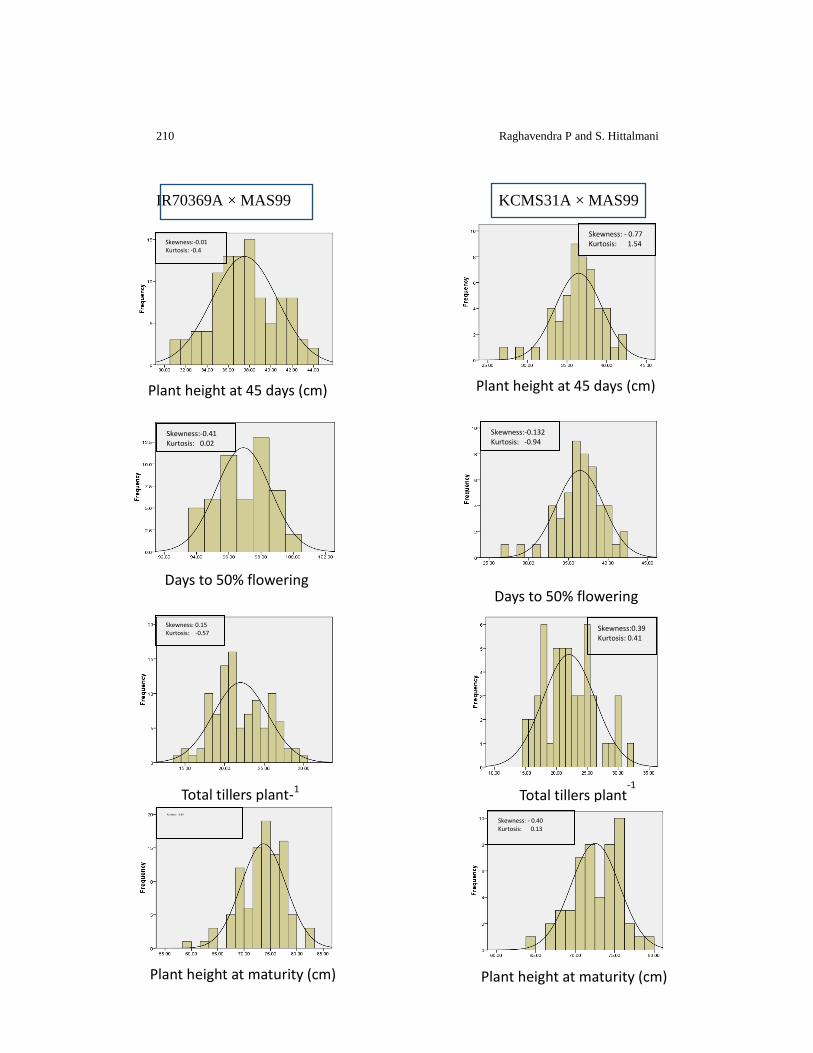
210 Raghavendra P and S. Hittalmani
IR70369A × MAS99 KCMS31A × MAS99
Plant height at maturity (cm)
Kurtosis: 0.84
Plant height at maturity (cm)
Skewness: - 0.40 Kurtosis: 0.13
Total tillers plant-1
Skewness: 0.15 Kurtosis: -0.57
Total tillers plant-1
Skewness:0.39 Kurtosis: 0.41
Skewness:
Kurtosis
Skewness: 0.39 Kurtosis: -0.41
Days to 50% flowering
Skewness:-0.41 Kurtosis: 0.02
Days to 50% flowering
Plant height at 45 days (cm)
Skewness:-0.01 Kurtosis: -0.4
Skewness: - 0.77 Kurtosis: 1.54
Plant height at 45 days (cm)
Skewness:-0.132 Kurtosis: -0.94
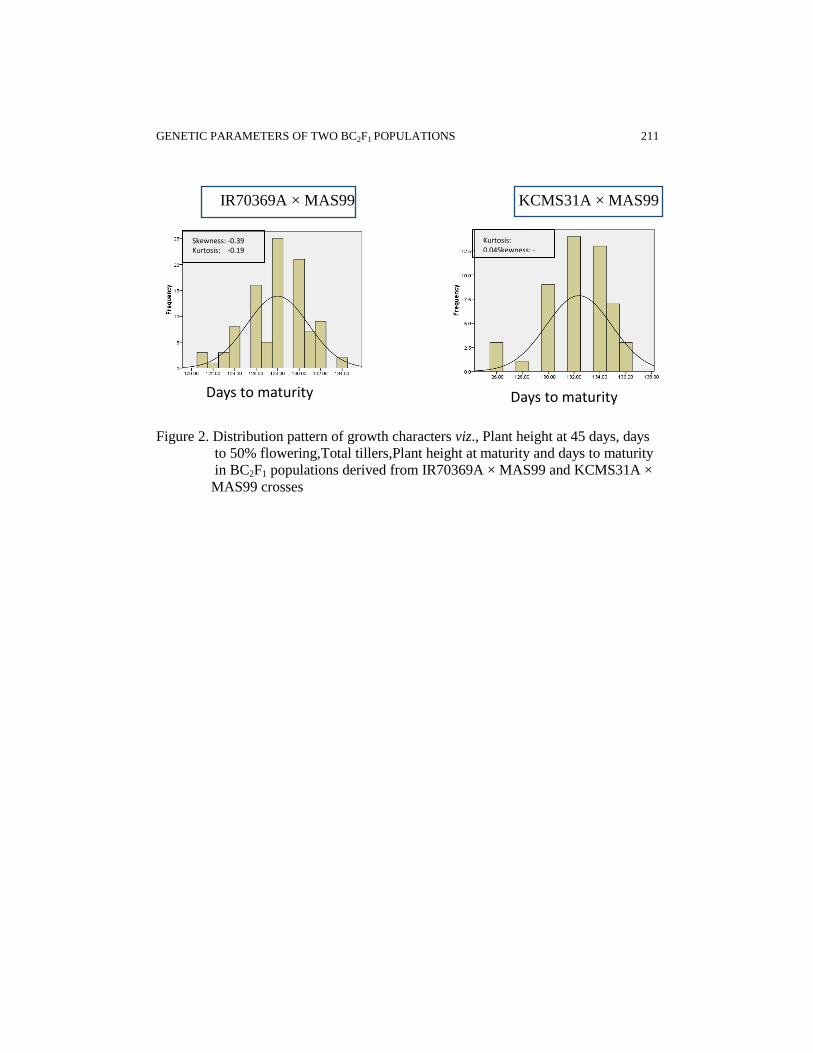
GENETIC PARAMETERS OF TWO BC2F1 POPULATIONS 211
IR70369A × MAS99 KCMS31A × MAS99
Figure 2. Distribution pattern of growth characters viz., Plant height at 45 days, days
to 50% flowering,Total tillers,Plant height at maturity and days to maturity
in BC2F1 populations derived from IR70369A × MAS99 and KCMS31A ×
MAS99 crosses
Skewness: -0.39 Kurtosis: -0.19
Days to maturity Days to maturity
Kurtosis: 0.04Skewness: - 0.86 Kurtosis: -0.41

212 Raghavendra P and S. Hittalmani
IR70369A × MAS99 KCMS31A × MAS99
Figure 3. Distribution pattern of Floral traits viz., Style length, Stigma length
Stigma exertion, and Panicle exertion in BC2F1 populations derived from
IR70369A × MAS99 and KCMS31A × MAS99 crosses
Skewness: -0.56 Kurtosis: -0.03
Stigma length (mm)
Skewness: - 0.21 Kurtosis: -0.92
Stigma length (mm)
Skewness: 0.15 Kurtosis: 0.10
Stigma exertion (%) Stigma exertion (%)
Skewness: - 0.486 Kurtosis: 0.23
Skewness: -0.05 Kurtosis: 0.48
Panicle exertion (cm)
Skewness: - 0.02 Kurtosis: - 0.11
Panicle exertion (cm)
Style length (mm)
Skewness:-0.36 Kurtosis: 0.34
Style length (mm)Skewness: -0.56
Skewness: 0.48

GENETIC PARAMETERS OF TWO BC2F1 POPULATIONS 213
IR70369A × MAS99 KCMS31A × MAS99
Figure 4. Distribution pattern of yield related traits viz., Panicle length, Productive
tillers per plant and Spikelets per panicle in BC2F1 populations derived
from IR70369A × MAS99 and KCMS31A × MAS99 crosses
Skewness:-0.31 Kurtosis: 1.1
1 Panicles plant-1
Skewness: 0.97 Kurtosis: 1.66
Panicle length (cm)
Skewness: - 0.096 Kurtosis: 0.46
Panicle length (cm)
Spikelets panicle-1
Skewness: -0.27 Kurtosis: -0.156 Skewness: - 0.29
Kurtosis: 0.29
Spikelets panicle-1
Skewness: 0.443 Kurtosis: -0.20
Panicles plant-1

SAARC J. Agri., 13(2): 214-221 (2015)
INFLUENCE OF SEEDLING AGE ON CUCUMBER
(Cucumis sativus L.) PRODUCTION
G. Jellani1, M. J. Atif
1, H. Ullah
1, M. Ali
1 and M. Musa*
2
Directorate of Vegetable, National Agricultural Research Center, Islamabad, Pakistan
ABSTRACT
Cucumber crop was evaluated for the influence of seedling age on its production during two consecutive years of 2011 and 2012 on experimental area of National Agricultural Research Center (NARC), Islamabad, Pakistan. Nursery of cucumber was raised in polythene tubes under protected structures (walk-in tunnels). Seedling transplantation of three different ages viz., 30, 45 and 60 days were compared with direct seeding in the open field. Seedling transplantation produced fruits earlier (22 days), increased availability period (41 days) as compared to direct seeded crop. Transplantation of 45 and 60 days old seedlings produced higher fruits yield of cucumber with higher gross return and gross margin. The results revealed that transplantation of 45 to 60 days old seedlings was suitable for achieving fruits earlier and profitable cucumber production technology.
Keywords: Cucurbits, cucumber, early crop, seedling age and gross
margin
INTRODUCTION
Cucumber is cultivated on an area of 3499 hectares with an annual production
of 449947 tonnes in Pakistan (GOP, 2013-14). Cucumber productivity is highly
dependent on different factors such as light, temperature, CO2, humidity, water
supply, fertilization, cultivation methods and varieties etc (Juknys et al., 2011).
Among those, temperature plays a significant role in cucumber production.
Cucumber seedling is easily injured by frost; consequently, direct seeding in the field
is delayed until the danger of frost is ended (Hussain et al., 1989). Cucumber
seedlings may be successfully raised under plastic tunnels during cooler months and
healthy seedlings can be transplanted at most favourable age. Seedling age greatly
influences the vegetative development of the crop, vegetative mass, biochemical
composition, output of standard transplants, plant growth after transplantation and
* Corresponding author email: [email protected] 1 Directorate of Vegetable, National Agricultural Research Center, Islamabad, Pakistan 2 Barani Agricultural Research Institute, Chakwal, Pakistan
Received: 28.11.2015
Influence of Seedling age on Cucumber Production 215
resistance to critical conditions (Henare and Ravanloo, 2008). Seedlings of an older
age are more tolerant to stress and produce fruits earlier, while young transplants are
less tolerant (Vavrina, 1998). Seedlings transplanted at their older age develop
reproductive phase quicker than vegetative phase (Orzolek, 2004). To encourage
quick plant growth and early harvest, the technique of transplanting cucumber
seedlings may be applied. Optimum seedling age for better plant establishment could
enhance productivity of cucumber crop (Handley and Hutton, 2003). The effect of
seedling age on yield is an issue often introduced by the growers to maximize
production potential (Holcomb, 1994). Optimum seedlings age determine early
production as well as higher yield of crop which favours the farmers to get higher
market price. Therefore, the aim of present study was to observe the influence of
seedling age on cucumber production which would be economical as well as
beneficial for farmers.
MATERIALS AND METHODS
The experiment was carried out at the experimental field of National
Agricultural Research Centre (NARC), Islamabad, Pakistan during two consecutive
years of 2011 and 2012. The experimental site was located at 73.080 E Longitude,
33.420
N Latitude and 683 msl. Soil texture was sandy loam with pH 7.8. Nursery of
cucumber (Variety: Sialkot selection) was raised in plastic tubes under plastic tunnel
in a medium comprising Farm Yard Manure (FYM), sand and soil with a proportion
of 1:1:1, respectively. Four treatments viz., T0: Traditional direct sowing practice, T1:
30 days old seedlings, T2: 45 days old seedlings, T3: 60 days old seedlings were
compared under field condition. The experiment was laid out in randomized complete
block design with three replications. FYM @ 7 t ha-1
was incorporated in to soil as
organic amendment at the time of land preparation one month before transplantation.
Seedlings of different ages according to treatments were transplanted on 03 March,
2011 and 05 March, 2012 maintaining row to row and plant to plant distance of 1.5 m
and 50 cm, respectively. Direct seeding was done on the same day. Data were
collected on days to first picking, availability period, survival percentage, fruits
weight per plant and fruit yield (t ha-1
). Collected data were analyzed using statistics
8.1 software package. Means of different parameters were ranked according to Least
Significant Difference (LSD) Test (Steel et al., 1997). Gross return and gross margin
were also calculated.
RESULTS AND DISCUSSION
The values of all the parameters under study showed similar trend indicated
similar performance of treatments in both the years. Two years mean of each trait
was computed and discussed here.
216 M Musa et al.
Days to first picking, availability period and survival percentage
Significant differences were observed among different seedling age treatments
for first picking time, availability period of the produce and survival percentage of
the plants. Two years mean values indicated that seedlings irrespective of their age
produced fruits earlier compared to direct seeded crop. First fruit was harvested about
22 days earlier (Table 2). Singh et al. (2010) also proved the technique of raising
seedlings for early harvesting of cucurbit in India. Availability period was about 41
days in 30 to 60 days old seedling, whereas it was 21 days in direct seeded crop. The
results revealed that availability period was 20 days more in 30 to 60 days old
seedlings than in direct seeded crop. Survival percentage was recorded 100% in
treatments of seedlings, whereas it was 75 % in direct seeded crop (Table 2).
Minimum survival rate in direct seeded crop might be due to poor root growth. Poor
survival of cucumber crop in direct sowing method was also recorded by Handley
and Hutton (2003). However, all seedling treatments proved statistically similar for
all above described traits. These results are also supported by Hasandokht and
Nosrati (2010).
Fruit weight per plant and fruit yield
Fruits weight per plant differed significantly among different seedling age
treatments (Table 3). Averaged over years, maximum fruits weight per plant (884.31
g) was recorded from crops raised through 60 days old seedlings, which was
statistically similar to that of 45 days old seedlings (859.17 g) but significantly higher
than other treatments.. Fruit yield was also varied significantly among different
treatments. In case of fruit yield, similar trend was observed to that of fruit weight per
plant. Fruit yield obtained from 60 days old seedlings was the highest (17.69 t ha-1
),
which was at par with that of 45 days old seedlings (77.19 t ha-1
), while both
treatments produced significantly higher fruit yield as compared to 30 days old
seedling and direct seeded crop. Different scientists (Hasandokht and Nosrati, 2010;
Orzolek, 2004) also reported that vegetables cultivated from older seedlings produced
higher yields. These results are also in line with the findings of Choudhari et al.
(2002). However, according to Liptay (1988), the yields from the seedlings of
different ages are similar, in spite of the fewer yield from younger seedlings of
cucumber. Minimum fruits yield (11.40 t ha-1
) was recorded from direct seeded crop.
NeSmith (1994) also reported lower fruit yield in direct seeded zucchini squash than
four weeks old transplants. Increase in fruit yield at 60 days old seedlings over direct
seeding was maximum (55.18%) which was statistically at par with 45 days old
seedlings (50.79%). On the contrary, fruit yield increment was minimum (35.53%) at
30 days old seedlings over direct seeding (Figure 2).
Gross margin and gross return
Averaged over years, gross margin and gross return also behaved similarly as
fruit yield. The highest gross margin (US$ 989.5 ha-1
) was found from 60 days old
seedlings and it was statistically similar to 45 days old cucumber seedlings (US$
Influence of Seedling age on Cucumber Production 217
936.8), while the lowest gross margin of US$ 412.3 ha-1
was recorded from direct
seeded crop (Figure 1). This result further revealed (Figure 2) that the increment of
gross margin in 60 days old seedlings was maximum (140%) over direct seeded crop,
which was statistically similar to 45 days old seedlings (127.21%). Increase in gross
margin with 30 days old seedlings over direct seeded crop was minimum (85.06%).
Likewise, gross return was 41.34 to 44.33% higher in 45 to 60 days old cucumber
seedlings over direct seeded crop. Higher gross return and gross margin in older
cucumber seedlings were attributed to the higher fruit yield owing to have more
availability period and higher survival rate (Figure 2).
CONCLUSION
The two-year results revealed that seedling transplantation was superior to
traditional direct seeded cucumber. Seedlings of 45-60 days old produced higher fruit
yield, gross return and gross margin. Farmers might be suggested to transplant 45-60
days old seedlings for profitable cucumber production.
REFERENCES
Choudhari, S. M., More, T. A. and Tazuke, A. 2002. Fertigation, fertilizer and spacing
requirement of tropical gynoecious cucumber hybrids. Acta Horticulture, 588: 233–240
GOP. 2013-14. Fruits, Vegetables and Condiments Statistics of Pakistan. Ministry of National
Food Security and Research (Economic Wing), Islamabad.
Handley, D. and Hutton, M. 2003. Effect of seeding date, transplant size and container on
growth and yield of pickling cucumbers. Journal of the American Society for
Horticultural Science, 38: 672
Hasandokht, M. R. and Nosrati, S. Z. 2010. Effect of transplant age and fruit pruning on
earliness and total yield of greenhouse cucumber (Cucumis sativus L. cv. Sultan). Plant
Ecophysiology, 2: 21-25
Henare, M., and Ravanloo, A. 2008. Effect of transplanting stage and planting depth of
seedling on growth and yield of tomato. Book of abstracts. IV Balkan Symposium on
Vegetables and Potatoes. Plovdiv, 96
Holcomb, E.J. (ed.). 1994. Bedding Plants IV. Ball Publishing, Batavia, Ill.
Hussain, S. ASZI., Khokar, K. M. and Farooq, M. 1989. Modern production practices of
cucumber. Progressive Farming, 9: 21–3
Juknys, R., Duchovskis, P., Sliesaravicius, A., Slepetys, J., Januskaitiene, I., Brazaityte, A.,
Ramaskeviciene, A., Lazauskas, S., Dedeliene, K., Sakalauskaite, J., Juozaityte, R.,
Kadziuliene, Z., and Diksaityte, A. 2011. Response of different agricultural plants to
elevated CO2and air temperature. Zemdirbyste–Agriculture, 97 (2): 89–98
Liptay, A. 1988. Field survival and establishment of tomato transplants of various age and
size. Acta Horticulture, 220: 203-210
NeSmith, D. S. 1993 or 1994. Transplant age has little influence on yield of muskmelon
(Cucumis melo L.). Hort. Sci. 29(8): 916.
218 M Musa et al.
Orzolek, M. 2004. Evaluating vegetable transplants. Vegetable, small fruit and specialty
crops. Virginia Cooperative Extension, 3(3): 9
Singh, B., Tomar, B. S. and Hasan, M. 2010. Plug tray nursery raising technology for off
season cucurbits cultivation. Acta Horticulture, (ISHS), 871: 279-282
Steel, R. G. D., Torrie, J. H. and Boston, M. A. 1997. Principles and Procedures of Statistics.
2nd
Ed. McGraw Hill, New York. 636
Vavrina, C. S.1998. Transplant age in vegetable crops. Horticultural Technology, 8 (4): 550–
555.

Influence of Seedling age on Cucumber Production 219
Table 1. Meteorological data during the study period of 2011 and 2012
Period of
study
Max Temp
(°C)
Min Temp
(°C)
Relative Humidity
(%)
Rainfall
(mm)
January, 2011 17.3 1.8 71.3 8.32
February, 2011 17.7 5.8 75.8 78.73
March, 2011 25.8 10.2 63 53.19
April, 2011 28.8 13.5 61 53.96
May, 2011 38.1 20.4 45 17.29
January, 2012 16.9 1.32 68.5 59.06
February, 2012 17.4 3.24 70.1 44.12
March, 2012 24.9 8.9 58.6 15.95
April, 2012 29.9 15.0 54.7 40.93
May, 2012 26.2 18.3 38.4 9.47
Source: Metrological Section, Water Resources Research Institute (WRRI), NARC, Islamabad

220 M Musa et al.
Table 2. Influence of seedlings age on days to 1st
picking, availability period and
survival of cucumber
Treatment Days to 1st picking Availability Period (days) Survival rate of plants (%)
2011 2012 Mean 2011 2012 Mean 2011 2012 Mean
Direct sowing 63.00 64.25 63.63 a 21.25 22.25 21.75 b 77.50 77.50 75.50 b
30 days old
seedlings 41.50 41.50 41.50 b 40.25 41.25 40.75 a 100.00 100.0 100.00 a
45 days old
seedlings
42.00 41.50 41.75 b 40.75 40.50 40.62 a 100.00 100.0 100.00 a
60 days old
seedlings 42.00 41.50 41.75 b 41.25 41.25 41.25 a 100.00 100.0 100.00 a
Year means 47.19 47.12 35.88 36.31 94.37 94.37
LSD
Treatment Year Interaction Treatment Year Interaction Treatment Year Interaction
1.44 *NS *NS 0.93 *NS *NS 2.58 *NS *NS
*NS: non-significant
Table 3. Influence of seedlings age on yield and gross return from cucumber
Treatment Yield plant-1 (g) Yield (t ha-1)
2011 2012 Mean 2011 2012 Mean
Direct sowing 730.75 721.60 26.17 c 11.65 11.15 11.40 c
30 days old seedlings 766.20 778.73 772.46 bc 15.32 15.58 15.45 b
45 days old seedlings 910.03 808.31 859.17 ab 18.20 16.18 17.19 a
60 days old seedlings 947.88 820.75 884.31 a 18.95 16.42 17.69 a
Year means 838.71 782.35 16.03 a 14.83 b
LSD
Treatment Year Interaction Treatment Year Interaction
90.75 *NS *NS 1.627 1.151 *NS
*NS: non-significant
Influence of Seedling age on Cucumber Production 221
Figure 1. Effect of seedling age on fruit yield and attained grass margin from
cucumber (2-year average)
Figure 2. % Increase in fruit yield, gross return and gross margin of cucumber from
different aged seedlings over direct sowing (2-year average)
11.40
15.45 17.19 17.69
412.3
763.0
936.8989.5
0
200
400
600
800
1000
1200
1
10
100
Direct sowing30 days old seedlings45 days old seedlings60 days old seedlings
Gro
ss m
arg
in (
US
$ h
a-1
)
Fru
it Y
ield
(t
ha
-1)
Yield t per ha Gross margin per ha
35.5350.79
55.18
31.5041.34 44.33
85.06
127.21140.00
0
30
60
90
120
150
30 days old seedlings 45 days old seedlings 60 days old seedlings
% I
ncr
ease
in
yie
ld, gro
ss r
etu
rn &
marg
in
% Increase in Yield % Increase in gross return
GUIDELINES OF THE JOURNAL
CALL FOR PAPER
SAARC Agriculture Centre invites research and review papers to be published in the
SAARC Journal of Agriculture (SJA). It is half yearly journal, i.e. two issues in a
year, first issue at June and second at December of each year.
AIMS AND SCOPE OF THE JOURNAL
SAARC Journal of Agriculture is a half yearly peer-reviewed an open access online
journal that publishes original research articles, review papers and short
communications in the fields of agriculture, animal sciences, fisheries, natural
resources management and allied disciplines. It is an official journal of SAARC
Agriculture Centre (SAC). The scientists and researchers from SAARC countries are
encouraged to submit their research and review papers for publishing in this journal.
MODE OF SUBMISSION
Authors are requested to submit their manuscript to managing editor through
electronic submission process via email- [email protected]. Author
guidelines and other relevant information are available in the web link of
http://www.banglajol.info/index.php/SJA/index.
AUTHOR GUIDELINES
Terms of Submission
The journal welcomes the submission of manuscripts that meet the general criteria of
significance and scientific excellence. Papers must be submitted on the understanding
that they have not been published elsewhere and are not currently under
consideration by another journal published by any other publisher. The submitting
author is responsible for ensuring that the article's publication has been approved by
all the other co-authors. It is also the authors' responsibility to ensure that the articles
emanating from a particular institution are submitted with the approval of the
necessary institution. Only an acknowledgment from the editorial office confirms the
date of receipt. Further correspondence and proofs will be sent to the author(s) before
publication unless otherwise indicated. It is a condition of submission of a paper that
the authors permit editing of the paper for readability. All enquiries concerning the
publication of accepted papers should be addressed to [email protected].
Manuscript Preparation
Manuscripts text should be within 4000 words including references. Manuscript
should be written in English in Microsoft Word using font “Times New Roman” and
font size 12. The manuscript must be double-spaced. The double-spacing requirement

GUIDELINES OF THE JOURNAL 223
applies to all written material, including footnotes, references, tables, and figure
captions. Authors are requested for limited use of italics, bold, and superscripts and
subscripts, however, scientific names should be typed in italics. Word processing
features such as automatic footnoting and outlining must be avoided and if numbered
list is required to place in the manuscript enter the numbers and use appropriate tabs
and indents by hand instead of using automatic outlining.
Manuscripts should be arranged in the following order:
1. Title, Running title and byline.
2. Author–paper documentation (addresses/affiliations, email address of the
corresponding author, etc.).
3. Abstract.
4. Introduction.
5. Materials and Methods.
6. Results (sometimes combined with the discussion).
7. Discussion
8. Conclusion
9. Acknowledgments (optional).
10. References.
11. Figure captions, then tables, then the figures themselves.
Title
The title should represent the content of the article. The terms in the title should be
limited to those words that give significant information about the content of the
article. It is discouraged to start title with „Study on‟, „Effect of‟, and „Influence of.‟
An ideal title briefly identifies the subject, indicates the purpose of the study, and
introduces key concept. Scientific names may be given where necessary.
Authorship
There should be a cover page which includes title and all the names of authors. It is
encouraged to use full names of authors in bylines. The first person listed in the title
is considered as the senior author. An asterisk (*) follows the name of an author
denotes the corresponding author and is matched to the words “*Corresponding
author” at the bottom of the cover page. In this place addresses for all authors, email
address and phone number for the corresponding author are included.
Peer Review Policy
Manuscripts will be sent to reviewers via e-mail for review the manuscripts
electronically using track change mode. All manuscripts are subject to peer review
and are expected to meet standards of academic excellence. All articles are initially
224 GUIDELINES OF THE JOURNAL
screened by the managing editor/ associate editor solely or with the help of members
of editorial board. If the article is found to be in order as per the „Guidelines‟ and
there is adequate original information, it is sent to an expert for peer review. On the
contrary, the articles that contain inadequate information or are not conform to
„Guidelines‟ are rejected as such or returned to the author for revision. After the
article has been examined by the reviewer or followed by over viewer, it is also
suitably edited by a relevant member of Editorial Board. Both reviewer/ over viewer
and editorial board comments along with the manuscript are passed on to an author,
who resubmits it after incorporating suggestions and comments. The thoroughly
revised article will be checked by the editorial board and managing editor in the light
of review/ over viewer comments whether it would be worth for publishing or not.
The articles accepted for publication by editorial team are checked by a professional
editor for English language, uniformity and any other ambiguity before sending to the
press for composing. Proofs are mailed to the corresponding authors if needed and
are also gone through by the managing editor/ associate editor/ member of editorial
board.
Article Processing Charges
Articles are published in the SAARC Journal of Agriculture (SJA) free of charge.
Title and Authorship Information
The following information should be included
Paper title
Full author names
Full mailing addresses
Email addresses
Abstract
The manuscript should contain an abstract. The abstract should be self-contained and
citation-free, single paragraph and should not exceed 200/250 words. An ideal
abstract may contain background, rationale, objectives, materials & methods, results
and conclusions.
Keywords
Up to 10, in alphabetical order and separated by comma.
Introduction
This section should be succinct, with no subheadings.
Materials and Methods
This part should contain sufficient details so that all procedures can be reflected. It
can be divided into subsections if several methods are described. It should include
year and place of study.

GUIDELINES OF THE JOURNAL 225
Results
The content of this section should permit full comprehension of the data reported in
figures and tables.
Discussion
A comprehensive discussion section is required to justify the results. Normally a
comparison between your results and results from previous works should be given in
the Discussion. The Results and Discussion could be merged in a single section if
necessary.
Conclusions
This should clearly explain the main findings of the work highlighting its importance
and relevance.
Acknowledgments
Acknowledgments of people, grants, funds, etc. should be placed in a separate
section before the reference list. The names of funding organizations should be
written in full. Please check this section carefully before publication, as amendments
or corrections are not allowed after publication
SHORT COMMUNICATIONS
Short Communications typically describe research techniques, apparatus, and
observations which were not confirmed normally by repetition (preliminary findings
based on a single experiment). These articles are usually shorter than research papers
and there are no individual abstract, introduction, materials and methods, results and
discussion. Instead, they are written in continuous form without any sub headings.
References
1. In general, not more than 10-15 references would be required. Recent and
relevant not more than 20 years old references are encouraged.
2. There is no need to give references for standard procedures of soil and plant
analysis, as well as for routine statistical analysis; only the methodology may
be indicated.
3. All references quoted in the text must appear at the end of the article and vice-
versa. The spellings author‟s names and dates or years at the two places should
be carefully checked.
4. The references should include names of all authors, years (not within brackets),
full title of the article, full name of the journal (in italics) (no abbreviations),
volume number, issue number, and pages. For book or monograph, the name of
the publisher should also be given as well as its volume, edition and relevant
pages.
5. The references cited together in the text should be arranged chronologically.
The list of references should be arranged alphabetically on author‟s names, and

226 GUIDELINES OF THE JOURNAL
chronologically per author.
6. References from standard scientific journals should be preferred, while those
concerning unpublished data are generally to be avoided or mentioned as
„Personal communications‟ in the text. These need not be given in the reference
list. A few examples for correct citation of references in the list are given
below:
Journal Article
Buhler, D.D. and Mester, T.C.1991. Effect of tillage systems on the emergence depth of giant
and green foxtail. Weed Science, 39: 200-203
Mowla, G.M., Mondal, M.K., Islam, M.N. and Islam, M.T. 1992. Farm level water utilization
in an irrigation project. Bangladesh Rice Journal, 3 (1&2): 51-56
Rahman, M.M. 1990. Infestation and yield loss in chickpea due to pod borer in Bangladesh.
Bangladesh Journal of Agricultural Research, 15(2): 16-23
Book/Bulletin/Reports/Series
Bhuiyan, S.I. 1982. Irrigation system management research and selected methodological
issues. IRRI research paper series no 81. Los Banos, Manila
De Datta, S. K. 1981. Principles and practices of rice production. Los Banos, Manila
International Rice Research Institute. 2000. International rice trade: a review of 1999 and
prospects for 2000. International Rice Commission Newsletter, IRRI, Manila
Steel, R.G.D. and Torrie, J.H. 1980. Principles and procedures of statistics: A biometrical
approach. 2nd ed. McGraw-Hill, New York
Westerman, R.L. (ed.) 1990. Soil testing and plant analysis. 3rd ed. SSSA Book Ser. 3. SSSA,
Madison, WI
Chapter in a Book
David, H. and Easwaramoorthy. 1988. Physical resistance mechanisms in insect plant
interactions. p. 45-70. In T.N. Ananthakrishnan and A. Rahman (ed.), Dynamics of
insect plant interactions: Recent advances and future trends. Oxford and IBH
Publication, New Delhi
Johnson, D. W. and D. E. Todd. 1998. Effects of harvesting intensity on forest productivity
and soil carbon storage. p. 351–363. In R. Lal et al. (ed.) Management of carbon
sequestration in soils. Advances in Soil Science. CRC Press, Boca Raton, FL
Conference/Symposium/ Proceedings
Joshi, B.K. 2004. Crossing frequency and ancestors used in developing Nepalese mid and
high hill rice cultivars: Possible criteria for yield improvement and rice genes
conservation. p. 502-523. In Proc. National Conference on Science and Technology,
4th, Vol. 1. 23-26 Mar., 2004. NAST, Kathmandu, Nepal.
Ramanujam, S. (ed.) 1979. Proceedings of International Wheat Genet Symposia, 5th, New
Delhi, India. 23–28 Feb. 1978. Indian Soc. Genet. Plant Breeding, Indian Agric. Res.
Inst., New Delhi.

GUIDELINES OF THE JOURNAL 227
Dissertation
Singh, A.A. 2005. Weed management approaches and modeling crop weed interaction in
soybean. M. Sc. (Ag.) thesis. Tamil Nadu Agricultural Univ., Coimbatore.
Software and Software Documentation
Minitab. 1998. MINITAB 12. Minitab, State College, PA.
Online publication
Venugopal, D. 2000. Nilgiri tea in crisis: Causes consequences and possible solutions.
Retrieved October 11, 2000 from http://www.badaga.org.
Online journal article
Doerge, T.A. 2002. Variable-rate nitrogen management creates opportunities and challenges
for corn producers. Crop Manage. doi:10.1094/cm-2002-0905-01-RS.
Tables
1. Each table must be typed on a separate sheet (not to be included in the text) and
numbered consecutively in the same order as they mentioned in text.
2. The title should fully describe the contents of the table and explain any symbol
or abbreviation used in it as a footnote, using asterisks or small letters viz. a, b,
etc.
3. Tables should be self-explanatory, not very large (< 10 columns in portrait and
<14 columns in landscape formats respectively) and may cover space up to 20-
25% of the text.
4. Maximum size of table acceptable is that can be conveniently composed within
one full printed page of the journal. The large sized tables should be suitably
split into two or more small tables.
5. Standard abbreviations of units of different parameters should be added
between parentheses.
6. The data in the tables should be corrected to minimum place of decimal so as to
make it more meaningful.
7. Vertical lines should not be used to separate columns. Similarly, horizontal
lines should be used only where these are necessary, not in the body of the
article.
8. All tables should be tagged with the main body of the text i.e. after references.
Figures
1. Figures may be given in place of tables where a large number of values are
presented that can be interpreted through figures. In no case the same data
should be presented in both tables and figures.
228 GUIDELINES OF THE JOURNAL
2. Originals of the figures should be no larger than twice the final size, of good
quality and printed clearly in black on plain white paper or in color. The figures
may be sized to fit within the columns of the journal (8 cm width for single
column or 17 cm for columns i.e. full page).
3. Lines should be bold enough to allow the figure to be reduced to either single
or double column width in the journal.
4. Black and white photographs are also accepted if these are necessary to
improve the presentation and quality of the article.
Some useful hints
1. All scientific or technical names as well as all data and facts must be rechecked
carefully before submitting the manuscript.
2. Dates and years may be mentioned as 28 May 2007, 28 May to 7 June, and 28-
30 May instead of May 28, 2007, 28 May-7 June, and 28 to 30 May,
respectively.
3. Avoid numerals and abbreviations at the beginning of a sentence; spell out or
change the word order if necessary.
4. A comma may be used for data in thousands or more such as 10,000 or
2,30,000 etc. Alternatively, these data can also be presented as 10.0 or 230.0 if
a common expression such as „ x103‟ is used in tables or figures. Avoid
expressing data in „lakhs‟, instead use „thousand‟ or „million‟.
5. Only standard abbreviations should be used and these should invariably be
explained at first mention. Avoid use of self-made abbreviations such as
Rhizo., Azo., buta, isop. etc. for Rhizobium, Azotobacter, butachlor,
isoproturon, respectively.
6. For names of plant protection chemicals, the first letter of the name need not be
capitalized for scientific names but should be capitalized for trade names. All
the names should be checked very carefully.
7. Use of unnecessary abbreviations and treatment symbols such as T1, T2 etc.
under Materials and Methods or tables without actually using these under
Results and Discussion should be avoided.
8. All weights and measurements must be in SI or metric units. Use kg ha-1
, or t
ha-1
but not q ha-1
. Do not follow the style g/ha, mg/kg, mg/l, mg/g, ml/l or g
per ha, etc
9. Use % after numbers, not per-cent, e.g. 7%. In a series or range of
measurements, mention the units only at end, e.g. use 30, 100, 170 and 300C;
20 or 30% more instead of 30C, 100C, 170C and 300 °C; 20% or 30% more.
10. Numeral should be used whenever it is followed by a unit measure or its
abbreviations e.g. 1 g, 3 m, 5 h, 6 months etc. Otherwise, words should be used

GUIDELINES OF THE JOURNAL 229
for numbers one to nine and numerals for larger ones except in a series of
numbers when numerals should be used for all in the series.
11. For the composition of fertilizers, manures, crops or soil, the elemental forms
(K, P, Mg etc.) should be used and not the oxides.
12. Statistical analysis of data in the standard experimental design should be sound
and complete in itself with both ±SE (Standard Error of means) and CD
(Critical Difference) or LSD (Least Significant Difference) (P=0.05) values
given for comparison of treatment means in tables and figures.
13. Use multiplication sign (×) not a alphabet x for indicating multiplication,
crossing, etc


