199

SAARC JOURNAL OF AGRICULTURE (SJA) Volume 11, Issue 2, 2013
ISSN: 1682-8348 © SAC
The views expressed in this journal are those of the author(s) and do not necessarily reflect those of SAC
Subscription rates
Annual subscription (two issues)
Individuals : Tk. 200.00 for Bangladesh US $ 15.00 for SAARC countries
US $ 20.00 for other countries
Institutional : Tk. 250.00 for Bangladesh US $ 15.00 for SAARC countries
US $ 20.00 for other countries
Published by
SAARC Agriculture Centre (SAC) BARC Complex, Farmgate, Dhaka-1215, Bangladesh Phone: 880-2-8141665, 8141140; Fax: 880-2-9124596
E-mail: [email protected], Website: www.saarcagri.org
Editor in-Chief Dr. Abul Kalam Azad
Director, SAARC Agriculture Centre BARC Complex, Farmgate, Dhaka-1215, Bangladesh
Managing Editor Dr. Muhamad Musa
Senior Program Specialist, SAARC Agriculture Centre BARC Complex, Farmgate, Dhaka-1215, Bangladesh
Printed at Momin Offset Press, 274/2 Elephant Road, Dhaka-1205, Bangladesh
E-mail: [email protected]

ISSN: 1682-8348
SAARC JOURNAL OF AGRICULTURE
VOLUME 11 ISSUE 2 DECEMBER 2013
SAARC Agriculture Centre

EDITORIAL BOARD
Editor-in-Chief Dr. Abul Kalam Azad
Director, SAARC Agriculture Centre BARC Complex, Farmgate, Dhaka-1215, Bangladesh
Managing Editor
Dr. Muhammad Musa Senior Program Specialist, SAARC Agriculture Centre BARC Complex, Farmgate, Dhaka-1215, Bangladesh
Associate Editor
Dr. Md. Nure Alam Siddiky Senior Program Officer, SAARC Agriculture Centre BARC Complex, Farmgate, Dhaka-1215, Bangladesh
Email: [email protected]
Members
Bangladesh: Dr. M. A. Khaleque Mian Professor Department of Genetics and Plant Breeding Bangabandhu Sheikh Mujibur Rahman Agricultural University Gazipur, Bangladesh Dr. Md. Abdul Wahab Professor Department of Fisheries and Management Bangladesh Agricultural University Mymensingh, Bangladesh Dr. Md. Abdus Samad Professor Department of Veterinary Medicine Bangladesh Agricultural University Mymensingh, Bangladesh Dr. Khondker Shariful Islam Professor Department of Entomology Bangladesh Agricultural University Mymensingh-2202
Bhutan: Dr. Tayan Raj Gurung Senior Program Specialist (Natural Resource Management) SAARC Agriculture Centre BARC Complex, Farmgate Dhaka-1215, Bangladesh India: Dr. S. S. Raju Principal Scientist (Agricultural Economics) National Centre for Agricultural Economics and Policy Research, New Delhi, India Dr. D. K. Benbi National Professor, Department of Soil Science Punjab Agricultural University Ludhiana- 141 004, Punjab, India Dr. P. Ananda Kumar Principal Scientist (Plant Biotechnology/Genetic Engineering and GM crops) National Research Centre on Plant Biotechnology Lal Bahadur Shastri Building Pusa Campus, New Delhi, India

Dr. K. Giridhar Senior Scientist (Agronomy) National Institute of Animal Nutrition and Physiology Adugodi, Bangalore- 560 030 Karnataka, India Nepal: Dr. Bal Krishna Joshi Scientist (Genetics and Plant Breeding) National Agriculture Genetic Resources Centre (Gene bank) Nepal Agricultural Research Council Kathmandu, Nepal Pakistan: Dr. Fayyaz-ul-Hassan Professor Department of Agronomy Pir Mehr Ali Shah Arid Agriculture University Rawalpindi, Pakistan
Dr. Anjum Munir Director Crop Diseases Research Institute Department of Plant & Environmental Protection National Agricultural Research Centre Islamabad, Pakistan Sri Lanka: Dr. H. H. D. Fonseka Additional Director (Research) Horticultural Crop Research and Development Institute Department of Agriculture Gannoruwa, Peradeniya 20400, Sri Lanka Dr. Priyantha Weerasinghe Senior Scientist (Soil Science) Horticultural Crop Research and Development Institute Department of Agriculture Gannoruwa, Peradeniya 20400, Sri Lanka
CONTENTS
Title Page
PATHOGENESIS OF PULLORUM DISEASE (PD) IN CHICKENS BY LOCAL ISOLATE OF Salmonella pullorum IN BANGLADESH M.G. Haider, E.H. Chowdhury, S.M.K. Sharif and M.M. Hossain
1
SELECTION CRITERIA, YIELD RELATIONSHIP WITH COMPONENT TRAITS AND GROUPING OF TROPICAL JAPONICA, INDICA LINES AND DERIVED HYBRIDS OF RICE (Oryza sativa L.) Sandeep Kumar Soni, V.K. Yadav, N. Pratap, V.P. Bhadana and T.Ram
17
EFFECT OF ANTIMELANOTIC TREATMENT AND VACUUM PACKAGING ON MELANOSIS AND QUALITY CONDITION OF ICE STORED FARMED TIGER SHRIMP (Penaeus monodon) Vijay Kumar Reddy. S, Pradnya A. Shinde, Faisal R. Sofi Piyusha S. Shelar and S. B. Patange
33
EFFECT OF INTEGRATED DISEASE MANAGEMENT PACKAGES ON DISEASES INCIDENCE AND BULB YIELD OF ONION (Allium cepa L.) R. C. Gupta and R. P. Gupta
49
INTRA AND INTER CLUSTER STUDIES FOR QUANTITATIVE TRAITS IN GARLIC (Allium sativum L) R. K. Singh, B. K. Dubey and R. P. Gupta
61
EVALUATION OF PHYSIOLOGICAL AND ORGALEPTIC PROPERTIES OF MANGO CV. KESAR AS INFLUENCED BY IONIZING RADIATION AND STORAGE TEMPERATURE M. K. Yadav, N. L. Patel, B. R. Parmar and Dileswar Nayak
69
CHARACTERIZATION AND FIELD PERFORMANCE OF 15 STRAWBERRY GERMPLASM UNDER BANGLADESH CONDITIONS M. Moshiur Rahman, M. Mizanur Rahman, M. Mofazzal Hossain M. A. Khaleque Mian and Q. Abdul Khaliq
81
MOLECULAR DIVERSITY ANALYSIS IN POTATO (Solanum tuberosum L.) THROUGH RAPD MARKERS M.E. Hoque, H. Huq and N.J. Moon
95
IDENTIFICATION AND DISTRIBUTION OF SUGARCANE STEM BORER IN BANGLADESH Md. Ataur Rahman, Md. Shibly Noman, Md. Abdul Maleque, Md. Zinnatul Alam Sultana Afroz and M.K.A. Chowdhury
103
COMBINING ABILITY AND GENE ACTION IN INDIGENOUS BITTER GOURD (Momordica charantia L.) R.S. Verma, Narendra Pratap, D. K. Dubey and S.S. Singh
117

Title Page
NUTRIENT BUDGETING, ECONOMICS AND ENERGETICS OF COWPEA UNDER POTASSIUM AND PHOSPHORUS MANAGEMENT V. K. Choudhary and P. Suresh Kumar
129
EFFECT OF AZOTOBACTER ON GROWTH AND YIELD OF MAIZE Bandhu Raj Baral and Parbati Adhikari
141
HYDRO-PRIMING OF SEED IMPROVES THE WATER USE EFFICIENCY, GRAIN YIELD AND NET ECONOMIC RETURN OF WHEAT UNDER DIFFERENT MOISTURE REGIMES Raj Pal Meena, Sendhil R, S. C. Tripathi, Subhash Chander R. S. Chhokar and R. K. Sharma
149
GENETIC VARIABILITY AND CHARACTER ASSOCIATION IN DOLICHOS BEAN V. Magalingam, Mohammed Yassin and S. Ramesh Kumar
161
Short Communications
INTEGRATED NUTRIENT MANAGEMENT ON PRODUCTIVITY OF CARROT AND FERTILITY OF SOIL Vithwel and S. P. Kanaujia
173
MORPHOLOGICAL CHARACTERIZATION OF CAULIFLOWER VARIETIES/ CULTIVARS USING DUS CHARACTERS B. Singh, T. Chaubey, Aastik Jha, D.K. Upadhyay and S.D. Pandey
183
Guidelines for Authors 193

SAARC J. Agri., 11(2): 01-16 (2013)
PATHOGENESIS OF PULLORUM DISEASE (PD) IN CHICKENS BY LOCAL ISOLATE OF Salmonella pullorum
IN BANGLADESH
M.G. Haider1*, E.H. Chowdhury, S.M.K. Sharif2 and M.M. Hossain Department of Pathology, Faculty of Veterinary Science, BAU, Mymensingh-2202, Bangladesh
ABSTRACT
Pullorum disease is caused by Salmonella enterica subspecies enterica serovar Pullorum. Chickens are the natural host of this pathogen. In the present study experimental pathogenesis was studied. Twenty pullets (Salmonella pullorum seronegative) of Isa Brown breed of 18 weeks and 10 cocks (Salmonella pullorum seronegative) of RIR breed of 26 weeks of age were experimentally infected orally with 2 x10⁷ (CFU) dose of Salmonella Pullorum organisms and in control group no bacteria was given. Birds were observed for clinical signs, gross pathology, and reisolation of S. Pullorum from different organs and blood, histopathological study, detection of antibody levels and detection of S. Pullorum by PCR at different time intervals of experimental period. Four hens and one cock were randomly selected and sacrificed on 6 hr before inoculation and 1 wk, 2, 3 and 4 wks of post infection (PI). Samples were collected for bacteriological, serology and histopathological examinations. Liver, lungs, ovarian follicles and testis were also collected in 50% buffered- glycerol and preserved in - 800C for PCR. The clinical signs of infected hens were found at 72 hrs of PI, which continued up to 4 wks. 15.81% reduction in egg production was observed. The highest mean CFU ml-1 of Salmonella Pullorum from blood was 13.55x 10³ at 1 wk PI and the lowest was 13x 102 at 4 wk PI. Gross lesions were variable in different birds at different time interval. The highest gross lesion was 93.75% as swollen and congested spleen and the lowest lesion was 43.75% as pericarditis and necrotic foci/ nodules in the heart. Microscopically, the liver showed congestion; hepatitis with infiltration of inflammatory cells, and focal necrosis with nodule formation. The antibody titre increased gradually and the highest titer was at 4 wks PI in hens (4712±1851) than that of cock (3059±903). S. Pullorum was
* Corresponding author email: [email protected] 1 Department of Pathobiology, Bangabandhu Sheihk Mujibur Rahman Agricultural University Gazipur-1706, Bangladesh 2Avian Influenza Preparedness and Response Project, DLS, Dhaka-1215
Received: 22.05.2012

2 M.G. Haider et al
detected by PCR in all liver and lung samples from 1 wk to 4 wks PI. S. Pullorum was reisolated from male and female reproductive organs after experimental infection. S. Pullorum was detected by PCR at 1 wk to 3 wks PI from testicular tissues. S. Pullorum was also reisolated from 50% eggs of experimentally infected birds. Keywords: Chickens, pathogenesis, pullorum disease
INTRODUCTION Pullorum disease is one of the major constraints of poultry industries in Bangladesh (Das et al., 2005). Khan et al. (1998) recorded 12% morbidity and 75% mortality at the age of 5 wks in broiler breeder replacement pullets of Shaver Red Bro breed at Bangladesh Agricultural University Poultry Farm. They also recorded 100% morbidity and 75% mortality in local birds at the age of 8 wks with oral dose of 0.5 ml of 107 CFU of S. Pullorum. A total of 33,204 birds at different groups were investigated for Salmonella infection in Bangladesh. The morbidity and mortality rate due to salmonellosis among the birds were 4.90% and 1.83%, respectively. The mortality rate was highest (68.53%) in the early age groups (0-3 months). It decreased with age and was reduced to 0.25% in the twelve months and above age group (Khan et al., 1998).
PD causes great economic losses every year in poultry farms and it has also public health significance (Shivaprasad, 1997). The diseases can spread via meat and eggs. A few investigations on natural cases of Salmonella infections have been completed in Bangladesh using the methods of necropsy, histopathology and isolation of bacteria by culture; staining and sugar fermentation tests (Haider et al., 2008). However, no investigations have yet been performed by locally isolated Salmonella Pullorum organisms in respect of pathogenesis, pathology and vertical transmission in chickens. For this reason, the present study was taken for better diagnosis, prevention and control of this economically important pullorum disease in Bangladesh.
MATERIALS AND METHODS The proposed research work was conducted at the Department of Pathology,
Faculty of Veterinary Science, Bangladesh Agricultural University, Mymensingh during the period from March 2007 to March 2009. Experimental hens and cocks
A total of 40 pullets (Salmonella Pullorum seronegative) of Isa Brown breed of 18 wks were purchased from Nourish Hatchery Ltd., Shreepur, Gazipur, Bangladesh and 10 cocks (Salmonella Pullorum seronegative) of RIR breed of 26 weeks old were taken from BAU Poultry farm. The birds were vaccinated against MD, IBD, IB, Fowl Pox and ND obtained from intervet, Holland. The birds were divided into two groups in which one group remained as control.
PATHOGENESIS OF PULLORUM DISEASE (PD) IN CHICKENS 3
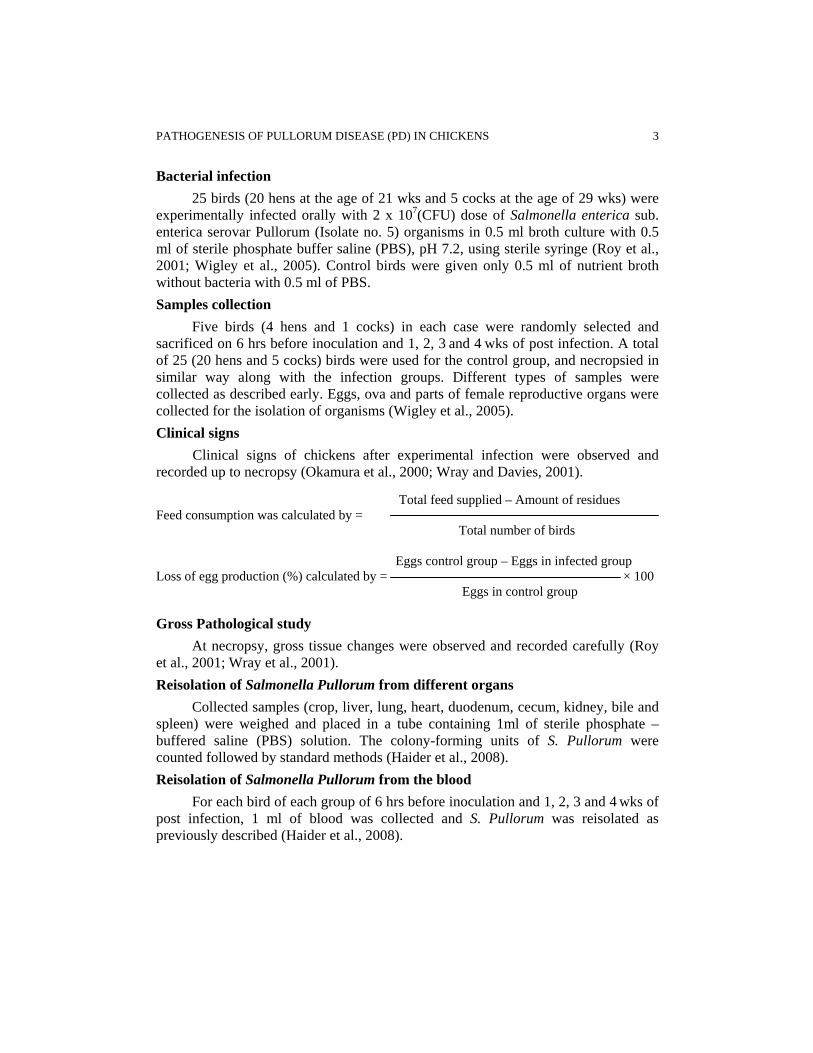
Bacterial infection 25 birds (20 hens at the age of 21 wks and 5 cocks at the age of 29 wks) were
experimentally infected orally with 2 x 10⁷(CFU) dose of Salmonella enterica sub. enterica serovar Pullorum (Isolate no. 5) organisms in 0.5 ml broth culture with 0.5 ml of sterile phosphate buffer saline (PBS), pH 7.2, using sterile syringe (Roy et al., 2001; Wigley et al., 2005). Control birds were given only 0.5 ml of nutrient broth without bacteria with 0.5 ml of PBS. Samples collection
Five birds (4 hens and 1 cocks) in each case were randomly selected and sacrificed on 6 hrs before inoculation and 1, 2, 3 and 4 wks of post infection. A total of 25 (20 hens and 5 cocks) birds were used for the control group, and necropsied in similar way along with the infection groups. Different types of samples were collected as described early. Eggs, ova and parts of female reproductive organs were collected for the isolation of organisms (Wigley et al., 2005). Clinical signs
Clinical signs of chickens after experimental infection were observed and recorded up to necropsy (Okamura et al., 2000; Wray and Davies, 2001).
Total feed supplied – Amount of residues Feed consumption was calculated by = Total number of birds Eggs control group – Eggs in infected group Loss of egg production (%) calculated by = × 100 Eggs in control group
Gross Pathological study At necropsy, gross tissue changes were observed and recorded carefully (Roy
et al., 2001; Wray et al., 2001). Reisolation of Salmonella Pullorum from different organs
Collected samples (crop, liver, lung, heart, duodenum, cecum, kidney, bile and spleen) were weighed and placed in a tube containing 1ml of sterile phosphate –buffered saline (PBS) solution. The colony-forming units of S. Pullorum were counted followed by standard methods (Haider et al., 2008). Reisolation of Salmonella Pullorum from the blood
For each bird of each group of 6 hrs before inoculation and 1, 2, 3 and 4 wks of post infection, 1 ml of blood was collected and S. Pullorum was reisolated as previously described (Haider et al., 2008).
4 M.G. Haider et al
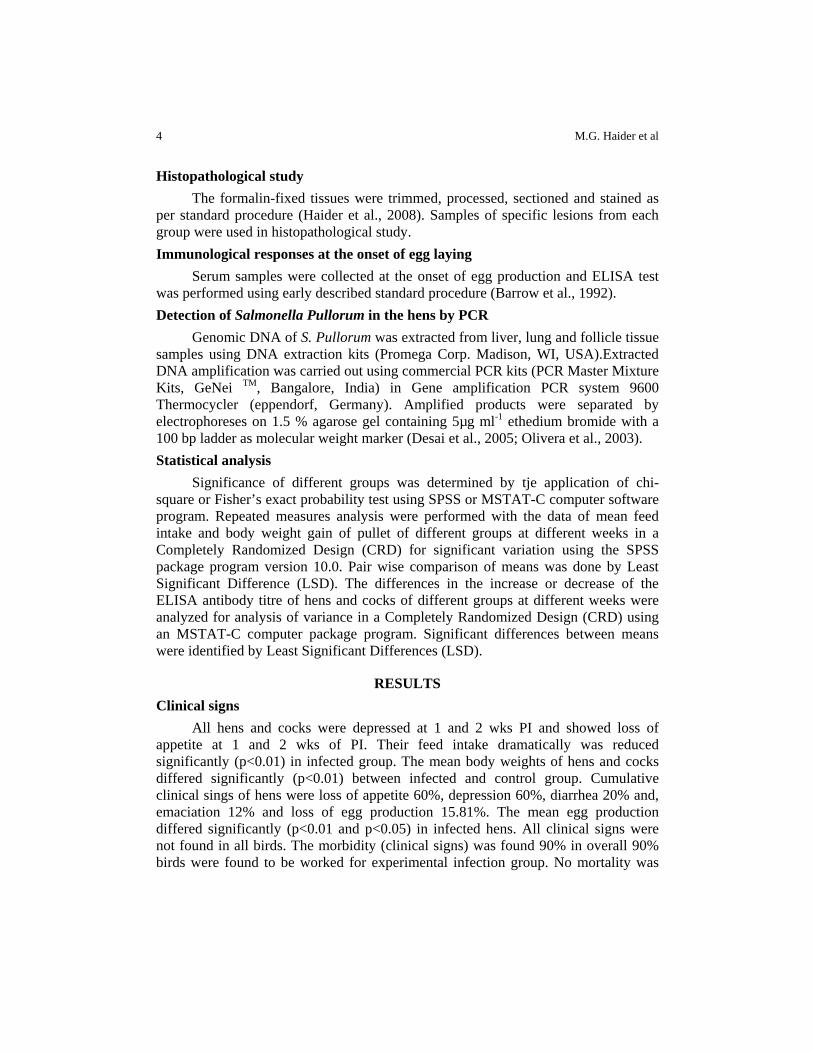
Histopathological study The formalin-fixed tissues were trimmed, processed, sectioned and stained as
per standard procedure (Haider et al., 2008). Samples of specific lesions from each group were used in histopathological study. Immunological responses at the onset of egg laying
Serum samples were collected at the onset of egg production and ELISA test was performed using early described standard procedure (Barrow et al., 1992). Detection of Salmonella Pullorum in the hens by PCR
Genomic DNA of S. Pullorum was extracted from liver, lung and follicle tissue samples using DNA extraction kits (Promega Corp. Madison, WI, USA).Extracted DNA amplification was carried out using commercial PCR kits (PCR Master Mixture Kits, GeNei TM, Bangalore, India) in Gene amplification PCR system 9600 Thermocycler (eppendorf, Germany). Amplified products were separated by electrophoreses on 1.5 % agarose gel containing 5µg ml-1 ethedium bromide with a 100 bp ladder as molecular weight marker (Desai et al., 2005; Olivera et al., 2003). Statistical analysis
Significance of different groups was determined by tje application of chi-square or Fisher’s exact probability test using SPSS or MSTAT-C computer software program. Repeated measures analysis were performed with the data of mean feed intake and body weight gain of pullet of different groups at different weeks in a Completely Randomized Design (CRD) for significant variation using the SPSS package program version 10.0. Pair wise comparison of means was done by Least Significant Difference (LSD). The differences in the increase or decrease of the ELISA antibody titre of hens and cocks of different groups at different weeks were analyzed for analysis of variance in a Completely Randomized Design (CRD) using an MSTAT-C computer package program. Significant differences between means were identified by Least Significant Differences (LSD).
RESULTS Clinical signs
All hens and cocks were depressed at 1 and 2 wks PI and showed loss of appetite at 1 and 2 wks of PI. Their feed intake dramatically was reduced significantly (p<0.01) in infected group. The mean body weights of hens and cocks differed significantly (p<0.01) between infected and control group. Cumulative clinical sings of hens were loss of appetite 60%, depression 60%, diarrhea 20% and, emaciation 12% and loss of egg production 15.81%. The mean egg production differed significantly (p<0.01 and p<0.05) in infected hens. All clinical signs were not found in all birds. The morbidity (clinical signs) was found 90% in overall 90% birds were found to be worked for experimental infection group. No mortality was
PATHOGENESIS OF PULLORUM DISEASE (PD) IN CHICKENS 5
found in infected group during study period. Recovery from clinical signs began at 2 wks PI. No clinical signs and mortality were seen in control group. Gross pathological study
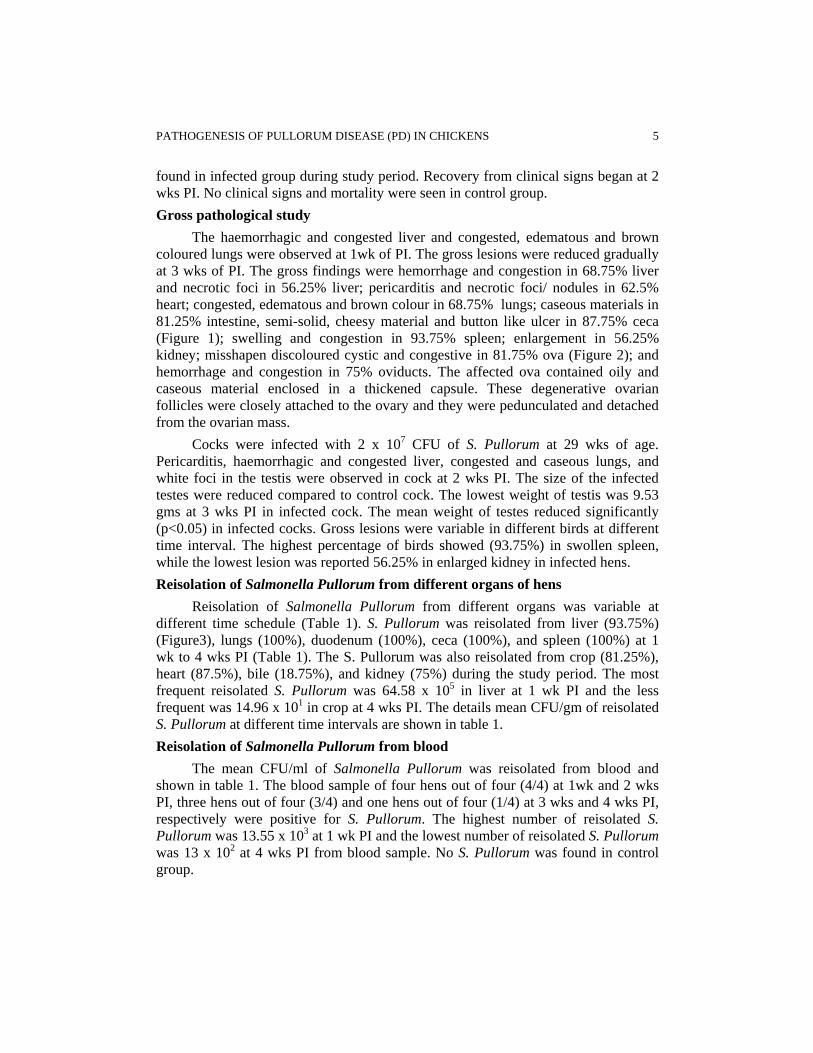
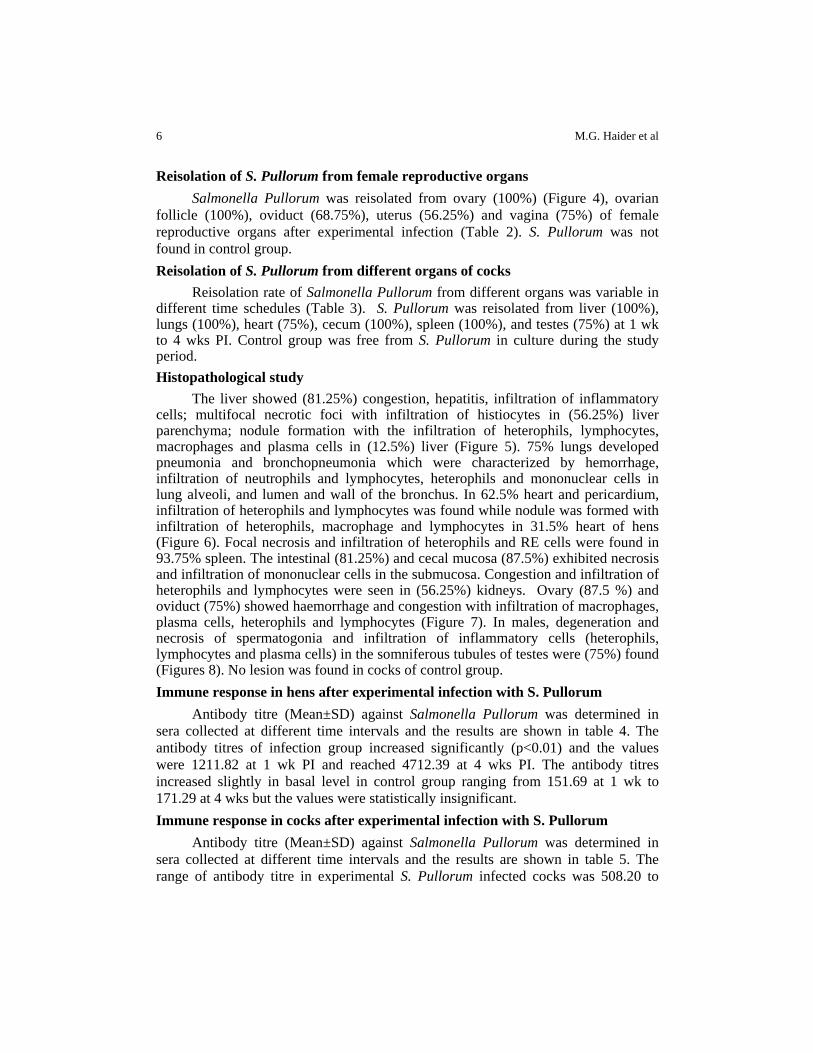
The haemorrhagic and congested liver and congested, edematous and brown coloured lungs were observed at 1wk of PI. The gross lesions were reduced gradually at 3 wks of PI. The gross findings were hemorrhage and congestion in 68.75% liver and necrotic foci in 56.25% liver; pericarditis and necrotic foci/ nodules in 62.5% heart; congested, edematous and brown colour in 68.75% lungs; caseous materials in 81.25% intestine, semi-solid, cheesy material and button like ulcer in 87.75% ceca (Figure 1); swelling and congestion in 93.75% spleen; enlargement in 56.25% kidney; misshapen discoloured cystic and congestive in 81.75% ova (Figure 2); and hemorrhage and congestion in 75% oviducts. The affected ova contained oily and caseous material enclosed in a thickened capsule. These degenerative ovarian follicles were closely attached to the ovary and they were pedunculated and detached from the ovarian mass.
Cocks were infected with 2 x 10⁷ CFU of S. Pullorum at 29 wks of age. Pericarditis, haemorrhagic and congested liver, congested and caseous lungs, and white foci in the testis were observed in cock at 2 wks PI. The size of the infected testes were reduced compared to control cock. The lowest weight of testis was 9.53 gms at 3 wks PI in infected cock. The mean weight of testes reduced significantly (p<0.05) in infected cocks. Gross lesions were variable in different birds at different time interval. The highest percentage of birds showed (93.75%) in swollen spleen, while the lowest lesion was reported 56.25% in enlarged kidney in infected hens. Reisolation of Salmonella Pullorum from different organs of hens
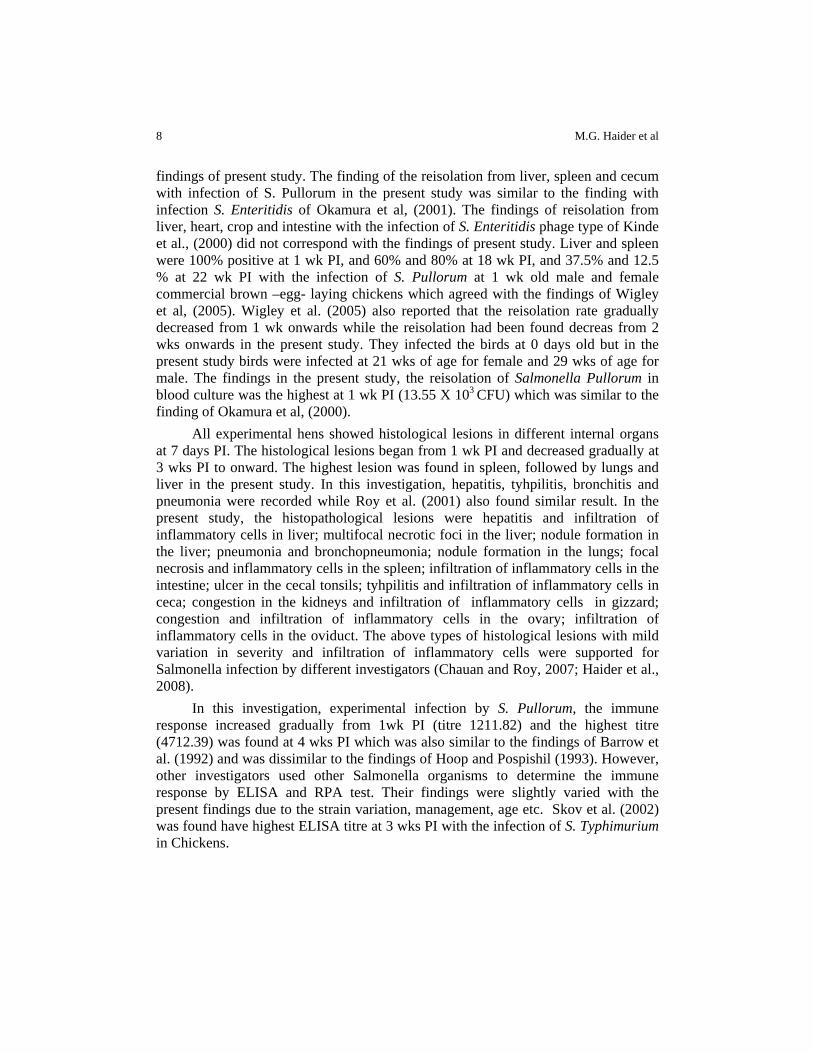
Reisolation of Salmonella Pullorum from different organs was variable at different time schedule (Table 1). S. Pullorum was reisolated from liver (93.75%) (Figure3), lungs (100%), duodenum (100%), ceca (100%), and spleen (100%) at 1 wk to 4 wks PI (Table 1). The S. Pullorum was also reisolated from crop (81.25%), heart (87.5%), bile (18.75%), and kidney (75%) during the study period. The most frequent reisolated S. Pullorum was 64.58 x 10⁵ in liver at 1 wk PI and the less frequent was 14.96 x 101 in crop at 4 wks PI. The details mean CFU/gm of reisolated S. Pullorum at different time intervals are shown in table 1. Reisolation of Salmonella Pullorum from blood
The mean CFU/ml of Salmonella Pullorum was reisolated from blood and shown in table 1. The blood sample of four hens out of four (4/4) at 1wk and 2 wks PI, three hens out of four (3/4) and one hens out of four (1/4) at 3 wks and 4 wks PI, respectively were positive for S. Pullorum. The highest number of reisolated S. Pullorum was 13.55 x 10³ at 1 wk PI and the lowest number of reisolated S. Pullorum was 13 x 102 at 4 wks PI from blood sample. No S. Pullorum was found in control group.
6 M.G. Haider et al
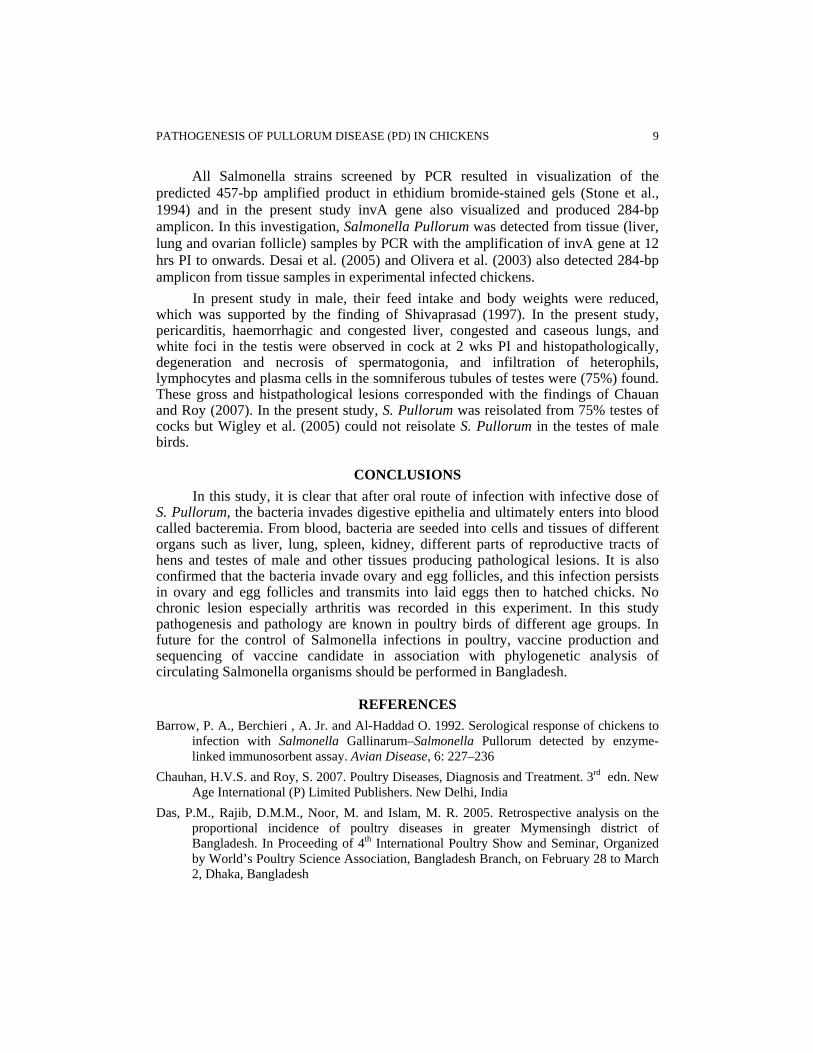
Reisolation of S. Pullorum from female reproductive organs Salmonella Pullorum was reisolated from ovary (100%) (Figure 4), ovarian
follicle (100%), oviduct (68.75%), uterus (56.25%) and vagina (75%) of female reproductive organs after experimental infection (Table 2). S. Pullorum was not found in control group. Reisolation of S. Pullorum from different organs of cocks
Reisolation rate of Salmonella Pullorum from different organs was variable in different time schedules (Table 3). S. Pullorum was reisolated from liver (100%), lungs (100%), heart (75%), cecum (100%), spleen (100%), and testes (75%) at 1 wk to 4 wks PI. Control group was free from S. Pullorum in culture during the study period. Histopathological study
The liver showed (81.25%) congestion, hepatitis, infiltration of inflammatory cells; multifocal necrotic foci with infiltration of histiocytes in (56.25%) liver parenchyma; nodule formation with the infiltration of heterophils, lymphocytes, macrophages and plasma cells in (12.5%) liver (Figure 5). 75% lungs developed pneumonia and bronchopneumonia which were characterized by hemorrhage, infiltration of neutrophils and lymphocytes, heterophils and mononuclear cells in lung alveoli, and lumen and wall of the bronchus. In 62.5% heart and pericardium, infiltration of heterophils and lymphocytes was found while nodule was formed with infiltration of heterophils, macrophage and lymphocytes in 31.5% heart of hens (Figure 6). Focal necrosis and infiltration of heterophils and RE cells were found in 93.75% spleen. The intestinal (81.25%) and cecal mucosa (87.5%) exhibited necrosis and infiltration of mononuclear cells in the submucosa. Congestion and infiltration of heterophils and lymphocytes were seen in (56.25%) kidneys. Ovary (87.5 %) and oviduct (75%) showed haemorrhage and congestion with infiltration of macrophages, plasma cells, heterophils and lymphocytes (Figure 7). In males, degeneration and necrosis of spermatogonia and infiltration of inflammatory cells (heterophils, lymphocytes and plasma cells) in the somniferous tubules of testes were (75%) found (Figures 8). No lesion was found in cocks of control group. Immune response in hens after experimental infection with S. Pullorum
Antibody titre (Mean±SD) against Salmonella Pullorum was determined in sera collected at different time intervals and the results are shown in table 4. The antibody titres of infection group increased significantly (p<0.01) and the values were 1211.82 at 1 wk PI and reached 4712.39 at 4 wks PI. The antibody titres increased slightly in basal level in control group ranging from 151.69 at 1 wk to 171.29 at 4 wks but the values were statistically insignificant. Immune response in cocks after experimental infection with S. Pullorum
Antibody titre (Mean±SD) against Salmonella Pullorum was determined in sera collected at different time intervals and the results are shown in table 5. The range of antibody titre in experimental S. Pullorum infected cocks was 508.20 to

PATHOGENESIS OF PULLORUM DISEASE (PD) IN CHICKENS 7
3059.27 at 1 wk PI to 4 wks PI. In control cocks, the antibody titre varied from 202.74 to 172.56 at similar time intervals with infected group, but these values were insignificant. The antibody titres of infection group increased significantly (p<0.01) while the antibody titres decreased gradually in basal level in control group. Detection of Salmonella Pullorum by PCR
Salmonella Pullorum was detected by PCR at different time intervals. No S. Pullorum was detected by PCR 6 hrs BI and control birds during study period. S. Pullorum was detected from four out of four liver (4/4), lungs (4/4) and ovarian follicle (4/4) from 1 wk to 3 wks PI in experimental group (Figure 9). Three liver (3/4), and four lungs (4/4) and four ovarian follicles (4/4) out of four at 4 wks PI were positive for S. Pullorum by PCR.
DISCUSSION In the present study, the oral route of experimental inoculation demonstrated
that S. Pullorum caused bacteremia and colonized in the liver, lungs, heart, kidney, intestine, spleen, and ceca of chicks to various degrees that corresponded with the findings of Wigley, et al. (2005). Clinical signs appeared in chicks after 12 hrs PI. These were loss of appetite, depression, drossiness, ruffled feather, and diarrhea, labored breathing, loss of body weight, and pest vent. The clinical findings in this study were similar to the natural/experimental findings of other authors (Shivaprasad, 1997; Wary and Davies, 2001). No mortality was found in adult birds in this study, which was similar to the findings of others (Roy et al., 2001; Wary and Davies 2001).Clinical signs of infected hens were limited to slight depression (100%) and diarrhoea (75%) that lasted for 3 days after inoculation with the field isolate of Salmonella Enteritidis phage type 4 (Kinde et al., 2000; Okamura et al., 2001).
The gross findings were haemorrhagic and congested liver, necrotic foci in the liver, pericarditis and necrotic foci/ nodules in heart, congested, edematous and brown colour lungs, semi-solid, cheesy material in ceca, unabsorbed and coagulated yolk, swollen and congested spleen and enlarged kidney. In this investigation, the gross findings described above corresponded with slight variation with the findings of other authors (Chauan and Roy, 2007).
In the present study, after experimental infection S. Pullorum was reisolated from different organs at 1 wk PI. But the maximum number of S. Pullorum was reisolated from 1wk to 2 wk PI. From 3 wk PI reisolation of S. Pullorum organisms reduced gradually. The findings of the reisolation and identification of Salmonella Pullorum organisms from different organs have also been described by other investigators (Hoop and Pospishil, 1993; Okamura et al., 2000).The highest percentage of reisolation of S. Pullorum from liver (100%), lungs (100%), cecum (100%) and spleen (100%) in hen at 7 days PI corresponded with the reisolation of Roy et al, (2001). Wigley et al. (2001) also recovered S. Pullorum after experimental inoculation at 7 days PI from all tissue samples, which did not correspond with the
8 M.G. Haider et al
findings of present study. The finding of the reisolation from liver, spleen and cecum with infection of S. Pullorum in the present study was similar to the finding with infection S. Enteritidis of Okamura et al, (2001). The findings of reisolation from liver, heart, crop and intestine with the infection of S. Enteritidis phage type of Kinde et al., (2000) did not correspond with the findings of present study. Liver and spleen were 100% positive at 1 wk PI, and 60% and 80% at 18 wk PI, and 37.5% and 12.5 % at 22 wk PI with the infection of S. Pullorum at 1 wk old male and female commercial brown –egg- laying chickens which agreed with the findings of Wigley et al, (2005). Wigley et al. (2005) also reported that the reisolation rate gradually decreased from 1 wk onwards while the reisolation had been found decreas from 2 wks onwards in the present study. They infected the birds at 0 days old but in the present study birds were infected at 21 wks of age for female and 29 wks of age for male. The findings in the present study, the reisolation of Salmonella Pullorum in blood culture was the highest at 1 wk PI (13.55 X 10³ CFU) which was similar to the finding of Okamura et al, (2000).
All experimental hens showed histological lesions in different internal organs at 7 days PI. The histological lesions began from 1 wk PI and decreased gradually at 3 wks PI to onward. The highest lesion was found in spleen, followed by lungs and liver in the present study. In this investigation, hepatitis, tyhpilitis, bronchitis and pneumonia were recorded while Roy et al. (2001) also found similar result. In the present study, the histopathological lesions were hepatitis and infiltration of inflammatory cells in liver; multifocal necrotic foci in the liver; nodule formation in the liver; pneumonia and bronchopneumonia; nodule formation in the lungs; focal necrosis and inflammatory cells in the spleen; infiltration of inflammatory cells in the intestine; ulcer in the cecal tonsils; tyhpilitis and infiltration of inflammatory cells in ceca; congestion in the kidneys and infiltration of inflammatory cells in gizzard; congestion and infiltration of inflammatory cells in the ovary; infiltration of inflammatory cells in the oviduct. The above types of histological lesions with mild variation in severity and infiltration of inflammatory cells were supported for Salmonella infection by different investigators (Chauan and Roy, 2007; Haider et al., 2008).
In this investigation, experimental infection by S. Pullorum, the immune response increased gradually from 1wk PI (titre 1211.82) and the highest titre (4712.39) was found at 4 wks PI which was also similar to the findings of Barrow et al. (1992) and was dissimilar to the findings of Hoop and Pospishil (1993). However, other investigators used other Salmonella organisms to determine the immune response by ELISA and RPA test. Their findings were slightly varied with the present findings due to the strain variation, management, age etc. Skov et al. (2002) was found have highest ELISA titre at 3 wks PI with the infection of S. Typhimurium in Chickens.
PATHOGENESIS OF PULLORUM DISEASE (PD) IN CHICKENS 9
All Salmonella strains screened by PCR resulted in visualization of the predicted 457-bp amplified product in ethidium bromide-stained gels (Stone et al., 1994) and in the present study invA gene also visualized and produced 284-bp amplicon. In this investigation, Salmonella Pullorum was detected from tissue (liver, lung and ovarian follicle) samples by PCR with the amplification of invA gene at 12 hrs PI to onwards. Desai et al. (2005) and Olivera et al. (2003) also detected 284-bp amplicon from tissue samples in experimental infected chickens.
In present study in male, their feed intake and body weights were reduced, which was supported by the finding of Shivaprasad (1997). In the present study, pericarditis, haemorrhagic and congested liver, congested and caseous lungs, and white foci in the testis were observed in cock at 2 wks PI and histopathologically, degeneration and necrosis of spermatogonia, and infiltration of heterophils, lymphocytes and plasma cells in the somniferous tubules of testes were (75%) found. These gross and histpathological lesions corresponded with the findings of Chauan and Roy (2007). In the present study, S. Pullorum was reisolated from 75% testes of cocks but Wigley et al. (2005) could not reisolate S. Pullorum in the testes of male birds.
CONCLUSIONS In this study, it is clear that after oral route of infection with infective dose of
S. Pullorum, the bacteria invades digestive epithelia and ultimately enters into blood called bacteremia. From blood, bacteria are seeded into cells and tissues of different organs such as liver, lung, spleen, kidney, different parts of reproductive tracts of hens and testes of male and other tissues producing pathological lesions. It is also confirmed that the bacteria invade ovary and egg follicles, and this infection persists in ovary and egg follicles and transmits into laid eggs then to hatched chicks. No chronic lesion especially arthritis was recorded in this experiment. In this study pathogenesis and pathology are known in poultry birds of different age groups. In future for the control of Salmonella infections in poultry, vaccine production and sequencing of vaccine candidate in association with phylogenetic analysis of circulating Salmonella organisms should be performed in Bangladesh.
REFERENCES Barrow, P. A., Berchieri , A. Jr. and Al-Haddad O. 1992. Serological response of chickens to
infection with Salmonella Gallinarum–Salmonella Pullorum detected by enzyme-linked immunosorbent assay. Avian Disease, 6: 227–236
Chauhan, H.V.S. and Roy, S. 2007. Poultry Diseases, Diagnosis and Treatment. 3rd edn. New Age International (P) Limited Publishers. New Delhi, India
Das, P.M., Rajib, D.M.M., Noor, M. and Islam, M. R. 2005. Retrospective analysis on the proportional incidence of poultry diseases in greater Mymensingh district of Bangladesh. In Proceeding of 4th International Poultry Show and Seminar, Organized by World’s Poultry Science Association, Bangladesh Branch, on February 28 to March 2, Dhaka, Bangladesh
10 M.G. Haider et al
Desai, A.R., Shah, D.H., Shringi, S., Mi-Jin Lee, Ying- Hua Li, Mae- Rim Cho, Jin-Ho Park, Seong-akug Eo, John-Hwa Lee and Joon-Seok Chae. 2005. An Allele-Specific PCR Assay for the Rapid and Serotype- Specific Detection of Salmonella Pullorum. Avian Disease, 49: 558-561
Haider, M.G., Chowdhury, E.H., Khan, M.A.H.N.A., Hossain, M.T., Rahman, M.S., Song, H.J. and Hossain, M.M. 2008. Experimental pathogenesis of pullorum disease with local isolate of Salmonella enterica serovar. enterica subspecies Pullorum in pullets in Bangladesh. Korean Journal of Poultry Science, 35 (4): 341-350
Hoop, R.K. and Pospishil, A.1993. Bacteriological, serological, histological and immunological findings in laying hens with naturally acquired Salmonella Enteritidis phage type 4 infections. The Veterinary Record, 139:391-393
Khan, M.A.H.N.A., Bari, A.S.M., Islam, M.R., Das, P.M. and Ali, MY. 1998. Pullorum disease in semi mature chickens and its experimental pathology. Bangladesh Veterinary Journal, 32: 124-128
Kinde, H., Shivaprasad, H.L., Daft, B.M., Read, D.H., Ardans, A., Breitmeyer, R., Rajashekara, G., Nagaraja, K.V. and Garder, I.A. 2000. Pathologic and Bacteriologic Findings in 27-week- old Commercial Laying Hens Experimentally Infected with Salmonella enteritidis, Phage Type 4. Avian Disease, 44: 239-248
Okamura, M., Kamijima, Y., Miyamoto, T., Tani, H., Sasai, K. and Baba, E. 2000. Differences Among Six Salmonella Serovars in Abilities to Colonize Reproductive Organs and to Contaminate Eggs in Laying Hens. Avian Diseases, 45: 61-69
Olivera, S.D., Roclenbuisch, C.R., Ce,M.C., Rocha, S.L.S. and Canal, C.W. 2003. Evaluation of selective and non-selective enrichment PCR procedures for Salmonella detection. Letters in Applied Microbiology, 36: 217-221
Roy, H., Dhillion, A.S., Shivaprasad H.L., Schaberg D.M., Bandli D. and Johnson S. 2001. Pathogenicity of Different Serogroups of Avain salmonellae in Specific- Pathogen-Free Chickens. Avian Disease, 45: 922-937
Shivoprasad, H.L. 1997. Pullorum disease Fowl typhoid. In Calnek, W.B. (ed.), Diseases in Poultry. Iowa State University Press, Iowa State, USA
Skov, M.N., Feld, N.C., Carstensen, B. and Madsen, M. 2002. The serological response to Salmonella Enteritidis and Salmonella typhimurium in experimentally infected chickens, followed by an indirect lipopolysaccharide enzyme immunosorbent assay and bacteriologic examinations through a one -year period. Avian Disease, 46:265-273
Solano, C., Galindo, J., Sesna, B., Aluarrez, M., Solsona, M.J. and Ganazo, C.N. 2000. Enzyme linked immunosorbent assay with a Salmonella enteritidis gene for differentiating infected from vaccinated poultry. The Veterinary Record, 31: 491-497
Stone, G.G., Oberst, R.D., Hays, M.P., McVey, S. and Chengappa, M.M. 1994. Detection of Salmonella serovars from clinical samples by enrichment broth cultivation-PCR procedure. Journal of Clinical Microbiology, 32: 1742-1749
Wary, C. and Davies, R.H. 2001. Pullorum disease. In Jordan, F., Pattison, M., Alexander, D. and Faragher, T. (eds.), Poultry Diseases. S.B. Saunders, Philadelphia, USA
Wigley, P., Hulme, S.D., Powers, C., Beal, R.K., Berchierim, Jr.A., Smith, A. and Barrow, P. 2005. Infection of the Reproductive Tract and Eggs with Salmonella enterica Serovar Pullorum in the Chicken is Associated with Suppression of Cellular Immunity at Sexual Maturity. Infection and Immunity, 73: 2986-2990

PATHOGENESIS OF PULLORUM DISEASE (PD) IN CHICKENS 11
Table 1: Mean CFU/gm of isolated and identified of Salmonella Pullorum from different organs of experimentally infected hens
Organs BI 6 hr PI 1 wk PI 2 wk PI 3 wk PI 4 wk 1. Crop 00
(0/4) 58.72 x 10⁴
(4/4) 25.81 x 10³
(4/4) 25.68 x 10²
(3/4) 14.96x 101 (2/4)
2. Liver 00 (0/4)
64.58 x 10⁵
(4/4) 65.79 x 10⁴
(4/4) 55.98 x 10³
(4/4) 44.28x 10³ (3/4)
3. Heart 00 (0/4)
21.34 x 10³
(4/4) 40.16 x 10³
(4/4) 48.66 x 10²
(3/4) 14.71x 10² (3/4)
4. Lungs 00 (0/4)
44.85 x10⁴ (4/4)
39.02.2x104
(4/4) 66.95 x10³
(4/4) 24.26 x10² (4/4)
5. Duodenum 00 (0/4)
20.98 x10⁵ (4/4)
47.51x10⁴
(4/4) 36.54 x10⁴
(4/4) 43.56 x10³ (4/4)
6. Cecum 00 (0/4)
81.11 x 10⁵
(4/4) 73.93 x 10⁵
(4/4) 64.47 x 10⁴
(4/4) 80.77x 10³ (4/4)
7. Bile 00 (0/4)
47.88 x 10³
(2/4) 14.29x 10³
(1/4) 00
(0/4) 00 (0/4)
8. Kidney 00 (0/4)
39.72 x 10³
(4/4) 13.58 x 10³
(4/4) 18.84 x10²
(2/4) 19.26 x101
(2/4) 9. Spleen 00
(0/4) 89.25 x 10⁵
(4/4) 93.34 x10⁵ (4/4)
62.21 x10³ (4/4)
51.25 x10³ (4/4)
10. Blood 00 (0/4)
13.55 x 10³
(4/4) 8.43 x 10³
(4/4) 33.76x 10²
(3/4) 13 x 102 (1/4)
Note: Percentage calculated from 1 wk PI to 4 wks PI.
Table 2: Mean CFU/gm of isolated and identified Salmonella Pullorum from female reproductive organs in experimentally infected hens
Organs BI 6 hr PI 1 wk PI 2 wk PI 3 wk PI 4 wk Total (%)
1.Ovary 00 (0/4)
41.05 x 10⁵
(4/4) 64.6 x 10⁴
(4/4) 33.05 x 10³
(4/4) 40.93x 10⁴ (4/4)
100
2.Ovarian follicle
00 (0/4)
67.75 x 10⁴
(4/4) 47.61 x 10⁴
(4/4) 31.67 x 10³
(4/4) 49.5 x 10³ (4/4)
100
3. Oviduct 00 (0/4)
39.65 x 10⁴
(4/4) 25.17 x 10³
(3/4) 40.67 x 10³
(2/4) 27.54x 10³ (2/4)
68.75
4. Uterus 00 (0/4)
40.11 x10⁵ (3/4)
14.36x10³
(3/4) 19.16 x10³
(2/4) 30.81 x10³ (1/4)
56.25
5. Vagina 00 (0/4)
51.15 x 10³
(4/4) 07.2 x 10³
(4/4) 43.12 x 10³
(3/4) 13.13x 10³ (1/4)
75
Note: Percentage calculated from 1 wk PI to 4 wks PI
12 M.G. Haider et al
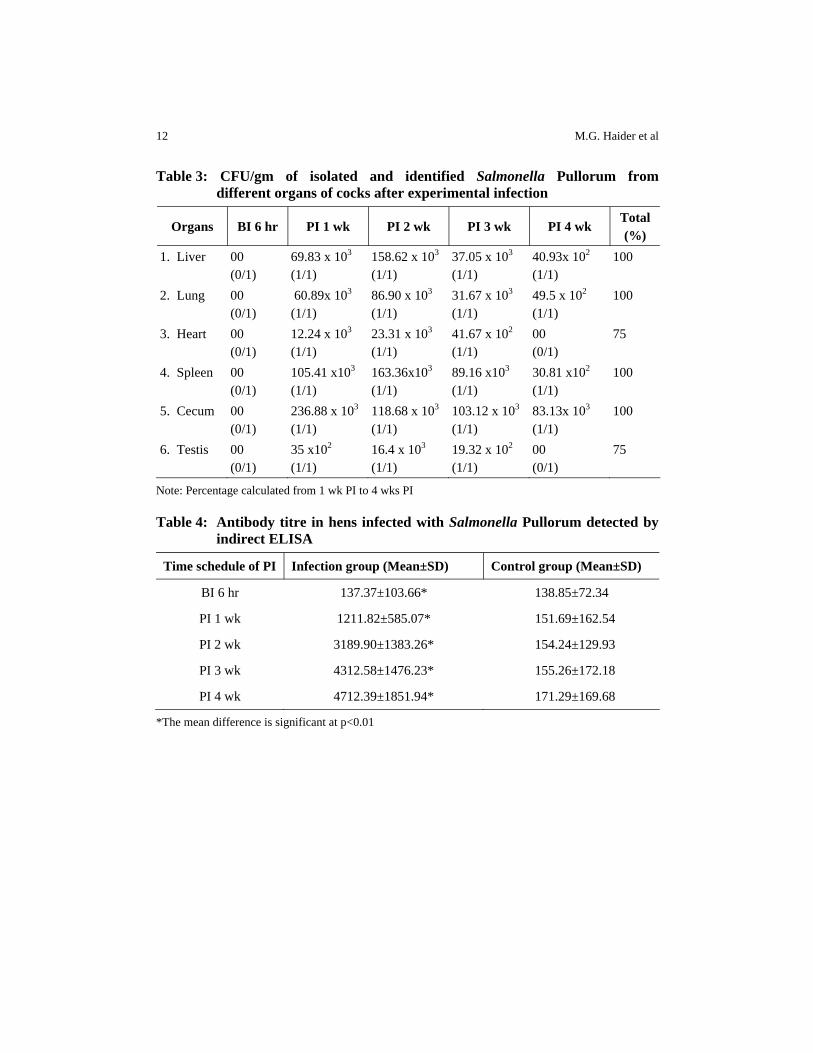
Table 3: CFU/gm of isolated and identified Salmonella Pullorum from different organs of cocks after experimental infection
Organs BI 6 hr PI 1 wk PI 2 wk PI 3 wk PI 4 wk Total (%)
1. Liver 00 (0/1)
69.83 x 10³
(1/1) 158.62 x 10³
(1/1) 37.05 x 10³
(1/1) 40.93x 10² (1/1)
100
2. Lung 00 (0/1)
60.89x 10³
(1/1) 86.90 x 10³
(1/1) 31.67 x 10³
(1/1) 49.5 x 10² (1/1)
100
3. Heart 00 (0/1)
12.24 x 10³
(1/1) 23.31 x 10³
(1/1) 41.67 x 10²
(1/1) 00 (0/1)
75
4. Spleen 00 (0/1)
105.41 x10³ (1/1)
163.36x10³
(1/1) 89.16 x10³
(1/1) 30.81 x10² (1/1)
100
5. Cecum 00 (0/1)
236.88 x 10³
(1/1) 118.68 x 10³
(1/1) 103.12 x 10³
(1/1) 83.13x 10³ (1/1)
100
6. Testis 00 (0/1)
35 x102
(1/1) 16.4 x 10³
(1/1) 19.32 x 10²
(1/1) 00 (0/1)
75
Note: Percentage calculated from 1 wk PI to 4 wks PI
Table 4: Antibody titre in hens infected with Salmonella Pullorum detected by indirect ELISA
Time schedule of PI Infection group (Mean±SD) Control group (Mean±SD)
BI 6 hr 137.37±103.66* 138.85±72.34
PI 1 wk 1211.82±585.07* 151.69±162.54
PI 2 wk 3189.90±1383.26* 154.24±129.93
PI 3 wk 4312.58±1476.23* 155.26±172.18
PI 4 wk 4712.39±1851.94* 171.29±169.68
*The mean difference is significant at p<0.01
PATHOGENESIS OF PULLORUM DISEASE (PD) IN CHICKENS 13
Table 5: Antibody titre in cocks infected with Salmonella Pullorum detected by indirect ELISA
Time schedule of PI Infection group (Mean±SD) Control group (Mean±SD) BI 6 hr 182.24±56.54* 192.05±38.62 PI 1 wk 508.20±98.77* 202.74±45.75 PI 2 wk 1167.61±162.39* 193.87±143.72 PI 3 wk 2114.94±612.03* 189.99±51.63 PI 4 wk 3059.27±903.40* 172.56±200.45
*The mean difference is significant at p<0.01
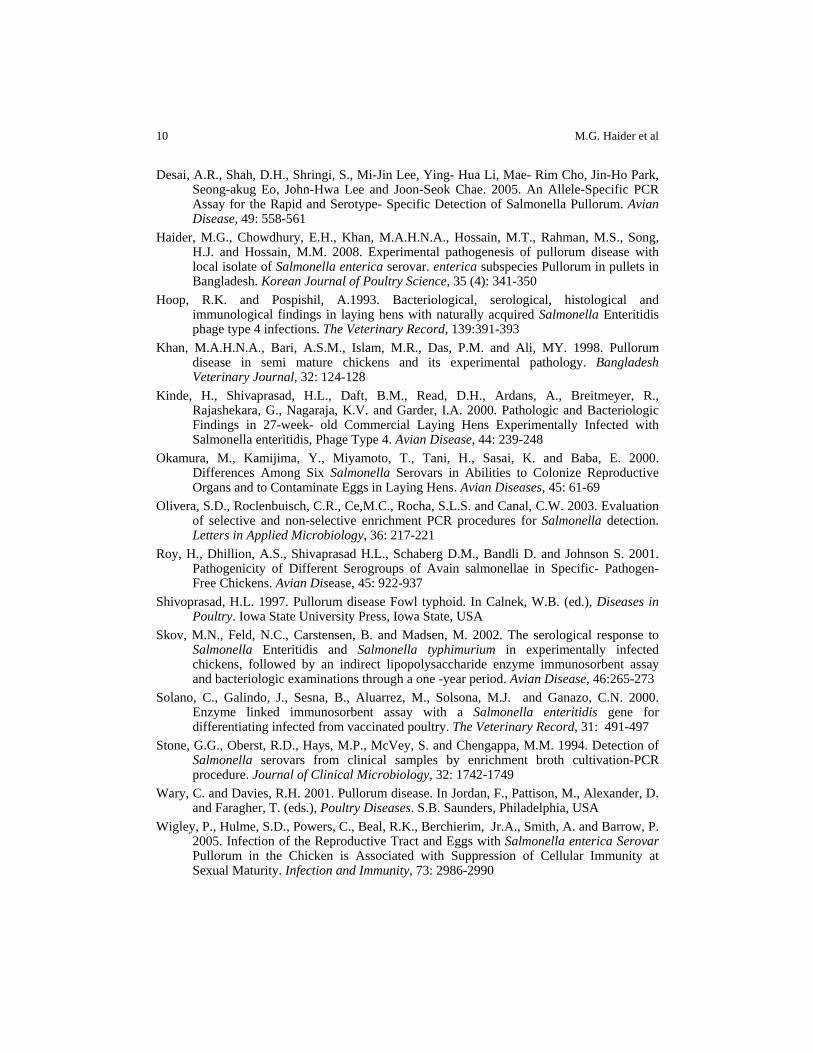
Figure 1: Semi-solid, cheesy material in ceca and button like ulcer at 3 wks PI with experimental infection of S. Pullorum.
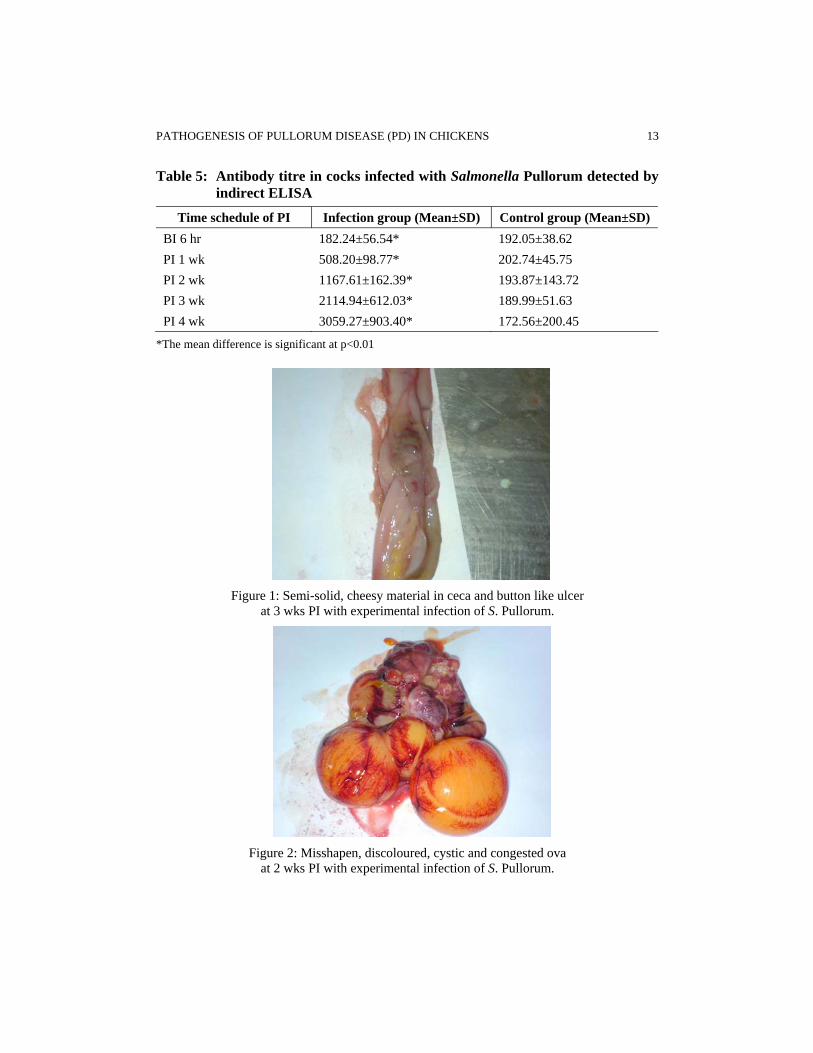
Figure 2: Misshapen, discoloured, cystic and congested ova at 2 wks PI with experimental infection of S. Pullorum.

14 M.G. Haider et al
Figure 3: Experimentally infected with S. Pullorum at 1wk
PI showing 76 CFU of S. Pullorum/gm of tissue of liver at 105 dilution.
Figure 4: Experimentally infected with S. Pullorum at 1wk PI showing 86 CFU of S. Pullorum/gm of tissue of ovary at 105 dilution
Figure 5: Nodule formation with the infiltration of heterophils, lymphocytes, macrophages and plasma cells in liver in experimental PD in hens at 3 wks PI (H&E, X 333).

PATHOGENESIS OF PULLORUM DISEASE (PD) IN CHICKENS 15
Figure 6: Nodule is formed with infiltration of heterophils macrophage and lymphocytes in heart in experimental PD in hens at 2 wks PI (H&E, X 333).
Figure 7: Infiltration of macrophages, heterophils and lymphocytes in the uterus and necrosis
in the epithelial cells of the gland in experimental PD in hens at 2 wks PI (H&E, X 333).
Figure 8: Degeneration and necrosis of spermatogonia and infiltration of heterophils, lymphocytes and plasma cells are found in the somniferous tubules of testes in experimental
PD in cock at 3 wks PI (H&E, X 83).

16 M.G. Haider et al
Figure 9: Electrophoresis for Salmonella Pullorum at 1wk of PI on 1.5% agarose gel showing band from lane 1 to 4 liver, from lane 5 to 8 lungs and from lane 9 to 12 ovarian follicle samples, lane p showing the 284-bp PCR products as a positive control and lane C showing no band as a negative control after amplification with the primer 139 (F) and 141 (R) targeting the gene invA for Salmonella Pullorum and lane M showing DNA molecular mass marker (100-bp ladder).
1 2 3 4 5 6 C M 7 8 9 10 11 12 P
284 bp
SAARC J. Agri., 11(2): 17-32 (2013)
SELECTION CRITERIA, YIELD RELATIONSHIP WITH COMPONENT TRAITS AND GROUPING OF TROPICAL
JAPONICA, INDICA LINES AND DERIVED HYBRIDS OF RICE (Oryza sativa L.)
Sandeep Kumar Soni*, V.K. Yadav, N. Pratap1, V.P. Bhadana2 and T.Ram2 Department of Genetics and Plant Breeding, C.S.A. University of Agriculture and Technology,
Kanpur-208 002 (UP) India
ABSTRACT
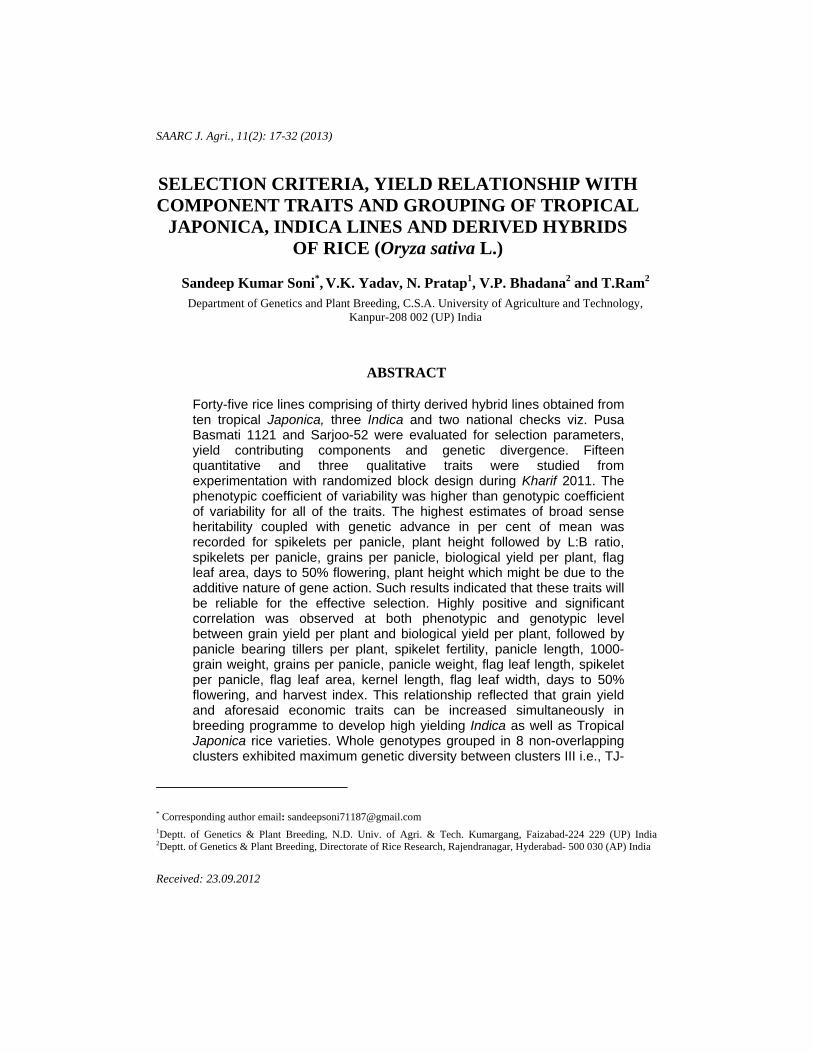
Forty-five rice lines comprising of thirty derived hybrid lines obtained from ten tropical Japonica, three Indica and two national checks viz. Pusa Basmati 1121 and Sarjoo-52 were evaluated for selection parameters, yield contributing components and genetic divergence. Fifteen quantitative and three qualitative traits were studied from experimentation with randomized block design during Kharif 2011. The phenotypic coefficient of variability was higher than genotypic coefficient of variability for all of the traits. The highest estimates of broad sense heritability coupled with genetic advance in per cent of mean was recorded for spikelets per panicle, plant height followed by L:B ratio, spikelets per panicle, grains per panicle, biological yield per plant, flag leaf area, days to 50% flowering, plant height which might be due to the additive nature of gene action. Such results indicated that these traits will be reliable for the effective selection. Highly positive and significant correlation was observed at both phenotypic and genotypic level between grain yield per plant and biological yield per plant, followed by panicle bearing tillers per plant, spikelet fertility, panicle length, 1000-grain weight, grains per panicle, panicle weight, flag leaf length, spikelet per panicle, flag leaf area, kernel length, flag leaf width, days to 50% flowering, and harvest index. This relationship reflected that grain yield and aforesaid economic traits can be increased simultaneously in breeding programme to develop high yielding Indica as well as Tropical Japonica rice varieties. Whole genotypes grouped in 8 non-overlapping clusters exhibited maximum genetic diversity between clusters III i.e., TJ-
* Corresponding author email: [email protected]
1Deptt. of Genetics & Plant Breeding, N.D. Univ. of Agri. & Tech. Kumargang, Faizabad-224 229 (UP) India
2Deptt. of Genetics & Plant Breeding, Directorate of Rice Research, Rajendranagar, Hyderabad- 500 030 (AP) India
Received: 23.09.2012

18 Sandeep Kumar Soni et al
64897 × NDR-359, TJ-64897 × CSR36, TJ-64897 × PB-1 and VIII i.e., TJ-11010 × NDR359, TJ-11010 × PB-1, TJ-16081 × NDR-359, TJ-16081 × PB-1. These clusters also stand for early days to flowering, short slender, second highest harvest index and panicle bearing tillers per plant, spikelets per panicle, grains per panicle, spikelet fertility, 1000-grain weight, long bold slender, biological yield per plant, and grain yield per plant. These genotypes showing higher mean performance for aforesaid traits can be exploited for enhancing hybrid vigour of desired New Plant Type with higher number of panicle bearing tillers per plant, spikelet per panicle and grains per spike in Indica as well as Tropical Japonica rice varieties for achieving higher yield. Keywords: Clustering pattern, Correlations, Genetic diversity, Indica, Japonica, New Plant Type, Path analysis and Selection parameters.
INTRODUCTION Rice as lifeline for a large segment of the world’s population, more than 91%
of world’s rice is produced in Asia and provides 20% of the per capita energy and 13% of the per capita protein worldwide. However, in Asia rice contributes about 35% of the energy and 28% of the protein. In India it plays an integral role for 65 per cent population, food security, income generation, employments and foreign currencies gains for the nation. India has the largest area, about 4.5 × 10⁷ ha, under rice in the world and produced 9.5 × 10⁹ tone in year 2010-11. In accordance with current population growth, rice requirement by 2025 is estimated to be around 1.3 × 10¹⁰ tone (Anonymous 2010). Hence it is very crucial to develop high yielding varieties. It is cultivated on foot hills of the Himalaya in the North Western parts of Indian sub-continent comprising the states of Haryana, Punjab, Uttaranchal, Uttar Pradesh, Himachal Pradesh and Delhi. Current Indica rice varieties have higher yield potential of 100 t ha-1 with harvest index of 0.4-0.5 under tropical conditions.
The hybrid vigour between Indica and Japonica inter-subspecies can be used to improve the yield of Indica and Japonica hybrids by introducing parts of the Indica genomic segments into the Japonica background or vice versa, after several generations of backcrossing. For developing New Plant Type with increased vigour, Indica and Japonica materials are an effective source of breeding for the many pleasing and desirable traits such as less and productive tillers, canopy structure, increased biomass production, reduced carbon assimilation, increased harvest index, increased sink-source and spikelet fertility.
Crop improvements depend upon the magnitude of genetic variability present in the base population. The expected improvement in yield components primarily depends on the nature and magnitude of heritable total variation. Selection based on a single character may not always be effective while it is impractical for a researcher to consider a large number of component characters simultaneously in a particular selection procedure. Correlation analysis between yield and its components provides
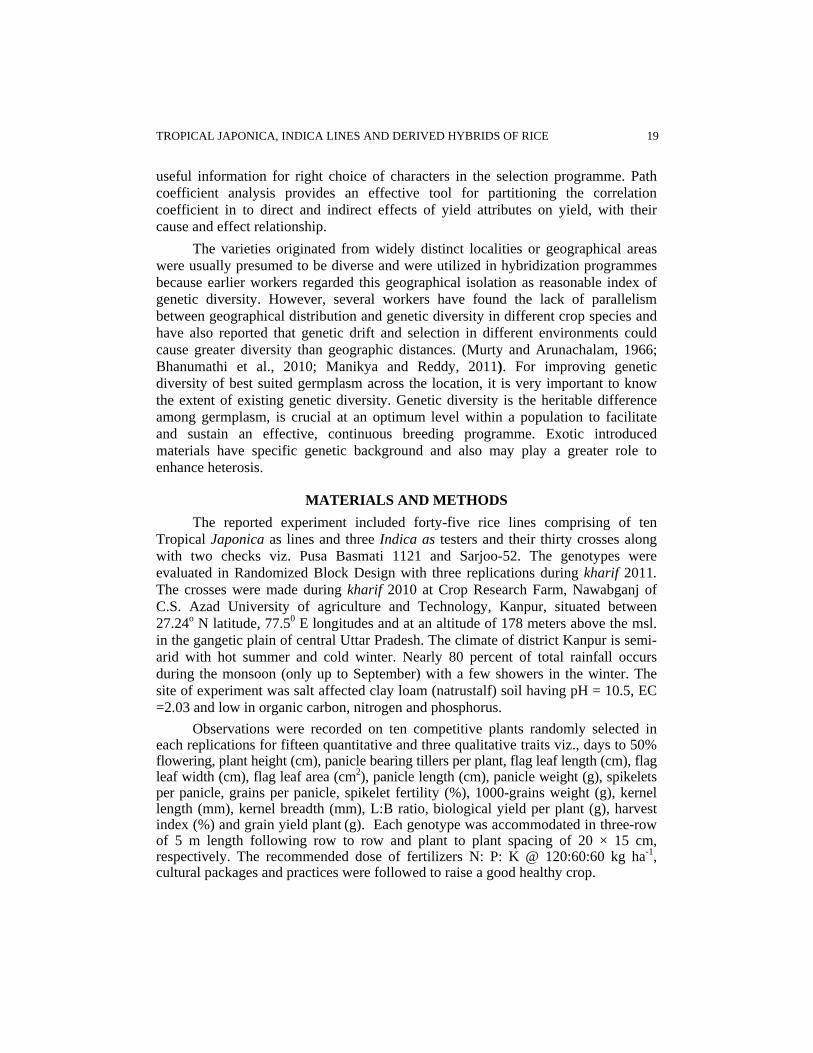
TROPICAL JAPONICA, INDICA LINES AND DERIVED HYBRIDS OF RICE 19
useful information for right choice of characters in the selection programme. Path coefficient analysis provides an effective tool for partitioning the correlation coefficient in to direct and indirect effects of yield attributes on yield, with their cause and effect relationship.
The varieties originated from widely distinct localities or geographical areas were usually presumed to be diverse and were utilized in hybridization programmes because earlier workers regarded this geographical isolation as reasonable index of genetic diversity. However, several workers have found the lack of parallelism between geographical distribution and genetic diversity in different crop species and have also reported that genetic drift and selection in different environments could cause greater diversity than geographic distances. (Murty and Arunachalam, 1966; Bhanumathi et al., 2010; Manikya and Reddy, 2011). For improving genetic diversity of best suited germplasm across the location, it is very important to know the extent of existing genetic diversity. Genetic diversity is the heritable difference among germplasm, is crucial at an optimum level within a population to facilitate and sustain an effective, continuous breeding programme. Exotic introduced materials have specific genetic background and also may play a greater role to enhance heterosis.
MATERIALS AND METHODS The reported experiment included forty-five rice lines comprising of ten
Tropical Japonica as lines and three Indica as testers and their thirty crosses along with two checks viz. Pusa Basmati 1121 and Sarjoo-52. The genotypes were evaluated in Randomized Block Design with three replications during kharif 2011. The crosses were made during kharif 2010 at Crop Research Farm, Nawabganj of C.S. Azad University of agriculture and Technology, Kanpur, situated between 27.24o N latitude, 77.50 E longitudes and at an altitude of 178 meters above the msl. in the gangetic plain of central Uttar Pradesh. The climate of district Kanpur is semi-arid with hot summer and cold winter. Nearly 80 percent of total rainfall occurs during the monsoon (only up to September) with a few showers in the winter. The site of experiment was salt affected clay loam (natrustalf) soil having pH = 10.5, EC =2.03 and low in organic carbon, nitrogen and phosphorus.
Observations were recorded on ten competitive plants randomly selected in each replications for fifteen quantitative and three qualitative traits viz., days to 50% flowering, plant height (cm), panicle bearing tillers per plant, flag leaf length (cm), flag leaf width (cm), flag leaf area (cm2), panicle length (cm), panicle weight (g), spikelets per panicle, grains per panicle, spikelet fertility (%), 1000-grains weight (g), kernel length (mm), kernel breadth (mm), L:B ratio, biological yield per plant (g), harvest index (%) and grain yield plant (g). Each genotype was accommodated in three-row of 5 m length following row to row and plant to plant spacing of 20 × 15 cm, respectively. The recommended dose of fertilizers N: P: K @ 120:60:60 kg ha-1, cultural packages and practices were followed to raise a good healthy crop.
20 Sandeep Kumar Soni et al
Standard statistical techniques such as analysis of variance (Panse and Sukhatme, 1967), genotypic and phenotypic coefficients of variation (Burton and de Vane, 1953), estimate of broad sense heritability (h2
b) (Hanson et al., 1956), genetic advance as percent of the mean (Johnson et al., 1955), phenotypic and genotypic correlation coefficient (Searle 1961), path analysis (Dewey and Lu, 1959) and standard statistical techniques such as Non-hierarchical Euclidean cluster analysis (Beale, 1969; Spark, 1973) were applied for assessing variability and genetic divergence present in the germplasm (using MASTA-C software). Grouping and arrangement of genotypes were done by Tocher’s method (Rao, 1952).
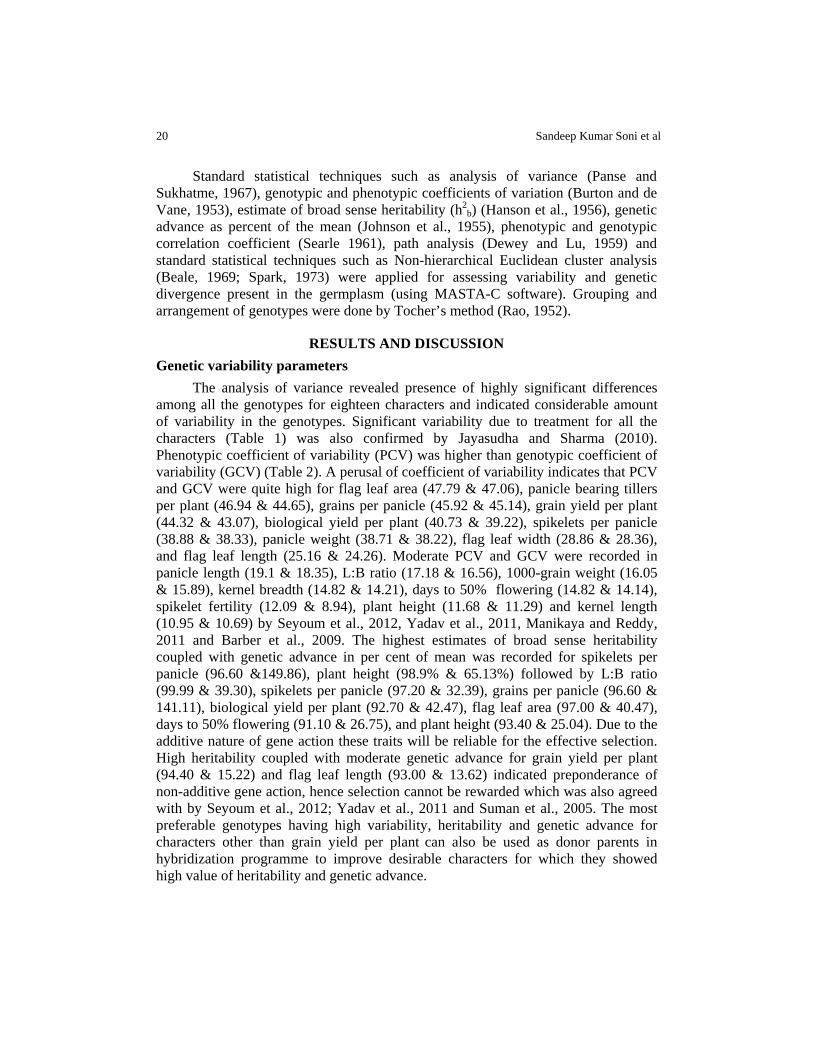
RESULTS AND DISCUSSION Genetic variability parameters
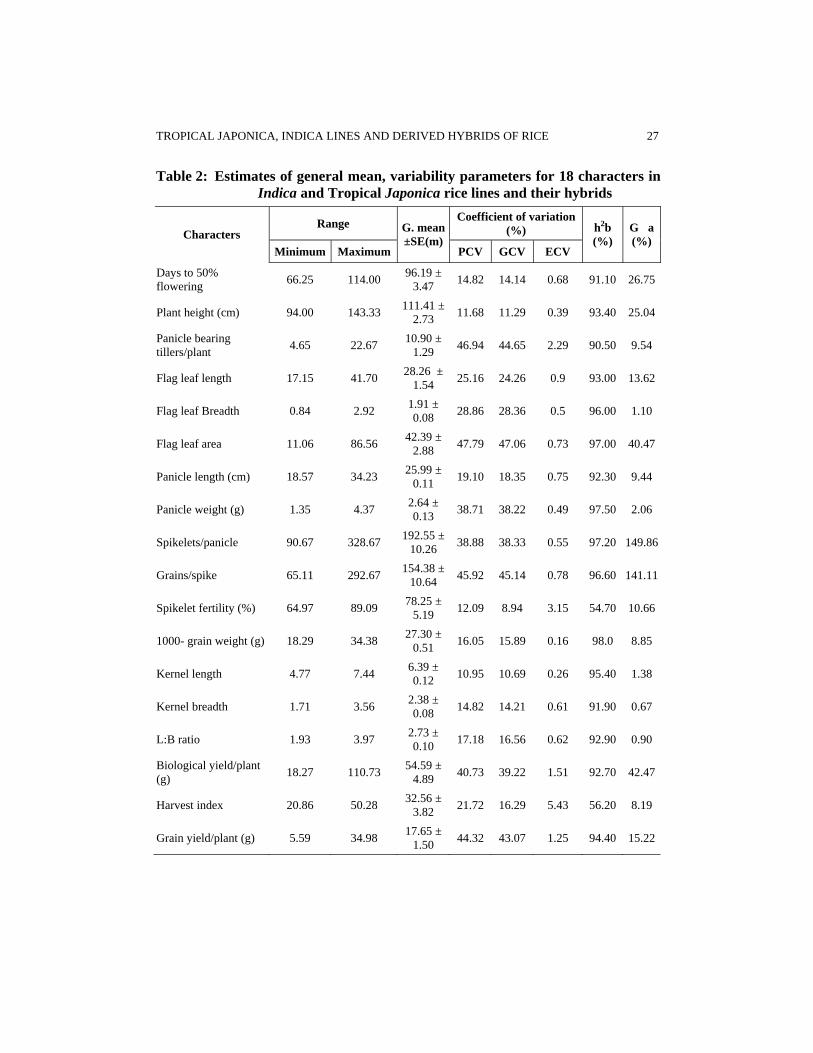
The analysis of variance revealed presence of highly significant differences among all the genotypes for eighteen characters and indicated considerable amount of variability in the genotypes. Significant variability due to treatment for all the characters (Table 1) was also confirmed by Jayasudha and Sharma (2010). Phenotypic coefficient of variability (PCV) was higher than genotypic coefficient of variability (GCV) (Table 2). A perusal of coefficient of variability indicates that PCV and GCV were quite high for flag leaf area (47.79 & 47.06), panicle bearing tillers per plant (46.94 & 44.65), grains per panicle (45.92 & 45.14), grain yield per plant (44.32 & 43.07), biological yield per plant (40.73 & 39.22), spikelets per panicle (38.88 & 38.33), panicle weight (38.71 & 38.22), flag leaf width (28.86 & 28.36), and flag leaf length (25.16 & 24.26). Moderate PCV and GCV were recorded in panicle length (19.1 & 18.35), L:B ratio (17.18 & 16.56), 1000-grain weight (16.05 & 15.89), kernel breadth (14.82 & 14.21), days to 50% flowering (14.82 & 14.14), spikelet fertility (12.09 & 8.94), plant height (11.68 & 11.29) and kernel length (10.95 & 10.69) by Seyoum et al., 2012, Yadav et al., 2011, Manikaya and Reddy, 2011 and Barber et al., 2009. The highest estimates of broad sense heritability coupled with genetic advance in per cent of mean was recorded for spikelets per panicle (96.60 &149.86), plant height (98.9% & 65.13%) followed by L:B ratio (99.99 & 39.30), spikelets per panicle (97.20 & 32.39), grains per panicle (96.60 & 141.11), biological yield per plant (92.70 & 42.47), flag leaf area (97.00 & 40.47), days to 50% flowering (91.10 & 26.75), and plant height (93.40 & 25.04). Due to the additive nature of gene action these traits will be reliable for the effective selection. High heritability coupled with moderate genetic advance for grain yield per plant (94.40 & 15.22) and flag leaf length (93.00 & 13.62) indicated preponderance of non-additive gene action, hence selection cannot be rewarded which was also agreed with by Seyoum et al., 2012; Yadav et al., 2011 and Suman et al., 2005. The most preferable genotypes having high variability, heritability and genetic advance for characters other than grain yield per plant can also be used as donor parents in hybridization programme to improve desirable characters for which they showed high value of heritability and genetic advance.
TROPICAL JAPONICA, INDICA LINES AND DERIVED HYBRIDS OF RICE 21
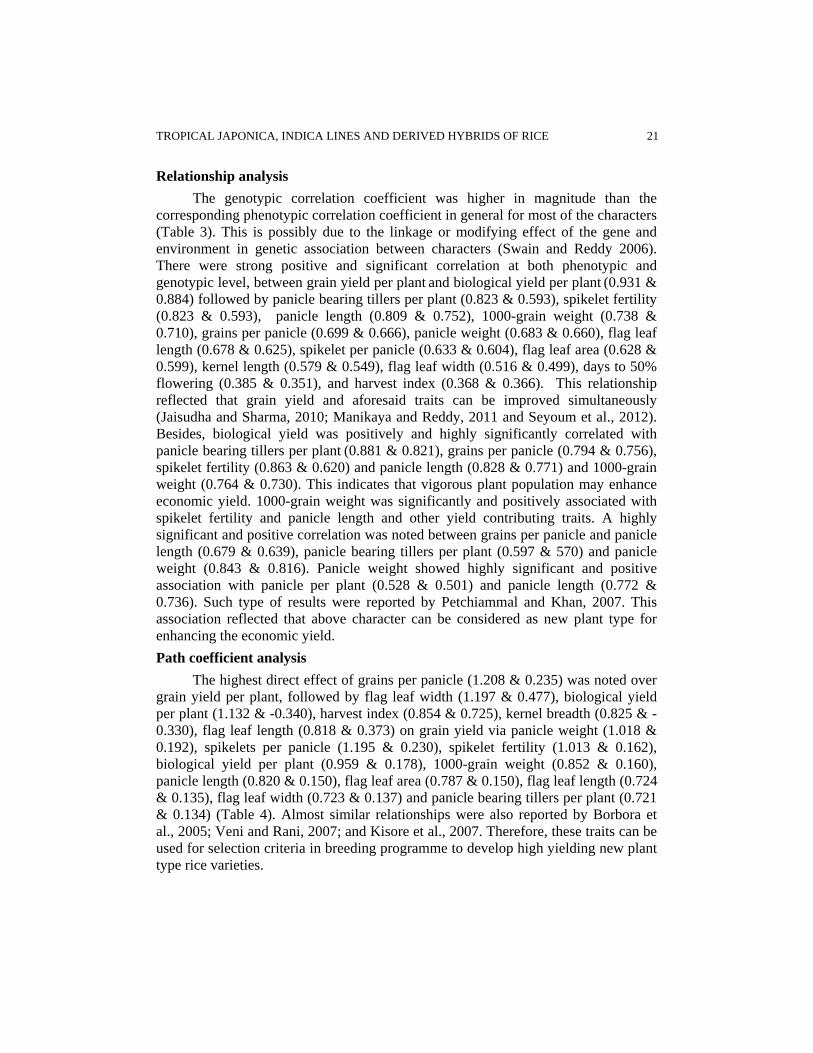
Relationship analysis The genotypic correlation coefficient was higher in magnitude than the
corresponding phenotypic correlation coefficient in general for most of the characters (Table 3). This is possibly due to the linkage or modifying effect of the gene and environment in genetic association between characters (Swain and Reddy 2006). There were strong positive and significant correlation at both phenotypic and genotypic level, between grain yield per plant and biological yield per plant (0.931 & 0.884) followed by panicle bearing tillers per plant (0.823 & 0.593), spikelet fertility (0.823 & 0.593), panicle length (0.809 & 0.752), 1000-grain weight (0.738 & 0.710), grains per panicle (0.699 & 0.666), panicle weight (0.683 & 0.660), flag leaf length (0.678 & 0.625), spikelet per panicle (0.633 & 0.604), flag leaf area (0.628 & 0.599), kernel length (0.579 & 0.549), flag leaf width (0.516 & 0.499), days to 50% flowering (0.385 & 0.351), and harvest index (0.368 & 0.366). This relationship reflected that grain yield and aforesaid traits can be improved simultaneously (Jaisudha and Sharma, 2010; Manikaya and Reddy, 2011 and Seyoum et al., 2012). Besides, biological yield was positively and highly significantly correlated with panicle bearing tillers per plant (0.881 & 0.821), grains per panicle (0.794 & 0.756), spikelet fertility (0.863 & 0.620) and panicle length (0.828 & 0.771) and 1000-grain weight (0.764 & 0.730). This indicates that vigorous plant population may enhance economic yield. 1000-grain weight was significantly and positively associated with spikelet fertility and panicle length and other yield contributing traits. A highly significant and positive correlation was noted between grains per panicle and panicle length (0.679 & 0.639), panicle bearing tillers per plant (0.597 & 570) and panicle weight (0.843 & 0.816). Panicle weight showed highly significant and positive association with panicle per plant (0.528 & 0.501) and panicle length (0.772 & 0.736). Such type of results were reported by Petchiammal and Khan, 2007. This association reflected that above character can be considered as new plant type for enhancing the economic yield. Path coefficient analysis
The highest direct effect of grains per panicle (1.208 & 0.235) was noted over grain yield per plant, followed by flag leaf width (1.197 & 0.477), biological yield per plant (1.132 & -0.340), harvest index (0.854 & 0.725), kernel breadth (0.825 & -0.330), flag leaf length (0.818 & 0.373) on grain yield via panicle weight (1.018 & 0.192), spikelets per panicle (1.195 & 0.230), spikelet fertility (1.013 & 0.162), biological yield per plant (0.959 & 0.178), 1000-grain weight (0.852 & 0.160), panicle length (0.820 & 0.150), flag leaf area (0.787 & 0.150), flag leaf length (0.724 & 0.135), flag leaf width (0.723 & 0.137) and panicle bearing tillers per plant (0.721 & 0.134) (Table 4). Almost similar relationships were also reported by Borbora et al., 2005; Veni and Rani, 2007; and Kisore et al., 2007. Therefore, these traits can be used for selection criteria in breeding programme to develop high yielding new plant type rice varieties.
22 Sandeep Kumar Soni et al
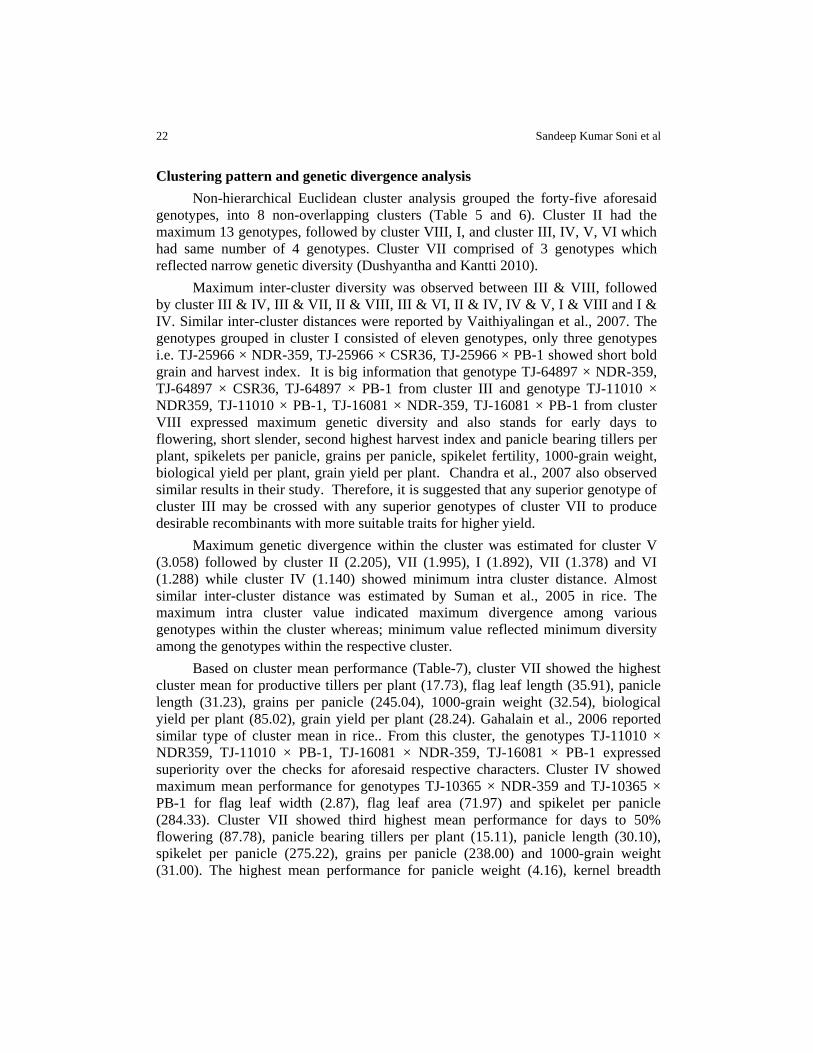
Clustering pattern and genetic divergence analysis Non-hierarchical Euclidean cluster analysis grouped the forty-five aforesaid
genotypes, into 8 non-overlapping clusters (Table 5 and 6). Cluster II had the maximum 13 genotypes, followed by cluster VIII, I, and cluster III, IV, V, VI which had same number of 4 genotypes. Cluster VII comprised of 3 genotypes which reflected narrow genetic diversity (Dushyantha and Kantti 2010).
Maximum inter-cluster diversity was observed between III & VIII, followed by cluster III & IV, III & VII, II & VIII, III & VI, II & IV, IV & V, I & VIII and I & IV. Similar inter-cluster distances were reported by Vaithiyalingan et al., 2007. The genotypes grouped in cluster I consisted of eleven genotypes, only three genotypes i.e. TJ-25966 × NDR-359, TJ-25966 × CSR36, TJ-25966 × PB-1 showed short bold grain and harvest index. It is big information that genotype TJ-64897 × NDR-359, TJ-64897 × CSR36, TJ-64897 × PB-1 from cluster III and genotype TJ-11010 × NDR359, TJ-11010 × PB-1, TJ-16081 × NDR-359, TJ-16081 × PB-1 from cluster VIII expressed maximum genetic diversity and also stands for early days to flowering, short slender, second highest harvest index and panicle bearing tillers per plant, spikelets per panicle, grains per panicle, spikelet fertility, 1000-grain weight, biological yield per plant, grain yield per plant. Chandra et al., 2007 also observed similar results in their study. Therefore, it is suggested that any superior genotype of cluster III may be crossed with any superior genotypes of cluster VII to produce desirable recombinants with more suitable traits for higher yield.
Maximum genetic divergence within the cluster was estimated for cluster V (3.058) followed by cluster II (2.205), VII (1.995), I (1.892), VII (1.378) and VI (1.288) while cluster IV (1.140) showed minimum intra cluster distance. Almost similar inter-cluster distance was estimated by Suman et al., 2005 in rice. The maximum intra cluster value indicated maximum divergence among various genotypes within the cluster whereas; minimum value reflected minimum diversity among the genotypes within the respective cluster.
Based on cluster mean performance (Table-7), cluster VII showed the highest cluster mean for productive tillers per plant (17.73), flag leaf length (35.91), panicle length (31.23), grains per panicle (245.04), 1000-grain weight (32.54), biological yield per plant (85.02), grain yield per plant (28.24). Gahalain et al., 2006 reported similar type of cluster mean in rice.. From this cluster, the genotypes TJ-11010 × NDR359, TJ-11010 × PB-1, TJ-16081 × NDR-359, TJ-16081 × PB-1 expressed superiority over the checks for aforesaid respective characters. Cluster IV showed maximum mean performance for genotypes TJ-10365 × NDR-359 and TJ-10365 × PB-1 for flag leaf width (2.87), flag leaf area (71.97) and spikelet per panicle (284.33). Cluster VII showed third highest mean performance for days to 50% flowering (87.78), panicle bearing tillers per plant (15.11), panicle length (30.10), spikelet per panicle (275.22), grains per panicle (238.00) and 1000-grain weight (31.00). The highest mean performance for panicle weight (4.16), kernel breadth

TROPICAL JAPONICA, INDICA LINES AND DERIVED HYBRIDS OF RICE 23
(3.25) were recorded in the two most superior genotypes TJ-25892 × NDR359 and TJ-25892 × PB-1 of cluster Vll. Earliness (87.78 days) and desirable medium plant height (116.00) of the above mentioned genotypes can be taken under consideration in crossing program. On the basis of eight genetically diverse clusters, superior genotypes listed in table 8 from the different clusters were selected. Interacting from different clusters and diverse genotypes would lead greater opportunity for crossing over which release latent genetic variability by breaking linkage drag and progenies derived from cross are expected to show broad spectrum of genetic variability providing a greater scope for screening transgressive segregants as new plant type for sustaining yield of existing varieties.
CONCLUSIONS The study of fifteen quantitative and three qualitative traits ranging for trait to trait among the genotype, indicated that selection can be practiced for background selection to sort-out superior parent with higher spikelets per panicle, grains per panicle, and panicle bearing tillers per plant due to the additive nature of gene action. The direct yield contributing characters showing strong positive association with grain yield reflected that these characters can be enhanced simultaneously. Similarly genotypes falling under cluster III and VIII having high mean performance for respective character can be used for getting better combinations with desirable character in Indica as well as in Japonica rice varieties for foreground selection to achieve higher yield with desirable new plant type.
ACKNOWLEDGEMENT The authors would like to thank Dr. T. Ram (Principal Scientist), Department of Genetics and Plant Breeding, Crop improvement Section and Dr. V.P. Bhadana (Principal Scientist), Department of Genetics and Plant Breeding, Hybrid Rice Section, Directorate of Rice Research, Rajendranagar, Hyderabad (AP) India, for providing the materials, and Dr. V.K. Yadav (Rice Breeder), Department of Genetics and Plant Breeding, CSAUA&T, Kanpur (UP) India for conducting the field trial timely, valuable suggestions and completion of this manuscript.
REFERENCES Anonymous 2010. FAO. statistical data base on agriculture, http:// apps. FAO org Babar, M., Khan, A. A., Arif, A., Zafar, Y. and Arif, M. 2009. Path analysis of some leaf and
panicle traits affecting grain yield in double haploid lines of rice (Oryza sativa L). Journal of Agricultural Research, 45 (4): 245-252
Beale, E. M. L. 1969. Euclidean cluster analysis. A paper contributed to 37th season of the International statistical Institute
Banumathi, S.; Thiyagarajan, K. and vaidyanathan, P. 2003. Study on magnitude of heterosis of rice hybrids for yield and its components. Crop Research, 25 (2): 287-293
24 Sandeep Kumar Soni et al
Borbora, T. K., Hazarika, G. N. and Medhi, A. K. 2005. Correlation and path analysis for panicle characters in rice. Crop Research, 30 (2): 215-222
Burton, G. W. and de Vane, E. W. 1953. Estimating heritability in tall fescue (Fistuea arundincea) from replicated clonal material. Agronomy Journal, 45: 178-181
Chandra, B. S., Reddy, T. D. and Ansari, N. A. 2007. Genetic divergence in rice (Oryza sativa L.) Research on Crops, 8 (3): 600-603
Dewey, D. R. and Lu, K. H. 1959. A correlation and path analysis of components of crested wheat grass seed production. Agronomy Journal, 57: 515-518
Dushyantha, K. B. M. and Kantti, A. 2010. Genetic divergence in rice accessions of hill zone of Karnataka. Electronic Journal of Plant Breeding, 1 (5): 1329-1331
Gahalain, S.S. 2006. Genetic divergence in rice (Oryza sativa L.) genotypes grown in Kumaun, Himalaya. Indian Journal of Genetics, 66 (1): 37-38
Hanson, G. H., Robinson, H. F. and Comstock, R. E. 1956. Biometrical studies of yield in screening populations of Korean Lesoedeza. Agronomy Journal, 48: 268-272
Jayasudha, S. and Sharma, D. 2010. Genetic parameters of variability, correlation and path-coefficient for grain yield and physiological traits in rice (Oryza sativa L.) under shallow lowland situation. Electronic Journal of Plant Breeding, 1 (5): 1332-1338
Johnson, H. W., Robinson, H. F. and Comstock, R. E. 1955. Estimates of genetic and environmental variability in Soybean. Agronomy Journal, 47: 314-318
Kishore, N. S., Ansari, N. A., Babu, V. R., Rani, N. S., Rao, L. V. and Subba, R. 2007. Correlation and path analysis in aromatic and non-aromatic rice genotypes. Agricultural Science Digest, 27: Issue 2
Manikya, M. and Reddy, T. D. 2011. Studies on genetic divergence in medium duration elite rice genotypes (Oryza sativa L.). Journal of Research ANGRAU, 39(3): 26-31
Murty, B. R. and Arunachalam, V. 1966. The nature of genetic divergence in relation to breeding system in crop plants. Indian Journal of Genetics, 26(A): 188-198
Panse, V. G. and Shukhatme, P. V. 1967. Statistical Methods for Agricultural Workers. 2nd Edn. ICAR, New Delhi, pp. 152-157
Petchiammal, K. I. and Kumar, C. R. A. 2007. Association analysis for yield and related traits in rice (Oryza sativa L.). International Journal of Plant Sciences, 2 (2): 97-100
Rao, C. R. 1952. Advanced statistical method in biometrical research. Willey and Sons Newyark
Searle, S. R. 1961. Phenotypic, genotypic and environmental correlations. Biometrics, 17: 474-480
Soyoum, M., Alamerew, S. and Bantte, K. 2012. Genetic variability, Heritability, correlation and path analysis for yield and yield related traits in upland rice (Oryza sativa L.). Plant archives, 7 (1): 13-22
Spark, D. N. 1973. Euclidean cluster analysis. Algorithm A. 58. Applied Statistics, 22: 126-130
Suman, A., Sankar, V. G., Rao, L. V. S. and Sreedhar, N. 2005. Variability, heritability and genetic advance in rice. Crop Research, 30 (2): 211-214
TROPICAL JAPONICA, INDICA LINES AND DERIVED HYBRIDS OF RICE 25
Swain, B. and Reddy, J. N. 2006. Correlation and path analysis of yield and its components in rainfed lowland rice genotypes under normal and delayed planting conditions. Oryza, 43(1): 58-61
Vaithiyalingan, M. 2007. Genetic divergence in rice (Oryza sativa L). Journal of Ecobiology, 17 (4): 393-395
Veni, B. K. and Rani, N. S. 2007. Association and path analysis studies for yield and yield components in rice. Journal of Research ANGRAU, 35 (1): 114-118 Yadav, S. K., Pandeey, P., Kumar, B. and Suresh, B. G. 2011. Genetic Architecture, Inter-relationship and Selection criteria for yield Improvement in rice (Oryza sativa L). Pakistan Journal of Biological Science, 14(9): 540-545

26 Sandeep Kumar Soni et al
Table 1: Estimates of variance for 18 characters in Indica and Tropical Japonica rice lines and their hybrids
Sources of variation Sl. No. Characters Replication
(2) Treatment
(44) Error (88) CV% CD
1. Days to 50% flowering 1.50 573.36** 18.10 4.42 6.89
2. Plant height (cm) 42.93 485.82** 11.22 3.00 5.42
3. Panicle bearing tillers/plant 2.61 73.62** 2.49 14.48 2.56
4. Flag leaf length 2.16 144.59** 3.56 6.67 3.06
5. Flag leaf Breadth 0.03 0.89** 0.01 5.36 0.16
6. Flag leaf area 3.41 1206.68** 12.45 8.32 5.72
7. Panicle length (cm) 1.04 70.18** 1.88 5.28 2.23
8. Panicle weight (g) 0.02 3.10** 0.02 6.15 0.26
9. Spikelets/panicle 413.75 16496.41** 158.16 6.53 20.38
10. Grains/spike 178.37 14739.39** 169.98 8.44 21.15
11. Spikelet fertility (%) 17.59 187.43** 40.54 8.13 10.31
12. 1000- grain weight (g) 1.96 56.87** 0.39 2.29 1.01
13. Kernel length 0.01 1.42** 0.02 2.34 0.24
14. Kernel breadth 0.03 0.35** 0.01 4.22 0.16
15. L:B ratio 0.02 0.62** 0.01 4.57 0.19
16. Biological yield/plant (g) 138.51 1410.99** 35.88 10.97 9.72
17. Harvest index 124.69 106.30** 21.90 14.37 7.59
18. Grain yield/plant (g) 2.71 176.87** 3.41 10.46 2.98
*, ** Significant at 5% and 1% probability levels, respectively
TROPICAL JAPONICA, INDICA LINES AND DERIVED HYBRIDS OF RICE 27
Table 2: Estimates of general mean, variability parameters for 18 characters in Indica and Tropical Japonica rice lines and their hybrids
Range Coefficient of variation (%) Characters
Minimum Maximum
G. mean ±SE(m)
PCV GCV ECV
h2b (%)
G�a (%)
Days to 50% flowering 66.25 114.00 96.19 ±
3.47 14.82 14.14 0.68 91.10 26.75
Plant height (cm) 94.00 143.33 111.41 ± 2.73 11.68 11.29 0.39 93.40 25.04
Panicle bearing tillers/plant 4.65 22.67 10.90 ±
1.29 46.94 44.65 2.29 90.50 9.54
Flag leaf length 17.15 41.70 28.26 ± 1.54 25.16 24.26 0.9 93.00 13.62
Flag leaf Breadth 0.84 2.92 1.91 ± 0.08 28.86 28.36 0.5 96.00 1.10
Flag leaf area 11.06 86.56 42.39 ± 2.88 47.79 47.06 0.73 97.00 40.47
Panicle length (cm) 18.57 34.23 25.99 ± 0.11 19.10 18.35 0.75 92.30 9.44
Panicle weight (g) 1.35 4.37 2.64 ± 0.13 38.71 38.22 0.49 97.50 2.06
Spikelets/panicle 90.67 328.67 192.55 ± 10.26 38.88 38.33 0.55 97.20 149.86
Grains/spike 65.11 292.67 154.38 ± 10.64 45.92 45.14 0.78 96.60 141.11
Spikelet fertility (%) 64.97 89.09 78.25 ± 5.19 12.09 8.94 3.15 54.70 10.66
1000- grain weight (g) 18.29 34.38 27.30 ± 0.51 16.05 15.89 0.16 98.0 8.85
Kernel length 4.77 7.44 6.39 ± 0.12 10.95 10.69 0.26 95.40 1.38
Kernel breadth 1.71 3.56 2.38 ± 0.08 14.82 14.21 0.61 91.90 0.67
L:B ratio 1.93 3.97 2.73 ± 0.10 17.18 16.56 0.62 92.90 0.90
Biological yield/plant (g) 18.27 110.73 54.59 ±
4.89 40.73 39.22 1.51 92.70 42.47
Harvest index 20.86 50.28 32.56 ± 3.82 21.72 16.29 5.43 56.20 8.19
Grain yield/plant (g) 5.59 34.98 17.65 ± 1.50 44.32 43.07 1.25 94.40 15.22

Table 3: Genotypic and Phenotypic correlation coefficients for 18 characters in Indica and Tropical Japonica rice lines and their hybrids
Traits Level PH PBT/P FLL FLW FLA PL PW S/P G/S SF TW KL KB L:B BY/P HI GY/P
DF rg rp
0.515** 0.468**
0.309*0.298*
0.647**0.598**
0.661**0.621**
0.697**0.658**
0.518**0.476**
0.358**0.341*
0.398**0.370**
0.430**0.398**
0.457** 0.316*
0.414**0.394**
0.618**0.587**
-0.049 -0.042
0.387**0.363**
0.571**0.525**
-0.462 -0.332
0.385**0.351**
PH rg rp
1.000 1.000
0.101 0.086
0.412**0.382**
0.654**0.624**
0.608**0.579**
0.586**0.532**
0.708**0.672**
0.555**0.524**
0.568**0.536**
0.445** 0.322*
0.676**0.642**
0.393**0.377**
0.236 0.215
0.000 0.008
0.461**0.426**
-0.128 -0.108
0.349* 0.325*
PBT/P rg rp 1.000
1.000 0.550**0.515**
0.239**0.220**
0.412**0.390**
0.697**0.638**
0.528**0.501**
0.534**0.506**
0.597**0.570**
0.741** 0.543**
0.579**0.547**
0.639**0.595**
0.250 0.225
0.210 0.189
0.881**0.821**
0.204 0.138
0.880**0.817**
FLL rg rp 1.000
1.000 0.711**
0.665 0.906**0.892**
0.708**0.655**
0.481**0.455**
0.589**0.563**
0.599**0.573**
0.607** 0.443**
0.505**0.486**
0.642**0.616**
-0.004 0.009
0.370**0.340
0.759**0.711**
-0.087 -0.105
0.678**0.625**
FLW rg rp 1.000
1.000 0.924**
0.911 0.650**0.608**
0.665**0.641**
0.578**0.561**
0.599**0.581**
0.555** 0.410**
0.577**0.556**
0.325* 0.302*
0.226 0.216
-0.044 -0.048
0.628**0.596**
-0.194 -0.123
0.516**0.499*
FLA rg rp 1.000
1.000 0.728**0.686**
0.620**0.599**
0.632**0.616**
0.651**0.635**
0.622** 0.462**
0.621**0.605**
0.521**0.501**
0.076 0.080
0.211 0.194
0.732**0.698**
-0.129 -0.103
0.628**0.599**
PL rg rp 1.000
1.000 0.772**0.736**
0.599**0.569**
0.679**0.639**
0.855** 0.606**
0.691**0.663**
0.689**0.640**
0.238 0.210
0.249 0.237
0.828**0.771**
0.182 0.114
0.809**0.752**
PW rg rp 1.000
1.000 0.806**0.783**
0.843**0.816**
0.759** 0.558**
0.801**0.781**
0.402**0.388**
0.528**0.490**
-0.181 -0.164
0.760**0.724**
0.034 0.028
0.683**0.660**
S/P rg rp 1.000
1.000 0.989**0.977**
0.760** 0.534**
0.641**0.622**
0.489**0.471**
0.333* 0.310*
0.014 0.015
0.733**0.700**
-0.088 -0.086
0.633**0.604**
G/S rg rp 1.000
1.000 0.839** 0.686**
0.705**0.682**
0.545**0.522**
0.350* 0.326*
0.038 0.036
0.794**0.756**
-0.059 -0.055
0.699**0.666**
SF rg rp 1.000
1.000 0.701**0.511**
0.651**0.463**
0.272* 0.191
0.198 0.136
0.863**0.620**
0.073 0.079
0.823**0.593**
TW rg rp 1.000
1.000 0.520**0.504**
0.412**0.391**
-0.069 -0.066
0.764**0.730**
0.121 0.092
0.738**0.710**
KL rg rp 1.000
1.000 0.137 0.126
0.537**0.535**
0.701**0.656**
-0.216 -0.159
0.579**0.549**
KB rg rp 1.000
1.000 -0.745 -0.751
0.308**0.284*
-0.276 -0.188
0.197 0.188
L:B rg rp 1.000
1.000 0.164 0.152
0.109 0.065
0.178 0.160
BY/P rg rp 1.000
1.000 0.021 -0.068
0.931**0.884**
HI rg rp 1.000
1.000 0.368**0.366**
GY/P rg rp 1.000
1.000
*, ** Significant at 5% and 1% probability levels, respectively. Legents: DF= PH= ...................................................GY/P

Table 4: Genotypic and Phenotypic path of 18 traits on grain yield in Indica and Tropical Japonica rice lines and their hybrids
Traits Level DF PH PBT/P FLL FLW FLA PL PW S/P G/P SF TW KL KB BY/P HI GY/P Corrl. of GY/P
DF Pg Pp
-0.141 -0.040
0.063 -0.028
0.042 0.020
0.529 0.223
0.791 0.294
-1.235 -0.473
0.097 0.003
-0.272 0.001
-0.281 -0.065
0.519 0.094
-0.155 -0.021
0.194 0.033
-0.548 0.176
-0.041 0.014
-0.438 -0.123
0.488 0.381
-0.105 -0.137
0.385 0.351
PH Pg Pp
-0.073 -0.019
0.123 -0.059
0.014 0.006
0.337 0.143
0.783 0.295
-0.078 -0.416
0.110 0.003
-0.537 0.002
-0.391 -0.092
0.686 0.126
-0.151 -0.021
0.316 0.054
-0.349 0.113
0.195 -0.071
0.000 -0.003
0.394 0.309
-0.029 -0.045
0.349 0.325
PBT/P Pg Pp
-0.044 -0.012
0.012 -0.005
0.135 0.066
0.449 0.192
0.287 0.104
-0.731 -0.281
0.131 0.003
-0.401 0.002
-0.377 -0.089
0.721 0.134
-0.251 -0.035
0.271 0.046
-0.566 0.178
0.206 -0.074
0.238 -0.064
0.752 0.595
0.046 0.057
0.880 0.817
FLL Pg Pp
-0.091 -0.024
0.050 -0.023
0.074 0.034
0.818 0.373
0.850 0.315
-1.606 -0.641
0.133 0.004
-0.365 0.002
-0.416 -0.099
0.724 0.135
-0.206 -0.029
0.236 0.041
-0.569 0.184
-0.003 -0.003
0.419 -0.116
0.648 0.515
-0.020 -0.043
0.678 0.625
FLW Pg Pp
-0.093 -0.025
0.080 -0.037
0.032 0.015
0.581 0.248
1.197 0.474
-1.638 -0.655
0.122 0.003
-0.504 0.002
-0.408 -0.099
0.723 0.137
-0.188 -0.027
0.270 0.047
-0.288 0.090
0.186 -0.071
-0.050 0.016
0.536 0.432
-0.044 -0.051
0.516 0.499
FLA Pg Pp
-0.098 -0.026
0.075 -0.034
0.056 0.026
0.741 0.333
1.106 0.432
-1.773 -0.719
0.137 0.004
-0.470 0.002
-0.446 -0.109
0.787 0.150
-0.211 -0.030
0.291 0.051
-0.462 0.150
0.062 -0.027
0.239 -0.066
0.625 0.506
-0.029 -0.042
0.628 0.599
PL Pg Pp
-0.073 -0.019
0.072 -0.031
0.094 0.042
0.579 0.244
0.778 0.288
-1.290 -0.493
0.188 0.005
-0.586 0.003
-0.422 -0.100
0.820 0.150
-0.289 -0.039
0.323 0.056
-0.611 0.192
0.197 -0.069
0.282 -0.081
0.707 0.559
0.041 0.047
0.809 0.752
PW Pg Pp
-0.050 -0.014
0.087 -0.040
0.071 0.033
0.393 0.170
0.795 0.304
-1.099 -0.431
0.145 0.004
-0.7590.004
-0.569 -0.138
1.018 0.192
-0.257 -0.036
0.375 0.065
-0.357 0.116
0.436 -0.162
-0.205 0.056
0.649 0.525
0.008 0.011
0.683 0.660
S/P Pg Pp
-0.056 -0.015
0.068 -0.031
0.072 0.033
0.482 0.210
0.692 0.266
-1.120 -0.443
0.112 0.003
-0.612 0.003
-0.706-0.177
1.195 0.230
-0.257 -0.035
0.300 0.052
-0.434 0.141
0.275 -0.102
0.016 -0.005
0.626 0.508
-0.020 -0.035
0.633 0.604
G/S Pg Pp
-0.061 -0.016
0.070 -0.032
0.081 0.038
0.490 0.214
0.717 0.275
-1.155 -0.457
0.127 0.003
-0.639 0.003
-0.698 -0.173
1.208 0.235
-0.284 -0.045
0.330 0.057
-0.483 0.156
0.289 -0.108
0.043 -0.012
0.678 0.548
-0.013 -0.023
0.699 0.666
SF Pg Pp
-0.064 -0.013
0.055 -0.019
0.100 0.036
0.497 0.165
0.664 0.194
-1.104 -0.332
0.160 0.003
-0.576 0.002
-0.536 -0.094
1.013 0.162
-0.339 -0.065
0.328 0.043
-0.578 0.139
0.225 -0.063
0.224 -0.046
0.728 0.450
0.017 0.033
0.823 0.593
TW Pg Pp
-0.058 -0.016
0.083 -0.038
0.078 0.036
0.413 0.181
0.691 0.263
-1.102 -0.435
0.130 0.004
-0.608 0.003
-0.453 -0.110
0.852 0.160
-0.237 -0.033
0.468 0.084
-0.461 0.151
0.340 -0.129
-0.078 0.022
0.653 0.529
0.027 0.038
0.738 0.710
KL Pg Pp
-0.087 -0.024
0.048 -0.022
0.086 0.039
0.525 0.230
0.389 0.143
-0.924 -0.360
0.129 0.003
-0.305 0.001
-0.345 -0.083
0.658 0.123
-0.220 -0.030
0.243 0.042
-0.8870.300
0.113 -0.042
0.608 -0.182
0.598 0.476
-0.049 -0.065
0.579 0.549
KB Pg Pp
0.007 0.002
0.029 -0.013
0.034 0.015
-0.003 0.003
0.270 0.102
-0.134 -0.058
0.045 0.001
-0.401 0.002
-0.235 -0.055
0.423 0.077
-0.092 -0.012
0.193 0.033
-0.121 0.038
0.825 -0.330
-0.843 0.255
0.263 0.206
-0.063 -0.077
0.197 0.188
L:B Pg Pp
-0.055 -0.015
0.002 0.001
0.028 0.013
0.303 0.127
-0.053 -0.023
-0.374 -0.139
0.047 0.001
0.137 -0.001
-0.010 -0.003
0.046 0.008
-0.067 -0.009
-0.032 -0.006
-0.476 0.160
-0.615 0.248
1.132 -0.340
0.140 0.110
0.025 0.027
0.178 0.160
BY/P Pg Pp
-0.081 -0.021
0.057 -0.025
0.119 0.054
0.621 0.265
0.752 0.282
-1.299 -0.502
0.155 0.004
-0.577 0.003
-0.518 -0.124
0.959 0.178
-0.292 -0.040
0.358 0.061
-0.621 0.196
0.254 -0.094
0.185 -0.052
0.854 0.725
0.005 -0.028
0.931 0.884
HI Pg Pp
0.065 0.013
-0.016 0.006
0.028 0.009
-0.071 -0.039
-0.232 -0.058
0.229 0.074
0.034 0.001
-0.026 0.000
0.062 0.015
-0.072 -0.013
-0.025 -0.005
0.056 0.008
0.192 -0.048
-0.228 0.062
0.124 -0.022
0.018 -0.049
0.227 0.411
0.368 0.366
Residual factors: Genotypic= 0.0072 and phenotypic= 0.0234, Bold figures Indicates Indicate direct effects. Legents: DF= PH= ...................................................GY/P

30 Sandeep Kumar Soni et al
Table 5: Clustering pattern of 45 Indica and Tropical Japonica rice lines and their hybrids for 18 characters by Non-hierarchical Euclidean Cluster analysis
Cluster number
No. of genotypes Genotypes
I 5 TJ-25966, TJ-16073, TJ-25966XNDR-359, TJ-25966XCSR36, TJ-25966XPB-1
II 13
TJ-4122, TJ-16073, TJ-39050, CSR-36, TJ-4122XNDR-359, TJ-4122XCSR36, TJ-4122XPB-1, TJ1673XNDR359, TJ1673XCSR36, TJ1673XPB-1, TJ-39050XNDR359, TJ-39050XCSR36, TJ-39050XPB-1
III 4 TJ-64897, TJ-64897XNDR-359, TJ-64897XCSR36, TJ-64897XPB-1
IV 4 TJ-10365, TJ-10365XNDR-359, TJ-10365XCSR36, TJ-10365XPB-1
V 4 NDR-359, Pusa Basmati-1, Pusa Basmati 1121, Sarjoo 52
VI 4 TJ-5769, TJ-5769XNDR-359, TJ-5769XCSR36, TJ-5769XPB-1 VII 3 TJ-25892XNDR359, TJ-25892XCSR36, TJ-25892XPB-1
VIII 8 TJ-11010, TJ-16081, TJ-11010XNDR359, TJ-11010XCSR36, TJ-11010XPB-1, TJ-16081XNDR-359, TJ-16081XCSR36, TJ-16081XPB-1
Table 6: Average intra (Diagonal and Bold) and inter-cluster distances for18
characters in Indica and Tropical Japonica rice lines and hybrids Clusters Cluster I Cluster II Cluster III Cluster IV Cluster V Cluster VI Cluster VII Cluster VIII
Cluster I 1.892 3.375 4.805 6.506 5.487 4.930 5.310 6.695
Cluster II 2.205 3.828 6.840 4.745 4.351 6.117 6.980
Cluster III 1.146 8.957 5.295 6.753 8.195 9.024
Cluster IV 1.140 6.751 4.012 5.471 3.480
Cluster V 3.058 4.276 6.409 5.330
Cluster VI 1.288 5.225 3.881
Cluster VII 1.378 4.602
Cluster VIII 1.995

Table 7: Clusters means, standard deviation and coefficient of variation for 18 traits in Indica and Tropical Japonica rice lines and hybrids
Character
Clusters DF PH PBT/P FLL FLW FLA PL PW S/P G/P SF TW KL KB L:B BY/P HI GY/P
Mean 82.80 106.40 8.73 23.75 2.08 37.31 24.51 3.02 158.87 118.13 73.86 25.42 5.23 2.65 1.97 42.66 36.46 15.48
SD 8.25 2.77 2.24 1.86 0.30 7.38 2.04 0.31 51.01 43.88 8.73 1.37 0.38 0.13 0.05 1.85 3.80 1.57 Cluster I CV 9.96 2.60 25.66 7.83 14.42 19.78 8.32 10.26 32.11 37.15 11.82 5.39 7.27 4.91 2.54 4.34 10.42 10.14
Mean 95.79 105.21 6.98 24.68 1.67 31.04 20.92 1.64 156.40 113.50 72.61 23.57 6.17 2.36 2.62 37.73 27.90 10.46 SD 8.74 8.08 1.56 5.09 0.17 7.18 2.24 0.23 58.66 42.70 5.15 2.10 0.44 0.18 0.24 6.91 4.33 2.48 Cluster II CV 9.12 7.68 22.35 20.62 10.18 23.13 10.71 14.02 37.51 37.62 7.09 8.91 7.13 7.63 9.16 18.31 15.52 23.71
Mean 73.08 103.17 7.18 17.99 0.90 12.10 20.32 1.63 117.50 81.50 69.38 24.78 5.65 1.89 3.02 25.13 39.51 9.77 SD 3.98 5.71 0.19 0.72 0.05 0.84 1.01 0.12 9.48 9.37 3.14 0.92 0.08 0.21 0.32 0.97 3.0 0.47 Cluster III CV 5.45 5.53 2.65 4.00 5.56 6.94 4.97 7.36 8.07 11.50 4.53 3.71 1.42 11.11 10.60 3.86 7.59 4.81
Mean 10.9.08 140.67 7.30 33.44 2.87 71.97 30.66 4.13 284.33 240.00 84.36 32.16 6.67 2.30 2.90 65.11 32.80 21.22 SD 5.35 3.03 1.87 1.94 0.08 0.78 1.43 0.25 5.98 13.93 3.60 1.53 0.32 0.15 0.13 5.85 1.73 1.59 Cluster IV CV 4.90 2.15 25.62 5.80 2.79 1.08 4.66 6.05 2.10 5.80 4.27 4.76 4.80 6.52 4.48 8.98 5.27 7.49
Mean 92.31 95.26 15.50 30.23 1.49 33.74 28.79 2.02 143.56 118.59 82.63 23.81 6.92 2.05 3.44 61.54 39.64 24.54 SD 17.89 0.83 4.79 4.49 0.20 7.84 1.78 0.20 11.97 12.41 2.29 5.58 0.37 0.27 0.61 14.28 9.75 9.11 Cluster V CV 19.38 0.87 30.90 14.85 13.42 23.24 6.18 9.90 8.34 10.46 2.77 23.44 5.35 13.17 17.73 23.20 24.60 37.12
Mean 110.58 122.25 12.32 34.85 2.15 56.24 29.04 2.71 142.58 111.58 77.62 29.79 6.70 2.31 2.90 65.80 29.17 19.05 SD 1.20 1.19 1.45 3.24 0.12 7.01 1.32 0.30 21.95 25.85 7.88 0.87 0.07 0.02 0.03 6.85 2.51 2.34 Cluster VI CV 0.11 0.10 1.18 0.93 0.56 1.25 0.45 1.11 1.54 2.32 1.02 0.29 0.10 0.09 0.10 1.04 0.86 1.23
Mean 87.78 116.00 15.11 26.32 1.65 32.48 30.10 4.16 275.22 238.00 86.46 31.00 6.96 3.25 2.15 67.44 28.34 18.95 SD 1.17 3.53 0.69 3.63 0.03 3.91 3.66 0.15 5.72 7.37 1.39 0.97 0.59 0.29 0.07 8.82 0.34 2.42 Cluster VII CV 1.33 3.04 4.57 13.79 1.82 12.04 12.16 3.61 2.08 3.10 1.61 3.13 8.48 8.92 3.26 13.08 1.20 12.77
Mean 108.25 115.08 17.73 35.91 2.40 65.52 31.23 3.54 282.46 245.04 86.64 32.54 7.09 2.43 2.92 85.02 33.88 28.24 SD 4.72 4.60 3.66 5.32 0.24 15.95 0.56 0.60 24.73 27.05 2.17 1.43 0.21 0.09 0.15 17.63 3.17 4.28 Cluster VIII CV 4.36 4.00 20.64 14.81 10.00 24.34 1.79 16.95 8.76 11.04 2.50 4.39 2.96 3.70 5.14 20.74 9.36 15.16

32 Sandeep Kumar Soni et al
Table 8: Important superior genotypes and hybrids identified on the basis of their important traits, and cluster means in Indica and Tropical Japonica rice lines and hybrids
Genotypes/hybrids Cluster Important traits TJ-25966 × NDR-359 I Short bold grain, harvest index TJ-25966 × CSR36 I Short bold grain, harvest index TJ-25966 × PB-1 I Short bold grain, harvest index TJ-64897 × NDR-359 III Fourth early days to flowering, short slender, second highest harvest inTJ-64897 × CSR36 III Fifth early days to flowering, short slender, fifth highest harvest indexTJ-64897 × PB-1 III Third early days to flowering, short slender TJ-10365 × NDR-359 IV Third highest flag leaf width, fourth highest flag leaf area, second h
length, first highest panicle weight, third highest spikelet/grains/panicle
TJ-10365 × PB-1 IV Fourth highest flag leaf area, fifth highest panicle weight, fourth spithird highest grains/panicle
NDR-359 V Medium days to flowering, first harvest index, fourth highest grain yiePusa Basmati-1 V Second dwarf plant height, long slender Pusa Basmati 1121 V Fifth dwarf plant height, long slender Sarjoo 52 V Third dwarf plant height, first highest tillers/plant, third highest
second highest grain yield/plant TJ-25892 × NDR359 VII First highest panicle length, third highest panicle weight,
spikelet/panicle, long bold slender TJ-25892 × PB-1 VII Fifth highest panicle weight, long bold slender TJ-11010 × NDR359 VIII Second highest panicle bearing tillers/plant, second panicle weight
spikelets/panicle, first highest grains/panicle, first highest spikelet fertility, second highelong bold slender, first biological yield/plant, third highest grain yield/plant
TJ-11010 × PB-1 VIII Third highest panicle bearing tillers/ plant, second highest spikelets/phighest grains/panicle Second highest spikelet fertility, first highest test weight, long boldhighest biological yield/plant, first highest grain yield/plant
TJ-16081× NDR-359 VIII Fourth panicle bearing tillers/plant, first flag leaf length, fourth flagfifth highest grains/ panicle, third highest test weight, long slender, second highest biological yihighest grain yield/plant
TJ-16081× PB-1 VIII Fifth highest panicle bearing tillers/plant, second flag leaf length, firleaf area, fourth highest panicle length, fifth highest test weight, long slender, fifth biological y
SAARC J. Agri., 11(2): 33-47 (2013)
EFFECT OF ANTIMELANOTIC TREATMENT AND VACUUM PACKAGING ON MELANOSIS AND QUALITY CONDITION OF ICE STORED FARMED TIGER SHRIMP
(Penaeus monodon)
Vijay Kumar Reddy. S*, Pradnya A. Shinde, Faisal R. Sofi1, Piyusha S. Shelar2 and S. B. Patange
Department of Fish Processing Technology and Microbiology, Fisheries College, Shirgaon, Ratnagiri, Maharashtra, India – 415 629
ABSTRACT
The objective of the study was to evaluate the effect of vacuum packaging in combination with antimelanotic treatment on quality characteristics and melanosis in farmed tiger shrimp (Penaeus monodon) collected from Ratnagiri region of Maharashtra. The processed shrimps were treated with sulfite mixture in water (30 g kg-1) and divided into two lots each with 250 shrimps. One of them was vacuum packed, the other was air packed and stored under ice. The ice stored shrimps were analyzed for quality attributes and melanosis for a period of 27 days. The treated vacuum packed shrimps had a shelf life of 24 days, whereas air packed shrimp had 16 days only. Melanosis was absent in the shrimps from both the lots throughout the storage period. Based on the results, it could be concluded that the combination of antimelanotic treatment (sulphite mixture) and packaging could significantly delay the occurrence of melanosis and increase the storage life of shrimp in ice. Key words: Tiger shrimp, antimelanotic treatment, melanosis, Sodium metabisulphite, treated air packed, treated vacuum packed
1. Practical applications In farmers practice Penaeus monodon will be treated with sodium metabisulphite of high concentrations immediately after the capture to prevent melanosis and for keeping quality. Even after the treatment, the shrimps deteriorate
* Corresponding author email: [email protected] 1Ph.D. Student, Department of Fish Processing Technology, College of Fisheries, KVAFSU, Mangalore, Karnataka, India-575001 2Deptt. Aquatic Environment and Management, Fisheries College and Research Institute, TANVASU, Tuticorin, Tamil Nadu Received: 14.10.2012
34 Vijay Kumar Reddy et al
rapidly and show melanosis within few hours and may also contain high sulphite residues, which is not desirable. In order to overcome these problems, the tiger shrimp were treated with sulphites of low concentration, than that used in regular farmers practice and was combined with packaging to create more period of contact to get more effect of metabisulphite and to prevent reaction of food with oxygen. The combined effect of packaging and sulphite treatment could delay the occurrence of melanosis and can keep the quality of shrimps for a long period (up to 27 days), which is only few days i.e., 2-8 days in case without treatment and packaging. So the work done is very much useful to farmers as well as processors to maintain the edibility of shrimp for longer periods.
INTRODUCTION Shrimp continues to be the most important commodity traded in value terms,
accounting for 15.4 per cent of the total value of internationally traded fish products (FAO, 2009). Demand for shrimp is increasing at a rapid rate. During 2008-09, shrimp continued to be the major item contributing more than 50% in value of total export of marine products from India (MPEDA, 2010). Shrimp is more susceptible to spoilage from postmortem autolysis and microbial growth. The high ambient temperature of our country favours rapid growth of microorganisms. There are several methods to preserve fresh fish and shrimp. Icing is a common method for short-term preservation.
The appearance of melanosis or blackspots on prawn, shrimp, and other fresh or raw crustaceans is rapid, even in chilled storage, and involves some important economic losses for the fish industry. One of the cheapest, easiest and most efficient methods of preventing blackspot is the use of sulfites (Smith, 1980). In several studies it was reported that sodium metabisulfite extended the melanosis for considerable periods (Chakrabarti and Gupta, 1998; Chakrabarti et al., 1992; Gomez-Guillen et al., 2005; Martinez-Alvarez et al., 2005; Ogawa, 1987 and Smith, 1980).To promote the marketing of fresh fishery products at retail level, novel methods of packaging and storage are required. One such method of current interest is vacuum packaging. Studies have shown that vacuum packaging in combination with lower temperatures improves the shelf life considerably (Jeyasekaran et al., 2004; Lopez-Caballero et al., 2000; Perez-Alonso et al., 2004; Rajesh et al., 2002 and Shalini et al., 2000).
The black tiger shrimp Penaeus monodon, is the most important aquacultured shrimp species in the world, accounting for 46% of the total aquaculture shrimp (Hanpongkittikun et al., 1995). Penaeus monodon locally known as ‘Tiger kolambi’ is one of the most important cultivable species along the entire coast of India. Demand for fresh farmed tiger shrimp is very high and storage life in ice is limited. No literature is available on using of combination of vacuum packaging with antimelanotic treatment for prevention of the quality changes in shrimp. The present

QUALITY CONDITION OF ICE STORED FARMED TIGER SHRIMP 35
35
study was therefore undertaken to find out the effect of the combination of antimelanotic treatment and vacuum packaging on the storage characteristics of farmed tiger shrimp in ice, especially on occurrence of melanosis and shelf life.
MATERIALS AND METHODS Harvesting and Treatment of Raw Material
Fresh tiger shrimp, Penaeus monodon procured from ‘Zadgaon brackish water shrimp farm, Ratnagiri, Maharashtra State, India, were brought to the laboratory in iced condition. The time period from the harvest of shrimps to testing was four hours. The shrimps used for this study had an average weight and average total length of 25±5 g and 15± 2 cm respectively. The shrimps were processed to remove rostrum and telson and were given dip treatment in seawater at 1:2 ratio (Shrimp to Sea water) containing sodium metabisulfite, citric acid, ethylene di-amine tetra acetic acid and disodium dihydrogen pyrophosphate at the concentrations of 30 g, 20 g, 0.45 g and 30 g for every kilogram of shrimp treated in every 2 liters of sea water (Gomez-Guillen et al., 2005). The sulfite treated shrimp were divided into two lots-1) treated vacuum packed (TVP): The shrimps were treated with 30 g kg-1 sulfites and then vacuum-packed. 2) Treated Air Packed (TAP): The shrimps were treated with 30 g kg-1 sulfites and then packed without vacuum (air pack). Packing and storage of treated shrimp
The treated shrimps were packed in laminate pouches of 12 µm polyester and 300 guage polyethylenes Lot I was vacuum packed at -1 bar pressure. Vacuum packaging machine (Dong Bang Machineries Pvt. Ltd., China) was used for packaging of whole tiger shrimps. The physical properties of the packaging materials used are given in table 1. Immediately after packing, all the packs were iced with flake ice in the ratio of 1:1 (shrimp to ice) in an insulated box. The insulated box was kept in a cold room maintained at 0-4oC. Re-icing was done every day to supplement the loss due to melting, after draining the melted ice. Quality analysis during period of ice storage
Samples in triplicate were drawn from each lot at regular intervals of 24 hrs for analysis throughout the storage period of 27 days and the average results are presented. All the packs were analysed for sensory, microbiological (Total Plate Count (TPC), Staphylococcus aureus, Psychrotrophic count, anaerobic count) and biochemical parameters (pH, TMA-N, TVB-N, AAN and FFA).
Moisture, crude protein, fat and ash were determined according to the methods described in AOAC (2000). The moisture content was measured by drying in a hot air oven (Kumar sales corporation, Mumbai), maintained at 100 0C ± 2 0C for 16-18 hours. The weight loss was expressed as percent moisture content of the meat. The protein content was determined by estimating total nitrogen in the sample using Kelplus electrically heating digestion and distillation unit (Pelican Equipment,
36 Vijay Kumar Reddy et al
Chennai). Crude protein content was calculated by multiplying total nitrogen content by 6.25 and expressed as percentage weight of meat.
The crude fat content of the meat was determined using SOCS plus unit (Pelican Equipment, Chennai). The fat present in the sample was extracted by using petroleum ether (AR grade). Then it was dried initially on a water bath at 980C – 1000C and then in an oven at 600C ± 50C. The difference in the initial and final weight of receiver beaker was determined and fat content of meat was calculated on wet weight basis. In ash content determination preliminary ashing was done by slow heating on a flame to allow smoking off fat without burning. Once the smoke stopped evolving from sample, it was incinerated in a muffle furnace (Cintex, Mumbai) at 5500C ± 10 0C for 5 hours until a white ash resulted. The pH of the sample was determined with a pHm93 pH-meter and a combined pH electrode (Radiometer, Copenhagen, Denmark).
The Free Fatty Acid (FFA) content in the lipid extract was determined with improved titremetric method as described by (AOAC, 2000). Methanol and isopropanol (chloroform: methanol: Isopropanol = 2:1:2) were added to chloroform extract. The extract was titrated with NaOH using metacresol purple as an indicator. The percentage of free fatty acid was calculated as oleic acid percentage.
Total volatile base nitrogen (TVB-N) and trimethyl amine nitrogen (TMA-N) were determined using a micro diffusion method (Conway, 1950). A1 ml of sulphuric acid was added to inner chamber of the diffusion unit and 1 ml of muscle solution which was extracted with TCA was added followed by addition of 1 ml of saturated potassium carbonate. The unit was sealed and kept undisturbed overnight. The amount of unreacted acid in the inner chamber was determined by titrating against standard sodium hydroxide with Tashiro’s indictor. TVB-N was calculated and expressed in mg 100g–1 of the sample. The TMA was determined following the method used for TVB-N estimation, except the addition of neutral formaldehyde to the outer chamber for TMA-N estimation. TMA-N was calculated as explained in TVB-N and expressed in mg 100g–1 of the sample.
Determination of α-amino nitrogen (AAN) content was done according to the method given by Benjakul and Morrissey, 1997. The sample was extracted with TCA and then added with few drops of thymolpthalein and NaOH. Then 10 ml of this was added to 30 ml mixed solution of Cucl2, tri-sodium phosphate and borate buffer (1: 2: 2). A 10 ml of the filtrate is added with 0.5ml of glacial acetic acid and 0.5 g of potassium iodide. The liberated iodine was titrated against sodium thiosulphate using starch as an indicator, when yellow solution of Iodine became faint yellow, few drops of starch solution was added and titration was continued till blue color disappeared. AAN was calculated as mg 100g-1 of muscle.
The total plate count, S. aureus, psychrotrophic count and anaerobic count were carried out for all the lots throughout storage period by using the method given
QUALITY CONDITION OF ICE STORED FARMED TIGER SHRIMP 37
37
by Tomlinson (1995). For estimating total plate count, appropriate dilutions were prepared from the homogenate using physiological saline and placed on plate count agar by pour plate method. The petri dishes were incubated at 370C for 24 - 48 h. The colonies developed on agar plates were counted and expressed as cfu g-1. In case of psychrotrophic count estimation, the petri dishes were pour plated and incubated at 7±1oC for 7-8 days. The colonies developed on agar plates were counted and expressed as cfu g-1.
For determining staphylococcal count, the petri dishes were plated by spread plate method on Baired parker agar. The plates were incubated at 37oC for 48 h. the colonies of S. aureus were expressed as cfu g-1. Total anaerobes were determined by 3 tube MPN technique. The sample was inoculated with 10 ml each into 3 tubes of 10 ml thioglycollate broth, 1 ml each to 3 tubes of thioglycollate broth and 0.1 ml of each to 3 tubes of thioglycollate broth. The test tubes were overlaid with sterile paraffin oil and incubated at 35oC for 48 hours. The probable number of anaerobic count were calculated according to the various combinations of +ve and –ve reactions by using Mac crady table.
Sensory evaluation was done by a 10 point scoring system using a modified version of one developed by Peryam and Pligirms (1957) based on characterization and differentiation of the various sensory characters, such as appearance, texture, odour and flavor. Scores were given by five trained panelists, based on a ten-point hedonic scale. Score 5 was taken as the borderline of acceptability. Evaluation for Melanosis was done by a 4 point scoring system, a modified version used by Gomez-Guillen et al. (2005) for Parapenaeus longirostris. Low score indicated less melanosis, good quality and vice versa.
RESULTS AND DISCUSSION Raw material characteristics
The proximate composition of fresh farmed tiger shrimp is given in figure 1. The proximate composition analysed was 75.16% moisture, 1.98% crude fat, 21.07% crude protein and 1.79% crude ash. There were no significant differences found in the proximate composition with increased storage period. Initial sensory, chemical and bacteriological analysis of fresh tiger shrimp indicated that the quality of the raw material was very fresh. The fresh tiger shrimp used in the present study had pH, TMA-N, TVB-N, AAN and indole values of 6.58, 8.92 mg%, 0.34 mg%, 18.46 mg% and 4 µg/100g respectively. It was reported that the raw tiger shrimp used in their study had TMA-N, TVB-N and indole content of 3.78-7.28 mg%, 15.96 - 28.28 mg%, and 5.85 - 6.85 µg/100 g respectively (Antony et al., 2002). The fresh tiger shrimp used in another study had pH and TVB-N values of 6.63 and 5.88 mg% (Rahaman et al., 2001).
The fresh tiger shrimp used in present study had TPC and psychrotrophic counts of 4.08 log cfu/g and 4.02 log cfu/g. Anaerobes and Staphylococcus were not detected in fresh shrimp.
38 Vijay Kumar Reddy et al
Changes in bio-chemical characteristics during ice storage The TMA-N content, which indicates the extent of protein breakdown, usually
caused by bacteria or enzymes, increased gradually in all the samples with storage time, as observed by earlier authors (Figure 2). In the present work, the initial TMA-N value was 0.34 mg%, which increased to 3.26 mg%, and 2.44 mg% for the TAP and TVP samples respectively on the 8th of day storage. The TMA-N further gradually increased up to 17th day of storage. On 17th day, the TMA-N was recorded to be 5.58 mg% and 3.66 mg% for TAP and TVP samples respectively. These findings are in agreement with the earlier reports on usage of vacuum packaging and treatment with various chemicals to preserve seafoods (Rajesh et al., 2002; Sawant, 2008 and Shakila et al., 2005).
The TVB-N was 8.92 mg % at the beginning of the storage in TAP and TVP samples, which gradually increased to 26.32 mg% and 21.77 mg% for TAP and TVP respectively on 17th day of storage (Figure 3). Further on the 26th day of storage the values rapidly increased and reached 30.01 mg% for TVP samples. The lower TVB-N values were recorded in TVP sample during storage. The similar trend was observed by Rajesh et al. (2002) and Sawant (2008) during their studies on seafood quality.
A change in pH of fish muscle is usually a good index for quality assessment. In the present study, all the samples exhibited increase in pH during storage, from initial value of 7.11 for both TAP and TVP samples on 0 day, reaching to a value of 7.81 and 7.78 in TAP and TVP samples on 17th and 27th day respectively (Figure 4.). The study showed similar changes to those observed by Sawant (2008) and Shalini et al. (2000).
The initial AAN content was 18.46 mg% for both TAP and TVP samples (Figure 5). In case of TAP, it increased up to 38.14 mg% which in TVP increased up to 29.40 mg% on 27th day. In the present study, the AAN showed a steady increase during the storage period of 26 days and reached 37.62 mg% on 26th day. Decrease of AAN during ice storage is attributed to leaching out of soluble nitrogenous constituents (Govindan, 1972). In the present study, the TAP and TVP shrimp samples were not in indirect contact with ice or water. Because of impermeable flexible pouches and hermetic sealing, there was no leaching and AAN values showed only slow increase throughout the storage period. The changes observed were in agreement with the observations made by Rajesh et al. (2002) and Sawant (2008).
In the present study FFA increased from the initial level of 0.16% oleic acid in both TAP and TVP shrimp to 1.89 and 1.26% oleic acid on 17th day of storage (Figure 6). The FFA value of TVP samples further increased and reached 1.74% on 26th day of storage. In the present study, the FFA value increased significantly with storage period and the increase in TAP was found to be more than that in TVP samples. Similar results have also been reported previously by various researchers
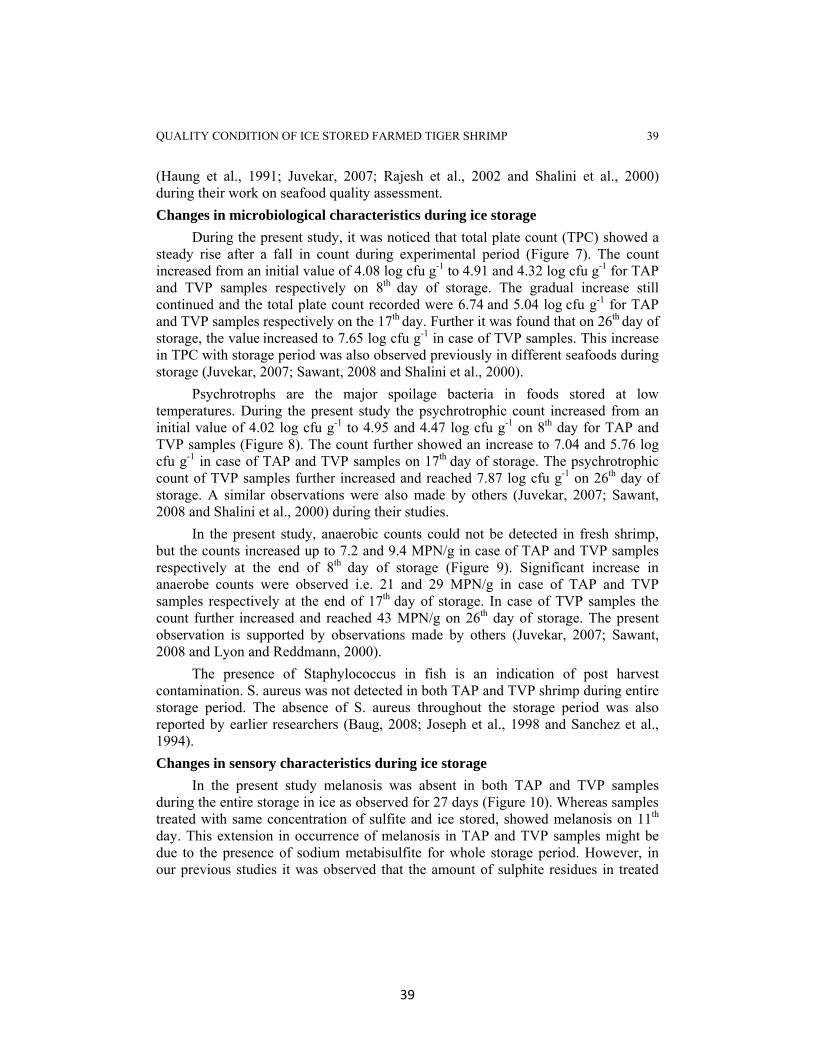
QUALITY CONDITION OF ICE STORED FARMED TIGER SHRIMP 39
39
(Haung et al., 1991; Juvekar, 2007; Rajesh et al., 2002 and Shalini et al., 2000) during their work on seafood quality assessment.
Changes in microbiological characteristics during ice storage During the present study, it was noticed that total plate count (TPC) showed a
steady rise after a fall in count during experimental period (Figure 7). The count increased from an initial value of 4.08 log cfu g-1 to 4.91 and 4.32 log cfu g-1 for TAP and TVP samples respectively on 8th day of storage. The gradual increase still continued and the total plate count recorded were 6.74 and 5.04 log cfu g-1 for TAP and TVP samples respectively on the 17th day. Further it was found that on 26th day of storage, the value increased to 7.65 log cfu g-1 in case of TVP samples. This increase in TPC with storage period was also observed previously in different seafoods during storage (Juvekar, 2007; Sawant, 2008 and Shalini et al., 2000).
Psychrotrophs are the major spoilage bacteria in foods stored at low temperatures. During the present study the psychrotrophic count increased from an initial value of 4.02 log cfu g-1 to 4.95 and 4.47 log cfu g-1 on 8th day for TAP and TVP samples (Figure 8). The count further showed an increase to 7.04 and 5.76 log cfu g-1 in case of TAP and TVP samples on 17th day of storage. The psychrotrophic count of TVP samples further increased and reached 7.87 log cfu g-1 on 26th day of storage. A similar observations were also made by others (Juvekar, 2007; Sawant, 2008 and Shalini et al., 2000) during their studies.
In the present study, anaerobic counts could not be detected in fresh shrimp, but the counts increased up to 7.2 and 9.4 MPN/g in case of TAP and TVP samples respectively at the end of 8th day of storage (Figure 9). Significant increase in anaerobe counts were observed i.e. 21 and 29 MPN/g in case of TAP and TVP samples respectively at the end of 17th day of storage. In case of TVP samples the count further increased and reached 43 MPN/g on 26th day of storage. The present observation is supported by observations made by others (Juvekar, 2007; Sawant, 2008 and Lyon and Reddmann, 2000).
The presence of Staphylococcus in fish is an indication of post harvest contamination. S. aureus was not detected in both TAP and TVP shrimp during entire storage period. The absence of S. aureus throughout the storage period was also reported by earlier researchers (Baug, 2008; Joseph et al., 1998 and Sanchez et al., 1994). Changes in sensory characteristics during ice storage
In the present study melanosis was absent in both TAP and TVP samples during the entire storage in ice as observed for 27 days (Figure 10). Whereas samples treated with same concentration of sulfite and ice stored, showed melanosis on 11th day. This extension in occurrence of melanosis in TAP and TVP samples might be due to the presence of sodium metabisulfite for whole storage period. However, in our previous studies it was observed that the amount of sulphite residues in treated
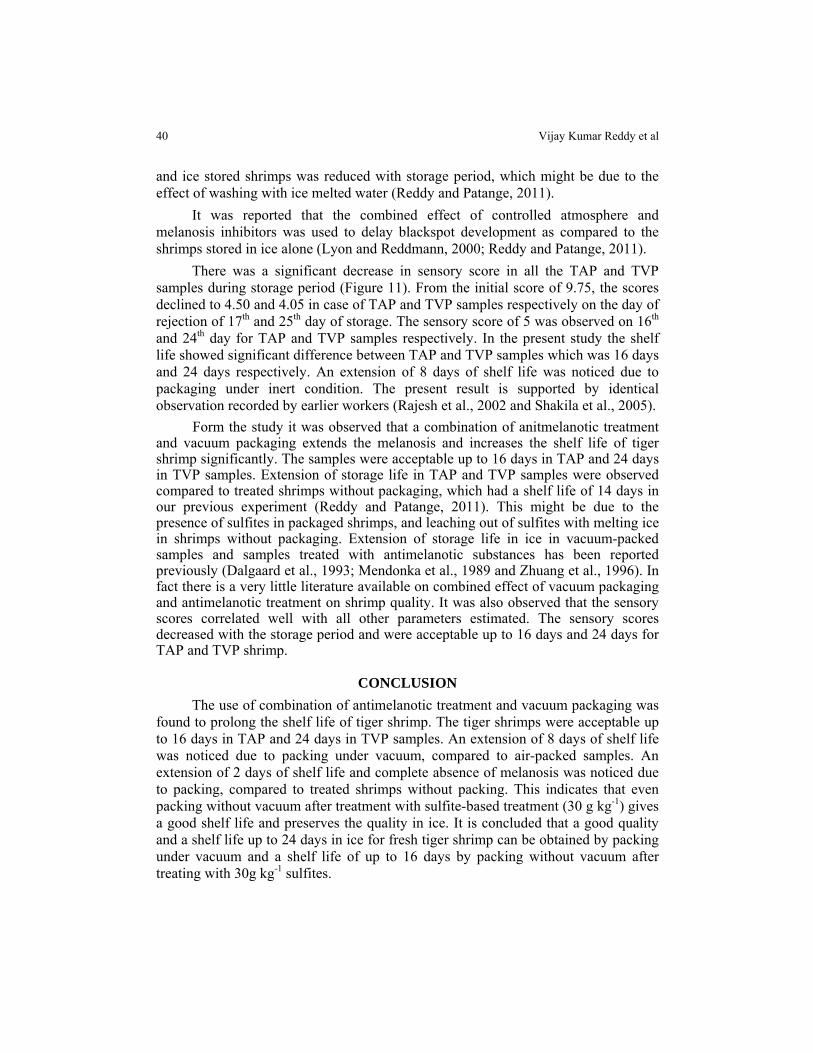
40 Vijay Kumar Reddy et al
and ice stored shrimps was reduced with storage period, which might be due to the effect of washing with ice melted water (Reddy and Patange, 2011).
It was reported that the combined effect of controlled atmosphere and melanosis inhibitors was used to delay blackspot development as compared to the shrimps stored in ice alone (Lyon and Reddmann, 2000; Reddy and Patange, 2011).
There was a significant decrease in sensory score in all the TAP and TVP samples during storage period (Figure 11). From the initial score of 9.75, the scores declined to 4.50 and 4.05 in case of TAP and TVP samples respectively on the day of rejection of 17th and 25th day of storage. The sensory score of 5 was observed on 16th and 24th day for TAP and TVP samples respectively. In the present study the shelf life showed significant difference between TAP and TVP samples which was 16 days and 24 days respectively. An extension of 8 days of shelf life was noticed due to packaging under inert condition. The present result is supported by identical observation recorded by earlier workers (Rajesh et al., 2002 and Shakila et al., 2005).
Form the study it was observed that a combination of anitmelanotic treatment and vacuum packaging extends the melanosis and increases the shelf life of tiger shrimp significantly. The samples were acceptable up to 16 days in TAP and 24 days in TVP samples. Extension of storage life in TAP and TVP samples were observed compared to treated shrimps without packaging, which had a shelf life of 14 days in our previous experiment (Reddy and Patange, 2011). This might be due to the presence of sulfites in packaged shrimps, and leaching out of sulfites with melting ice in shrimps without packaging. Extension of storage life in ice in vacuum-packed samples and samples treated with antimelanotic substances has been reported previously (Dalgaard et al., 1993; Mendonka et al., 1989 and Zhuang et al., 1996). In fact there is a very little literature available on combined effect of vacuum packaging and antimelanotic treatment on shrimp quality. It was also observed that the sensory scores correlated well with all other parameters estimated. The sensory scores decreased with the storage period and were acceptable up to 16 days and 24 days for TAP and TVP shrimp.
CONCLUSION The use of combination of antimelanotic treatment and vacuum packaging was
found to prolong the shelf life of tiger shrimp. The tiger shrimps were acceptable up to 16 days in TAP and 24 days in TVP samples. An extension of 8 days of shelf life was noticed due to packing under vacuum, compared to air-packed samples. An extension of 2 days of shelf life and complete absence of melanosis was noticed due to packing, compared to treated shrimps without packing. This indicates that even packing without vacuum after treatment with sulfite-based treatment (30 g kg-1) gives a good shelf life and preserves the quality in ice. It is concluded that a good quality and a shelf life up to 24 days in ice for fresh tiger shrimp can be obtained by packing under vacuum and a shelf life of up to 16 days by packing without vacuum after treating with 30g kg-1 sulfites.

QUALITY CONDITION OF ICE STORED FARMED TIGER SHRIMP 41
41
ACKNOWLEDGEMENTS The authors wish to express their thanks to Dr. Balasaheb Sawant Konkan
Krishi Vidyapeeth, Dapoli for funding this work and Associate Dean, Fisheries College, Shirgaon for cooperation in carrying out this study.
REFERENCES Antony, M. M., Jeyasekaran, G., Shakila, R.J. and Shanmugam, S.A. 2002. Bio-chemical
quality of raw shrimps processed in seafood processing plants located in Tuticorin region of Tamil Nadu. Indian Journal of Food Science Technology, 39: 698-701
AOAC. 2000. Official Methods of Analysis of the Association of Official Analytical Chemists. 12th ed. Washington DC
Baug, T. E. 2008. Application of hurdle technology in preparation of soft-moist prawns (Parapenaeopsis stylifera). M. Sc. (Fish.) diss. Dr. Balasaheb Sawant Konkan Krishi Vidyapeeth, Dapoli, Maharashtra
Benjakul, S. and Morrissey, T. 1997. Measurement of spoilage in fish. Journal of Fish Research Bd Canada, 3: 77-91
Chakrabarti, R. and Gupta, S.S. 1998. Studies on phenoloxidase activity and its sensitivity to metabisulfite in frozen Metapenaeus monoceros. Fishery Technology, 35: 30-33
Chakrabarti, R., Gupta, S.S., Rao, C.C.P. and Basu, S. 1992. Control of black discolouration in raw shrimps from tropical region. Fishery Technology, 29: 84-85
Conway, E.J. 1950. Micro diffusion Analysis and volumetric Error. Crosby, Lockwood, London
Dalgaard, P., Gram, L. and Huss, H.H. 1993. Spoilage and shelf life of cod fillets packed in vacuum or modified atmospheres. International Journal of Food Microbiology, 19: 283-294
FAO. 2009. Fishery and Aquaculture statistics 2007. Food and Agriculture Organization of the United Nations, Rome
Gomez-Guillen, M.C., Martinez-Alvarez, O., Liarnas, A. and Montero, P. 2005. Melanosis inhibition and SO2 residual levels in shrimps (Parapenaeus longirostris) after different sulfite-based treatments. Journal of Science Food and Agriculture, 85: 1143-1148
Govindan, T.K. 1972. Research on Freezing Preservation of Fish in India-a review. Indian Food Packer, 26: 52-59
Hanpongkittikun, A., Siripongvutikorn, S. and Cohen, D.L. 1995. Black tiger shrimp (Penaeus monodon) quality changes during iced storage. Asian Food Journal, 10: 125-130
Haung, Y.W., Koehler, P.E., Eitenmiller, R.R. and Lillard, D.A. 1991. Effect of packaging on the storage quality of iced channel catfish. In proc. Fifteenth Annual Conference of tropical and subtropical Fisheries, Sea Grant, Florida University, Gainesville (USA)
Jeyasekaran, G., Maheswari, K., Shakila, R.J., Ganesan, P. and Akshmanan, R.L. 2004. Bacterial quality of vacuum packed Tuna (Euthynnus affinis) chunks stored under abused refrigerated temperatures. Asian Fish Science, 17: 217-227
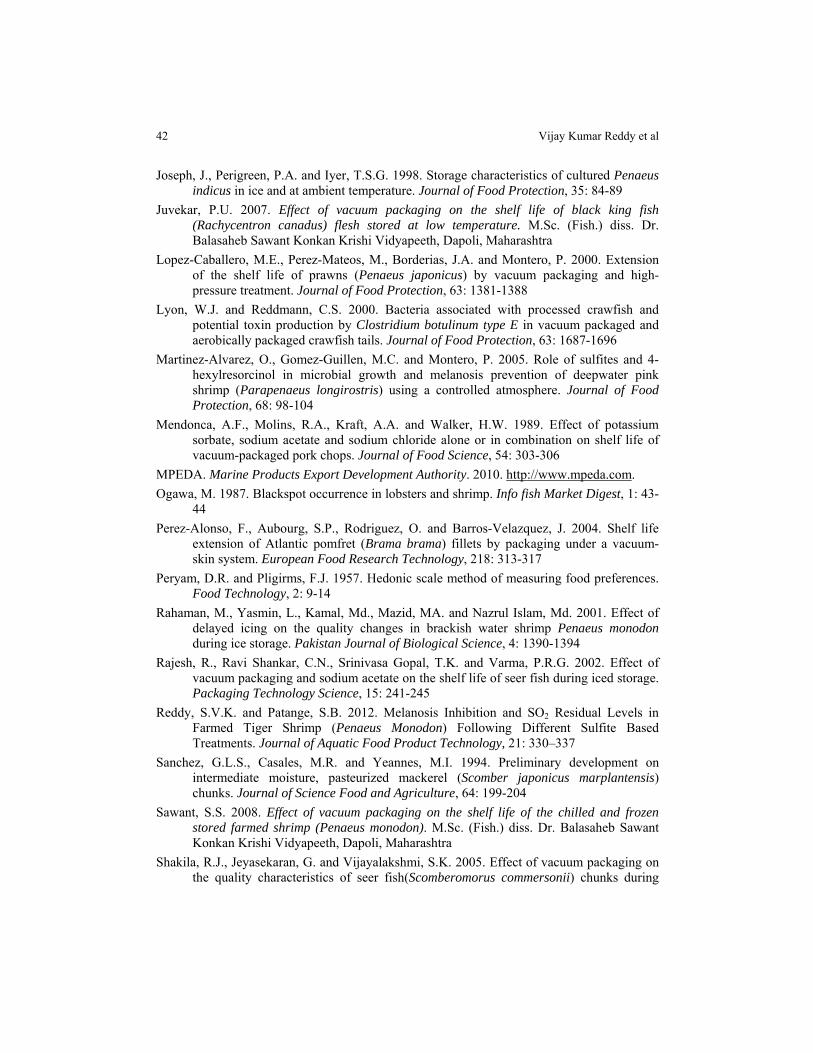
42 Vijay Kumar Reddy et al
Joseph, J., Perigreen, P.A. and Iyer, T.S.G. 1998. Storage characteristics of cultured Penaeus indicus in ice and at ambient temperature. Journal of Food Protection, 35: 84-89
Juvekar, P.U. 2007. Effect of vacuum packaging on the shelf life of black king fish (Rachycentron canadus) flesh stored at low temperature. M.Sc. (Fish.) diss. Dr. Balasaheb Sawant Konkan Krishi Vidyapeeth, Dapoli, Maharashtra
Lopez-Caballero, M.E., Perez-Mateos, M., Borderias, J.A. and Montero, P. 2000. Extension of the shelf life of prawns (Penaeus japonicus) by vacuum packaging and high-pressure treatment. Journal of Food Protection, 63: 1381-1388
Lyon, W.J. and Reddmann, C.S. 2000. Bacteria associated with processed crawfish and potential toxin production by Clostridium botulinum type E in vacuum packaged and aerobically packaged crawfish tails. Journal of Food Protection, 63: 1687-1696
Martinez-Alvarez, O., Gomez-Guillen, M.C. and Montero, P. 2005. Role of sulfites and 4-hexylresorcinol in microbial growth and melanosis prevention of deepwater pink shrimp (Parapenaeus longirostris) using a controlled atmosphere. Journal of Food Protection, 68: 98-104
Mendonca, A.F., Molins, R.A., Kraft, A.A. and Walker, H.W. 1989. Effect of potassium sorbate, sodium acetate and sodium chloride alone or in combination on shelf life of vacuum-packaged pork chops. Journal of Food Science, 54: 303-306
MPEDA. Marine Products Export Development Authority. 2010. http://www.mpeda.com. Ogawa, M. 1987. Blackspot occurrence in lobsters and shrimp. Info fish Market Digest, 1: 43-
44 Perez-Alonso, F., Aubourg, S.P., Rodriguez, O. and Barros-Velazquez, J. 2004. Shelf life
extension of Atlantic pomfret (Brama brama) fillets by packaging under a vacuum-skin system. European Food Research Technology, 218: 313-317
Peryam, D.R. and Pligirms, F.J. 1957. Hedonic scale method of measuring food preferences. Food Technology, 2: 9-14
Rahaman, M., Yasmin, L., Kamal, Md., Mazid, MA. and Nazrul Islam, Md. 2001. Effect of delayed icing on the quality changes in brackish water shrimp Penaeus monodon during ice storage. Pakistan Journal of Biological Science, 4: 1390-1394
Rajesh, R., Ravi Shankar, C.N., Srinivasa Gopal, T.K. and Varma, P.R.G. 2002. Effect of vacuum packaging and sodium acetate on the shelf life of seer fish during iced storage. Packaging Technology Science, 15: 241-245
Reddy, S.V.K. and Patange, S.B. 2012. Melanosis Inhibition and SO2 Residual Levels in Farmed Tiger Shrimp (Penaeus Monodon) Following Different Sulfite Based Treatments. Journal of Aquatic Food Product Technology, 21: 330–337
Sanchez, G.L.S., Casales, M.R. and Yeannes, M.I. 1994. Preliminary development on intermediate moisture, pasteurized mackerel (Scomber japonicus marplantensis) chunks. Journal of Science Food and Agriculture, 64: 199-204
Sawant, S.S. 2008. Effect of vacuum packaging on the shelf life of the chilled and frozen stored farmed shrimp (Penaeus monodon). M.Sc. (Fish.) diss. Dr. Balasaheb Sawant Konkan Krishi Vidyapeeth, Dapoli, Maharashtra
Shakila, R.J., Jeyasekaran, G. and Vijayalakshmi, S.K. 2005. Effect of vacuum packaging on the quality characteristics of seer fish(Scomberomorus commersonii) chunks during
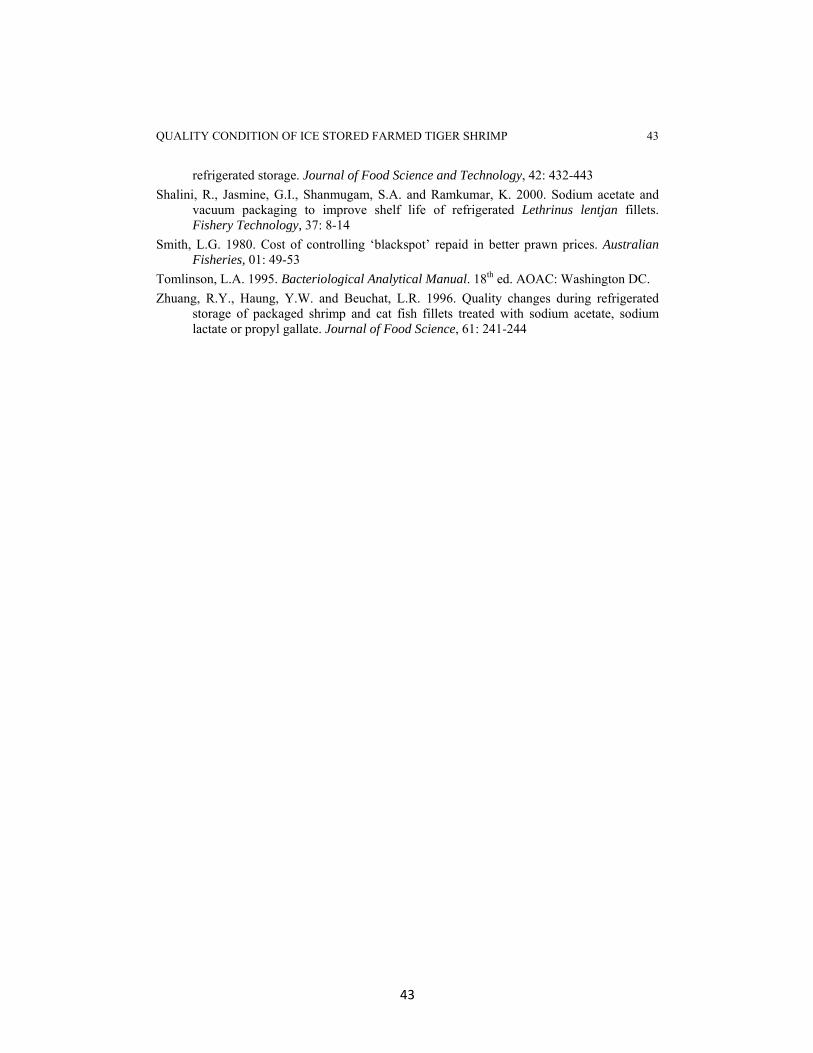
QUALITY CONDITION OF ICE STORED FARMED TIGER SHRIMP 43
43
refrigerated storage. Journal of Food Science and Technology, 42: 432-443 Shalini, R., Jasmine, G.I., Shanmugam, S.A. and Ramkumar, K. 2000. Sodium acetate and
vacuum packaging to improve shelf life of refrigerated Lethrinus lentjan fillets. Fishery Technology, 37: 8-14
Smith, L.G. 1980. Cost of controlling ‘blackspot’ repaid in better prawn prices. Australian Fisheries, 01: 49-53
Tomlinson, L.A. 1995. Bacteriological Analytical Manual. 18th ed. AOAC: Washington DC. Zhuang, R.Y., Haung, Y.W. and Beuchat, L.R. 1996. Quality changes during refrigerated
storage of packaged shrimp and cat fish fillets treated with sodium acetate, sodium lactate or propyl gallate. Journal of Food Science, 61: 241-244
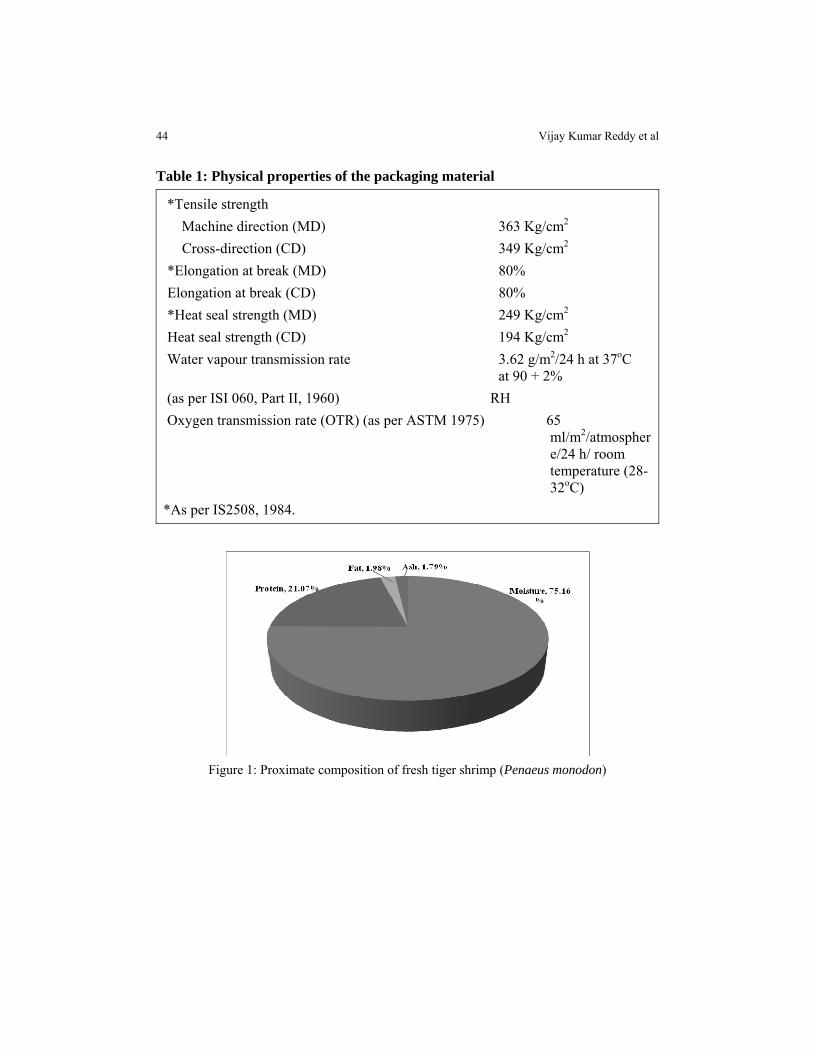
44 Vijay Kumar Reddy et al
Table 1: Physical properties of the packaging material
*Tensile strength Machine direction (MD) 363 Kg/cm2 Cross-direction (CD) 349 Kg/cm2 *Elongation at break (MD) 80% Elongation at break (CD) 80% *Heat seal strength (MD) 249 Kg/cm2 Heat seal strength (CD) 194 Kg/cm2 Water vapour transmission rate 3.62 g/m2/24 h at 37oC at 90 + 2% (as per ISI 060, Part II, 1960) RH Oxygen transmission rate (OTR) (as per ASTM 1975) 65
ml/m2/atmosphere/24 h/ room temperature (28-32oC)
*As per IS2508, 1984.
Figure 1: Proximate composition of fresh tiger shrimp (Penaeus monodon)

QUALITY CONDITION OF ICE STORED FARMED TIGER SHRIMP 45
45
Figure 2: Changes in TMA-N (mg%) content in tiger shrimp during ice storage
Figure 3: Changes in TVB-N (mg%) content in tiger shrimp during ice storage
Figure 4: Changes in pH in tiger shrimp during ice storage
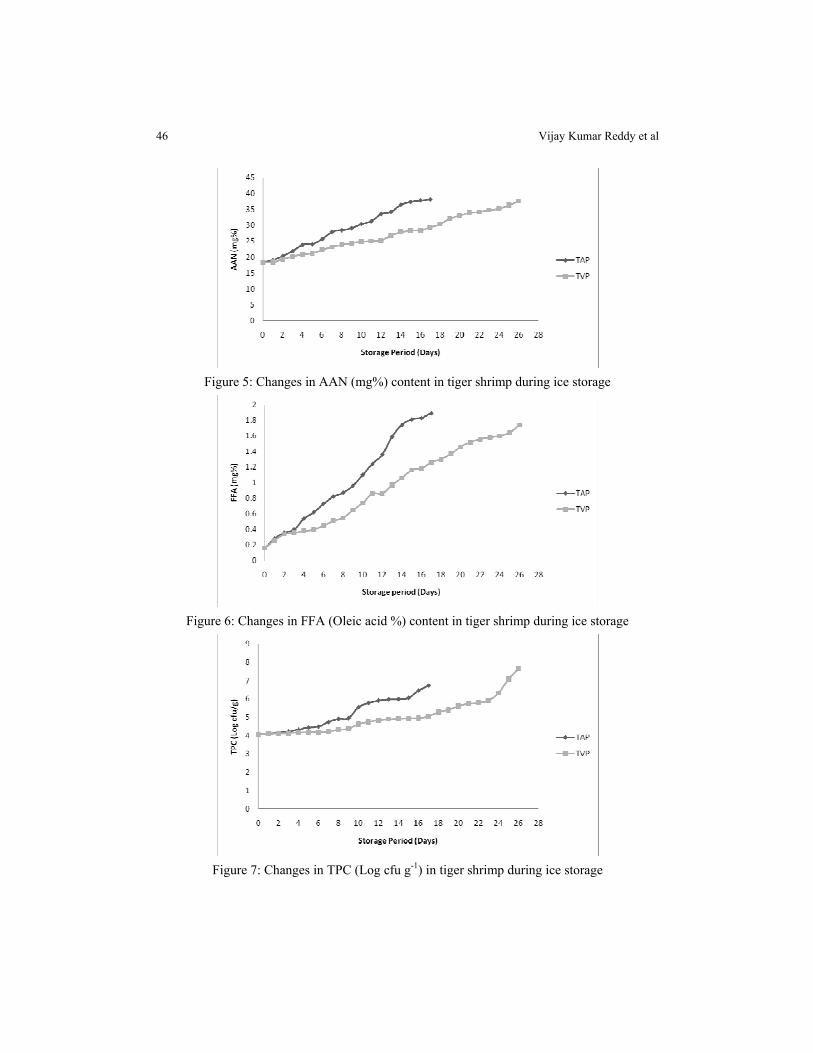
46 Vijay Kumar Reddy et al
Figure 5: Changes in AAN (mg%) content in tiger shrimp during ice storage
Figure 6: Changes in FFA (Oleic acid %) content in tiger shrimp during ice storage
Figure 7: Changes in TPC (Log cfu g-1) in tiger shrimp during ice storage
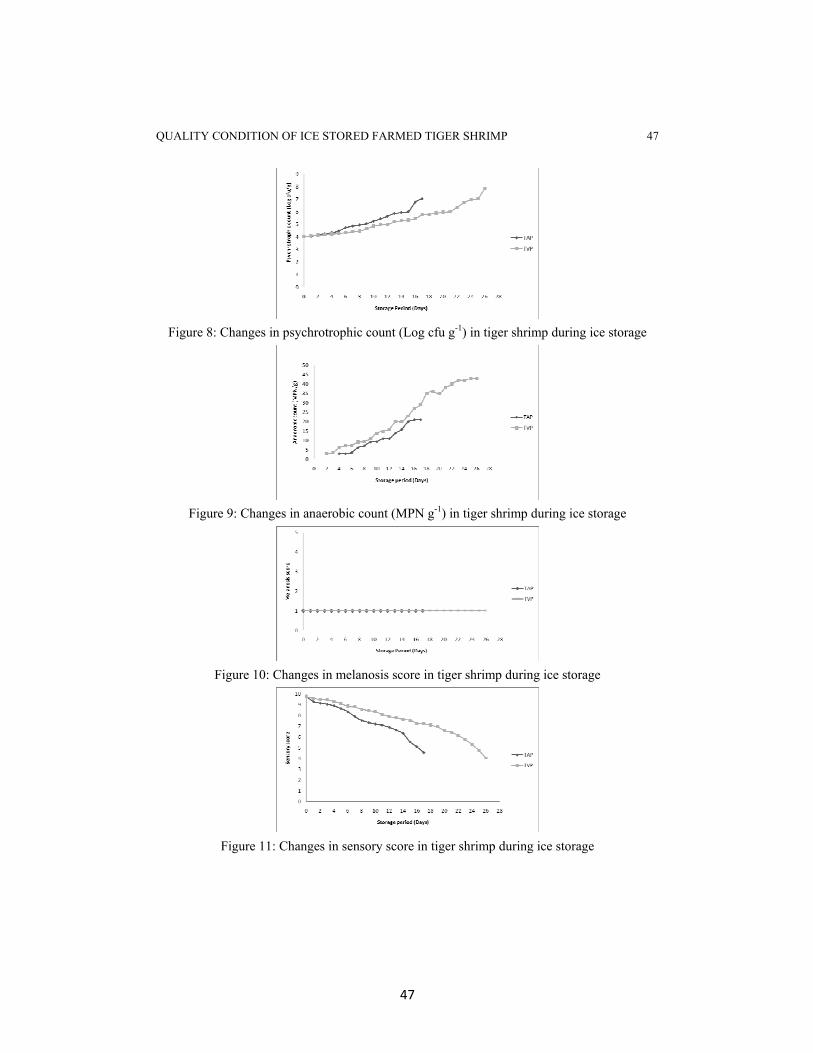
QUALITY CONDITION OF ICE STORED FARMED TIGER SHRIMP 47
47
Figure 8: Changes in psychrotrophic count (Log cfu g-1) in tiger shrimp during ice storage
Figure 9: Changes in anaerobic count (MPN g-1) in tiger shrimp during ice storage
Figure 10: Changes in melanosis score in tiger shrimp during ice storage
Figure 11: Changes in sensory score in tiger shrimp during ice storage

SAARC J. Agri., 11(2): 49-59 (2013)
EFFECT OF INTEGRATED DISEASE MANAGEMENT PACKAGES ON DISEASES INCIDENCE AND BULB
YIELD OF ONION (Allium cepa L.)
R. C. Gupta* and R. P. Gupta National Horticultural Research and Development Foundation, Nashik-422 003 (Maharashtra) India
ABSTRACT
A field experiment was conducted to find out the effect of different integrated disease management (IDM) packages on severity of basal rot (Fusarium oxysporum), white rot (Sclerotium rolfsii) and stemphylium blight (S. vesicarium) diseases, and bulb yield of onion (Allium cepa L.) variety Agrifound Light Red. Nine IDM packages consisting of NPK fertilizers, farm yard manure, biocontrol agents and spray of fungicides starting from 30 days of transplanting at 15 days interval were applied. The incidence of basal rot and white rot of onion bulbs ranged from 0.98-4.31% and 0.00-0.96%, respectively. The highest incidence of basal rot (4.31%) and white rot (0.96) was recorded in bulbs harvested from untreated control. The lowest incidence of basal rot (0.98%) was found in bulbs harvested from the IDM package consisting of NPK @ 100:50:50 kg ha-1 + FYM @ 10 t ha-1 + vermicompost @ 1 t ha-1 + Ps. fluorescens @ 5 kg ha-1 + copper oxychloride @ 0.3%). White rot did not appear under this package. The lowest Stemphylium blight intensity (3.87%) was achieved with the package having four foliar sprays of propiconazole @ 0.1% followed by mancozeb @ 0.25% and copper oxychloride @ 0.3%. The IDM package increased the bulbs yield over standard check by 25.54% and over untreated control by 109.42%. The average highest bulb diameter (54.15 mm) and bulb size index (23.27 cm2) and lowest incidence (0.98%) of basal rot disease in onion bulbs was also obtained with IDM package consisting of NPK @ 100:50:50 kg ha-1 + FYM @ 10 t ha-1 + vermicompost @ 1 t ha-1 + Ps. fluorescens @ 5 kg ha-1 + copper oxychloride @ 0.3%). Key words: Allium cepa, integrated disease management.
* Corresponding author email:[email protected] Received: 04.12.2012

50 R. C. Gupta* and R. P. Gupta
INTRODUCTION Onion (Allium cepa L.) is an exportable bulb crop among the cultivated Allium
species in India. The country is a traditional exporter of fresh onion with 67% share of the total export of fresh vegetables. Onion is exported to the Iran, UAE, Malaysia, Bangladesh, Sri Lanka, Indonesia, Vietnam, Reunion France and Singapore (Anonymous 2008). Onion is cultivated in summer (Rabi), rainy (Kharif) and dry periods (late Kharif) seasons in the country and maximum area under cultivation is being covered in Rabi season. India ranks second in cultivated area as well as onion production in the world. It has been estimated that more than 25% yield losses occur due to foliar diseases, especially Stemphylium blight (S. vesicarium) and purple blotch (Alternaria porri). Onion crop also suffers from basal rot (Fusarium oxysporum) and white rot (Sclerotium rolfsii) diseases causing various extents of losses (Entwistle, 1990). About 30-40% storage losses in onion occur due to incidence of Fusarium basal rot (Gupta et al., 2008; Barnoczkine, 1986). The diseases are also responsible for deterioration of export quality of onion bulbs (Gupta et al., 2009).
Trichoderma viride and Pseudomonas fluorescens have antagonistic capacity against plant pathogens which enhance systemic acquired resistance and plant growth promoting character. Pseudomonas fluorescens plays an important role in phosphate solubilization which improves the soil and plant health. Scanty information is available on quality production of onion by approaching integrated crop health and disease management (Gupta et al., 2009).
Gupta et al., (2008) conducted in-vitro study for the management of soil borne fungal pathogens like Fusarium oxysporum and Sclerotium cepivorum using bio agents and oil cakes and findings indicated that T. viride inhibited 50.74% mycelia growth as well as 93.59% inhibition in sclerotia production of S. cepivorum while 70.40% inhibition in mycelia growth of F. oxysporum. Gupta et al. (2011) reported that basal rot and white rot in onion can be managed by the application of Trichoderma viride, T. harzianum and Pseudomonas fluorescens. In view of the above facts, the present study was undertaken to find out the effect of different IDM packages on severity of soil borne and foliar diseases, and yield of onion.
MATERIALS AND METHODS The integrated disease management packages were: T1=N-P-K (100:50:50) +
FYM @ 20t ha-1 + T. viride @ 5kg ha-1 + Spray of propiconazole @ 0.1%, T2= N-P-K (100:50:50) + Vermicompost @ 2 t ha-1 + T. viride @ 5 kg ha-1 + Spray of propineb @ 0.25%, T3= N-P-K (100:50:50) + FYM @ 10 t ha-1 + Vermicompost @ 1t ha-1 + T. viride @ 5 kg ha-1 + Spray of copper oxychloride @ 0.3%, T4-= N-P-K (100:50:50) + FYM @ 10 t ha-1 + Vermicompost @ 1t ha-1 + Ps. fluorescens @ 5 kg ha-1 + Spray of copper oxychloride @ 0.25%, T5= N-P-K (100:50:50) + FYM @ 20 t ha-1 + T. viride @ 5 kg ha-1 + Seedling root dip (10g T.viride+100g FYM + 1lit.

INTEGRATED DISEASE MANAGEMENT PACKAGES ON DISEASES INCIDENCE 51
water) +Spray of propiconazole @ 0.1%, T6= N-P-K (100:50:50) + FYM @ 20 t ha-1 + Ps. fluorescens @ 5 kg ha-1 + Seedling root dip (10g Ps. fluorescens +100g FYM + 1lit. water) +Spray of propineb @ 0.25%, T7= N-P-K (100:50:50) + FYM @ 10 t ha-1 + Vermicompost @ 1t ha-1 + T. viride @ 5 kg ha-1 + Ps. fluorescens @ 5 kg ha-
1 + Spray of copper oxychloride @ 0.3%, T8= N-P=K (100:50:50) + foliar spray of polyfeed and multi-k @ 1.0% with foliar spray of Mancozeb @ 0.25% (standard check) and T9= Untreated Control
The experiment was conducted during Rabi, 2008-09 and 2009-10 in the experimental farm of Regional Research Station, National Horticultural Research and Development Foundation, Nashik, India. The soil of the experimental field was black soil in texture, having pH-7.2, EC-0.155, organic carbon 0.57%, available phosphorus 47.09 kg ha-1 and potash 414.80 kg ha-1. The field was prepared following standard methods for good tilth (Singh et al., 2001) and divided into 3.0m x 1.5m unit plots maintaining 0.50 m space between plots. Drain was made around the unit plots by digging soil from the space between plots. The soil of the drain was used to raise the unit plot. The experiment was laid out in a randomized complete block design with 3 replications. Eight weeks old onion seedlings of variety Agrifound Light Red were transplanted maintaining 10.0 cm plant to plant and 15.0 cm row to row distances. The dosage of manure, fertilizers, biopesticides and fungicides were the same according to IDM packages selected for the experiment. Manure and fertilizers were applied at the time of final land preparation. Trichoderma viride (2x10⁶ cfu g-1) and Pseudomonas fluorescens (2x10⁸ cfu g-1) were obtained from M/s. Sun Agro Biosystem Pvt. Ltd., Chennai. The biopesticides were applied to the soil before transplanting or by dipping roots of seedlings in their suspensions before transplanting. Spraying of the fungicides for the management of foliar diseases was started after 30 days of transplanting. A total of 4 sprays were given at 15 days intervals started after 30 days of transplanting. The insecticide deltamethrin @ 0.1% was sprayed uniformly to control insect pest.
All the recommended intercultural practices were followed to grow the crop. Irrigation was applied at regular intervals to maintain the optimum moisture level in the field. The crop was harvested at bulbs maturity. The incidence and intensity of basal rot and white rot of bulbs were recorded after harvesting based on the covering area of infected bulb by the fungal pathogen following 0 to 5 scales. The severity of Stemphylium blight was indexed at 30, 45, 60 and 75 days after transplanting on a 0-5 scale and Percent Disease Index (PDI) was computed (Sharma, 1995). Data on incidence and intensity of basal rot and white rot disease of onion bulbs, exportable bulb yield, gross yield and bulb size were recorded after harvest. The data recorded in two consecutive years were pooled and analyzed statistically by Randomized Block Design. The cost benefit ratio was also computed.

52 R. C. Gupta* and R. P. Gupta
RESULTS AND DISCUSSION Incidence of basal rot and white rot diseases
The incidence of basal rot and white rot diseases in onion bulbs ranged from 0.98-4.31% and 0.00-0.96%, respectively. The highest incidence of basal rot as well as white rot was recorded in bulbs harvested from untreated control. The lowest incidence of basal rot (0.98%) was found in bulbs harvested from the treatment T4 (NPK @ 100:50:50 + FYM @ 10 t ha-1 + vermicompost @ 1 t ha-1 + Ps. fluorescens @ 5 kg ha-1 + copper oxychloride @ 0.3%). White rot did not appear under this treatment (T4). However, the lowest incidence of the disease (0.18%) was recorded from T5 (NPK @ 100:50:50 kg ha-1 + FYM @ 20 t ha-1 + T. viride @ 5 kg ha-1 + seedling root dip (10g T.viride+100g FYM + 1 liter water + spray of propiconazole at 0.1%). It was found that soil application of Ps. fluorescens and Trichoderma viride supplemented with root dip method effectively control the soil borne fungal disease of onion. The data presented in figure 4 revealed that 100% control of white rot disease and maximum control of basal rot disease were obtained with the application of Ps. fluorescens @ 5 kg ha-1 in the soil in treatment T4 as compared to the untreated control. The present study revealed that Ps. fluorescens was most effective against soil borne disease of onion followed by T. viride (Table 1).
Data presented in figure 4 revealed that 100% control of white rot and basal rot of onion bulb was obtained with soil application of Ps. fluorescens @ 5kg ha-1 followed by T. viride @ 5 kg ha-1 as soil application as well as seedling root dip (10g T.viride+100g FYM + 1liter water) compared to the results of the present study reveal that Ps. fluorescens and T. viride is most effective against soil borne diseases of onion.
Rajendran and Rangnathan (1996) reported that soil application of T. viride and other species were effective against basal rot (Fusarium oxysporum) pathogen. Other workers also reported that biocontrol agents such as T. viride, Gliocladium zeae and Coniothyrium minitans gave effective control of white rot disease of onion caused by Sclerotium rolfsii (Gupta et al., 2011; Ahmad and Tribe, 1977). Incidence and intensity of Stemphylium blight disease
All the tested fungicides significantly reduced incidence and intensity of Stemphylium blight (Stemphylium vesicarium) over control. The lowest Stemphylium blight incidence (25.0%) was recorded before 4th spray of propiconazole @ 0.1% (T5) and mancozeb @ 0.25% (T8). However, the lowest Stemphylium blight intensity (3.87%) was achieved with sprays of propiconazole @ 0.1% followed by intensity (4.20 %) in mancozeb @ 0.25%. Significantly the highest Stemphylium blight incidence (43.0%) and intensity (9%) was recorded from untreated control (Table 2).
Propiconazole @ 0.1% was most effective against foliar diseases as well as increasing the onion bulb yield and could be recommended as curative measure against Stemphylium blight as an ad-hoc decision making component of integrated disease management strategy (Table 2).
INTEGRATED DISEASE MANAGEMENT PACKAGES ON DISEASES INCIDENCE 53
The data presented in figure 3 revealed that the highest control of Stemphylium blight intensity (62.21%) of onion was achieved with foliar sprays of propiconazole @ 0.1% followed by mancozeb @ 0.25% (55.63 and copper oxychloride @ 0.3% (54.78%). The results of the present study reveal that propiconazole was the most effective against Stemphylium blight followed by mancozeb and copper oxychloride.
Gupta et al. (1996) reported that spray of contact fungicide mancozeb @ 0.25% reduced the incidence and intensity of Stemphyllium blight in onion. Foliar spray of mancozeb @ 0.25 % was also recommended by some other workers for the control of foliar diseases of onion like Stemphyllium blight and purple blotch (Alternaria porri) of onion (Borkar and Patil, 1995; Srivastava et al., 1999; Mathur and Sharma, 2006; Gupta et al., 2011a & b). Mathur and Sharma (2006) reported that spraying of mancozeb @ 0.2% and copper oxychloride @ 0.3% thrice at 15 days intervals significantly superior in reducing purple blotch and Stemphylium blight as well as increasing the yield of onion bulbs. Gupta and Pandey (2011) conducted a field study on management of foliar diseases of onion and reported that propiconazole and mancozeb sprays at 15 days intervals effectively controlled the foliar diseases of onion. Exportable and gross yield of onion Significantly highest exportable onion bulb yield (289.63 t ha-1) as well as gross yield (311.81 t ha-1) was recorded from the IDM package T4 (NPK @ 150:50:50 + FYM @ 10 t ha-1 + vermicompost @ 1 t ha-1 + Ps. fluorescens @ 5 kg ha-1 + copper oxychloride @ 0.3%) which was followed by yield the treatment T6 (N.P.K. @100:50:50 + FYM @ 20 t ha-1 + Ps. fluorescens @ 5 kg ha-1 + seedling root dip (10g Ps. fluorescens +100g FYM + 1 lit. water) + Spray of propineb @ 0.25% and treatment T5 (Table 1). Significantly the highest bulb diameter (54.15 mm) and bulb size index (23.27 cm2) was recorded in the package T4. The highest cost benefit ratio (1: 4.24) was also recorded in this package (T4). However, the lowest exportable yield of onion bulbs (230.89 t ha-1) was recorded in standard check T8 (NPK (100:50:50) + foliar spray of polyfeed and multi-k @ 1.0% with foliar spray of Mancozeb @ 0.25%) and the lowest exportable yield (13.830 t ha-1) was observed under control. The highest gross yield (31.181t ha-1) of onion bulbs was also recorded from treatment T4 which was at par with other treatments except gross yield noticed in treatment T3 (N.P.K. (100:50:50) + FYM @ 10 t ha-1 + vermicompost @ 1t ha-1 + T. viride @ 5 kg ha-1 + Spray of copper oxychloride @ 0.3%) and untreated check (Table 1). Figures 1 and 2 show that, remarkably higher exportable yield of onion bulbs was observed in integrated nutrient applying chemical fertilizers along with organic manures (T4) which caused an increase of 25.44% over recommended doses of NPK fertilizers (standard check) and 109.42% over untreated control. The findings of the present study revealed that judicious use of fertilizers, organic manures, and chemical pesticides supplemented with biopesticide are effective to

54 R. C. Gupta* and R. P. Gupta
increase yield as well as quality of the onion bulb. The improvement in bulb diameter, size index and yield attributes due to phosphate solubilizers may be due to the ability of Ps. fluorescens to solubilize and increase availability from insoluble or fixed phosphorus to soluble or readily available phosphorus (P). Similar findings have been reported by other workers (Gupta, 2009; Verma and Mathur, 1989). The favorable nutritional environment in the root zone created by the addition of organic manures and biofertilizers resulted in increased absorption of the nutrients from soil which was responsible for increasing the yield of onion bulbs (Gupta et al., 2009). Similar findings have been reported in carrot (Luzzati et al., 1980) and in potato (Mandal and Roy, 2001). The higher yield was obtained in potato based cropping systems by the use of fertilizers in combination with organic manures than the use of inorganic fertilizers alone (Sharma and Dua, 1995). Studies conducted on integrated nutrient management (INM) in onion bulb crop improved the quality and yield of onion bulbs through integration of chemical fertilizers along with organic manures (Singh et al., 2001).
CONCLUSION The findings of the present study revealed that application of NPK @ 100:50:50 + FYM @ 10 t ha-1 + vermicompost @ 1 t ha-1 + Ps. fluorescens @ 5 kg ha-1 with foliar spray of copper oxychloride @ 0.3% was adjudged better in increasing the yield of export quality onion bulbs. Four sprays of mancozeb @ 0.25% and propiconazole @ 0.1% starting from 30 days after transplanting with an interval of 15 days are effective to reduce foliar diseases of onion.
REFERENCES Ahmad, A.H.M., and Tribe, H.T. 1977. Biological control of white rot of onion (Sclerotium
cepivorum) by Coniothyrium minitans. Plant Pathology, 26:75-78 Anonymous. 2008. Agriculture Year Book. Agriculture Today. The National Agriculture
Magazine. pp, 91 Barnoczkine, Stoilova E.1986. Possibilities to control Fusarium on onions.
Zoldsegtermesztesi kutato Intezet Bulletinje, 19:33 Borkar, S.G., and Patil, B.S. 1995. Chemical control of purple blotch of onion. Indian
Journal of Mycology and Plant Pathology, 25 (3): 289-290 Gupta, R. C., Pandey, N. K. and Bhonde, S. R. 2008.Evaluation of oil-cakes and bioefficacy
of Trichoderma viride on soil borne fungal pathogens on onion and garlic. National symposium on the biotechnology in plant disease management for sustainable crop protection held at ARI, Pune on September, 17-18, 2008. Abstract. PP- 39
Entwistle, A.R. 1990. Root Diseases. In Onions and Allied Crops Vol. II Eds. H.D. Rabinowitch and J.L. Brewster, CRC Press Inc. Florida 103-154
Gupta, R. C., Srivastava, K. J. and Gupta R. P. 2011. Management of economically important soil borne diseases in onion bulb crop. National symposium on vegetable biodiversity held at JNKVV, Jabalpur on April 04-05, 2011. PP-87
INTEGRATED DISEASE MANAGEMENT PACKAGES ON DISEASES INCIDENCE 55
Gupta, R.C., and Pandey, N.K. 2011. Integrated disease management for the production of export quality onion bulbs (Allium cepa L.). (Abstr.). National Symposium on Alliums: Current scenario and Emerging Trends held on March, 12-14 organized by Directorate of Onion and Garlic Research, Pune,236pp
Gupta, R.C., Yadav, S.P., and Srivastava, K.J. 2011. Studies on management of foliar diseases of onion (Allium cepa L.) through recommended pesticides and their residue status after harvest. (Abstr.). National Symposium on Alliums: Current scenario and Emerging Trends held on March, 12-14 organized by Directorate of Onion and Garlic Research , Pune, 234-235pp
Gupta, R.P., Srivastava, P.K., and Sharma, R.C. 1996. Efficacy of fungicides and their spray intervals on the control of purple blotch and stemphylium blight disease of onion. NHRDF Newsletter, 16 (4):11-13
Gupta, R. C., Pandey, Sujay and Srivastava, K. J.2009. Integrated crop management for the production of export quality onion bulb (Allium cepa L.). Proceeding of international conference on horticulture- Horticulture for livelihood security & economic growth held on Nov., 09-12, 2009 at Bangalore. PP- 687-690
Luzzati, A., Bressey, G., and Campanello, N.S.1980. Interaction between organic and mineral manuring in vegetable crop: Experiments on carrot. Amalidella Facalta di Agraria, 10:3-22
Mathur, K., and Sharma, S.N. 2006. Evaluation of fungicides against Alternaria porri and Stemphyllium vesicarium disease of onion in Rajasthan. Journal of Mycology and Plant Pathology, 36 (2):323-324
Mondal, S.S., and Roy, B. 2001. Effect of potassium applied with or without sulphur and farm yard manure on the yield and nutrient uptake by crops in potato-jute-rice sequence. Indian J. Agric. Sci., 71 (2):116-117
Rajendran, K., and Rangnathan, K. 1996. Biological control of onion basal rot Fusarium oxysporum f. sp. cepae by combining application of fungal and bacterial antagonists. Journal of Biological control, 10 (1-2):97-102
Sharma, R.C., and Dua, K. 1995. Fertilizer management in potato based cropping systems in India. Fert. News, 40:79-90
Singh, D.K., Pandey, A.K., Pandey, U.B., and Bhonde, S.R. 2001. Effect of Farm Yard Manure combined with foliar application of NPK mixture and micro nutrients on growth, yield and quality of onion. NHRDF Newsletter, 21 (3-4):1-10
Srivastava, P.K., Tiwari, B.K., and Srivastava, K.J. 1999. Effect of different fungicides and spray intervals on the control of purple blotch disease of late Kharif onion. NHRDF Newsletter, 19 (4):10-11
Gupta, P. K. 2009. Soil, plant, water and fertilizer analysis. Second edition reprinted in 2009 published by Agrobios (India) Agro house, behind Nasrani Cinema, Chopasani Road, Jodhpur. PP- 152-204
Verma, S., and Mathur, R.S. 1989. Biological association between nitrogen fixing and phosphate solubilizing microorganisms. Current Science 58:1099-1100
Sharma, I. M. 1997. Screening of onion varieties/ lines against purple blotch caused by Alternaria porri under field conditions. Plant Disease Research, 12 (1): 60-61
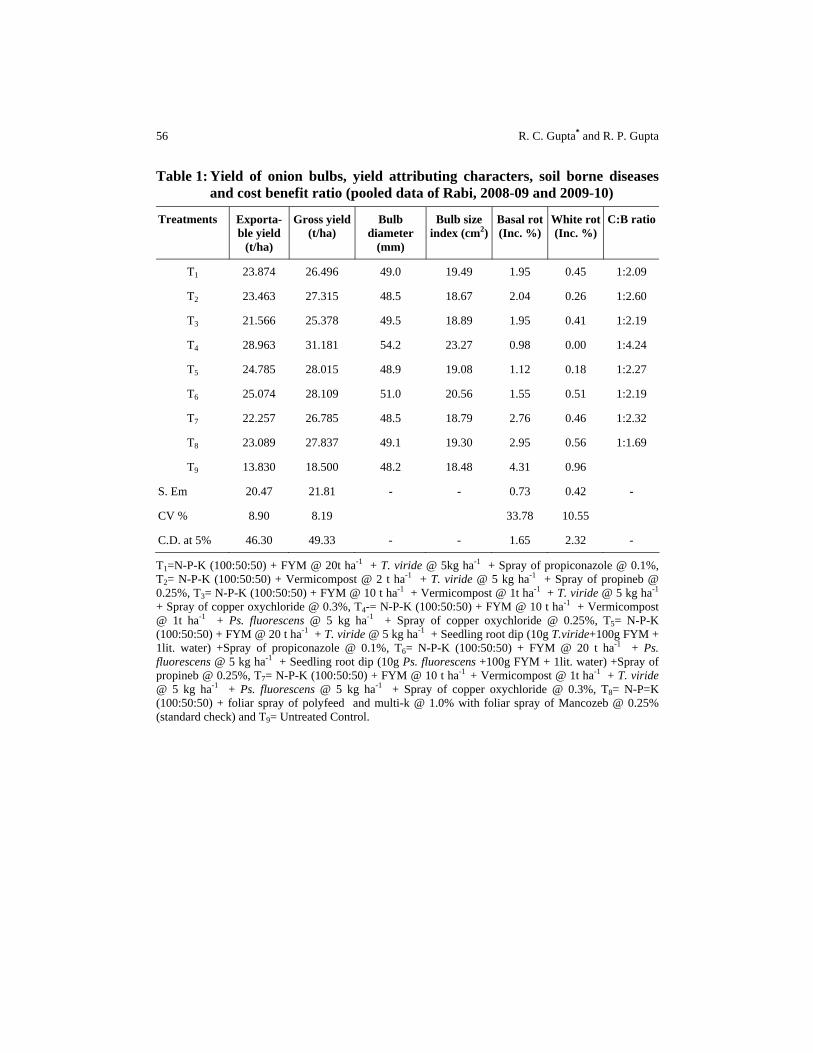
56 R. C. Gupta* and R. P. Gupta
Table 1: Yield of onion bulbs, yield attributing characters, soil borne diseases and cost benefit ratio (pooled data of Rabi, 2008-09 and 2009-10)
Treatments Exporta-ble yield
(t/ha)
Gross yield (t/ha)
Bulb diameter
(mm)
Bulb size index (cm2)
Basal rot (Inc. %)
White rot (Inc. %)
C:B ratio
T1 23.874 26.496 49.0 19.49 1.95 0.45 1:2.09
T2 23.463 27.315 48.5 18.67 2.04 0.26 1:2.60
T3 21.566 25.378 49.5 18.89 1.95 0.41 1:2.19
T4 28.963 31.181 54.2 23.27 0.98 0.00 1:4.24
T5 24.785 28.015 48.9 19.08 1.12 0.18 1:2.27
T6 25.074 28.109 51.0 20.56 1.55 0.51 1:2.19
T7 22.257 26.785 48.5 18.79 2.76 0.46 1:2.32
T8 23.089 27.837 49.1 19.30 2.95 0.56 1:1.69
T9 13.830 18.500 48.2 18.48 4.31 0.96
S. Em 20.47 21.81 - - 0.73 0.42 -
CV % 8.90 8.19 33.78 10.55
C.D. at 5% 46.30 49.33 - - 1.65 2.32 -
T1=N-P-K (100:50:50) + FYM @ 20t ha-1 + T. viride @ 5kg ha-1 + Spray of propiconazole @ 0.1%, T2= N-P-K (100:50:50) + Vermicompost @ 2 t ha-1 + T. viride @ 5 kg ha-1 + Spray of propineb @ 0.25%, T3= N-P-K (100:50:50) + FYM @ 10 t ha-1 + Vermicompost @ 1t ha-1 + T. viride @ 5 kg ha-1 + Spray of copper oxychloride @ 0.3%, T4-= N-P-K (100:50:50) + FYM @ 10 t ha-1 + Vermicompost @ 1t ha-1 + Ps. fluorescens @ 5 kg ha-1 + Spray of copper oxychloride @ 0.25%, T5= N-P-K (100:50:50) + FYM @ 20 t ha-1 + T. viride @ 5 kg ha-1 + Seedling root dip (10g T.viride+100g FYM + 1lit. water) +Spray of propiconazole @ 0.1%, T6= N-P-K (100:50:50) + FYM @ 20 t ha-1 + Ps. fluorescens @ 5 kg ha-1 + Seedling root dip (10g Ps. fluorescens +100g FYM + 1lit. water) +Spray of propineb @ 0.25%, T7= N-P-K (100:50:50) + FYM @ 10 t ha-1 + Vermicompost @ 1t ha-1 + T. viride @ 5 kg ha-1 + Ps. fluorescens @ 5 kg ha-1 + Spray of copper oxychloride @ 0.3%, T8= N-P=K (100:50:50) + foliar spray of polyfeed and multi-k @ 1.0% with foliar spray of Mancozeb @ 0.25% (standard check) and T9= Untreated Control.
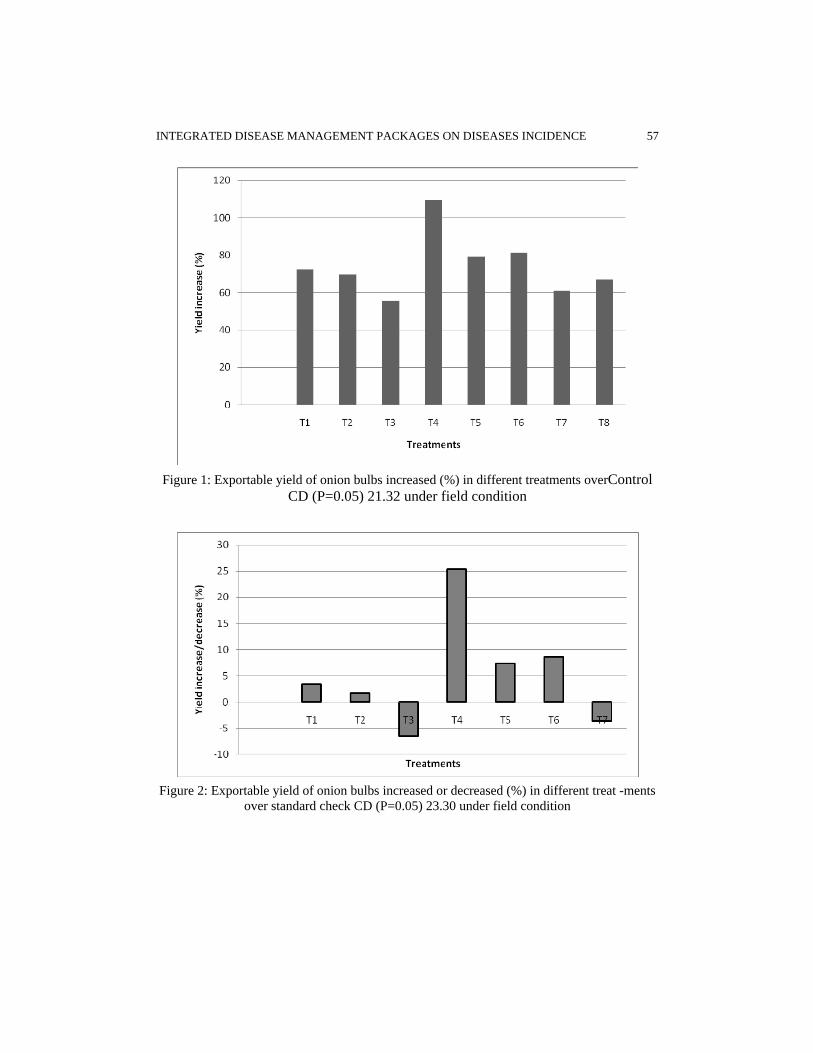
INTEGRATED DISEASE MANAGEMENT PACKAGES ON DISEASES INCIDENCE 57
Figure 1: Exportable yield of onion bulbs increased (%) in different treatments overControl
CD (P=0.05) 21.32 under field condition
Figure 2: Exportable yield of onion bulbs increased or decreased (%) in different treat -ments
over standard check CD (P=0.05) 23.30 under field condition
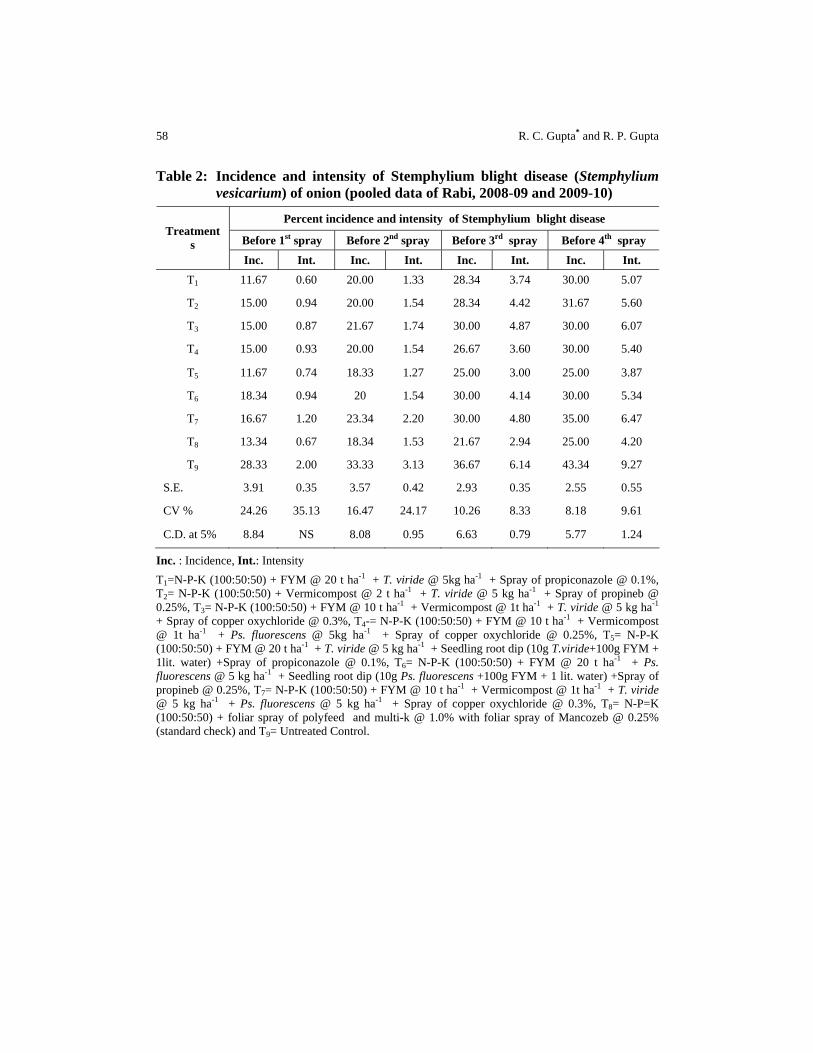
58 R. C. Gupta* and R. P. Gupta
Table 2: Incidence and intensity of Stemphylium blight disease (Stemphylium vesicarium) of onion (pooled data of Rabi, 2008-09 and 2009-10)
Percent incidence and intensity of Stemphylium blight disease
Before 1st spray Before 2nd spray Before 3rd spray Before 4th spray Treatment
s Inc. Int. Inc. Int. Inc. Int. Inc. Int.
T1 11.67 0.60 20.00 1.33 28.34 3.74 30.00 5.07
T2 15.00 0.94 20.00 1.54 28.34 4.42 31.67 5.60
T3 15.00 0.87 21.67 1.74 30.00 4.87 30.00 6.07
T4 15.00 0.93 20.00 1.54 26.67 3.60 30.00 5.40
T5 11.67 0.74 18.33 1.27 25.00 3.00 25.00 3.87
T6 18.34 0.94 20 1.54 30.00 4.14 30.00 5.34
T7 16.67 1.20 23.34 2.20 30.00 4.80 35.00 6.47
T8 13.34 0.67 18.34 1.53 21.67 2.94 25.00 4.20
T9 28.33 2.00 33.33 3.13 36.67 6.14 43.34 9.27
S.E. 3.91 0.35 3.57 0.42 2.93 0.35 2.55 0.55
CV % 24.26 35.13 16.47 24.17 10.26 8.33 8.18 9.61
C.D. at 5% 8.84 NS 8.08 0.95 6.63 0.79 5.77 1.24
Inc. : Incidence, Int.: Intensity T1=N-P-K (100:50:50) + FYM @ 20 t ha-1 + T. viride @ 5kg ha-1 + Spray of propiconazole @ 0.1%, T2= N-P-K (100:50:50) + Vermicompost @ 2 t ha-1 + T. viride @ 5 kg ha-1 + Spray of propineb @ 0.25%, T3= N-P-K (100:50:50) + FYM @ 10 t ha-1 + Vermicompost @ 1t ha-1 + T. viride @ 5 kg ha-1 + Spray of copper oxychloride @ 0.3%, T4-= N-P-K (100:50:50) + FYM @ 10 t ha-1 + Vermicompost @ 1t ha-1 + Ps. fluorescens @ 5kg ha-1 + Spray of copper oxychloride @ 0.25%, T5= N-P-K (100:50:50) + FYM @ 20 t ha-1 + T. viride @ 5 kg ha-1 + Seedling root dip (10g T.viride+100g FYM + 1lit. water) +Spray of propiconazole @ 0.1%, T6= N-P-K (100:50:50) + FYM @ 20 t ha-1 + Ps. fluorescens @ 5 kg ha-1 + Seedling root dip (10g Ps. fluorescens +100g FYM + 1 lit. water) +Spray of propineb @ 0.25%, T7= N-P-K (100:50:50) + FYM @ 10 t ha-1 + Vermicompost @ 1t ha-1 + T. viride @ 5 kg ha-1 + Ps. fluorescens @ 5 kg ha-1 + Spray of copper oxychloride @ 0.3%, T8= N-P=K (100:50:50) + foliar spray of polyfeed and multi-k @ 1.0% with foliar spray of Mancozeb @ 0.25% (standard check) and T9= Untreated Control.

INTEGRATED DISEASE MANAGEMENT PACKAGES ON DISEASES INCIDENCE 59
Figure 3: Percent disease control (PDC) of stemphylium blight in different treatments over
control CD (P=0.05) 13.82 under field condition
Figure 4: Percent disease control (PDC) of basal rot and white rot in different treat--ments
over control CD (P=0.05) 33.95 under field condition
SAARC J. Agri., 11(2): 61-67 (2013)
INTRA AND INTER CLUSTER STUDIES FOR QUANTITATIVE TRAITS IN GARLIC (Allium sativum L)
R. K. Singh*, B. K. Dubey and R. P. Gupta National Horticultural Research and Development Foundation, Nashik-422 003, (Maharashtra) India
ABSTRACT
Garlic is propagated vegetatively, the clonal selection is the important breeding method and very scanty work has been done on the association between different traits in garlic. Analysis of variance revealed significant divergence in fifteen garlic clone with checks i. e. Yamuna Safed (G-1), Agrifound White (G-41), Yamuna Safed-2 (G-50) and Yamuna Safed-3 (G-282) for different traits, indicating sufficient genetic diversity among the cultivars. Genotypes belonging to the cluster with maximum inter cluster distance were genetically more divergent. Therefore, it is suggested that based upon large cluster distances to select genotypes from all the clusters, which may lead to broad spectrum of favorable genetic variability for bulb yield improvement. Cluster-III had highest value of plant height (93.05 cm), bulb diameter (4.71 cm), bulb size index (16.08 cm2), 20 bulb weight (700 g), clove diameter (1.75 cm), clove size index (4.43 cm2), weight of 50 cloves (97.50 g) and gross yield (159.63 t ha-1) and minimum neck thickness (1.45 cm) number of cloves per bulbs (17) days for bulb initiation (61.66 days) and days to harvesting (149.83). The traits total soluble solids contributed maximum (20.46%) toward genetic divergence followed by gross yield (16.37%), bolters (12.86%), marketable yield (11.11%), number of cloves per bulbs (10.52%), weight of 50 cloves (10.52%), days for bulb initiation (10.52%) and days for harvesting (4.09%). These traits were considered to be most important for genetic divergence, they contributed (96.45%) towards genetic divergence and selection of genotypes based on these traits will contribute to wider genetic diversity in the existing gene pool of garlic genotypes. Key words: Garlic, Allium sativum, genetic divergence and D2 analysis
INTRODUCTION Among the spices grown in India, garlic (Allium sativum L.) is undoubtedly
one of the important crops, propagated vegetatively and hence selection and use of
* Corresponding author email:[email protected] Received: 07.03.2013
62 R. K. Singh et al
diverse parents for its improvement through hybridization is difficult. Garlic consumed by almost all the sections of societies and highly placed for its flavor enhancing capacity and good export potential as fresh bulb as well as in the form of dehydrated product (Gupta and Singh, 1998). Lack of high yielding varieties is one of the main constraints in limiting the production and productivity. Garlic exhibits greater susceptibility to agro-techniques and environmental conditions and possesses a wide range of variability for bulb traits and yield attributes as well as the storability in spite of being vegetatively propagated crop. As this crop is propagated vegetatively, the clonal selection is the important breeding method and very scanty work has been done on the association between different traits which are prerequisite for executing a selection programme. Ministry of Agriculture, India estimate; the annual area under garlic during the year 2012-13 was 2.42 lakh ha and production was 12.28 lakh MT with average yield 5.07 t ha-1. Among different states in India, Madhya Pradesh is the leading state accounting for more than 27% of area and 21% of production with average yield of 4.47 t ha-1. The other major garlic growing states are Gujarat, Rajasthan, Orissa, Uttar Pradesh, Maharashtra and Tamilnadu. In India per hectare yield are highest in Kerala (19.0 t ha-1) followed by Manipur (11.91 t ha-
1), Punjab (10.96 t ha-1), Andhra Pradesh (10.38 t ha-1) and West Bengal (9.79 t ha-1) (Bhonde et al, 2012).
Diversity arises either due to geographical separation or due to genetic barriers to cross ability and it plays an important role in plant breeding. The knowledge of genetic diversity, its nature and degree of variability would be helpful for selecting desirable genotypes and cultivars for a successful breeding programme. Application of this method helps us for maintaining large number of germplasm and avoiding the duplicates. To meet the domestic requirement and fulfill the export demand, selection of suitable variety for growing under different agro-climatic condition is necessary. In this regards National Horticultural Research and Development Foundation (NHRDF), collected more than 400 germplasm from different garlic growing areas. Among of those 19 germplasm were selected including four checks on the basis of yield and yield contributing traits. The present study was therefore, conducted to determine the genetic divergence among 15 selected genotypes along with four checks i. e. Yamuna Safed (G-1), Agrifound White (G-41), Yamuna Safed-2 (G-50) and Yamuna Safed-3 (G-282) and factors influencing genetic diversity and variability of economic traits to identify suitable genotypes of garlic.
MATERIALS AND METHODS The experiment was carried out at National Horticultural Research and
Development Foundation, (NHRDF) Salaru, Karnal during 2005-06 and 2006-07. Nineteen diverse genotypes including four checks (released varieties) namely Yamuna Safed (G-1), Agrifound White (G-41), Yamuna Safed-2 (G-50) and Yamuna Safed-3 (G-282) (table-1) were evaluated in randomized complete block design with three replications. Uniform size cloves were selected and planted during the first

QUANTITATIVE TRAITS IN GARLIC 63
fortnight of October in bed of 3.0 m x 1.5 m with a spacing of 10 cm x 7.5 cm. The climate of Karnal is subtropical with minimum and maximum temperature ranging between 20 to 450C and favorable for garlic cultivation during Rabi season. Recommended dose of chemical fertilizer such as 100 kg N, 50 kg P2O5 and 50 kg K per hectare) were adopted to ensure a healthy crop growth and development. Harvesting was done as per maturity of different genotypes. Observations were recorded on 10 randomly selected plants in each replications for all the characters viz.-plant height (cm), leaves per plant, neck thickness (cm), bulb diameter (cm), bulb size index (cm2), weight of 20 bulbs (g), clove diameter (cm), clove size index (cm2), cloves per bulbs, weight of 50 cloves (g), bolters (%), total soluble solid (%), dry matter (%), days for bulb initiation, days for harvesting, gross yield (t ha-1) and marketable yield (t ha-1).
Pooled data of 2006-2008 were analyzed statistically as suggested by Mahalanobis, (1936). “D2” statistics was used to find out generalized distance between the genotypes as per Rao, (1952). The D2 values were determined to have clustering which was done following Tocher’s method. The clusters were grouped in to four divergence classes (DC) on the basis of mean (M) and standard deviation (S).
RESULTS AND DISCUSSION On the basis of D2 values, all the 19 genotypes were grouped in three clusters
(Table-2). Cluster I was largest consisting of 17 genotypes. Cluster II and III had one genotype each. The genotypes belonging to same status or origin were grouped in to different cluster and the genotypes belonging to different origin were grouped in same cluster. The grouping pattern of the genotypes suggested no parallelism between genetic divergence and geographical distribution of genotypes. Singh et al. (2011), Singh et al, (2012), Lokhande et al. (1987), Mohanty (2001) and Mohanty and Prusti (2002) also reported that genotype diversity was independent of geographical region.
Intra and inter cluster D2 values and corresponding genetic distance are presented in table-3. The highest inter cluster value (D2) and genetic distance was noted for cluster-I (852.88), (29.20) while other clusters II and III had zero intra cluster value. Clusters with single genotype (II and III) indicated their independent identity and importance due to various unique characters possessed by them. The intra cluster values were less than inter cluster values indicating the homogenous and heterogeneous nature of the genotypes within and between the clusters. Inter cluster distance (D2) is the main criterion for selection of genotype. The genotypes belonging to the cluster with maximum inter cluster distance are genetically more divergent. Therefore, it is suggested that selection of genotypes should be based upon large cluster distances, which may lead to broad spectrum of favorable genetic variability for bulb yield improvement.

64 R. K. Singh et al
Estimates of cluster means for different traits are the measures of inter cluster divergence and degree of homogeneity in these clusters. Cluster mean was worked out and presented in table-4, indicating that the different clusters were superior in respect of various traits.
Cluster-III had highest value of plant height (93.05 cm), bulb diameter (4.71 cm), bulb size index (16.08 cm2), 20 bulb weight (700 g), clove diameter (1.75 cm), clove size index (4.43 cm2), weight of 50 cloves (97.50 g) and gross yield (159.63 t ha-1) and minimum neck thickness (1.45 cm) cloves per bulbs (17) days for bulb initiation (61.66 days) and days to harvesting (149.83) (Table-3). Cluster-II was promising for highest number of leaves per plant (7.60) and minimum bolters (11.38%). Cluster I showed highest cloves per bulb (38.57), total soluble solids (38.11%), dry matter content (40.22%) and marketable yield (134.89 t ha-1). The largest cluster-I had more and less average values for most of the traits like yield and yield contributory traits. Any attempt to strengthen the existing gene pool with introduction of garlic materials and their evaluation for desirable traits like resistance to insect pest and disease, adoptability, yield and quality is relevant for improving the potentiality of garlic crop.
The characters contributing maximum to the D2 values are to be given greater emphasis for deciding the cluster for the purpose of further selection. The study revealed that total soluble solids contributed maximum (20.46%) toward genetic divergence followed by gross yield (16.37%), bolters (12.86%), marketable yield (11.11%), cloves per bulbs (10.52%), weight of 50 cloves (10.52%), days for bulb initiation (10.52%) and days for harvesting (4.09%). All above mentioned traits were considered to be most important for genetic divergence and they contributed (96.45%) towards genetic divergence in this present investigation. Similar findings for contribution towards marketable yield and gross yield were also reported by Khar et al. (2006) in garlic and Mehta et al. (2005) in onion. The result of the present study will help to avoiding duplicates and minimizes the cost of maintenance of garlic germplasm. This also indicates that there is good scope for selection of varieties for desirable traits and cultivation in different part of India for higher productivity.
Therefore it is suggested that based upon large cluster distances to select genotypes from all the clusters, which may lead to broad spectrum of favorable genetic variability for bulb yield improvement.
ACKNOWLEDGEMENT The authors are grateful to the Director, National Horticultural Research and Development Foundation, Nashik, for providing necessary facilities during the course of investigation.

QUANTITATIVE TRAITS IN GARLIC 65
REFERENCES Bhonde, S. R., Singh, R. K. and Prakash H. 2012. Garlic cultivation in India. Published by
Director, National Horticultural Research and Development Foundation Chitegaon Phata, Post-
Gupta, R. P. and Singh, D. K. 1998. Studies on the performance of different advance lines in garlic, National Horticultural Research and Development Foundation, News letter, 18 (3):13
Khar, A., Asha, A., Mahajan, V. and Lawande, K. E. 2006. Genetic divergence analysis in elite lines of garlic (Allium sativum L). Journal of Maharashtra Agriculture University 31(1):52-55
Lokhande, G. D., Pawar, B. B., Dumbre, A.D. and Thete, R.Y. 1987. Genetic divergence in garlic (Allium sativum L.). Current Research Report 3: 98-99
Mahalnobis, P. C. 1936. On the generalized distance in statistics. Proc. Nat. Inst. Sci., 12: 49-55
Mehta, D. R., Dhaduk, L. K. and Kalathia, K.V. 2005. Genetic variability, diversity, correlations and path coefficient analysis of Indian cultivars of onion under Saurashtra region of Gujrat. In: Singh, U P, Singh, D P & Sarma, B K (Eds) Recent Advances in Allium Research, Contributory Papers, First National Conference on Alliums 24-25 February 2005, (pp. 128-142). Institute of Agricultural Science Banaras Hindu University, Varanasi
Mohanty, B. K. 2001. Analysis of genetic divergence in Kharif onion. Indian Journal of Horticulture, 58: 260-63
Mohanty, B. K. and Prusti, A. M. 2002. Mahalanobis’s generalized distance analysis in onion. Research on Crops, 3:142-144
Singh, R. K. and B. K. Dubey. 2011. Studies on genetic divergence in onion advance lines. Indian Journal of Horticulture, 68 (1):123-127
Singh, R. K., Dubey B. K. and Gupta, R. P. 2012. Studies on variability and genetic divergence in garlic (Allium sativum L). Journal of Spices and Aromatic Crops, 21 (2): 136-144
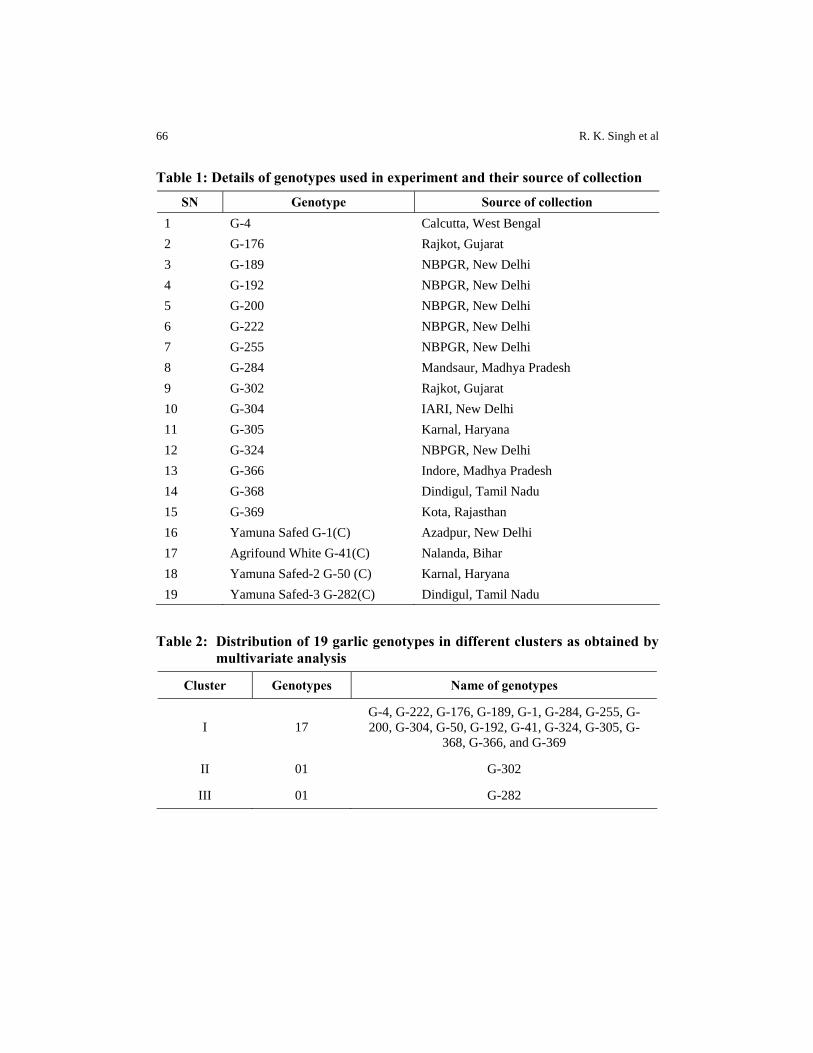
66 R. K. Singh et al
Table 1: Details of genotypes used in experiment and their source of collection
SN Genotype Source of collection 1 G-4 Calcutta, West Bengal 2 G-176 Rajkot, Gujarat 3 G-189 NBPGR, New Delhi 4 G-192 NBPGR, New Delhi 5 G-200 NBPGR, New Delhi 6 G-222 NBPGR, New Delhi 7 G-255 NBPGR, New Delhi 8 G-284 Mandsaur, Madhya Pradesh 9 G-302 Rajkot, Gujarat 10 G-304 IARI, New Delhi 11 G-305 Karnal, Haryana 12 G-324 NBPGR, New Delhi 13 G-366 Indore, Madhya Pradesh 14 G-368 Dindigul, Tamil Nadu 15 G-369 Kota, Rajasthan 16 Yamuna Safed G-1(C) Azadpur, New Delhi 17 Agrifound White G-41(C) Nalanda, Bihar 18 Yamuna Safed-2 G-50 (C) Karnal, Haryana 19 Yamuna Safed-3 G-282(C) Dindigul, Tamil Nadu
Table 2: Distribution of 19 garlic genotypes in different clusters as obtained by
multivariate analysis
Cluster Genotypes Name of genotypes
I 17 G-4, G-222, G-176, G-189, G-1, G-284, G-255, G-200, G-304, G-50, G-192, G-41, G-324, G-305, G-
368, G-366, and G-369
II 01 G-302
III 01 G-282
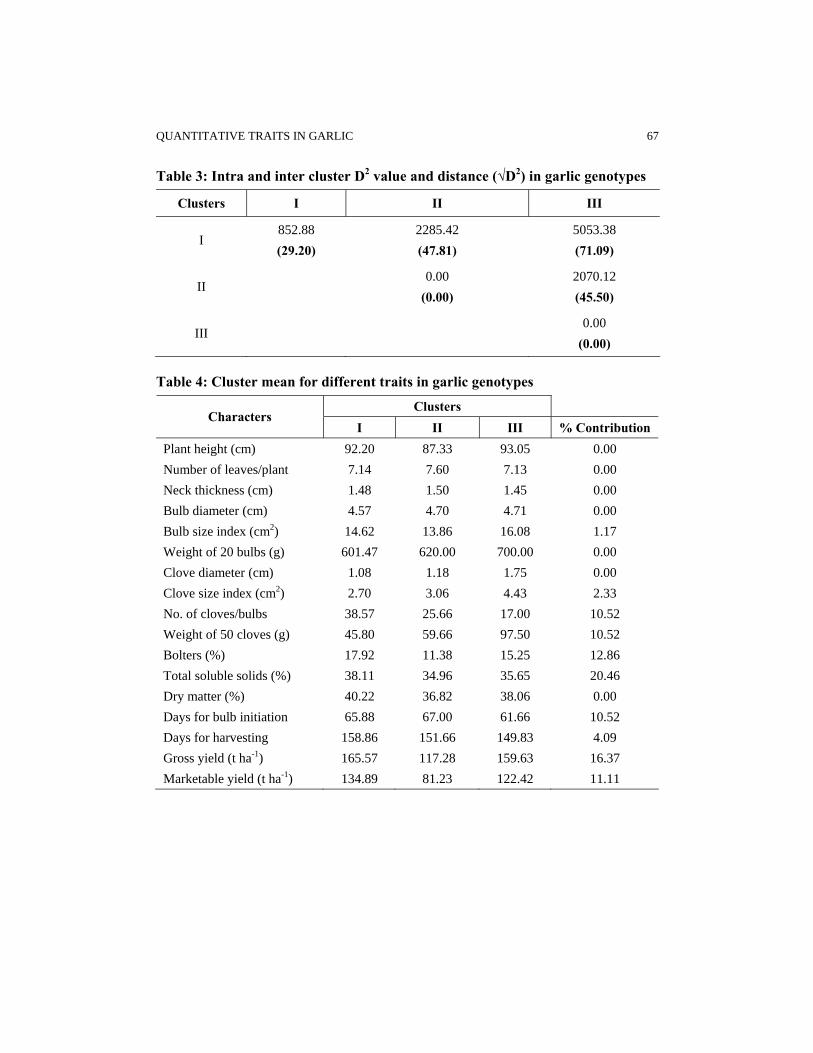
QUANTITATIVE TRAITS IN GARLIC 67
Table 3: Intra and inter cluster D2 value and distance (√D2) in garlic genotypes
Clusters I II III
I 852.88 (29.20)
2285.42 (47.81)
5053.38 (71.09)
II 0.00
(0.00) 2070.12 (45.50)
III 0.00
(0.00)
Table 4: Cluster mean for different traits in garlic genotypes
Clusters Characters
I II III % Contribution Plant height (cm) 92.20 87.33 93.05 0.00 Number of leaves/plant 7.14 7.60 7.13 0.00 Neck thickness (cm) 1.48 1.50 1.45 0.00 Bulb diameter (cm) 4.57 4.70 4.71 0.00 Bulb size index (cm2) 14.62 13.86 16.08 1.17 Weight of 20 bulbs (g) 601.47 620.00 700.00 0.00 Clove diameter (cm) 1.08 1.18 1.75 0.00 Clove size index (cm2) 2.70 3.06 4.43 2.33 No. of cloves/bulbs 38.57 25.66 17.00 10.52 Weight of 50 cloves (g) 45.80 59.66 97.50 10.52 Bolters (%) 17.92 11.38 15.25 12.86 Total soluble solids (%) 38.11 34.96 35.65 20.46 Dry matter (%) 40.22 36.82 38.06 0.00 Days for bulb initiation 65.88 67.00 61.66 10.52 Days for harvesting 158.86 151.66 149.83 4.09 Gross yield (t ha-1) 165.57 117.28 159.63 16.37 Marketable yield (t ha-1) 134.89 81.23 122.42 11.11

SAARC J. Agri., 11(2): 69-80 (2013)
EVALUATION OF PHYSIOLOGICAL AND ORGALEPTIC PROPERTIES OF MANGO CV. KESAR
AS INFLUENCED BY IONIZING RADIATION AND STORAGE TEMPERATURE
M. K. Yadav*, N. L. Patel1, B. R. Parmar and Dileswar Nayak2 Department of Horticulture, N. M. College of Agriculture, Navsari Agricultural University,
Dandi Road, Navsari- 396450, India
ABSTRACT
Radiation processing of fruits involves exposure to short wave energy to achieve a specific purpose to maintain the physiological changes and sensory quality of the product. The effect of gamma irradiation and stor-age temperature on physiological changes and organoleptic properties of mango fruit var. Kesar was studied. The fruits were exposed to gamma radiation at different doses i.e. 0.00kGy, 0.20kGy, 0.40kGy and 0.60kGy from the radio isotope 60Co and stored at different storage environments i.e. at ambient storage (27±2oCwith 60-70% RH); at 90C with 90% RH; at 120C with 90% RH and control atmosphere storage ( at 120C, O2 2%, CO2 3% and RH 90%). The fruits irradiated with 0.40kGy gamma rays and stored at 90C storage temperature with 90% RH recorded maximum reduction in physiological loss in weight and reduced ripening. The mini-mum physiological loss in weight and ripening and highest marketability of fruits was recorded from fruits irradiated with 0.40kGy gamma rays and stored at 12oC storage temperature with 90 RH including maximum scores on skin colour, pulp colour, texture, taste and overall acceptability at the end of shelf life (41.43 days). Key words: Colour, gamma irradiation, Kesar mango, marketability, rip-ening, storage temperature, taste
INTRODUCTION Mango (Mangifera indica L.) is a tropical to sub-tropical fruit; its rapid ripen-
ing process and infection caused by microorganism are the major causes of posthar-vest losses and limit the transport of fresh fruit from the site of harvest to market (Mi-tra, 1997). Mangoes are growing in over 90 countries worldwide and Asia accounts
* Corresponding author email: [email protected] 1Department of Fruit Science, ASPEE College of Horticulture and Forestry 2Department of Natural Resource Management, College of Forestry Received: 10.03.2013
70 M. K. Yadav et al
for 77% of global mango production, whereas the America and Africa account for 13 and 19%, respectively (Pereira et al., 2010). Kesar, one of the leading mango culti-vars of India is recently emerged out for establishing commercial mango orchard. In export market it becomes more favorite to Alphonso. The ripe fruit has attractive col-our, shape and size, rich flavour, pleasant aroma, excellent taste, sweet and fibrelees fleshs. It has excellent sugar: acid blend. Mangoes are extremely perishable in nature and to extend their ripening during long distance shipment, fruits are generally har-vested at physiologically mature stage, stored at low temperatures and ripened at des-tination under favorable conditions (Yimyong et al., 2011). At the present stage of development, however, sea shipment does not guarantee good quality fruit on arrival for successful marketing. Therefore, if freshly harvested fruit is allowed to ripe at normal ambient conditions (this can vary between 220C- 320C and 40-65% RH), rip-ening processes increase rapidly within the week; the ripe fruit may stay edible for a few days thereafter (Udipi and Ghurge, 2010). The most commonly encountered postharvest problems for mango are shriveling due to water loss, fast ripening and ultimately less marketability. Moreover, chilling injury may occur under low tem-perature. On the other hand, as the temperature increases, the higher will be the fruits water loss. Mango is susceptible to chilling injury and an optimum temperature of 12-130C is generally recommended (Gomez – Lim, 1993; Yimyong et al., 2011). Ir-radiation of fruits has been successfully shown to delay ripening (Pimentel and Wal-der, 2004) and is the most recent commercial phytosanitary treatment for fresh com-modities. Irradiation is a physical process for the treatment of foods compared to conventional process like heating or freezing. It prevents food poisoning, reduces wastage and at the same time preserves quality (Mahindru, 2009).Therefore, the new knowledge is critical because it is important to maintain a balance between the opti-mum doses required to achieve safety and the minimum change in the sensory quality of the fruit. Therefore, a balance between the required effective dose and tolerance of fruit to irradiation has to be investigated under various storage temperatures. So, ir-radiation can be used in combination with low temperature for assessing the effects of different doses of gamma irradiation and storage temperature on physiological and organoleptic quality of the fruit. The loss in appearance, taste and texture of fruits is likely to reduce the consumer’s acceptability drastically. The objectives of the study were to evaluate the effect of irradiation and storage temperature on physiological and sensory changes during storage. Kesar mangoes from Gujarat have captured sizeable Indian market and have good export potential, but the protocol for their irra-diation and post harvest storage needed to be standardized. In this paper the results of studies for standardization protocol of irradiation and storage are presented and dis-cussed.
PHYSIOLOGICAL AND ORGALEPTIC PROPERTIES OF MANGO CV. KESAR 71
MATERIALS AND METHODS Material and preparation
The present experiment was carried out at Navsari Agricultural University, Navsari (Gujarat) India during the year 2008-2010. The export grade mangoes of cv. Kesar were harvested from university orchard and were sorted for uniformity in size, maturity and free from defects and washed with chlorinated water. After drying, fruits were packed in corrugated fibre board (CFB) boxes (370 X 275 X 90mm) cush-ioned with tissue paper. The packed boxes were kept in cold storage at 12oC for 8 h for pre-cooling. Radiation processing
After pre-cooling; fruits were irradiated at ISOMED plant (Board of Radiation and Isotope Technology, Sir Bhabha Atomic Research Centre, Mumbai, India). The fruits were exposed to gamma radiation for different doses from the source radio iso-tope 60Co with energy 1.33MeV. There were four irradiation doses i.e. I1 -0.00kGy (Non-radiated), I2 -0.20kGy (1.15hrs), I3 -0.40kGy (2.30hrs) and I4 -0.60kGy (3.45 hrs). Storage conditions
The CFB boxes were stored in cold storage as per storage temperature treat-ments. The treatments were S1-Ambient (27±2oC, 60-70% RH), S2-90C, 90% RH, S3-120C, 90% RH and S4- Control atmosphere (CA) storage (120C, O2 2%, CO2 3% and RH 90%).The relative humidity maintained through automated RH sensors. Parameters and evaluation protocols
The selected parameters and protocols were performed at Post Harvest Tech-nology Unit of American Sprayers and Pressing Equipments (ASPEE) College of Horticulture and Forestry, Navsari Agricultural University, Navsari, India. The pa-rameters and protocols are discussed below. Physiological loss in weight (%)
Four fruits from each treatment were weighed on first day of treatment and subsequently their weight was recorded at six day interval up to the end of shelf life. The physiological loss in weight (PLW) was expressed in percentage and calculated as follows. W1 – W2 PLW % = ------------------ X 100 W1 Where, W1 = initial weight and W2 =final weight (Shankar et al., 2009)

72 M. K. Yadav et al
Ripening (%) Ripening was measured by the number of fruits having change in colour from
greenish to yellow and soft in texture were counted from day 2 day of storage to at six day interval up to the eating ripeness and expressed in percentage over total num-ber of fruits taken for the study. Marketable fruits (%)
The number of good quality and visibly sound fruits that could be marketed were counted and expressed as percentage over the total number of fruits at pre-scribed interval up to 90 per cent fruits had marketability. For senso organoleptic evaluation
The various treatments were evaluated by a panel consisted of twenty trained panelists and evaluated the sample on the basis of colour , taste, aroma and by press-ing the fruit and points were given as per hedonic scale procedure (Rangana, 1986). Higher scoring was treated as more acceptable from the attraction point of view. Statistical analysis
The two years data obtained from experiment was analyzed using ANOVA for completely randomized design with factorial concept in three repetitions. Signifi-cance of differences among treatments means were compared using the Fisher’s analysis of variance at 5% probability level, technique as followed by Panse and Sukhatme (1967). The data were subjected to appropriate transformation (arcsine) to meet the assumptions of normality.
RESULTS AND DISCUSSION Physiological loss in weight (%)
It is evident from the data (Figure1) that the shelf life was extended up to 38 days and on this day the significantly minimum PLW (5.850%) was recorded in the fruits exposed to 0.40kGy gamma rays (I3S2) followed by 0.20kGy (I2S2) gamma rays (7.470%) fruits stored at 90C temperature. In general, gamma rays @ 0.40kGy (I3) was the most effective treatment in reducing the physiological weight loss in Kesar mango at 90C (S2) and 120C (S3) storage temperature as compared to all other treat-ments. The physiological loss in weight was possibly on account of loss of moisture through transpiration and utilization of some reserve food materials in the process of respiration (Mayer et al., 1960). The irradiation significantly reduced physiological loss in weight during storage period over control which might be attributed to reduc-tion in utilization of reserve food material in the process of respiration (Purohit et al., 2004). The delay in respiration rate as a result of irradiation is also reported by Singh and Pal (2009) in guava. Similar findings were also observed by Prasadini et al. (2008) and El-Salhy et al. (2006) in mango. Similarly, in the different storage condi-tions, the highest physiological loss in weight was observed in fruits subjected to am-

PHYSIOLOGICAL AND ORGALEPTIC PROPERTIES OF MANGO CV. KESAR 73
bient temperature. Minimum physiological loss in weight was noted in cold storage temperature which might be due to lesser water vapour deficit compared to ambient condition and the low temperature which had slowed down the metabolic activities like respiration and transpiration (Mane, 2009). The results are at par with the results of Roy and Joshi (1989) and Waskar and Masalkar (1997) in mango; Nagaraju and Reddy (1995) in banana and Gutierrez et al. (2002) in guava. The significantly mini-mum reduction in physiological loss in weight of mango fruits subjected to irradia-tion and stored at various temperatures i.e. at 90C,120C and in CA (120C) might be due to the mutual complementary effect of irradiation and low temperature. Fruit ripening (%)
Figure 2 indicated that the irradiated fruits did not fully ripe up to 38th day of storage when fruits were exposed to 0.40kGy gamma rays and kept at 120C (I3S3) and 0.60kGy kept at 90C (I4S2) storage temperature were discarded due to the end of their shelf life. The fruits exposed to 0.20kGy and 0.40kGy gamma rays showed 97.93 and 97.30 per cent ripening, respectively at 90C storage (I2S2 and I3S2). Man-goes are classified as climacteric fruits and ripe rapidly after harvest. The un-irradiated mangoes had early ripeness whereas; gamma ray exposed mangoes had a significantly delayed ripening. The possible mechanisms that have been postulated include: a) irradiations results in decreased sensitivity to ripening action of ethylene and b) alteration in carbohydrates metabolism by regulating certain key enzymes, which interfere with production of ATP which is required for various synthetic proc-esses during ripening (Udipi and Ghugre, 2010). Same findings were noted by Far-zana (2005) in mango and Aina et al. (1999) in banana. The lower and delayed ripen-ing was noted at 90C and 120C and in CA (120C) storage as compared to ambient temperature. The decrease of ripening per cent and increase in days to ripening at low temperature may be due to desirable inhibition of enzymatic activities leading to re-duction in the respiration and ethylene production (Mane, 2009). These results are supported by Mann and Singh (1975) in mango and Deka et al. (2006) in banana. Marketable fruits (%)
The data on per cent marketable fruit are presented in figure 3. The maximum marketable fruit (97.69%) was noted in the fruits irradiated with 0.40kGy gamma rays and stored at 120C (I3S3), which was followed by I2S3 and I4S3. The fruits stored at either at 90C (S2) or at 120C (S3) temperature with (I2, I3 and I4) or without (I1) gamma rays treatment also showed considerable marketable fruits percentage for long time. The regulation of ripening is an extremely important factor in supplying the consumers with fruit of acceptable eating quality. Innovation in irradiation and cold storage are the new tools for the enhancement of physiological changes and health promoting components in climacteric fruits so, the fruits provide long time marketability. The per cent marketable fruit was significantly influenced by various doses of gamma irradiation and storage temperatures possibly due to the fact that ir-radiation maintains water content in the fruit and low temperature coupled with high

74 M. K. Yadav et al
humidity in cold storage maintains the health of the fruits. Control ripening also a possible reason for long time and higher marketability. These results are in confor-mity with the findings of El-Salhy et al. (2006) with respect to irradiation and Mane (2009) with respect to low temperature in mango. Skin and pulp colour
The data pertaining to skin colour showed (Table 1) significant effect on skin and pulp colour. Due to irradiation the maximum score (7.8) for skin colour was ob-tained in the fruits treated with treatment I3 (0.40kGy). The maximum score (8.0) for skin colour was obtained in the fruits stored under treatment S3 (120C).Combined ef-fect of irradiation and storage temperature recorded maximum skin colour score (8.5) when fruits were exposed to 0.40kGy gamma rays stored at 120C storage temperature (I3S3). Significantly the maximum pulp colour score (7.5) of fruits was recorded (Ta-ble 1) when fruits were exposed to 0.40kGy gamma rays (I3). The maximum score (7.7) for pulp colour obtained from fruits stored under treatment S3 (120C). Com-binedly the maximum pulp colour score of fruits (7.8) was recorded in fruits exposed to 0.40kGy gamma rays and stored at 120C storage temperature (I3S3). The visual changes in the colour of the fruits were noticeable throughout the storage. It was no-ticed that outer skin and inner pulp of mango fruits irradiated at medium (0.40kGy) and lower dose (0.20kGy) of gamma rays had greener skin and yellow to pink pulp than the skin and pulp of the higher dose (0.60kGy) exposed fruits at the end of stor-age. The large changes in skin and tissue colour during ripening may have over-whelmed any irradiation responses (Zhao et al., 1996). Similar results were also found by El- Salhy et al., (2006) in mango and by Paull (1996) in papaya. The stor-age temperature had significant effect on skin and pulp colour. The fruit stored at 120C, ambient temperature and in CA (120C) storage recorded higher colour score whereas, minimum colour score was recorded in fruits stored at 90C. It may be due to the slow degradation of chlorophyll due to slow rate of respiration and ethylene pro-duction by desired temperature and it is also associated with chloroplast to chromo-plast transition. The present results support the results of Medlicott et al. (1990), Waskar and Masalkar (1997) and El-Salhy et al. (2006) in mango and Gutierrez et al. (2002) in guava. Texture of fruit
The panelists found significant differences in the texture of the un-irradiated and irradiated fruits. It is evident from the data, presented in Table 2 that significantly maximum texture score (7.6) was recorded in fruits exposed to treatment I3 (0.40kGy). Maximum score (7.8) for texture was obtained from fruits stored at treat-ment S3(120C). Collectively the maximum texture value (8.0) was recorded in fruits exposed to 0.40kGy gamma rays and stored at 120C storage (I3S3). The panelists found a significant difference between the dose levels of gamma ray with respect to texture score. The possible reasons may be that medium to lower dose of irradiation can break chemical bonds, increase membrane permeability and metabolic activity,
PHYSIOLOGICAL AND ORGALEPTIC PROPERTIES OF MANGO CV. KESAR 75
which will lead to more water vapor movement to intercellular space and maintain the texture of the fruit and another reason may be that the changes in pectin by irra-diation are possible cause of the radiation induced softening (Zhao et al. 1996). These results are in agreement with findings of Moreno et al. (2006), El-Salhy et al. (2006) and Lacroix et al. (1990) in mango; Pimentel and Walder (2004) in banana and Singh and Pal (2007) and Singh and Pal (2009) in guava. Significantly better texture score was recorded at the full ripening stage in fruits stored at 120C, ambient temperature and in CA (120C) storage compared to fruits stored at 90C temperature, which may be due to retardation of the biochemical changes and ripening process at desired tem-perature (Mane, 2009) and significantly decrease in texture during storage of fruits was due to changes in nature of pectin substances which cementing the cell wall and hydrolysis of starch, hemicelluloses and cellulose during ripening of fruit (Leopold, 1964).This finding is in conformity with the findings of Waskar and Masalkar (1997) in mango; Purvoko (2002) in banana. Taste of fruits
Significantly the maximum (Table 2) taste score (7.7) was recorded in fruits exposed to 0.40kGy gamma rays (I3). Similarly, maximum score (7.9) for taste ob-tained in fruits stored under treatment S3 (120C) followed by treatment ambient stor-age (S1). In combination, the maximum taste score (8.2) was recorded in fruits ex-posed to 0.40kGy gamma rays stored at 120C (I3S3) Significantly enhanced taste of fruits might be due to optimum moisture and uniform ripening at desired temperature and radiation dose. The 90C stored fruits lost their taste and flavour due to prolonged storage of mango fruits at lower temperature and high humidity (Dhemre and Waskar, 2004). Overall acceptability
Significantly the maximum overall acceptability score (7.8) was recorded (Ta-ble 2) in fruits exposed to 0.40kGy gamma rays (I3). The maximum score (7.9) for overall acceptability obtained when fruits were stored under treatment S3 (120C). Combined effect of irradiation and storage temperature showed the maximum overall acceptability score (8.4) in fruits exposed to 0.40kGy gamma rays and stored at 120C storage (I3S3). The higher score of acceptability of fruits in these treatments may be due to good appearance, better texture and best in taste. Another reason is that the combined advantage of irradiation and desired temperature which reduces undesir-able sensory changes, since free radicals are less mobile at low temperature and hence their ability to interact with other constituents reduces (Udipi and Ghurge, 2010). The same results were obtained by Rajput et al. (2004) in apple with respect to irradiation and Mane (2009) in mango with respect to storage temperature.
76 M. K. Yadav et al
CONCLUSION Exposure of mango fruits (var. Kesar) to 0.40kGy gamma rays subsequently
stored at 90C temperature delayed the ripening process which maintained lower per-centage of physiological loss in weight and ripening per cent and higher percentage of marketable fruits. This was followed by the fruits treated with 0.40kGy gamma irradiation subsequently stored at 120C temperature. The highest score for skin and pulp colour; texture and taste of fruit and overall acceptability was observed in fruits exposed to 0.40kGy gamma rays and stored under 120C storage temperature com-pared to minimum in fruits stored at 90C temperature irradiated with 0.60kGy gamma radiation. Overall conclusions are that the irradiation increases the fruit health and overall acceptability for consumers point of view. It fulfills the quarantine briers for export purpose.
REFERENCES Aina, J. O., Adesiji, O. F. and Ferris, S. R. B. 1999. Effect of gamma irradiation on post harvest ripening of plantain fruit (Musa paradisiaca L.). Journal of Science for Food and Ag-
riculture, 79(5): 653-656 Deka, B. C., Choudhury, A., Bhattacharyya, K.H., Begum and Neog, M. 2006. Postharvest
treatment for shelf life extension of banana under different storage environments. Acta Horticulture, 2: 841-849
Dhemre, J. K and Waskar, D. P. 2004. Effects of post harvest treatments on shelf life and quality of Kesar mango fruits during storage. Journal of Maharashtra Agricultural University, 29(2): 159-163
El-Salhy, F. T. A., Khafagy, S. A. A. and Haggay, L. F. 2006. The changes that occur in mango fruits treated by irradiation and hot water during cold storage. Journal of Ap-plied Research, 2 (11): 864-868
Farzana, Panhwar. 2005. Post harvest technology of mango fruits, its development, physiol-ogy, pathology and marketing in Pakistan. Digital VerlagGmbH Pub., Germany.
Gomez-Lim, M. R. (1993). Mango fruit ripening: Physiological and Molecular biology. Acta Horticulture, 341: 484- 496
Gutierrez, A.O., Nieto, A. D., Martinez, D., Dominguez, A. M. T., Delgadillo, S., Qutierrez, A. J. G. 2002. Low temperature plastic film, maturity stage and shelf life of guava fruits. Revista Chapingo Serie Horticulturea, 8 (2): 283-301Hussein, A. M., Sabrout, M. B. and Zaghloul, A. E. 1998. Post harvest physical and biochemical changes of common and late types of seedy guava fruits during storage. Alexandria Journal of Ag-riculture Research, 43 (3): 187-204
Lacroix, M, Bernard, L., Jobin, M., Milot, S. and Gagnon, M. 1990. Effect of irradiation on the biochemical and organoleptic changes during the ripening of papaya and mango fruits. Radiation Physics and Chemistry, 35 (1-3): 296-300
Leopold, A.C. 1964. Plant Growth and Development. McGraw- Hill book company, New York and London
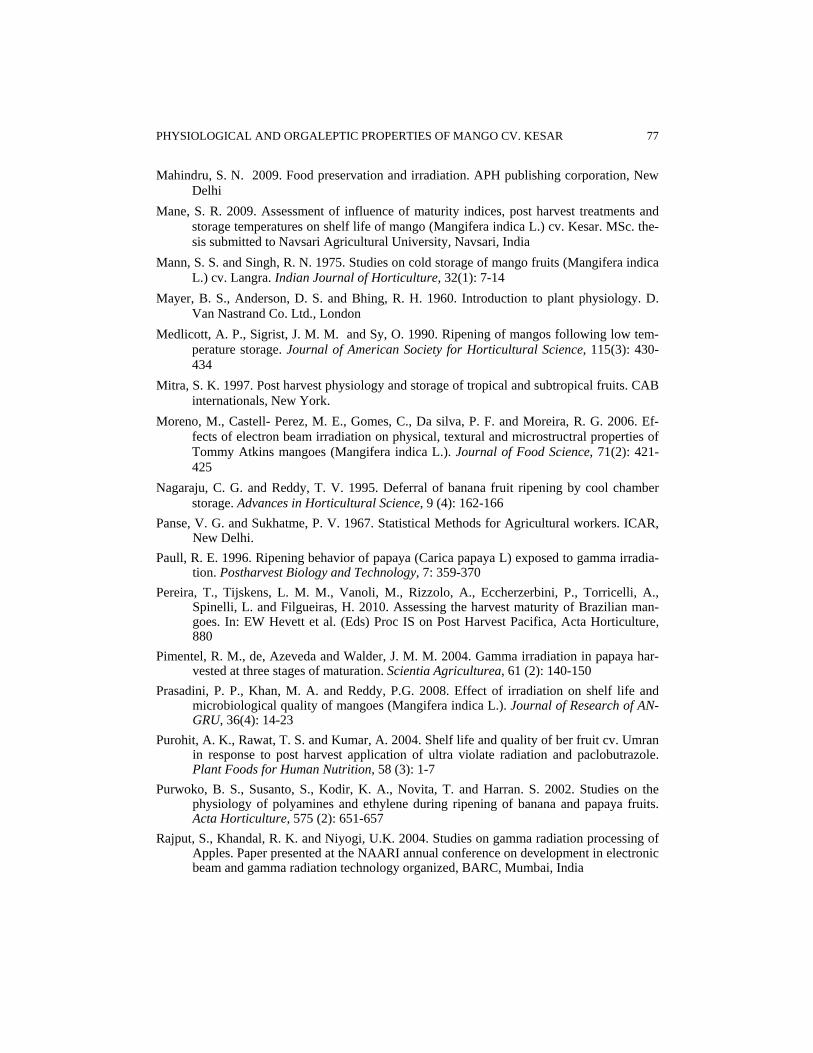
PHYSIOLOGICAL AND ORGALEPTIC PROPERTIES OF MANGO CV. KESAR 77
Mahindru, S. N. 2009. Food preservation and irradiation. APH publishing corporation, New Delhi
Mane, S. R. 2009. Assessment of influence of maturity indices, post harvest treatments and storage temperatures on shelf life of mango (Mangifera indica L.) cv. Kesar. MSc. the-sis submitted to Navsari Agricultural University, Navsari, India
Mann, S. S. and Singh, R. N. 1975. Studies on cold storage of mango fruits (Mangifera indica L.) cv. Langra. Indian Journal of Horticulture, 32(1): 7-14
Mayer, B. S., Anderson, D. S. and Bhing, R. H. 1960. Introduction to plant physiology. D. Van Nastrand Co. Ltd., London
Medlicott, A. P., Sigrist, J. M. M. and Sy, O. 1990. Ripening of mangos following low tem-perature storage. Journal of American Society for Horticultural Science, 115(3): 430-434
Mitra, S. K. 1997. Post harvest physiology and storage of tropical and subtropical fruits. CAB internationals, New York.
Moreno, M., Castell- Perez, M. E., Gomes, C., Da silva, P. F. and Moreira, R. G. 2006. Ef-fects of electron beam irradiation on physical, textural and microstructral properties of Tommy Atkins mangoes (Mangifera indica L.). Journal of Food Science, 71(2): 421-425
Nagaraju, C. G. and Reddy, T. V. 1995. Deferral of banana fruit ripening by cool chamber storage. Advances in Horticultural Science, 9 (4): 162-166
Panse, V. G. and Sukhatme, P. V. 1967. Statistical Methods for Agricultural workers. ICAR, New Delhi.
Paull, R. E. 1996. Ripening behavior of papaya (Carica papaya L) exposed to gamma irradia-tion. Postharvest Biology and Technology, 7: 359-370
Pereira, T., Tijskens, L. M. M., Vanoli, M., Rizzolo, A., Eccherzerbini, P., Torricelli, A., Spinelli, L. and Filgueiras, H. 2010. Assessing the harvest maturity of Brazilian man-goes. In: EW Hevett et al. (Eds) Proc IS on Post Harvest Pacifica, Acta Horticulture, 880
Pimentel, R. M., de, Azeveda and Walder, J. M. M. 2004. Gamma irradiation in papaya har-vested at three stages of maturation. Scientia Agriculturea, 61 (2): 140-150
Prasadini, P. P., Khan, M. A. and Reddy, P.G. 2008. Effect of irradiation on shelf life and microbiological quality of mangoes (Mangifera indica L.). Journal of Research of AN-GRU, 36(4): 14-23
Purohit, A. K., Rawat, T. S. and Kumar, A. 2004. Shelf life and quality of ber fruit cv. Umran in response to post harvest application of ultra violate radiation and paclobutrazole. Plant Foods for Human Nutrition, 58 (3): 1-7
Purwoko, B. S., Susanto, S., Kodir, K. A., Novita, T. and Harran. S. 2002. Studies on the physiology of polyamines and ethylene during ripening of banana and papaya fruits. Acta Horticulture, 575 (2): 651-657
Rajput, S., Khandal, R. K. and Niyogi, U.K. 2004. Studies on gamma radiation processing of Apples. Paper presented at the NAARI annual conference on development in electronic beam and gamma radiation technology organized, BARC, Mumbai, India

78 M. K. Yadav et al
Rangana, S. (1986). Manual of analysis of fruits and vegetable products. Tata McGraw Hill Publishing Co Ltd, New Delhi
Roy, S. K. and Joshi, G. D. 1989. An approach to integrated post harvest handling of mango. Acta Horticulture, 231: 469-661
Shankar,V., Veeragavathatham, D. and Kannan, M. 2009. Effect of organic farming practices on post harvest storage life and organoleptic quality of yellow onion (Allium cepa L.). Indian Journal of Agricultural Sciences, 79(8): 608-614.
Singh, S. P and Pal, P. K. 2007. Post harvest fruit fly disinfestation strategies in rainy season guava crop. Acta Horticulture, 375: 591-596
Singh, S. P. and Pal, R. K. 2009. Ionizing radiation treatment to improve postharvest life and maintain quality of fresh guava fruit. Radiation Physics and Chemistry, 78:135-140
Udipi, S. A. and Ghurge, P. S. 2010. Applications of food irradiation. In: Udipi, S.A. and Ghugre, P.S. (eds.) Food irradiation, (pp. 40-71). Agrotech Publishing academy, Udaipur
Waskar, D. P. and Masalkar, S. D. 1997. Effect of hydrocooling and bavistin dip on the shelf life and quality of mango during storage under various environments. Acta Horticul-ture, 455:687-695
Yimyong, S., Datsenka, T. U., Handa, A. K. and Sereypheap, K. 2011. Hot water treatment delays ripening associated metabolic shift in ‘Okrong’ mango fruit during storage. Journal of American Society for Horticultural Science, 136(6): 441-451
Zhao, M., Moy, J. and Paull, R. E. 1996. Effect of gamma irradiation on ripening papaya pec-tin. Postharvest Biology and Technology, 8: 209-222
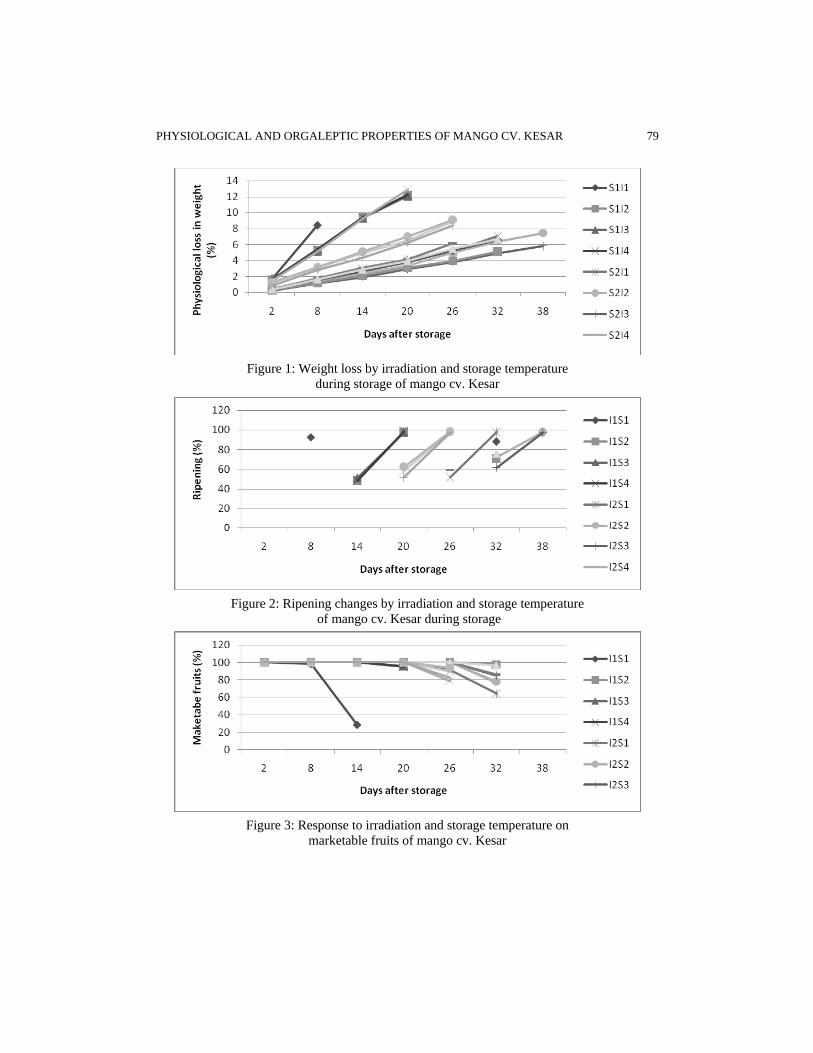
PHYSIOLOGICAL AND ORGALEPTIC PROPERTIES OF MANGO CV. KESAR 79
Figure 1: Weight loss by irradiation and storage temperature
during storage of mango cv. Kesar
Figure 2: Ripening changes by irradiation and storage temperature
of mango cv. Kesar during storage
Figure 3: Response to irradiation and storage temperature on
marketable fruits of mango cv. Kesar

Table 1: Effect of irradiation and storage temperature on skin and pulp colour score of mango cv.Kesar Skin colour Pulp colour
Factors I1 I2 I3 I4 Mean I1 I2 I3 I4 Mean S1 7.5 7.8 7.8 7.0 7.5 7.4 7.5 7.7 7.3 7.5 S2 6.8 7.0 7.0 6.7 6.9 6.2 6.8 7.1 6.2 6.5 S3 7.9 8.0 8.5 7.7 8.0 7.5 7.7 7.8 7.5 7.7 S4 7.5 7.7 7.8 7.2 7.5 7.2 7.2 7.5 7.2 7.3
Mean 7.5 7.6 7.8 7.1 7.1 7.3 7.5 7.0 Factors I S I X S I S I X S S. Em ± 0.004 0.004 0.008 0.009 0.005 0.009
CD (P≤0.05) 0.012 0.012 0.023 0.026 0.014 0.026 Where, I=irradiation, S-storage temperature
Table 2: Effect of irradiation and storage temperature on texture, taste and overall acceptability score mango CV Kesar
Texture Taste Overall acceptability
Factors I1 I2 I3 I4 Mean I1 I2 I3 I4 Mean I1 I2 I3 I4 Mean
S1 7.4 7.5 7.8 7.0 7.5 7.6 7.7 7.9 7.5 7.7 7.4 7.6 7.7 7.1 7.5
S2 6.6 6.8 7.1 6.4 6.7 6.7 6.8 7.2 6.5 6.8 6.6 6.8 7.5 6.5 6.8
S3 7.8 8.0 8.0 7.5 7.8 7.8 7.9 8.2 7.7 7.9 7.6 8.1 8.4 7.5 7.9
S4 7.2 7.3 7.4 7.0 7.2 7.5 7.6 7.7 7.4 7.6 7.3 7.4 7.6 7.2 7.4
Mean 7.2 7.4 7.6 7.0 7.4 7.5 7.7 7.2 7.2 7.5 7.8 7.1
Factors I S I X S I S I X S I S I X S
S. Em ± 0.005 0.005 0.010 0.005 0.005 0.010 0.005 0.005 0.010 CD (P≤0.05) 0.015 0.015 0.028 0.015 0.015 0.030 0.016 0.016 0.030
Where, I=irradiation, S-storage temperature

SAARC J. Agri., 11(2): 81-94 (2013)
CHARACTERIZATION AND FIELD PERFORMANCE OF 15 STRAWBERRY GERMPLASM UNDER
BANGLADESH CONDITIONS
M. Moshiur Rahman1*, M. Mizanur Rahman2, M. Mofazzal Hossain2 M. A. Khaleque Mian3 and Q. Abdul Khaliq4
Pomology Division, Horticulture Research Centre, Bangladesh Agricultural Research Institute, Joydebpur, Gazipur, Bangladesh
ABSTRACT
Fifteen strawberry germplasm collected from local and exotic sources were evaluated for different qualitative and quantitative characters. The germplasm showed variation for majority of the studied traits. Plant height during peak harvest ranged from 14.67 to 25.00 cm and FA 007 exhibited the tallest plants. The maximum number of leaves plant-1 was produced by FA 006 (46.67). The maximum number of runners plant-1 was obtained in FA 003 (68.67) followed by FA 004 (63.00), while the highest number of crown plant-1 was found in FA 007 (15.33) followed by FA 006 (14.67). Days to flowering varied from 48.33 to 102.30 among the germplasm and FA 008 required minimum (48.33) days for flowering. The germplasm FA 004 produced the highest number of flower trusses (35.50 plant-1) while it was the lowest in FA 010 (5.00 plant-1). The number of flowers plant-1was found maximum in FA 003 (168.00 plant-1) and minimum in FA 010 (40.00 plant-1). Among the germplasm pollen viability varied significantly and maximum viable pollen was recorded in FA 010 (84 %), while it was lowest in FA 004 (12.00 %). The highest per cent fruit set was recorded in BARI Strawberry-1 (86 %) while, FA 013 (39 %) showed the lowest. Among the germplasm the highest yield plant-1 was recorded from FA 005 (737.70 g) followed by FA 006 (702.30 g) and was significantly higher than others while the lowest yield plant-1 was recorded from FA 013 (52.00 g), FA 014 (69.00 g), FA 009 (81.33 g) and FA 010 (121.30 g). Keywords: Strawberry, qualitative growth characters, quantitative growth characters, reproductive characters
* Corresponding author email: [email protected] 1 Senior Scientific Officer, HRC, BARI, Gazipur, Bangladesh
2 Professor, Department of Horticulture, BSMRAU, Salna, Gazipur, Bangladesh
3 Professor, Department of Plant Breeding, BSMRAU, Salna, Gazipur, and
4 Professor, Department of Agronomy, BSMRAU, Salna, Gazipur, Bangladesh Received: 03.04.2013

82 M. Moshiur Rahman et al
INTRODUCTION Strawberries (Fragaria x ananassa Duch.) are widely grown fruit crop in the
world, adapted in geographically diverse area (Biswas et al., 2009). Strawberry is now grown successfully in Bangladesh. There are more than 20 Fragaria species and numerous cultivars commercially cultivated in several countries (Gaafar and Saker, 2006). The cultivars vary remarkably in morphological characters (Biswas et al., 2009). The genotypic and phenotypic interaction of strawberry plant is highly cultivar dependent. Therefore, the choice of a cultivar is of paramount importance for successful strawberry cultivation (Asrey and Singh, 2004). On the other hand, as a new crop it is necessary to evaluate the morphological characters under Bangladesh condition. A germplasm collection with good variability for the desirable characters is the basic requirement of any crop improvement program (Singhania et al., 2006; AVRDC, 1990). In addition, crop improvement is primarily based on extensive evaluation of germplasm. Morphological characters of a plant is most important for nature as well as yield of a crop. Hence, studies about these important traits are necessary for successful cultivation of this crop in a new area like Bangladesh.
Bangladesh Agricultural Research Institute has released one variety of strawberry named BARI strawberry-1, which is not enough for increasing demand of strawberry cultivation. So, it is necessary to develop more variety of this promising crop. None of work based on field performance and morphological characterization of strawberry under Bangladesh condition was done. However, a good number of investigations were done in India, Pakistan and elsewhere in the world. Therefore, the present study was undertaken to characterize the collected strawberry germplasm for morphological characters and to select superior one on the basis of morphological characters.
MATERIALS AND METHODS Experiment site: This study was conducted at the Fruit Research Farm of
Horticulture Research Centre of Bangladesh Agricultural Research Institute, (Latitude 23059′ N, Longitude 90024′ E, Altitude 14.33 m), Gazipur, Bangladesh during August 2008 to May 2010. This region falls in sub-tropical zone having hot summers (May–August) and mild winter (December–February). Cumulative rainfall of about 104 – 112 mm during cultivation period with average 79.4 % relative humidity. The mean maximum and minimum temperature during cropping period were 25.89 and 17.050C, respectively. Soil of the experimental farm was clay loam, having pH 6.2, which was low in organic carbon (0.95 %), very low in available phosphorus (9 ppm) and low in potash (0.17 meq/100 g soil).
Treatments: Healthy and disease free daughter plants of 15 strawberry germplasm collected from local and exotic sources were considered as treatments and planted in the experimental field. The released strawberry variety in Bangladesh namely BARI Strawberry-1 was used as check (Appendix 1).
PERFORMANCE OF STRAWBERRY UNDER BANGLADESH CONDITIONS 83
83
Experimental design and layout: The experiment was laid out in a randomized complete block (RCB) design with three replications. The unit plot size was 100 x 280 cm and the plants were spaced 50 x 40 cm on open beds. Beds were raised 30 cm above main field with 50 cm drain in-between 2 beds. Each plot contained double row accommodating 14 plants. Daughter plants of strawberry germplasm were planted in September 15, 2008 and 2009. Data were collected from inner plants from each row to avoid border effect. In each unit plot ten inner plants were selected for recording data.
Intercultural operations: Runners were removed at every 3 to 4 days intervals in order to make the crown capable to initiate flowers. Straw mulch was applied around the plants as a normal practice in order to conserve soil moisture, decreasing weed and to avoid contact of the fruits with soil for reduction of rot caused by soil microbes. Weeds were removed whenever necessary to keep the crop weed free. Irrigation was given whenever necessary to keep soil moisture available in the field for better plant growth. All other necessary cultural practices and plant protection measures were followed uniformly for all the plots and treatments during the entire period of experimentation.
Observations recorded: Following vegetative characters viz. growth habit, plant vigor, foliage density, foliage color of strawberry plants and position of inflorescences were recorded by close observation according to the descriptor developed by IBPGR (1986). On the other hand, plant height (cm), plant spread (cm), leaves plant-1, runners plant-1, crowns plant-1, days to flowering, flower trusses plant-1, flowers plant-1, size of flower (cm), disk size of flower (receptacle) (cm), pollen viability (%) and percent fruit set were recorded for quantitative growth characters of strawberry plants and yield plant-1 (g).
Pollen viability (%): Freshly opened flowers were collected to assess viability of the pollen grains. The pollen grains from the anther cone were dusted on a glass slide. Carmino Acetic Acid (CAA) solution (single drop) was used to stain the specimen and was covered with a cover slip. Pollen grains were viewed under a light microscope. The normal and properly stained pollen grains were considered as viable.
Data analysis: Two year’s data of different quantitative parameters were pooled and analyzed, following RCB design using MSTAT-C (Nisen, 1983). The mean comparison was done following the Duncan’s Multiple Range Test (DMRT).
RESULTS AND DISCUSSION Qualitative growth characters
Growth habit: Regarding growth habit of plants, the germplasm were categorized into 3 types viz. erect, intermediate and prostrate (Table 1). Six germplasm (FA 001, BARI Strawberry-1, FA 005, FA 008, FA 013 and FA 014)

84 M. Moshiur Rahman et al
exhibited intermediate type of growth habit, five germplasm (FA 004, FA 006, FA 007, FA 016 and FA 017) exhibited erect type of growth and rest of the germplasm exhibited prostrate type of growth habit. Meulenbroek et al. (2002) found that the plants of ‘Pavana’ variety exhibited open (prostrate) growth habit.
Plant vigor: Based on plant vigor, the germplasm were classified into 3 viz., weak, intermediate and strong (Table 1). Among 15 germplasm studied, strong vigorous plants were observed in 6 germplasm (FA 003, FA 004, FA 006, FA 007, FA 016 and FA 017); 5 germplasm (FA 001, BARI Strawberry-1, FA 005, FA 008 and FA 011) were intermediate and the rest 4 germplasm (FA 009, FA 010, FA 013 and FA 014) were weak in plant vigor. Ludvikova and Paprstein (2003) found that plants of ‘Pegasus’ and ‘Honeoye’ varieties were vigorous in nature. Their findings corroborated with the present observation.
Foliage density: Foliage densities of strawberry plants were classified into sparse, intermediate and dense (Table 1). Among the germplasm plants of 7 germplasm (FA 001, BARI Strawberry-1, FA 005, FA 010, FA 011, FA 013 and FA 014) showed intermediate, 5 germplasm (FA 004, FA 006, FA 007. FA 016 and FA 017) showed dense and remaining 3 (FA 003, FA 008 and FA 009) sparse type of foliage. Ludvikova and Paprstein (2003) found that the variety ‘Pegasus’ was dense and ‘Honeoye’ was intermediate in nature. Results of their findings are similar to the present observation.
Foliage color: Foliage coloration of plants was groped into light, intermediate and dark (Table 1). Among the germplasm, 8 (FA 001, BARI Strawberry-1, FA 003, FA 008, FA 009, FA 011, FA 013 and FA 014) were dark in foliage color; 2 (FA 004 and FA 010) germplasm were intermediate and plants of rest germplasm (FA 005, FA 006, FA 007. FA 016 and FA 017) were light in color.
Position of inflorescences: Positions of inflorescences in different germplasm were categories into beneath, level with and above the foliage (Table 1). Among the studied germplasm, it was found that the plants of 9 germplasm (FA 003, FA 004, FA 005, FA 006, FA 007, FA 010, FA 011, FA 016 and FA 017) produced inflorescences, which were beneath the foliage. Inflorescences of 4 germplasm (FA 001, BARI Strawberry-1, FA 008 and FA 013) were above the foliage and rest two germplasm (FA 009 and FA 014) produced inflorescences level with the foliage (Table 1). The germplasm having inflorescences above the foliage was suitable for harvesting. Meulenbrock et al. (2002) found that cultivar ‘Pavana’ had long flower clusters that make the fruit easy to pick.
Quantitative growth characters Plant height: Significant variation among the germplasm was observed for plant
height. The tallest plant (25.00 cm) was recorded in the genotype FA 007 and the shortest (14.67 cm) in the genotype FA 013 (Table 2). The variation in plant height might be due to the genetic makeup. Results of present investigation regarding plant height were partial
PERFORMANCE OF STRAWBERRY UNDER BANGLADESH CONDITIONS 85
85
agreement with the findings of Rahman (2011), and Asrey and Singh (2004). Riyaphan et al. (2005) obtained significant variation in plant height of strawberry plants in Thailand, which ranged from 10 to 20 cm at mid-harvesting time.
Plant spread: Significant variation among the germplasm was observed for plant spread. The highest plant spread (24.67 cm) was recorded in the genotype FA 005 and FA 006, and the lowest (15.00 cm) in the genotype FA 013 (Table 2). The variation in plant size might be due to the genetic makeup of strawberry plants. Asrey and Singh (2004) and Rahman (2011) found a significant variation in plant spread. Results of present investigation regarding plant size was in agreement with the findings of Asrey and Singh (2004) and Rahman (2011).
Leaves plant-1: Leaf number is important for photosynthesis and it differed significantly ranging from 46.67 (FA 006) to 20.33 (FA 014). Among the germplasm, FA 006 produced the maximum number of leaves and FA 014 produced the minimum (Table 2.). The number of leaf plant-1 in different germplasm varied mainly due to inherent characters of the germplasm. Rahman (2011) obtained the number of leaves plant-1 varying from 60.52 to 49.00 in different germplasm which was more or less closer to the findings of the present study. But the finding about leaves plant-1 reported by Asrey and Singh (2004) was lower than the present study. They found that number of leaves ranged from 3.33 to 6.33 plant-1 under irrigation in semi-arid region of Punjab, which might be due to the genetic as well as the environmental effect. Perez-de-Camacaro et al. (2002) obtained a variation in leaf number among cultivars during the later part of the season and found that cv. ‘Bolero’ and ‘Everest’ produced the highest and ‘Elsanta’ the least number of leaves plant-1. In another study revealed a significant variation in leaves plant-1 among strawberry germplasm and recorded 4.6 to 9.8 leaves plant-1 at 86 days after planting in Cambridge.
Number of runner and crown plant-1: Significant variation among the germplasm was observed in respect of numbers of runner and crown plant-1. Among the germplasm, FA 003 produced the highest number of runner (68.67) followed by FA 004 (63.00) while FA 007 produced the lowest (6.33). FA 007 produced the maximum number of crown (15.33) followed by FA 006 (14.67) and FA 005 (11.33), while FA 009 and FA 011 produced the lowest (6.67) (Table 2.). The variation in different germplasm as recorded might be due to genetic makeup. This result is in confirmatory with the findings of Pérez-de-Camacaro et al. (2002). They found a significant difference in number of runner and crown plant-1 among the strawberry cultivars in UK. ‘Elsanta’ produced more runners than ‘Bolero’ and ‘Everest’. While cv. ‘Bolero’ produced more crowns than ‘Everest’ and ‘Elsanta’. In the present study, FA 005, FA 006 and FA 007 produced the minimum number of runners but the maximum number of crowns. This result is at par with that of Riyaphan et al. (2005). They found significant variation in numbers of runners and crowns plant-1 and reported that cv. ‘Tioga’ produced the maximum number of crowns and the minimum number of runners in Thailand.

86 M. Moshiur Rahman et al
Relationship between runner and crown per plant: A negative linear relationship was observed between number of crown per plant and number of runner per plant (Figure 1). The equation was y = -0.0952x + 12.612 and the value of the coefficient of determination (R2 = 0.4801) gave a good fit and the fitted regression line had a significant regression coefficient, indicating number of crown plant-1 will be increased with a significant manner with the decrease of number of runner plant-1. So, there is a clear indication that higher number of runners inhibited the crown producing ability of strawberry plants. This result is in strong agreement with that of Riyaphan et al. (2005). Reproductive characters
Days to flowering: Significant variation among the germplasm in relation to days to flowering was observed. The maximum number of days (102.3) was required for flowering in FA 004 and the minimum (48.33 days) in FA 008 (Table 3). This is because FA 008 might be early genotype. It is in agreement with the findings of Riyaphan et al. (2005) who recorded that number of days from transplanting to first blooming ranged from 67.50 to 78.90 in cv. ‘Tioga’ and from 40.80 to 47.23 in cv. ‘Tochiotome’. Asrey and Singh (2004) found a significant variation in days to flowering, which is also in consonant with the present findings. They found that strawberry cultivar ‘Seascape’ required maximum number of days for flowering followed by ‘Chandler’, while minimum in Fern. Rahman (2011) found that days to flowering varied significantly among the strawberry germplasm and it ranged from 72.42 to 81.87 days. Macit et al. (2007) reported that ‘Sweet Charlie’ and ‘Camarosa’ were earlier in first flowering than other varieties, while Kabarla was late under conventional system in Samsun, Turkey.
Flower trusses and flowers plant-1: Marked variation was observed among the germplasm for number of flower trusses (inflorescences) and flowers plant-1. Among the germplasm, FA 004 produced maximum number of flower trusses plant-1 (35.5), while FA 010 produced only 5 flower trusses plant-1. During the study period, the highest number of flowers plant-1 (168) was observed in FA 003 followed by FA 016 (145), FA 017 (144) and FA 004 (142), which were statistically similar; while the lowest was in FA 010 (40) shown in table 1.3.3. The number of flower trusses and flowers plant-1 in different germplasm varied mainly due to inherent mechanism of the germplasm. This result was partially similar with that of Rahman et al. (2011), who found that number of flower trusses and number of flowers plant-1 differed significantly among the germplasm, ranged from 6.58 to 8.10 and from 37.11 to 53.42, respectively. Michel et al. (2006) found that the total number of flowers plant-1 was linearly related to its number of inflorescences (trusses). They found on an average 25.90 flowers inflorescence-1. But Sønsteby and Heide, (2008) recorded less number of inflorescences with a more number of flowers plant-1 in cv. ‘Korona’. Riyaphan et al. (2005) and Pérez-de-Camacaro et al. (2002) found that the number of inflorescences plant-1 significantly varied in strawberry cultivars, which are in close conformity with the present findings. They also observed that the early flowering germplasm produced less number of trusses as well as flowers

PERFORMANCE OF STRAWBERRY UNDER BANGLADESH CONDITIONS 87
87
plant-1 compared to late flowering germplasm. This the fact might be due to that the early flowering germplasm produced inflorescences before optimum vegetative growth, which might have suppressed inflorescences and flowers number plant-1. On the other hand, late flowering germplasm reach reproductive phase after attaining optimum vegetative growth, which might enhance flowering potentiality. In addition, the early flowering germplasm produced flower under higher temperature which have negative impact on inflorescences and flower production. These observations are supported by the findings of Patterson (1995) and Chercuitte et al. (1991), while Maurer and Umeda (1999) found that irrespective of flowering time, flowers number plant-1 varied significantly among the germplasm.
Relationship between days to flowering and flower trusses plant-1: A positive quadratic relationship was observed between days to flowering and flower trusses plant-1 (Figure 2). The equation was y = -138.92 + 4.1467x - 0.0241x2 and the value of the coefficient of determination (R2 = 0.7786) was significant at 5% level of probability, indicating flower trusses plant-1 increased with a significant manner with the increase of days to flowering up to 85 days. So, there is a clear indication that early flowering germplasm produced less number of flower trusses plant-1 compared to late flowering germplasm. This result is in line with the findings of Patterson (1995) and Chercuitte et al. (1991). But flower trusses decreased in those plants that required more than 85 days for earlier flowering. This might be due to extreme delayed plants flowered at higher temperature which inhibited flowering in strawberry. Ledesma et al. (2008) found comparatively high temperature significantly reduced the number of inflorescences in strawberry.
Size of flower: Size of flower in respect of diameter and thickness varied significantly. This might be due to genetic variation among the germplasm. Among the germplasm FA 007 produced the largest flower in respect of diameter and thickness (3. 43 cm and 2.07 cm, respectively) followed by FA 006 (3.30 cm and 2.03 cm, respectively), while FA 004 produced the smallest flower having the lowest diameter (2.07 cm) and thickness (0.87 cm) and shown in table 4. This result is in agreement with the findings of Rahman (2011) and Verma et al. (2002), who found that diameter and thickness of flower ranged from 1.74 to 2.44 cm and 1.40 to 2.36 cm, respectively.
Disk size of flower (receptacle): Size of receptacle (disk) of flower in respect of diameter and thickness varied significantly. Among the genotype FA 006 produced flowers having the biggest receptacle in respect of diameter (2.60 cm) while, FA 004 produced flowers with the smallest receptacle diameter (1.33 cm). The thickest receptacle was found in the flowers of FA 007 (1.60 cm) and the thinnest receptacle was found in the flowers of FA 004 and FA 003 (Table 4). Rahman (2011) and Verma et al. (2002) found that flower disk diameter and thickness differed significantly among the germplasm ranging from 0.66 to 0.90 cm. and 0.31 cm to 0.65 cm, respectively which were lower compared to present observation. This might be due to difference of cultivation or the growing environment.

88 M. Moshiur Rahman et al
Pollen viability: Pollen viability is one of the most important attributes for proper fruit setting. The germplasm varied significantly in respect of pollen viability. The maximum viable pollens were found in FA 010 (84.00 %) followed by FA 008 (81.67 %), FA 001 (81.33 %) and BARI Strawberry-1 (76.00 %) and those were statistically similar, but the lowest viable pollen grains were found in FA 004 (12.00 %) and FA 003 (12.33 %) (Table 4). Such variation in pollen variability might be due to the influence of ploidy level and effect of high temperature which prevailed during the time of flowering in these two germplasm. Ledesma and Sugiyama (2005) stated that pollen viability of strawberry varied significantly among the germplasm, which was supported by the present observation. Such variation might be due to the effect of germplasm, temperature and their interaction. In addition, pollen quality was also influenced by high temperature, but the effect of higher temperature on pollen viability is cultivar specific. According to Kronenberg (1959), pollen viability differs among strawberry cultivars which affect the fruit set and yield of strawberry.
Per cent fruit set: The number of fruit set is directly dependent on the abundance of flowers and their existence in the plant which was controlled by environment and genetic makeup of the germplasm. The highest per cent fruit set was recorded in BARI Strawberry-1 (86 %) followed by FA 008 (81 %) and FA 010 (73 %) and they were statistically similar, and significantly higher than rest of the germplasm while FA 013 (39 %) showed the lowest (Figure 3). Among the germplasm FA 003 and FA 004 failed to produce any fruit due to very poor pollen viability (Table 4). The variation in different germplasm is due to variation of genetic makeup and differential response of the germplsam to climatic conditions of the locality. Ledesma et al. (2008) found that per cent fruit set of strawberry varied significantly among the cultivars ranging from 60.20 to 92.40 they also observed a significant interaction between temperature and cultivars regarding fruit set (%) which was similar to the results of the present experiment.
Relationship between pollen viability and percent fruit set: A positive linear relationship was observed between pollen viability (%) and per cent fruit set (Figure 4). The equation was y = 1.1062x - 17.108 and the value of the coefficient of determination (R2 = 0.8139) gave a fitted regression line and indicating a significant regression coefficient, representing fruit set will be increased with a significant manner with the increase of pollen viability (%). So, there is a clear indication that increase in percent pollen viability has significant positive effect on percent fruit set. Abdul-baki and Stommel, (1995) and Cross et al. (2003) stated that fruit set was directly hampered by poor pollen performance. Their results are strongly supported by the present findings.
Yield plant-1: Among the germplasm the highest yield plant-1 was recorded from FA 005 (737.70 g) followed by FA 006 (702.30 g) and was significantly higher than others (Figure 5). The lowest yield plant-1 was recorded from FA 013, FA 014, FA 009 and FA 010 which produced only 52.00 g, 69.00 g, 81.33 g and 121.30 g fruits plant-1,
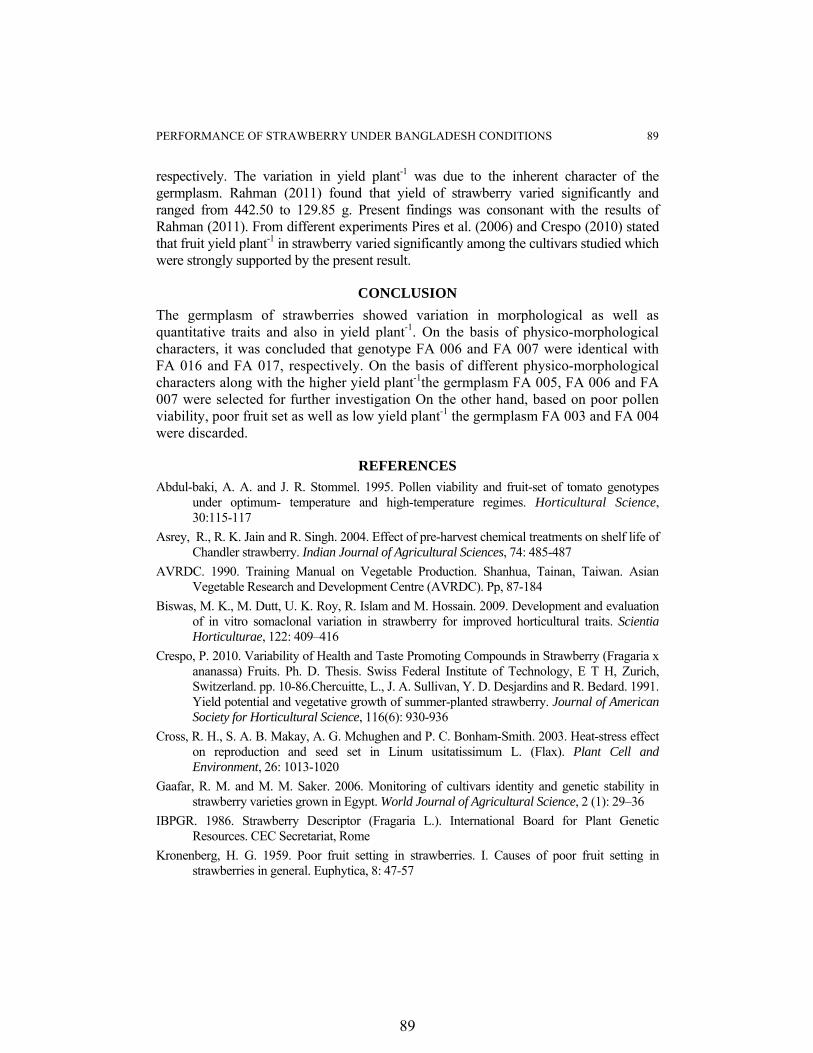
PERFORMANCE OF STRAWBERRY UNDER BANGLADESH CONDITIONS 89
89
respectively. The variation in yield plant-1 was due to the inherent character of the germplasm. Rahman (2011) found that yield of strawberry varied significantly and ranged from 442.50 to 129.85 g. Present findings was consonant with the results of Rahman (2011). From different experiments Pires et al. (2006) and Crespo (2010) stated that fruit yield plant-1 in strawberry varied significantly among the cultivars studied which were strongly supported by the present result.
CONCLUSION The germplasm of strawberries showed variation in morphological as well as quantitative traits and also in yield plant-1. On the basis of physico-morphological characters, it was concluded that genotype FA 006 and FA 007 were identical with FA 016 and FA 017, respectively. On the basis of different physico-morphological characters along with the higher yield plant-1the germplasm FA 005, FA 006 and FA 007 were selected for further investigation On the other hand, based on poor pollen viability, poor fruit set as well as low yield plant-1 the germplasm FA 003 and FA 004 were discarded.
REFERENCES Abdul-baki, A. A. and J. R. Stommel. 1995. Pollen viability and fruit-set of tomato genotypes
under optimum- temperature and high-temperature regimes. Horticultural Science, 30:115-117
Asrey, R., R. K. Jain and R. Singh. 2004. Effect of pre-harvest chemical treatments on shelf life of Chandler strawberry. Indian Journal of Agricultural Sciences, 74: 485-487
AVRDC. 1990. Training Manual on Vegetable Production. Shanhua, Tainan, Taiwan. Asian Vegetable Research and Development Centre (AVRDC). Pp, 87-184
Biswas, M. K., M. Dutt, U. K. Roy, R. Islam and M. Hossain. 2009. Development and evaluation of in vitro somaclonal variation in strawberry for improved horticultural traits. Scientia Horticulturae, 122: 409–416
Crespo, P. 2010. Variability of Health and Taste Promoting Compounds in Strawberry (Fragaria x ananassa) Fruits. Ph. D. Thesis. Swiss Federal Institute of Technology, E T H, Zurich, Switzerland. pp. 10-86.Chercuitte, L., J. A. Sullivan, Y. D. Desjardins and R. Bedard. 1991. Yield potential and vegetative growth of summer-planted strawberry. Journal of American Society for Horticultural Science, 116(6): 930-936
Cross, R. H., S. A. B. Makay, A. G. Mchughen and P. C. Bonham-Smith. 2003. Heat-stress effect on reproduction and seed set in Linum usitatissimum L. (Flax). Plant Cell and Environment, 26: 1013-1020
Gaafar, R. M. and M. M. Saker. 2006. Monitoring of cultivars identity and genetic stability in strawberry varieties grown in Egypt. World Journal of Agricultural Science, 2 (1): 29–36
IBPGR. 1986. Strawberry Descriptor (Fragaria L.). International Board for Plant Genetic Resources. CEC Secretariat, Rome
Kronenberg, H. G. 1959. Poor fruit setting in strawberries. I. Causes of poor fruit setting in strawberries in general. Euphytica, 8: 47-57
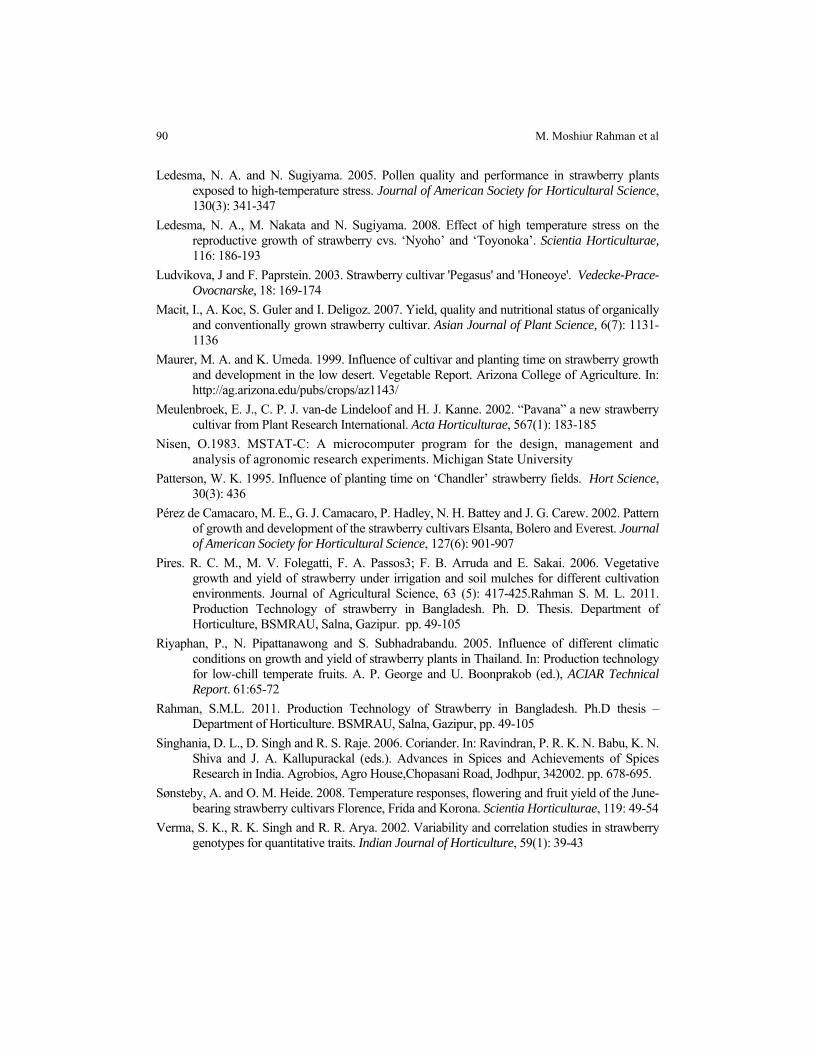
90 M. Moshiur Rahman et al
Ledesma, N. A. and N. Sugiyama. 2005. Pollen quality and performance in strawberry plants exposed to high-temperature stress. Journal of American Society for Horticultural Science, 130(3): 341-347
Ledesma, N. A., M. Nakata and N. Sugiyama. 2008. Effect of high temperature stress on the reproductive growth of strawberry cvs. ‘Nyoho’ and ‘Toyonoka’. Scientia Horticulturae, 116: 186-193
Ludvikova, J and F. Paprstein. 2003. Strawberry cultivar 'Pegasus' and 'Honeoye'. Vedecke-Prace-Ovocnarske, 18: 169-174
Macit, I., A. Koc, S. Guler and I. Deligoz. 2007. Yield, quality and nutritional status of organically and conventionally grown strawberry cultivar. Asian Journal of Plant Science, 6(7): 1131-1136
Maurer, M. A. and K. Umeda. 1999. Influence of cultivar and planting time on strawberry growth and development in the low desert. Vegetable Report. Arizona College of Agriculture. In: http://ag.arizona.edu/pubs/crops/az1143/
Meulenbroek, E. J., C. P. J. van-de Lindeloof and H. J. Kanne. 2002. “Pavana” a new strawberry cultivar from Plant Research International. Acta Horticulturae, 567(1): 183-185
Nisen, O.1983. MSTAT-C: A microcomputer program for the design, management and analysis of agronomic research experiments. Michigan State University
Patterson, W. K. 1995. Influence of planting time on ‘Chandler’ strawberry fields. Hort Science, 30(3): 436
Pérez de Camacaro, M. E., G. J. Camacaro, P. Hadley, N. H. Battey and J. G. Carew. 2002. Pattern of growth and development of the strawberry cultivars Elsanta, Bolero and Everest. Journal of American Society for Horticultural Science, 127(6): 901-907
Pires. R. C. M., M. V. Folegatti, F. A. Passos3; F. B. Arruda and E. Sakai. 2006. Vegetative growth and yield of strawberry under irrigation and soil mulches for different cultivation environments. Journal of Agricultural Science, 63 (5): 417-425.Rahman S. M. L. 2011. Production Technology of strawberry in Bangladesh. Ph. D. Thesis. Department of Horticulture, BSMRAU, Salna, Gazipur. pp. 49-105
Riyaphan, P., N. Pipattanawong and S. Subhadrabandu. 2005. Influence of different climatic conditions on growth and yield of strawberry plants in Thailand. In: Production technology for low-chill temperate fruits. A. P. George and U. Boonprakob (ed.), ACIAR Technical Report. 61:65-72
Rahman, S.M.L. 2011. Production Technology of Strawberry in Bangladesh. Ph.D thesis – Department of Horticulture. BSMRAU, Salna, Gazipur, pp. 49-105
Singhania, D. L., D. Singh and R. S. Raje. 2006. Coriander. In: Ravindran, P. R. K. N. Babu, K. N. Shiva and J. A. Kallupurackal (eds.). Advances in Spices and Achievements of Spices Research in India. Agrobios, Agro House,Chopasani Road, Jodhpur, 342002. pp. 678-695.
Sønsteby, A. and O. M. Heide. 2008. Temperature responses, flowering and fruit yield of the June-bearing strawberry cultivars Florence, Frida and Korona. Scientia Horticulturae, 119: 49-54
Verma, S. K., R. K. Singh and R. R. Arya. 2002. Variability and correlation studies in strawberry genotypes for quantitative traits. Indian Journal of Horticulture, 59(1): 39-43

PERFORMANCE OF STRAWBERRY UNDER BANGLADESH CONDITIONS 91
91
Table 1: Qualitative growth characters of strawberry germplasm
Germplasm Growth habit plant vigor Foliage density Foliage color Position of inflorescences
FA 001 Intermediate Intermediate Intermediate Dark Above the foliage
FA 003 Prostrate Strong Sparse Dark Beneath the foliage
FA 004 Erect Strong Dense Intermediate Beneath the foliage
FA 005 Intermediate Intermediate Intermediate Light Beneath the foliage
FA 006 Erect Strong Dense Light Beneath the foliage
FA 007 Erect Strong Dense Light Beneath the foliage
FA 008 Intermediate Intermediate Sparse Dark Above the foliage
FA 009 Prostrate Weak Sparse Dark Level with the foliage
FA 010 Prostrate Weak Intermediate Intermediate Beneath the foliage
FA 011 Prostrate Intermediate Intermediate Dark Beneath the foliage
FA 013 Intermediate Weak Intermediate Dark Above the foliage
FA 014 Intermediate Weak Intermediate Dark Level with the foliage
FA 016 Erect Strong Dense Light Beneath the foliage
FA 017 Erect Strong Dense Light Beneath the foliage
BARI Sb.-1 Intermediate Intermediate Intermediate Dark Above the foliage
Table 2: Quantitative growth characters of strawberry germplasm
Germplasm Plant height (cm)
Plant spreading
(cm) Leaves plant-1 Runners
plant-1 Crowns plant-1
FA 001 15.33 de 22.00 ab 31.00 e 44.67 c 7.33 cd FA 003 16.33 de 23.33 a 34.00 de 68.67 a 9.00 b-d FA 004 17.00 d 21.67 ab 36.67 cd 63.00 a 9.67 bc FA 005 21.67 bc 24.67 a 42.67 b 11.67 f 11.33 b FA 006 22.67 b 24.67 a 46.67 a 8.33 f 14.67 a FA 007 25.00 a 24.33 a 40.00 bc 6.33 f 15.33 a FA 008 16.67 de 23.00 a 20.67 f 31.33 d 8.67 b-d FA 009 15.67 de 20.00 a-c 21.33 f 44.33 c 6.67 d FA 010 15.00 de 18.00 b-d 21.00 f 43.00 c 7.00 cd FA 011 15.00 de 18.00 b-d 23.67 f 53.00 b 6.67 d FA 013 14.67 e 15.00 d 21.33 f 53.67 b 7.00 cd FA 014 17.00 d 16.00 cd 20.33 f 43.00 c 7.33 cd FA 016 20.00 c 21.67 ab 40.00 bc 19.33 e 9.00 b-d FA 017 21.33 bc 23.33 a 40.67 bc 20.67 e 9.00 b-d BARI Strawberry-1
17.00 d 23.00 a 31.33 e 33.33 d 8.67 b-d
Level of significance ** ** ** ** **
CV (%) 4.82 8.69 5.55 7.49 12.24
Figures having the same letter(s) in a column do not differ significantly by DMRT. Level of significance ** means significant at 1 % level
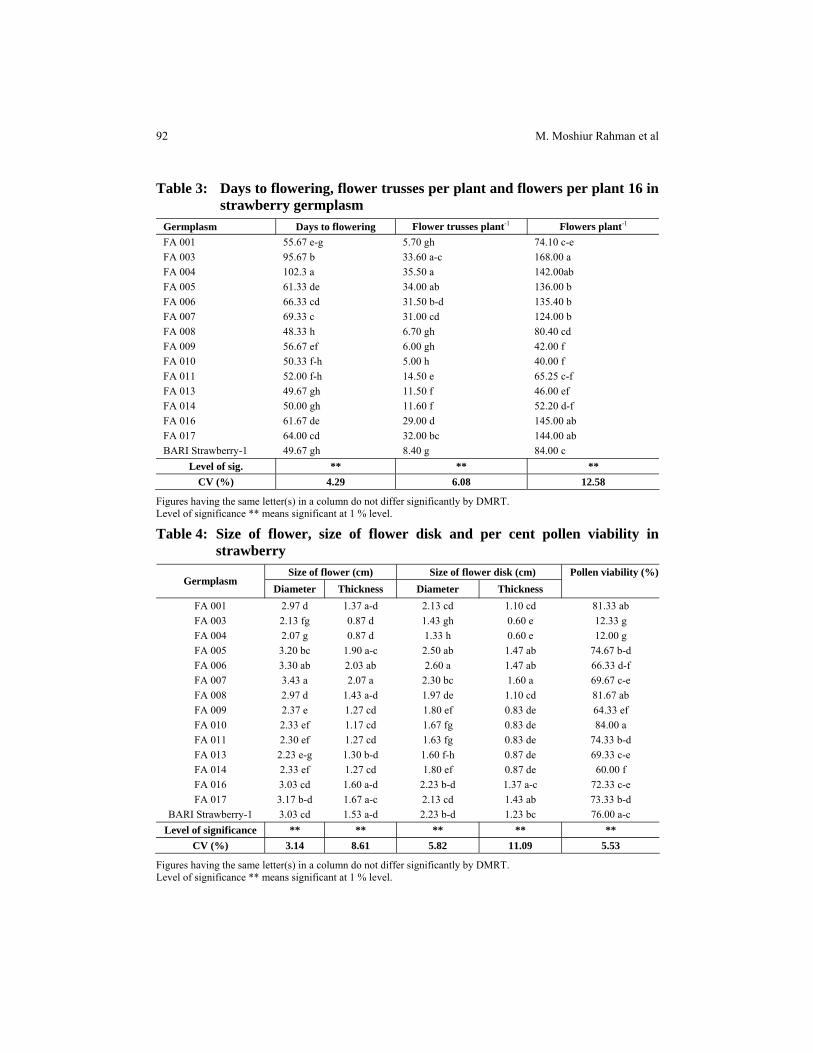
92 M. Moshiur Rahman et al
Table 3: Days to flowering, flower trusses per plant and flowers per plant 16 in strawberry germplasm
Germplasm Days to flowering Flower trusses plant-1 Flowers plant-1 FA 001 55.67 e-g 5.70 gh 74.10 c-e FA 003 95.67 b 33.60 a-c 168.00 a FA 004 102.3 a 35.50 a 142.00ab FA 005 61.33 de 34.00 ab 136.00 b FA 006 66.33 cd 31.50 b-d 135.40 b FA 007 69.33 c 31.00 cd 124.00 b FA 008 48.33 h 6.70 gh 80.40 cd FA 009 56.67 ef 6.00 gh 42.00 f FA 010 50.33 f-h 5.00 h 40.00 f FA 011 52.00 f-h 14.50 e 65.25 c-f FA 013 49.67 gh 11.50 f 46.00 ef FA 014 50.00 gh 11.60 f 52.20 d-f FA 016 61.67 de 29.00 d 145.00 ab FA 017 64.00 cd 32.00 bc 144.00 ab BARI Strawberry-1 49.67 gh 8.40 g 84.00 c
Level of sig. ** ** ** CV (%) 4.29 6.08 12.58
Figures having the same letter(s) in a column do not differ significantly by DMRT. Level of significance ** means significant at 1 % level.
Table 4: Size of flower, size of flower disk and per cent pollen viability in strawberry
Size of flower (cm) Size of flower disk (cm) Germplasm
Diameter Thickness Diameter Thickness Pollen viability (%)
FA 001 2.97 d 1.37 a-d 2.13 cd 1.10 cd 81.33 ab FA 003 2.13 fg 0.87 d 1.43 gh 0.60 e 12.33 g FA 004 2.07 g 0.87 d 1.33 h 0.60 e 12.00 g FA 005 3.20 bc 1.90 a-c 2.50 ab 1.47 ab 74.67 b-d FA 006 3.30 ab 2.03 ab 2.60 a 1.47 ab 66.33 d-f FA 007 3.43 a 2.07 a 2.30 bc 1.60 a 69.67 c-e FA 008 2.97 d 1.43 a-d 1.97 de 1.10 cd 81.67 ab FA 009 2.37 e 1.27 cd 1.80 ef 0.83 de 64.33 ef FA 010 2.33 ef 1.17 cd 1.67 fg 0.83 de 84.00 a FA 011 2.30 ef 1.27 cd 1.63 fg 0.83 de 74.33 b-d FA 013 2.23 e-g 1.30 b-d 1.60 f-h 0.87 de 69.33 c-e FA 014 2.33 ef 1.27 cd 1.80 ef 0.87 de 60.00 f FA 016 3.03 cd 1.60 a-d 2.23 b-d 1.37 a-c 72.33 c-e FA 017 3.17 b-d 1.67 a-c 2.13 cd 1.43 ab 73.33 b-d
BARI Strawberry-1 3.03 cd 1.53 a-d 2.23 b-d 1.23 bc 76.00 a-c Level of significance ** ** ** ** **
CV (%) 3.14 8.61 5.82 11.09 5.53
Figures having the same letter(s) in a column do not differ significantly by DMRT. Level of significance ** means significant at 1 % level.

PERFORMANCE OF STRAWBERRY UNDER BANGLADESH CONDITIONS 93
93
y = -138.92 + 4.1467x -0.0241x2
R2 = 0.7786*
0
5
10
15
20
25
30
35
40
45
40 50 60 70 80 90 100 110
Days to flowering
Flo
wer
trus
ses p
lant
-1
y = -0.0952x + 12.612 R2 = 0.4801
02468
1012141618
0 6 12 18 24 30 36 42 48 54 60 66 72 78
Runner plant-1
Cro
wn
plan
t-1
Figure 1: Relationship between number of runner plant-1 and number of crowns plant-1
Figure 2: Relationship between days to flowering and number of flower trusses plant-1.
Figure 3: Fruit set (%) in different strawberry germplasm. Note. Plant of FA 003 and FA 004 failed to produce any fruits.
69
0 0
66
5956
81
45
73
64
39
48
64
58
86
0
10
20
30
40
50
60
70
80
90
100
FA 001
FA 003
FA 004
FA 005
FA 006
FA 007
FA 008
FA 009
FA 010
FA 011
FA 013
FA 014
FA 016
FA 017
BARI Stra
wberry-1
Genotypes
Frui
t ste
(%)
Germplasm
94 M. Moshiur Rahman et al
253.7
737.7702.3
626.3
452.7
81 .33 121.3 150
52 69
575557
520.7
0
100
200
300
400
500
600
700
800
FA 0
01
FA 0
05
FA 0
06
FA 0
07
FA 0
08
FA 0
09
FA 0
10
FA 0
11
FA 0
13
FA 0
14
FA 0
16
FA 0
17BAR
I Stra
wberry
-1
Genotypes
Yiel
d/pl
ant (
g)
y =1.1062x - 17.108 R2 = 0.8139**
-20
0
20
40
60
80
100
0 20 40 60 80 100
Pollen viability (%)
Frui
t set
(%)
Figure 4. Relationship between pollen viability and percent fruit set in straw berry
Figure 5: Yield plant-1 (g) in different strawberry germplasm.
Appendix 1: Accession number, source of collection and country of origin of collected strawberry germplasm/varieties
Accession No. Source of collection Country of origin FA 001 BARI Japan FA 003 Parvin Nursery Unknown FA 004 Parvin Nursery Unknown FA 005 Personal contact Florida, USA FA 006 Personal contact Florida, USA FA 007 Personal contact Florida, USA FA 008 Rajshahi University Japan FA 009 Rajshahi University Japan FA 010 Rajshahi University Japan FA 011 Kashban Nursery India FA 013 Kashban Nursery India FA 014 Parvin Nursery India FA 016 Krishibid Nursery Unknown FA 017 Krishibid Nursery Unknown
BARI Strawberry-1 BARI Japan
Yie
ld p
lant
-1 (g
)
Germplasm
SAARC J. Agri., 11(2): 95-102 (2013)
MOLECULAR DIVERSITY ANALYSIS IN POTATO (Solanum tuberosum L.) THROUGH RAPD MARKERS
M.E. Hoque*1, H. Huq2 and N.J. Moon3 Department of Biotechnology, Sher-e-Bangla Agricultural University, Dhaka, Bangladesh
ABSTRACT
Random Amplified Polymorphic DNA (RAPD) markers were used to study the molecular diversity of 12 popular potato varieties in Bangladesh. DNA was extracted from tender leaf sample for PCR amplification. The PCR amplified DNA profile was visualized on 2% agarose gel, staining with ethidium bromide. Eight RAPD primers were used to evaluate the genetic diversity of potato varieties. Some total of 36 DNA fragments were amplified and out of them 24 were polymorphic. Those primers generated 61.53% of polymorphic DNA band. The primer OPX 04 produced highest (9) number of DNA band and out of 9 amplicon 6 were polymorphic. Lowest number of amplification was observed in the primer OPA-17 and it was only 3. The highest Nei’s genetic distance (0.9701) was noticed between the variety Granola and Provinto. The highest (0.8205) number of genetic identity/similarity was observed between the varieties Cardinal and Diamant. The unweighted pair group method of arithmetic mean (UPGMA) dendrogram based on Nei’s genetic distance revealed that the 12 varieties followed into two main clusters. The present finding showed that there was high level of genetic diversity among the varieties which can be used for parental selection in potato breeding program. Key words: Molecular diversity, RAPD, potato.
INTRODUCTION Potato (Solanum tuberosum L.) is a highly heterogeneous and vegetatively
propagated crop. It is one of the important food crops of Bangladesh as well as in many other countries of the word. It produces more calories and protein per unit of land with minimum time than any other field crops (Upadhya, 1995). Because of its high yield potential and food value as compared to rice and wheat, it is cnsidered as a promising candidate crop for feeding the hungry people of the world (Pushkarnath, * Corresponding author email: [email protected] 1Associate Professor, Department of Biotechnology, Sher-e-Bangla Agricultural University, Dhaka, Bangladesh 2Assistant Professor, Department of Biotechnology, Sher-e-Bangla Agricultural University, Dhaka, Bangladesh 3M.S. Student, Dept. of Genetics and Plant Breeding, Sher-e-Bangla Agricultural University, Dhaka, Bangladesh Received: 09.04.2013

96 M. E. Hoque et al
1976). The yield level of potato in Bangladesh is lower than other potato growing countries of the world (BBS, 2010). The use of local seed and traditional varieties are the major constrains of low yield in potato. Development of high yielding varieties having good keeping quality is one of the challenges for potato breeders. Genetic variability has been considered as is prerequisite for crop improvement program. The quantification of genetic diversity made it possible to select diverse parents for successful hybridization program. In recent years, several molecular markers had been used to identify and assess the genetic diversity and phylogenies relationship in plant. The traditional methods based on morphological traits require more time, cost expensive and has large effect on environment. By the development of a wide range of molecular technique, marker assisted breeding is now used to enhance conventional breeding program for crop improvement. Among the different molecular markers RAPD technique (Williams et al. 1990) is reliable, faster and easier for exploiting molecular diversity analysis within and among species. RAPD markers have been widely used for identification of genetic relationship among cultivars (Tosti and Nejri, 2002). Hence, the present investigation was undertaken for molecular diversity analysis of some released potato varieties through RAPD markers and to identify the divergence genotypes for potato improvement program.
MATERIALS AND METHODS The experiments were carried out at the Department of Biotechnology, Sher-e-
Bangla Agricultural University, Sher-e-Bangla Nagar, Dhaka. Twelve popular released potato varieties were collected from Tuber Crops Research Centre (TCRC), Bangladesh Agricultural Research Institute (BARI), Gazipur and used as experimental materials. The potato varieties were Cardinal, Diamant, Granola, Asterix, Sagita, Courrage, Lady Rosetta, Felsina, Multa, Provinto, Petronige and TPS-1.
Seedling raising: Good quality, disease free, healthy tuber (breeder stock) were sown in plastic pots and kept in nets house. All management practices were done for raising quality seedlings from those materials. Fresh leaves were collected at 3-4 leaf stage of plant for isolation of DNA.
Eetraction and quantification of DNA: Total genomic DNA from each variety was isolated by CTAB method with slight modification according to Frey et al., (2004). The extracted DNA was purified by propanol and treated with 10µg/ml RNase A for 20-25 min at 37oC to remove the RNA. The purified DNA was dissolved in TE buffer and quantification of DNA was done through electrophoresis on 1% agarose gel staining by ethidium bromide. The sample DNA was stored at -20oC freezer for further use.
Primer selection and PCR amplification: Seventeen RAPD primers were selected on the basis of previous works to evaluate the molecular polymorphism among the potato varieties. PCR reaction was performed using BIONEER KIT
MOLECULAR DIVERSITY ANALYSIS IN POTATO 97
(korea). The PCR reaction having 20.0 µl mixture containing 3.0 µl sterile deionized water, l0X PCR buffer 4.0 µl, enzyme dilution buffer 4.0 µl, 20 mM MgCl2, 3.0 µl dNTPs (10mM) 1.0 µl top DNA polymerase 0.5 µl, primer 2.5 µl and sample DNA (approx. 40-50 ng) 2.0 µl. The reaction mixture was subjected to the following thermal profile for amplification in a thermocycler : 5 min at 95oC for initial denaturation, followed by 33 cycle of 1.10 min denaturation at 94oC, 1.0 min at annealing and 1.30 min at 72oC for extension. A final extension step was done at 72oC for 7 min. Electrophoresis was done to visualize the PCR amplified product. It was carried out on 2.0% agarose gel and amplified fragments were visualized by staining with ethidium bromide. The amplified bands were scored as present (1) and absent (0) for each primer. The score of bands were pooled to create a single data matrix. These were used to estimate polymorphic loci. Genetic distance and identity were calculated based on Nei’s (1972). Phylogenetic tree and dendrogram were established based on an unpaired group method of arithmetic means (UPGMA) using the software POPGENE (Version 1.31) (Yeh et al., 1999).
RESULTS AND DISCUSSION Molecular diversity and polymorphism studies in 12 potato varieties of
Bangladesh was done through RAPD primer. Seventeen RAPD Primers (10-mer) were initially screened on 12 popular potato varieties for their ability to amplify polymoric fragment of DNA. Out of them only eight primers viz. OPA-17, OPG-17, OPJ-13, OPP-12, OPX-01, OPX-04 and OPX-07 showed distinct polymeric DNA profiles. Some total of 39 bands were obtained from these primers with an average of 4.87 bands per primer. Among the amplified product 24 polymorphic DNA bands were observed. The polymorphic DNA fragments ranged from 2-6 in different RAPD oligomer. It was observed that the primer OPX-04 product had highest (9) number of polymorphic DNA band and it was lowest (2) in OPA-17 and OPX-07 primers. The percent of polymorphic DNA fragment was 61.53 under this present investigation (Table 2). The maximum DNA fragment was generated by the primer OPX-04 and it was minimum (3) in OPA-17. The DNA profile of 12 potato varieties using OPX-04, OPX-07 and OPX-17 primers are shown in figure 1 and 2, respectively. The number of polymorphic bands was considered appropriate to assess the genetic divergence of potato genotypes. It might be due to more amount of GC content (60-70%) of the primers used in this study. Fukuoka et al. (1992) observed an increased number of bands with increasing GC content of the primer. The explanation for the correlation between GC content and the number of bands may be the stability of base complementation of A with T. The amplified DNA profiling was scored according to the presence and absence of bands. Absence of bands might be failure of primers to anneal at a binding site in some genotypes due to nucleotide sequence differences or may be insertion or deletions of primer binding site. Rocha et al. (2010) reported on genetic diversity in potato cultivar by RAPD and SSR markers. They notice that, genomic DNA of 16 potato cultivars was amplified with 25 RAPD primers that

98 M. E. Hoque et al
generated 92 polymorphic bands. The cultivar identification using RAPD markers is well documented in studies of molecular characterization (Bianchi et al, 2003). Fingerprinting based on RAPD marker type was used for identification and characterization of potato cultivars in North America (Sosinski and Donches, 1996). The genetic identity and genetic distance among the 12 potato varieties are presented in table 2. The Nei’s genetic identity was the highest (0.82050) in the varietal pair Cardinal and Diamant and it was the lowest (0.333) in Provinto and Granola. The highest Nei’s genetic distance (0.970) was noticed between Granola and Provinto. It was the lowest (0.137) in two different varietal pair viz, (a) Petronige and Provinto (b) Courrage and Provinto, respectively. However, high levels of genetic distance were also noticed in the varietal pairs: Lady Rossetta and Cordage (0.955), Provinto and Lady Rossetta (0.893), Courrage and Granola (0.8910). A dendrogram based on Nei’s (1972) genetic distance using unmeasured pair group method of arithmetic mean (UPGMA) was established with 12 popular potato varieties (Figure 3). These varieties segregated into two main clusters. The variety Granola and Sagita were into one cluster and rest of the materials were in cluster-II. The cluster -II was sub-divided into two sub groups. Seven varieties were clustered in one sub-group and three varieties were clustered in second sub-group. Those sub-groups were further segregated in different sub-sub cluster group on the basis of their identity. The results indicated that, low and high level genetic distance exists between the varieties. The variety Granola, Provinto, Lady Rossetta and Courrage showed highest level of genetic diversity which can be used for further potato breeding program. Sawy et al. (2007) reported that, RAPD technique can be successfully applied to determine the genetic fidelity of potato plant. A limited study has been made on genetic divergence in potato either at tetraploid (Gaur et al. 1978 and Sidhu et al., 1981 or at diploid level (Grag 1988). Mondal (2007) reported that an understanding of the nature and magnitude of variability among the genetic stock is of prime importance to the breeders. Hence, it is important to analyze the genetic variability of parental materials. Molecular based analysis of present finding can provide information on actual genetic diversity among the potato cultivars.
CONCLUSION Information on the genetic diversity allows to assist the parent selection and
paving the way to genetic gains. The results of present study revealed the existence of high level of genetic diversity among the studied 12 popular widely grown potato varieties in Bangladesh. These varieties can further be used as parental material for fixation of heterosis in potato improvement program.

MOLECULAR DIVERSITY ANALYSIS IN POTATO 99
ACKNOWLEDGEMENT The authors expressed deepest sense of appreciation and heartfelt thanks to
Bangladesh Academy of Sciences (BAS) and United State Department of Agriculture (USDA) for financial support to conduct the research.
PCR Amplification with RAPD Primer OPX-07 Figure 1: RAPD profile of 12 potato varieties using primer OPX-07. Lane: 1. Cardinal; 2. Diamant; 3. Granola; 4. Lady Rossetta; 5. Sagita; 6. Courrage; 7. Asterix; 8. Felsina; 9. Multa; 10. Provinto; 11. Petronige; 12. T.P.S. 1; M1= Molecular marker 1kb (B.G. Nei, India) and M2=100bp (Bioneer, Korea)
PCR Amplification with RAPD Primer OPX-04
Figure 2: RAPD profile of 12 potato varieties using primer OPX-04. Lane: 1.Cardinal; 2. Diamant; 3. Granola; 4. Lady Rossetta; 5. Sagita; 6. Courrage; 7. Asterix; 8. Felsina;9. Multa; 10. Provinto; 11. Petronige; 12. T.P.S. 1; M= Molecular marker 100bp (Bioneer, Korea)
M1 M2 1 4 5 6 8 2 7 9 3 10 11 12
2.0 Kb 1.5 ” 1.0 ” 1.0 kb
500 bp
M 1 2 3 4 5 6 7 8 9 10 11 12
2.0 Kb 1.5 ” 1.0 ”
500 bp
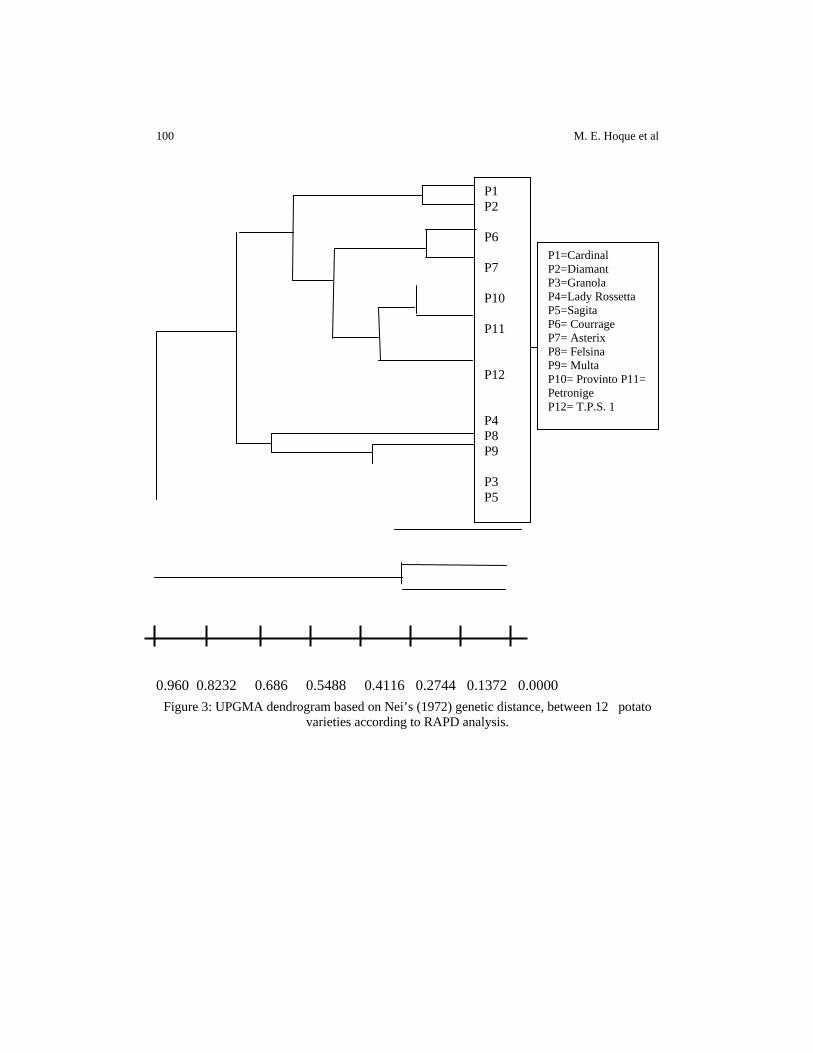
100 M. E. Hoque et al
0.960 0.8232 0.686 0.5488 0.4116 0.2744 0.1372 0.0000
Figure 3: UPGMA dendrogram based on Nei’s (1972) genetic distance, between 12 potato varieties according to RAPD analysis.
P1 P2 P6 P7 P10 P11 P12 P4 P8 P9 P3 P5
P1=Cardinal P2=Diamant P3=Granola P4=Lady Rossetta P5=Sagita P6= Courrage P7= Asterix P8= Felsina P9= Multa P10= Provinto P11= Petronige P12= T.P.S. 1

MOLECULAR DIVERSITY ANALYSIS IN POTATO 101
Table 1: Number and percentage of polymorphic loci obtained in 12 potato varieties
Name of RAPD primer
Sequence of the primer
GC content (%)
No. of bands scored
Size ranges (bp) observed
No. of polymorphic
bands
Percentage of polymorphic
loci
OPA17 GACCGCTTGT 60 3 278-735 2 66.66
OPG17 ACGACCGACA 60 6 249-1225 3 50.0
OPJ13 CCACACTACC 60 5 295-1491 4 80.0
OPP12 AAGGGCGAGT 60 5 400-1264 3 60.0
OPX01 CTGGGCACGA 70 7 144-934 4 57.14
OPX04 CCGCTACCGA 70 9 198-1579 6 66.66
OPX07 GAGCGAGGCT 70 4 301-1272 2 50.00
Total - - 39 - 24 61.53
Table 2: Genetic identity (above diagonal) and genetic distance (below
diagonal) values among the twelve potato varieties Cardinal Diamant Granula Asterix Lady
RossettaCourrage Sagita Felsina Multa Provinto Petronige TPS1
Cardinal - 0.8205 0.5897 0.6154 0.5641 0.7692 0.6923 0.6410 0.5641 0.7436 0.6667 0.7692
Diamant 0.1978 - 0.6667 0.7436 0.5897 0.6410 0.5641 0.4615 0.5385 0.6667 0.7436 0.6923
Granula 0.5281 0.4055 - 0.6154 0.7692 0.4103 0.4359 0.5385 0.5641 0.3333 0.4615 0.4615
Asterix 0.4855 0.2963 0.4855 - 0.5897 0.5897 0.5641 0.6154 0.6923 0.6154 0.7436 0.6410
L.Rossetta 0.5725 0.5281 0.2624 0.5281 - 0.3846 0.4615 0.6667 0.6923 0.3590 0.4872 0.5385
Courrage 0.2624 0.4447 0.8910 0.5281 0.9555 - 0.8718 0.6154 0.5897 0.8718 0.7436 0.6923
Sagita 0.3677 0.5725 0.8303 0.5725 0.7732 0.1372 - 0.7436 0.6154 0.8462 0.7179 0.6667
Felsina 0.4447 0.7732 0.6190 0.4855 0.4055 0.4855 0.2963 - 0.7692 0.6410 0.5641 0.6667
Multa 0.5725 0.6190 0.5725 0.3677 0.3677 0.5281 0.4855 0.2624 - 0.6667 0.7436 0.6923
Provinto 0.2963 0.4055 0.9701 0.4855 0.8931 0.1372 0.1671 0.4447 0.4055 - 0.8718 0.8205
Petronige 0.4055 0.2963 0.7732 0.2963 0.7191 0.2963 0.3314 0.5725 0.2963 0.1372 - 0.7949
TPS1 0.2624 0.3677 0.7732 0.4447 0.6190 0.3677 0.4055 0.4055 0.3677 0.1978 0.2296 -
102 M. E. Hoque et al
REFERENCES BBS. 2010. Statistical Year Book of Bangladesh. Bangladesh Bureau of Statistics.
Bangladesh Secretariat, Dhaka. 111-112 PP Bianchi, V.J., Fachinello, J.C. and Schuch, M.W. 2003. RAPDs na caraterizacao genetico-
molecular eno estudo da variabilidade genetica de cultivares de ameixeira. Revista Brasileira de Fruticultura, 25:272-274
Frey, J.E. Frey, B., Sauer, C. and Kellerhals, M. 2004. Efficient low cost DNA extraction and multiplex fluorescent PCR method for marker assisted selection in breeding. Plant Breed, 123:554-557
FuKuo, Ka., S., Hosaka, K. and Kamijima, O. 1992. Use of random amplified polymorphic DNAs (RAPDs) for identification of rice accessions. Japan Journal of Genetics, 67:243-252
Gaur, P.C., Gupta, P.K. and Kishore, H. 1978. Studies on genetic divergence of potato. Euphytica, 27:361-368
Grag, K.C. 1988. A study on dihaploids derived from five Indian cultivars of potato. Haryana Journal of Horticulture Science, 20: 255-260
Mondal, M.A.A., Hossain, M.M., Rasul, M.G. and Uddin, M.S. 2007. Genetic diversity in potato (Solanum tuberosum L.). Bangladesh Journal of Botany, 36(2): 121-125
Nei, M. 1972. Genetic distance between populations. American Naturalist, 106: 283-292. Puskarnath. 1976. Potato in the Sub-Tropics. Orient Longman Ltd. New Delhi-110012, India,
289 P Rocha, E.A., Paiva, L.V., Carvalho, H.H. and Guima-raes, C.T. 2010. Molecular
characterization and genetic diversity of potato cultivars using SSR and RAPD markers. Crop Breed. Appl. Biotech, 10:204-210
Sawy, A. E.,Bekheet, S. and Aly, U.I. 2007.Morphological and molecular characterization of potato microtubers production on Coumarin inducing medium. Int. J. Agril. Bio. 9-5: 675-680
Sidhu, A.S., Pandita, M.L. and Arora, S.K. 1981. Studies on genetic divergence in potato. Journal of Indian Potato Association, 8: 117-122
Sosinski, B. and Douches, D.S. 1996. Using polymerase Chain reaction-based DNA amplification to fingerprint North America potato Cultivars. Horti Science, 31:130-133
Tosti, N and Negri, V. 2002. Efficency of the PCR-based markers in assessing genetic variation among cowpea (Vigna ungiculata spp unguiculata) landraces. Genome, 45: 268-275
Upadhya, M. D. 1995. The potential of true potato seed technology for increased potato production in Bangladesh. Proceeding of the national workshop on national program for true potato seed (TPS) in Bangladesh, Bangladesh Agricultural Research Council, Dhaka, 5P
Williams, J.G.K., Kubelik, A.E., Levak, K.J., Rafalski, J.A. and Tingey, S. C. 1990. DNA Polymorphisms amplified by arbitrary primer are useful as genetic markers. Nucleic Acid Res, 28:6531-6535
Yeh, F.C. Yang, R.C., Boyle, T.B.J., Ye, Z.H. and Mao, J.X. 1999. POPGENE, the user-friendly software for population genetic analysis

SAARC J. Agri., 11(2): 103-116 (2013)
IDENTIFICATION AND DISTRIBUTION OF SUGARCANE STEM BORER IN BANGLADESH
Md. Ataur Rahman1, Md. Shibly Noman2, Md. Abdul Maleque2* Md. Zinnatul Alam3, Sultana Afroz4 and M.K.A. Chowdhury2
Bangladesh Sugarcane Research Institute, Ishurdi, Pabna, Bangladesh
ABSTRACT Field surveys were conducted during the cropping season of 2010-2011 to assess the distribution of Sugarcane stem borer species in 12 AEZs of Bangladesh. These surveys documented abundance and their distribution and results clearly showed the existence of the stem borer at all locations surveyed, but with a higher incidence in the Atwary (36%) and initiation of infestation was observed on 20 May. Stem borer incidence and distribution varied significantly among the different locations. Second highest rate of infestation (32%) was recorded in Bashudebpur followed by Dinajpur (31%), Pabna and Akandabaria farm (30%). The lower infestation was recorded in Kaliganj. The percentage of stems attacked at the Kaliganj has never exceeded 23% followed by Rajshahi (28%), Thakurgaon and Faridpur (29%). The rate of infestation of stem borer (Chilo tumidicostalis) in different locations varied from 23-36%. While morphological characteristics of stem borer species were identified with standard keys and species composition was only predominated by Chilo tumidicostalis Hampson, though previous workers found other borers in addition to this species. The sex ratio of adult moth Chilo tumidicostalis was 1:1.42 after emergence from the reared collected pupae from different locations. Key words: Alternate host, Caterpillar growth stage, Moths, Pupae, Lepidopteran pest, Sugarcane.
INTRODUCTION Sugarcane (Saccharum officinarum L.), a perennial tropical crop with a high self-tolerant nature, is grown for sugar stored in its stem and propagated through stem cuttings. Sugarcane is grown around the world between tropical and sub-tropical * Corresponding author email: [email protected] 1Bangladesh Sugarcane Research Institute, Ishurdi, Pabna, Bangladesh 2Crops Division, Bangladesh Agricultural Research Council, Farmgate, Dhaka 1215, Bangladesh 3Department of Entomology, Bangabandhu Sheikh Mujibur Rahman Agricultural University, Gazipur 1706, Bangladesh 4Department of Agriculture Extension, Ministry of Agriculture, Dhaka 1000, Bangladesh Received: 28.04.2013

104 Md. Ataur Rahman et al
climate (North latitude = 350C and South latitude = 350C). Sugarcane is cultivated in more than 100 countries of the tropical and sub-tropical regions of the world (Humbert, 1968). Around 70% of the world’s sugar is produced from this crop (Chowdhury and Vasil, 1993). Sugarcane is cultivated on an area of about 0.16 million hectare of land which almost 50% area is located in the sugar mills zone, and the remaining 50% is grown in the non-mills zone, where sugarcane is mostly diverted for jaggary and juice production. Presently, 15 sugar mills are in operation under Bangladesh Sugar and Food Industries Corporation (BSFIC) with a capacity of 0.21 million tons of sugar production per year (BSFIC, 2008). Stem borer, Chilo tumidicostalis Hampson is a serious insect pest of sugarcane in Bangladesh (Karim and Islam, 1977), Thailand (Suasa-ard et al., 2000), Nepal, Burma (Williams et al., 1969) and Australia (Sallam, 2006). Incidence of stem borer infestation starts from the end of April and continues up to November. However, it remains most abundant from June to September. Hundred percent crop losses by stem borer infestation were recorded in Setabgonj Sugar Mills in Bangladesh during 1973-1974 cropping season when attack reached as high as 100% due to the stem borer infestation (Karim and Islam, 1977). In India, it caused 8.2-12.6% yield loss sometimes reaching up to 70% with 10.75-48.55 % sugar recovery in endemic areas (Khanna et al., 1957; Butani, 1961). Gupta and Avasthey (1960) also reported 25-70% and 12-60% in cane yield due to primary and secondary infestation, respectively in different sugarcane varieties, along with 0.5-3.5 unit loss of sugar recovery in West Bengal, India. Stem borer is the most destructive pest of sugarcane in growing areas of Bangladesh. Maximum weight losses of 28.73, 18.64 and 18.01% and sucrose losses of 9.74, 11.21 and 15.93% were estimated in Isd 16, Isd 21 and Isd 30 respectively having more than three bores in infested cane (BSFIC, 2008). The stem borer genus Chilo contains 41 species of which Chilo tumidicostalis had been so far identified worldwide attacking many crops particularly Graminae/Poaceae family. This species and Chilo auricilius are very common and destructive in Bangladesh and India (Khanna et al., 1957; Avasthy, 1983). In addition, internode borers, Chilo sacchariphagus indicus Kapur is also a major pest of sugarcane in Peninsular India (Gupta and Avasthy, 1957). Climatic and soil conditions of both Bangladesh and India are almost similar. Besides, availability of alternate hosts during off season facilitates over-wintering of stem borer in Bangladesh. Therefore, there is a high possibility of invasion of the pest in Bangladesh. In such situation, distribution and identification of this pest at certain intervals are essential to know whether any new pest species has invaded in this country. In fact, no comprehensive work has so far been undertaken in Bangladesh to identify the different species of stem borer attacking sugarcane cultivated throughout the country since 1962. In this context, the present study was undertaken to identify and to assess the distribution of sugarcane stem borers in Bangladesh.

SUGARCANE STEM BORER IN BANGLADESH 105
MATERIALS AND METHODS Study site The survey was conducted at nine locations covering 12 Agro-Ecological Zones (AEZ) of Bangladesh with date of sample collection, date of placing sample in rearing box in the laboratory (Table 1). Stem borer infested sugarcanes were collected from the selected locations from August to September 2011. Nine Sugar Mills zones of Bangladesh namely Atwary, Panchagar Sugar Mills (PSM); Patuadangi farm, Thakurgaon Sugar Mills (TSM); Sultanpur farm, Setabganj Sugar Mills (STSM); Puthia, Rajshahi Sugar Mills (RJSM); Bashudebpur, Natore Sugar Mills (NTSM); BSRI farm, Pabna Sugar Mills (PBSM); Akandabaria farm, Carew & Co. Sugar Mills; Modhukhali, Faridpur Sugar Mills (FSM) and Kaliganj, Mobarakganj Sugar Mills (MKSM) were selected for this study (Figure 1).
Collection of sample A comprehensive survey was conducted through questionnaire by extensive visit throughout the selected locations during the cropping season of 2010-2011 and stem borer infested sugarcane fields were observed in the morning and afternoon. Adult emergence of Chilo tumidicostalis from pupae was recorded by rearing the collected specimen of 9 locations during the period from August to October 2011 and periods of stem borer infestation were recorded for nine locations of Bangladesh during the period from May to June 2011 (Figure 2 & 3). A total of 100 infested sugarcanes (Plate 6) were checked for recording the incidence of target pest in each field of cane grower. Hundred plants were examined randomly at each sugarcane field to obtain the percent infestation of stem borer (Figure 4). At each location, three sugarcane fields were randomly selected from which specimens were collected at random from 3 different cane growers. The percent of stem borer infested sugarcane per location was calculated based on the number of total plants observed and the number of infested plants. Accordingly fifty (50) plant specimens from each location were cut and tied into bundle. The bundle of cane containing borers was brought to Entomology Laboratory of Regional Sugarcane Research Station (RSRS), Thakurgaon as well as Entomology Laboratory of Bangladesh Sugarcane Research Institute (BSRI), Ishurdi, Pabna for morphometric study. Rearing boxes were kept ready before the specimen were carried to the laboratory. Rearing of sugarcane stem borer Infested sugarcane collected from different locations were placed separately in netted rearing cage (90 cm × 60 cm) and placed on laboratory desk. In order to culture the specimen larvae were collected by splitting borer infested stem of sugarcane. They were reared in the plastic boxes (23.0 cm in dia. and 10.5 cm high) with pieces of sugarcane stalk as food until pupation. The pupae were kept in a Petri dish (11.5 cm × 1.5 cm) with adequate moisture provided with water-soaked filter paper in the bottom of the Petri dish until the adult emergence. Pupae were then transferred to the

106 Md. Ataur Rahman et al
insect rearing cage (60 cm × 60 cm × 90 cm). Stock culture of stem borer was maintained at room temperature ranging from 20-30°C. Adults emerged from full grown pupae at 7-15 days after pupation. Emerged adults were placed separately in a killing jar and their number was counted. Adult moths were then pinned, stretched and preserved for identification. Identification of sugarcane stem borer (Chilo tumidicostalis Hampson) The major characteristics used to identify the adult male and female of sugarcane stem borer at different stages are given in appendix I. Specimens were primarily identified with the help of taxonomic keys described by Butani (1956), Alam (1967) and Butani and Jotwani (1984) (Appendix II). The laboratory reared freshly emerged adults (moths) collected from nine locations were compared with adult characteristics (Plate 1-6). For this purpose specific characters of each specimen were studied thoroughly and checked with the characters of the keys and all the characters were studied under binocular microscope. Larval (caterpillar) characteristics were also considered to confirm the identification. Design and Statistical analysis: The experiment was laid out in Completely Randomized Design (CRD) with three replications. The treatment means were compared using Duncan’s Multiple Range Test i.e. DMRT (Gomez and Gomez, 1984).
RESULTS AND DISCUSSION Infested samples with larvae collected from different locations, number of pupae and number of total adult individuals emerged from the laboratory-reared sugarcane are presented in Table 2. The recently emerged adults collected from nine locations of Bangladesh belong to the genus Chilo under the family Pyralidae. In the present study through identifying characteristics keys as described by Butani (1956), it might be assumed that only Chilo tumidicostalis would be the major pest of sugarcane in all the nine locations of Bangladesh. The present results are supported by Isaac and Rao (1941) and Isaac and Venkataraman (1941) who had shown the same larval and pupal characters of stem borer.
Morphological variations were not observed among the emerged adults of both male and female. The results indicated that the morphological characteristics of larva, pupa and adults were completely comparable to that of Chilo tumidicostalis only. Thus, only one species tumidicostalis belonging to the genus Chilo under the family Pyralidae was identified. Avasthy (1983) reported that two species of Chilo (i.e., Chilo tumidicostalis and Chilo auriciliusi) had bored into sugarcane, corn and paddy. He observed that these species also had attacked other plants under the family Graminae/Poaceae. Kapur (1950) reported that Argyria tumidicostalis later renamed as Chilo tumidicostalis Hampson was the major borer pest of sugarcane which prevails in Bangladesh.

SUGARCANE STEM BORER IN BANGLADESH 107
Number of pupae emerged The highest number of pupae (73) was produced from larvae of infested sugarcane collected from Patuadangi farm, Thakurgaon (Table 2). The second highest number of pupae (70) was obtained from the samples with larvae collected from Sultanpur farm, Setabganj. On the other hand, the lowest number of pupae (56) was found from the collected samples with larvae of Akandabaria farm, Carew & Co., Dorshona. Almost similar number of pupae viz., 60, 62, 65, 67, 68 and 69 were recorded from the sugarcane samples (with larvae) of Kaliganj, BSRI farm, Pabna, Puthia, Modhukhali, Bashudebpur and Atwary, respectively. Number of Adults emerged From the Figure 2 the highest number of adults (50) emerged from the pupae were recorded from Patuadangi farm followed by Atwary, Sultanpur farm and Modhukhali (49). The lowest number of adults (45) emerged from the pupae of Akandabaria (Carew & Co.) followed by BSRI farm (46). The number of adults emerged from the pupae of Puthia, Kaliganj and Bashudebpur were 47, 47 and 48, respectively. Male and female Sex Ratio The numbers of male and female stem borer moths emerged from the pupae of different locations are presented in Table 2. The highest number (24) of male moths emerged from the pupae of Patuadangi farm and the second highest number (22) of male moths emerged from Sultanpur farm. Number of male moths of 21 and 20 emerged from the pupae of the samples was collected from Atwary and Bashudebpur, respectively. Male moth emergence was poor from the pupae of samples collected from Modhukhali (19), Puthia (18), BSRI farm (18), Kaliganj (18) and Akandabaria farm (17). The highest number (30) of female moths emerged from the pupae of the samples from Modhukhali and the second highest number (29) from the samples of Puthia and Kaliganj followed by Atwary (28), Bashudebpur (28), BSRI farm (28) and Akandabaria farm (28). Twenty seven and twenty six female moths emerged individually from the pupae of samples collected from Sultanpur farm and Patuadangi farm. The number of female moth emergence ranged from 26-30. The lowest number (26) of female moth emerged from the pupae of samples collected from Patuadangi farm. A total of 430 moths emerged from the collected specimens of 9 different locations. Of them, 177 were males and 253 were females with a sex ratio of 1:1.42. Periods and rate of infestation by Chilo tumidicostalis in different locations From the figure 3 the initiation of infestation by stem borer was observed on 20 May in Atwary, 22 May in Patuadangi farm and 25 May in Sultanpur farm. On the other hand, stem borer infestation was found on 10 June in Rajshahi, 15 June in Natore, 18 June in Faridpur, 16 June in Pabna, 14 June in Akandabaria farm and 20 June in Mobarakganj. Panchagor, Thakurgaon and Dinajpur mills zones were the most Chilo tumidicostalis Hampson prone areas in Bangladesh. These zones have medium high

108 Md. Ataur Rahman et al
land, sandy and sandy loam soil texture, rain fed in March, April and May but were rainy in June, July and August because these areas are closer to Dargilling and Himaloy. Sugarcane is a major crop in these areas covering 14-18 months in the field. Maize and Rice is the alternate/sequential crop which is alternate host of sugarcane stem borer. In these areas, sugarcane is planted in the early season. For this reason, stem borer infestation reached as high as 100% in Sultanpur farm and Dinajpur (Karim and Islam, 1977). Survey record on the infestation rate of stem borer in different locations From the figure 4 survey report indicates that the highest rate of infestation (36%) was observed in Atwary. Second highest rate of infestation (32%) was recorded in Bashudebpur followed by Dinajpur (31%), Pabna and Akandabaria farm (30%). The lower infestation was recorded in Kaliganj (23%), followed by Rajshahi (28%), Thakurgaon and Faridpur (29%). The rate of infestation of stem borer (Chilo tumidicostalis) in different locations varied from 23-36%. Distribution of stem borer on host and locality Stem borer, Chilo tumidicostalis (Hampson) was the most abundant species which recorded 430 individuals that emerged from 590 pupae (72.88%) reared in infested sugarcane collected from 9 different locations situated at North, South, West and Central regions of Bangladesh. These species predominantly emerged from the specimens collected from Thakurgaon but became gradually infrequent in the infested sugarcane collected from Dinajpur, Panchagor, Natore, Faridpur, Rajshahi, Pabna, Kaliganj and Dorshona (Figure 3). The present study indicated that Chilo tumidicostalis is the most damaging insect pest that bored into the sugarcane, though previous workers found other borers in addition to Chilo auricilius. Other borers which attack maize and rice choose sugarcane as alternate host. A research report was found in the web site that there were many species of Chilo so far identified worldwide which attack many crops particularly under Graminae/Poaceae family. The genus Chilo contains 41 species and of them, 8 species (i.e., Chilo agamemnon, C. auricilius, C. infuscatellus, C. orichalocociliellus, C. partellus, C. sacchariphagus, C. terrenellus and C. tumidicostalis) have damage potential in Australian cane if they invade the mainland. Additionally, two Chilo species of Australia (i.e., Chilo polychrysus and C. suppressalis) are major pest of rice and minor pest of sugarcane in some countries in Asia (David and Easwaramoorthy, 1990). However, Chilo suppressalis appears to be strictly a pest of rice, but there is no evidence in the literature that it can survive on sugarcane. Two other species (Chilo diffusilineus and C. zacconius) were found in Africa but might have negligible impact. The remaining 29 Chilo genera are not known to be the pests of sugarcane. Stem borer, Chilo tumidicostalis (Hampson) is originally an Asian species. Populations in Madagascar, Malaysia, Mauritius and Reunion have probably been introduced by human in the mid 1800s (Williams, 1983). Chilo tumidicostalis is reported to feed exclusively on sugarcane, found in Bangladesh, India, Myanmar, Nepal and Thailand (David and Easwaramoorthy, 1990; Suasa-ard et al., 2000). It is known as the Bengal borer in India and used to be considered a major pest of
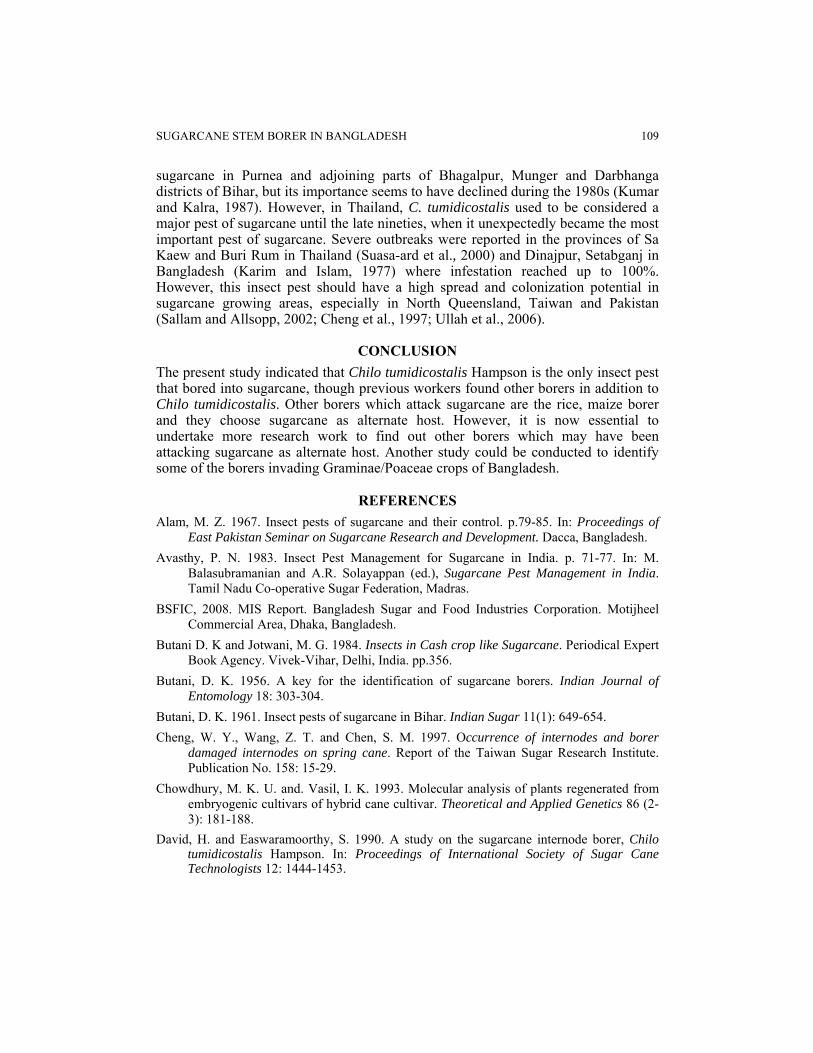
SUGARCANE STEM BORER IN BANGLADESH 109
sugarcane in Purnea and adjoining parts of Bhagalpur, Munger and Darbhanga districts of Bihar, but its importance seems to have declined during the 1980s (Kumar and Kalra, 1987). However, in Thailand, C. tumidicostalis used to be considered a major pest of sugarcane until the late nineties, when it unexpectedly became the most important pest of sugarcane. Severe outbreaks were reported in the provinces of Sa Kaew and Buri Rum in Thailand (Suasa-ard et al., 2000) and Dinajpur, Setabganj in Bangladesh (Karim and Islam, 1977) where infestation reached up to 100%. However, this insect pest should have a high spread and colonization potential in sugarcane growing areas, especially in North Queensland, Taiwan and Pakistan (Sallam and Allsopp, 2002; Cheng et al., 1997; Ullah et al., 2006).
CONCLUSION The present study indicated that Chilo tumidicostalis Hampson is the only insect pest that bored into sugarcane, though previous workers found other borers in addition to Chilo tumidicostalis. Other borers which attack sugarcane are the rice, maize borer and they choose sugarcane as alternate host. However, it is now essential to undertake more research work to find out other borers which may have been attacking sugarcane as alternate host. Another study could be conducted to identify some of the borers invading Graminae/Poaceae crops of Bangladesh.
REFERENCES Alam, M. Z. 1967. Insect pests of sugarcane and their control. p.79-85. In: Proceedings of
East Pakistan Seminar on Sugarcane Research and Development. Dacca, Bangladesh. Avasthy, P. N. 1983. Insect Pest Management for Sugarcane in India. p. 71-77. In: M.
Balasubramanian and A.R. Solayappan (ed.), Sugarcane Pest Management in India. Tamil Nadu Co-operative Sugar Federation, Madras.
BSFIC, 2008. MIS Report. Bangladesh Sugar and Food Industries Corporation. Motijheel Commercial Area, Dhaka, Bangladesh.
Butani D. K and Jotwani, M. G. 1984. Insects in Cash crop like Sugarcane. Periodical Expert Book Agency. Vivek-Vihar, Delhi, India. pp.356.
Butani, D. K. 1956. A key for the identification of sugarcane borers. Indian Journal of Entomology 18: 303-304.
Butani, D. K. 1961. Insect pests of sugarcane in Bihar. Indian Sugar 11(1): 649-654. Cheng, W. Y., Wang, Z. T. and Chen, S. M. 1997. Occurrence of internodes and borer
damaged internodes on spring cane. Report of the Taiwan Sugar Research Institute. Publication No. 158: 15-29.
Chowdhury, M. K. U. and. Vasil, I. K. 1993. Molecular analysis of plants regenerated from embryogenic cultivars of hybrid cane cultivar. Theoretical and Applied Genetics 86 (2-3): 181-188.
David, H. and Easwaramoorthy, S. 1990. A study on the sugarcane internode borer, Chilo tumidicostalis Hampson. In: Proceedings of International Society of Sugar Cane Technologists 12: 1444-1453.

110 Md. Ataur Rahman et al
Gomez, K. A. & Gomez, A. A. 1984. Statistical Procedure for Agricultural Research. 2nd edition. John Wiley and Sons, New York. 680 pp.
Gupta, B. D. 1960. Insect pests of Sugarcane in India. VI. The stalk borer, Chilo tumidicostalis Hampson. Indian Sugar 10: 67-78.
Gupta, B. D. and Avasthy, P. N. 1957. An epidemic of stem borer, Chilo tumidicostaris Hampson. Newsletter, Indian Institute of Sugarcane Research, Lucknow. p.34.
Gupta, B. D. and Avasthy, P. N. 1960. Biology and control of stem borer, Chilo tumidicostalis Hamson. International Society of Sugar Cane Technologists 10: 886-901.
Humbert, R. P. 1968. The Growing of Sugar Cane. Elsevier publishing company, Amsterdam. 1-779.
Isaac, P. V. and Rao, K. V. 1941. A key for the identification of the larvae of know Lepidopterous borers of sugarcane in India based on morphological characters. Indian Journal of Agricultural Sciences 11: 795-803.
Isaac, P. V. and Venkataraman, T. V. 1941. A key for the identification of the pupae of know Lepidopterous borers of sugarcane in India based on morphological characters. Indian Journal of Agricultural Sciences 11: 804-815.
Kapur, A. P. l950. The identity of some Crambinae associated with sugarcane in India and certain species related to them (Lepidoptera : Pyralidae). Transactions of the Royal Entomological Society, London. 101:38-43.
Karim, M. A. and Islam, M. N. 1977. Stem borer of sugarcane in Bangladesh. In Proc. The 22nd Annual Scientific Conference, Bangladesh Association for Advancement of Science pp 29-30.
Khanna, K. L., Nigam, L. N. and Puri, V. D. 1957. Stem borer, Chilo tumidicostalis Hampson, a serious pest of sugarcane in Bihar. In: Proceedings of the Indian Academy of Science (B) 46: 75-95.
Kumar, S. and Kalra, A. N. 1987. Attack of stem borer, Chilo tumidicostalis Hampson as a cane borer in Rajasthan. Indian Sugarcane Journal 9: 154-156.
Sallam, M.N. 2006. A Review of sugarcane stem borers and their natural enemies in Asia and Indian Ocean Islands: an Australian perspective. Annales de la Société entomologique de France, 42 (3-4): 263-283
Sallam, M.N. and Allsopp, P.G. 2002. Preparing for borer incursion into Australia. Australian Sugarcane 5(6): 5-7.
Suasa-ard, W., Wiwat-suasa-ard and Allsopp, P.G. 2000. Chilo tumidicostalis Hamson (Lepidoptera: Pyralidae) and its natural enemies in Thailand. pp. 10-16. In: Proceedings of the 4th Sugarcane-Entomology- Workshop, International society of sugarcane Technologists, Sugarcane pest Management in the New Millennium., 7-10 February, 2000. Khon Kaeno, Thailand.
Ullah, M., Butt, B. U. and Shah, M. 2006. Assessment of cane and internode damage in millable cane by sugarcane pest complex. Sarhad Journal of Agriculture 22(2): 202-207.
Williams, J. R. 1983. The sugarcane stem borer, Chilo tumidicostalis Hamson in Mauritius. Revue Agricole et Sucrière de l'Île Maurice 62: 5-23.
Williams, J. R., Metcalfe, J. R., Mongomery, R. W. and Mathes, R. 1969. Pests of Sugarcane Elsevier, Amsterdam.
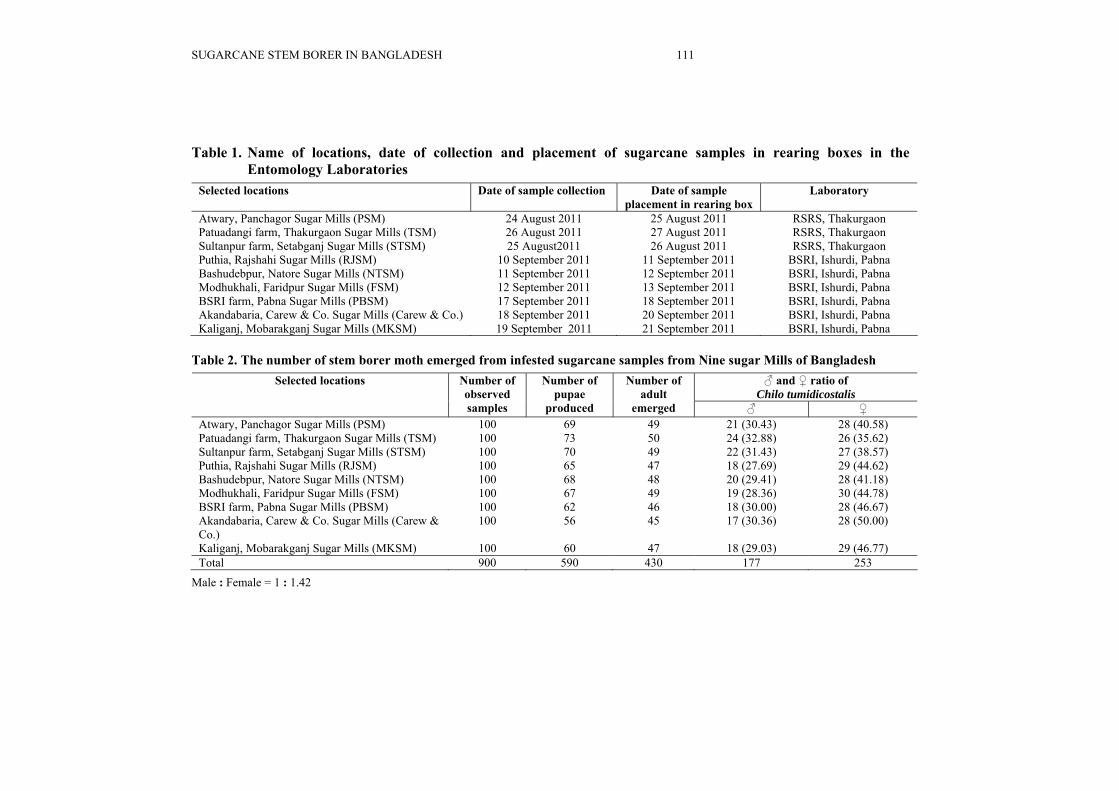
SUGARCANE STEM BORER IN BANGLADESH 111
Table 1. Name of locations, date of collection and placement of sugarcane samples in rearing boxes in the Entomology Laboratories
Selected locations Date of sample collection Date of sample placement in rearing box
Laboratory
Atwary, Panchagor Sugar Mills (PSM) 24 August 2011 25 August 2011 RSRS, Thakurgaon Patuadangi farm, Thakurgaon Sugar Mills (TSM) 26 August 2011 27 August 2011 RSRS, Thakurgaon Sultanpur farm, Setabganj Sugar Mills (STSM) 25 August2011 26 August 2011 RSRS, Thakurgaon Puthia, Rajshahi Sugar Mills (RJSM) 10 September 2011 11 September 2011 BSRI, Ishurdi, Pabna Bashudebpur, Natore Sugar Mills (NTSM) 11 September 2011 12 September 2011 BSRI, Ishurdi, Pabna Modhukhali, Faridpur Sugar Mills (FSM) 12 September 2011 13 September 2011 BSRI, Ishurdi, Pabna BSRI farm, Pabna Sugar Mills (PBSM) 17 September 2011 18 September 2011 BSRI, Ishurdi, Pabna Akandabaria, Carew & Co. Sugar Mills (Carew & Co.) 18 September 2011 20 September 2011 BSRI, Ishurdi, Pabna Kaliganj, Mobarakganj Sugar Mills (MKSM) 19 September 2011 21 September 2011 BSRI, Ishurdi, Pabna
Table 2. The number of stem borer moth emerged from infested sugarcane samples from Nine sugar Mills of Bangladesh ♂ and ♀ ratio of
Chilo tumidicostalis Selected locations Number of
observed samples
Number of pupae
produced
Number of adult
emerged ♂ ♀ Atwary, Panchagor Sugar Mills (PSM) 100 69 49 21 (30.43) 28 (40.58) Patuadangi farm, Thakurgaon Sugar Mills (TSM) 100 73 50 24 (32.88) 26 (35.62) Sultanpur farm, Setabganj Sugar Mills (STSM) 100 70 49 22 (31.43) 27 (38.57) Puthia, Rajshahi Sugar Mills (RJSM) 100 65 47 18 (27.69) 29 (44.62) Bashudebpur, Natore Sugar Mills (NTSM) 100 68 48 20 (29.41) 28 (41.18) Modhukhali, Faridpur Sugar Mills (FSM) 100 67 49 19 (28.36) 30 (44.78) BSRI farm, Pabna Sugar Mills (PBSM) 100 62 46 18 (30.00) 28 (46.67) Akandabaria, Carew & Co. Sugar Mills (Carew & Co.)
100 56 45 17 (30.36) 28 (50.00)
Kaliganj, Mobarakganj Sugar Mills (MKSM) 100 60 47 18 (29.03) 29 (46.77) Total 900 590 430 177 253
Male : Female = 1 : 1.42
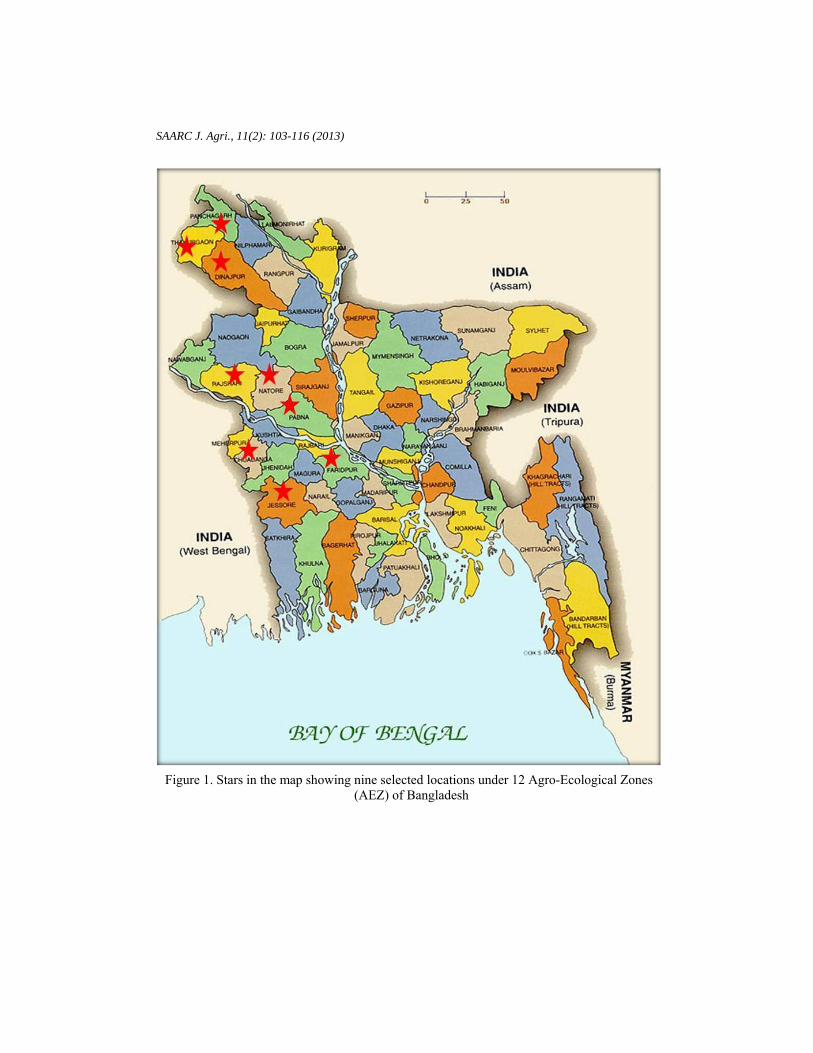
SAARC J. Agri., 11(2): 103-116 (2013)
Figure 1. Stars in the map showing nine selected locations under 12 Agro-Ecological Zones
(AEZ) of Bangladesh

SUGARCANE STEM BORER IN BANGLADESH 113
113
3629 31
2832
29 30 3023
0
5
10
15
20
25
30
35
40
L1 L2 L3 L4 L5 L6 L7 L8 L9
Surv
ey re
cord
of s
tem
bor
er
infe
stat
ion
(%)
Locations
4950
4947
4849
4645
47
40
42
44
46
48
50
52
L1 L2 L3 L4 L5 L6 L7 L8 L9
Num
ber o
f adu
lts e
mer
ge
Locations
L1 = PSM, L2= TSM, L3= STSM, L4= RJSM, L5= NTSM, L6= FSM, L7= PBSM,
L8= Carew & Co. and L9= MKSM, Standard bar indicates standard error.
Figure 2. Adult emergence from the pupae of Chilo tumidicostalis reared from the collected specimens of nine locations of Bangladesh during August-October, 2011
L1 = PSM, L2= TSM, L3= STSM, L4= RJSM, L5= NTSM, L6= FSM, L7= PBSM,
L8= Carew & Co. and L9= MKSM
Figure 3. Periods and rate of infestation by stem borer in nine locations of Bangladesh during May-June, 2011 (P<0.01).
L1 = PSM, L2= TSM, L3= STSM, L4= RJSM, L5= NTSM, L6= FSM, L7= PBSM, L8= Carew & Co. and L9= MKSM
Figure 4. Mean percent infestation by stem borer in nine locations of Bangladesh during the cropping season of 2010-2011 (P<0.01).
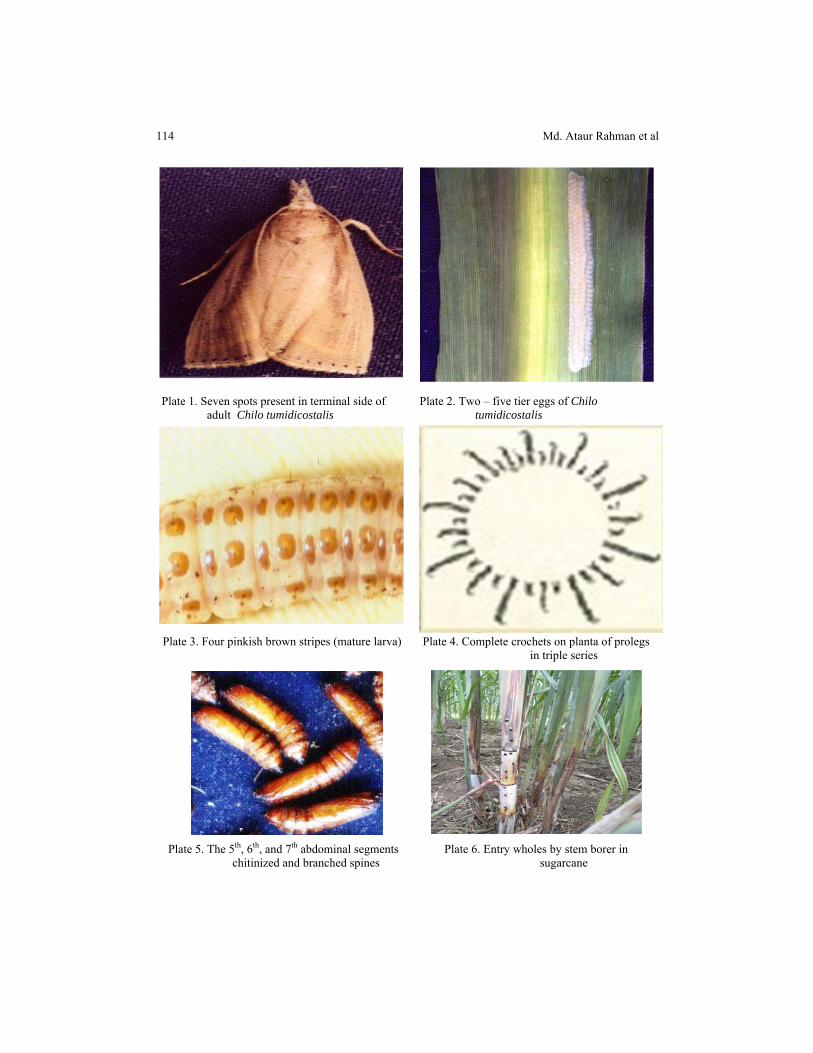
114 Md. Ataur Rahman et al
Plate 1. Seven spots present in terminal side of
adult Chilo tumidicostalis Plate 2. Two – five tier eggs of Chilo
tumidicostalis
Plate 3. Four pinkish brown stripes (mature larva) Plate 4. Complete crochets on planta of prolegs in triple series
Plate 5. The 5th, 6th, and 7th abdominal segments chitinized and branched spines
Plate 6. Entry wholes by stem borer in sugarcane
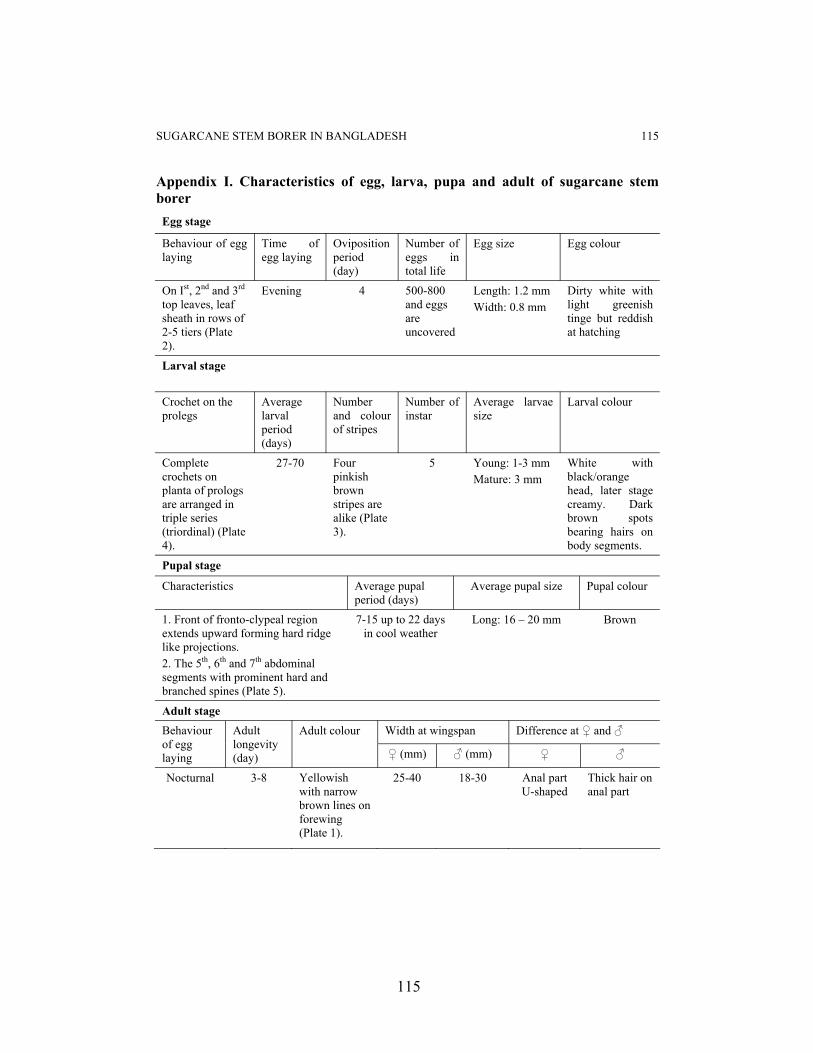
SUGARCANE STEM BORER IN BANGLADESH 115
115
Appendix I. Characteristics of egg, larva, pupa and adult of sugarcane stem borer Egg stage
Behaviour of egg laying
Time of egg laying
Oviposition period (day)
Number of eggs in total life
Egg size Egg colour
On Ist, 2nd and 3rd top leaves, leaf sheath in rows of 2-5 tiers (Plate 2).
Evening 4 500-800 and eggs are uncovered
Length: 1.2 mm Width: 0.8 mm
Dirty white with light greenish tinge but reddish at hatching
Larval stage
Crochet on the prolegs
Average larval period (days)
Number and colour of stripes
Number of instar
Average larvae size
Larval colour
Complete crochets on planta of prologs are arranged in triple series (triordinal) (Plate 4).
27-70 Four pinkish brown stripes are alike (Plate 3).
5 Young: 1-3 mm Mature: 3 mm
White with black/orange head, later stage creamy. Dark brown spots bearing hairs on body segments.
Pupal stage
Characteristics Average pupal period (days)
Average pupal size Pupal colour
1. Front of fronto-clypeal region extends upward forming hard ridge like projections. 2. The 5th, 6th and 7th abdominal segments with prominent hard and branched spines (Plate 5).
7-15 up to 22 days in cool weather
Long: 16 – 20 mm Brown
Adult stage Width at wingspan Difference at ♀ and ♂ Behaviour
of egg laying
Adult longevity (day)
Adult colour
♀ (mm) ♂ (mm) ♀ ♂
Nocturnal 3-8 Yellowish with narrow brown lines on forewing (Plate 1).
25-40 18-30 Anal part U-shaped
Thick hair on anal part

116 Md. Ataur Rahman et al
Appendix II. Standard Key for Identification of sugarcane borer pests
Particulars Stalk borer (Chilo auricilius)
Plassey borer (Chilo tumidicostalis)
Internode borer (Chilo sachariphagous indicus)
Number of stripes
Five: Almost alike Four: Almost alike Four: Almost alike
Colour of stripes
Violet Pinkish brown Violet
Colour of tubercles
Grey Grey Jet black
Crochet on the prolegs
Complete crochets with biordinal spines in the prolegs
Complete crochets with triordinal spines in the prologs
Complete crochets with triordinal spines in the prolegs
Egg Egg laid in egg mass of 2-5. Total of 47-146 eggs.
Egg lay in 4-5 tiers. Total of 500-800 eggs. Eggs are uncovered.
Egg laid cluster in 2-3 parallel rows. Total eggs of few to 414.
larvae Head black Black/ orange colour head Head black
Adult Forewing straw colour with golden spot. Hindwing straw colour with silvery fringe
Forewing dark brown scales. Terminal series of black spots present. Hindwing light brown scales. Seven spots present in terminal side.
Straw colour with slightly dark spot on forewing.
According to Butani (1956)
SAARC J. Agri., 11(2): 117-127 (2013)
COMBINING ABILITY AND GENE ACTION IN INDIGENOUS BITTER GOURD (Momordica charantia L.)
R.S. Verma, Narendra Pratap*1, D. K. Dubey, and S.S. Singh Department of Vegetable Science, N. D. University of Agriculture and Technology
Kumarganj, Faizabad-224229, Uttar Pradesh, India
ABSTRACT
The investigation was carried out to get information regarding magnitude of combining ability and nature of gene action for fruit yield and several other yield attributing traits following line × tester mating design involving 12 lines and 3 testers and their 36 hybrids tested in two environments viz., summer and rainy season 2010 at Research Farm of Department of Vegetable Science, N. D. University of Agriculture & Technology, Kumarganj, Faizabad, UP, India. From the estimate of gca effects, among the parental lines NDBT-13, NDBT-15 and NDBT-19 were identified as superior donor for both seasons and NDBT-10 for summer season and among the testers Kalyanpur Sona for summer season and Pusa Do Mausami for rainy season for fruit yield per plant and its yield contributing traits like number of fruits per plant and average fruit weight. Eight crosses displayed desirable significant sca effects in both seasons for fruit yield per plant. Among these eight crosses the best cross combinations based on desirable sca effects for fruit yield per plant were NDBT-19 × Pusa Do Mousami in summer season while NDBT-8 × Pusa Do Mousami, NDBT-15 × NDBT-12 and NDBT-10 × Pusa Do Mousami in rainy season. These crosses have more number of fruits per plant, average fruit weight, fruit diameter and other component traits in both seasons. Key words: Gene action, General combining ability (gca), Hybrids, Line × Tester mating design, Momordica charantia L., RBD, Specific combining ability (sca)
INTRODUCTION Bitter gourd (Momordica charantia L.) is one of the most nutritive and
commercially important vegetable grown throughout the country. The importance of bitter gourd has been recognized due to its high nutritive value and medicinal
* *Correspondence author email: [email protected], [email protected] 1AICRP (Chickpea), IIPR, Kalyanpur, Kanpur-208024, Uttar Pradesh, India Received: 28.04.2013

118 R.S. Verma et al
properties. Bitter gourd still remains an unexploited crop from genetic and breeding point of view. In bitter gourd, Indian variability is quite distinct than that of African/S.E. Asian region (Seshadri and Chatterjee, 1996). Wide range of variability in respect of vegetative and fruit character is available. Many varieties and F1 hybrids have been developed utilizing those variability. It is a monoecious and highly cross pollinated crop and has been known to offer good potentialities for increased yield. Considering these facts, it is essential and desirable to carry out a successful breeding programme utilizing the land races available in Indian subcontinent. Therefore, this study was conducted to generate information about general and specific combining ability effects for different economic characters.
MATERIALS AND METHODS The present investigation involving 36 F1’s (derived through line × tester
mating design) and their patents i.e., 12 lines (NDBT-1, NDBT-2, NDBT-3, NDBT-4, NDBT-5, NDBT-6, NDBT-7, NDBT-8, NDBT-10, NDBT-13, NDBT-15 and NDBT-19) and 3 testers (Kalyanpur Sona, NDBT-12 and Pusa Do Mausami) was under taken for estimating the gca (general combining ability) and sca (specific combining ability) for the 14 characters. Accordingly the experiment was set up in a complete randomized block design (RBD) with three replications in two seasons, namely summer (S) season and rainy (R) season 2010 at the Research Farm of Department of Vegetable Science, ND University of Agriculture & Technology, Kumarganj, Faizabad, UP, India. Sowing was done with a 3.0 m for row to row and, 0.5 m plant to plant spacing was maintained. All the recommended agronomic package and practices, plant protection measures were followed to raise a good and healthy crop. Among the 14 characters the observations were recorded on plot basis for node number to anthesis of first staminate flower, node number to anthesis of first pistillate flower, days to anthesis of first staminate flower, days to anthesis of first pistillate flower and days to first fruit harvest, where as for fruit length (cm), fruit diameter (cm), average fruit weight (g), number of fruits per plant, fruit yield per plant (kg), number of primary branches per plant, number of nodes per plant, inter-nodal length (cm) and vine length (m) data were recorded on 10 randomly selected plants. The estimation of combining ability and gene action were carried out as per the procedure of Kempthorne (1957).
RESULT AND DISCUSSION The estimates of sca variances were found to be greater than corresponding gca
variances for all the characters in both summer and rainy seasons indicating preponderance of non-additive gene action (Table 1). The ratio of gca to sca variances (average degree of dominance) was observed to be more than unity for all the characters (revealing over dominance) except for node number to anthesis of first pistillate flower in summer and for fruit yield per plant in rainy season (nearly equal to unity, suggests existence of complete dominance) indicating that predominance of

GENE ACTION IN INDIGENOUS BITTER GOURD 119
non-additive gene effects representing non-fixable dominance and epistatic components of genetic variance. This indicated that maintenance of heterozygocity would be highly fruitful for improving the characters. These results are in accordance with Singh et al. (2006) who reported non additive type of gene action for yield and yield related traits in their material. However Mishra et al. (1994) found that both additive and non additive gene actions were involved in the expression of yield and yield related characters. Similar gene actions were also observed by Devadas and Ramadas, 1997, Ram et al., 1999 and Jadhav et al., 2010. The differences in the results might have been due to the differences in the genetic material studied. General combining ability
As per table 2, the general combining ability of parents indicated that four lines i.e. NDBT-10, NDBT-13, NDBT-15 and NDBT-19 had significant and positive gca effects for fruit yield per plant during both seasons and among the testers, Kalyanpur Sona and PDM had significant and positive gca effects during summer and rainy seasons, respectively for this trait. Furthermore, these four lines were found to be good general combiners for number of fruits per plant during both seasons except NDBT-15, which showed negative effect in summer. Among the 12 lines, two lines NDBT-13 and NDBT-19 were found to have significantly positive gca effect for majority of the characters in both seasons like days to anthesis of first pistillate flower, days to first fruit harvest, number of fruits per plant, fruit yield per plant number of nodes per plant, inter-nodal length and vine length. The line NDBT-13 was also good combiner for node number of first staminate flower (significantly negative), fruit length, fruit diameter and average fruit weight (significantly positive) during both seasons. The line NDBT-15 was also found to be a good combiner for days to anthesis of first staminate flower, average fruit weight and inter-nodal length during both the seasons and also found to be a good combiner for days to anthesis of first pistillate flower, number of fruits per plant during rainy season along with node number to anthesis of first pistillate flower in summar season. The line NDBT-2 was found good combiner for earliness and other desirable traits like; node number to anthesis of first staminate flower, node number to anthesis of pistillate flower, days to anthesis of first staminate flower, days to anthesis of first pistillate flower, days to first fruit harvest. Among the testers, Kalyanpur Sona was found to be a good combiner for node number to anthesis of first staminate flower, node number to anthesis of first pistillate flower in both seasons and for days to anthesis of first pistillate flower, days to fruit harvest indicating earliness, and also more number of fruit and fruit yield per plant in summer season. Pusa Do Mousami (PDM) was also found to be a good combiner for fruit length, fruit diameter and vine length in both the seasons and for fruit yield per plant and number of fruits per plant in rainy season. The parents mentioned above may be used in a future breeding programme for bringing improvement in bitter gourd. Similar results were observed in bitter gourd by Ram et al., 1999; Kumar et al., 2005; Sundharaiya and Venkatesan, 2006 and Sundaram, 2008.

120 R.S. Verma et al
Specific combining ability effects Estimation of specific combining ability effects are given in table 3. Among
thirty-six crosses, eight in summer and eight in rainy season exhibited significant positive sca effect for increased fruit yield and among these four are common in both seasons. It was also observed that the majority of the crosses which showed significant sca effects for increased yield also involved at least one parent having high and significant gca estimates. The high significant positive sca effects in respect of fruit yield per plant were observed in a cross NDBT-3 × Pusa Do Mousami followed by NDBT-1 × Kalyanpur Sona, NDBT-4 × NDBT-12, NDBT-19 × Pusa Do Mousami and NDBT-7 × Kalyanpur Sona in summer season, and NDBT-15 × NDBT-12 followed by NDBT-10 × Pusa Do Mousami, NDBT-1 × Kalyanpur Sona, NDBT-8 × Pusa Do Mousami, NDBT-7 × Kalyanpur Sona in rainy season where as NDBT-1 × Kalyanpur Sona and NDBT-7 × Kalyanpur Sona NDBT-4 × NDBT-12 and NDBT-8 × PDM were found desirable in both seasons. These crosses also showed consistently favourable sca effects for other yield component characters. However, the best crosses varied with the characters. Based on sca effects NDBT-19 × Pusa Do Mousami in summer season, NDBT-8 × Pusa Do Mousami, NDBT-15 × NDBT-12 and NDBT-10 × Pusa Do Mousami in rainy season were found to be the best specific combiners for fruit yield per plant. The cross NDBT-19 × Pusa Do Mousami exhibited significantly the highest sca effects for other characters like average fruit weight and number of fruits per plant in summer season. The cross NDBT-3 × Pusa Do Mousami was also found to be having the highest significant sca effects for fruit diameter and number of fruits per plant in both seasons. The cross NDBT-1 × Kalyanpur Sona was also found along with the significant sca effect for number of primary branches per plant and number of nodes per plant in summer season. The cross NDBT-4 × NDBT-12 was also found to be having significant negative sca effects for node number to anthesis of first pistillate flower and vine length in both seasons where as it was positively significant for days to first fruit harvest and fruit length in summer season. The cross NDBT-7 × Kalyanpur Sona was also found to have significant and negative sca effects for days to anthesis of first pistillate flower, days to anthesis of first staminate flower, days to first fruit harvest indicating earliness for these characters, whereas number of fruits per plant, number of nodes per plant and vine length had significant positive sca effect in both seasons. The cross NDBT-6 × Pusa Do Mousami had negative sca effects significant for days to anthesis of first pistillate flower and days to first fruit harvest in rainy season. The highest sca effect for days to first harvest was observed in cross combination NDBT-13 × Kalyanpur Sona in rainy season. For fruit diameter, the highest positive and significant sca effects were observed in the cross combination NDBT-5 × Kalyan Sona followed by NDBT-3 × Pusa Do Mousami, NDBT-7 × NDBT-12, NDBT-13 × Kalyan Sona, NDBT-8 × PDM and NDBT-2 × NDBT-12 in both seasons. For fruit length the highest significant sca effect was observed in a cross combination of NDBT-5 × Kalyanpur Sona followed by NDBT-7 × NDBT-12 in summer, while as

GENE ACTION IN INDIGENOUS BITTER GOURD 121
NDBT-3 × Pusa Do Mousami followed by NDBT-4 × Kalyanpur Sona in rainy season were the desirable crosses. Similar results were observed in bitter gourd by Ram et al., 1999, Sundharaiya and Venkatesan, 2006, Sundaram, 2008.
From these studies, it was indicated that sca effects of certain crosses were related with gca of their parents as the best cross combination for most of the characters involved at least one parent with high or average gca effects for particular traits in both or any one season (summer or rainy). Hence, these parents may be utilized for development of new hybrids. The crosses NDBT-1 × Kalyanpur Sona and NDBT-7 × Kalyanpur Sona exhibited high sca effects for fruit yield per plant, days to anthesis of first staminate flower, days to anthesis of first pistillate flower, days to first fruit harvest, average fruit weight, number of fruits per plant, number of primary branches per plant, number of nodes per plant and vine length and these crosses can be exploited for development of desirable hybrids for either both (summer and rainy) or summer/rainy season.
REFERENCES Devadas, V.S. and Ramadas, S.1997. Gene actions of seed yield and quality traits
in bitter gourd. The Horticulture Journal, 10 (2): 51-56 Jadhav, K.A., Garad, B.V., Kshirsagar, D.B., Dhumal, S.S. and Pati,l B.T. 2010.
Combining ability studies in bitter gourd (Momordica charantia L.). Journal of Maharashtra Agriculture University, 35 (2): 203-206
Kempthorne, O. 1957. An Introduction to Genetical Statistics. John Wiley and Sons, Inc., New York, U.S.A
Kumar, Aravinda, Prabhakar, J.S., Pitchaimuthu, M. and Gowda, N.C.N .2005. Heterosis and combining ability studies in bitter gourd for earliness and growth parameters. Karnataka Journal of Horticulture, 1 (4): 12-19
Mishra, H.N., Mishra, R.S., Mishra, S.N. and Parhi, G. 1994. Heterosis and combining ability in bitter gourd. Indian Journal of Agricultural Sciences, 64 (5): 310-313
Ram, D., Kalloo, G. and Singh, Major.1999. Combining ability of quantitative characters in bitter gourd (Momordica charantia). Indian Journal of Agricultural Sciences, 69 (2): 122-125
Seshadri, V.S. and Chatterajtee, S.S. 1996. The history and adaptation of some introduced vegetable crops in India. Vegetable Science, 23: 114-140
Singh, B., Singh, S.K., Ram, D., Pandey, S. and Rai, M. 2006. Combining ability analysis in bitter gourd (Momordica charantia L.). The Horticulture Journal, 19 (2): 112-115
Sundaram, V. 2008. Studies on combining ability in bitter gourd. Crop Research, 35 (1/2): 46-51
Sundhrarya, K. and Arumugam, Shakila .2006. Gene action studies in bitter gourd (Momordica charantia L.). Advances in Plant Science, 19 (1): 249-252
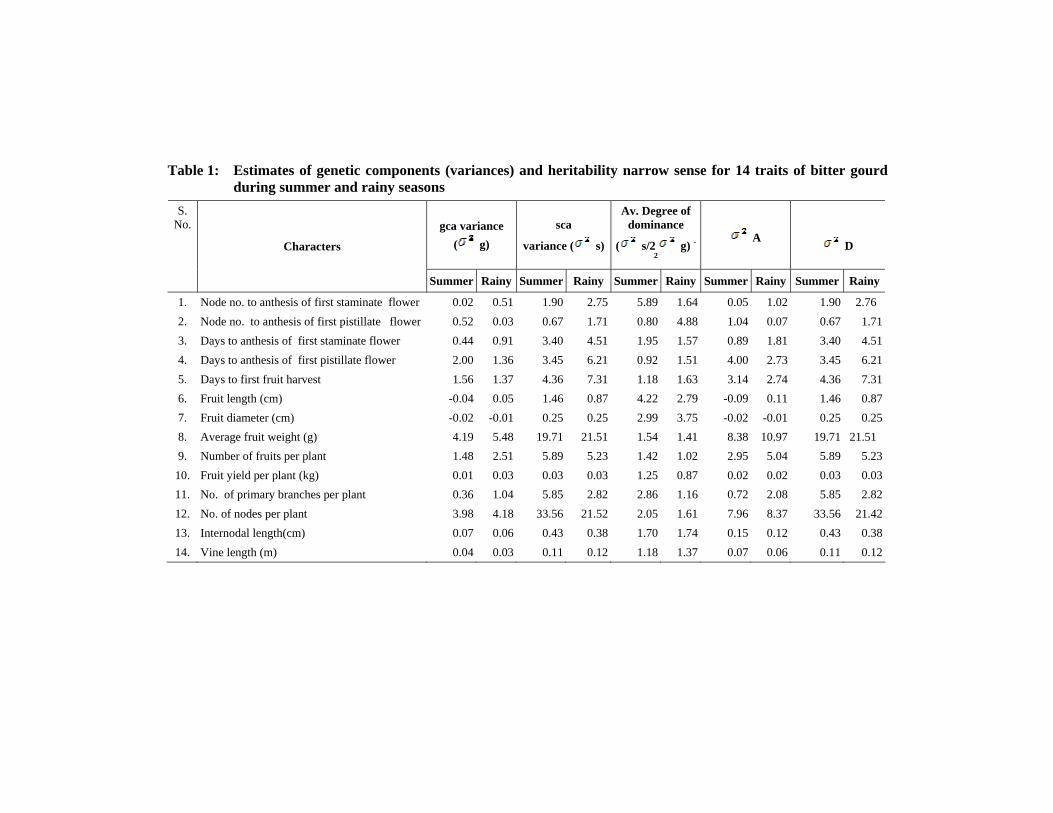
Table 1: Estimates of genetic components (variances) and heritability narrow sense for 14 traits of bitter gourd during summer and rainy seasons
gca variance ( g)
sca
variance ( s)
Av. Degree of dominance
( s/2 g) -2
A
D
S. No.
Characters
Summer Rainy Summer Rainy Summer Rainy Summer Rainy Summer Rainy
1. Node no. to anthesis of first staminate flower 0.02 0.51 1.90 2.75 5.89 1.64 0.05 1.02 1.90 2.76 2. Node no. to anthesis of first pistillate flower 0.52 0.03 0.67 1.71 0.80 4.88 1.04 0.07 0.67 1.713. Days to anthesis of first staminate flower 0.44 0.91 3.40 4.51 1.95 1.57 0.89 1.81 3.40 4.514. Days to anthesis of first pistillate flower 2.00 1.36 3.45 6.21 0.92 1.51 4.00 2.73 3.45 6.215. Days to first fruit harvest 1.56 1.37 4.36 7.31 1.18 1.63 3.14 2.74 4.36 7.316. Fruit length (cm) -0.04 0.05 1.46 0.87 4.22 2.79 -0.09 0.11 1.46 0.877. Fruit diameter (cm) -0.02 -0.01 0.25 0.25 2.99 3.75 -0.02 -0.01 0.25 0.258. Average fruit weight (g) 4.19 5.48 19.71 21.51 1.54 1.41 8.38 10.97 19.71 21.51 9. Number of fruits per plant 1.48 2.51 5.89 5.23 1.42 1.02 2.95 5.04 5.89 5.23
10. Fruit yield per plant (kg) 0.01 0.03 0.03 0.03 1.25 0.87 0.02 0.02 0.03 0.0311. No. of primary branches per plant 0.36 1.04 5.85 2.82 2.86 1.16 0.72 2.08 5.85 2.8212. No. of nodes per plant 3.98 4.18 33.56 21.52 2.05 1.61 7.96 8.37 33.56 21.4213. Internodal length(cm) 0.07 0.06 0.43 0.38 1.70 1.74 0.15 0.12 0.43 0.3814. Vine length (m) 0.04 0.03 0.11 0.12 1.18 1.37 0.07 0.06 0.11 0.12

Table 2: Estimate of gca effects of parents for 14 characters during summer and rainy seasons in bitter gourd
Characters Node no. to anthesis
of first staminate flower
Node no. to anthesisof first pistillate
flower
Days to anthesis of first staminate
flower
Days to anthesis of first pistillate flower
Days to first fruit harvest Fruit length Fruit diameter
Lines Summer Rainy Summer Rainy Summer Rainy Summer Rainy Summer Rainy Summer Rainy Summer Rainy
NDBT-1 -0.56 -1.92** -2.16** -1.21** -0.20 -2.81** 0.83 -3.53** 0.14 -3.68** -0.04 -0.69** 0.23** -0.06
NDBT-2 -1.00 ** -1.81** -3.49** -1.88** -1.20** -2.48** -4.06** -4.53** -4.64** -5.01** -0.78** 0.25 -0.39** -0.34**
NDBT-3 -1.11 ** -0.69 -0.49 -0.10 -1.54** -1.26** -0.61 -2.08** 0.03 -2.68** 0.41* 0.39 0.38** 0.30**
NDBT-4 0.11 0.86* 0.84* 1.12** -0.43 -0.48 -1.28* -3.08** -1.86** -2.68** 0.42* -0.59* 0.16** 0.10
NDBT-5 -0.11 0.08 0.06 -0.99* -1.76** -1.93** -1.28* -0.86 -1.34* 0.21 0.16 -0.59* -0.09 -0.03
NDBT-6 1.00** 1.75** 0.40 -0.10 0.02 -0.93** -1.63** -0.08 -0.86 0.32 -0.27 -0.54* -0.25** 0.08
NDBT-7 0.08 0.86* -0.16 -0.10 -1.31** -1.26** -0.17 0.81 -0.64 1.10 -0.61** 0.12 0.04 -0.13
NDBT-8 0.67 2.31** -0.16 1.12* -0.87* 2.74** -0.50 -0.97* -0.42 -0.45 -0.41* -0.05 -0.56** -0.41**
NDBT-10 1.00** 0.75 0.95** 1.90** 3.69** 2.41** 2.17** 4.58** 2.81** 4.55** -0.12 0.70** 0.01 -0.05
NDBT-13 -0.78* -1.81** 0.51 0.12 -0.76 -1.48** 1.83** 2.69** 2.36** 2.77** 0.86** 1.25** 0.57** 0.63**
NDBT-15 -0.11 -1.25** 1.40** -0.99* 1.69** 2.30** 1.06 3.03** 1.03 2.21 0.31 -0.69** -0.05 0.06
NDBT-19 0.89* 0.86* 2.40** 1.12* 2.69** 5.19** 3.61** 4.03** 3.36** 3.32** 0.07 0.44 -0.03 -0.18*
E(gi) Lines 0.35 0.40 0.42 0.45 0.42 0.43 0.61 0.48 0.65 0.56 0.20 0.24 0.05 0.08
SE(gi-gj) Lines 0.50 0.57 0.59 0.63 0.60 0.61 0.86 0.68 0.93 0.79 0.28 0.34 0.08 0.12
Testers
K. Sona -0.47 ** -0.58** -0.57** -0.21 -0.34 -0.59** -1.42** 0.75** -1.22** 0.96** -0.42** -0.44** -0.02 -0.08*
NDBT-12 0.56** 0.92** 0.29 0.37 -0.43* -0.06 -0.14 -0.69** -0.14 -0.87** 0.05 0.18 -0.02 -0.07
PDM -0.08 -0.33 0.29 -0.16 0.77** 0.66** 1.56** -0.06 1.36** -0.09 0.37* 0.26* 0.04 0.15**
SE(gi) Testers 0.17 0.20 0.21 0.22 0.21 0.21 0.30 0.24 0.32 0.28 0.10 0.12 0.02 0.04
SE(gi-gj) Testers 0.25 0.28 0.29 0.31 0.30 0.30 0.43 0.34 0.46 0.39 0.14 0.17 0.04 0.06
NDBT-1 -10.07** -12.21** -1.98** -2.98** -0.30** -0.39** 1.67** 0.77* -1.39 -1.94* -1.03** -0.89** -0.53** -0.62**
NDBT-2 2.59** 2.79** -1.53** -0.93* -0.09** -0.04 -0.68* 2.33** 5.28** 3.72** -1.18** -0.83** -0.40** -0.23**

Characters Node no. to anthesis
of first staminate flower
Node no. to anthesisof first pistillate
flower
Days to anthesis of first staminate
flower
Days to anthesis of first pistillate flower
Days to first fruit harvest Fruit length Fruit diameter
Lines Summer Rainy Summer Rainy Summer Rainy Summer Rainy Summer Rainy Summer Rainy Summer Rainy
NDBT-3 2.70** 3.79** -4.05** -2.17** -0.32** -0.14** -3.67** -3.20** 2.50** 2.83** -0.57** -0.49** -0.19** -0.03**
NDBT-4 -2.52** -3.99** 0.22 0.32 -0.01 -0.04 1.34** 0.88* 2.94** 0.39 -0.53** -0.50** -0.20** -0.18**
NDBT-5 0.70 -0.88 -0.87* -2.30** -0.03 -0.16** 1.50** 1.88** 2.06* 1.28 -0.46** -0.66** -0.21** -0.26**
NDBT-6 -3.74** -3.66** 1.50** -2.25** 0.02 -0.24** 0.13 0.22 -2.28* -2.39** -0.56** -0.64** -0.42** -0.52**
NDBT-7 -2.07** -1.88 -0.16 -0.88* -0.05* -0.11** 0.28 -2.10** -6.83** -5.72** 0.38** 0.36** -0.03 -0.13**
NDBT-8 -3.96** -3.44** 0.23 1.16** -0.04 0.02 0.04 -1.54** -9.17** -9.06** 0.59** 0.68** -0.04 -0.05
NDBT-10 0.70 1.68 2.03** 0.86* 0.19** 0.08** -1.25** -1.29** 3.72** 3.06** 1.20** 1.11** 0.65** 0.63**
NDBT-13 10.93** 12.79** 1.69** 1.97** 0.36** 0.38** 0.21 -0.49 8.17** 9.94** 0.59** 0.28** 0.74** 0.67**
NDBT-15 9.26** 8.90** -1.06** 1.77** 0.07** 0.30** -0.38 -0.22 -11.72** -8.61** 0.49** 0.47** -0.28** -0.23**
NDBT-19 -4.52** -3.88** 3.97** 5.49** 0.22** 0.34** 0.82* 2.82** 6.72** 6.50** 1.08** 1.12** 0.90** 0.94**
SE(gi)Lines 0.85 0.93 0.39 0.43 0.02 0.03 0.34 0.38 0.89 0.87 0.07 0.05 0.04 0.03
SE(gi-gj) Lines 1.21 1.32 0.55 0.61 0.03 0.04 0.48 0.54 1.27 1.23 0.10 0.07 0.06 0.05
Testers
K.Sona -0.07 -0.05 1.52** -1.25** 0.11** -0.11** -1.10** 0.08 -0.69 -0.56 -0.02 -0.05* -0.03 -0.05**
NDBT-12 0.48 -0.16 -0.59** -0.59** -0.03** -0.04** 0.75** 0.96** -0.31 -0.42 -0.01 0.01 -0.07** -0.01
PD M -0.41 0.20 -0.94** 1.84** -0.08** 0.16** 0.35* -1.04** 1.00* 0.97* 0.03 0.04 0.08** 0.06**
SE(gi) Testers
0.42 0.46 0.19 0.21 0.01 0.01 0.17 0.19 0.44 0.43 0.03 0.02 0.02 0.01
SE(gi-gj) Testers 0.60 0.66 0.27 0.30 0.01 0.02 0.24 0.27 0.63 0.61 0.05 0.03 0.03 0.02
*- Significant at 5 per cent probability level; ** - Significant at 1 per cent probability level
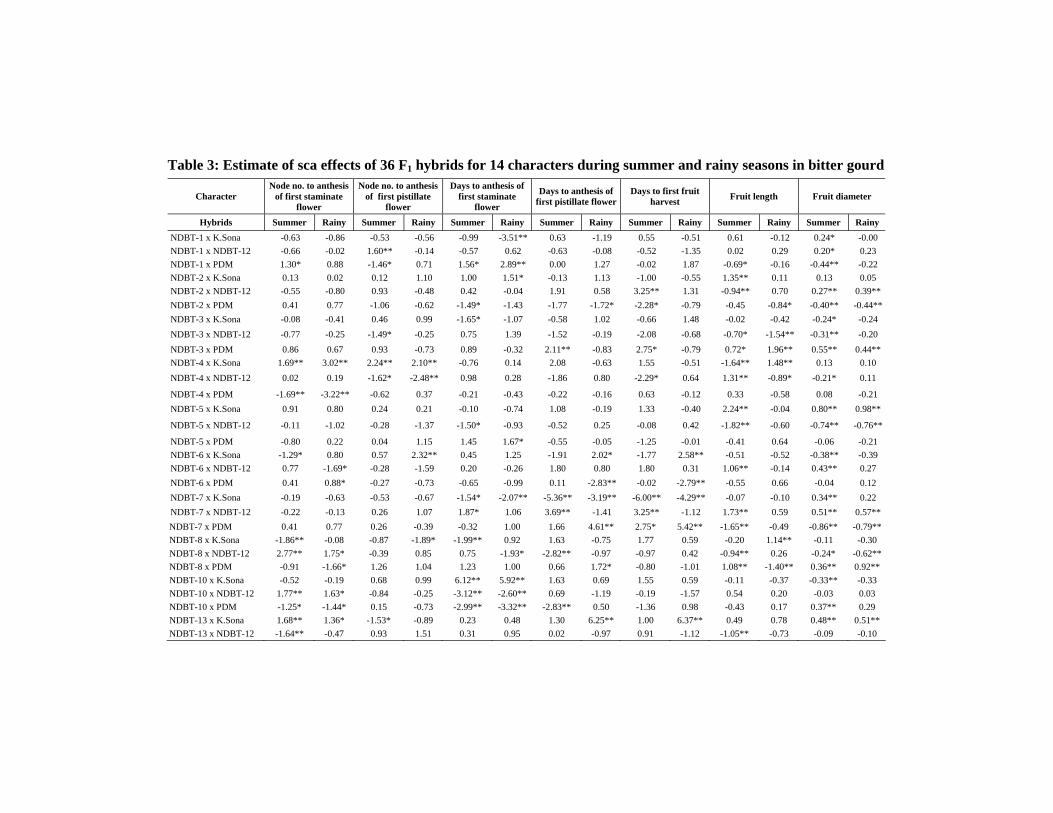
Table 3: Estimate of sca effects of 36 F1 hybrids for 14 characters during summer and rainy seasons in bitter gourd
Character Node no. to anthesis
of first staminate flower
Node no. to anthesis of first pistillate
flower
Days to anthesis of first staminate
flower
Days to anthesis of first pistillate flower
Days to first fruit harvest Fruit length Fruit diameter
Hybrids Summer Rainy Summer Rainy Summer Rainy Summer Rainy Summer Rainy Summer Rainy Summer Rainy NDBT-1 x K.Sona -0.63 -0.86 -0.53 -0.56 -0.99 -3.51** 0.63 -1.19 0.55 -0.51 0.61 -0.12 0.24* -0.00 NDBT-1 x NDBT-12 -0.66 -0.02 1.60** -0.14 -0.57 0.62 -0.63 -0.08 -0.52 -1.35 0.02 0.29 0.20* 0.23 NDBT-1 x PDM 1.30* 0.88 -1.46* 0.71 1.56* 2.89** 0.00 1.27 -0.02 1.87 -0.69* -0.16 -0.44** -0.22 NDBT-2 x K.Sona 0.13 0.02 0.12 1.10 1.00 1.51* -0.13 1.13 -1.00 -0.55 1.35** 0.11 0.13 0.05 NDBT-2 x NDBT-12 -0.55 -0.80 0.93 -0.48 0.42 -0.04 1.91 0.58 3.25** 1.31 -0.94** 0.70 0.27** 0.39** NDBT-2 x PDM 0.41 0.77 -1.06 -0.62 -1.49* -1.43 -1.77 -1.72* -2.28* -0.79 -0.45 -0.84* -0.40** -0.44**NDBT-3 x K.Sona -0.08 -0.41 0.46 0.99 -1.65* -1.07 -0.58 1.02 -0.66 1.48 -0.02 -0.42 -0.24* -0.24 NDBT-3 x NDBT-12 -0.77 -0.25 -1.49* -0.25 0.75 1.39 -1.52 -0.19 -2.08 -0.68 -0.70* -1.54** -0.31** -0.20 NDBT-3 x PDM 0.86 0.67 0.93 -0.73 0.89 -0.32 2.11** -0.83 2.75* -0.79 0.72* 1.96** 0.55** 0.44** NDBT-4 x K.Sona 1.69** 3.02** 2.24** 2.10** -0.76 0.14 2.08 -0.63 1.55 -0.51 -1.64** 1.48** 0.13 0.10 NDBT-4 x NDBT-12 0.02 0.19 -1.62* -2.48** 0.98 0.28 -1.86 0.80 -2.29* 0.64 1.31** -0.89* -0.21* 0.11
NDBT-4 x PDM -1.69** -3.22** -0.62 0.37 -0.21 -0.43 -0.22 -0.16 0.63 -0.12 0.33 -0.58 0.08 -0.21 NDBT-5 x K.Sona 0.91 0.80 0.24 0.21 -0.10 -0.74 1.08 -0.19 1.33 -0.40 2.24** -0.04 0.80** 0.98**
NDBT-5 x NDBT-12 -0.11 -1.02 -0.28 -1.37 -1.50* -0.93 -0.52 0.25 -0.08 0.42 -1.82** -0.60 -0.74** -0.76**
NDBT-5 x PDM -0.80 0.22 0.04 1.15 1.45 1.67* -0.55 -0.05 -1.25 -0.01 -0.41 0.64 -0.06 -0.21 NDBT-6 x K.Sona -1.29* 0.80 0.57 2.32** 0.45 1.25 -1.91 2.02* -1.77 2.58** -0.51 -0.52 -0.38** -0.39 NDBT-6 x NDBT-12 0.77 -1.69* -0.28 -1.59 0.20 -0.26 1.80 0.80 1.80 0.31 1.06** -0.14 0.43** 0.27 NDBT-6 x PDM 0.41 0.88* -0.27 -0.73 -0.65 -0.99 0.11 -2.83** -0.02 -2.79** -0.55 0.66 -0.04 0.12 NDBT-7 x K.Sona -0.19 -0.63 -0.53 -0.67 -1.54* -2.07** -5.36** -3.19** -6.00** -4.29** -0.07 -0.10 0.34** 0.22 NDBT-7 x NDBT-12 -0.22 -0.13 0.26 1.07 1.87* 1.06 3.69** -1.41 3.25** -1.12 1.73** 0.59 0.51** 0.57** NDBT-7 x PDM 0.41 0.77 0.26 -0.39 -0.32 1.00 1.66 4.61** 2.75* 5.42** -1.65** -0.49 -0.86** -0.79**NDBT-8 x K.Sona -1.86** -0.08 -0.87 -1.89* -1.99** 0.92 1.63 -0.75 1.77 0.59 -0.20 1.14** -0.11 -0.30 NDBT-8 x NDBT-12 2.77** 1.75* -0.39 0.85 0.75 -1.93* -2.82** -0.97 -0.97 0.42 -0.94** 0.26 -0.24* -0.62**NDBT-8 x PDM -0.91 -1.66* 1.26 1.04 1.23 1.00 0.66 1.72* -0.80 -1.01 1.08** -1.40** 0.36** 0.92** NDBT-10 x K.Sona -0.52 -0.19 0.68 0.99 6.12** 5.92** 1.63 0.69 1.55 0.59 -0.11 -0.37 -0.33** -0.33 NDBT-10 x NDBT-12 1.77** 1.63* -0.84 -0.25 -3.12** -2.60** 0.69 -1.19 -0.19 -1.57 0.54 0.20 -0.03 0.03 NDBT-10 x PDM -1.25* -1.44* 0.15 -0.73 -2.99** -3.32** -2.83** 0.50 -1.36 0.98 -0.43 0.17 0.37** 0.29 NDBT-13 x K.Sona 1.68** 1.36* -1.53* -0.89 0.23 0.48 1.30 6.25** 1.00 6.37** 0.49 0.78 0.48** 0.51** NDBT-13 x NDBT-12 -1.64** -0.47 0.93 1.51 0.31 0.95 0.02 -0.97 0.91 -1.12 -1.05** -0.73 -0.09 -0.10

Character Node no. to anthesis
of first staminate flower
Node no. to anthesis of first pistillate
flower
Days to anthesis of first staminate
flower
Days to anthesis of first pistillate flower
Days to first fruit harvest Fruit length Fruit diameter
Hybrids Summer Rainy Summer Rainy Summer Rainy Summer Rainy Summer Rainy Summer Rainy Summer Rainy
NDBT-13 x PDM -0.13 -0.88 0.60 -0.62 -0.54 -1.43 -1.33 -5.27** -1.91 -5.24** 0.55 -0.05 -0.38** -0.40**
NDBT-15 x K.Sona 0.25 -0.86 -0.42 -1.78* -0.21 -1.96* -0.25 -3.08** 0.33 -4.40** -0.62 -0.38 -0.54** -0.12
NDBT-15 x NDBT-12 0.88 1.63* 0.37 1.62* -0.12 1.50* -1.19 1.36 -1.75 2.75** 0.69* 1.18** -0.07 -0.15
NDBT-15 x PDM -1.13 -0.77 0.04 0.15 0.34 0.45 1.44 1.72* 1.41 1.64 -0.03 -0.70 0.61** 0.28
NDBT-19 x K.Sona -0.08 -2.97** -0.42 -1.89* -0.54 -0.85 -0.13 -2.08* 1.33 -0.85 -1.49** -1.52** -0.52** -0.48**
NDBT-19 x NDBT-12 -2.44** -0.80 0.71 1.51 -0.12 -0.04 -0.08 1.02 -1.41 -0.01 0.01 0.77 0.31** 0.23 NDBT-19 x PDM 2.52** 3.77** -0.28 0.37 0.67 0.89 0.22 1.05 0.08 0.87 1.48** 0.76 0.20* 0.25 SE(Sij-Skl) 0.86 0.99 1.03 1.10 1.05 1.06 1.49 1.19 1.61 1.37 0.49 0.59 0.14 0.21 SE(Sij-Sik) 1.80 2.06 2.16 2.29 2.18 2.22 3.12 2.48 3.36 2.86 1.02 1.24 0.30 0.43
NDBT-1 x K.Sona 3.95** 3.60* 3.48** 3.63** 0.27** 0.22** 2.89** -2.40** 6.13** 0.11 -0.15 0.05 0.17* 0.18** NDBT-1 x NDBT-12 -2.37 -1.62 -2.10** -1.95* -0.15** -0.16** -4.42** -0.69 0.75 1.97 0.04 0.00 0.11 0.06 NDBT-1 x PDM -1.48 -1.98 -1.38* -1.68* -0.11** -0.06 1.56** 3.10** -6.88** -2.08 0.10 -0.06 -0.27** -0.24**NDBT-2 x K.Sona -0.81 -0.73 -1.39* -0.94 -0.13** -0.07 -1.46 0.39 -0.52 -4.88** -0.07 -0.00 -0.00 -0.31**NDBT-2 x NDBT-12 -2.03 -2.28 1.42* -0.19 0.08* -0.06 2.51** -1.89** -1.25 -1.36 -0.01 0.05 -0.17* 0.06 NDBT-2 x PDM 2.98* 3.01 -0.02 1.13 0.05 0.16** -1.04 1.50* 1.77 6.25** 0.08 -0.05 0.18* 0.25** NDBT-3 x K.Sona 2.07 1.60 -2.03** -3.20** -0.15** -0.21** -3.20** -0.47 -6.41** -3.00 -0.11 -0.18 -0.27** -0.18**NDBT-3 x NDBT-12 -0.14 0.37 -3.26** 1.36 -0.25** 0.07 0.67 -0.16 3.52* 2.86 -0.05 -0.09 0.08 0.10
NDBT-3 x PDM -1.92 -1.98 5.28** 1.83* 0.41** 0.13 2.53** 0.63 2.88 0.13 0.17 0.27** 0.18* 0.08
NDBT-4 x K.Sona 2.96* 3.37* -0.97 -1.72 -0.00 -0.07 -0.68 1.55* -3.52* -3.22 -0.08 -0.19* -0.18* -0.15
NDBT-4 x NDBT-12 1.07 1.49 2.56** 1.17 0.17** 0.16** 0.05 -1.34* 3.75* 4.63** 0.17 0.18* 0.33** 0.29**
NDBT-4 x PDM -4.03** -4.87** -1.58* 0.55 -0.16** -0.09 0.62 -0.23 -0.22 -1.41 -0.09 -0.01 -0.14 -0.14*
NDBT-5 x K.Sona 3.40** 4.30** -0.65 -0.50 -0.01 0.10 -2.44** 0.65 0.02 -0.11 -0.02 0.15 -0.02 0.03
NDBT-5 x NDBT-12 -0.14 0.04 -0.17 1.66* 0.05 0.16** 0.49 0.17 -0.02 -1.58 -0.16 -0.19* -0.07 -0.11
NDBT-5 x PDM -3.25* -4.31** 0.83 -1.16 -0.03 -0.20** 1.95** -0.83 0.00 1.69 0.19 0.03 0.09 0.08
NDBT-6 x K.Sona -5.45** -3.28* 0.94 0.80 -0.03 0.03 -2.54** 1.58* 2.36 2.88 0.00 0.04 0.11 0.15*
NDBT-6 x NDBT-12 8.29** 5.49** -2.24** -1.78* 0.00 -0.06 1.73** 0.37 3.97* 4.41** 0.06 -0.06 0.15 0.12*
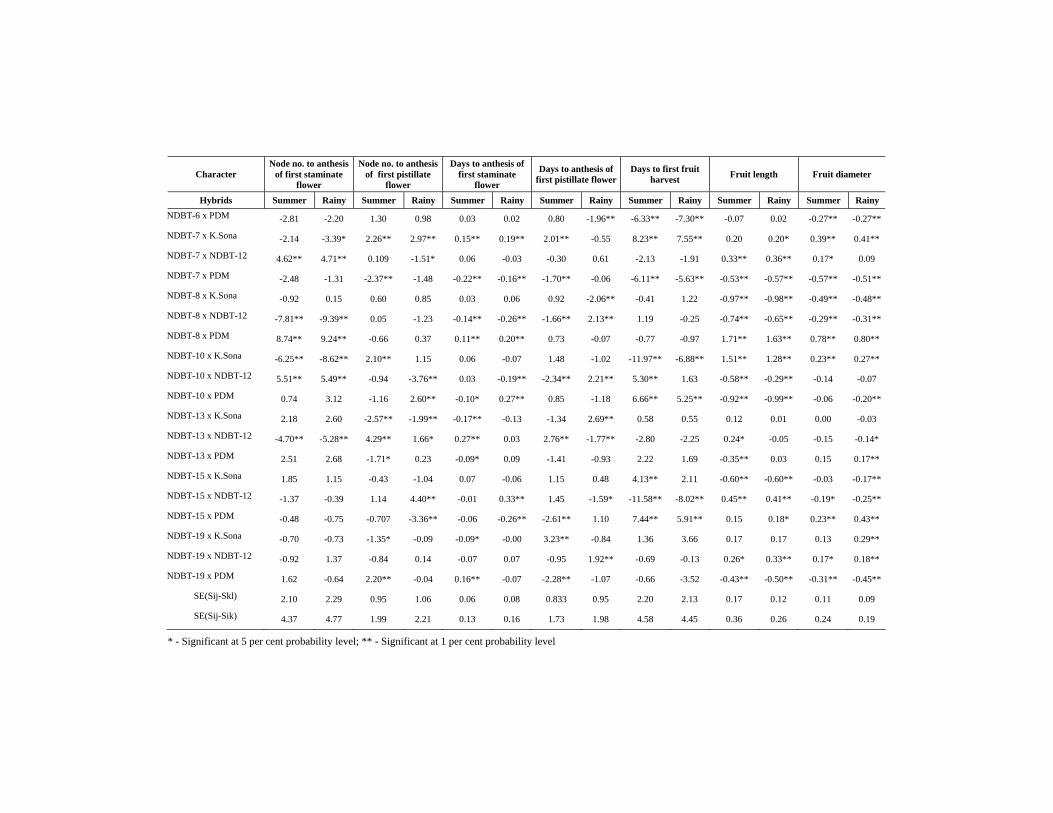
Character Node no. to anthesis
of first staminate flower
Node no. to anthesis of first pistillate
flower
Days to anthesis of first staminate
flower
Days to anthesis of first pistillate flower
Days to first fruit harvest Fruit length Fruit diameter
Hybrids Summer Rainy Summer Rainy Summer Rainy Summer Rainy Summer Rainy Summer Rainy Summer Rainy NDBT-6 x PDM -2.81 -2.20 1.30 0.98 0.03 0.02 0.80 -1.96** -6.33** -7.30** -0.07 0.02 -0.27** -0.27**
NDBT-7 x K.Sona -2.14 -3.39* 2.26** 2.97** 0.15** 0.19** 2.01** -0.55 8.23** 7.55** 0.20 0.20* 0.39** 0.41**
NDBT-7 x NDBT-12 4.62** 4.71** 0.109 -1.51* 0.06 -0.03 -0.30 0.61 -2.13 -1.91 0.33** 0.36** 0.17* 0.09
NDBT-7 x PDM -2.48 -1.31 -2.37** -1.48 -0.22** -0.16** -1.70** -0.06 -6.11** -5.63** -0.53** -0.57** -0.57** -0.51**
NDBT-8 x K.Sona -0.92 0.15 0.60 0.85 0.03 0.06 0.92 -2.06** -0.41 1.22 -0.97** -0.98** -0.49** -0.48**
NDBT-8 x NDBT-12 -7.81** -9.39** 0.05 -1.23 -0.14** -0.26** -1.66** 2.13** 1.19 -0.25 -0.74** -0.65** -0.29** -0.31**
NDBT-8 x PDM 8.74** 9.24** -0.66 0.37 0.11** 0.20** 0.73 -0.07 -0.77 -0.97 1.71** 1.63** 0.78** 0.80**
NDBT-10 x K.Sona -6.25** -8.62** 2.10** 1.15 0.06 -0.07 1.48 -1.02 -11.97** -6.88** 1.51** 1.28** 0.23** 0.27**
NDBT-10 x NDBT-12 5.51** 5.49** -0.94 -3.76** 0.03 -0.19** -2.34** 2.21** 5.30** 1.63 -0.58** -0.29** -0.14 -0.07
NDBT-10 x PDM 0.74 3.12 -1.16 2.60** -0.10* 0.27** 0.85 -1.18 6.66** 5.25** -0.92** -0.99** -0.06 -0.20**
NDBT-13 x K.Sona 2.18 2.60 -2.57** -1.99** -0.17** -0.13 -1.34 2.69** 0.58 0.55 0.12 0.01 0.00 -0.03
NDBT-13 x NDBT-12 -4.70** -5.28** 4.29** 1.66* 0.27** 0.03 2.76** -1.77** -2.80 -2.25 0.24* -0.05 -0.15 -0.14*
NDBT-13 x PDM 2.51 2.68 -1.71* 0.23 -0.09* 0.09 -1.41 -0.93 2.22 1.69 -0.35** 0.03 0.15 0.17**
NDBT-15 x K.Sona 1.85 1.15 -0.43 -1.04 0.07 -0.06 1.15 0.48 4.13** 2.11 -0.60** -0.60** -0.03 -0.17**
NDBT-15 x NDBT-12 -1.37 -0.39 1.14 4.40** -0.01 0.33** 1.45 -1.59* -11.58** -8.02** 0.45** 0.41** -0.19* -0.25**
NDBT-15 x PDM -0.48 -0.75 -0.707 -3.36** -0.06 -0.26** -2.61** 1.10 7.44** 5.91** 0.15 0.18* 0.23** 0.43**
NDBT-19 x K.Sona -0.70 -0.73 -1.35* -0.09 -0.09* -0.00 3.23** -0.84 1.36 3.66 0.17 0.17 0.13 0.29**
NDBT-19 x NDBT-12 -0.92 1.37 -0.84 0.14 -0.07 0.07 -0.95 1.92** -0.69 -0.13 0.26* 0.33** 0.17* 0.18**
NDBT-19 x PDM 1.62 -0.64 2.20** -0.04 0.16** -0.07 -2.28** -1.07 -0.66 -3.52 -0.43** -0.50** -0.31** -0.45**
SE(Sij-Skl) 2.10 2.29 0.95 1.06 0.06 0.08 0.833 0.95 2.20 2.13 0.17 0.12 0.11 0.09
SE(Sij-Sik) 4.37 4.77 1.99 2.21 0.13 0.16 1.73 1.98 4.58 4.45 0.36 0.26 0.24 0.19
* - Significant at 5 per cent probability level; ** - Significant at 1 per cent probability level

SAARC J. Agri., 11(2): 129-140 (2013)
NUTRIENT BUDGETING, ECONOMICS AND ENERGETICS OF COWPEA UNDER POTASSIUM AND
PHOSPHORUS MANAGEMENT
V. K. Choudhary*1 and P. Suresh Kumar2
ICAR, Research Complex for North Eastern Hilly Region, Arunachal Pradesh Centre, Basar-791 101, India
ABSTRACT
Low availability of phosphorus (P) and potassium (K) in acidic soil is a major constraint for crop production. Cowpea was grown under split-plot design with three levels of K and P (viz., 100%, 75% and 50% of recommended dose). Green pod and stover yield was 20.9 and 16.9% higher with 100% K over 50% K application. Similarly, 100% P had 20.2% higher green pod and 16.6% higher stover yield over 50% P. Production efficiency was found higher with 100% K and P (48.6 and 49.0 kg ha-1 day-1 respectively) followed by 75% K. The actual gain of N, P and K, and balance were higher with the increase of K and P levels but reverse in case of gross and net return, and BCR. The energy productivity and energy use efficiency were higher on 100% K and P. Cowpea on acid soil along with 100% recommended dose of 40 kg K and 60 kg P ha-1 showed highest yield along with soil fertility restoration as well as reduced the cost of inorganic fertilizer, higher BCR (1.89) and energy requirement. Key words: Cowpea, economics, energy, phosphorus, potassium
INTRODUCTION Cowpea (Vigna unguiculata L.) is an important grain legume in rainfed regions
and marginal areas of the tropics and subtropics. It is particularly important in India because this crop can be used as pulse, vegetable and fodder. Cowpea is grown by most farmers due to its short growing cycle. The grain is a good source of human protein, while the haulms are valuable source of livestock protein (Mpepereki et al., 2000). Apart from these, the cowpea reduces the soil erosion, enriches the soil by atmospheric nitrogen (N)-fixation and reduces the weed growth by smothering effect, and therefore, it is considered as important legume cum vegetable crop. Cowpea can fix more than 50% of its N from N2-fixation (Khan et al., 2002). * Corresponding author email: [email protected] 1Scientist (Agronomy), National Institute of Biotic Stress Management, Raipur- 493 225 2Senior Scientist (Horticulture), National Institute of Abiotic Stress Management, Baramati- 413 115 Received: 14.05.2013
130 V. K. Choudhary and P. Suresh Kumar
Crop productivity on more than 40% of earth’s arable land is limited by poor plant availability of P (Vance, 2001). The generally poor food situation in Eastern Himalayan Region (EHR) is related to the low availability of P in the soil. Moderate applications of P fertilizer often have only marginal effect on yields due to P fixation by Iron (Fe) and Al-oxides in the soils (Sample et al., 1980). Most of the soil-P is bound in sparingly soluble P pools and not immediately available to support plant growth. The low availability of soil phosphorus may limit N2-fixation and also uptake of K. Pulse crop required higher amount of P to develop their root system. Positive effects of grain legumes on yields of cereals grown in rotation may also be due to enhanced P-availability through secretion of enzymes and acids in the legume rhizosphere (Schlecht et al., 2006). The functions of potassium in plant-water relations, energy and enzyme synthesis and tolerance against diseases are well documented. Application of P and K fertilizer is essential for optimal crop yields when soils are deficient with then. The agronomic efficiency of inorganic P fertilizers has been reported to be only 10–25% within the first year of application, as a large portion of applied fertilizer P is fixed by soil and therefore become unavailable to plant (Thierry, 2008). Cowpea is an important leguminous crop, but the crop is grown under poor soil with or without chemical inputs, therefore, the productivity is very low. An attempt was therefore, required to estimate the nutritional need of the crop to harvest higher yield, nutrient budgeting, economics and energy involvement in production.
MATERIALS AND METHODS Climatic condition and experimental site
A field experiment was carried out at the experimental farm of ICAR Research Complex for NEH Region, Arunachal Pradesh Centre, Basar, located at West Siang District of Arunachal Pradesh, India during 2009 and 2010. Experimental site was at 27°95′ N latitude, 94°76′ E longitude with 660 m above MSL and falls under humid sub tropical climate. The daily temperature during the study period varied widely between minimum of 20°C and maximum of 35°C, received average rainfall of 1300 mm from March to June. The physical and chemical properties of the soils are silty loam in texture, acidic in reaction (pH 5.3), high in organic carbon (Walkaley and Black, 1.50 g kg-1), low in available N (alkaline permanganate N, 205.6 kg ha-1), low in available phosphorus (Bray P, 8.3 kg ha-1) and medium in available K (Neutral normal ammonium acetate K, 260 kg ha-1). Treatment details
The experiment was laid out in split-plot design with three replications. Main plots were subjected to potassium with three levels (viz. 100, 75 and 50% of recommended dose (RD)) and sub-plots were subjected to phosphorus with three levels (viz. 100, 75 and 50% of RD) i.e. 40, 30 and 20 kg K and 60, 45 and 30 kg P ha-1. The recommended dose of fertilizers (25:60:40 kg NPK ha-1) was applied in the
COWPEA UNDER POTASSIUM AND PHOSPHORUS MANAGEMENT 131
131
form of urea, single super phosphate and muriate of potash, respectively. Five tones of well decomposed manure were applied at final land preparation and all the fertilizer as per treatments were applied prior to sowing. Seeds were sown with spacing of 45 cm x 20 cm and all other cultural operations were done as per recommendation. Observations on crop and soil
Green pod and stover yield was recorded from the net plot area of (3.0 m2). Production efficiency was calculated by dividing green pod yield by 85 days duration of cowpea. Soil samples were collected before and after the experiment and plant samples were collected at the time of final harvest for chemical analysis. The contents of N, P and K in the plant were analyzed by standard procedure and the total uptake of nutrients by plants was calculated from their contents in the plants multiplied by dry matter yield and expressed in kg ha-1. N, P and K use efficiency was calculated by nutrient uptake by crop per hectare to the nutrient applied to the individuals. Energetic parameters
Energy input and output was calculated using energy equivalents as suggested by Devasanapathy et al. (2009). Energy use efficiency (kg pod MJ-1 and kg dry matter MJ-1) was calculated by dividing green pod yield (kg) by total input energy (MJ) and total dry matter produced (kg) by total input energy (MJ). The details of energy parameters and their estimation are given in table 1.
Table 1: Energy parameters and their estimation Parameters Formulae Description
Total energy (MJ ha-1)
Te: total energy, Eg: energy from green pod; Es: energy from straw
Energy use efficiency green pod (%)
EEg: energy use efficiency of green pod
Energy use efficiency stover (%)
EEs: energy use efficiency of stover
Energy productivity (kg MJ-1)
Ep: Energy productivity, Go: green pod yield, Ei: energy input
Net energy (MJ ha-1)
Ne: Net energy, Eo: energy output
132 V. K. Choudhary and P. Suresh Kumar
Economic and statistical analysis Economic analysis was worked out as per prevailing market prices of the
inputs and produce. The price ( t-1) of cowpea pod and stover were 8000 and 500 respectively [USD 1($) = 48.0] constant for both the years. The analysis of variance of the data was carried out by using SAS 9.2 software. Treatment mean differences were separated by the least significant difference (LSD) test at 0.05 probability level.
RESULTS AND DISCUSSION Total dry matter and yield
Total dry matter (TDM) content significantly varied with K and P levels in cowpea (Table 2). TDM was highest with the application of K with 100% of recommendation. There was trend to decrease TDM with the decrease of K levels. Similar trend was followed in both the years. Similarly, 100% P had highest TDM in both the years. This is because of higher growth attributes viz. leaf number and leaf area (data not presented), which helped the plant to produce more photosynthesis and accumulated in different plant parts (Abayomi et al., 2008). Green pod and stover yields were significantly highest with 100% K which showed 20.2 and 21.5% of green pod, and 11.2 and 22.6% of stover yield for 2009 and 2010, respectively higher over 50% K. Though, 100 and 50% P application showed at par in 2010. Phosphorus application with 100% P recorded 19.8 and 20.5% higher green pod yield and 11.5 and 19.6% higher stover yield for 2009 and 2010, respectively over 50% P. Similar results were also observed by Neumann and George, 2009. Production efficiency
Data presented in table 2 clearly depicts that production efficiency (PE) significant (P<0.05) differed with K and P levels. PE in K application with 100 and 75% showed identical in 2010 but differed in 2009 where 100% P application registered significantly higher. PE was 16.5 and 9.8% higher on 100 and 75% K, respectively over 50% K. Similarly, with P levels, PE was 14.4 and 3.4% higher on 100 and 75% P, respectively over 50% P. In both the years P application with 100% gave significantly higher PE. This might be due to better growth and yield attributes and finally leads to higher yield. The applied nutrients were efficiently taken up by plants. Similar finding was also reported by Singh et al. (2010). Nitrogen uptake and balance
The N uptake significantly (P<0.05) differed with the different levels of K and P which clearly indicates that the N uptake was highest with the application of 100% K in both the years. However, lowest N uptake was recorded with 50% K (Table 3). Increased N uptake due to higher yield was also confirmed by Tanwar et al. (2010). The nitrogen budgeting was greatly influenced by the levels of K and P applied. It can be visualized that among the K levels, 100% of applied K recorded 71.3% higher actual gain of N followed by 75% (39.3%). However, the balance was recorded 92.6% higher in 100% K followed by 46.3% with 75% of K over the 50% of K. It
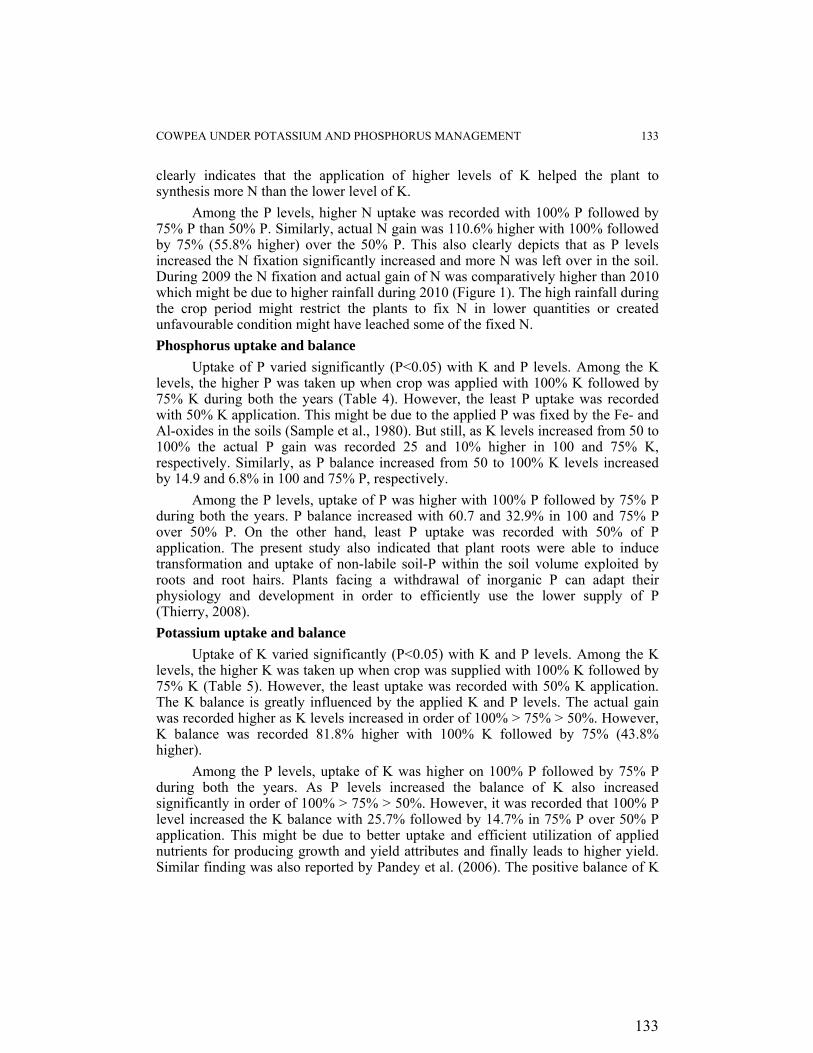
COWPEA UNDER POTASSIUM AND PHOSPHORUS MANAGEMENT 133
133
clearly indicates that the application of higher levels of K helped the plant to synthesis more N than the lower level of K.
Among the P levels, higher N uptake was recorded with 100% P followed by 75% P than 50% P. Similarly, actual N gain was 110.6% higher with 100% followed by 75% (55.8% higher) over the 50% P. This also clearly depicts that as P levels increased the N fixation significantly increased and more N was left over in the soil. During 2009 the N fixation and actual gain of N was comparatively higher than 2010 which might be due to higher rainfall during 2010 (Figure 1). The high rainfall during the crop period might restrict the plants to fix N in lower quantities or created unfavourable condition might have leached some of the fixed N. Phosphorus uptake and balance
Uptake of P varied significantly (P<0.05) with K and P levels. Among the K levels, the higher P was taken up when crop was applied with 100% K followed by 75% K during both the years (Table 4). However, the least P uptake was recorded with 50% K application. This might be due to the applied P was fixed by the Fe- and Al-oxides in the soils (Sample et al., 1980). But still, as K levels increased from 50 to 100% the actual P gain was recorded 25 and 10% higher in 100 and 75% K, respectively. Similarly, as P balance increased from 50 to 100% K levels increased by 14.9 and 6.8% in 100 and 75% P, respectively.
Among the P levels, uptake of P was higher with 100% P followed by 75% P during both the years. P balance increased with 60.7 and 32.9% in 100 and 75% P over 50% P. On the other hand, least P uptake was recorded with 50% of P application. The present study also indicated that plant roots were able to induce transformation and uptake of non-labile soil-P within the soil volume exploited by roots and root hairs. Plants facing a withdrawal of inorganic P can adapt their physiology and development in order to efficiently use the lower supply of P (Thierry, 2008). Potassium uptake and balance
Uptake of K varied significantly (P<0.05) with K and P levels. Among the K levels, the higher K was taken up when crop was supplied with 100% K followed by 75% K (Table 5). However, the least uptake was recorded with 50% K application. The K balance is greatly influenced by the applied K and P levels. The actual gain was recorded higher as K levels increased in order of 100% > 75% > 50%. However, K balance was recorded 81.8% higher with 100% K followed by 75% (43.8% higher).
Among the P levels, uptake of K was higher on 100% P followed by 75% P during both the years. As P levels increased the balance of K also increased significantly in order of 100% > 75% > 50%. However, it was recorded that 100% P level increased the K balance with 25.7% followed by 14.7% in 75% P over 50% P application. This might be due to better uptake and efficient utilization of applied nutrients for producing growth and yield attributes and finally leads to higher yield. Similar finding was also reported by Pandey et al. (2006). The positive balance of K
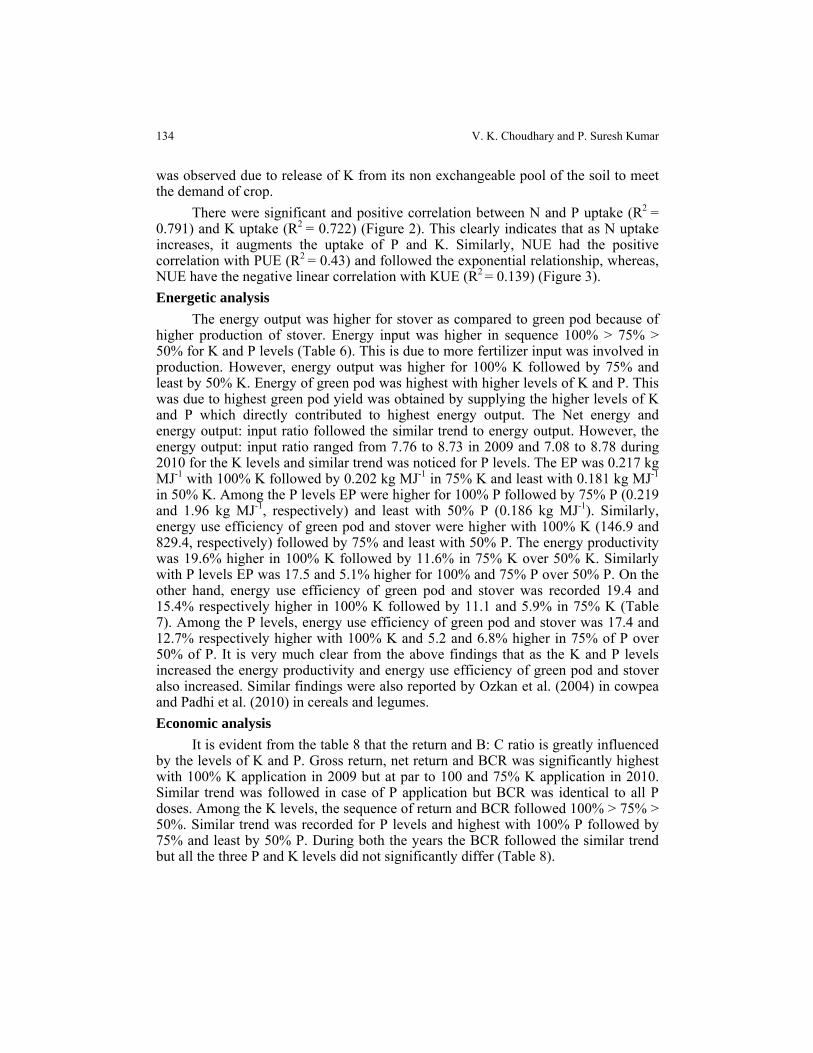
134 V. K. Choudhary and P. Suresh Kumar
was observed due to release of K from its non exchangeable pool of the soil to meet the demand of crop.
There were significant and positive correlation between N and P uptake (R2 = 0.791) and K uptake (R2 = 0.722) (Figure 2). This clearly indicates that as N uptake increases, it augments the uptake of P and K. Similarly, NUE had the positive correlation with PUE (R2 = 0.43) and followed the exponential relationship, whereas, NUE have the negative linear correlation with KUE (R2 = 0.139) (Figure 3). Energetic analysis
The energy output was higher for stover as compared to green pod because of higher production of stover. Energy input was higher in sequence 100% > 75% > 50% for K and P levels (Table 6). This is due to more fertilizer input was involved in production. However, energy output was higher for 100% K followed by 75% and least by 50% K. Energy of green pod was highest with higher levels of K and P. This was due to highest green pod yield was obtained by supplying the higher levels of K and P which directly contributed to highest energy output. The Net energy and energy output: input ratio followed the similar trend to energy output. However, the energy output: input ratio ranged from 7.76 to 8.73 in 2009 and 7.08 to 8.78 during 2010 for the K levels and similar trend was noticed for P levels. The EP was 0.217 kg MJ-1 with 100% K followed by 0.202 kg MJ-1 in 75% K and least with 0.181 kg MJ-1 in 50% K. Among the P levels EP were higher for 100% P followed by 75% P (0.219 and 1.96 kg MJ-1, respectively) and least with 50% P (0.186 kg MJ-1). Similarly, energy use efficiency of green pod and stover were higher with 100% K (146.9 and 829.4, respectively) followed by 75% and least with 50% P. The energy productivity was 19.6% higher in 100% K followed by 11.6% in 75% K over 50% K. Similarly with P levels EP was 17.5 and 5.1% higher for 100% and 75% P over 50% P. On the other hand, energy use efficiency of green pod and stover was recorded 19.4 and 15.4% respectively higher in 100% K followed by 11.1 and 5.9% in 75% K (Table 7). Among the P levels, energy use efficiency of green pod and stover was 17.4 and 12.7% respectively higher with 100% K and 5.2 and 6.8% higher in 75% of P over 50% of P. It is very much clear from the above findings that as the K and P levels increased the energy productivity and energy use efficiency of green pod and stover also increased. Similar findings were also reported by Ozkan et al. (2004) in cowpea and Padhi et al. (2010) in cereals and legumes. Economic analysis
It is evident from the table 8 that the return and B: C ratio is greatly influenced by the levels of K and P. Gross return, net return and BCR was significantly highest with 100% K application in 2009 but at par to 100 and 75% K application in 2010. Similar trend was followed in case of P application but BCR was identical to all P doses. Among the K levels, the sequence of return and BCR followed 100% > 75% > 50%. Similar trend was recorded for P levels and highest with 100% P followed by 75% and least by 50% P. During both the years the BCR followed the similar trend but all the three P and K levels did not significantly differ (Table 8).

COWPEA UNDER POTASSIUM AND PHOSPHORUS MANAGEMENT 135
135
However, the interaction of K and P were statistically similar. It was found that cowpea had direct benefit of N2- fixation and also increased the benefit of residual soil fertility. Application of higher level of K and P significantly increased the yield and also helped the budget of N, P and K. Higher level of K (40 kg ha-1) and P (60 kg ha-1) helped efficient production as well as utilization of energy and economic benefit.
REFERENCES Abayomi, Y. A., Ajibade, T. V., Sammuel, O. F. and Saadudeen, B. F. 2008. Growth and
yield responses of cowpea genotype to NPK application in the southern Guinea Savanna Zone of Nigeria. Asian Journal of Plant Sciences, 7(2): 170-176
Devasenapathy, P., Senthikumar, G. and Shanmugam, P. M. 2009. Energy management in crop production. Indian Journal of Agronomy, 54(1): 80-90
Khan, D. F., Peoples, M. B., Chalk, P. M. and Herridge, D. F. 2002. Quantifying below-ground nitrogen of legumes. 2. A comparison of 15N and non-isotopic methods. Plant Soil, 239: 277-289
Mpepereki, S., Javaheri, F., Davis, P. and Giller, K. E. 2000. Soyabeans and sustainable agriculture: ‘promiscuous’ soyabeans in Southern Africa. Field Crops Research, 65: 137-149
Neumann, E. and George, E. 2009. The effect of arbuscular mycorrhizal root colonization on growth and nutrient uptake of two different cowpea genotypes exposed to drought stress. Emeritus Journal of Food and Agriculture, 21(2): 1-17
Ozkan, B., Akcaoz, H. and Fert, C. 2004. Energy input–output analysis in Turkish agriculture. Renewable Energy, 29: 39-51
Padhi, A. K., Jena, B. K. and Panigrahi, R. K. 2010. Performance of double cropping systems involving legume vegetables and finger millet under rainfed condition. Indian Journal of Agricultural Research, 44(1): 14-19
Panday, N., Verma, A. K., Anurag and Tripathi, R. S. 2006. Integrated nutrient management in transplanted rice. Indian Journal of Agronomy, 52(1): 40-42
Sample, E. C., Soper, R. J. and Racz, G. J. 1980. Reactions of phosphate fertilizers in soils. In: The role of phosphorus in agriculture. Eds. Khasawneh, F. E. Sample, E. C. and Kamprath, E. J. pp. 263–310. ASA, CSSA, SSSA. Madison, WI
Schlecht, E., Buerkert, A., Tielkes, E. and Bationo, A. 2006. A critical analysis of challenges and opportunities for soil fertility restoration in Sudano-Sahelian West Africa. Nutrient Cycling in Agro ecosystems, 76: 109-136
Singh, P., Singh, P., Singh, K. N., Singh, R., Aga, F. A., Bahar, F. and Raja, W. 2010. Evaluation of wheat genotypes for productivity and economics under graded levels of nitrogen in temperate Kashmir. Indian Journal of Agricultural Sciences, 80(5): 380-384
Tanwar, S. P. S., Rokadia, P. and Singh, A. K. 2010. Productivity, nutrient balance and economics of kabuli chickpea as influenced by integrated nutrient management. Indian Journal of Agronomy, 55(1): 51-55
Thierry, D. 2008. Root branching responses to phosphate and nitrate. Current Opinion Plant Biology, 11: 82-87
Vance, C. P. 2001. Symbiotic nitrogen fixation and phosphorus acquisition. plant nutrition in a world of declining renewable resources. Plant Physiology, 127: 390-397

136 V. K. Choudhary and P. Suresh Kumar
Table 2: Dry matter accumulation, pod and stover yield and production efficiency as influenced by potassium and phosphorus
Treatment Total dry matter (g plant-1)
Green pod yield(t ha-1)
Stover yield (t ha-1)
Production efficiency (kg ha-1
day-1)
2009 2010 2009 2010 2009 2010 2009 2010
Potassium
100% 26.33a 23.87a 4.23a 4.01a 12.43a 12.82a 49.97a 47.30a
75% 23.33b 22.50b 3.77b 3.86a 11.64b 11.38b 45.31b 46.40a
50% 21.00c 21.44c 3.52b 3.30b 11.16b 10.46c 43.09b 40.38b
LSD (P=0.05) 1.71 0.95 0.34 0.24 0.69 0.87 4.01 2.88
Phosphorus
100% 27.67a 24.11a 4.23a 4.12a 12.41a 12.53a 49.76a 48.33a
75% 23.00b 22.31b 3.76b 3.64b 11.70ab 11.64ab 45.02b 43.61b
50% 20.00c 21.39b 3.53b 3.42b 11.13b 10.48b 43.59b 42.14b
LSD (P=0.05) 2.72 1.39 0.40 0.40 0.85 1.29 4.25 4.27
K levels: 100% (40 kg); 75% (30 kg) and 50% (20 kg); P levels: 100% (60 kg); 75% (45 kg) and 50% (30 kg); Values with the same letter within each variables group are not significantly different (P<0.05)
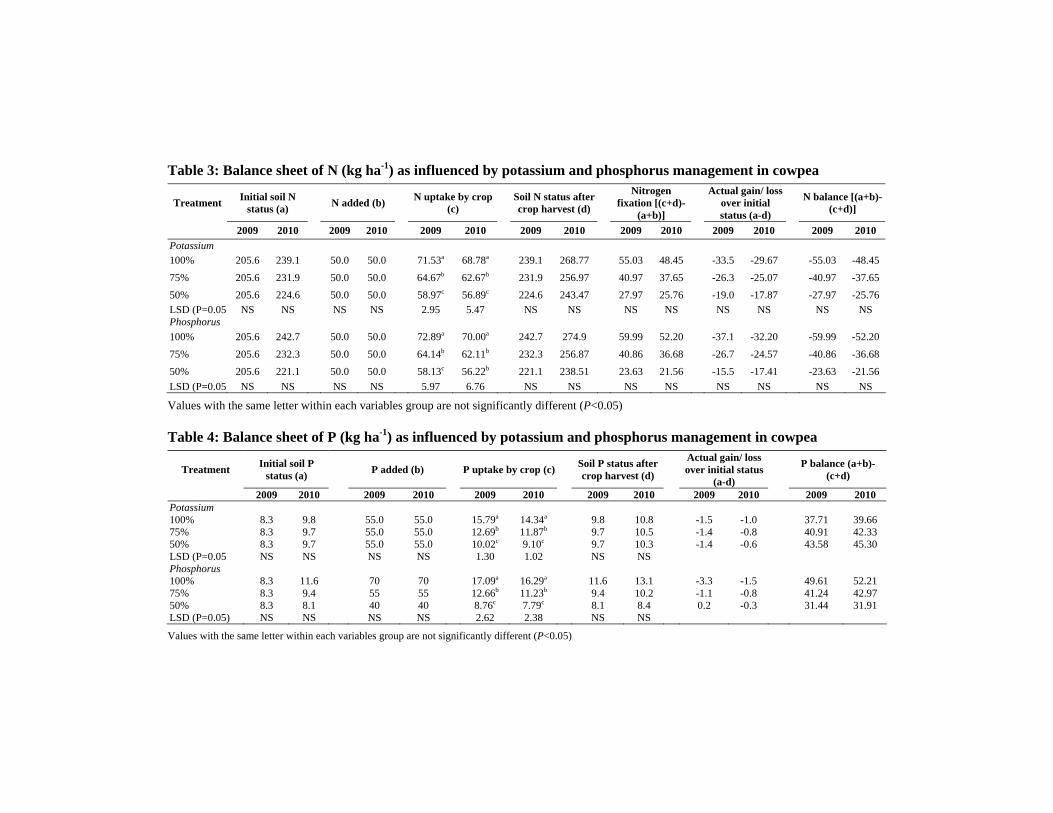
Table 3: Balance sheet of N (kg ha-1) as influenced by potassium and phosphorus management in cowpea
Treatment Initial soil N status (a) N added (b) N uptake by crop
(c) Soil N status after crop harvest (d)
Nitrogen fixation [(c+d)-
(a+b)]
Actual gain/ loss over initial status (a-d)
N balance [(a+b)-(c+d)]
2009 2010 2009 2010 2009 2010 2009 2010 2009 2010 2009 2010 2009 2010 Potassium 100% 205.6 239.1 50.0 50.0 71.53a 68.78a 239.1 268.77 55.03 48.45 -33.5 -29.67 -55.03 -48.45 75% 205.6 231.9 50.0 50.0 64.67b 62.67b 231.9 256.97 40.97 37.65 -26.3 -25.07 -40.97 -37.65 50% 205.6 224.6 50.0 50.0 58.97c 56.89c 224.6 243.47 27.97 25.76 -19.0 -17.87 -27.97 -25.76 LSD (P=0.05 NS NS NS NS 2.95 5.47 NS NS NS NS NS NS NS NS Phosphorus 100% 205.6 242.7 50.0 50.0 72.89a 70.00a 242.7 274.9 59.99 52.20 -37.1 -32.20 -59.99 -52.20 75% 205.6 232.3 50.0 50.0 64.14b 62.11b 232.3 256.87 40.86 36.68 -26.7 -24.57 -40.86 -36.68 50% 205.6 221.1 50.0 50.0 58.13c 56.22b 221.1 238.51 23.63 21.56 -15.5 -17.41 -23.63 -21.56 LSD (P=0.05) NS NS NS NS 5.97 6.76 NS NS NS NS NS NS NS NS
Values with the same letter within each variables group are not significantly different (P<0.05)
Table 4: Balance sheet of P (kg ha-1) as influenced by potassium and phosphorus management in cowpea
Treatment Initial soil P status (a) P added (b) P uptake by crop (c) Soil P status after
crop harvest (d) Actual gain/ loss over initial status
(a-d) P balance (a+b)-
(c+d)
2009 2010 2009 2010 2009 2010 2009 2010 2009 2010 2009 2010 Potassium 100% 8.3 9.8 55.0 55.0 15.79a 14.34a 9.8 10.8 -1.5 -1.0 37.71 39.66 75% 8.3 9.7 55.0 55.0 12.69b 11.87b 9.7 10.5 -1.4 -0.8 40.91 42.33 50% 8.3 9.7 55.0 55.0 10.02c 9.10c 9.7 10.3 -1.4 -0.6 43.58 45.30 LSD (P=0.05 NS NS NS NS 1.30 1.02 NS NS Phosphorus 100% 8.3 11.6 70 70 17.09a 16.29a 11.6 13.1 -3.3 -1.5 49.61 52.21 75% 8.3 9.4 55 55 12.66b 11.23b 9.4 10.2 -1.1 -0.8 41.24 42.97 50% 8.3 8.1 40 40 8.76c 7.79c 8.1 8.4 0.2 -0.3 31.44 31.91 LSD (P=0.05) NS NS NS NS 2.62 2.38 NS NS
Values with the same letter within each variables group are not significantly different (P<0.05)

2
Table 5: Balance sheet of K (kg ha-1) as influenced by potassium and phosphorus management in cowpea
Initial soil K status (a) K added (b) K uptake by crop
(c) Soil K status
after crop harvest (d)
Actual gain/
loss over initial status (a-d)
K balance (a+b)-(c+d) Treatment
2009 2010 2009 2010 2009 2010 2009 2010 2009 2010 2009 2010 Potassium 100% 260.0 310.8 65 65 86.19a 84.89a 310.8 352.9 -50.8 -42.1 -72.0 -62.0 75% 260.0 293.7 55 55 81.34b 78.89a 293.7 315.8 -33.7 -22.1 -60.0 -46.0 50% 260.0 272.8 45 45 74.16c 71.89b 272.8 276.9 -12.8 -4.1 -42.7 -31.0 LSD (P=0.05 NS NS NS NS 2.79 6.48 NS NS Phosphorus 100% 260.0 292.5 55.0 55.0 85.61a 84.56a 292.5 315.4 -32.5 -22.9 -63.1 -52.5 75% 260.0 292.4 55.0 55.0 81.36a 78.89ab 292.4 315.2 -32.4 -22.8 -58.8 -46.7 50% 260.0 292.2 55.0 55.0 74.72b 72.22b 292.2 315.1 -32.2 -22.7 -51.9 -40.1 LSD (P=0.05) NS NS NS NS 5.59 7.15 NS NS
Values with the same letter within each variables group are not significantly different (P<0.05)
Table 6: Energetic parameters (MJ ha-1) as influenced by potassium and phosphorus management in cowpea Energy output (pod) Energy output (stover) Total energy output Energy input Net energy Output: input Treatment
2009 2010 2009 2010 2009 2010 2009 2010 2009 2010 2009 2010 Potassium 100% 28702a 27195.3a 155417a 160278a 184119a 187430a 18896 19146 165223a 168327a 8.73a 8.78a
75% 25538b 26140.7a 145556b 142222b 171094b 168363b 18762 19012 152331b 149351b 8.12b 7.84b
50% 23881b 22374.0b 139583b 130694c 163464c 153068c 18671 18921 144793c 134148c 7.76b 7.08c
LSD (0.05) 2307.7 1641.8 8637.3 10852 7365.4 11616 7365.4 11616 0.387 0.59 Phosphorus 100% 28702a 27903a 155139a 156667a 183841a 184570a 18998.3 19248.3 164843a 165322a 8.67a 8.58a
75% 25463b 24649b 146250ab 145556ab 171713b 170205ab 18772.4 19022.4 152940b 151182ab 8.14ab 7.92ab
50% 23956b 23157b 139167b A30972b 163123b 154130b 18558.2 18808.2 144564b 135321b 7.80b 7.20b
LSD (0.05) 2687 2719.1 10634 16141 11563 17914 11491 17837 0.57 0.90
Values with the same letter within each variables group are not significantly different (P<0.05)

COWPEA UNDER POTASSIUM AND PHOSPHORUS MANAGEMENT 139
139
Table7: Energy productivity and use efficiency as influenced by potassium and phosphorus management in cowpea
Energy productivity Energy use
efficiency (pod) Energy use efficiency (stover) Treatment
2009 2010 2009 2010 2009 2010 Potassium
100% 0.224a 0.209a 151.83a 141.92a 822.31a 836.54a
75% 0.201b 0.203a 136.00b 137.41a 775.51b 747.61b
50% 0.188b 0.174b 127.81b 118.20b 747.29b 690.47c
LSD (0.05) 0.018 0.013 12.20 8.59 45.49 56.94
Phosphorus
100% 0.223a 0.214a 151.02a 144.88a 816.48a 813.58a
75% 0.200b 0.191b 135.58b 129.57b 778.94ab 764.84ab
50% 0.190b 0.182b 129.03b 123.09b 749.69b 696.20b
LSD (0.05) 0.020 0.020 13.75 13.75 53.85 81.59
Values with the same letter within each variables group are not significantly different (P<0.05)
Table 8: Economic parameters ( ha-1) as influenced by potassium and phosphorus management in cowpea
Cost of cultivation Gross return Net return B:C
Treatment 2009 2010 2009 2010 2009 2010 2009 2010
Potassium 100% 13500 13756 40083a 38500.0a 26583a 24743.7a 1.97a 1.79a 75% 13067 13306 35946b 36533.3a 22889b 23227.7a 1.75b 1.74a 50% 12700 12955 33761b 31627.8b 21061b 18672.1b 1.66b 1.44b LSD (0.05) 2514.3 2150.4 2514.3 2150.4 0.186 0.157 Phosphorus 100% 14067 14308 40072a 39191a 26006a 24883a 1.85a 1.73a 75% 13067 13305 35894b 34907b 22828b 21602ab 1.78a 1.62a 50% 12133 12404 33833b 32563b 21700b 20159b 1.74a 1.62a LSD (0.05) 3296.4 3634.8 3026.4 3362.1 0.198 0.215
Values with the same letter within each variables group are not significantly different (P<0.05)
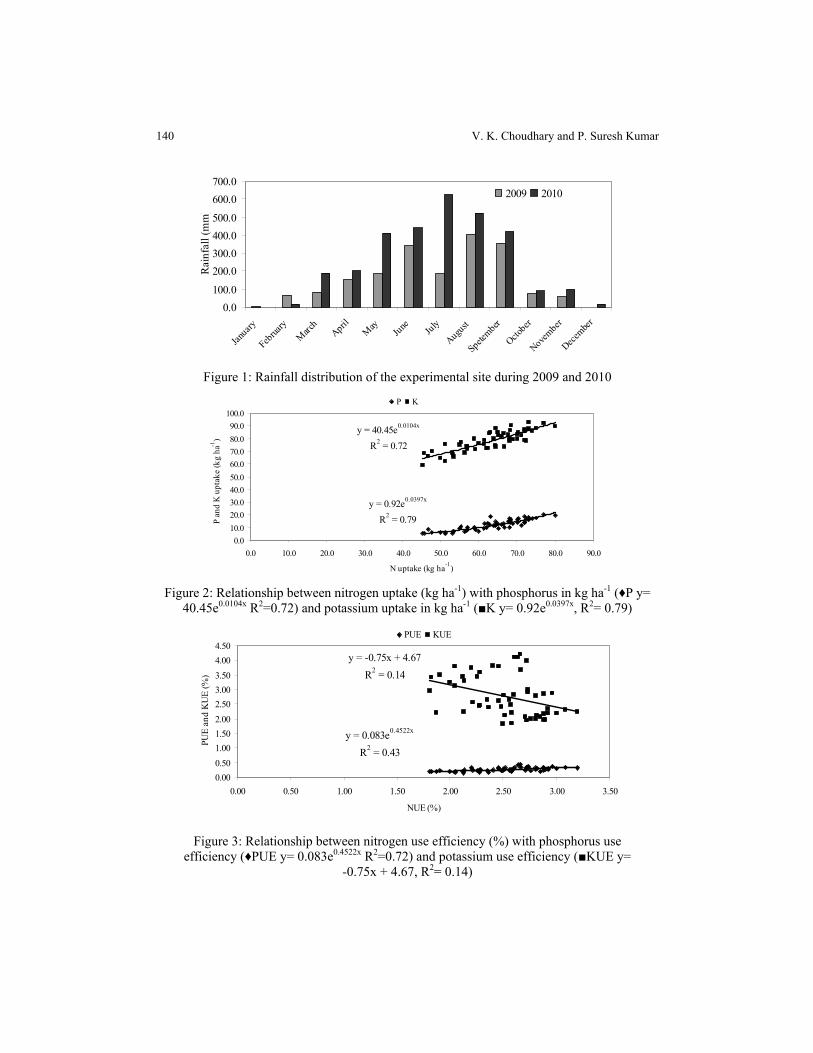
140 V. K. Choudhary and P. Suresh Kumar
0.0100.0
200.0300.0400.0500.0
600.0700.0
January
Februa
ryMarc
hApril
May June July
August
Spetember
October
November
December
Rai
nfal
l (m
m)
2009 2010
Figure 1: Rainfall distribution of the experimental site during 2009 and 2010
y = 40.45e0.0104x
R2 = 0.72
y = 0.92e0.0397x
R2 = 0.79
0.010.020.030.040.050.060.070.080.090.0
100.0
0.0 10.0 20.0 30.0 40.0 50.0 60.0 70.0 80.0 90.0
N uptake (kg ha-1)
P an
d K
upt
ake
(kg
ha-1
)
P K
Figure 2: Relationship between nitrogen uptake (kg ha-1) with phosphorus in kg ha-1 (♦P y=
40.45e0.0104x R2=0.72) and potassium uptake in kg ha-1 (■K y= 0.92e0.0397x, R2= 0.79)
y = -0.75x + 4.67R2 = 0.14
y = 0.083e0.4522x
R2 = 0.43
0.000.501.001.502.002.503.003.504.004.50
0.00 0.50 1.00 1.50 2.00 2.50 3.00 3.50
NUE (%)
PUE
and
KU
E (%
)
PUE KUE
Figure 3: Relationship between nitrogen use efficiency (%) with phosphorus use
efficiency (♦PUE y= 0.083e0.4522x R2=0.72) and potassium use efficiency (■KUE y= -0.75x + 4.67, R2= 0.14)
SAARC J. Agri., 11(2): 141-147 (2013)
EFFECT OF AZOTOBACTER ON GROWTH AND YIELD OF MAIZE
Bandhu Raj Baral* and Parbati Adhikari Nepal Agricultural Research Council, National Maize Research Program, Rampur, Chitwan, Nepal
ABSTRACT
A field experiment was conducted to study the effect of Azotobacter on growth and yield of maize (variety Rampur composite) at farmland of National Maize Research Program, Rampur, Chitwan, Nepal during the winter season of 2007-08 and 2008-09. The experiment was laid out in randomized complete block design with eight treatments each replicated three times. The treatments were control, 120:60:40 kg NP2O5K2O ha-1, Azotobacter seed inoculation, Azotobacter soil application, Azotobacter +10 t FYM ha-1, 10 t FYM ha-1, 120:60:40 kg NP2O5K2O ha-1 + Azotobacter, 120:60:40 kg NP2O5K2O ha-1 + Azotobacter + 10 t FYM ha-
1. Analysis of variance showed that grain yield, plant height, ear height, ear length, kernel per rows and 1000 grain weight were significantly affected with treatments. Only inoculation of Azotobacter increased 15 to 35% grain yield over non inoculated treatments. The benefit of Azotobacter inoculation was higher in the absence of chemical fertilizer application. Key words: Azotobacter, chemical fertilizer, FYM, grain yield, seed inoculation
INTRODUCTION The worldwide spread of inflation, initiated by several fold rises in Petroleum
price thereby depicting its striking influence on the prices of chemical nitrogenous fertilizers. The prices of nitrogenous fertilizers have nearly doubled during the last 3-4 years. This has necessitated searching for cheaper source of nitrogen to meet the needs of crops. Farmers use chemical fertilizers to increase production to meet their needs, but the excessive use of fertilizers leads to contamination of soil and groundwater and reduce soil fertility. On the other hand, for marginal farmers in Nepal, the purchase of chemical fertilizers is difficult and expensive. So, biofertilizers can replace partially chemical fertilizers. Hence, there is a need to
* *Corresponding author email: [email protected] Received: 14.05.2013

142 Bandhu Raj Baral and Parbati Adhikari
search for alternative strategies to improve soil health without causing damage to environment as well as soil. Therefore, biofertilizers are gaining importance as they are ecofriendly, non hazardous and nontoxic products (Sharma et al., 2007).
Biofertilizers include mainly the nitrogen fixing, phosphate solubilizing and plant growth promoting microorganisms. Biofertilizers benefiting the crop production are Azotobacter, Azospirillum, blue green algae, Azolla, P-solubilizing microorganisms, mycorrhizae and sinorhizobium (Selvakumar et al, 2009). Among the biofertilizers,. Azotobacter represents the main group of heterotrophic, non symbiotic, gram negative, free living nitrogen-fixing bacteria. They are capable of fixing an average 20 kg N/ha/year. The genus Azotobacter includes 6 species, with A. chroococcum most commonly inhabiting in various soils all over the world (Mahato et al., 2009). Besides nitrogen fixation, Azotobacter also produces thiamin, riboflavin, indole acetic acid and gibberellins. When Azotobacter is applied to seeds, seed germination is improved to a considerable extent, so also it controls plant diseases due to above substances produced by Azotobacter. The exact mode of action by which Azotobacteria enhances plant growth is not yet fully understood. Three possible mechanisms have been proposed: N2 fixation; delivering combined nitrogen to the plant; the production of phytohormone-like substances that alter plant growth and morphology, and bacterial nitrate reduction, which increases nitrogen accumulation in inoculated plants (Mrkovacki and and Milic, 2001). In Nepal very limited studies were carried out on the effect of Azotobacter on maize growth and productivity. Therefore, a field experiment was carried out to study the effect of Azotobacter on maize growth and productivity.
MATERIALS AND METHODS The experiment was conducted at farm land of National Maize Research
Program, Rampur, Chitwan, Nepal. The experiment was carried out during the winter season of 2007-08 and 2008-09. The treatment consist of T1= Control, T2= Recommended dose of chemical fertilizer (RDF; 120:60:40 kg NP2O5K2O ha-1), T3= Azotobacter seed inoculation, T4= Azotobacter soil inoculation, T5= Azotobacter + 10 t FYM ha-1 , T6= 10 t FYM ha-1 , T7= RDF (120:60:40 kg NP2O5K2O ha-1) + Azotobacter, T8= RDF (120:60:40 kg NP2O5K2O ha-1) + Azotobacter + 10 t FYM ha-1. The experiment was laid out in randomized complete block design (RCBD) with three replications. Maize open pollinated variety named Rampur composite was planted in 12 m-2 plot with the row to row spacing 75 cm and 25 cm plant to plant spacing. The sources of chemical fertilizer were Urea, DAP and MOP. Seed inoculation with the Azotobacter was carried out by using 10% sugar solution carrier. The sugar solution was prepared by adding 100 g sugar in 1 litre water and boiled then. After cooling the solution, maize seeds were put in the solution pot and taken out and the inoculants were thoroughly mixed with the maize seeds. These seeds were kept in shade before planting. The inoculation was done just few hours before seed sowing. Soil sampling was done before sowing and analyzed for total N,

AZOTOBACTER ON GROWTH AND YIELD OF MAIZE 143
available P, available K, Organic matter and pH. The soil was alluvial sandy loam in texture. The initial total N content was low (0.05%), available P2O5 was high (173kg ha-1), available K2O was medium (102 kg ha-1), organic matter was low (2.12%) and medium acidic in pH (6.0).All the intercultural operation were carried out as per need. ANOVA was carried out using Genstat 13.2. The significant differences among the means were tested using least significance difference (LSD) at 5% significance level.
RESULTS AND DISCUSSION Growth and harvested ear
Inoculation with Azotobacter significantly influenced the plant and ear height of maize during 2007-08 and 2008-09 (Table 1). Two years mean revealed that maximum plant height (120.5) was recorded with the application of recommended dose of chemical fertilizer plus 10 t FYM ha-1 and Azotobacter inoculation. During 2008-09 the overall plants were taller as compared to 2007-08. Similarly, the ear placement height showed similar trend as like plant height. The numbers of harvested ears per m2 were significantly affected. The highest number of ears per m2 (5.41) was recorded in the treatment applied with recommended dose of chemical fertilizer along with Azotobacter inoculation and 10 t FYM ha-1. It seems that chemical combination of organic and inorganic fertilizer increase the number of ear per m2. The numbers of unfilled ears per m2 was not influenced by the Azotobacter inoculation and other treatments in compared to control during both years. Yield attributes
Yield parameters specially ear length, kernels per rows and 1000 grains weight. were highly influenced by Azotobacter inoculation. The mean ear length varied form 10.4 cm to 14.1 cm (Table 2).The maximum ear length (14.1) was seen in the treatment combination consisting of Azotobacter inoculation along with recommended dose of chemical fertilizer and 10 t FYM ha-1. In contrast, the minimum ear length (10.4) was seen in control. The number of kernel rows per ear was not affected by the treatment during both years. The numbers of kernels per row was significantly influenced by Azotobacter inoculation in 2007-08. However, in 2008-09 kernels per row were not affected by treatments. In 2007-08, maximum number of kernels per rows was obtained in the treatment consisting of Azotobacter inoculation along with recommended dose of chemical fertilizer and 10 t FYM ha-1. From this result, it was confirmed that the effect of Azotobacter, chemical fertilizer and FYM were positive and additive on numbers of kernel setting per ear. Thousand grains weight was significantly influenced by the treatment in both the years. Two years mean 1000 grain weight was varied from 432 to 490.8 g. The highest 1000 grains weight was measured in the treatment inoculated with Azotobacter along with recommended dose of chemical fertilizer and 10 t FYM ha-1 and lowest 1000 grains weight. was measured in the treatment of 10 t FYM ha-1 applied. Kader et al, (2002)

144 Bandhu Raj Baral and Parbati Adhikari
reported that Azotobacter increases N availability in the soil which could enhance the numbers of grains and 1000 grains weight Application of recommended dose of chemical fertilizer showed major influencing factor in 1000 grain weight in 2007-08. The variation of influence of Azotobacter on yield attributes such as 1000 grains weight in 2008-09 than previous year may be the Azotobacter sp. populations affected by soil chemical (e.g. organic matter, pH, temperature, soil depth, soil moisture) and microbiological (e.g. microbial interactions) properties (Ridvan, 2009). Grain and stover yield
Grain and stover yield were significantly influenced by the Azotobacter inoculation during both years. The grain yield varied from 2.83 t ha-1 to 6.62 t ha-1 (Table 3). The highest grain yield (6.42 t ha-1) was recorded with the Azotobacter inoculation along with recommended dose of chemical fertilizer and 10 t FYM ha-1 treatment. In contrast the lowest grain yield (2.83 t ha-1) was recorded in control. Two years mean grain yield revealed that only inoculation of Azotobacter increased grain yield 0.3 to 35% more as compared to non inoculated treatment combination. Similarly, the highest stover yield (11.9 t ha-1) and lowest stover yield (3.83 t ha-1) were seen with the same treatments which produced highest grain yield and lowest grain yield. Peng et al. (2013) also reported the positive effect of manure and Azotobacter application on maize biomass. The stover and grain yield were highly correlated in the experiment (not shown). The highest benefit of 35% grain yield increment was obtained with the seed inoculation treatment over the control followed by 34% in soil inoculated treatment over the control treatment. Inoculation of Azotobacter in addition to only 10 t FYM ha-1 increased 15% more grain yield over the treatment only applied 10 t FYM ha-1. The lowest benefit of 0.3 % increase in yield by Azotobacter inoculation was obtained in the treatment applied with recommended dose of chemical fertilizer and Azotobacter inoculation over the recommended chemical fertilizer applied treatment. This result was in line with the Peng et al. (2013), they concluded that Azotobacter chroococcum inoculation with maize seeds not only economically most efficient at lower doses of N but also saved N when applied in combination with FYM. Biari et al. (2008) also found positive effect of Azotobacter application on maize grain yield increase at organic field condition. The benefit of Azotobacter applying with FYM could be as Azotobacter uses carbon for its metabolism from simple or compound substances of carbonaceous in nature. Besides carbon, Azotobacter also requires calcium for nitrogen fixation. Similarly, a medium used for growth of Azotobacter is required to have presence of organic nitrogen, micro-nutrients and salt in order to enhance the nitrogen fixing ability of Azotobacter.

AZOTOBACTER ON GROWTH AND YIELD OF MAIZE 145
CONCLUSION Inoculation with Azotobacter significantly increased plant height, ear height,
number of ears per m2, ear length, kernel per row, 1000 grain weight, grain and stover yield of maize. Only inoculation of Azotobacter increased maize grain yield upto 35% over non inoculated treatment. The benefit of Azotobacter inoculation was higher when chemical fertilizer was not used. A positive additive (15% yield increased) effect of 10 t FYM ha-1 with Azotobacter inoculation was seen. Therefore, it was concluded that Azotobacter could be one of the biofertilizer option for sustainable and environmental ecofriendly for maize production where chemical fertilizer is limited.
ACKNOWLEDGEMENT The authors would like to thank the Executive Director of Nepal Agricultural
Research Council (NARC) Dr. D. B. Gurung (former Maize Coordinator) for providing support to conduct this experiment and Dr. K. B. Koirala Maize Coordinator who motivated to write the paper. The authors would also like to thank H. L. Bohora for his continuous help during field and lab work of this experiment.
REFERENCES Biari, A., Gholami, A. and Rahmani, H. A. 2008. Growth promotion and enhanced nutrient
uptake of maize (Zea mays L.) by application of plant growth promoting rhizobacteria in Arid region of Iran. Journal of Biological Sciences, 8: 1015-1020
Kader, M. A., Mian, M. H. and Hoque, M. S. 2002. Effect of Azotobacter inoculants on the yield and nitrogen uptake by wheat. Journal of Biological science, 4: 259-261
Ridvan K. 2009. Nitrogen fixation capacity of Azotobacter spp. Strains isolated from soils in different ecosystems and relationship between them and the microbiological properties of soils. Journal of Environmental Biology, 30 (1):73-82
Mahato P., Badoni, A. and. Chauhan, J. S. 2009. Effect of Azotobacter and Nitrogen on Seed Germination and Early Seedling Growth in Tomato. Researcher, 1(4):62-66
Mrkovacki, N., Milic, V. 2001. Use of Azotobacter chroococcum as potentially useful in agricultural application. Annals of Microbiology, 51:145-158
Peng, S. H., Wan-Azha, W. M., Wong, W. Z. Go, W. Z., Chai, E. W., Chin, K. L. and H`ng, P. S. 2013. Effect of Using Agro-fertilizers and N-fixing Azotobacter Enhanced Biofertilizers on the Growth and Yield of Corn. Journal of Applied Sciences, 13: 508-512
Selvakumar, G., Lenin, M., Thamizhiniyan, P. and Ravimycin,T. 2009. Response of biofertilizers on the growth and yield of blackgram (Vigna mungo L.). Recent Research in Science and Technology, 1(4):169-175
Sharma K., Dak G., Agrawal A., Bhatnagar M. and Sharma R. 2007. Effect of phosphate solubilizing bacteria on the germination of Cicer arietinum seeds and seedling growth. Journal of Herbal Medicine and Toxicology, 1(1):61-63

Table 1: Effects of Azotobacter on growth and yield attributes of maize during 2007-08 and 2008-09 at Rampur Plant height (cm) Ear height (cm) Harvested ears/m2 Unfilled ear/m2 Treatments
2007-08 2008-09 Mean 2007-08 2008-09 Mean 2007- 08 2008-09 Mean 2007-08 2008-09 Mean T1 150 184 167.0 65 92 78.5 4.36 4.21 4.28 1.03 1.16 1.09 T2 194 213 203.5 85 112 98.5 5.56 5.05 5.30 0.20 0.50 0.35 T3 177 216 196.5 78 115 96.5 4.73 4.43 4.58 0.73 0.88 0.80 T4 184 209 196.5 68 108 88.0 4.13 4.66 4.39 1.35 0.83 1.09 T5 188 211 199.5 90 113 101.5 4.33 4.00 4.16 0.96 1.38 1.17 T6 186 214 200.0 96 111 103.5 5.08 4.60 4.84 0.33 0.93 0.63 T7 206 211 208.5 94 111 102.5 4.86 4.83 4.84 0.41 0.76 0.58 T8 205 216 210.5 100 113 106.5 5.33 5.50 5.41 0.21 0.16 0.18 F-test ** ** * ** * * NS NS CV% 5.2 2.92 9.5 4.95 14.2 10.3 24.7 28.80 LSD(0.05) 13.6 10.7 14.3 9.51 1.00 0.84 -
NS, p >0.05; *, p<0.05; **, p>0.01
Table 2: Effects of Azotobacter on yield attributes of maize during 2007-08 and 2008-09 at Rampur Ear length (cm) Kernel rows/ear Kernels/row 1000 grain wt.(g) Treat-
ments 2007-08 2008-09 Mean 2007-08 2008-09 Mean 2007-08 2008-09 Mean 2007-08 2008-09 Mean T1 9.5 11.3 10.4 12.2 13.2 12.7 22.4 26.8 24.6 404.8 353.4 379.1 T2 12.4 13.8 13.1 13.4 13.4 13.4 29.8 28.6 29.2 480.6 437.6 459.1 T3 12.6 13.0 12.8 13.6 13.7 13.7 25.2 28.4 26.8 456.2 437.8 447.0 T4 11.2 12.4 11.8 11.8 13.7 12.7 26.2 26.8 26.5 444.6 434.4 439.5 T5 13.3 12.4 12.8 14.6 14.0 14.3 29.3 27.5 28.4 479.8 445.3 462.5 T6 11.2 12.9 12.0 13.6 13.0 13.3 24.5 27.4 25.9 457.2 406.8 432.0 T7 12.4 14.2 13.3 13.0 14.0 13.5 29.4 30.7 30.0 474.4 458.2 466.3 T8 14.2 14.0 14.1 12.8 14.4 13.6 30.8 31.1 30.9 488.6 493.0 490.8 F-test * ** NS NS * NS * * CV% 5.2 4.98 11.2 5.08 4.4 6.17 13.8 6.72 LSD(0.05) 1.20 1.13 - 6.4 - 46.8 51.01
NS, p >0.05; *, p<0.05; **, p>0.01

Table 3: Effects of Azotobacter on stover and grain yield of maize during 2007-08 and 2008-09 at Rampur
Stover yield (t ha-1) Grain Yield (t ha-1) Treatments
2007-08 2008-09 Mean 2007-08 2008-09 Mean
Grain yield increase (%) by inoculation over non-inoculation
T1 2.80 4.86 3.83 2.75 2.91 2.83 - T2 9.28 10.05 9.67 5.40 6.30 5.85 - T3 5.45 7.32 6.39 3.27 4.39 3.83 35 T4 5.80 7.48 6.64 3.12 4.49 3.81 34 T5 7.90 6.03 6.97 4.90 4.62 4.76 15 T6 6.10 6.77 6.44 4.22 4.06 4.14 - T7 9.46 10.63 10.05 5.36 6.38 5.87 0.3 T8 12.8 11.04 11.92 6.22 6.62 6.42 F-test ** ** ** ** CV% 13.1 15.46 12.8 15.47 LSD (0.05) 1.99 2.18 1.23 1.31
NS, p >0.05; *, p<0.05; **, p>0.01

SAARC J. Agri., 11(2): 149-159 (2013)
HYDRO-PRIMING OF SEED IMPROVES THE WATER USE EFFICIENCY, GRAIN YIELD AND NET ECONOMIC RETURN OF WHEAT UNDER DIFFERENT MOISTURE
REGIMES
Raj Pal Meena*, Sendhil R, S. C. Tripathi, Subhash Chander, R. S. Chhokar and R. K. Sharma
Directorate of Wheat Research, Karnal, Haryana 132001, India
ABSTRACT
Wheat is the second most important staple food crop of India and contributes a major share to food basket of the country. Since majority of the area under wheat is irrigated, it consumes huge quantity of fresh water for its cultivation. The availability of good quality water for irrigation is decreasing over a period of time due to vagaries of monsoon, urbanization and industrialization. The biggest challenge on this front is to improve the efficiency and productivity of water being used in existing cropping system. Therefore, it is the need of hour to improve water use efficiency for wheat production. In the milieu, the present investigation was taken with an objective of studying the effect of pre-germinated seed in crop establishment under sub-optimal soil moisture conditions by using the residual soil moisture after harvesting of rice in Indo-Gangetic plains, so that pre sowing irrigation requirement for crop establishment may be cut and reduced in time period which require from pre-sowing irrigation to field preparation. This experiment was conducted for two consecutive years 2010-11 and 2011-12 to evaluate the influence of hydropriming on the water use efficiency and grain yield of wheat (Triticum aestivum L.) under moisture stress. The experiment was conducted in split plot design with three replications keeping moisture stress treatments (optimum moisture, sub-optimal moisture and dry soil followed by irrigation) in main plots and seed priming treatments (dry seed, hydropriming, and pre-germinated seeds) in subplots. Pre-germinated seed produced significantly higher grain yield (5.49 t ha-1), which was statistically similar to hydropriming (5.30 t ha-1). Various seeding methods were statistically at par. The hydro-primed and pre-germinated seeds established earlier than dry seeds leading to better crop establishment under optimum, sub optimum soil moisture as well as dry soil conditions leading to higher tillering and grain yield. The results
* Corresponding author email: [email protected] Received: 27.05.2013

150 Raj Pal Meena et al
of experiment showed that priming with plain water and pre-germinated seeds improved germination indices, seedling growth and crop establishment. Since priming with plain water and to have pre-germinated seeds is simple and cheap method, which can increase germination percentage and homogeneity of seedling emergence under water stress conditions and it can be easily used by farmers. Interactive effect of different seed priming techniques along with seeding at sub optimal soil moisture level proved to be an efficient technique for enhancing water productivity of wheat crop. Keywords: Economics, seed priming, yield, water productivity and wheat
INTRODUCTION Wheat (Triticum aestivum L.), is the most important cereal crop and is also
staple food for millions of people around the world. Irrigation water decreasing and drought are the major factor limiting crop growth and productivity in many regions of the world, the loss of which is more than any other single environmental factor (Farooq et al., 2009a).Wheat yields in the South Asia where rice-wheat cropping system is following, are suffering due to delayed sowing owing to late harvesting of rice, short period of winter seasons, less developed facilities of irrigation and poor crop stands due to lack of optimal moisture. The availability of good quality water is decreasing with time due to higher population pressure, urbanization and industrialization. However, changing global climate is making the situation more serious (IPCC 2007). Water deficit during initial stage of crop results in delayed and erratic seedling emergence and stand establishment and in severe cases, complete inhibition of seedling emergence may also result (Kaya et al., 2006). The biggest challenge on this front is to improve the efficiency and productivity of water being used in existing systems. Harris (1996) demonstrated that simply soaking seeds in plain water before sowing could increase the speed and homogeneity of germination and emergence, leading to better crop stands, and stimulated seedlings to grow much more vigorously. Hydro priming, a simple hydration technique to a point of pre-germination metabolisms without actual germination (Farooq et al., 2009b), is one of the most pragmatic, simple, economic and short-term approaches to combat the effects of drought (Kaya et al., 2006) and other abiotic stresses (Jafar et al., 2012) on seedling emergence and crop establishment. Hydro primed seeds usually have early, higher and synchronized germination owing to reduction in the lag time of imbibitions otherwise required much time (Brocklehurst and Dearman 2008) and build-up of germination enhancing metabolites (Farooq et al., 2006). Preliminary research has also identified a number of opportunities for priming to be used as a vehicle to introduce biofertilizers, micronutrients and crop protection agents into seeds. Studies also suggested that it is possible to prime seeds with small amount of phosphate to good effect in the early root growth is stimulated allowing more effective uptake of available P in the soil (Johanson et al., 2004). Rajpar et al., (2006)

HYDRO-PRIMING OF SEED WHEAT UNDER DIFFERENT MOISTURE REGIMES 151
151
reported that hydro-priming improved wheat yield under non-saline conditions. Good establishment increases competitiveness against weeds, increases tolerance to abiotic stress especially dry spells and ultimately maximizes the yields (Clark et al., 2001). Direct benefits due to seed priming includes, faster emergence, better and more uniform stands, more vigorous plants, better drought tolerance, earlier flowering and higher grain yield in many crops (Harris et al., 1999; Harris and Hollington, 2001).
Wheat is the second most important staple food crop of India and contributes major share to food basket (93.9 MT in 2011-12) of the country (Sharma et al., 2013). The present water productivity of wheat is 1500 litres of water/kg of wheat grain (FAO, 2012). Since 90 per cent of wheat crop is grown in irrigated condition, thus it consumes huge quantity of fresh water for its production (Agricultural Statistics at a glance 2010). It is, therefore, the need of hour to improve water use efficiency for wheat production. Keeping this fact in view, the present investigation was undertaken with an objective to study the effect of seed priming and pre germinated seeds in crop establishment under sub optimal soil moisture conditions in Indo-Gangetic plains, so that pre-sowing irrigation requirement of wheat crop and time period (from pre sowing irrigation to field preparation) may be reduced.
MATERIALS AND METHODS Wheat genotype DBW 17 was used for this study and seed was obtained from
Seed Project, Directorate of Wheat Research, Karnal, India. The present study was conducted at the research farm of Directorate of Wheat Research, Karnal, Haryana, India. The region is characterized by sub tropical and semi arid climate with a hot dry summer (March-June), wet monsoon season (late June – mid September) and a cool dry winter (November-February). Average annual rainfall of Karnal location is 744 mm of which about 80 percent is received during the monsoon. The climate is sub-tropical with mean maximum temperature ranging in between 34-390C in summer and mean minimum temperature ranging in between 6-70C in winter. The crop season received 129.7 mm and 36.3 mm rainfall during 2010-11 and 2011-12, respectively. The soil of experimental field was sandy clay loam with pH 7.3 (1:2.5 soils to water). The soil had organic carbon 0.4 %, available N 190 kg ha-1, available P 17.8 kg ha-1 and available K 165 kg ha-1 at the beginning of the experiment. A field experiment comprising three main plot treatments viz. 1- seeding at optimum moisture level (17.5 %), 2- seeding at sub optimal moisture (10.9 %) and 3- seeding in dry soil followed by irrigation (4.2 %); and three sub plot treatments viz., 1- no seed priming, 2- seed priming with plain water and 3- pre germinated seed was conducted in split plot design with three replications during Rabi (winter) seasons of 2010-11 and 2011-12. To impose the moisture stress treatments pre sowing irrigations were given in treatment optimum moisture level, sub optimal moisture level was obtained by using the residual soil moisture after rice harvesting (no pre sowing irrigation), whereas treatment dry soil followed by irrigation was achieved three times plowing the field to air dry the field (without pre sowing irrigation). Seed priming treatment, seeds
152 Raj Pal Meena et al
were soaked in normal water for about 8 hours before sowing and for pre-germinated seeds treatment; seeds were soaked in normal water over night, spread on a gunny bag and covered by another wet gunny bag for next 12 hours. The sowing of seeds were done on 18 and 6 November in 2010 and 2011, respectively and harvested on 28 April & 1 May in 2011 and 2012, respectively. The row spacing was kept 20 cm. Recommended doses of fertilizer (150:60:40 kg of N, P2O5 and K2O ha-1) were applied as part of nutrient management. Full doses of P and K and 1/3 dose of N through NPK mixture (12:32:16) and urea were applied at sowing and remaining N was applied equally in two splits at first (25 days after sowing) and second (45 days after sowing) irrigations. Soon after seed sowing one light irrigation was imposed in treatment dry sowing followed by irrigation. Subsequent irrigations were given at critical growth stages of wheat crop. For weed control one spray of Sulfosulfuron (Leader 75 WG) @ 25 g ha -1 were done 10 days after first irrigation. Subsequently one hand weeding was done to keep the experimental area free from weeds. Other management practices were adopted as per recommendations of the crop under irrigated conditions. Germination count per meter square was recorded at 4th day after sowing. Number of productive tillers per square meter from the centre of plot was measured in each plot at maturity. Plant height data were recorded by measuring the height of ten representative plants from each plot randomly. A random sample of ten spikes was taken from each plot to determine spike length at maturity. A net plot of size 6 m2 was harvested manually to obtain biomass and yield data. Thousand grains were randomly selected from each sub plot and weighed.
Water productivity and economic analysis combines physical accounting of water with yield or economic output to assess how much value is being obtained from the use of water (Abdullaev et al., 2007). For this analysis, physical water productivity was calculated by the following equation:
WP = Output/Q Where,
WP is the productivity of water in kg m-3, output is the productivity of wheat in kg ha-1 and Q is water used by the crop in m-3 ha-1.
Total amount of water used by wheat was calculated by multiplying the discharge from the tube well with total time taken for irrigating the crop throughout the season (total irrigating hours multiplied by volume of water drawn out per hour). Based on this, the average discharge of tubewell with 10 HP was estimated at 600m-3 ha-1 per irrigation (Kaur et al., 2012).
For statistical analysis SAS version 10.3 had been used to analyze the observations and differences among means were further grouped into significant classes by Duncan’s New Multiple Range Test at five percent probability.

HYDRO-PRIMING OF SEED WHEAT UNDER DIFFERENT MOISTURE REGIMES 153
153
RESULTS AND DISCUSSION Germination Indices
Pre-germinated seeds and seed priming with normal water gave beneficial effect for seed germination, seedling emergence and subsequently crop establishment. Pre-germinated seeds and seed priming in this study resulted significantly higher germination 153 & 167 per square meter which were significantly higher over dry seeds (136). In moisture regime treatments maximum germination was recorded for the treatment dry sowing followed by irrigation (205 per square meter) which was significantly superior to optimum and sub optimal soil moisture treatments. It seems that primed seeds decreased the time of emergence by about 50 per cent. Priming of seeds with normal water makes them rapidly imbibe water and revive metabolism and germination. This then results in higher germination rate, improved stand establishment, increased stress tolerance and ultimately higher yield. The importance of early germination, seedling emergence and rapid stand establishment and growth is quite essential to compete for water, light and nutrients. Yield Attributes
Yield attributes viz. number of effective /m2 (500), ear head length (10.8) and 1000 grain weight (39.08 g) were the highest in pre-germinated seeds followed by hydro primed seeds and found significantly higher than unprimed seeds. The highest yield attributes in pre-germinated seeds may be ascribed to higher number of effective tillers which lead to higher dry matter accumulation (biomass), translocation and conversion of photosynthesis in to reproductive parts. Seeds can be soaked before sowing to meet the initial seed imbibitions requirement. These results indicate that seed priming and pre-germinated seeds caused early and vigorous germination, which led into proper crop establishment under sub optimal soil moisture conditions, there by, producing higher yield attributes. Similar beneficial effects of seed priming were reported by Rajpar et al. (2006) and revealed that seedlings were significantly faster in emergence, took fewer days to mature and gave significantly higher grain yield. Among seeding methods (seeding at optimum moisture level, sub optimal moisture and in dry soil followed by irrigation) except number of effective tillers, all yield attributing characters were found non-significant. Highest number of effective tillers /m2 (499) were recorded for the treatment seeding in dry soil followed by irrigation which was statistically superior over seeding at optimum moisture level (491) and seeding at sub optimal moisture (457). Yield
The grain (5.49 t ha-1) and biomass (12.7 t ha-1) yields of wheat varied significantly due to pre-germinated seeds. These were the highest under pre-germinated seeds sown with optimal soil moisture and sub optimal soil moisture conditions and were significantly higher than unprimed seeds. Pre-germinated seeds

154 Raj Pal Meena et al
and hydro primed seeds registered 9.2 and 5.2 % higher grain yield compared to unprimed seeds, respectively. Increase in grain yield of wheat under pre-germinated seeds and seed priming treatments could be attributed to higher yield attributes whereas, the increase in biological yield was due to higher plant density and plant height. Higher grain and biomass yield in pre-germinated seeds could also be attributed to early germination and vigorous growth, consequently good crop establishment. Higher grain yield with seed priming of wheat has been also reported by Harris et al. (2001b) and Rashid et al. (2002). Harris et al. (1999) reported that early emergence and maturity in seed priming treatment could be due to advancement in metabolic state. Musa et al. (1999) also concluded that priming improve plant stand and provide benefits in term of maturity. This view was further supported by Rashid et al. (2002). Water productivity
The highest yield was observed in M1S3 (6.39 t ha-1) during 2010-11 and M3S3 (4.95 t ha-1) during 2011-12. The information in table 4 indicates the total irrigation water (tube well water + rainfall) applied for crop under different treatments. During both the years of study, water productivity per hectare was highest in the case of pre-germinated seeds technique coupled with seeding at sub optimal soil moisture level (M2S3). Productivity was higher in 2011-12 in spite of low rainfall in comparison to 2010-11 and it could be due to early sowing as compared to the year 2010-11.
Cost of irrigating per hectare of wheat was more in 2011-12 owing to marginal increase in the wages of labourers (Table 5). The quantum of water used for irrigation was low in the case of seeding at sub optimal soil moisture level under seed priming techniques. The cost of irrigation ranged from as high as INR 2232 ha-1 to as low as INR 1860/ha due to sacrificing irrigation at the rate of 600 m ha-3 for seeding at sub optimal soil moisture level under different seed priming techniques.
On the basis of these two years study, it can be revealed that pre-germinated and hydro primed seed sowing may be adopted to enhance seed germination, emergence, and higher biomass as well as grain yield of wheat in Indo-Gangetic plains of India. In addition this technology helps advancing the wheat sowing by about 10-15 days for avoiding the pre sowing irrigation time period require from pre sowing irrigation to field preparation. 10-15 days time period is very crucial in rice-wheat cropping system, the largest cropping system of South Asia. In this region wheat planting usually gets delayed in Rice-Wheat system due to late harvesting of rice which can cause wheat yield penalty. Secondly poor establishment of crop due to lack of optimum soil moisture could be a major constraint for proper crop establishment in other crop sequences. Integrating pre-germinated seeds, seed priming with surface seeding can be a cost effective strategies for enhancing productivity in these rice fallows. On the other hand, good establishment increases competitiveness against weeds, increases tolerance to dry spells maximizes yields and save the time and cost of one irrigation which can also advance the sowing of

HYDRO-PRIMING OF SEED WHEAT UNDER DIFFERENT MOISTURE REGIMES 155
155
wheat after rice crop. Clark et al., 2001 also expressed their views in the same manner. The benefits accrued for the country due to saving irrigation water was estimated in view of the overall deteriorating water situation. The average productivity of wheat was 4.56 t ha-1 in 2010-11 and 5.85 t ha-1 in 2011-12 (Table 4). Production was estimated at 45.58 MT in 2010-11 and 58.47 MT in 2011-12 and the value of production stood at INR 533247 million and INR 751340 million respectively for 2010-11 and 2011-12. Following the water conservation technique, about 20 percent of irrigation water @ 600 m ha-3 and 20 percent of energy @ 24 units ha -1 could be saved for the country as a whole under rice-wheat system.
CONCLUSION Pre-germinated seeds and seed priming is helpful in reducing the risk of poor
stand establishment under sub optimal soil moisture conditions. Pre-germinated seeds and hydro priming of seeds are the simple, cost effective and useful technique, which can advance the wheat sowing by about 10 days and beneficial for both crop thereby increasing wheat yield.
REFERENCES Abdullaev, I., Husan, M.U., & Jumaboev, K. 2007. Water is saving and economic impacts of
land leveling: The case study of cotton production in Tajikistan, Irrigation Drainage System, 21, 251-263
Agricultural Satistics At a glance .2010. Directorate of Economics and Statistics. Department of Agriculture and Cooperation. Ministry of Agriculture, Govt. of India
Brocklehurst, P.A., & Dearman, J. 2008. Interaction between seed priming treatments and nine seed lots of carrot, celery and onion II. Seedling emergence and plant growth, Annals of Applied Biology, 102, 583–593
Clark, L.J., Whalley, W.R., Ellis-Jones, J., Dent, K., Rowse, H.R., Finch-Savage, W.E., Gatsai, T., Jasi, L., Kaseke, N.E., Murungu, F.S., Riches, C.R. & Chiduza, C. 2001. On farm seed priming in maize: A physiological evaluation, Eastern and Southern Africa Regional Maize Conference. pp. 268-273
Farooq, M.,. Basra S.M.A., Khalid, M., Tabassum R., & Mehmood T. 2006. Nutrient homeostasis, metabolism of reserves and seedling vigor as affected by seed priming in coarse rice, Canadian Journal of Botany, 84 :1196–1202
Farooq, M., Wahid A., Kobayashi N., Fujita D., & S. Basra M.A. 2009a. Plant drought stress: effects, mechanisms and management, Agronomy for Sustainable Development, 29: 185–212
Farooq, M., Basra S. M. A, Wahid A., Khaliq A., & Kobayashi N. 2009b. Rice seed invigoration: a review. In: E. Lich Lichtfouse, ed. Organic Farming, Pest Control and Remediation of Soil Pollutants, pp. 137–175. Springer, the Netherlands
Food and Agriculture Organization. 2012. Press Release on World water day 22 March 2012 Harris, D. 1996. The effects of manure, genotype, seed priming, depth and date of sowing on
the emergence and early growth of sorghum bicolor (L.) Moench in semi arid Botswana, Soil and Tillage Research, 40: 73-88
156 Raj Pal Meena et al
Harris, D., & Hollington, P.A. 2001. ‘On-farm’ seed priming – an update. Tropical Agriculture Association (UK) Newsletter, 21(4):7
Harris, D., Joshi, A., Khan, P.A., Gothkar, P., & Sodhi, S. 1999. On farm seed priming in semi-arid agriculture: development and evaluation in maize, rice and chickpea in India using participatory methods, Experimental Agriculture, 35: 15-29
Harris, D., Pathan, A.K., Gothkar, P., Joshi, A., Chiwasa, W., & Nyamudeza, P. 2001b. On-farm seed priming: use participatory methods to revive and refine a key technology, Agricultural System, 69 (1-2): 151-164
IPCC, 2007: Climate Change .2007. The Physical Science Basis. Contribution of Working Group I to the Fourth Assessment Report of the Intergovernmental Panel on Climate Change [Solomon, S., D. Qin, M. Manning, Z. Chen, M. Marquis, K.B. Averyt, M.Tignor and H.L. Miller (eds.)]. Cambridge University Press, Cambridge, United Kingdom and New York, NY, USA
Jafar, M. Z., Farooq, M., Cheema, M. A., Afzal, I., Basra, S. M. A., Wahid, M. A., Aziz, T., & Shahid, M. 2012. Improving the performance of wheat by seed priming under saline conditions. Journal of Agronomy and Crop Science, 198: 38–45
Johanson, C., Musa, A.M., Kumar Rao, J.V.D.K., Harris, D., Ali, M.Y., & Lauren, J.G. 2004. Molybdenum response of chickpea in the High Barind Track of Bangladesh and in Eastern India. In International workshop on Agricultural strategies to reduce micronutrient problems in mountains and other marginal areas in South and South East Asia. Kathmandu, 8-10 September 2004. Nepal Agricultural Research Council
Kaya, M. D., Okçu, G., Atak, M., ÇIkIlI, Y.¸ & KolsarIcI, O. 2006. Seed treatments to overcome salt and drought stress during germination in sunflower (Helianthus annuus L.). European Journal of Agronomy, 24: 291–295
Kaur, B., Singh, S., Garg, B.R., Singh, J.M., & Singh, J. 2012. Enhancing water productivity through on-farm resource conservation technology in Punjab agriculture. Agricultural Economics Research Review, 25(1): 79-85
Musa, A.M., Johansen C., Kumar J. & Harris D. 1999. Response of chickpea to seed priming in the High Barind Tract of Bangladesh. International Chickpea and Pigeonpea Newsletter, 6: 20-22
Rajpar, I., Khanif Y.M. & Memon A.A. 2006. Effect of Seed Priming on Growth and Yield of Wheat (Triticum aestivum L.) Under Non-Saline Conditions. International Journal of Agricultural Research, 1 (3): 259-264
Rashid, A., Harris, D., Hollington, P.A. & Khattak, R.A. 2002. On farm seed priming: a key technology for improving the livelihoods of resource poor-farmers on saline lands. Pp. 423-431 in: R. Ahmad and K.A. Malik (eds.) ‘Prospects for Saline Agriculture’. Kluwer Academic Publishers. The Netherlands
Sharma, I., Chatrath, R., and Sendhil, R. 2013. Climate change and sustainable food security SP 4-2013. Research, Policy and Institutional Dynamics in Enhancing Wheat production and productivity in India. PK Shetty, S. Ayyappan and MS Swaminathan (eds.)

Table 1: Effect of seed priming and seeding method on yield attributing characters of wheat under sub-optimal soil moisture conditions
Germination/m2 Productive tillers/m2 Spike length (cm) Plant height (cm) 1000 grain weight (g) Treatments 2010-11 2011-12 Pooled 2010-11 2011-12 Pooled 2010-11 2011-12 Pooled 2010-11 2011-12 Pooled 2010-11 2011-12 Pooled
A. Seeding Method M1* 140 142 141 444 539 491 10.2 10.3 10.2 83.4 90.8 87.8 36.7 41.0 38.9 M2 108 112 110 392 521 456 10.1 10.2 10.2 85.4 91.3 88.4 36.5 40.3 38.4 M3 204 205 205 440 568 504 9.5 9.5 9.5 84.2 92.1 88.0 37.2 40.3 38.8 SEm± 6.0 5.0 5.4 4.6 12.1 7.3 0.23 0.22 0.224 0.72 0.83 0.92 0.36 0.24 0.18 CD (P=0.05) 23.4 19.7 21.1 18.2 47.9 28.5 0.90 0.8 NS 2.8 2.3 NS 1.4 0.9 NS B. Seed Priming S1* 135 136 136 420 509 464 9.6 9.5 9.6 84.1 90.2 87.8 36.6 40.1 38.3 S2 151 154 153 424 540 482 10.1 10.2 10.1 84.8 91.3 88.3 36.7 40.5 38.7 S3 165 169 167 432 579 500 10.3 10.2 10.2 83.9 92.2 87.9 37.1 41.1 39.1 SEm± 5.2 7.7 6.4 4.2 10.5 6.1 0.16 0.17 0.175 0.48 0.62 0.17 0.16 0.25 0.13 CD (P=0.05) 16.2 23.8 19.7 12.9 32.3 19.1 0.51 0.55 NS 1.4 1.4 NS 0.5 0.7 0.4
Table 2: Effect of seed priming and seeding method on yield of wheat under sub-optimal soil moisture conditions Grain Yield (t ha-1) Biomass Yield (t ha-1) Treatments 2010-11 2011-12 Pooled 2010-11 2011-12 Pooled
A. Seeding Method M1* 4.67 5.89 5.28 10.63 14.29 12.49 M2 4.56 5.85 5.20 10.54 14.21 12.45 M3 4.66 6.01 5.33 10.60 14.88 12.79 SEm± 0.053 0.048 0.043 0.049 0.081 0.019 CD (P=0.05) NS NS NS NS 0.315 0.076 B. Seed Priming S1* 4.44 5.61 5.02 10.56 14.15 12.37 S2 4.64 5.97 5.30 10.58 14.52 12.58 S3 4.81 6.17 5.49 10.62 14.72 12.74 SEm± 0.076 0.071 0.057 0.083 0.089 0.072 CD (P=0.05) 0.235 0.219 0.175 NS 0.273 0.221
* M1: Seeding at optimum moisture Level, M2: Seeding at sub optimal soil moisture level M3: Seeding in dry soil followed by irrigation S1: No seed priming, S2: Seed priming, S3: Sprouted seed
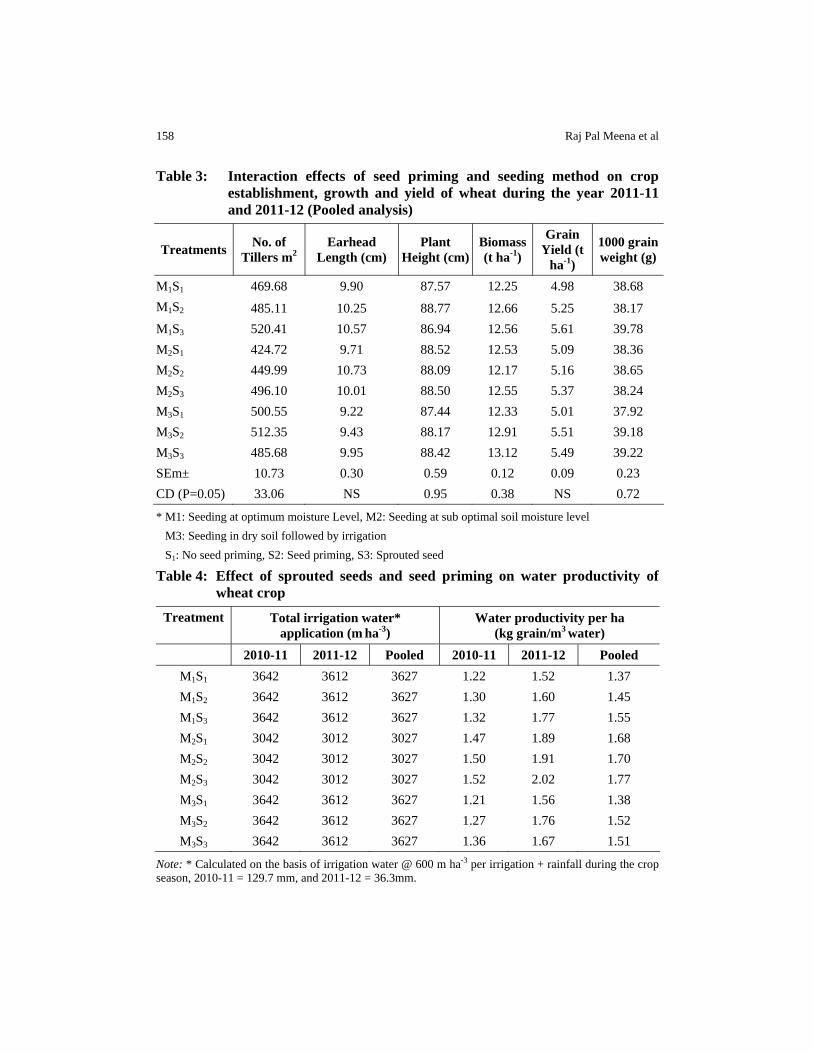
158 Raj Pal Meena et al
Table 3: Interaction effects of seed priming and seeding method on crop establishment, growth and yield of wheat during the year 2011-11 and 2011-12 (Pooled analysis)
Treatments No. of Tillers m2
Earhead Length (cm)
Plant Height (cm)
Biomass (t ha-1)
Grain Yield (t
ha-1)
1000 grain weight (g)
M1S1 469.68 9.90 87.57 12.25 4.98 38.68 M1S2 485.11 10.25 88.77 12.66 5.25 38.17 M1S3 520.41 10.57 86.94 12.56 5.61 39.78 M2S1 424.72 9.71 88.52 12.53 5.09 38.36 M2S2 449.99 10.73 88.09 12.17 5.16 38.65 M2S3 496.10 10.01 88.50 12.55 5.37 38.24 M3S1 500.55 9.22 87.44 12.33 5.01 37.92 M3S2 512.35 9.43 88.17 12.91 5.51 39.18 M3S3 485.68 9.95 88.42 13.12 5.49 39.22 SEm± 10.73 0.30 0.59 0.12 0.09 0.23 CD (P=0.05) 33.06 NS 0.95 0.38 NS 0.72
* M1: Seeding at optimum moisture Level, M2: Seeding at sub optimal soil moisture level M3: Seeding in dry soil followed by irrigation S1: No seed priming, S2: Seed priming, S3: Sprouted seed
Table 4: Effect of sprouted seeds and seed priming on water productivity of wheat crop
Treatment Total irrigation water* application (m ha-3)
Water productivity per ha (kg grain/m3 water)
2010-11 2011-12 Pooled 2010-11 2011-12 Pooled M1S1 3642 3612 3627 1.22 1.52 1.37 M1S2 3642 3612 3627 1.30 1.60 1.45 M1S3 3642 3612 3627 1.32 1.77 1.55 M2S1 3042 3012 3027 1.47 1.89 1.68 M2S2 3042 3012 3027 1.50 1.91 1.70 M2S3 3042 3012 3027 1.52 2.02 1.77 M3S1 3642 3612 3627 1.21 1.56 1.38 M3S2 3642 3612 3627 1.27 1.76 1.52 M3S3 3642 3612 3627 1.36 1.67 1.51
Note: * Calculated on the basis of irrigation water @ 600 m ha-3 per irrigation + rainfall during the crop season, 2010-11 = 129.7 mm, and 2011-12 = 36.3mm.

HYDRO-PRIMING OF SEED WHEAT UNDER DIFFERENT MOISTURE REGIMES 159
159
Table 5: Cost of irrigation influenced by seeding of hydro-primed and pre-germinated wheat seeds
Irrigation water
2010-11 2011-12 Pooled Treatment Quantity (m
ha-3) Cost
(INR ha-1) Quantity (m
ha-3) Cost
(INR ha-1) Quantity (m
ha-3) Cost
(INR ha-1) M1S1 3600 2172 3600 2292 3600 2232 M1S2 3600 2172 3600 2292 3600 2232 M1S3 3600 2172 3600 2292 3600 2232 M2S1 3000 1810 3000 1910 3000 1860 M2S2 3000 1810 3000 1910 3000 1860 M2S3 3000 1810 3000 1910 3000 1860 M3S1 3600 2172 3600 2292 3600 2232 M3S2 3600 2172 3600 2292 3600 2232 M3S3 3600 2172 3600 2292 3600 2232 Mean 3400 2051 3400 2164 3400 2108
* M1: Seeding at optimum moisture Level, M2: Seeding at sub optimal soil moisture level, M3: Seeding in dry soil followed by irrigation, S1: No seed priming, S2: Seed priming, S3: Sprouted seed
Figure 1: Weather data for the Rabi season of 2010-11 & 2011-12
Figure 2: Mean rainfall prevailed during the Julian weeks of the crop season

SAARC J. Agri., 11(2): 161-171 (2013)
GENETIC VARIABILITY AND CHARACTER ASSOCIATION IN DOLICHOS BEAN
V. Magalingam, Mohammed Yassin and S. Ramesh Kumar1* Department of Horticulture, Pandit Jawaharlal Nehru College of Agriculture and Research Institute,
TNAU, Karaikal-609 603, Tamil Nadu, India
ABSTRACT
Field bean (Dolichos lablab L.) is an important vegetable crop throughout India due to its local acceptability by the people. It has wide genetic variability for various traits like plant habit, branching habit, stem pigmentation, pod colour and pod characters etc. In the past, very little attention was given by the scientists on systematic crop improvement in Dolichos bean. The present investigation was laid out in a simple randomized complete block design with three replications during rabi 2011-2012 to study the variability present in 23 genotypes of dolichos bean. Analysis of variance revealed that there were significant differences among the genotypes for all the characters studied. The difference between PCV and GCV was narrow for all characters except percentage of pod set. Hence, these characters were less influenced by environment. High GCV and heritability estimates were associated with greater genetic advance for the nine traits viz., percentage of pod set, number pods per cluster, number pods per plant, green pod length, green pod width, individual green pod weight, pod yield, crude protein and crude fibre indicating that these characters had additive gene effect and were more reliable for effective selection in the improvement of dolichos bean. It is inferred from correlation and path analysis that the individual green pod weight, percentage of pod set, number of flowers per cluster and number of pods per plant exhibited significant positive correlation and direct positive effect on yield. Hence, these traits may be used as selection indices for yield improvement of dolichos bean. Key words: multivariate analysis, pod characters, selection, sem
INTRODUCTION Dolichos bean [Lablab prupureus (L.) Sweet] is an important leguminous
vegetable of India and is mainly grown for its tender pods which are cooked and * Corresponding author e-mail: [email protected] 1Department of Horticulture, Vanavarayar Institute of Agriculture, Manakkadavu, Pollachi-642 103, TNAU, Tamil Nadu, India Received: 07.08.2013
162 V. Magalingam et al
consumed as vegetable. It is also called as sem, hyacinth bean, field bean and avarai. Being leguminous vegetable, the immature green pods of dolichos bean is a good source of protein, minerals and vitamins (Basu et al., 1999). Based on historical evidences, India is considered as origin and primary centre of diversity for dolichos bean. It is one of the most ancient crop among the cultivated plants grown as either pure or mixed with other crops, such as finger millet, groundnut, castor, corn or sorghum. It is also grown in homestead. It is a multipurpose crop grown as pulse, vegetable and forage. Field bean is a drought tolerant crop grown in dry lands with limited rainfall. The crop prefers relatively cool season when sowing done in July-August. It starts fruiting in winter and continues indeterminately in spring (Savitha, 2008). Despite having many good attributes, the crop has remained unexploited owing to low productivity, long duration, photosensitivity and indeterminate growth habit. The consumer preference also varies with pod size, shape, colour and aroma (Sogadu). The efforts of improving the crop by utilizing indigenous and exotic germplasm have been useful in breaking the yield barriers resulting in compact plant type, reduced duration and photo-insensitive types. Hence, comprehensive germplasm collection and evaluation, identification of suitable genotypes for pure crop and investigation of its value as an intercrop with other food and forage crops are essential. The crop is mainly grown for its green pods, while the dry seeds are used in various vegetable preparations. It is one of the major sources of protein in South Indian dietary. A wide range of variations exist for the plant and pod characters amongst the accessions grown all over the country. The success of any breeding programme in general and improvement of specific trait through selection in particular, totally depends upon the genetic variability present in the available germplasm of a particular crop (Parmar et al. 2013). Since, many of the plant characters are governed by polygenes and greatly influenced by environmental conditions; the progress of breeding is, however, conditioned by the magnitude, nature and interrelationship of genotypic and non-genotypic variation. Among the quantitative characters, yield is a complex character, which is dependent on a number of yield contributing characters (Savitha, 2008). The knowledge of the association of yield components and their relative contribution shown by path analysis has practical significance in selection. The study of the association between pairs of characters and yield provide basis for further breeding programme. With a view to measuring the variability among the 23 genotypes for flower and pod characters, getting information on the associations of flower and pod characters with pod yield and assessing the degree of divergence among the genotypes as well as assessing the relative contribution of different components, the present study was undertaken with the following objectives.(i) to study the nature and magnitude of variability in dolichos genotypes; (ii) to understand the degree and direction of association between yield and its components and among themselves; (iii) to assess the direct and indirect effects of traits on yield.
GENETIC VARIABILITY AND CHARACTER ASSOCIATION IN DOLICHOS BEAN 163
MATERIALS AND METHODS The present evaluation of Dolichos bean genotypes suitable for coastal region
of Karaikal in U.T. of Puducherry was conducted in the college orchard, Department of Horticulture, Pandit Jawaharlal Nehru College of Agriculture and Research Institute, Karaikal during rabi season 2012. The experimental material consisted of 23 genotypes of dolichos bean collected from NBPGR (National Bureau of Plant Genetic Resources), New Delhi; TNAU (Tamil Nadu Agricultural University); IIHR (Indian Institute of Horticultural Research), and local varieties of Tamil Nadu and Puducherry. The details of the accessions are given in table 1. The experiment was laid out in the Eastern block of PAJANCOA & RI, Karaikal during Novemeber- March, 2012. The experimental site is situated between 10°49' and 11°01' N Latitude and 78°43' and 79°52' E Longitude with an altitude of four meters from the sea level. The soil type of the experimental plot was clay loam with medium fertility. Karaikal has tropical climate and receives an average annual rainfall of 915.5 mm in 44 rainy days. The farm pond water was used for irrigating the experimental field. The field experiment was laid out in a randomized block design with three replications during rabi season 2012. The plants were spaced 60 cm between row and 30 cm between plants in a row. Recommended horticultural practices and plant protection measures were followed uniformly. The observations were recorded from ten randomly selected plants per replication on each genotype for 15 characters viz., plant height, number of branches per plant, days to 50 percent flowering, number of flowers per cluster, number of clusters per plant, percentage of pod set, days to maturity, number of pods per cluster, number of pods per plant, green pod length, green pod width, individual green pod weight, pod yield per plant, crude protein content and crude fibre content. Crude protein content of the pods was estimated by Bremner (1965). Crude fibre content of pods was estimated by the method of Sadasivam and Manickam (1996). The mean values were subjected to statistical analysis. Correlation, variability and path coefficient analysis were carried out by using GENRES software.
RESULTS AND DISCUSSION (I) Variability studies
Variability of a character is measured by range and genotypic coefficient of variation (Rahman et al., 2002). The range in the mean values reflects the extent of phenotypic variability present in the entries. In this way, the values include genotypic, environmental and genotype x environmental components. So, the estimation of genetic (heritable) and environmental (non-heritable) components of the total variability are required as these help us in the choice of suitable breeding programme. In the present investigation the difference between PCV and GCV was compared for different traits and it was found to be relatively narrow for almost all the characters expect for percentage of pod set, indicating the presence of low degree

164 V. Magalingam et al
of environmental influence on these characters. Regarding the percentage of pod set, the difference between PCV and GCV was moderately higher which indicates that this trait is much influenced by environment. Since GCV represents the heritable components of total variation, it would be more appropriate to use this parameter for comparing variability of different characters among genotypes in dolichos bean.
In the present investigation, high GCV was recorded for percentage of pod set, number of pods per cluster, number of pods per plant, green pod length, green pod width, individual green pod weight, green pod crude protein, green pod crude fiber and pod yield (Table 2). This indicated the maximum variability existing in the genotypes for these characters and offers good scope for improvement of these traits by simple selection. Similar findings were reported by Golani et al. (2007) and Mohan et al. (2009) in dolichos bean. Moderate GCV was observed for plant height, number of branches per plant, number of flower per cluster, number of cluster per plant and days to maturity, whereas lowest GCV was observed for days to 50 percent flowering. These lowest and moderate GCV estimates for these traits revealed that the extent of response of these traits for selection would be lesser than that of the other traits.
High genotypic coefficient of variation (GCV) alone is not sufficient for determination of the heritable variation, as it simply measures the extent of genetic variability present for a character. Hence, GCV together with heritability estimates would give the best picture of the advance to be expected by selection. In the present investigation, high heritability estimates were observed for all the characters studied (Table 2). High heritability ranged from 74.270 for number of branches per plant to 99.730 for green pod crude fiber. High heritability values obtained for most of the traits suggested that this might generally be governed by additive gene action and hence the phenotype could provide fairly reliable measure of genotypic effect. Hence, selection could be exercised on the phenotypic performance. Higher estimates of genetic advance (≥ 40%) as percent of mean were observed for 9 traits out of 15 (Table 2). Moderate genetic advance as percentage mean was observed for the rests. Heritability estimates in broad sense alone do not serve as the true indicator of genetic potentiality of the genotypes since the scope is restricted by their interaction with environment. High heritability coupled with high genetic advance as percent of mean was observed for 9 traits viz., percent of pod set, number pods per cluster, number pods per plant, green pod length, green pod width, individual green pod weight, green pod crude protein, green pod crude fiber and pod yield per plant. These traits have also high GCV. This indicates the presence of additive genes and consequently there is an ample scope of improving these characters by simple selection. High heritability coupled with moderate genetic advance as percent mean was observed for plant height, number of flower per cluster, number of cluster per plant, days to maturity, number of branches per plant and days to 50 percentage of flowering, indicate the presence of dominance and epistatic gene action effects in controlling these characters. Similar trends were observed by Bendale et al. (2004) in lablab bean.
GENETIC VARIABILITY AND CHARACTER ASSOCIATION IN DOLICHOS BEAN 165
(ii) Correlation studies Although variability estimates provide information on the extent of improvement through selection but they do not throw much light on the extent and nature of relationship between the characters which could be utilized for selection following hybridization. The correlation studies revealed higher estimates of genotypic correlation coefficients than their corresponding phenotypic correlation coefficients, suggesting a strong inherent relationship between different traits and that the environmental factors had not played much role in expression of the phenotypic. Genotypic correlation coefficient for yield and quality traits
The genotypic correlation of pod yield with yield components revealed that the pod yield per plant was positively and significantly associated with green pod width, number of flowers per cluster, pod length and individual green pod weight (Table 3). It implied that these characters strongly influenced the pod yield per plant. Percent of pod set and number of pods per plant exhibited non- significant positive correlation with pod yield. A similar trend was reported by Ali et al. (2005) and Roy et al. (2006).
Negative correlation was observed for days to 50 percent flowering and days to maturity. This association indicated that these characters shall be taken into consideration for improvement of dolichos bean crop for earliness. Significant negative correlation of other characters with green pod yield implied that there was a little scope for consideration of these characters for the improvement of green pod yield in dolichos bean. Based on the above discussion, it could be inferred that the most important pod characters such as green pod length, number of flowers per cluster, green pod width and individual green pod weight may be considered for intentional selection in simultaneous improvement on pod yield per plant. In addition to these characters, percentage of pod set and number of pods per plant can also be taken into consideration for improvement on pod yield. The parameters such as days to 50 percent flowering and days to maturity were negatively correlated with yield and hence these characters could be considered for earliness.
In the inter correlation among the components characters, plant height was significantly and positively correlated with days to 50 percent flowering and days to maturity. This result indicated that increase in plant height caused late flowering and consequently the maturity was also delayed. The percentage of pod set was positively correlated with number of pods per cluster and number of pods per plant. These results clearly indicated that the percentage of pod set is one most important trait for increasing the production of more number of pods per plant. However, increased percentage of pod set and increased number of pods per cluster as well as number of pods per plant were negatively correlated with green pod length, green pod width and individual green pod weight. The length of pod had positive association with green pod width and individual green pod weight. Therefore, knowledge on the inter correlation association of component traits with pod yield per plant will help making selection more precise and accurate.
166 V. Magalingam et al
Phenotypic correlation coefficient for yield and quality traits In the present investigation the phenotypic correlation coefficients also showed
similar trend as exhibited by genotypic correlation wherein the green pod width had strong positive correlation with yield. In addition, the green pod width, green pod length, number of flowers per cluster, number of pods per plant and percent pod set had direct positive effect on yield (Table 3). It indicated that these characters can be considered for selection in the improvement of pod yield per plant. Similarly, the inter correlation among components traits, the flower characters as well as pod traits were inter associated among themselves.
From the above discussion it may be concluded that the most important traits viz., green pod length, green pod width, number of flowers per cluster and individual green pod weight were found to be positively and significantly correlated both at genotypic and phenotypic levels, indicating that these traits may be considered as very important in selection and any improvement in these four characters would bring about an enhancement in yield. For earliness, parameters such as days to 50 percent flowering and days to maturity may be taken into consideration. It is also suggested that hybridization of genotypes possessing combination of such characters will be useful for obtaining desirable segregants. Similar reports were reported by Sonali et al. (2009) in pea. (iii) Path analysis
Selection of superior genotypes based on yield as such may not be effective for the enhancement of yield and hence selection should be made for component traits as well. Association of yield components thus assumes a unique prominence as the basis for selecting desirable genotypes with high yield potential. In addition, knowledge on presence of association among component characters reveals that some of them may serve as indicators of yield. In the present study, the path analysis reveals that individual green pod weight exhibited very high direct positive effect (3.72) on pod yield per plant. In addition, percent pod set, number of clusters per plant, pods per plant and flowers per cluster and days to 50 percent flowering also showed very high direct positive effect on pod yield (Table 4). This indicated that these characters played an important role in increasing the pod yield. Therefore, the direct selection of these characters may about bring an overall improvement in pod yield. These findings were in agreement with the results reported Desai et al. (2003) in dolichos bean, where the number of branches per plant, green pod crude protein showed high and direct positive effects respectively on pod yield.
The days to maturity, pod length, plant height, green pod width and number of pods per cluster had negatively direct effect on yield per plant. The residual effect determines how best the causal factor accounts for the variability of the dependent factor that is yield per plant in this study. In the present investigation the residual effect of path coefficient analysis was 0.1519, which clearly indicated that the 15 characters taken for this investigation were sufficient for genetic analysis in dolichos
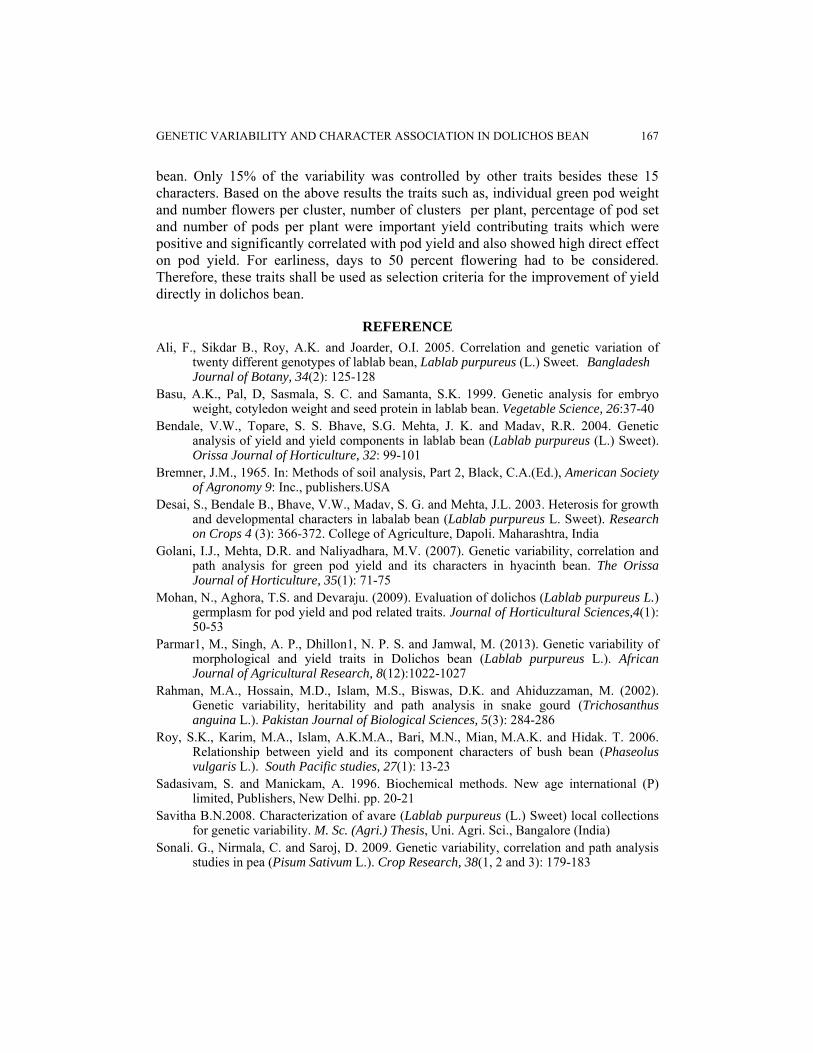
GENETIC VARIABILITY AND CHARACTER ASSOCIATION IN DOLICHOS BEAN 167
bean. Only 15% of the variability was controlled by other traits besides these 15 characters. Based on the above results the traits such as, individual green pod weight and number flowers per cluster, number of clusters per plant, percentage of pod set and number of pods per plant were important yield contributing traits which were positive and significantly correlated with pod yield and also showed high direct effect on pod yield. For earliness, days to 50 percent flowering had to be considered. Therefore, these traits shall be used as selection criteria for the improvement of yield directly in dolichos bean.
REFERENCE Ali, F., Sikdar B., Roy, A.K. and Joarder, O.I. 2005. Correlation and genetic variation of
twenty different genotypes of lablab bean, Lablab purpureus (L.) Sweet. Bangladesh Journal of Botany, 34(2): 125-128
Basu, A.K., Pal, D, Sasmala, S. C. and Samanta, S.K. 1999. Genetic analysis for embryo weight, cotyledon weight and seed protein in lablab bean. Vegetable Science, 26:37-40
Bendale, V.W., Topare, S. S. Bhave, S.G. Mehta, J. K. and Madav, R.R. 2004. Genetic analysis of yield and yield components in lablab bean (Lablab purpureus (L.) Sweet). Orissa Journal of Horticulture, 32: 99-101
Bremner, J.M., 1965. In: Methods of soil analysis, Part 2, Black, C.A.(Ed.), American Society of Agronomy 9: Inc., publishers.USA
Desai, S., Bendale B., Bhave, V.W., Madav, S. G. and Mehta, J.L. 2003. Heterosis for growth and developmental characters in labalab bean (Lablab purpureus L. Sweet). Research on Crops 4 (3): 366-372. College of Agriculture, Dapoli. Maharashtra, India
Golani, I.J., Mehta, D.R. and Naliyadhara, M.V. (2007). Genetic variability, correlation and path analysis for green pod yield and its characters in hyacinth bean. The Orissa Journal of Horticulture, 35(1): 71-75
Mohan, N., Aghora, T.S. and Devaraju. (2009). Evaluation of dolichos (Lablab purpureus L.) germplasm for pod yield and pod related traits. Journal of Horticultural Sciences,4(1): 50-53
Parmar1, M., Singh, A. P., Dhillon1, N. P. S. and Jamwal, M. (2013). Genetic variability of morphological and yield traits in Dolichos bean (Lablab purpureus L.). African Journal of Agricultural Research, 8(12):1022-1027
Rahman, M.A., Hossain, M.D., Islam, M.S., Biswas, D.K. and Ahiduzzaman, M. (2002). Genetic variability, heritability and path analysis in snake gourd (Trichosanthus anguina L.). Pakistan Journal of Biological Sciences, 5(3): 284-286
Roy, S.K., Karim, M.A., Islam, A.K.M.A., Bari, M.N., Mian, M.A.K. and Hidak. T. 2006.
Relationship between yield and its component characters of bush bean (Phaseolus vulgaris L.). South Pacific studies, 27(1): 13-23
Sadasivam, S. and Manickam, A. 1996. Biochemical methods. New age international (P) limited, Publishers, New Delhi. pp. 20-21
Savitha B.N.2008. Characterization of avare (Lablab purpureus (L.) Sweet) local collections for genetic variability. M. Sc. (Agri.) Thesis, Uni. Agri. Sci., Bangalore (India)
Sonali. G., Nirmala, C. and Saroj, D. 2009. Genetic variability, correlation and path analysis studies in pea (Pisum Sativum L.). Crop Research, 38(1, 2 and 3): 179-183

168 V. Magalingam et al
Table 1: Sources of Dolichos bean S.
No. Genotype designation used in text and tables Accession name Source
1 DB1 Dolichos Diana Ashoka Seeds Private Limited, Bangalore
2 DB2 Dolichos Nandini Prabhakar Seeds Private Limited, Bangalore
3 DB3 PHS Dhoni Prabhakar Seeds Private Limited, Bangalore
4 DB4 Rohini Rasi Seeds Private Limited, Salem 5 DB5 Ankur Goldy Ankur Seeds Private Limited, Nagpur 6 DB6 Konkan Dr. Balasheb Sawant Konkan Krishi
Vidyapeeth, Dapoli , Maharashtra 7 DB7 Dolichos Ruchi Indosun Agri Genetics Private
Limited, Hyderabad 8 DB8 Dolichos Nandi Aditya Seeds Private Limited,
Bangalore 9 DB9 Arka Jay Indian Institute of Horticultural
Research, Bangalore 10 DB10 Arka Vijay Indian Institute of Horticultural
Research, Bangalore 11 DB11 COGB -14 Tamil Nadu Agricultural University,
Coimbatore 12 DB12 Dolichos Senthil Senthil Seeds & Company Private
Limited, Bangalore 13 DB13 PHS Dolichos Prabhakar Seeds Private Limited,
Bangalore 14 DB14 Kumbakonam local Kumbakonam, Tamil Nadu 15 DB15 Madagadipet local Pondicherry 16 DB16 Ottanchathiram local Tamil Nadu 17 DB17 IC 354334 National Bureau of Plant Genetic
Resources, New Delhi. 18 DB18 IC 354336 National Bureau of Plant Genetic
Resources, New Delhi. 19 DB19 IC 354337 National Bureau of Plant Genetic
Resources, New Delhi. 20 DB20 Lakshmi Super Seeds Private Limited,
Hyderabad 21 DB21 Gold 24 Sun Star Seeds Private Limited,
Hyderabad 22 DB22 Dolli Rasi Seeds Private Limited, Haryana 23 DB23 Theni local Tamil Nadu

Table 2: Estimation of variability parameters for dolichos bean genotypes
SI. No Character
Phenotypic variance
(PV)
Genotypic Variance
(GV)
Phenotypic coefficient of variation (PCV %)
Genetic coefficient of variation (GCV %)
Heritability Genetic advance
Genetic advance as percent of
mean
1 Plant height 241.019 214.472 16.332 15.407 88.990 28.459 29.939
2 Number of branches per plant
0.648 0.481 12.811 11.041 74.270 1.232 19.602
3 Days to 50% flowering 16.130 15.741 8.180 8.081 97.590 8.074 16.445
4 Number of flowers per cluster
11.967 8.930 16.942 14.635 74.620 5.318 26.043
5 Number of clusters per plant
1.806 1.568 14.517 13.527 86.830 2.404 25.966
6 Percent pod set 42.264 33.011 31.049 27.440 78.110 10.460 49.958
7 Days to maturity 38.304 38.078 11.312 11.279 99.410 12.674 23.166
8 Number pods per cluster 5.318 4.911 29.656 28.498 92.350 4.387 56.416
9 Number pods per plant 83.499 72.614 24.008 22.389 86.960 16.370 43.010
10 Green pod length 2.779 2.626 21.475 20.876 94.500 3.245 41.805
11 Green pod width 0.203 0185 25.764 24.569 90.940 0.845 48.263
12 Individual green pod weight
1.325 1.260 28.720 28.007 95.100 2.255 56.264
13 Green pod crude protein 4.313 4.258 23.102 22.954 98.730 4.224 46.985
14 Green pod crude fiber 8.43 8.411 39.646 39.593 99.730 5.966 81.453
15 Pod yield per plant 827.571 797.648 20.373 20.002 96.380 57.118 40.452
Variability in field bean
Table 3: Genotypic correlation coefficient for different characters of dolichos bean 2 3 4 5 6 7 8 9 10 11 12 13 14 15
1 0.049 0.488* -0.222 0.130 -0.274 0.148* -0.352 -0.408* 0.274 0.277 0.331 0.290 0.008 -0.163 1a 0.025 0.454* -0.147 0.094 -0.234 0.393 -0.303 -0.352 0.225 0.260 0.294 0.284 0.005 -0.139 2 -0.278 -0.213 0.063 -0.098 -0.361 0.076 -0.190 -0.160 -0.010 -0.056 -0.133 0.245 -0.262 2a -0.241 -0.169 0.018 -0.061 -0.306 0.051 -0.171 0.119 -0.025 -0.050 -0.126 0.213 -0.225 3 -0.144 0.014 0.140 0.944** 0.147 0.010 0.229 -0.286 -0.201 0.504* 0.143 -0.343 3a -0.107 0.027 0.114 0.927** 0.151 0.014 -0.215 -0.255 -0.191 0.494* 0.138 -0.332 4 0.065 -0.311 -0.047 -0.074 0.165 -0.185 0.316 -0.033 -0.154 -0.280 0.416* 4a 0.071 -0.421* -0.039 -0.073 0.111 -0.117 0.307 -0.007 -0.139 -0.241 0.357 5 -0.452 0.086 0.254 0.045 -0.228 -0.307 -0.301 0.162 -0.248 -0.523** 5a -0.420* 0.083 0.255 0.070 -0.211 -0.268 -273 0.151 -0.232 -0.459* 6 0.051 0.513* 0.750** -0.349 -0.425* -0.561** -0.090 0.266 0.150 6a 0.044 0.468* 0.702** -0.331 -0.370 -0.541** -0.077 0.233 0.132 7 0.083 0.046 -0.241 -0.261 -0.163 0.487* 0.017 -0.285 7a 0.079 0.043 -0.235 -0.252 -0.159 0.482* 0.017 -0.277 8 0.681** -0.734** -0.730** -0.854** 0.042 0.332 -0.404* 8a 0.661** -0.685** -0.654** -0.819** 0.047 0.315 -0.361 9 -0.677** -0.525** -0.821** -0.106 0.004 0.126 9a -0.620** -0.453* -0.811** -0.099 0.002 0.146 10 0.613** 0.835** -0.092 -0.149 0.409* 10a 0.589** 0.806** -0.089 -0.186 0.390 11 0.763** -0.287 -0.243 0.520**
11a 0.711** -0.277 -0.234 0.489*
12 -0.160 -0.224 0.406*
12a -0.155 -0.216 0.385
13 0.190 -0.304
13a 0.188 -0.298
14 -0.302 14a -0.297
*, ** Significant at 5 and 1% levels. ‘a’ denotes phenotypic correlation co-efficients. 1 = Plant height, 2 = Number of branches per plant, 3= Days to 50%age flowering, 4 = Number of flowers per cluster, 5 = Number of cluster per plant, 6 = Percent pod set, 7 = Days to maturity, 8 = Number of pods per cluster, 9 = Number of pods per plant, 10 = Green pod length, 11 = Green pod width, 12 = Individual green pod weight, 13 = Green pod crude protein, 14 = Green pod crude fiber, 15 = Pod yield per plant.

Table 4. Path coefficient for direct and indirect effects of different traits 1 2 3 4 5 6 7 8 9 10 11 12 13 14 15
1 -0.5017 0.0321 0.5871 -0.2256 0.1479 -0.4994 -0.4426 0.0830 -0.4582 -0.2089 -0.0671 1.2318 0.1579 0.0005 -0.163
2 -0.0246 0.6547 -0.3348 -0.2164 0.0721 -0.1789 0.3817 -0.0180 -0.2133 -0.1220 0.0023 -0.2090 -0.0723 0.0163 -0.262
3 -0.2448 -0.1822 1.2030 -0.1469 0.0161 0.2559 -0.9996 -0.0346 0.0116 0.1741 0.0693 -0.7492 0.2747 0.0095 -0.343
4 0.1113 -0.1393 -0.1737 1.0174 0.0741 -0.5673 0.0492 0.0174 0.1854 0.1412 -0.0766 -0.1209 -0.0838 -0.0186 0.416*
5 -0.0650 0.0414 0.0170 0.0661 1.1406 -0.8250 -0.0910 -0.0600 0.0507 0.1739 0.0744 -1.1180 0.0885 -0.0165 -0.523**
6 0.1373 -0.0642 0.1687 -0.3164 -0.5157 1.8245 -0.0544 -0.1210 0.8411 0.2656 0.1030 -2.0870 -0.0492 0.0177 0.150
7 -0.2098 -0.2361 1.1362 -0.0473 0.0981 0.0938 -1.0584 -0.0197 0.0511 0.1840 0.0631 -0.6072 0.2656 0.0011 -0.285
8 0.1765 0.0498 0.1764 -0.0750 0.2902 0.9354 -0.0882 -0.2359 0.7643 0.5592 0.1769 -3.1782 0.0228 0.0221 -0.404*
9 0.2048 -0.1244 0.0124 0.1681 0.0516 1.3675 -0.0482 -0.1607 1.1222 0.5160 0.1271 -3.0526 -0.0578 0.0003 0.126
10 -0.1375 0.1048 -0.2749 -0.1885 0-0.2602 -0.6359 0.2556 0.1731 -0.7598 -0.7621 -0.1485 3.1053 -0.0499 -0.0129 0.409*
11 -0.1389 -0.0062 -0.3442 0.3217 -0.3505 -0.7758 0.2759 0.1722 -0.5887 -0.4671 -0.2422 2.8366 -0.1564 -0.0162 0.520**
12 -0.1661 -0.0368 -0.2423 -0.0331 -0.3428 -1.0236 0.1728 0.2016 -0.9209 -0.6362 -0.1847 3.7200 -0.0873 0.0149 0.406*
13 -0.1453 -0.0868 0.6060 -0.1563 0.1852 -0.1647 -0.5156 -0.0099 -0.1190 0.0698 0.0695 -0.5954 0.5453 0.0127 -0.304
14 -0.0039 0.1602 0.1714 -0.2850 -0.2828 0.4854 -0.0178 -0.0783 0.0042 0.1476 0.0588 -0.8323 0.1036 0.0666 -0.302
** Significant at 1% level * Significant at 5% level 1 = Plant height, 2 = Number of branches per plant, 3= Days to 50%age flowering, 4 = Number of flowers per cluster, 5 = Number of cluster per plant, 6 = Percent pod set, 7 = Days to maturity, 8 = Number of pods per cluster, 9 = Number of pods per plant, 10 = Green pod length, 11 = Green pod width, 12 = Individual green pod weight, 13 = Green pod crude protein, 14 = Green pod crude fiber, 15 = Pod yield per plant.

SAARC J. Agri., 11(2): 173-181 (2013)
Short Note INTEGRATED NUTRIENT MANAGEMENT ON
PRODUCTIVITY OF CARROT AND FERTILITY OF SOIL
Vithwel and S. P. Kanaujia* Department of Horticulture, SASRD, Nagaland University, Medziphema-797106, India
Carrot (Daucus carota L.) belongs to the family umbelliferae and is an important root vegetable grown throughout the world. Among various factors responsible for low production of carrot, nutrient management is of prime importance for maintaining higher yield and soil fertility. It has been reported that neither the chemical fertilizer alone nor the organic manure are able to sustain the crop productivity and soil fertility. The increasing use of chemical fertilizers to increase vegetable production has been widely recognized but its long run impact on soil health, ecology and other natural resources are detrimental which affect living organisms including beneficial soil microorganism and human being. The escalating prices of chemical fertilizers and its detrimental impact on the soil, environment and human health urged the farmer to adoption of integrated plant nutrient that offers the sustainable crop production and soil fertility (Sentiyangla et al., 2010). Besides fertilizers, there are several sources of plant nutrients like organic manures, biofertilizers etc. These nutrients sources not only reduce quantity of chemical fertilizers but also improve soil fertility (Chumyani et al., 2012). Use of organic manures in INM help mitigating multiple nutrient deficiencies. Application of organic manures to acidic soil reduces the soluble and exchangeable Al temporarily by forming complex and provides better environment for growth and development in addition to improvement in physical, chemical and biological properties of soil (Avitoli et al., 2012). Biofertilizers have also emerged as promising components of nutrient supply system. Application of biofertilizers which is environment friendly and low cost input, with organic and inorganic fertilizers as part of an integrated nutrient management strategy and play significant role in plant nutrition.
A field experiment was conducted during 2011 - 2012 at the Experimental Farm of SASRD, Medziphema campus, Nagaland University, Nagaland. The field is located at the altitude of 304.8 m above mean sea level with geographical location at 20º 45' 43'' N latitude and 93 º 53' 04'' E longitudes. The soil of the experimental site was sandy loam having soil pH 4.4, organic carbon 1.60 % and available N, P and K content of 305.76, 17.00 and 225.25 kg ha-1 respectively. The experiment was laid out in a randomized block design with three replications. Plot size measured 1.8 m x * Corresponding author e mail: [email protected] Received: 23.06.2013

174 Vithwel and S. P. Kanaujia
1.8 m and spacing was maintained at 30 x 10 cm. Seeds were sown on 5 October, 2011 and thinning was done 10 days after sowing to maintain spacing. The treatments consisted of T1 - Control, T2 - FYM @ 20 t ha-1, T3 - Pig manure @ 15 t ha-1, T4 - Vermicompost @ 5 t ha-1, T5 - 100% recommended dose of NPK (80:40:40 kg ha-1), T6 -50% NPK + 50% FYM, T7 - 50% NPK + 50% Pig manure, T8 - 50% NPK + 50% Vermicompost, T9 - 50% NPK + 50% FYM + Biofertilizers, T10 - 50% NPK + 50% Pig manure + Biofertilizers, T11 - 50% NPK + 50% Vermicompost + Biofertilizers. N, P and K were given through Urea, SSP and MOP respectively. Full dose of P and K and half dose of N were applied at the time of transplanting and remaining half dose of N was given 45 days after transplanting. Manures viz., FYM, pig manure and vermicompost were incorporated as per treatment to respective plots prior to transplanting. Biofertilizers (Azospirillum and Phosphotika) were inoculated to seeds prior to sowing as seed treatment methods @ 500 g ha-1 each. Observations on plant height, number of leaves, root length, root diameter, root weight, root yield and carotene content were recorded at harvesting. Carotene content was determined by spectrophotometer method (Rangama, 1977) and expressed in mg 100 -1g.
Soil samples were collected before and after harvest of crop from different locations of the experimental plot to a depth of 15 cm with the help of screw type auger. The collected soil samples were mixed and reduced to 500 g, dried under shade and ground to pass 2 mm sieve. Soil samples were analysed for pH, organic carbon, available nitrogen, phosphorus and potassium which were determined by Digital pH meter, Walkley and Black Rapid titration method, Alkaline potassium permanganate method, Olsen’s method, flame photometer method, respectively (Jackson, 1973). Statistical analysis was carried out as per standard procedure.
Economics of the treatments were calculated as per prevailing market price of input and output. Gross income was calculated by yield multiplied with whole sale rate of carrot (Rs. 10000 t-1). Net income was estimated by deducting the total cost of cultivation (fixed cost + treatment cost) from gross income of the particular treatment. Cost-benefit ratio was worked out by dividing net return from total cost of cultivation.
Improvement in growth characters is considered to be a pre-requisite to increase the yield. NPK fertilizers with different organic manures along with biofertilizers alone or in combination were found to have significant effect on growth characters as compared to control (Table-1). All the treatments were found effective in increasing the plant growth over control. Application of 50% NPK + 50% FYM + biofertilzers (T9) recorded maximum plant height (25.00 cm) and number of leaves (6.98). The lowest values of plant height and number of leaves were recorded with control. The increase in vegetative growth might be due to the role of nitrogen in promoting vegetative growth and enhancing cell division and elongation as well as greater chlorophyll synthesis, phosphorus is easily mobilized in the plant and translocated to the meristematic zone and increase the activity of leaf formation and

PRODUCTIVITY OF CARROT AND FERTILITY OF SOIL 175
175
development in carrot and potassium activates many enzymes involved in respiration and photosynthesis. The added FYM in integrated nutrient management would have improved the physical, chemical and biological properties of soil which helps better nutrient absorption and utilization by plant resulting better plant growth. Rani et al. (2006) reported that application of neem cake and castor cake in combination with half the recommended dose of NPK recorded maximum growth characters in carrot. Sentiyangla et al. (2010) reported significant increase in plant height and number of leaves in radish when applied integrated application of chemical fertilizers, organic manures and biofertilizers (50% NPK + 50% FYM + biofertilizers). Subenthung et al. (2012) reported that combined application of 50% Pig manure + 50% NPK recorded maximum plant height (50.16 cm) and number of leaves (14.43), leaf area (185.86 cm2) and root yield (522.51 t ha-1) in turnip. These results are in conformity with the finding of Chumyani et al., 2012 in tomato and Vimera et al., 2012 in king chilli, they found that maximum growth characters with 50% NPK + 50% FYM + biofertilizers.
Integrated application of chemical fertilizers, organic manures and biofertilizers alone or in combination significantly increased the yield and yield attributing characters of carrot compared to control (Table-1). Application of 50 % NPK + 50 % FYM + biofertilizers (T9) recorded maximum values of all yield attributing characters such as root length (18.88 cm), root diameter (4.14 cm), root weight (90.37 g). This result indicates positive effects of integrating NPK with manures as well as biofertilizers. Integrated application of organic manure and inorganic fertilizer increased the availability of NPK and also improved the fertility status of soil and productivity due to which yield attributing characters might have increased. Besides NPK, micronutrients might have played an important role in increasing the yield attributing characters of carrot as addition of FYM increased the availability of micronutrients. Also, biofertilizers might have played a vital role in increasing the yield and yield related attributes. Root yield per hectare was recorded highest (30.88 t) in the treatment combination of 50% NPK + 50% FYM + Biofertilizers (T9) which was significantly superior over other treatment except T10 (50% NPK + 50% Pig manure + Biofertilizers) and minimum root yield was rcorded in control. Application of 50% NPK + 50% FYM + Biofertilizers produced 15% higher yield over 100% recommended doze of NPK. This might be due to corresponding response to increased growth and yield attributing characters attained previously under this treatment. Sagiv et al. (1994) reported that highest yield was obtained in carrot when organic manure, composted refuses and N fertilization was applied in combination. Rani et al. (2006) reported that application of neem cake and castor cake in combination with half the recommended dose of NPK recorded maximum root yield (25.860 t ha -1) in carrot. Sentiyangla et al. (2010) observed maximum yield in radish by combination of NPK, FYM and biofrtilizers. Subenthung et al. (2012) observed that maximum root yield was obtained in the combined application of 50% pig manure + 50% NPK in turnip. Similarly Chumyani

176 Vithwel and S. P. Kanaujia
et al. (2012) and Vimera et al. (2012) also conducted an experiment on integrated nutrient management and found that 50% NPK + 50% FYM + Biofertilizers recorded maximum yield in tomato and king chilli, respectively.
Quality of carrot is usually evaluated by carotene content. Various organic manures, inorganic fertilizers and biofertilizers and their combination had a beneficial impact on carotene content in roots. It is evident from table-1 that maximum carotene (3.41 mg 100-1g) was recorded with 50 % NPK + 50 % FYM + biofertilizers (T9). The comparative higher level of carotene might be due to the action of specific soil nutrients which might be made more readily available into the soil for plant absorption as a result of mineral fertilizer + lone organic manure ‘or’ with biofertilizers integration effect which might have activated specific enzymes for the synthesis of carotene in carrot. Nakagawa et al. (2003) reported that carotene content in roots was increased by application of organic fertilizers. Rani et al. (2006) reported that application of neem cake and castor cake in combination with half the recommended dose of NPK recorded highest carotene content (3.96 mg 100-1 g) in carrot. Sunandarani and Malareddy (2007) reported that Neem cake + 50% RD of NPK gave the highest carotene content (4.60 mg 100-1 g) in carrot.
Sustainability of a cropping system is being evaluated on the basis of crop yield as well as nutrient status of the soil after harvest of the crop. Different treatments alone and their combination with biofertilizers showed profound residual effect on soil fertility after harvest. However, their intensity varied considerably because of quantum variation (Table-2). Maximum available nitrogen (314.92 kg ha-
1), phosphorous (19.59 kg ha-1) and potassium (250.42 kg ha-1) was recorded with treatment 100% NPK (T5) which was found at par with 50% NPK + 50% FYM + Biofertilizers (T9), 50% NPK + 50% Pig manure + Biofertilizers (T10), 50% NPK + 50% Vermicompost + Biofertilizers (T11). Maximum available nitrogen phosphorous and potassium in treatment 100% NPK might be due to poor soil physical structure, lack of organic manures and microbial activities, thus resulting in poor utilization of NPK by plants. As such the applied NPK could bring about higher residual NPK in soil after harvest. Similar result was also reported by Vimera et al. (2012) who reported that application of 100% NPK fertilizers alone recorded maximum available NPK in soil after harvest in king chilli. Organic carbon of soil acts as a sink and source of nutrients for microbial population, which regulates the availability of different nutrients through microbial transformation. The net increase in organic carbon was much higher with organic manures in combination with biofertilizers and fertilizers over 100% NPK alone. Application of 50% NPK + 50 % FYM + biofertilizers (T9) recorded maximum organic carbon (1.85 %) and soil pH (4.65) after harvest. Application of 50% NPK + 50 % FYM + biofertilizers recorded 16 % higher organic carbon over 100% NPK alone. This might be due to increased microbial activities in the root zone which decomposed organic manures and also fixed unavailable form of mineral nutrients into available forms in soil thereby substantiated crop requirements and improved organic carbon level and stabilized
PRODUCTIVITY OF CARROT AND FERTILITY OF SOIL 177
177
soil pH. Chaudhary et al. (2005) reported that the incorporation of biofertilizers and FYM with inorganic fertilizers significantly improved the organic carbon content and pH of the soil in tomato. Similar results were also reported by Chumyani et al. (2012) in tomato who found maximum organic carbon and soil pH under treatment of 50% NPK + 50 % FYM + biofertilizers.
It is evident from table-3 that the integration of 50% NPK + 50 % FYM + biofertilizers (T9) was found to be the most profitable treatment in carrot exhibiting highest net return Rs. 2,36,193 with cost benefit ratio of 1:3.65 followed by Rs. 2,21,723 with the application of 50% NPK + 50% Pig manure + Biofertilizers (T10). The reason of high profitability in these two modes of integration can be due to lower cost of inputs and higher yield. Similar results were also reported by Chumyani et al. (2012) in tomato and Vimera et al. (2012) in king chilli. They found highest net return with the combined application of 50% NPK + 50% FYM + Biofertilizers.
It can be concluded from the experiment that integrated application of 50% NPK + 50% FYM + Biofertilizers was found optimum for getting maximum productivity of carrot without reducing fertility status of soil. This treatment reduced 50% chemical fertilizers without any compromise on yield of carrot and fertility of soil. Therefore, 50% NPK + 50% FYM + Biofertilizers may be recommended for sustainable yield of carrot and to nourish the soil fertility under foothills condition of Nagaland.
REFERENCES Avitoli, K., Singh, A. K., Kanaujia, S.P. and Singh, V. B. 2012. Quality production of kharif
onion (Allium cepa L.) in response to biofertilizers inoculated organic manures. Indian Journal of Agricultural Science, 82: 236-40
Chumyani, Kanaujia, S.P., Singh, A. K., and Singh, V. B. 2012. Effect of integrated nutrient management on growth, yield and quality of tomato (Lycopersicon esculentum mill.) Journal of Soil and Crops, 22: 5-9
Chaudhary, M.R., Talukdar, N.C., and Saikia, A. 2005. Changes in organic carbon, available N, P2O5 and K2O under integrated use of organic manures, biofertilizers and inorganic fertilizer on sustaining productivity of tomato and fertility of soil. Research on Crops, 6: 547-550
Jackson, M.L. 1973. Soil Chemical Analysis. Prentice Hall of India Pvt. Ltd., New Delhi Nakagawa, S., Tamura, E., Yamamoto, H., Yoshida, K. and Yoshimoto, T. 2003. Quality
comparisions of carrot (Daucus carota L.) fertilized organically or chemically, with differences in growth eliminated. Japanese Journal of Soil Science and Plant Nutrition, 74: 45 – 53
Panse, V.G. and Sukhatme, P.V. 1978. Statistical Methods for Agricultural Workers. ICAR, New Delhi
Rangana, S. 1977. Manual for analysis of fruit and vegetable products. Tata McGraw Hill Co. Pvt. Ld., New Delhi
178 Vithwel and S. P. Kanaujia
Rani, N.S., Syed and Reddy, Y.N. 2006. Effect of cropping situations and Integrated Nutrient Management practices on growth, yield, quality and economics of growing carrot in ber-based cropping system. Indian Journal of Dryland Agricultural Research and Development, 21: 136 – 140
Sagiv, B., Hadas, A. and Bar-Yoref, B.1994. Influence of organic manure, compost refuse and N fertilization and their combination in carrot var. Nantes. Hassadeh, 74: 631 – 634
Sentiyangla, Kanaujia, S. P., Singh, V. B. and Singh, A. K. 2010. INM for quality production of radish (Raphanus sativus L) in acid Alfisol. Journals of Soils and Crops, 20 (1): 1-9
Subenthung, Y., Singh, V.B., Kannaujia, S.P and Singh A.K. 2012. Effect of integrated nutrient management on growth, yield and nutrient uptake by turnip (Brassica rapa L.) cv.Pusa Sweti and their economics. Journal of Soil and Crops, 22(1): 1-9
Sunandarani, N. and Mallareddy, K. 2007. Effect of different organic manures and inorganic fertilizers on growth, yield and quality of carrot (Daucus carota L.). Karnataka Journal of Agricultural Sciences, 20(3): 686-688
Vimera, K., Kanaujia, S.P., Singh, V.B. and Singh, P.K. 2012. Effect of integrated nutrient management on growth and yield of king chilli under foothill condition of Nagaland. Journal of Indian Society of Soil Science, 60: 45-49
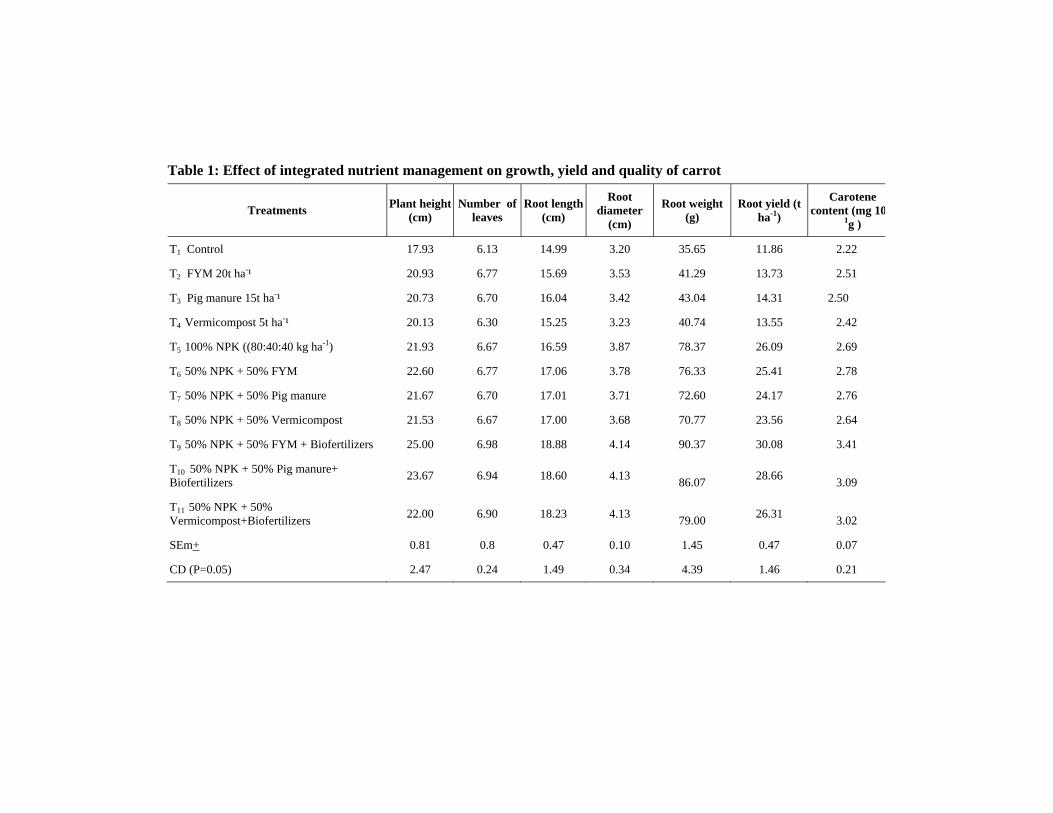
Table 1: Effect of integrated nutrient management on growth, yield and quality of carrot
Treatments Plant height (cm)
Number of leaves
Root length (cm)
Root diameter
(cm)
Root weight (g)
Root yield (t ha-1)
Carotene content (mg 10
1g )
T1 Control 17.93 6.13 14.99 3.20 35.65 11.86 2.22
T2 FYM 20t ha-¹ 20.93 6.77 15.69 3.53 41.29 13.73 2.51
T3 Pig manure 15t ha-¹ 20.73 6.70 16.04 3.42 43.04 14.31 2.50
T4 Vermicompost 5t ha-¹ 20.13 6.30 15.25 3.23 40.74 13.55 2.42
T5 100% NPK ((80:40:40 kg ha-1) 21.93 6.67 16.59 3.87 78.37 26.09 2.69
T6 50% NPK + 50% FYM 22.60 6.77 17.06 3.78 76.33 25.41 2.78
T7 50% NPK + 50% Pig manure 21.67 6.70 17.01 3.71 72.60 24.17 2.76
T8 50% NPK + 50% Vermicompost 21.53 6.67 17.00 3.68 70.77 23.56 2.64
T9 50% NPK + 50% FYM + Biofertilizers 25.00 6.98 18.88 4.14 90.37 30.08 3.41
T10 50% NPK + 50% Pig manure+ Biofertilizers 23.67 6.94 18.60 4.13 86.07 28.66 3.09
T11 50% NPK + 50% Vermicompost+Biofertilizers 22.00 6.90 18.23 4.13 79.00 26.31 3.02
SEm+ 0.81 0.8 0.47 0.10 1.45 0.47 0.07
CD (P=0.05) 2.47 0.24 1.49 0.34 4.39 1.46 0.21
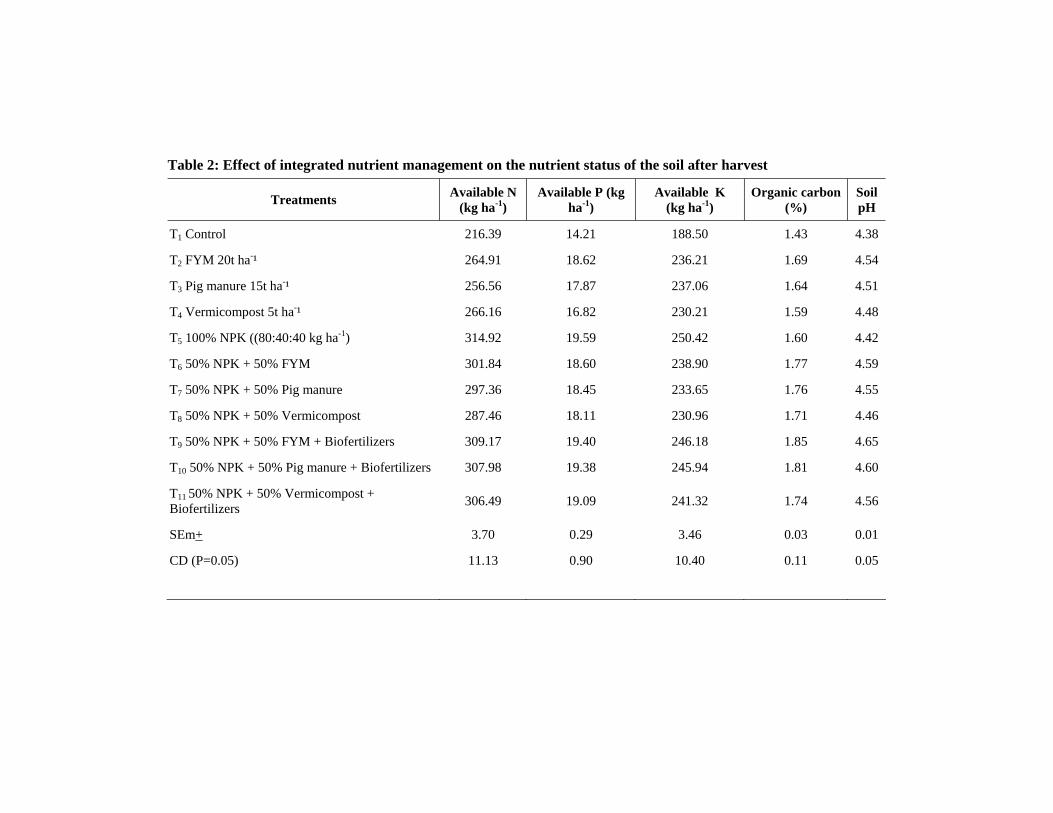
Table 2: Effect of integrated nutrient management on the nutrient status of the soil after harvest
Treatments Available N (kg ha-1)
Available P (kg ha-1)
Available K (kg ha-1)
Organic carbon(%)
SoilpH
T1 Control 216.39 14.21 188.50 1.43 4.38
T2 FYM 20t ha-¹ 264.91 18.62 236.21 1.69 4.54
T3 Pig manure 15t ha-¹ 256.56 17.87 237.06 1.64 4.51
T4 Vermicompost 5t ha-¹ 266.16 16.82 230.21 1.59 4.48
T5 100% NPK ((80:40:40 kg ha-1) 314.92 19.59 250.42 1.60 4.42
T6 50% NPK + 50% FYM 301.84 18.60 238.90 1.77 4.59
T7 50% NPK + 50% Pig manure 297.36 18.45 233.65 1.76 4.55
T8 50% NPK + 50% Vermicompost 287.46 18.11 230.96 1.71 4.46
T9 50% NPK + 50% FYM + Biofertilizers 309.17 19.40 246.18 1.85 4.65
T10 50% NPK + 50% Pig manure + Biofertilizers 307.98 19.38 245.94 1.81 4.60
T11 50% NPK + 50% Vermicompost + Biofertilizers 306.49 19.09 241.32 1.74 4.56
SEm+ 3.70 0.29 3.46 0.03 0.01
CD (P=0.05) 11.13 0.90 10.40 0.11 0.05
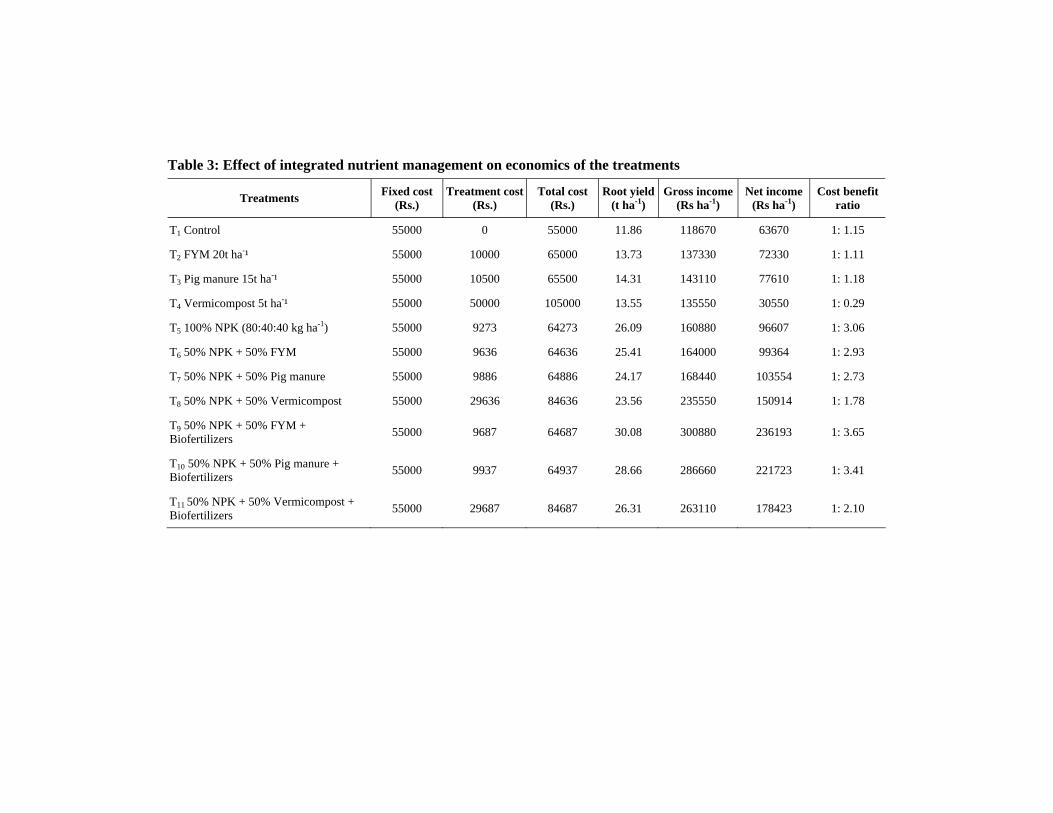
Table 3: Effect of integrated nutrient management on economics of the treatments
Treatments Fixed cost (Rs.)
Treatment cost (Rs.)
Total cost (Rs.)
Root yield (t ha-1)
Gross income (Rs ha-1)
Net income (Rs ha-1)
Cost benefit ratio
T1 Control 55000 0 55000 11.86 118670 63670 1: 1.15
T2 FYM 20t ha-¹ 55000 10000 65000 13.73 137330 72330 1: 1.11
T3 Pig manure 15t ha-¹ 55000 10500 65500 14.31 143110 77610 1: 1.18
T4 Vermicompost 5t ha-¹ 55000 50000 105000 13.55 135550 30550 1: 0.29
T5 100% NPK (80:40:40 kg ha-1) 55000 9273 64273 26.09 160880 96607 1: 3.06
T6 50% NPK + 50% FYM 55000 9636 64636 25.41 164000 99364 1: 2.93
T7 50% NPK + 50% Pig manure 55000 9886 64886 24.17 168440 103554 1: 2.73
T8 50% NPK + 50% Vermicompost 55000 29636 84636 23.56 235550 150914 1: 1.78
T9 50% NPK + 50% FYM + Biofertilizers 55000 9687 64687 30.08 300880 236193 1: 3.65
T10 50% NPK + 50% Pig manure + Biofertilizers 55000 9937 64937 28.66 286660 221723 1: 3.41
T11 50% NPK + 50% Vermicompost + Biofertilizers 55000 29687 84687 26.31 263110 178423 1: 2.10

SAARC J. Agri., 11(2): 183-191 (2013)
Short Note
MORPHOLOGICAL CHARACTERIZATION OF CAULIFLOWER VARIETIES/CULTIVARS USING DUS
CHARACTERS
B. Singh*1, T. Chaubey, Aastik Jha, D.K. Upadhyay and S.D. Pandey Indian Institute of Vegetable Research, Varanasi-221305 (Uttar Pradesh), India
Cauliflower is a cool season crop; it is more exacting in its climatic requirements than most other crops in this family. The plant is extremely sensitive to unfavourable conditions, such as unusually hot weather, drought or too low temperature, which often result in the formation of premature curds. It is monogenomic species whose genomic constitution is C and chromosome number is n=9 belongs to Cruciferae family (Thamburaj and Singh, 2001). The variety attains acceptance when the farmers get genetically pure seed of high standard. For the purpose, each cultivar should be properly defined with suitable descriptors, so as to maintain its identity during seed production through field inspection and certification. In India, Protection of Plant Varieties and Farmer’s Right Act, 2001 (PPVandFRA, 2001) envisages the registration and protection of new and notified/extant plant varieties based on the criteria of Distinctness, Uniformity and Stability (DUS) of morphological characteristics and increasing attention is being paid towards comprehensive plant genetic recourses.
The characterizations of 15 varieties were done to use as reference material for protection of other varieties under PPVand FR Rules, 2003. Therefore, the database of cauliflower varieties generated may be useful for the selection of suitable varieties to be compared against the candidate varieties developed in India as and when required. This investigation may also be helpful to the researchers with respect to breeding of cauliflower varieties for particular traits. Moreover, farmers can also get benefit with regards to selection of suitable varieties of their interest.
The present investigation was carried out for successive three years during Rabi season of 2010 to 2012 to carry out characterization of already released cauliflower varieties at Research Farm, Indian Institute of Vegetable Research, Varanasi, India. The seed materials for the present investigation comprised of 15 varieties i.e Pusa Paushja, Pusa Sharad, Pusa Himjyoti, Pusa Shukti, Pusa Meghna, Pusa Deepali, Kashi Kunwari, Kashi Agahani, CCS-80, Pant Gobhi-3, Pusa Subhra,
* Corresponding author:[email protected] 1Project Coordinator (All India Coordinated Research Project on Vegetable Crops) Received: 30.07.2013

184 B. Singh et al
Pusa Snow Ball-1 PSBK-1, PSB-16 and PSBK-25. The field experiment was laid out in a randomized block design with three replications. Each plot consisted of four rows of 5m length with spacing of 50 cm between rows and 50 cm between plants and all the recommended agronomic practices were followed to raise the good crop. The observations were recorded on 10 plants in each replication at specific stages of crop growth period when the characters under study had full expression. Varieties were evaluated for 28 DUS qualitative and quantitative characters listed in National DUS test guidelines descriptors for cauliflower viz; seedling: anthocyanin colouration of hypocotyl, outer stem (stalk): length (up to insertion of first leaf) , leaf attributes viz; leaf: attitude, length, width, shape, lobe, colour, waxiness, torsion of tip profile of upper side of blade, puckering , crimping near main vein and degree of undulation of margin, curd characteristics viz; curd: initiation (days to 50% of the plants with curd initiation from sowing of seed), covering by inner leaves, polar diameter, equatorial diameter, shape in longitudinal section, doming, colour, knobbing, texture, compactness, anthocyanin colouration at maturity, maturity group, flower: colour, and stalk length (Anonymous, 2009).
The characterization of cauliflower varieties is presented in table-1 and frequency distribution of each descriptor of released varieties along with example varieties is depicted in table-2.
The varieties were classified on the basis of seedling anthocynin pgiment of hypocotyls into two groups i.e. absent and present. Most of the varieties exhibited absent while, snowball group (Pusa Snowball-1, PSBK-1, PSB-16) expressed seedling anthocyanin colouration. Based on outer stem (stalk) length, cauliflower varieties were grouped as short, medium and long. Two varieties namely Pusa Sharad and Pusa Snow Ball-1 expressed medium and 13 varieties showed long stalk length while, none of the varieties depicted short outer stem (stalk) length. As per leaf attitude, three varieties i.e. Pusa Himjyoti, Pusa Snow Ball-1 and PSBK-25 expressed erect while, Pusa Meghna and Kashi Aghrahani showed horizontal and rest 10 varieties showed semi erect type. Leaf length of cauliflower varieties classified into three categories viz; short, medium and long. However, in the present study, only four varieties i.e. Pusa Meghna, Pusa Shukti, PSB-16 and Pusa Sharad had short leaf length, ten varieties showed medium leaf length and other varieties showed long leaf length. Considerable variation was also observed for leaf shape, variety like Pusa Meghna was of narrow elliptic leaf shape while, Pusa Paushja, Pusa Sharad, PSB-1, Pusa Himjyoti, Pant Gobhi-3, PSBK-25, Pusa Deepali and Kashi Agahani were of elliptic type and rest varieties i.e. Pusa Snow Ball K-1, Pusa Shukti, CCH-80, Pusa Subhra, PSB-16 and Kashi Kunwari had broad elliptic type leaf shape. On the basis of leaf lobe, the varieties were classified in two group viz; absent and present. Most of the varieties expressed leaf lobe except Pusa Paushja, Pusa Sharad, Pusa Himjyoti, Pusa Snow Ball-1and Pusa Shukti.

CHARACTERIZATION OF CAULIFLOWER VARIETIES 185
The varieties were also classified on the basis of leaf colour in three groups i.e. light green, dark green and bluish. Most of the varieties were found to have light and dark green leaves except Pusa Paushja which showed as bluish leaf colour. Leaf waxiness was another trait with good variability. On the basis of this character, the varieties were categorized into four groups i.e. absent, light, medium and strong. Waxiness was absent in Pusa Meghna while, Pusa Paushja, CCS-80, Pant Gobhi-3, Pusa Subhra and PSB-16 exhibited medium waxiness. Varieties like Pusa Himjyoti, Pusa Snow Ball-1, Pusa Shukti, PSBK-1 and Pusa Meghna expressed light whereas; Pusa Paushja and PSBK-25 showed strong leaf waxiness. The trait leaf torsion of tip was categorized into four categories namely, absent, weak, medium and strong. Five varieties i.e. Pusa Snow Ball-1, Pusa Shukti, Pusa Meghna, Pusa Deepali and Kashi Kunwari depicted absent, while, 5 varieties expressed weak and rest varieties showed medium torsion of leaf tip. None of the varieties showed strong torsion of leaf tip. On the basis of leaf profile of upper side of blade character, the varieties were classified into three groups i.e. concave, flat and convex. Varieties like, Pusa Snow Ball-1, Pusa Shukti, Pusa Deepali, Kashi Kunwari and Kashi Agahani were of flat type leaf while, Pusa Paushja, Pusa Sharad, Pusa Himjyoti, CCS-80, Pant Gobhi-3 and PSBK-1 showed convex and rest varieties showed concave type leaf. Among the varieties, weak leaf puckering was absent in Pusa Himjyoti, Pusa Snow Ball-1, Pusa Meghna and Kashi Kunwari whereas, Pusa Paushja, Pusa Sharad, CCS-80, Pant Gobhi-3, Pusa Subhra, PSBK-1 and Kashi Agahani expressed medium and Pusa Shukti, PSBK-25 and Pusa Deepali showed strong leaf puckering characters. In the favour of leaf crimping near main vine, the varieties have been grouped into four categories, viz; seven varieties as weak, five as medium and 3 as strong whereas, none of the varieties had no leaf crimping near main vine. On the basis of curd initiation, cauliflower varieties can be classified into three categories viz; early (<75 days), medium (75-100 days), late (>100 days). There are three varieties with early curd initiation e.g. Pusa Meghna, Pusa Deepali and Kashi Kunwari while, 9 varieties i.e. Pusa Himjyoti, Kashi Agahani, Pusa Paushja, Pusa Sharad, Pusa Shukti, CCS-80, Pant Gobhi-3 and Pusa Subhra were in medium group and Pusa Snowball -1, PSBK-1, PSB-16 and PSBK-25 exhibited late curd initiations. Curd covering by inner leaves was another trait with good variability. On the basis of this character, the varieties were grouped into three types viz; not covered, partly covered, and covered. Four varieties (Kashi Kunwari, Pusa Himjyoti, Pusa Deepali and Pusa Meghna) were not covered, whereas, Kashi Agahani Pusa Paushja, Pusa Sharad, Pusa Shukti, CCS-80, Pant Gobhi-3 and Pusa Subhra exhibited partly covered and four (PSBK-1, PSB-16, PSBK-25 and Pusa Snow Ball-1) varieties covered by inner leaves. Based on polar diameter of curd, varieties were classified into 3 groups viz; small (<15 cm), medium (15-20cm) and large (>20cm). Proportionate distributions of varieties in small and medium group were observed. Only two varieties Pusa Shukti and PSBK-1 were in large group. Equatorial diameter of curd cauliflower varieties were grouped as small, medium and large, accordingly, 4 varieties as small, 9 as medium and 2

186 B. Singh et al
were observed as large equatorial diameter during experimentation. Dubey et al., (2003) reported high variability in curd size of cauliflower. Shape in longitudinal section of curd is another character with sufficient variability in cauliflower varieties. Circular shape was observed in Pusa Himjyoti, broad elliptic was observed in 11 varieties viz; Kashi Kunwari, Kashi Agahani, Pusa Paushja, Pusa Sharad, Pusa Shukti, CCS-80, Pant Gobhi-3, Pusa Subhra, PSBK-1, PSB-16 and PSBK-25, while, Pusa Snow Ball-1, Pusa Megna and Pusa Deepali were depicted as narrow elliptic. The character of curd doming was categorized as weak, medium and strong. In this respect variety Pusa Meghna showed weak and variety Pusa Paushja expressed have strong curd doming whereas, rest of other varieties were depicted as medium curd doming. Curd colour varied from white to creamy white in the varieties studied. Pusa Paushja, Pusa Sharad, PSBK-1 and PSBK-25 exhibited white colour whereas, rest of the varieties showed creamy white colour. Curd knobbing is important character categorized into three categories i.e. fine, medium and course. Most of the varieties showed medium knobbing except PSBK-1 which expressed fine curd knobbing. Among the 15 cauliflower varieties studied considerable variation was observed for all the characters except curd texture (Table-1) where all the varieties exhibited fine curd texture. On the basis of curd compactness, the varieties were classified into three groups viz; loose, medium and compact, seven varieties were found as medium type and 8 varieties of compact type. Similar findings were reported by Singh et al., (2005). Kumar et al. (2010) found significant differences among the genotypes in Indian cauliflower suggesting sufficient variability for yield and quality characters.
The trait anthocyanin colouration of curd at maturity was categorized into two categories namely, absent and present. Two varieties depicted as present and rest of 13 varieties showed absent in anthocyanin curd colouration. Curd maturity group is most important character which classified as early, mid early, mid late and late. Only one variety Pusa Deepali was found early, whereas, Kashi Kunwari, Pusa Meghna was expressed as mid early group, Pusa Paushja, Pusa Sharad, Pusa Himjyoti, Pusa Shukti, CCS-80, Pant Gobhi-3 and Pusa Subhra were exhibited as mid late group and all the snow ball group varieties were depicted as late group for maturity. Late group varieties viz; Pusa Snow Ball-1, PSB-16, PSBK-1, PSB-16 and PSBK-25 could not flower due to lack of chilling requirement in northern plane in India. Flower colour grouped as white, creamy white and yellow. Among the 11 flowered varieties, three varieties namely Pusa Himjyoti, Pusa Deepali and Pusa Meghna expressed creamy white, and rest of the other varieties showed yellow flower colour while, none of the variety was depicted as white colour. Similar grouping trends were reported by Singh et al., (2012) in cabbage. The trait flower stalk length was categorized into three categories namely short, medium and long. Out of these, two varieties was depicted as short stalk length and 9 varieties showed medium stalk length.
It is concluded that the DUS descriptors can be effectively used for identification and grouping of varieties and satisfying the DUS criteria for these morphological descriptors could be registered under PPV and FR Act. Pre-breeding
CHARACTERIZATION OF CAULIFLOWER VARIETIES 187
or genetic enhancement needs emphasis for transfer or introgression of genes and gene combinations from unadapted source into more usable breeding material. There are indications that novel and useful traits can be successfully combined from related varieties. Further, these varieties can be used in varietal improvement programme depending upon the desired characteristics. However, registration of candidate varieties only considered under DUS testing as per the legal frame work and till now, morphological characterizations are being considered as per PPV and FR Act for notified vegetable crops.
ACKNOWLEDGEMENTS The authors gratefully acknowledge the PPV&FR Authority, New Delhi for
financially support, assistance through PVP legislation and DUS testing project.
REFERENCES Anonymous. 2009. PPV and FR Authority specific DUS test guidelines for nine crop species
– Brassica oleracea (Botrytis L.). Plant Variety Journal of India, 3 (11):217-229 Dubey, R.K., Singh, B.P. and Ram, H.H. 2003. Genetic variability, heritability and genetic
advance for quantitative characters in Indian cauliflower (Brassica Oleracia var. Botrytis L.). Vegetable Science, 30(1): 81-82
Kumar, M. Mahesh, S.R. Sharma, Kalia, P. and Saha, P. 2010. Genetic variability and character association for quantitative and quality traits in early maturing Indian cauliflowers. Indian Journal of Horticulture, 67:218-223
PPV and FR, 2001. Protection of Plant Varieties and Farmer’s Right Act (No. 53 of 2001) Dept. of Agriculture and Cooperation, Ministry of Agriculture, Govt of India, Krishi Bhavan, New Delhi
Singh, B., Chaubey, T., Upadhyay, D.K., Jha, A. and Pandey, S.D. 2012. Morphological characterization for DUS testing of cabbage (Brassica oleracea var. capitata L.) genotypes. Progressive Horticulture, 44 (1): 170-173
Singh, B., Singh, A.K., Pandey, S and Rai, M. 2005. Effect of curd cutting techniques at different curd stage on seed production in Indian cauliflower (Brassica Oleracia var. Botrytis L.). Vegetable Science, 32(1): 80-81
Tamburaj, T. And Singh, N. 2001. Textbook of Vegetables, Tuber crops and Spices, ICAR (Pub.) New Delhi
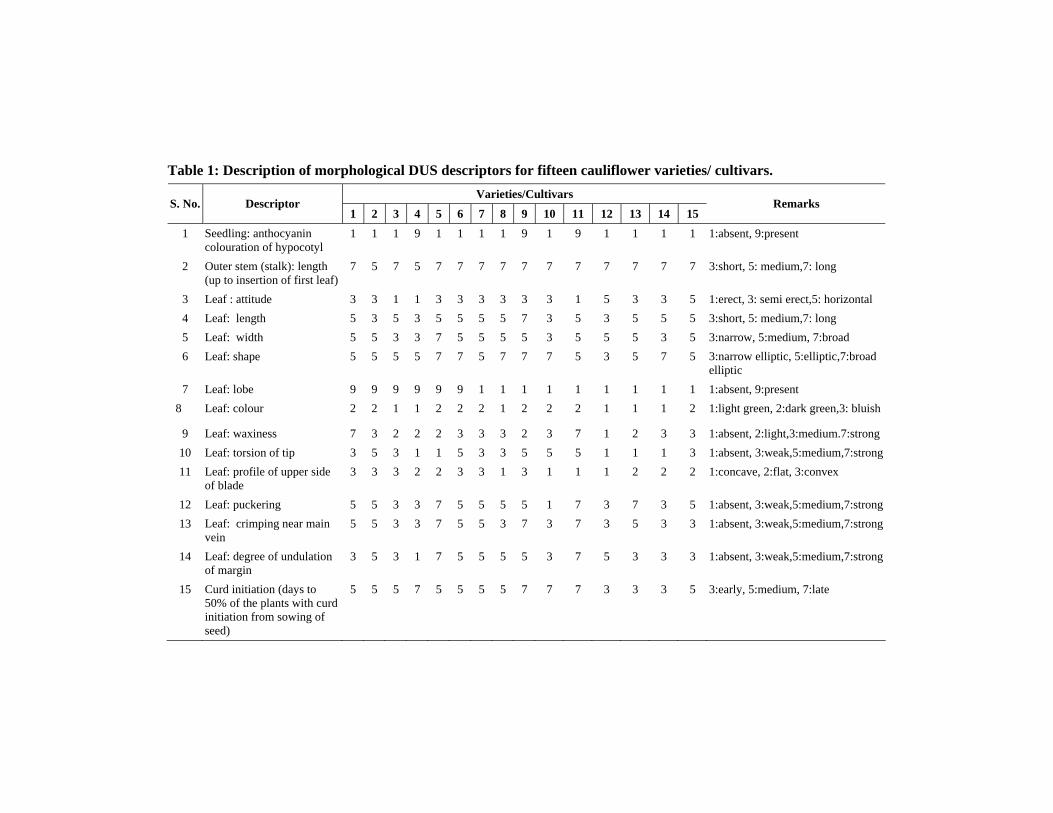
Table 1: Description of morphological DUS descriptors for fifteen cauliflower varieties/ cultivars. Varieties/Cultivars
S. No. Descriptor 1 2 3 4 5 6 7 8 9 10 11 12 13 14 15
Remarks
1 Seedling: anthocyanin colouration of hypocotyl
1 1 1 9 1 1 1 1 9 1 9 1 1 1 1 1:absent, 9:present
2 Outer stem (stalk): length (up to insertion of first leaf)
7 5 7 5 7 7 7 7 7 7 7 7 7 7 7 3:short, 5: medium,7: long
3 Leaf : attitude 3 3 1 1 3 3 3 3 3 3 1 5 3 3 5 1:erect, 3: semi erect,5: horizontal 4 Leaf: length 5 3 5 3 5 5 5 5 7 3 5 3 5 5 5 3:short, 5: medium,7: long 5 Leaf: width 5 5 3 3 7 5 5 5 5 3 5 5 5 3 5 3:narrow, 5:medium, 7:broad 6 Leaf: shape 5 5 5 5 7 7 5 7 7 7 5 3 5 7 5 3:narrow elliptic, 5:elliptic,7:broad
elliptic 7 Leaf: lobe 9 9 9 9 9 9 1 1 1 1 1 1 1 1 1 1:absent, 9:present
8 Leaf: colour 2 2 1 1 2 2 2 1 2 2 2 1 1 1 2 1:light green, 2:dark green,3: bluish
9 Leaf: waxiness 7 3 2 2 2 3 3 3 2 3 7 1 2 3 3 1:absent, 2:light,3:medium.7:strong10 Leaf: torsion of tip 3 5 3 1 1 5 3 3 5 5 5 1 1 1 3 1:absent, 3:weak,5:medium,7:strong11 Leaf: profile of upper side
of blade 3 3 3 2 2 3 3 1 3 1 1 1 2 2 2 1:concave, 2:flat, 3:convex
12 Leaf: puckering 5 5 3 3 7 5 5 5 5 1 7 3 7 3 5 1:absent, 3:weak,5:medium,7:strong13 Leaf: crimping near main
vein 5 5 3 3 7 5 5 3 7 3 7 3 5 3 3 1:absent, 3:weak,5:medium,7:strong
14 Leaf: degree of undulation of margin
3 5 3 1 7 5 5 5 5 3 7 5 3 3 3 1:absent, 3:weak,5:medium,7:strong
15 Curd initiation (days to 50% of the plants with curd initiation from sowing of seed)
5 5 5 7 5 5 5 5 7 7 7 3 3 3 5 3:early, 5:medium, 7:late

Varieties/Cultivars S. No. Descriptor
1 2 3 4 5 6 7 8 9 10 11 12 13 14 15 Remarks
16 Curd: covering by inner leaves
5 5 3 7 5 5 5 5 7 7 7 3 3 3 5 3:not covered, 5: partly covered,7:covered
17 Curd: polar diameter 5 5 3 3 7 5 5 5 7 5 5 3 3 5 5 3:small, 5:medium,7;large 18 Curd: equatorial diameter 5 5 3 3 7 5 5 5 7 5 5 3 3 5 5 3:small, 5:medium,7;large 19 Curd: shape in longitudinal
section 3 3 1 5 3 3 3 3 3 3 3 5 5 3 3 1:circular,3: broad elliptic,5: narrow
elliptic 20 Curd: doming 7 5 5 5 5 5 5 5 5 5 5 3 5 5 5 3:weak,5:medium,7:strong 21 Curd: colour 1 1 2 2 2 2 2 2 1 2 1 2 2 2 2 1:white, 2:creamy white, 3:orange 22 Curd: knobbing 5 5 5 5 5 5 5 5 3 5 5 5 5 5 5 3:fine,5:medium,7:coarse 23 Curd: texture 3 3 3 3 3 3 3 3 3 3 3 3 3 3 3 3:fine,7:coarse 24 Curd: compactness 7 7 5 7 5 5 5 7 7 5 7 5 5 7 7 3:loose,5:medium,7:compact 25 Curd: anthocyanin
colouration at maturity 1 1 1 9 1 1 1 1 9 1 1 1 1 1 1 1:absent, 9:present
26 Curd: maturity group 7 7 7 9 7 7 7 7 9 7 9 5 3 5 7 3:early,5:mid early,7:mid late, 9:late
27 Flower: colour 3 3 2 - 3 3 3 3 - - - 2 2 3 3 1:white,2:creamy white,3:yellow 28 Flower: stalk length 5 3 5 - 5 5 5 5 - - - 5 3 5 5 3:short, 5: medium,7: long
Varieties/cultivars: 1: Pusa Paushja, 2: Pusa Sharad, 3: Pusa Himjyoti,4: Pusa Snow Ball-1, 5: Pusa Shukti,6: CCS-80, 7: Pant Gobhi-3, 8: Pusa Subhra,9: PSBK-1,10: PSB-16, 11:PSBK-25,12: Pusa Meghna,13: Pusa Deepali, 14: Kashi Kunwari, 15: Kashi Agahani Note: (-) is Pusa Snow Ball-1, PSBK-1, PSB-16 and PSBK-25 are snowball group. Temperate region is suitable for this group flowering.
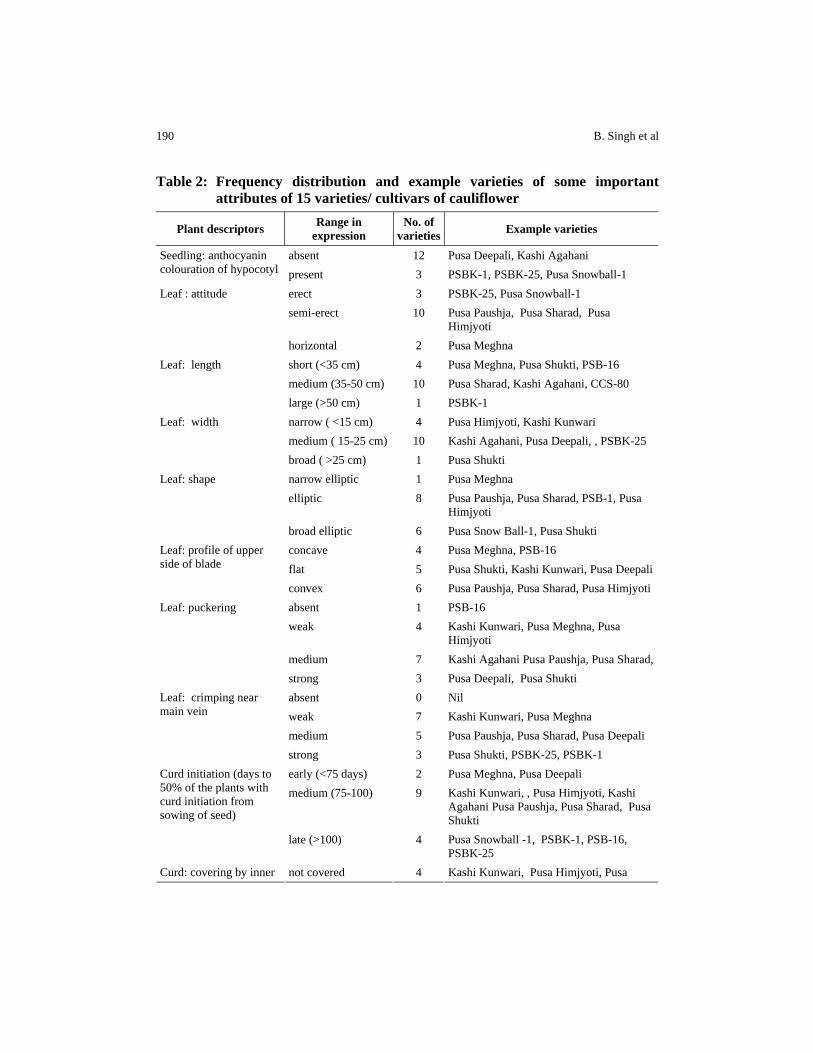
190 B. Singh et al
Table 2: Frequency distribution and example varieties of some important attributes of 15 varieties/ cultivars of cauliflower
Plant descriptors Range in expression
No. of varieties Example varieties
absent 12 Pusa Deepali, Kashi Agahani Seedling: anthocyanin colouration of hypocotyl present 3 PSBK-1, PSBK-25, Pusa Snowball-1
erect 3 PSBK-25, Pusa Snowball-1 semi-erect 10 Pusa Paushja, Pusa Sharad, Pusa
Himjyoti
Leaf : attitude
horizontal 2 Pusa Meghna short (<35 cm) 4 Pusa Meghna, Pusa Shukti, PSB-16 medium (35-50 cm) 10 Pusa Sharad, Kashi Agahani, CCS-80
Leaf: length
large (>50 cm) 1 PSBK-1 narrow ( <15 cm) 4 Pusa Himjyoti, Kashi Kunwari medium ( 15-25 cm) 10 Kashi Agahani, Pusa Deepali, , PSBK-25
Leaf: width
broad ( >25 cm) 1 Pusa Shukti narrow elliptic 1 Pusa Meghna elliptic 8 Pusa Paushja, Pusa Sharad, PSB-1, Pusa
Himjyoti
Leaf: shape
broad elliptic 6 Pusa Snow Ball-1, Pusa Shukti concave 4 Pusa Meghna, PSB-16 flat 5 Pusa Shukti, Kashi Kunwari, Pusa Deepali
Leaf: profile of upper side of blade
convex 6 Pusa Paushja, Pusa Sharad, Pusa Himjyoti absent 1 PSB-16 weak 4 Kashi Kunwari, Pusa Meghna, Pusa
Himjyoti medium 7 Kashi Agahani Pusa Paushja, Pusa Sharad,
Leaf: puckering
strong 3 Pusa Deepali, Pusa Shukti absent 0 Nil weak 7 Kashi Kunwari, Pusa Meghna medium 5 Pusa Paushja, Pusa Sharad, Pusa Deepali
Leaf: crimping near main vein
strong 3 Pusa Shukti, PSBK-25, PSBK-1 early (<75 days) 2 Pusa Meghna, Pusa Deepali medium (75-100) 9 Kashi Kunwari, , Pusa Himjyoti, Kashi
Agahani Pusa Paushja, Pusa Sharad, Pusa Shukti
Curd initiation (days to 50% of the plants with curd initiation from sowing of seed)
late (>100) 4 Pusa Snowball -1, PSBK-1, PSB-16, PSBK-25
Curd: covering by inner not covered 4 Kashi Kunwari, Pusa Himjyoti, Pusa

CHARACTERIZATION OF CAULIFLOWER VARIETIES 191
Plant descriptors Range in expression
No. of varieties Example varieties
Deepali, Pusa Meghna partly covered 7 Kashi Agahani Pusa Paushja, Pusa Sharad,
Pusa Shukti
leaves
covered 4 PSBK-1, PSB-16, PSBK-25, Pusa Snow Ball-1
small (<15 cm) 4 Pusa Himjyoti, Pusa Deepali, Pusa Meghna
medium (15-20 cm) 9 Kashi Agahani Pusa Paushja, Pusa Sharad
Curd: polar diameter
large (>20cm) 2 Pusa Shukti, PSBK-1 small (<15 cm) 4 Pusa Himjyoti, Pusa Deepali, Pusa
Meghna medium (15-20 cm) 9 Kashi Agahani Pusa Paushja, Pusa Sharad
Curd: equatorial diameter
large (>20cm) 2 Pusa Shukti, PSBK-1 circular 1 Pusa Himjyoti broad elliptic 11 Kashi Kunwari, Kashi Agahani Pusa
Paushja, Pusa Sharad, PSBK-25
Curd: shape in longitudinal section
narrow elliptic 3 Pusa Deepali, Pusa Meghna PSB-1 weak 1 Pusa Meghna medium 13 Kashi Kunwari, Kashi Agahani, PSBK-25,
Pusa Sharad, Pusa Himjyoti
Curd: doming
strong 1 Pusa Paushja loose 0 Nil medium 7 Pusa Himjyoti, Pusa Deepali, Pusa
Meghna,
Curd: compactness
compact 8 PSBK-25, Pusa Sharad, Pusa Paushja, Pusa Shukti
early 1 Pusa Deepali mid-early 2 Kashi Kunwari, Pusa Meghna mid-late 9 Pusa Paushja, Pusa Shukti ,Pusa Sharad,
Kashi Agahani
Curd: maturity group
late 3 PSBK-25, PSB-1, Pusa Snowball -1 white 0 Nil creamy white 3 Pusa Himjyoti, Pusa Deepali, Pusa
Meghna
Flower: colour
yellow 8 Pusa Sharad, Kashi Agahani, Pusa Himjyoti, Kashi Kunwari
193
SAARC JOURNAL OF AGRICULTURE GUIDELINES FOR AUTHORS
CALL FOR PAPER SAARC Agriculture Centre invites research and review papers to be published in the SAARC Journal of Agriculture (SJA). It is half yearly journal, i.e. two issues in a year, first issue at June and second at December of each year.
AIMS AND SCOPE OF THE JOURNAL SAARC Journal of Agriculture is an international half yearly peer-reviewed journal that publishes original research articles, review papers and short communications in the fields of agriculture, animal sciences, fisheries, natural resources management and allied disciplines. It is an official journal of SAARC Agriculture Centre (SAC). The scientists and researchers from SAARC countries are encouraged to submit their research and review papers for publishing in this journal.
MODE OF SUBMISSION Authors are requested to submit their manuscript to managing editor through electronic submission process via email- [email protected].
AUTHOR GUIDELINES Terms of Submission The journal welcomes the submission of manuscripts that meet the general criteria of significance and scientific excellence. Papers must be submitted on the understanding that they have not been published elsewhere and are not currently under consideration by another journal published by any other publisher. The submitting author is responsible for ensuring that the article's publication has been approved by all the other co-authors. It is also the authors' responsibility to ensure that the articles emanating from a particular institution are submitted with the approval of the necessary institution. Only an acknowledgment from the editorial office confirms the date of receipt. Further correspondence and proofs will be sent to the author(s) before publication unless otherwise indicated. It is a condition of submission of a paper that the authors permit editing of the paper for readability. All enquiries concerning the publication of accepted papers should be addressed to [email protected]. Manuscript Preparation Manuscripts text should be within 4000 words including references. Manuscript should be written in English in Microsoft Word using font “Times New Roman” and font size 12. The manuscript must be double-spaced. The double-spacing requirement applies to all written material, including footnotes, references, tables, and figure
194
captions. Authors are requested for limited use of italics, bold, and superscripts and subscripts, however, scientific names should be typed in italics. Word processing features such as automatic footnoting and outlining must be avoided and if numbered list is required to place in the manuscript enter the numbers and use appropriate tabs and indents by hand instead of using automatic outlining. Manuscripts should be arranged in the following order: 1. Title, Running title and byline. 2. Author–paper documentation (addresses/affiliations, email address of the
corresponding author, etc.). 3. Abstract. 4. Introduction. 5. Materials and Methods. 6. Results (sometimes combined with the discussion). 7. Discussion 8. Conclusion 9. Acknowledgments (optional). 10. References. 11. Figure captions, then tables, then the figures themselves.
Title The title should represent the content of the article. The terms in the title should be limited to those words that give significant information about the content of the article. It is discouraged to start title with ‘Study on’, ‘Effect of’, and ‘Influence of.’ An ideal title briefly identifies the subject, indicates the purpose of the study, and introduces key concept. Scientific names may be given where necessary.
Authorship There should be a cover page which includes title and all the names of authors. It is encouraged to use full names of authors in bylines. The first person listed in the title is considered as the senior author. An asterisk (*) follows the name of an author denotes the corresponding author and is matched to the words “*Corresponding author” at the bottom of the cover page. In this place addresses for all authors, email address and phone number for the corresponding author are included. Peer Review Policy Manuscripts will be sent to reviewers via e-mail for review the manuscripts electronically using track change mode. All manuscripts are subject to peer review and are expected to meet standards of academic excellence. All articles are initially screened by the managing editor/ associate editor solely or with the help of members of editorial board. If the article is found to be in order as per the ‘Guidelines’ and

195
there is adequate original information, it is sent to an expert for peer review. On the contrary, the articles that contain inadequate information or are not conform to ‘Guidelines’ are rejected as such or returned to the author for revision. After the article has been examined by the reviewer or followed by over viewer, it is also suitably edited by a relevant member of Editorial Board. Both reviewer/ over viewer and editorial board comments along with the manuscript are passed on to an author, who resubmits it after incorporating suggestions and comments. The thoroughly revised article will be checked by the editorial board and managing editor in the light of review/ over viewer comments whether it would be worth for publishing or not. The articles accepted for publication by editorial team are checked by a professional editor for English language, uniformity and any other ambiguity before sending to the press for composing. Proofs are mailed to the corresponding authors if needed and are also gone through by the managing editor/ associate editor/ member of editorial board. Article Processing Charges Articles are published in the SAARC Journal of Agriculture (SJA) free of charge. Title and Authorship Information The following information should be included • Paper title • Full author names • Full mailing addresses • Email addresses Abstract The manuscript should contain an abstract. The abstract should be self-contained and citation-free, single paragraph and should not exceed 200/250 words. An ideal abstract may contain background, rationale, objectives, materials & methods, results and conclusions. Keywords Up to 10, in alphabetical order and separated by comma.
Introduction This section should be succinct, with no subheadings. Materials and Methods This part should contain sufficient details so that all procedures can be reflected. It can be divided into subsections if several methods are described. It should include year and place of study.

196
Results The content of this section should permit full comprehension of the data reported in figures and tables. Discussion A comprehensive discussion section is required to justify the results. Normally a comparison between your results and results from previous works should be given in the Discussion. The Results and Discussion could be merged in a single section if necessary. Conclusions This should clearly explain the main findings of the work highlighting its importance and relevance. Acknowledgments Acknowledgments of people, grants, funds, etc. should be placed in a separate section before the reference list. The names of funding organizations should be written in full. Please check this section carefully before publication, as amendments or corrections are not allowed after publication
SHORT COMMUNICATIONS Short Communications typically describe research techniques, apparatus, and observations which were not confirmed normally by repetition (preliminary findings based on a single experiment). These articles are usually shorter than research papers and there are no individual abstract, introduction, materials and methods, results and discussion. Instead, they are written in continuous form without any sub headings.
References 1. In general, not more than 10-15 references would be required. Recent and
relevant not more than 20 years old references are encouraged. 2. There is no need to give references for standard procedures of soil and plant
analysis, as well as for routine statistical analysis; only the methodology may be indicated.
3. All references quoted in the text must appear at the end of the article and vice-versa. The spellings author’s names and dates or years at the two places should be carefully checked.
4. The references should include names of all authors, years (not within brackets), full title of the article, full name of the journal (in italics) (no abbreviations), volume number, issue number, and pages. For book or monograph, the name of the publisher should also be given as well as its volume, edition and relevant pages.

197
5. The references cited together in the text should be arranged chronologically. The list of references should be arranged alphabetically on author’s names, and chronologically per author.
6. References from standard scientific journals should be preferred, while those concerning unpublished data are generally to be avoided or mentioned as ‘Personal communications’ in the text. These need not be given in the reference list. A few examples for correct citation of references in the list are given below:
Journal Article Buhler, D. D. and Mester, T.C.1991. Effect of tillage systems on the emergence
depth of giant and green foxtail. Weed Science, 39: 200-203. Mowla, G.M., Mondal, M.K, Islam, M.N. and Islam, M.T. 1992. Farm level water
utilization in an irrigation project. Bangladesh Rice Journal, 3 (1&2): 51-56. Rahman, M.M. 1990. Infestation and yield loss in chickpea due to pod borer in
Bangladesh. Bangladesh Journal of Agricultural Research, 15(2): 16-23. Book/Bulletin/Reports/Series Bhuiyan, S.I. 1982. Irrigation system management research and selected
methodological issues. IRRI research paper series no 81. Los Banos, Manila. De Datta, S. K. 1981. Principles and practices of rice production. Los Banos, Manila. International Rice Research Institute. 2000. International rice trade: a review of 1999
and prospects for 2000. International Rice Commission Newsletter, IRRI, Manila.
Steel, R.G.D. and Torrie, J.H. 1980. Principles and procedures of statistics: A biometrical approach. 2nd ed. McGraw-Hill, New York.
Westerman, R.L. (ed.) 1990. Soil testing and plant analysis. 3rd ed. SSSA Book Ser. 3. SSSA, Madison, WI.
Chapter in a Book David, H. and Easwaramoorthy. 1988. Physical resistance mechanisms in insect plant
interactions. p. 45-70. In T.N. Ananthakrishnan and A. Rahman (ed.), Dynamics of insect plant interactions: Recent advances and future trends. Oxford and IBH Publication, New Delhi.
Johnson, D.W. and D.E. Todd. 1998. Effects of harvesting intensity on forest productivity and soil carbon storage. p. 351–363. In R. Lal et al. (ed.) Management of carbon sequestration in soils. Advances in Soil Science. CRC Press, Boca Raton, FL.
198
Conference/Symposium/ Proceedings Joshi, B.K. 2004. Crossing frequency and ancestors used in developing Nepalese mid
and high hill rice cultivars: Possible criteria for yield improvement and rice genes conservation. p. 502-523. In Proc. National Conference on Science and Technology, 4th, Vol. 1. 23-26 Mar., 2004. NAST, Kathmandu, Nepal.
Ramanujam, S. (ed.) 1979. Proceedings of International Wheat Genet Symposia, 5th, New Delhi, India. 23–28 Feb. 1978. Indian Soc. Genet. Plant Breeding, Indian Agric. Res. Inst., New Delhi.
Dissertation Singh, A.A. 2005. Weed management approaches and modeling crop weed
interaction in soybean. M. Sc. (Ag.) thesis. Tamil Nadu Agricultural Univ., Coimbatore.
Software and Software Documentation Minitab. 1998. MINITAB 12. Minitab, State College, PA. Online publication Venugopal, D. 2000. Nilgiri tea in crisis: Causes consequences and possible
solutions. Retrieved October 11, 2000 from http://www.badaga.org. Online journal article Doerge, T.A. 2002. Variable-rate nitrogen management creates opportunities and
challenges for corn producers. Crop Manage. doi:10.1094/cm-2002-0905-01-RS.
Tables 1. Each table must be typed on a separate sheet (not to be included in the text) and
numbered consecutively in the same order as they mentioned in text. 2. The title should fully describe the contents of the table and explain any symbol
or abbreviation used in it as a footnote, using asterisks or small letters viz. a, b, etc.
3. Tables should be self-explanatory, not very large (< 10 columns in portrait and <14 columns in landscape formats respectively) and may cover space up to 20-25% of the text.
4. Maximum size of table acceptable is that can be conveniently composed within one full printed page of the journal. The large sized tables should be suitably split into two or more small tables.
5. Standard abbreviations of units of different parameters should be added between parentheses.

199
6. The data in the tables should be corrected to minimum place of decimal so as to make it more meaningful.
7. Vertical lines should not be used to separate columns. Similarly, horizontal lines should be used only where these are necessary, not in the body of the article.
8. All tables should be tagged with the main body of the text i.e. after references.
Figures 1. Figures may be given in place of tables where a large number of values are
presented that can be interpreted through figures. In no case the same data should be presented in both tables and figures.
2. Originals of the figures should be no larger than twice the final size, of good quality and printed clearly in black on plain white paper or in color. The figures may be sized to fit within the columns of the journal (8 cm width for single column or 17 cm for columns i.e. full page).
3. Lines should be bold enough to allow the figure to be reduced to either single or double column width in the journal.
4. Black and white photographs are also accepted if these are necessary to improve the presentation and quality of the article.
Some useful hints 1. All scientific or technical names as well as all data and facts must be rechecked
carefully before submitting the manuscript. 2. Dates and years may be mentioned as 28 May 2007, 28 May to 7 June, and 28-
30 May instead of May 28, 2007, 28 May-7 June, and 28 to 30 May, respectively.
3. Avoid numerals and abbreviations at the beginning of a sentence; spell out or change the word order if necessary.
4. A comma may be used for data in thousands or more such as 10,000 or 2,30,000 etc. Alternatively, these data can also be presented as 10.0 or 230.0 if a common expression such as ‘ x103’ is used in tables or figures. Avoid expressing data in ‘lakhs’, instead use ‘thousand’ or ‘million’.
5. Only standard abbreviations should be used and these should invariably be explained at first mention. Avoid use of self-made abbreviations such as Rhizo., Azo., buta, isop. etc. for Rhizobium, Azotobacter, butachlor, isoproturon, respectively.
6. For names of plant protection chemicals, the first letter of the name need not be capitalized for scientific names but should be capitalized for trade names. All the names should be checked very carefully.

200
7. Use of unnecessary abbreviations and treatment symbols such as T1, T2 etc. under Materials and Methods or tables without actually using these under Results and Discussion should be avoided.
8. All weights and measurements must be in SI or metric units. Use kg ha-1, or t ha-1 but not q ha-1. Do not follow the style g/ha, mg/kg, mg/l, mg/g, ml/l or g per ha, etc
9. Use % after numbers, not per-cent, e.g. 7%. In a series or range of measurements, mention the units only at end, e.g. use 30, 100, 170 and 300C; 20 or 30% more instead of 30C, 100C, 170C and 300 °C; 20% or 30% more.
10. Numeral should be used whenever it is followed by a unit measure or its abbreviations e.g. 1 g, 3 m, 5 h, 6 months etc. Otherwise, words should be used for numbers one to nine and numerals for larger ones except in a series of numbers when numerals should be used for all in the series.
11. For the composition of fertilizers, manures, crops or soil, the elemental forms (K, P, Mg etc.) should be used and not the oxides.
12. Statistical analysis of data in the standard experimental design should be sound and complete in itself with both ±SE (Standard Error of means) and CD (Critical Difference) or LSD (Least Significant Difference) (P=0.05) values given for comparison of treatment means in tables and figures.
13. Use multiplication sign (×) not a alphabet x for indicating multiplication, crossing, etc


