SaasXp: The EbertFastie Spectrometer Control Hardware and Software UNIVERSITY CENTRE ON SVALBARD – P.O.BOX 156 – N9171 LONGYEARBYEN NORWAY 1 SaasXP The EbertFastie Spectrometer Control Hardware and Software F. Sigernes University Courses on Svalbard (UNIS), Box 156, 9171 Longyearbyen, Norway. 1. Basic optics This document describes the hardware and software that controls the Ebert – Fastie spectrometers at the Auroral Station in Adventdalen, Svalbard. The main components of the instrument are shown in Fig. 1. Figure 1. The EbertFastie configuration: (1) entrance slit, (2) concave mirror, (3) plane reflecting grating, (4) exit slit, (5) collector lens, (6) detector, and (7) order sorting cutoff filter. The principal components of the instruments are one large focal length spherical mirror, one plane reflective diffraction grating and a pair of curved slits. The recorded radiance from the sky is limited by the etendue the product of the area of the entrance slit and the solid angle field of view. Because of the low intensity of the source, the etendue is made as large as possible. The image of the entrance slit is reflected by one part of the spherical mirror onto the grating. The second part of the mirror focuses the diffracted light from the grating onto the exit
Transcript
SaasXp: The EbertFastie Spectrometer Control Hardware and Software
UNIVERSITY CENTRE ON SVALBARD – P.O.BOX 156 – N9171 LONGYEARBYEN NORWAY
1
SaasXP The EbertFastie Spectrometer Control
Hardware and Software F. Sigernes
University Courses on Svalbard (UNIS), Box 156, 9171 Longyearbyen, Norway.
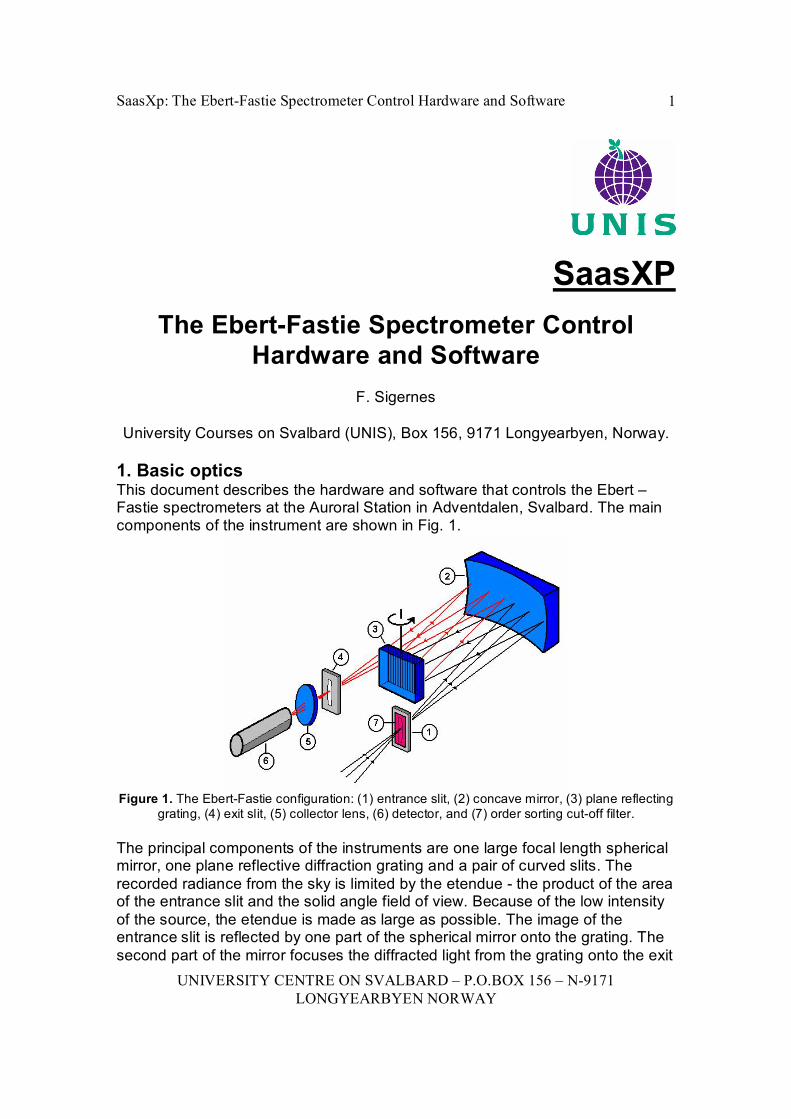
1. Basic optics This document describes the hardware and software that controls the Ebert – Fastie spectrometers at the Auroral Station in Adventdalen, Svalbard. The main components of the instrument are shown in Fig. 1.
Figure 1. The EbertFastie configuration: (1) entrance slit, (2) concave mirror, (3) plane reflecting grating, (4) exit slit, (5) collector lens, (6) detector, and (7) order sorting cutoff filter.
The principal components of the instruments are one large focal length spherical mirror, one plane reflective diffraction grating and a pair of curved slits. The recorded radiance from the sky is limited by the etendue the product of the area of the entrance slit and the solid angle field of view. Because of the low intensity of the source, the etendue is made as large as possible. The image of the entrance slit is reflected by one part of the spherical mirror onto the grating. The second part of the mirror focuses the diffracted light from the grating onto the exit
SaasXp: The EbertFastie Spectrometer Control Hardware and Software
UNIVERSITY CENTRE ON SVALBARD – P.O.BOX 156 – N9171 LONGYEARBYEN NORWAY
2
slit. When the grating turns, the image of the entrance slit is scanned across the exit slit. A collector lens transfers the output of the exit slit to the front of a photomultiplier tube. The tube is mounted in a thermoelectrically cooled housing and cooled down to 20C. Signals from the tube are amplified and discriminated before sent to the computer’s counting card. Cutoff filters are used in front of the entrance slit to prevent overlapping spectral orders. The field of view of approximately is approximately 5 degrees. Appendix A lists the fundamental equations for this type of optical configuration.
2. Short historical background The original EbertFastie spectrometer, was constructed by W. G. Fastie at John Hopkins University, Maryland at the beginning of the 70's. Fastie improved the original design of the monochromator made by Hermann Ebert in 1889. In 1978, a 1m and a ½m EbertFastie spectrometer were transferred to the Auroral Station in Adventdalen, Svalbard, from the Geophysical Institute (GI), University of Alaska. One more 1m was installed in 1980. These instruments are named 1m Green, ½m Black and 1m Silver Bullet according to focal length and colour. Since then, the photon counting and computer electronics have been continuously upgraded in order to enhance both the control and performance of the instruments. Furthermore, a ½ m Ebert – Fastie spectrometer (½m White) was moved in 2004 from the Skibotn Observatory in Norway up to Longyearbyen. Data from these instruments are widely published and recognized.
The 1m Green and the ½m Black uses a high resolution stepper motor with encoder connected to the grating shaft. This is different from grating sweep mechanism (cam – arm system) used on the ½m White and 1m Silver Bullet. The steppers and encoders where installed in the early 90’s. This document describes the 3rd software upgrade from DOS to Windows XP. The main reason for the latest software upgrade is that the old GI ISA counter cards form the 80’s are out of production. The cards where made by Bruce McKibben and they where excellent! Nevertheless, ISA compatible computers are hard to get. A new PCI based card from the company National Instrument has now taken over.
3. Hardware overview Fig. 2 shows the Ebert – Fastie spectrometer named 1m Green. The main electronics required to run the instrument may be separated in 4 sub categories
1. The detector head: photomultiplier tube (PMT), cooler and preamplifier / discriminator (PAD).
2. The high voltage supply. 3. The grating stepper encoder motor system. 4. PC with high speed counter card.
A short description of each sub category follows.
SaasXp: The EbertFastie Spectrometer Control Hardware and Software
UNIVERSITY CENTRE ON SVALBARD – P.O.BOX 156 – N9171 LONGYEARBYEN NORWAY
3
Figure 2. The 1m Green Ebert – Fastie spectrometer. (1) Peltier cooler for PMT, (2) PAD and High voltage controller (ADAM 6024), (3) Slit width adjuster wheel, (4) Order sorting filter in front of entrance slit, (5) Grating motor system, (6) Light pipe, (7) Power supply to cooler, (8) Power to PAD, and (9) DC supply to the ADAM module.
3.1 The detector head In order to reduce thermo electrical noise or dark current, the photo multiplicator is cooled using the Peltier technique. Simply stated, Peltier cooling is based on the phenomenon of cooling or absorption of heat at the junction of two rods of metal or semi conductor when a current is made to pass through them. In order for thermoelectric cooling devices to be effective, the absorbed heat must be removed from the hot side of the device. In Fig. 2 an air fan is mounted on the top of the housing to blow out / exchange hot air.
The cooler in Fig. 2 is made by the company: Products for Research Inc, model number TE 102TS. Fig. 3 shows the PMT and the socket used. When a photon hits the photo emissive cathode of the tube, it emits a photoelectron into vacuum. The electron is then accelerated and directed to the first electrode (dynode), where it kicks loose a secondary electron. The process continues at the next dynode. Finally, the multiplied result, a train of electrons, is collected by the anode as an output signal. This is illustrated in Fig. 4. Most of the PMT’s we use are from the Hamamatsu Corporation. Some old ones are from Thorn EMI, UK.
SaasXp: The EbertFastie Spectrometer Control Hardware and Software
UNIVERSITY CENTRE ON SVALBARD – P.O.BOX 156 – N9171 LONGYEARBYEN NORWAY
4
Figure 4. Basic principle of a photomultiplicator (PMT).
The signals from the anode are amplified and discriminated to form a square pulse train. This operation is carried out by a PAD (Pulse Amplifier and Discriminator). The current pulses from the anode of the PMT are converted by the PAD to TTL compatible output pulses that are suitable for PC counter cards. Several types have been used from different manufactures. The Golden bricks are from the former company SpaCom Electronics, or the more recent Silver PADs are from Advanced Research Instrument Corporation, USA.
For the ½ m White spectrometer, the PAD is actually mounted inside the socket, model ADS/ADH/ADP120. This single printed circuit board comes with the socket from Products for Research Inc. Fig. 5 shows the F100T Silver PAD and its main specifications.
Max Repetition rate 50 MHz Sensitivity 160 µV Input impedance 50 Ω Input noise level 5 µV Pulse pair resolution 20 ns Min. output pulse width 10 ns Output TTL Power supply (# F100 PS) +8 – 24 V
Figure 5. The F100T Preamplifier / Discriminator from Advanced Research Instrument Corporation.
Due to availability and durability, we will use the Silver PAD for future upgrades.
SaasXp: The EbertFastie Spectrometer Control Hardware and Software
UNIVERSITY CENTRE ON SVALBARD – P.O.BOX 156 – N9171 LONGYEARBYEN NORWAY
5
Figure 6. High Voltage (HV)
3.2 The high voltage supply The high voltage system to the PMT contains the actual high voltage generator, a signal control module and a couple of DC power supplies. The generator is produced by the company Euro Test in Germany (model # CPn 30 405 125). This unit is capable of producing up to 3kV. The output is controlled by a 12 channel multi purpose I/O module from Advantech Co., Ltd. The ADAM6024 interfaces through the internet through standard IP based protocols. Fig. 6 shows a close up of the ADAM module mounted on top of the high voltage generator. The PAD is mounted on the side of the modules. The specifications and the connection diagram are shown in appendix B and C, respectively.
3.3 The grating stepper encoder motor system
Figure 7. Grating stepper–encoder motor system: (1) encoder, (2) stepper motor, (3) gear drive , (4) home sensor, (5) grating normal (arm), (6) grating angle indicator, and (7 8) end switches.
Figure 8. Motor drive indexer: (1) encoder connection, (2) stepper motor wire, and (3) to controlling PC (RS232 COM 1).
Fig. 7 shows the motor system assembled to the 1m Green grating shaft. This motor is capable of doing 25,000 individual steps per revolution and is connected to a 5000 line encoder. The encoder shaft is mounted to a rotary table. The rotary table or gear drive has a gear ratio of 1:36 and is mounted directly to the grating shaft.
The whole system controlled by an Indexer that generates current pulses to drive the motor. See Fig. 8. The indexer provides additional logic such as limit switches and a home position switch. Homing is provided by a magnetic relay mounted on the rotary table. This custom made system is capable of doing 900,000 steps per revolution of the grating with exact position tracking.
SaasXp: The EbertFastie Spectrometer Control Hardware and Software
UNIVERSITY CENTRE ON SVALBARD – P.O.BOX 156 – N9171 LONGYEARBYEN NORWAY
6
It is possible to rotate the motor / grating to a precise position and stop, rotate at a constant velocity, alternate back and forth between two angular positions or use a combination of such moves.
The whole motor system was delivered by the Parker Hannifin Corporation, USA.
3.4 PC with high speed counter card
Figure 9. NI PCI 6602
The counter card is made by National Instruments (NI). The NI 6602 device is a PCI bus compatible card. It has four 32bit counter channels and up to 32 lines of individually configurable, TTL/CMOS compatible digital I/O. The card has a base frequency of 80 MHz and each counter is capable of detecting down to 5 ns wide pulses. The card is installed on a Windows XP operated PC.
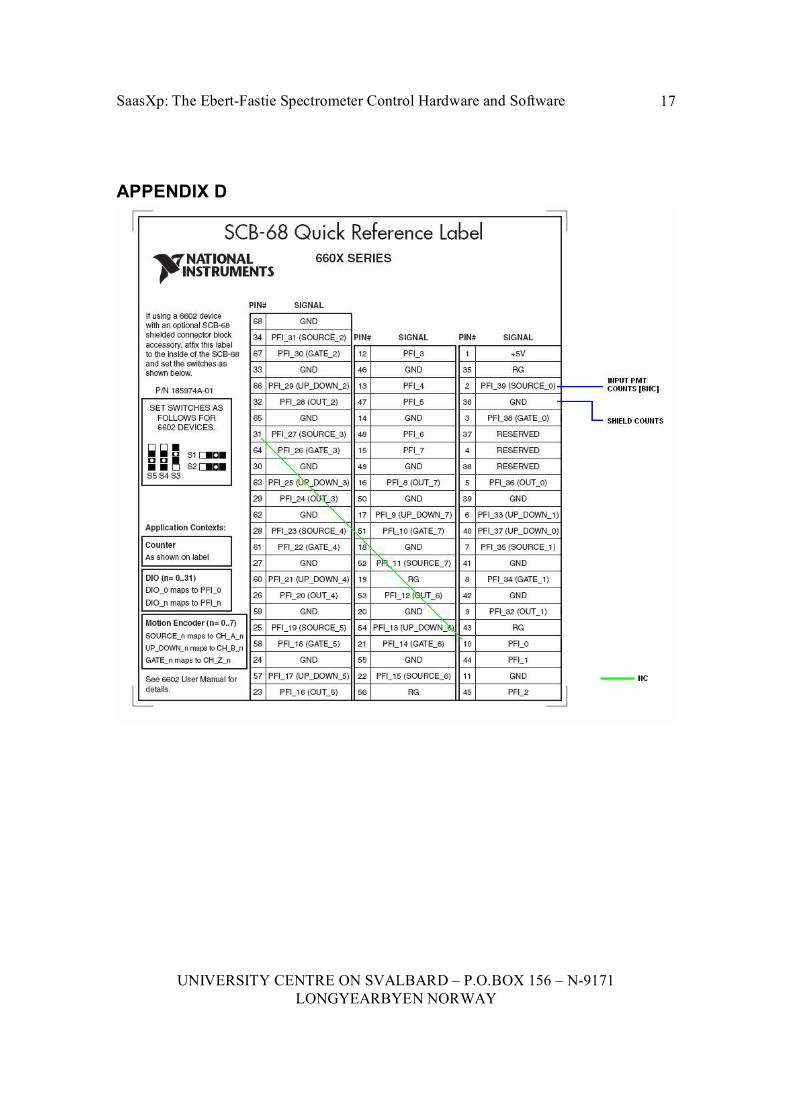
In addition, a NI SCB68 connector box is used to access the cards ports. See appendix D for pin assignments.
Since the grating is fixed in position during sampling, a method called simple event counting is used. The counter (SOURCE) counts TTL pulses armed via a software command. The counter counts the number of falling edges that occur on SOURCE between two active edges triggered by software. At the completion of the period interval (Integration time P), the HW Save register latches the counter value for the software read. Fig. 10 shows an example of simple event counting where the counter counts 3 events on SOURCE.
Figure 10. Simple event counting with the NIPCI 6602 counting card
SaasXp: The EbertFastie Spectrometer Control Hardware and Software
UNIVERSITY CENTRE ON SVALBARD – P.O.BOX 156 – N9171 LONGYEARBYEN NORWAY
7
4. Software
4.1 SaasXP The software to control the counter card is written in Borland Delphi 5. The routines used are developed over years of operating the spectrometers at the Auroral Station in Adventdalen, Svalbard. The platform is Windows XP. The program is called SaasXP, named according to its previous ancestors Saas and Spec4 that were compiled for DOS. SaasXP uses the National Instruments driver library called NIDAQmx to communicate with the PCI NI6602 counter card. These drivers are shipped with the card and need to be installed on the host computer. The library is accessible through the DDL file called nicaiu.dll. Here is an example on how to declare a function for use in Delphi:
function DAQmxStartTask(task: pointer):longint; stdcall; external 'nicaiu.dll';
In order to perform simple event counting as mentioned in the previous section, about 6 functions are called from the NIDAQmx library. See the source file pmt_box.pas for details. Appendix E lists an example on how the code can be written for sampling data.
The program is started by calling the main executable
D:\SaasXp\SaasXp 60
The input parameter 60 is optional and stands for runtime for a period of 60 minutes. This type of startup is ideal for scheduled operations, where different tasks may be required of the instrument.
Fig. 11 shows a screen capture of the program in operation. The program should be fairly easy to use. An explanation on how to use it is indicated by labels. The program remembers its position and size. Runtime status information is provided in the two status bars. A LED indicates whether the shutter is open or not. A toolbar at the top of the form contains buttons for documentation (shortcut to this file), a command prompt for high voltage control, copy to clipboard or printer, instrumental settings and enable or disable of recording (RUN button).
Note that the program remembers the status of the RUN button. If it is enabled during shutdown, then it will automatically start the instrument on the next execution. Shutdown is done 4 ways. Either by hitting the Esc button (fast or hard shutdown), by closing the main form (mouse click on upper right corner), disable the RUN button or by timeout as described earlier.
SaasXp: The EbertFastie Spectrometer Control Hardware and Software
UNIVERSITY CENTRE ON SVALBARD – P.O.BOX 156 – N9171 LONGYEARBYEN NORWAY
8
Figure 11. Screen capture of SpaasXp.exe. (1) is record or RUN button, (2) Setup / Configuration of instrument, (3) dumps current view to a printer, (4) copies to clipboard (print screen option), (5) status bar, (6) information (this file), (7) command prompt for high voltage, (8) shutter LED, (9) current settings of instrument, and (10) status bar.
The current setup of the instrument is listed as read only in the program when the instrument operates. In order to change the setup it is necessary to first disable the play button and then click on the setup button. This will open up a file called SaasXp.set. You will need to save this file to update the settings of the instrument. Fig. 12 shows the content of this file.
The configuration file is divided into 2 sections. First the instrumental or fixed settings are given by the specifications of the instrument. This section contains parameters such as site tag, name of instrument, photomultiplier tube, type of order sorting filter, grating groove density, focal length of mirror, motorencoder settings, default plot options, and data location. Note that the format of the file must be conserved. All input must be placed correctly after the semicolon of each line. Any incorrect input will cause the program to crash. Keep one sample file as backup in case of problems.
SaasXp: The EbertFastie Spectrometer Control Hardware and Software
UNIVERSITY CENTRE ON SVALBARD – P.O.BOX 156 – N9171 LONGYEARBYEN NORWAY
9
Figure 12. Configuration. The blocks (1) and (2) are colored yellow and light blue to visualize difference between fixed settings of the instrument and user runtime settings, respectively.
Secondly, the wavelength regions that the instrument will sweep are given in the runtime section of the configuration file. See block colored light blue in Fig. 12. Each region the instrument sweeps in wavelength is given as one line. The line starts with a setup number followed by a start and a stop wavelength, the integration code, a plot window maximum, the spectral order, the number to sum and the slit widths.
The integration code is entered according to the following table. Code 0 1 2 3 4 5 6 7 8 9 msec 0.51 1.02 2.05 4.10 8.19 16.38 32.77 65.54 131.07 262.14
Again, it is important to enter the correct format. Also, each region should be entered according to a continuous increase in grating angle. This angle is given by the grating equation of the instrument and depends on spectral order (appendix A). In Fig. 11 the message “Setup OK!” in the status bar indicates that this rule has been followed. Numbers in parentheses next to the wavelengths give the calculated grating angles. If this rule is not obeyed, the program will just simply terminate.
SaasXp: The EbertFastie Spectrometer Control Hardware and Software
UNIVERSITY CENTRE ON SVALBARD – P.O.BOX 156 – N9171 LONGYEARBYEN NORWAY
10
Figure 13. The figure shows the screen dump of SaasXp in action with 4 plot windows for each spectral region. Each plot is the runtime mean spectrum in units of raw counts and Ångstrøm for intensity and wavelength, respectively. The labels are (1) – copy to clipboard, (2) – plot grid ON / OFF, (3) – print, and (4) – scale intensity axis up or down (maximum intensity value).
Note that it is only possible to define maximum 4 wavelength regions to sweep with SaasXp. Each region will produce its own plotting window. Fig. 13 shows the graphical layout of the plot windows. The main feature is that they plot wavelength versus intensity in real time. Bright colors indicates the current scans and corresponding darkened colors is the previously scans. The effect of the runtime mean is seen as an increase in signal to noise between scans. The # 2 sum does not influence the data saved to disk. Each individual scan is saved to file. The files are named according to date and saved in a directory selectable to the user. The format is simple ASCII.
SaasXp: The EbertFastie Spectrometer Control Hardware and Software
UNIVERSITY CENTRE ON SVALBARD – P.O.BOX 156 – N9171 LONGYEARBYEN NORWAY
11
Wavelength and absolute calibrations are conducted with the program Spekkis.exe, which is part of the distribution. The accurate start and stop wavelengths of the scan are calculated by the wavelength calibration module of Spekkis.
4.2 HvIP3
Figure 14. Screen shot of HvIP3 in action. Commands: (1) turns high voltage ON, (2) is status, and (3) turns the high voltage OFF. A four line response follows each command.
The HVIp3.exe is a command line program that communicates with the high voltage control module (ADAM6024) via the internet. The program syntax is
Usage: HvIp3 [IP:] [NEG PMT Voltage or ?].
To turn ON the high voltage to 1400V, simply type on the Command Prompt:
HvIp3 158.39.47.63 1400
Correspondingly, the high voltage is turn OFF by the command
HvIp3 158.39.47.63 0
You request the status by typing
HvIp3 158.39.47.63 ?
SaasXp: The EbertFastie Spectrometer Control Hardware and Software
UNIVERSITY CENTRE ON SVALBARD – P.O.BOX 156 – N9171 LONGYEARBYEN NORWAY
12
Note that in the above examples the IP number 158.39.47.63 is just used for testing of the system. The program basically converts the input strings to the ASCII or the Modbus TCP/UDP protocols used by the manufacturer. The Delphi 5 source file HvIP3.dpr communicates with the Winsock API through the driver files Adamtcp.pas and Adamtcp.dll that comes with the unit. Two command files may be uses to turn the high voltage ON and OFF in incremental voltage steps, respectively. Fig. 14 shows a screenshot of the program in action.
IMPORTANT Turn the blue button of DC power supply to the high voltage unit OFF during troubleshooting or faulty conditions! Make sure that the ADAM module is operative and working before turning the power ON again (+12.5 VDC).
SaasXp: The EbertFastie Spectrometer Control Hardware and Software
UNIVERSITY CENTRE ON SVALBARD – P.O.BOX 156 – N9171 LONGYEARBYEN NORWAY
13
Manufactory list Parker Hannifin Parker Compumotor Division, 5500 Business Park Drive, Rohnert Park, CA 94928, USA Phone +1 7075847558 or 8003589068 http://www.parkermotion.com/
Products for Research Inc. 88 Holten Street, Danvers, MA 01923, USA Phone: (978)7743250 – Fax: (978) 7623593 http://www.photocool.com/
Hamamatsu Photonics K. K. 3256, Sunayama cho, Hamamatsu City, Shizuoka Pref., 4308587, Japan Phone: (81)534522141 – Fax: (81)534567889 http://www.hamamatsu.com
Advanced Research Instruments Corporation PO Box 7427 Golden CO 80403 USA http://www.aricorp.com
Euro Test ET System electronic GmbH Haupstr. 119 – 121 D68804, Altluβheim, Germany. Tel.: +49 (0)6205 39480 Fax: +49 (0)6205 375 60 http://www.ETSGmbH.de
Advantech Co., Ltd. No. 1, Alley 20, Lane 26 Rueiguang Road, Neihu District Taipei 114, Taiwan, R. O. C. http://www.advantech.com
National Instruments 11500 North Mopac Expressway Austin, Texas 787593504 USA Tel: 512 794 0100 http://www.ni.com/
SaasXp: The EbertFastie Spectrometer Control Hardware and Software
UNIVERSITY CENTRE ON SVALBARD – P.O.BOX 156 – N9171 LONGYEARBYEN NORWAY
14
APPENDIX A
Basic equations for an EbertFastie spectrometer
N – grating normal θ – grating angle φ – constant
tan φ = y / f f – focal length α – incident angle β – diffracted angle y – ½ slit – slit distance a – groove spacing n – spectral order w – slit width
Figure 1. Optical diagram Ebert Fastie spectrometer. G is plane reflective grating, S1 entrance slit, S2 exit slit, and M concave mirror.
The grating equation is
) sin (sin β α λ + = a n , where φ θ α − = and φ θ β + = .
Then [ ] ) cos sin cos (sin ) cos sin cos (sin θ φ φ θ θ φ φ θ λ + + − = a n or
φ θ λ cos sin 2a n = ⇒ .
Angular dispersion is
β λ β
cos ) ( a n d d
= ,
and since β d f dx = then linear dispersion becomes
f n a
f n a
f d d
dx d ) cos( cos φ θ β
β λ λ +
= = =
The theoretical bandpass of the instrument is then defined as
. ) cos( w f n
a w dx d FWHM BP ×
+ = × = = φ θ λ
SaasXp: The EbertFastie Spectrometer Control Hardware and Software
UNIVERSITY CENTRE ON SVALBARD – P.O.BOX 156 – N9171 LONGYEARBYEN NORWAY
15
APPENDIX B
SaasXp: The EbertFastie Spectrometer Control Hardware and Software
UNIVERSITY CENTRE ON SVALBARD – P.O.BOX 156 – N9171 LONGYEARBYEN NORWAY
16
APPENDIX C
SaasXp: The EbertFastie Spectrometer Control Hardware and Software
UNIVERSITY CENTRE ON SVALBARD – P.O.BOX 156 – N9171 LONGYEARBYEN NORWAY
17
APPENDIX D
SaasXp: The EbertFastie Spectrometer Control Hardware and Software
UNIVERSITY CENTRE ON SVALBARD – P.O.BOX 156 – N9171 LONGYEARBYEN NORWAY
18
APPENDIX E Procedure Sample_Data_Example; var cts_hnd: TaskHandle; cts: uInt32; timeouts:float64; f,t0,t1:int64; t:Real; Exposure_Time:extended;
until (t>=exposure_time); Count_pmt:=int(Cts); if (cts_hnd <> NULL) then begin DAQmxStopTask(cts_hnd); DAQmxClearTask(cts_hnd);
end; end;
SaasXp: The EbertFastie Spectrometer Control Hardware and Software
UNIVERSITY CENTRE ON SVALBARD – P.O.BOX 156 – N9171 LONGYEARBYEN NORWAY
19
APPENDIX F
Network of EbertFastie Spectrometers on Svalbard
Instrument name Location HvIP2 PC 1 m Green Longyearbyen 158.39.49.204 158.39.49.102 1 m Silver Longyearbyen 158.39.49.203 158.39.49.107 ½ m White Longyearbyen 158.39.49.202 158.39.49.201 ½ m Black NyÅlesund * 193.156.10.172
* Web Camera in NyÅlesund IP: 193.156.10.173 Mask: 255.255.255.192 Router: 193.156.10.129
Name: protcam.nyaal.npolar.no DNS: 158.39.46.248 / 158.39.47.4 ½ m Black: protonic.nyaal.npolar.no
An upgrade of the auroral EbertFastie spectrometer
F Sigernes T Svene DA Lorentzeny and LTW Sigernesz
The University Courses on Svalbard N Longyearbyen Svalbard NorwayyGeophysical Institute University of Alaska Fairbanks Alaska USA
zUniversity of Trondheim Trondheim Norway
In preparation
Abstract
Two auroral m focal length EbertFastie spectrometers have been recongured with new controlling hardware at Poker Flat research range AlaskaN W and at Nordlysstasjonen in Adventdalen Svalbard N E respectively The use ofhigh resolution stepping motors mounted to the gratingshafts of the instruments combined with either a laserposition tracking system or an incremental encoder aredescribed and discussed Both instruments were set upto measure on multiple wavelength regions of auroralemissions It is found that the overall operational performance of the instruments as auroral spectrometershas reached a higher level Particularly from the standpoint of exibility in operation mechanical stability ofcomponents and simplicity of construction and adjustment The ability of one spectrometer to operate onseveral wavelength regions with high spectral resolution speed and sensitivity has gained new possibilitiesin the eld of auroral spectroscopy
Introduction
In Herman Ebert described a spectrometer using a spherical mirror and a plane grating His sketchis reproduced in Fig and shows the instrumentas a photographic spectrograph This optical systemthe Ebert monochromator formed sharp images for avery narrow spectral range Later in William GFastie improved the performance of the instrument using curved slits instead of straight slits Fastie Problems of astigmatism became less and consequentlythe resolution of the instrument was improved The instrument is now known as the EbertFastie spectrometer
The m EbertFastie spectrometer was constructedby W G Fastie at John Hopkins University Marylandat the beginning of the s In all ve of these instruments have been produced In one was transferred together with a
m EbertFastie spectrometer
to Nordlysstasjonen Svalbard from the Geophysical Institute University of Alaska In addition a m EbertFastie spectrometer was transferred to Poker Flat research range Alaska The
m EbertFastie spectrom
eter was constructed during the s deploying Fastiesndings about the improved Ebert monochromatorThis spectrometer was originally constructed for rocketmeasurements but numerous of these instruments havealso been used for groundbased measurements
The introduction of photon counting and computercontrol of these instruments was conducted by Abas GSivjee at Geophysical Institute University of Alaska inthe mid s Sivjee et al This work has continued during the last decade to enhance the computercontrol of these instruments But the original designof the operational hardware has not changed since theinstruments were installed Data from these instruments are widely published and recognized but in order to meet present and future requirements in auroralspectroscopy it became apparent that an upgrade wasneeded Both of the m EbertFastie spectrometersmentioned above have been further upgraded with newcontrolling hardware and software which depart in itsmajor mechanical features from past equipment Thispaper describes and discusses the new operational systems of the instruments Measurements of the aurorallines N
A NG N
A NG andthe Doppler shifted and broadened hydrogen line H
A have been carried out in order to demonstratethe performance of the instruments as auroral spectrometers at both optical sites
Fred Sigernes
Comment on Text
This paper is not published. Never will.
SIGERNES ET ALUPGRADE OF THE EBERTFASTIE
GS
Κ Κ
Η
l1 l2
P
Figure Reproduction of Eberts sketch of his spectrometer l and l are light baes P photographicplate G grating S entrance slit plane and H sphericalconcave mirror K is side plates parts of the framework for the optical components and the housing toblock stray light
The rest of this paper contains a discussion of theseresults
Opticalmechanical arrangement
The aim of the present EbertFastie spectrometers isto record the emission spectra of the aurora and nightglow Fig shows the optical arrangement of anEbertFastie spectrometer The principal componentsof the instrument are one large spherical mirror oneplain diraction grating and a pair of slits The recordedradiance from the sky is limited by the etendue theproduct of the area of the entrance slit and the eld ofview Because of the low intensity of the source the
f
N
S
W
β
φ
θ
α
M
S2 S1
L
C
G
Figure Arrangement of EbertFastie N is gratingnormal grating angle diraction angle incidentangle s distance between entrance and exit slit w slitwidth and f focal length of the spherical mirror Thefocal length is ideally R
where R is the radius of the
concave spherical mirror is constant for given spectrometer tan s
f M is spherical concave mirror C
cooled photomultiplierhousing and L light pipe Sand S are entrance and exit slits respectively
etendue is made as large as possible The image of theentrance slit is reected and focused by one part of thespherical mirror onto the plane grating The secondpart of the mirror focuses the diracted light from thegrating onto the exit slit When the grating turns theimage of the entrance slit is scanned across the exit slit
A lightpipe transfers the image at the exit slit tothe front of a photomultiplier tube The photomultiplier tube is mounted in a Peltier cooled housing sincesensitivity is improved by cooling the photocathode ofthe tube Signals from the tube are amplied and discriminated before entering the counter card The tubes
SIGERNES ET ALUPGRADE OF THE EBERTFASTIE
are of the GaAs type and the spectral response ofthese tubes covers a wide range from to AThe quantum eciency is nearly independent of wavelength Filters in front of the entrance slit are usedto prevent overlapping orders The counter card is adaughter board designed for use with a parallel IObaseboard for the controlling computer The designof the counter card as a daughter board allows up tofour such daughter boards to be installed on one Baseboard The maximum count rate of this pulse counteris MHz
A picture of the upgraded EbertFastie spectrometer located under a ve foot dome inside the OpticalObservatory at Poker Flat research range Alaska isshown in g This spectrometer is xed in geographical zenith with slits aligned along the magneticmeridian The position of the grating is controlled bya high resolution stepping motor A full sized PCcard installed in the controlling computer gives information on acceleration velocity and position to an Indexer The microprocessor of the indexer uses this information to generate pulse rates up to persecond These pulses drive the stepping motor Thistechnique known as microstepping is used to obtainhighresolution rotational motion The motor is capable of doing individual steps per revolution Toobtain high enough resolution on the movement of thegrating a gear box belt drive is connected betweenthe engine shaft and the grating shaft This gives sixtimes better resolution of the grating movement compared with the motor shaft It is possible to rotatethe motorgrating to a precise position and stop rotate at a constant velocity alternate back and forthbetween two angular positions or use a combination ofsuch moves
Additional logic provides monitoring limit switchesand a home position switch A regular HeliumNeonlaser is used combined with a mirror mounted on themotor shaft to trigger a photoresistor to ensure thehome position of the grating in zero order An ordinarymm lens works as focusing element of the divergingreected laser beam In front of the photoresistor isa pinhole to make sure of exact home position Thisestablishes an absolute reference point for the instrument which is frequently checked during operation Alight bae with shutter is situated in front of the entrance slit to make the eld of view sucient narrowThe upgraded m EbertFastie spectrometer locatedat Nordlysstasjonen Svalbard uses an incremental encoder instead of the laser system described above
Figure The upgraded blue m EbertFastie spectrometer at Poker Flat research range Alaska
Fig shows the instrumental setup of this instrument together with the
m EbertFastie spectrometer
This motor is capable of doing individual stepsper revolution and is connected to a line encoderThe encoder shaft is mounted to a rotary table Therotary table has a gear ratio of and is mounted directly to the grating shaft The same additional logicas described above provide monitoring limit switchesand a home position switch by an indexer Homing isprovided by a magnetic relay mounted on the rotarytable This custom made system is capable of doing steps per revolution of the grating with exactposition tracking The home position is therefore onlychecked once during an observational period
SIGERNES ET ALUPGRADE OF THE EBERTFASTIE
Figure The upgraded green m EbertFastie spectrometer at Nordlysstasjonen Svalbard The black instrument to the right is the
m EbertFastie spectrom
eter
The entrance optics to the spectrometers is a periscopewhich can be turned in dierent directions along thegeomagnetic meridian lling the eld of view of thespectrometers The eld of view is degrees
Theory of instrument
The performance of the instrument depends on linearand angular dispersion bandpass and calibration Theoperation of a perfect instrument discussed below assumes no spherical aberration astigmatism or gratingghosts
The well known equation for the plane grating in
the instrument is
n a sin sin
Here is wavelength n spectral order incident angle diraction angle and a is the grating constantsee g Dening and we obtain
d
d
a cos
n
where d is the angular separation between two emissions grating angle and d the wavelength separation between the two emissions d
dis known as angular
dispersion When d is small the corresponding distance in the exit plane will be dx f d where f isfocal length of mirrorThe linear dispersion d
dx is then given by
d
dxa cos
n f
It denes the extent to which a spectral interval isspread out across the focal plane of the spectrometerIt is associated with the ability of the instrument toresolve ne spectral detail It is seen from equation that the linear dispersion becomes smaller for higherspectral order The bandpass BP of the instrument isdened
BP d
dxw
where w is the width of the exit slit Normally theentrance and exit slits have the same width ThenBP is the instrumental line width the halfwidth ofa innite narrow line passing through the instrumentand recorded By halfwidth is meant the full widthat half maximum FWHM When the curved entranceand exit slits are perfectly matched the prole of theline will be triangular
Wavelength calibration is achieved by the use ofstandard emission lamps Since the stepping motoris connected to the grating shaft through a belt or agear drive each step in wavelength between data pointshas to be calculated according to the grating equationBetween each step of the motor the grating rotates aconstant angle If N is the total number of datapoints steps in one wavelength region and is thestart angle of the grating then an arbitrary wavelengthin this region can be found from equation
i
a cos
n
sin i
SIGERNES ET ALUPGRADE OF THE EBERTFASTIE
where i runs from one to N Using this method to obtain an intensity versus wavelength plot in one region of interest with at least tworecognizedknown wavelengths I and II the calibrated wavelength i can be interpolated through
z
z
II I
II i
where z is the distance between II and I and zthe dierence between i and II Eq can onlybe used when there is a linear relation between wavelengths and rotation of the grating It is now possible to nd the true start angle and stop angle Nof each region The number of data points does notchange in this operation
N
N
and the true step in angle can be found Thecalibrated values in wavelength is then simply
i
a cos
n
sin i
where NN
can be seen has a calibration factorof
Ideally each photon entering the instrument will betransformed to an electronic pulse by the photomultiplier but some loss will always occur The throughputcan be considered as an equivalent for the sensitivityor wavelength dependent calibration curve of the instrument giving the ratio of electronic counts out tothe number of photons passing through the instrumentIt is necessary to calibrate the instrument against aknown light source to obtain the spectral intensity inabsolute units The absolute calibration arrangementis shown in Fig The eld of view of the instrument has to be insidethe fully illuminated area of the screen which is diffusely reemitting B is the known intensity of theTungsten lamp in Rayleigh per Angstrm obtained ata distance r away from the lamp The intensity Bof the screen at a distance R away from the lamp wouldthen be
B B rR
cos
R
A!
If C is the corresponding measured counts per unittime produced by the intensity of the Tungsten lampa measured auroral line with relative intensity Im
Periscope 45 Deg.
Diffuse ReemittingScreen
30 m
AbsoluteCalibration
tower
TungstenLamp
East Observing dome
Tv hutMsphut
Observing Deck
Red hut
Figure Absolute calibration setup R m is distance between the calibration lamp a Tungsten lampand the entrance slit normal the vertical
is the angle between this vertical and the plane of thediuse reemitting screen
counts per unit time will have the intensity I inabsolute units
I
B
C
Im
R
A!
The throughput of the instrument is inuenced by theordersorting lter at the entrance slit because the lter itself has a characteristic transmission response dependent on wavelength Normally compromise has tobe made between ability of the instrument to resolvespectral details and expected throughput which is alsodepends on the blaze angle of the grating The most effective tilt angle of the grating is preferred The resultof the compromise is given by the resulting spectra
Measurements and discussion
As an example of the performance of the instrumentswe now describe eld observations of auroral spectra
The rst night of observation for the m EbertFastie spectrometer located at Poker Flat research rangeAlaska was on November The optical eld siteat the range is operated by the University of Alaskaand is a suitable location for nighttime observations ofthe aurora for much of the winter season
A diuse auroral arc with no structure appeared inthe north at about local time LT and it movedfast into our eld of view The eld of view of the spectrometer looking straight up with slits aligned alongthe magnetic meridian resulted in a measured area at km altitude of about x km Viereck et al The activity increased at about LT andmore structured arcs were observed At about LT the activity started to decrease Fig show calibrated spectra taken during this period comprising
SIGERNES ET ALUPGRADE OF THE EBERTFASTIE
A panel A A panel B and A panel C The wavelength regions contain the auroral N
A NG N
ANG and H A emission lines respectivelyEach panel is plotted as a function of time wavelengthand intensity The intensities are given in R and thegrayscale bars to the right indicate the intensity rangeof each obtained region Also shown below each grayscaled plot is the mean prole throughout the time period and the total intensity integrated over the holewavelength region The measurements are averaged inintervals of minutes to increase the signal to noiseratio All wavelength regions were obtained in the second order The scan time for each region was about seconds The stepping motor used approximately second to skip between dierent regions which makesa total scan time of about seconds Some secondsare lost in seeking the home position after each totalscan in wavelength but is necessary in order to keeptrack of the exact position of the grating
Fig shows data from the m EbertFastie spectrometer located at Nordlysstasjonen in AdventdalenSvalbard During the boreal winter the sun is morethan degrees below the horizon for two months whichpermits optical measurements throughout the daytimeand nighttime period The instrument was set up tomeasure the auroral emissions H A in the secondorder A panel A and N
A NG in the third order A panel B Alsoshown in g is data from the
m EbertFastie spec
trometer scanning in the second order Apanel E throughout the hole day The angle of theperiscope was degrees relative to the vertical pointing south which at the site is degrees relative to thegeomagnetic eld The eld of view is degrees lookingalong the magnetic eld lines
On this day the of January the activitywas high with great substorms on the nightside Atabout UT discreet morning arcs were observed followed by patchy prenoon arcs in the zenith Againat about UT the oval went south as geomagneticnoon approached The long tail of the Doppler proleshown in panel A extends down to A indicatinghigh energy of the incoming hydrogenproton particlesMore narrow proles about A wide appeared closerto noon indicating that the initial proton bulk energydecreased The rotational structure of the N
A NG emission band is clearly shown in panelB especially when the intensity of Hydrogen lines increases Due to scattered sunlight the background lightlevel rises when approaching local noon This eect is
seen as a continuous increase in the intensity over theentire wavelength region around UT in the grayscaled plot of panel E
On the of January the SCIFER rocket waslaunched from Andya rocket range to study ionoutowin the prenoon region of the auroral oval Nordlysstasjonen was used as headquarter for the campaign and thespectrometers were operative during the launch window See g Again discreet morning arcs alignednortheast to southwest geomagnetic coordinateswere observed until about UT Patchy prenoon arcswere observed to move into the eld of view of the spectrometers from to UT The cusp on thisday was situated to the north of the station appearingat about UT Throughout most of the prenoonmorning the spectrometers measured weak Dopplershifted auroral H and H proles documenting ioninow
The total scan time of the m EbertFastie atNordlysstasjonen in Adventdalen was seconds using and seconds in each wavelength region respectively The seconds used between scans is necessary in order to make sure that the position trackingof the encoder is stable After each move of the gratingmotor the encoder reports the actual position according to the position counter If an error occursthe motor is instructed to correct its position Whenthe nal position is reached the counters are reset andexecuted before the next move is conducted It is important to initiate the indexer with the correct velocity and acceleration between dierent modes of movements If the velocity or the acceleration is set to highthe system becomes unstable and a stall occurs Asmall backlash in the rotary table occurs when themotorgrating turns to move in the opposite directionafter having obtained data from the nal wavelengthregion This error is less than one motor step It iscorrected by moving the motor all the way back to itshome position where it again turns and moves up toits rst wavelength region
The motor of the Poker Flat instrument is ratherlarge in physical size and strength compared to theloadgrating it is moving A large motor is more stable than a small motor due to less resonance from theindexermotor causing instabilities in the microstepping at low speeds There was no backlash found during operation of the instrument which favor the useof a belt drive instead of a rotary table The homeposition was checked frequently between each sweep inwavelength and worked as an absolute reference pointbetween scans
SIGERNES ET ALUPGRADE OF THE EBERTFASTIE
Figure Spectrometer grayscale plots for November at Poker Flat research range Alaska of theauroral emission lines N
A NG panel A N
A NG panel B and the Doppler shiftedH A panel C for the time period LT Intensities are plotted as a function of local time andwavelength The grayscaled bars to the right indicates the intensities in Rayleighs per Angstrm The averagespectra and the total intensities are shown below each grayscale plot
SIGERNES ET ALUPGRADE OF THE EBERTFASTIE
Figure Spectrometer grayscale plots for January at Nordlysstasjonen in Adventdalen SvalbardPanel A shows the auroral Doppler shifted H A for the time period UT Panel B showsthe auroral N
A NG emission line in the time perion UT Panel E shows the auroralemission lines OI! A OI! A and the Doppler shifted H A for the time period UT The intensities are plotted as a function of time and wavelength The grayscaled bars to the right indicatesthe intensities in Rayleighs per Angstrm The average spectra and the total intensities are shown below eachgrayscale plot
SIGERNES ET ALUPGRADE OF THE EBERTFASTIE
Figure Spectrometer grayscale plots for January at Nordlysstasjonen in Adventdalen SvalbardPanel A shows the auroral Doppler shifted H A in the time period UT Panel B shows theauroral N
A NG emission line for the time period UT Panel E shows the auroralemission lines OI! A OI! A and the Doppler shifted H A for the time period UT The intensities are plotted as a function of time and wavelength The grayscaled bars to the right indicatesthe intensities in Rayleighs per Angstrm The average spectra and the total intensities are shown below eachgrayscale plot
SIGERNES ET ALUPGRADE OF THE EBERTFASTIE
The laser homing system worked quite well but theexact position and behavior of the motor during sampling of data was not known producing a lack of about A in the bandpass of the data shown in g Thisproblem is eliminated by the use of a high resolutionencoder
The obtained spectra by the m EbertFastie atNordlysstasjonen of the auroral N
A NG emission band indicate that the bandpass is deviatingabout A to the corresponding bandpass calculatedaccording to equation It should be mentioned thata very small misalignment in the optical components ofthe instrument can produce the same magnitude of error in the bandpass The motor used on the spectrometer at Nordlysstasjonen is small compared to the corresponding motor on the Poker Flat instrument and hasonly twice the torque necessary to move the load Andas described earlier a small error in position may occurafter each move due to resonance If an error occursthe motorencoder uses about msec to correct the position A larger motor would not totally eliminate thisproblem but a small decrease in time used betweenscans could be achieved In order to do a maximumoptimalization a larger motor and a belt drive insteadof the rotary table could be used combined with theencoder to decrease the scan time and eliminate thebacklash respectively
Fine adjustments of the optical components in anauroral spectrometer to achieve optimal performance isoften time consuming and dicult In the near vicinityof the spectrometers hardware is setup which enablesdirect access and control of the motors It is possibleto rotate the grating to a precise position and stoplook at a spectral line output image at the exit slitadjust the optical the components and view the result Since the motor has a holding torque when notmoving the output spectral image at the exit slit canbe improved by adjusting only one of the optical components This makes ne tuning considerable easierthan before When the spectrometers are tuned upadjustments of wavelength calibration is reduced to aminimum Also it is now possible to make the grating sequently alternate between several narrow angularintervals This enables one instrument to operate onmore than one wavelength region
The emissions lines N
A NG N
A NG and H A were chosen to demonstrate that the upgraded spectrometers are capable ofisolating any auroral emission whether it is contaminated with overlapping emissions or weak and Dopplershifted to tens of Angstrm The ability of a spectrometer to measure several wavelength regions of auroral
emissions with high speed resolution and sensitivityimproves the possibility of obtaining corresponding exact emission ratios Simply also based on the fact thatonly one detector has to be calibrated The intensityratios between the Doppler shifted hydrogen lines andthe N
NG bands which are strongly dependent onthe energy characteristics of the incoming proton uxRees " Van Zyl et al can now be closelystudied and used to obtain dierential energy particlespectra directly from groundbased measurements
Realtime data from the m EbertFastie spectrometer located at Nordlysstasjonen in Adventdalen Svalbard is available to the scientic community throughinternet
Concluding remarks
The upgraded EbertFastie spectrometers described aboveare improved in several aspects The principal resultsobtained by this study may be summarized as follows The use of a high resolution stepping motor mountedto the grating shaft of an auroral EbertFastie spectrometer combined with an incremental encoder or alaser homing system improves the overall operationalperformance of the instrument The ability of a stepping motor sequently to alternate a grating between narrow angular intervals makesan EbertFastie spectrometer able to measure on corresponding multiple wavelength regions with high speedresolution and sensitivity A study of spectral emission ratios can be conductedby the use of one EbertFastie spectrometer Absoluteand wavelength calibration is only necessary for onedetector Energy characteristics of incoming particleuxes which excite the aurora can be studied in detailfrom groundbased observations No hands on operations is necessary in order tochange setup of the instruments during an observational period and adjustments of wavelength calibration is reduced to a minimum Fine tuning for optimal performance is no longertime consuming To achieve a minimum of instabilities in the microstepping at low speeds the motor is recommendedto have at least twice the torque necessary to move theload A belt drive is recommended instead of a rotarytable between the grating shaft and the motor in orderto eliminate backlash Optimal optical performance is achieved by using ahigh resolution encoder to enable position tracking
SIGERNES ET ALUPGRADE OF THE EBERTFASTIE
Acknowledgements Financial support for this research
was provided the National Science Foundation the Geo
physical Institute University of Alaska NASA The Uni
versity Studies on Svalbard and the Auroral Observatory
University of Troms We would like to thank Jim Baldrigde
for technical assistance The support and belief of Drs
Chuck Deehr Roger Smith and Kjell Henriksen are appre
ciated
References
Fastie W G A Small plane grating monochromatorJ Opt Soc Am
Fastie W G Image forming properties of the Ebertmonochromator J Opt Soc Am
Rees M H On the interaction of auroral protonswith the Earths atmosphere Planet Space Sci
Sivjee G G Romick G J and Rees M H Intensity ratio and center wavelengths of OII A line emissions Astrophys J
Van Zyl B Gealy M W and Neumann H Prediction of photon yields for proton aurorae in N
atmosphere J Geophys Res
Viereck R A and Deehr C S On the Interactionbetween gravity waves and the OH Meinel and the O atmospheric bands in the polarnight airglow J Geophys Res