Revision: 09-09-2021 1 Safety Dashboard Manager’s Guide Tip: Select Ctrl + F to search for any key word in this document. The purpose of the Manager’s Guide is to lend a deeper understanding of each Safety metric that is available to you on the Safety Dashboard on E=Vision. It will provide for each metric: • Range/ Target • Definition/ Explanation • Why it’s important? • How do I improve? • Which level on the Hazard Pyramid the metric is placed
Transcript
Revision: 09-09-2021 1
Safety Dashboard Manager’s Guide
Tip: Select Ctrl + F to search for any key word in this document.
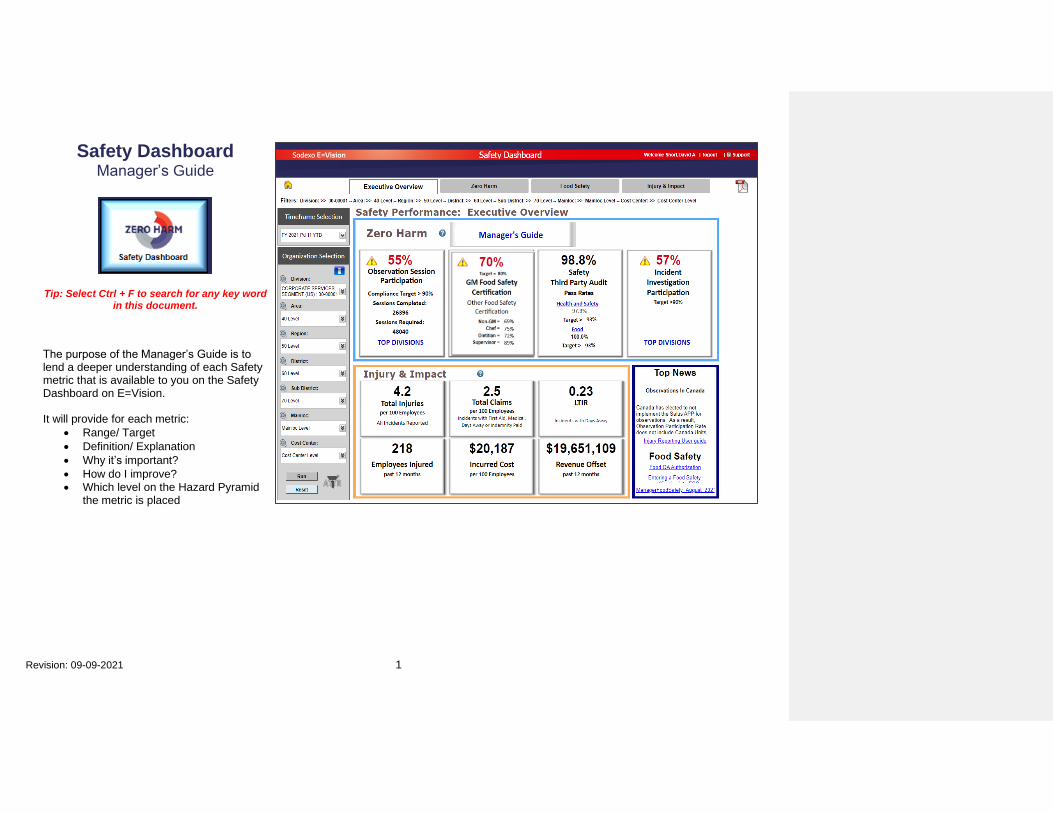
The purpose of the Manager’s Guide is to lend a deeper understanding of each Safety metric that is available to you on the Safety Dashboard on E=Vision.
It will provide for each metric:
• Range/ Target
• Definition/ Explanation
• Why it’s important?
• How do I improve? • Which level on the Hazard Pyramid
the metric is placed
Revision: 09-09-2021 2
Executive Overview – Zero Harm
Revision: 09-09-2021 3
Metric Range/ Target Definition/ Explanation Why it’s important? How do I improve? Observation Session Participation Rate
Range 0 to 100%
Target >=90%
The percent of required workplace safety observation sessions completed.
Observation sessions are conducted by unit management who have access to the observation tracking system called Salus App VIA computer or mobile device (IOS and Android). During the 20-minute observation session, the manager observes behaviors engages with employees to recognize safe behaviors, and corrects unsafe behaviors.
Workplace safety observation sessions are critical for identifying systemic behaviors and conditions that lead to injuries. By conducting observation sessions, management and employees can identify hazards before injuries occur. The identification of risks is the first step in prevention.
Rates improve when more users in the safety observation system conduct the targeted number of observation sessions every month. Targets are set by the system administrator and are typically set at eight sessions per trained manager per month. Rates increase (i.e. improve) as observers conduct more sessions each month until they reach their monthly goals.
% Observations Safe
Range 0 to 100%
Target 50% - 70%
The percent of total workplace behaviors observed during observation sessions conducted by unit management and recorded in the Salus App. as "safe".
This measure is used to show the balance of safe to unsafe observations. High rates may indicate a falsely optimistic view or a failure to properly recognize potential hazards. Low rates may indicate an imbalanced approach and a disregard for activities that are good. A balanced approach includes a relatively equal ratio of safe to unsafe observations.
Rates improve when observers make an equal number of safe to unsafe observations. To ensure observations are equally proportioned, try to make one positive observation for every negative observation you log.
Practice constructive "course corrections" for any identified unsafe behaviors, and monitor employee behavior moving forward to ensure safe behaviors are sustained.
Commented [SD1]: Remove
Revision: 09-09-2021 4
Observation Sessions Completed
Range 0+
Target N/A
Total number of observation sessions Completed
Observation sessions are conducted by unit management who have access to the observation tracking system called Salus App VIA computer or mobile device (IOS and Android). During the 20-minute observation session, the manager observes behaviors engages with employees to recognize safe behaviors, and corrects unsafe behaviors.
Workplace safety observation sessions are critical for identifying systemic behaviors and conditions that lead to injuries. By conducting observation sessions, managers and employees can identify hazards before injuries occur. The identification of risks is the first step in prevention.
Have all managers within each location trained in conducting workplace safety observation sessions and recording the session results in the Salus App.
Make conducting safety observation sessions a priority and ensure each manager conducts the prescribed number of sessions each month.
Observation Sessions Required
Range 0+
Target N/A
Total number of observation sessions Required. The current target is 1 per week per manager using the Salus App VIA computer or mobile device. (Please refer to your segment leadership for segment specific targets.) Observation sessions are conducted by unit management who have access to the observation tracking system called Salus App VIA computer or mobile device (IOS and Android). During the 20-minute observation session, the manager observes behaviors engages with employees to recognize safe behaviors, and corrects unsafe behaviors.
A higher number means there are more managers to perform and record safety observation, sessions which is foundational for supporting and sustaining a Zero Harm mindset and environment.
Have all managers within each location trained to conduct observation sessions and how to record the session results in the Salus App.
Reach out to your HSE Manager for training information.
Revision: 09-09-2021 5
Metric Range/ Target
Definition/ Explanation
Why it’s important? How do I improve?
General Manager Certification Rate
* Certification results are by period not YTD
Range 0 to 100%
Target >=80%
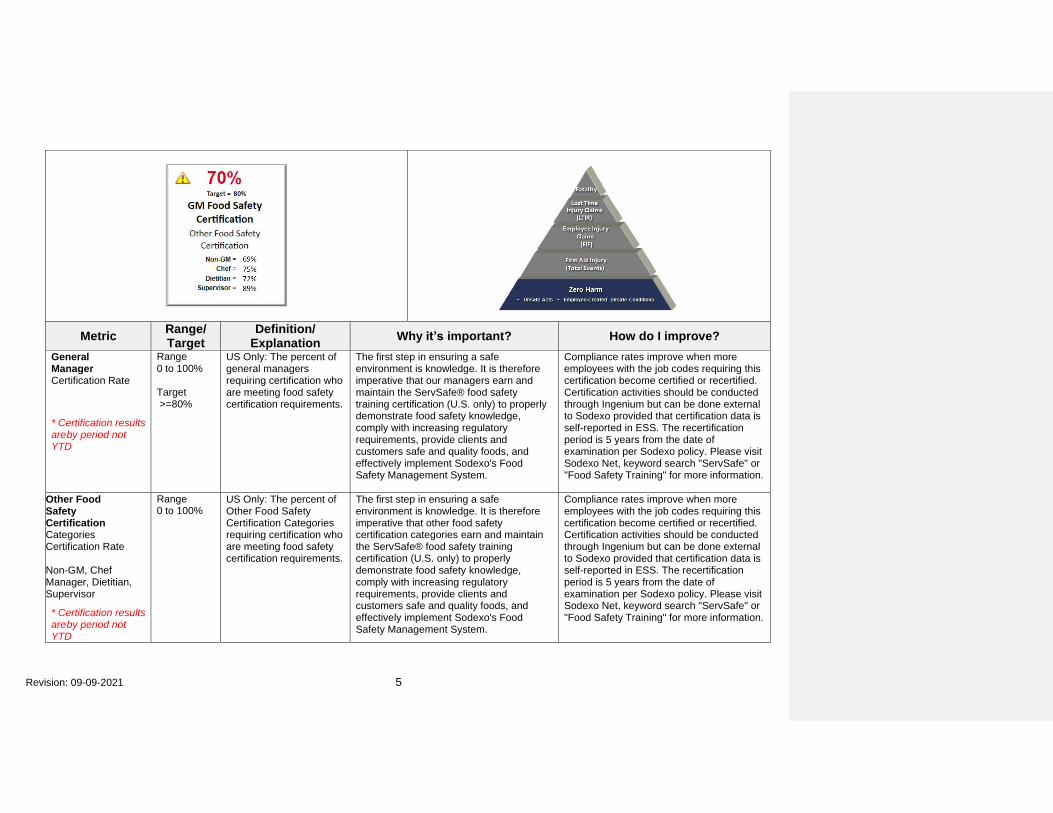
US Only: The percent of general managers requiring certification who are meeting food safety certification requirements.
The first step in ensuring a safe environment is knowledge. It is therefore imperative that our managers earn and maintain the ServSafe® food safety training certification (U.S. only) to properly demonstrate food safety knowledge, comply with increasing regulatory requirements, provide clients and customers safe and quality foods, and effectively implement Sodexo's Food Safety Management System.
Compliance rates improve when more employees with the job codes requiring this certification become certified or recertified. Certification activities should be conducted through Ingenium but can be done external to Sodexo provided that certification data is self-reported in ESS. The recertification period is 5 years from the date of examination per Sodexo policy. Please visit Sodexo Net, keyword search "ServSafe" or "Food Safety Training" for more information.
Other Food Safety Certification Categories Certification Rate Non-GM, Chef Manager, Dietitian, Supervisor
* Certification results are by period not YTD
Range 0 to 100%
US Only: The percent of Other Food Safety Certification Categories requiring certification who are meeting food safety certification requirements.
The first step in ensuring a safe environment is knowledge. It is therefore imperative that other food safety certification categories earn and maintain the ServSafe® food safety training certification (U.S. only) to properly demonstrate food safety knowledge, comply with increasing regulatory requirements, provide clients and customers safe and quality foods, and effectively implement Sodexo's Food Safety Management System.
Compliance rates improve when more employees with the job codes requiring this certification become certified or recertified. Certification activities should be conducted through Ingenium but can be done external to Sodexo provided that certification data is self-reported in ESS. The recertification period is 5 years from the date of examination per Sodexo policy. Please visit Sodexo Net, keyword search "ServSafe" or "Food Safety Training" for more information.
Revision: 09-09-2021 6
Metric Range/ Target
Definition/ Explanation
Why it’s important? How do I improve?
Safety Third Party Audit Pass Rate
Range 0 to 100%
Target N/A
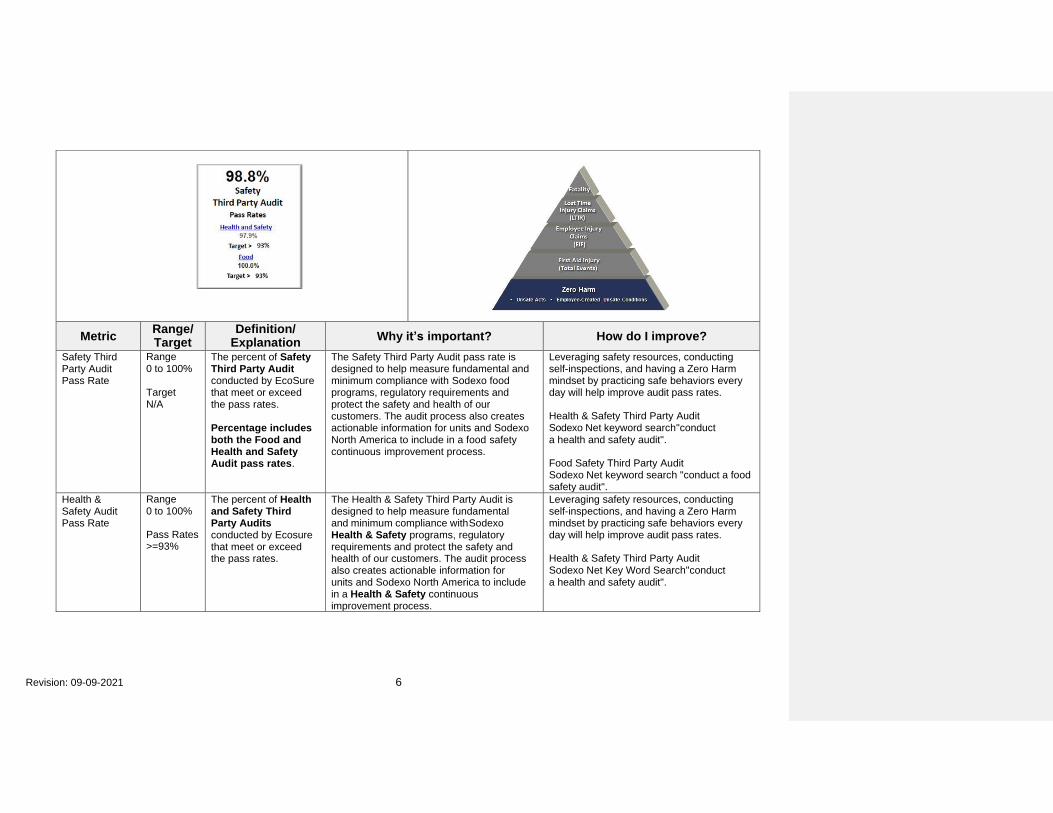
The percent of Safety Third Party Audit conducted by EcoSure that meet or exceed the pass rates. Percentage includes both the Food and Health and Safety Audit pass rates.
The Safety Third Party Audit pass rate is designed to help measure fundamental and minimum compliance with Sodexo food programs, regulatory requirements and protect the safety and health of our customers. The audit process also creates actionable information for units and Sodexo North America to include in a food safety continuous improvement process.
Leveraging safety resources, conducting self-inspections, and having a Zero Harm mindset by practicing safe behaviors every day will help improve audit pass rates.
Health & Safety Third Party Audit Sodexo Net keyword search "conduct a health and safety audit".
Food Safety Third Party Audit Sodexo Net keyword search "conduct a food safety audit".
Health & Safety Audit Pass Rate
Range 0 to 100%
Pass Rates >=93%
The percent of Health and Safety Third Party Audits conducted by Ecosure that meet or exceed the pass rates.
The Health & Safety Third Party Audit is designed to help measure fundamental and minimum compliance with Sodexo Health & Safety programs, regulatory requirements and protect the safety and health of our customers. The audit process also creates actionable information for units and Sodexo North America to include in a Health & Safety continuous improvement process.
Leveraging safety resources, conducting self-inspections, and having a Zero Harm mindset by practicing safe behaviors every day will help improve audit pass rates.
Health & Safety Third Party Audit Sodexo Net Key Word Search "conduct a health and safety audit".
Revision: 09-09-2021 7
Food Safety Audit Pass Rate
Range 0 to 100%
Pass Rates >=98%
The percent of Food Safety Third Party Audits conducted by EcoSure that meet or exceed the pass rates.
The Food Safety Third Party Audit is designed to help measure compliance with Sodexo Food Safety programs, regulatory requirements and protect the safety and health of our customers. The audit process also creates actionable information for units and Sodexo North America to include in a food safety continuous improvement process.
Leveraging safety resources, conducting self- inspections, and having a Zero Harm mindset by practicing safe behaviors every day will help improve audit pass rates.
Food Safety Audit: Sodexo Net Key Word Search "conduct a food safety audit".
Metric Range/ Target
Definition/ Explanation
Why it’s important? How do I improve?
Incident Investigation Participation
Range 0 to 100%
Target >=90%
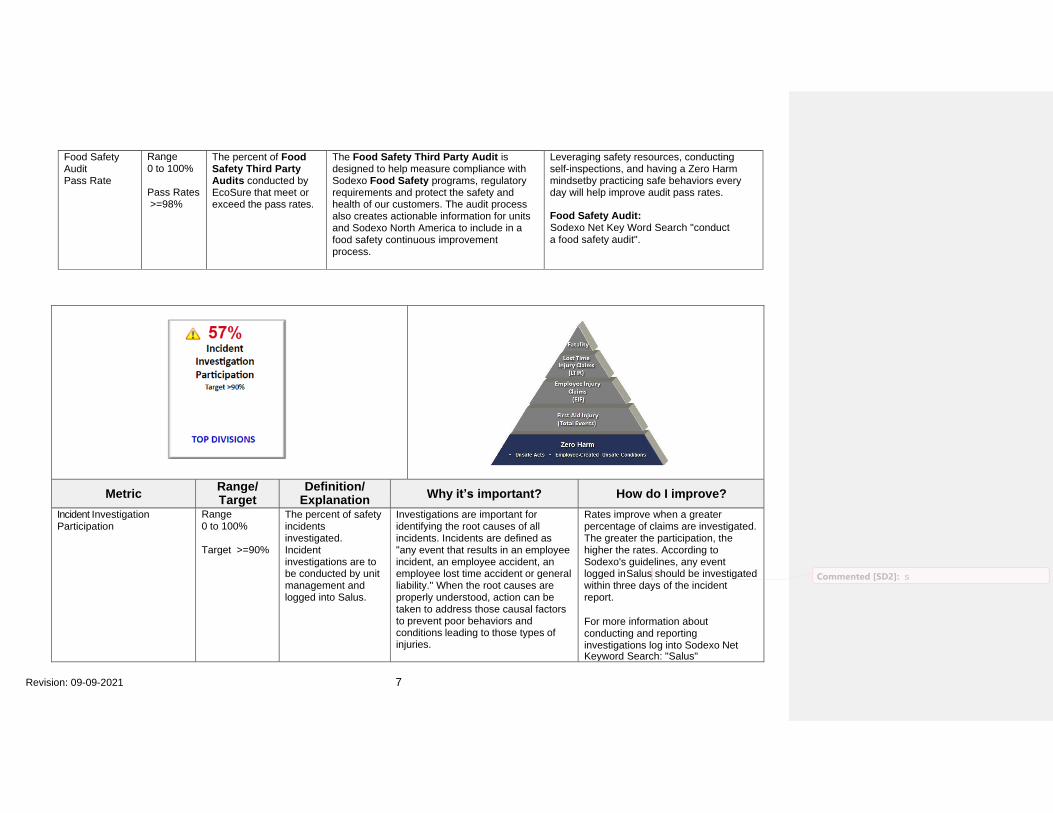
The percent of safety incidents investigated. Incident investigations are to be conducted by unit management and logged into Salus.
Investigations are important for identifying the root causes of all incidents. Incidents are defined as "any event that results in an employee incident, an employee accident, an employee lost time accident or general liability." When the root causes are properly understood, action can be taken to address those causal factors to prevent poor behaviors and conditions leading to those types of injuries.
Rates improve when a greater percentage of claims are investigated. The greater the participation, the higher the rates. According to Sodexo's guidelines, any event logged in Salus should be investigated within three days of the incident report.
For more information about conducting and reporting investigations log into Sodexo Net Keyword Search: "Salus"
Commented [SD2]: s
Revision: 09-09-2021 8
Executive Overview - Injury & Impact
Revision: 09-09-2021 9
Metric Range/ Target
Definition/ Explanation
Why it’s important? How do I improve?
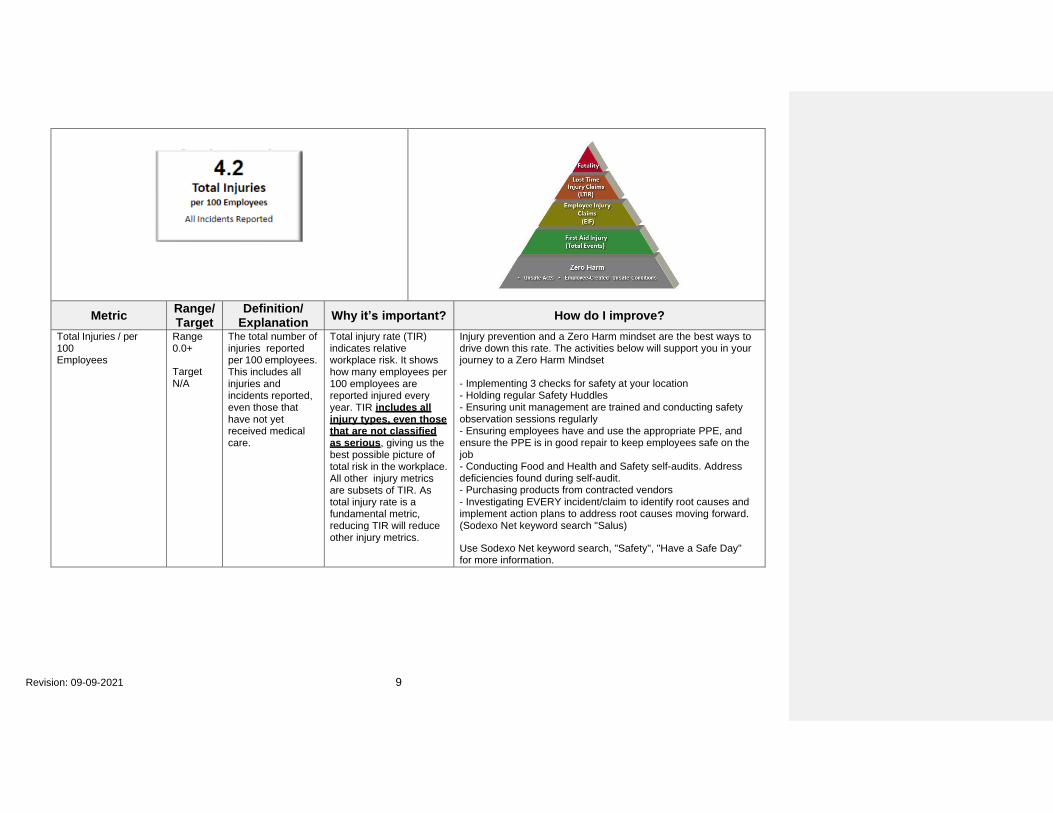
Total Injuries / per 100 Employees
Range 0.0+
Target N/A
The total number of injuries reported per 100 employees. This includes all injuries and incidents reported, even those that have not yet received medical care.
Total injury rate (TIR) indicates relative workplace risk. It shows how many employees per 100 employees are reported injured every year. TIR includes all injury types, even those that are not classified as serious, giving us the best possible picture of total risk in the workplace. All other injury metrics are subsets of TIR. As total injury rate is a fundamental metric, reducing TIR will reduce other injury metrics.
Injury prevention and a Zero Harm mindset are the best ways to drive down this rate. The activities below will support you in your journey to a Zero Harm Mindset
- Implementing 3 checks for safety at your location - Holding regular Safety Huddles - Ensuring unit management are trained and conducting safety observation sessions regularly - Ensuring employees have and use the appropriate PPE, and ensure the PPE is in good repair to keep employees safe on the job - Conducting Food and Health and Safety self-audits. Address deficiencies found during self-audit. - Purchasing products from contracted vendors - Investigating EVERY incident/claim to identify root causes and implement action plans to address root causes moving forward. (Sodexo Net keyword search "Salus)
Use Sodexo Net keyword search, "Safety", "Have a Safe Day" for more information.
Revision: 09-09-2021 10
Metric Range/ Target
Definition/ Explanation
Why it’s important? How do I improve?
Total Claims / per 100 Employees
Range 0.0+
Target N/A
The total number of workers comp claims per 100 employees. This includes all injuries classified as workers comp claims.
This measure shows how many workers compensation claims exist for every 100 employees. It includes all injuries that are converted into claims, including first aid, so it gives a solid picture of risk in the workplace.
Injury prevention and a Zero Harm mindset are the best ways to drive down this rate. The activities below will support you in your journey to a Zero Harm Mindset
- Implementing 3 checks for safety at your location - Holding regular Safety Huddles - Ensuring unit management are trained and conducting safety observation sessions regularly - Ensuring employees have and use the appropriate PPE, and ensure the PPE is in good repair to keep employees safe on the job - Conducting Food and Health and Safety self-audits. Address deficiencies found during self-audit. - Purchasing products from contracted vendors - Investigating EVERY incident/claim to identify root causes and implement action plans to address root causes moving forward. (Sodexo Net keyword search "Salus)
Use Sodexo Net keyword search, "Safety", "Have a Safe Day" for more information.
Revision: 09-09-2021 11
Metric Range/ Target
Definition/ Explanation
Why it’s important?
How do I improve?
LTIR Incidents with Days Away
Range 0.00+
Target See AIP Target
LTIR (Lost Time Injury Rate) refers to the occurrence rate of workplace incidents resulting in an employee's inability to work.
LTIR is calculated using 200,000 working hours or 100 employees working 40 hours per week.
This is essentially a measure of severe injuries per 100 employees. It is the smallest subset of claims and generally includes only the most severely injured employees.
Injury prevention and a Zero Harm mindset are the best ways to drive down this rate. The activities below will support you in your journey to a Zero Harm Mindset
- Implementing 3 checks for safety at your location - Holding regular Safety Huddles - Ensuring unit management are trained and conducting safety observation sessions regularly - Ensuring employees have and use the appropriate PPE, and ensure the PPE is in good repair to keep employees safe on the job - Conducting Food and Health and Safety self-audits. Address deficiencies found during self-audit. - Purchasing products from contracted vendors - Investigating EVERY incident/claim to identify root causes and implement action plans to address root causes moving forward. (Sodexo Net keyword search "Salus)
Use Sodexo Net keyword search, "Safety", "Have a Safe Day" for more information.
Revision: 09-09-2021 12
Metric Range/ Target
Definition/ Explanation
Why it’s important?
How do I improve?
Employees Injured past 12 Months
Range 0+
Target N/A
The number of employees injured within the past 12 months.
This measure shows the total number of employees injured within the past 12 months. The goal is to drive this number to zero.
Injury prevention and a Zero Harm mindset are the best ways to drive down this number. The activities below will support you in your journey to a Zero Harm Mindset
- Implement 3 checks for safety at your location - Hold regular Safety Huddles - Ensure unit management is trained and conducts safety observation sessions regularly - Ensure employees have and use the appropriate PPE, and ensure the PPE is in good repair to keep employees safe on the job - Conduct Food and Health and Safety self-audits. Address deficiencies found during self-audit. - Purchase products from contracted vendors - Investigate EVERY incident/claim to identify root causes and implement action plans to address root causes moving forward. (Sodexo Net keyword search "Salus)
Use Sodexo Net keyword search, "Safety", "Have a Safe Day" for more information.
Revision: 09-09-2021 13
Metric Range/ Target
Definition/ Explanation
Why it’s important?
How do I improve?
Incurred Workers' Compensation Cost / per 100 Employees
Range $0+
Target N/A
The average incurred* cost per 100 employees. Workers' Compensation cost incurred includes amounts paid to date for legal defense, medical treatment, and lost wages as well as future amounts (reserves) expected based on current information. Since claims develop and evolve over time, the ultimate claim cost will be different and probably higher.
This measure shows the cost of treatment incurred* per 100 employees. High rates imply greater injury severity and/or frequency. Lower rates suggest an improvement in the prevention of serious injuries and/or a reduction in the frequency of overall injuries.
This rate and its components are confidential information and are never to be shared with clients, employees, or their representatives.
Injury prevention and a Zero Harm mindset are the best ways to drive down this rate. The activities below will support you in your journey to a Zero Harm Mindset
- Implementing 3 checks for safety at your location - Holding regular Safety Huddles - Ensuring unit management are trained and conducting safety observation sessions regularly - Ensuring employees have and use the appropriate PPE, and ensure the PPE is in good repair to keep employees safe on the job - Conducting Food and Health and Safety self-audits. Address deficiencies found during self-audit. - Purchasing products from contracted vendors - Investigating EVERY incident/claim to identify root causes and implement action plans to address root causes moving forward. (Sodexo Net keyword search "Salus)
Use Sodexo Net keyword search, "Safety", "Have a Safe Day" for more information.
Revision: 09-09-2021 14
Metric Range/ Target
Definition/ Explanation
Why it’s important?
How do I improve?
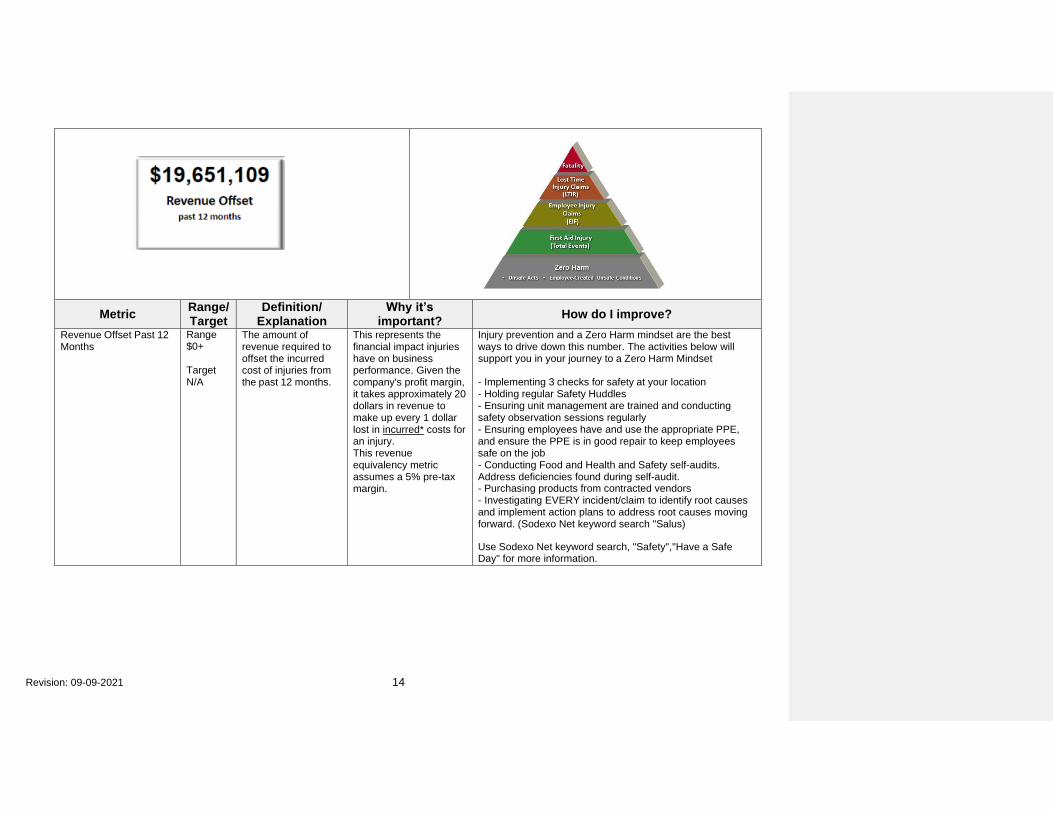
Revenue Offset Past 12 Months
Range $0+
Target N/A
The amount of revenue required to offset the incurred cost of injuries from the past 12 months.
This represents the financial impact injuries have on business performance. Given the company's profit margin, it takes approximately 20 dollars in revenue to make up every 1 dollar lost in incurred* costs for an injury. This revenue equivalency metric assumes a 5% pre-tax margin.
Injury prevention and a Zero Harm mindset are the best ways to drive down this number. The activities below will support you in your journey to a Zero Harm Mindset
- Implementing 3 checks for safety at your location - Holding regular Safety Huddles - Ensuring unit management are trained and conducting safety observation sessions regularly - Ensuring employees have and use the appropriate PPE, and ensure the PPE is in good repair to keep employees safe on the job - Conducting Food and Health and Safety self-audits. Address deficiencies found during self-audit. - Purchasing products from contracted vendors - Investigating EVERY incident/claim to identify root causes and implement action plans to address root causes moving forward. (Sodexo Net keyword search "Salus)
Use Sodexo Net keyword search, "Safety", "Have a Safe Day" for more information.
Revision: 09-09-2021 15
Revision: 09-09-2021 16
Metric Range/ Target
Definition/ Explanation
Why it’s important? How do I improve?
Food Product Compliance
Range 0 to 100%
Target N/A
Food Product Compliance is not the same as Product Compliance found in the E=Vision financial dashboard. The Safety Dashboard Food product compliance measure is actually a subset of the E=Vision Product Compliance as it includes only food purchases and food prime vendors. It is calculated as:
Compliant food product purchases from Prime Food Vendors divided by total food purchases from Prime Food Vendors.
Purchasing right products from vendors identified as Prime ensures that not only the vendor but the products have been properly vetted by Supply Management for product quality and safety. It also helps to ensure the security of the supply chain and the traceability of all products.
Use Prime Vendors for your primary Purchases and purchase the compliant products through prime to improve your score.
Revision: 09-09-2021 17
Metric Range/ Target
Definition/ Explanation
Why it’s important? How do I improve?
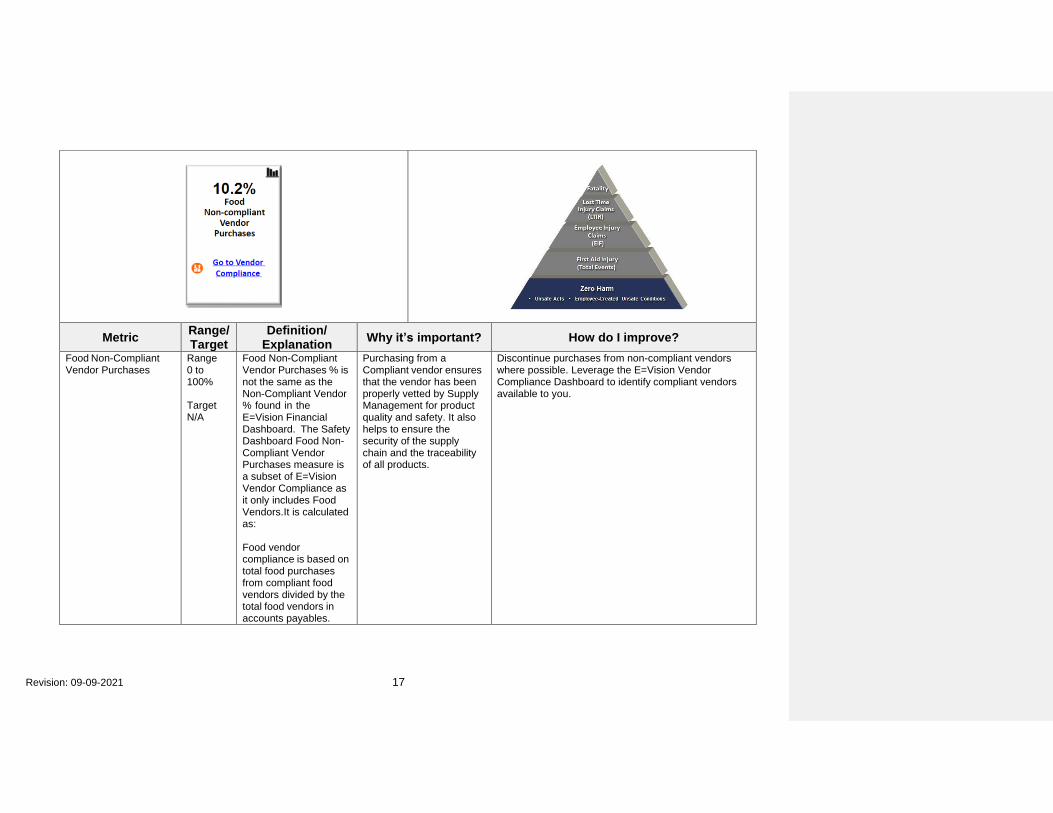
Food Non-Compliant Vendor Purchases
Range 0 to 100%
Target N/A
Food Non-Compliant Vendor Purchases % is not the same as the Non-Compliant Vendor % found in the E=Vision Financial Dashboard. The Safety Dashboard Food Non- Compliant Vendor Purchases measure is a subset of E=Vision Vendor Compliance as it only includes Food Vendors. It is calculated as:
Food vendor compliance is based on total food purchases from compliant food vendors divided by the total food vendors in accounts payables.
Purchasing from a Compliant vendor ensures that the vendor has been properly vetted by Supply Management for product quality and safety. It also helps to ensure the security of the supply chain and the traceability of all products.
Discontinue purchases from non-compliant vendors where possible. Leverage the E=Vision Vendor Compliance Dashboard to identify compliant vendors available to you.
Revision: 09-09-2021 18
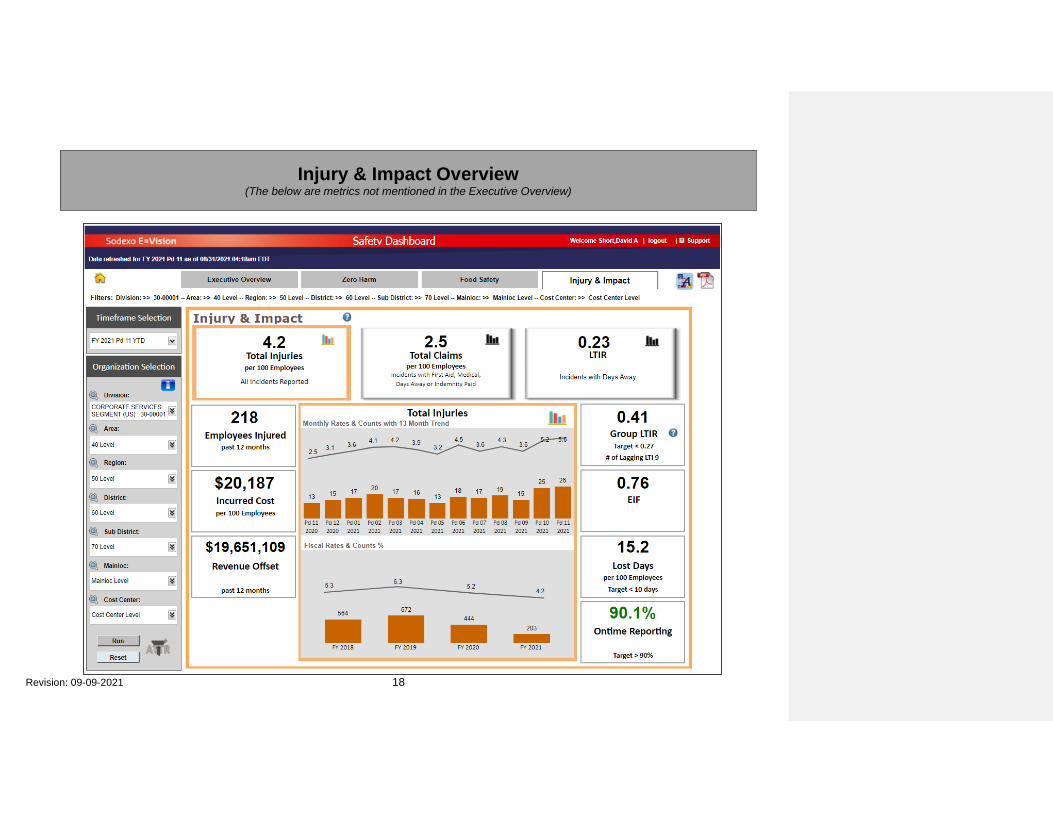
Injury & Impact Overview (The below are metrics not mentioned in the Executive Overview)
Revision: 09-09-2021 19
Metric Range/ Target
Definition/ Explanation
Why it’s important?
How do I improve?
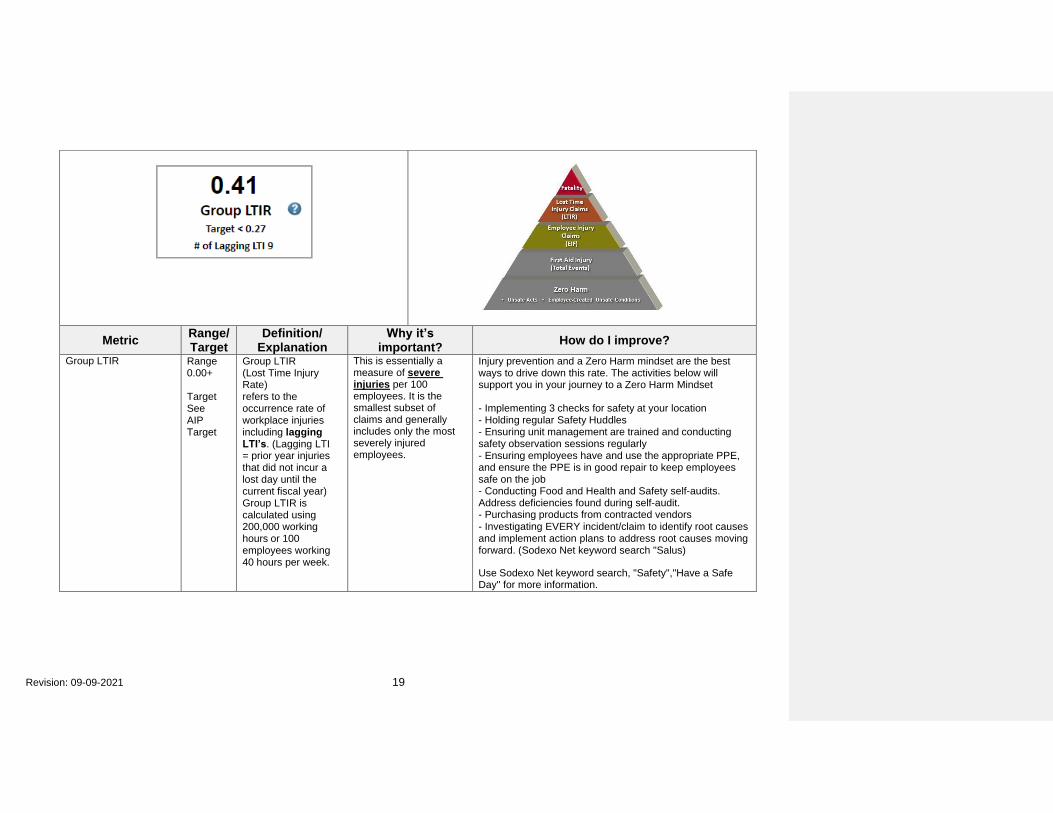
Group LTIR Range 0.00+ Target See AIP Target
Group LTIR (Lost Time Injury Rate ) refers to the occurrence rate of workplace injuries including lagging LTI’s. (Lagging LTI = prior year injuries that did not incur a lost day until the current fiscal year) Group LTIR is calculated using 200,000 working hours or 100 employees working 40 hours per week.
This is essentially a measure of severe injuries per 100 employees. It is the smallest subset of claims and generally includes only the most severely injured employees.
Injury prevention and a Zero Harm mindset are the best ways to drive down this rate. The activities below will support you in your journey to a Zero Harm Mindset
- Implementing 3 checks for safety at your location - Holding regular Safety Huddles - Ensuring unit management are trained and conducting safety observation sessions regularly - Ensuring employees have and use the appropriate PPE, and ensure the PPE is in good repair to keep employees safe on the job - Conducting Food and Health and Safety self-audits. Address deficiencies found during self-audit. - Purchasing products from contracted vendors - Investigating EVERY incident/claim to identify root causes and implement action plans to address root causes moving forward. (Sodexo Net keyword search "Salus)
Use Sodexo Net keyword search, "Safety", "Have a Safe Day" for more information.
Revision: 09-09-2021 20
Metric Range/ Target
Definition/ Explanation
Why it’s important?
How do I improve?
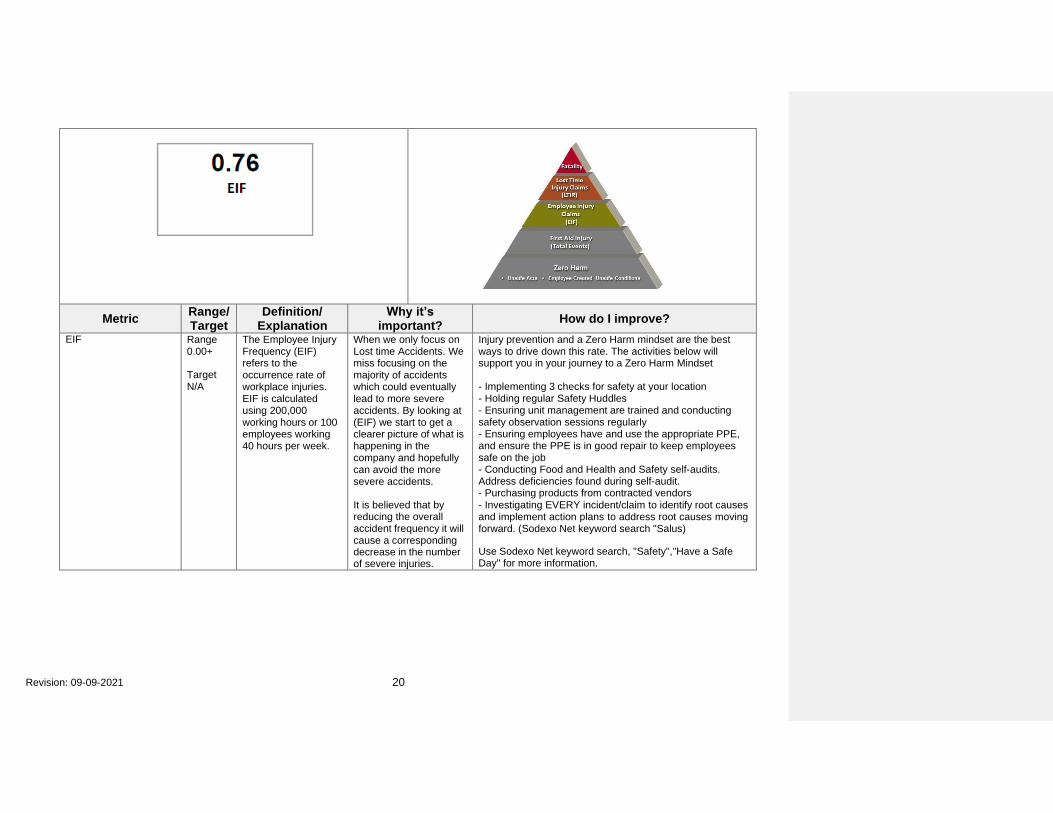
EIF Range 0.00+
Target N/A
The Employee Injury Frequency (EIF) refers to the occurrence rate of workplace injuries. EIF is calculated using 200,000 working hours or 100 employees working 40 hours per week.
When we only focus on Lost time Accidents. We miss focusing on the majority of accidents which could eventually lead to more severe accidents. By looking at (EIF) we start to get a clearer picture of what is happening in the company and hopefully can avoid the more severe accidents.
It is believed that by reducing the overall accident frequency it will cause a corresponding decrease in the number of severe injuries.
Injury prevention and a Zero Harm mindset are the best ways to drive down this rate. The activities below will support you in your journey to a Zero Harm Mindset
- Implementing 3 checks for safety at your location - Holding regular Safety Huddles - Ensuring unit management are trained and conducting safety observation sessions regularly - Ensuring employees have and use the appropriate PPE, and ensure the PPE is in good repair to keep employees safe on the job - Conducting Food and Health and Safety self-audits. Address deficiencies found during self-audit. - Purchasing products from contracted vendors - Investigating EVERY incident/claim to identify root causes and implement action plans to address root causes moving forward. (Sodexo Net keyword search "Salus)
Use Sodexo Net keyword search, "Safety", "Have a Safe Day" for more information.
Revision: 09-09-2021 21
Metric Range/ Target
Definition/ Explanation
Why it’s important?
How do I improve?
Lost Days / 100 Employees
Range 0.0+
Target N/A
The number of workdays lost due to workplace injury per 100 employees.
Unlike LTIR which includes only lost time, Lost Days / 100 Employees includes claims with lost time and those with indemnity. Indemnity includes payments to reimburse employees for lost wages or other compensation related to the injury.
Higher rates imply greater injury severity. Both lost time and indemnity are indicators that the injury was serious enough to warrant time away from work. This just means that this measure includes all claims where lost time is recorded in one way or another.
It is the smallest subset of claims and generally includes only the most severely injured employees.
Injury prevention and a Zero Harm mindset are the best ways to drive down this rate. The activities below will support you in your journey to a Zero Harm Mindset
- Implementing 3 checks for safety at your location - Holding regular Safety Huddles - Ensuring unit management are trained and conducting safety observation sessions regularly - Ensuring employees have and use the appropriate PPE, and ensure the PPE is in good repair to keep employees safe on the job - Conducting Food and Health and Safety self-audits. Address deficiencies found during self-audit. - Purchasing products from contracted vendors - Investigating EVERY incident/claim to identify root causes and implement action plans to address root causes moving forward. (Sodexo Net keyword search "Salus)
Use Sodexo Net keyword search, "Safety", "Have a Safe Day" for more information. Commented [SD3]: Do we need to add lagging
information here.
Revision: 09-09-2021 22
Metric Range/ Target
Definition/ Explanation
Why it’s important?
How do I improve?
Ontime Reporting Range 0 to 100%
Target >90
This measure shows the percent of incidents reported within 1 day. Timely reporting of incidents ensures that investigations are initiated as soon as possible. This enables unsafe conditions or practices to be corrected sooner. Thus, minimizing the reoccurrence of a similar or like injury to other employees.
This measure tracks the timeliness of injury reporting. Reporting injuries immediately helps ensure the injury is addressed quickly so proper care can be administered, and it improves accuracy of reporting, which is critical for understanding and managing risk in the workplace. A higher rate for this measure is better.
Injury prevention and a Zero Harm mindset are the best ways to drive down this rate. The activities below will support you in your journey to a Zero Harm Mindset
- Implementing 3 checks for safety at your location - Holding regular Safety Huddles
- Ensuring unit management are trained and conducting safety observation sessions regularly - Ensuring employees have and use the appropriate PPE, and ensure the PPE is in good repair to keep employees safe on the job - Conducting Food and Health and Safety self-audits. Address deficiencies found during self-audit. - Purchasing products from contracted vendors - Investigating EVERY incident/claim to identify root causes and implement action plans to address root causes moving forward. (Sodexo Net keyword search "Salus)
Use Sodexo Net keyword search, "Safety", "Have a Safe Day" for more information.