February 2015 Monthly Snapshot One-Year Change in One-Year Change in Median Sales Price Single Family Median Sales Price Condo/TIC/Coop 2 3 4 5 6 7 8 9 10 11 12 13 14 15 16 Monthly Indicators + 6.2% + 17.4% + 12.8% One-Year Change in There has been talk of abundant cold and snow this winter (unless you happen to live in California!). When weather patterns turn bad, like wicked bad, real estate industry pundits tend to go gloom, assuming that Americans hungry for homeownership are bothered by a little frozen precipitation. The nation will unfreeze, inventory is expected to rise and home sales are widely expected to increase. These are good times, indeed, and many of us now have an enchanting shared experience that we can walk uphill to school both ways. New Listings were down 2.6 percent for single family homes and 21.1 percent for Condo/TIC/Coop properties. Pending Sales decreased 18.2 percent for single family homes and 14.7 percent for Condo/TIC/Coop properties. The Median Sales Price was up 6.2 percent to $1,115,000 for single family homes and 17.4 percent to $1,100,000 for Condo/TIC/Coop properties. Months Supply of Inventory decreased 13.3 percent for single family units and 23.5 percent for Condo/TIC/Coop units. In national financial news, rumors that Fannie Mae and Freddie Mac could one day be a thing of the past have people wondering about the future of the 30- year fixed-rate mortgage. But let's not sound the alarm just yet. A drastic change to lending's gold standard is certainly not on the immediate horizon. Meanwhile, Federal Reserve Chair Janet Yellen seems to have no immediate interest in raising interest rates for the first time since 2006. The economy remains stable, which should keep housing rolling through the short-named months. Median Sales Price All Property Types Residential real estate activity in San Francisco County (Districts 1-10), comprised of single-family properties, townhomes and condominiums. Percent changes are calculated using rounded figures. Single Family Activity Overview Months Supply of Inventory Current as of March 11, 2015. All data from the San Francisco MLS. Powered by 10K Research and Marketing. Condo/TIC/Coop Activity Overview Inventory of Active Listings % of Properties Sold Over List Price % of List Price Received Housing Affordability Ratio All Properties Activity Overview New Listings Pending Sales Sold Listings Median Sales Price Average Sales Price Days on Market Until Sale Activity by District
Transcript
February 2015 Monthly Snapshot
One-Year Change in One-Year Change inMedian Sales Price
Single FamilyMedian Sales Price Condo/TIC/Coop
23456789
10111213141516
Monthly Indicators
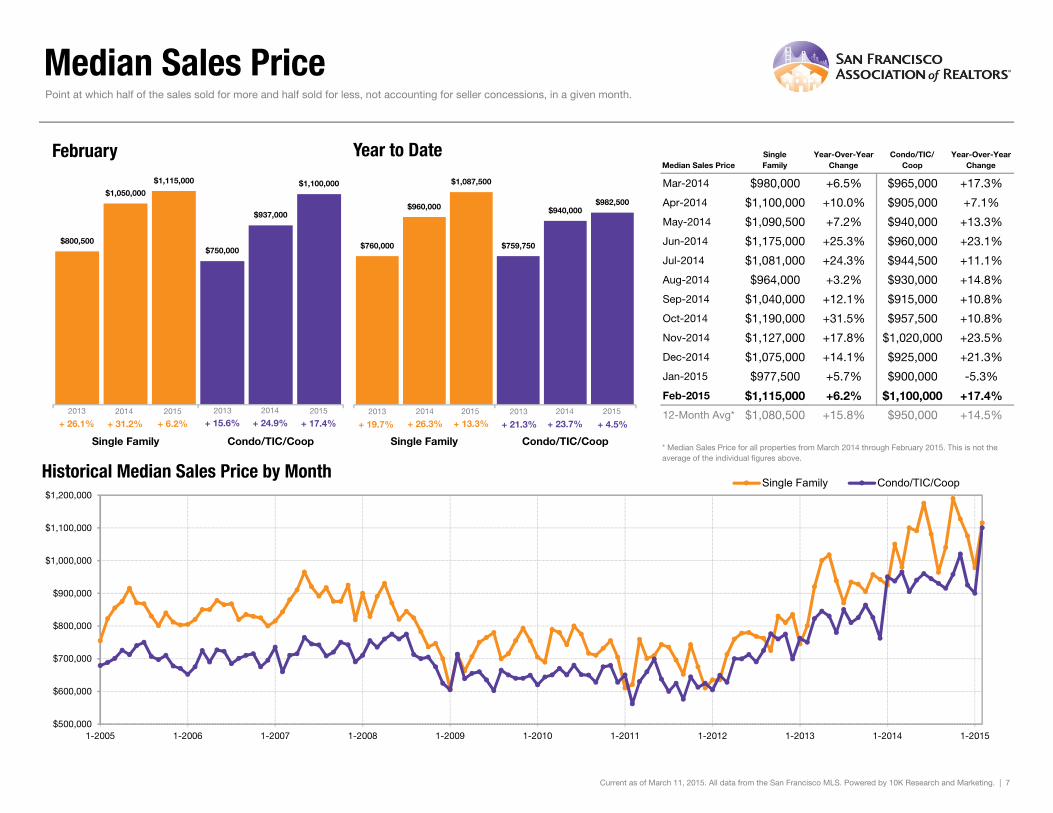
+ 6.2% + 17.4% + 12.8%One-Year Change in
There has been talk of abundant cold and snow this winter (unless you happen to live in California!). When weather patterns turn bad, like wicked bad, real estate industry pundits tend to go gloom, assuming that Americans hungry for homeownership are bothered by a little frozen precipitation. The nation will unfreeze, inventory is expected to rise and home sales are widely expected to increase. These are good times, indeed, and many of us now have an enchanting shared experience that we can walk uphill to school both ways.
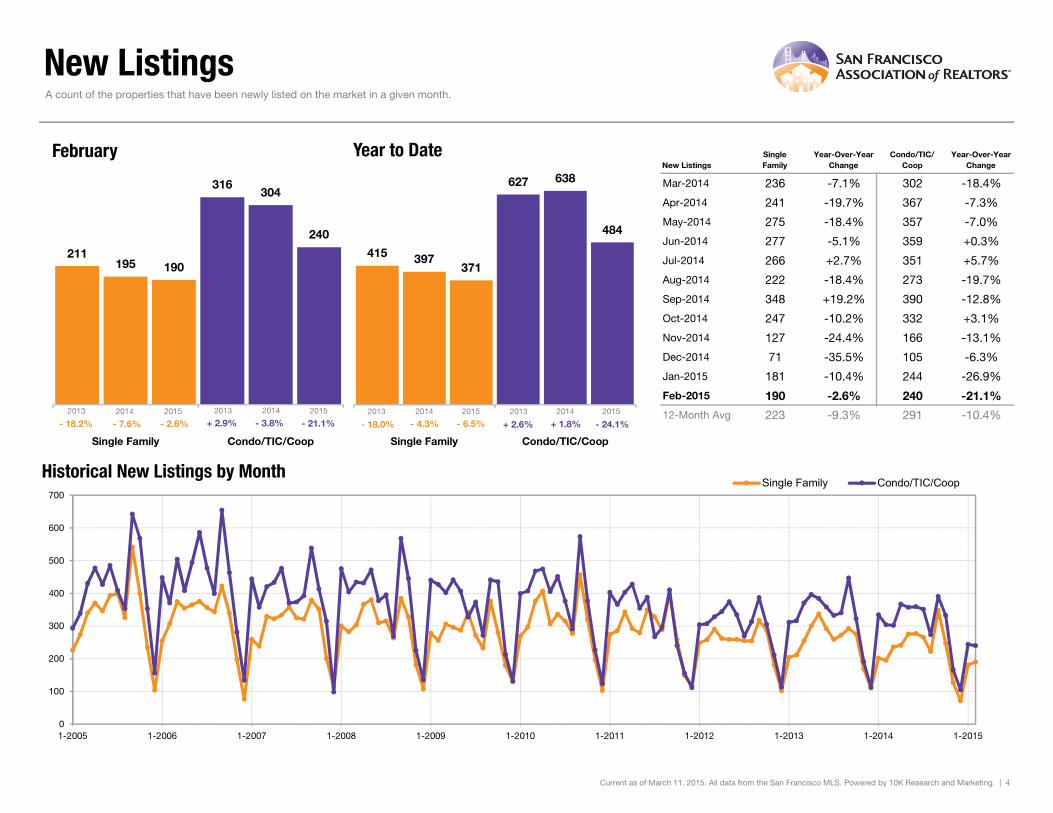
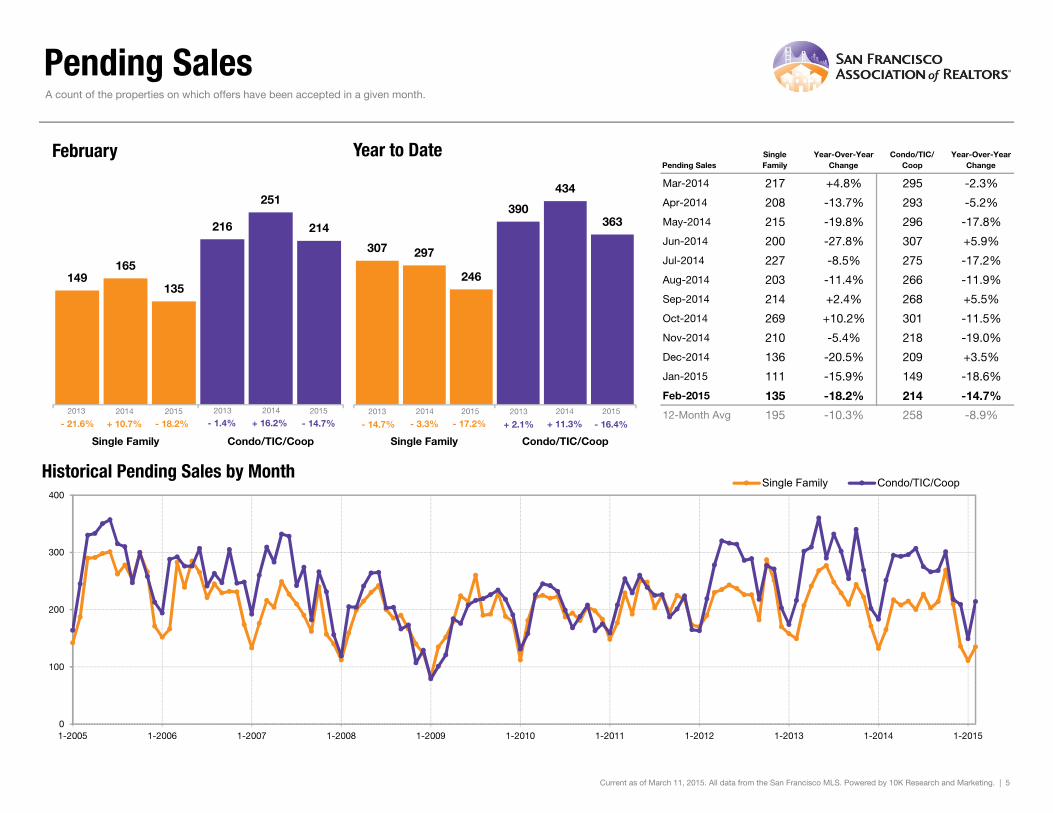
New Listings were down 2.6 percent for single family homes and 21.1 percent for Condo/TIC/Coop properties. Pending Sales decreased 18.2 percent for single family homes and 14.7 percent for Condo/TIC/Coop properties.
The Median Sales Price was up 6.2 percent to $1,115,000 for single family homes and 17.4 percent to $1,100,000 for Condo/TIC/Coop properties. Months Supply of Inventory decreased 13.3 percent for single family units and 23.5 percent for Condo/TIC/Coop units.
In national financial news, rumors that Fannie Mae and Freddie Mac could one day be a thing of the past have people wondering about the future of the 30-year fixed-rate mortgage. But let's not sound the alarm just yet. A drastic change to lending's gold standard is certainly not on the immediate horizon. Meanwhile, Federal Reserve Chair Janet Yellen seems to have no immediate interest in raising interest rates for the first time since 2006. The economy remains stable, which should keep housing rolling through the short-named months.
Median Sales Price All Property Types
Residential real estate activity in San Francisco County (Districts 1-10), comprised of single-family properties, townhomes and condominiums. Percent changes are calculated using rounded figures.
Single Family Activity Overview
Months Supply of Inventory
Current as of March 11, 2015. All data from the San Francisco MLS. Powered by 10K Research and Marketing.
Condo/TIC/Coop Activity Overview
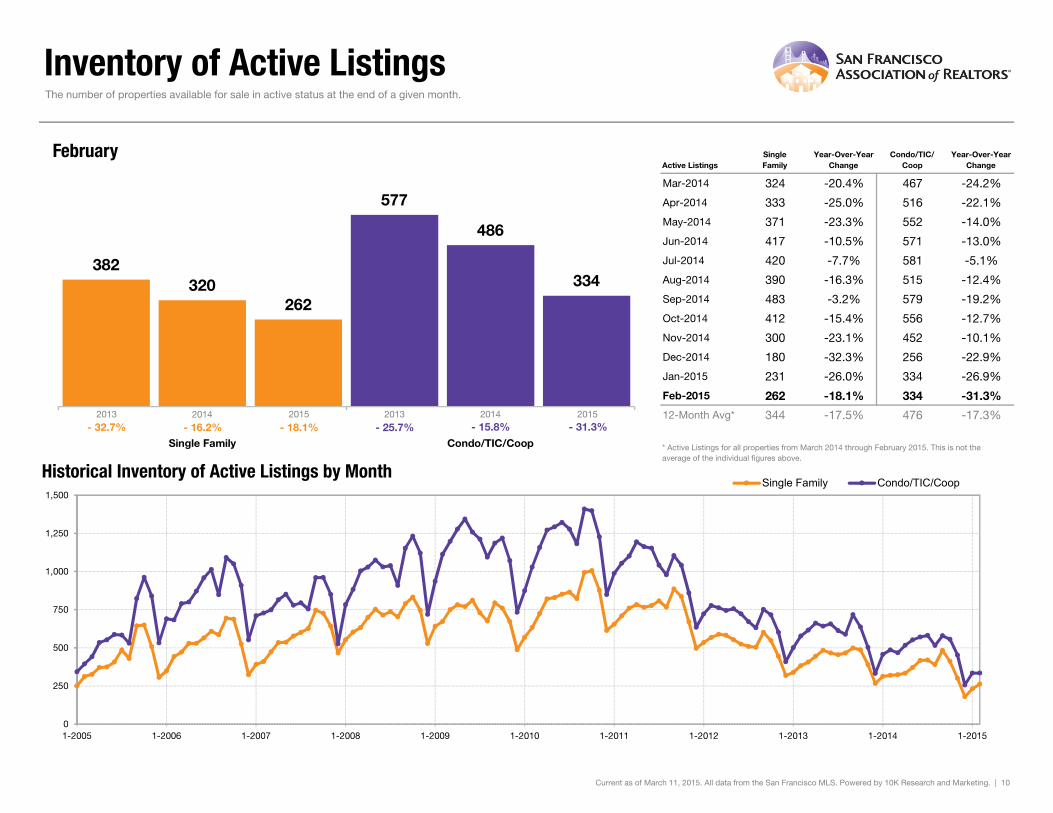
Inventory of Active Listings% of Properties Sold Over List Price% of List Price ReceivedHousing Affordability Ratio
All Properties Activity Overview
New ListingsPending SalesSold ListingsMedian Sales PriceAverage Sales PriceDays on Market Until Sale
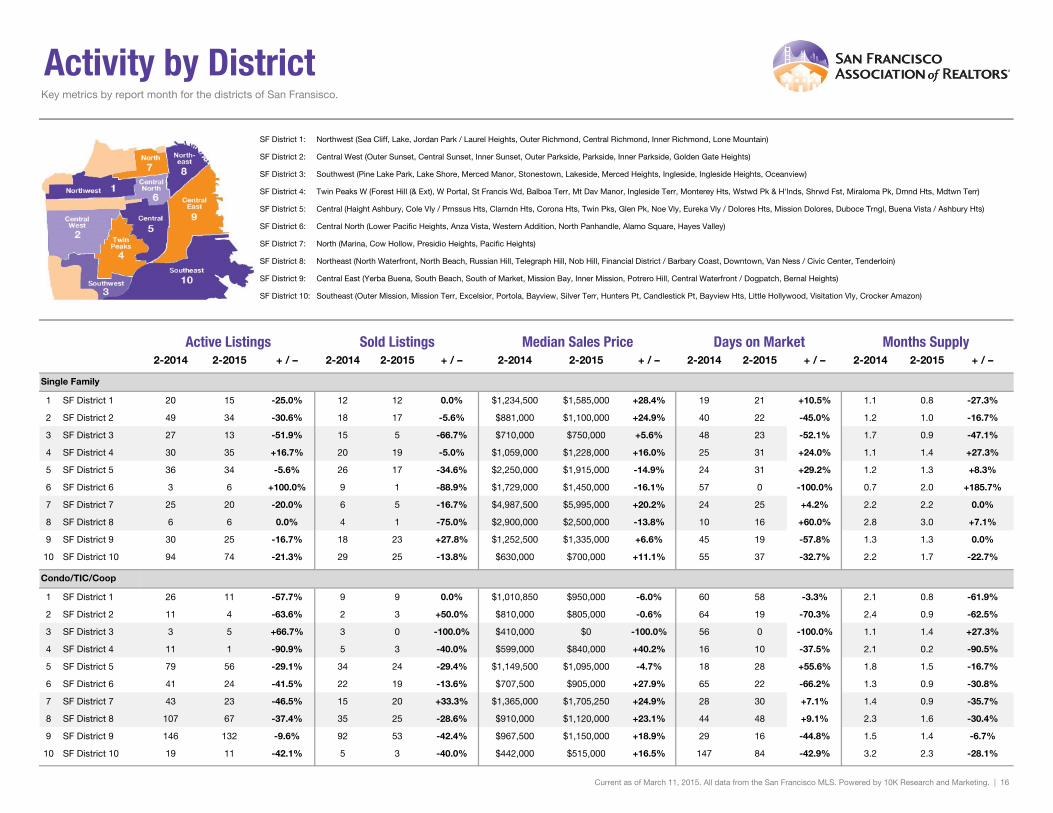
Activity by District
Single Family Activity OverviewKey metrics by report month and for year-to-date (YTD) starting from the first of the year.
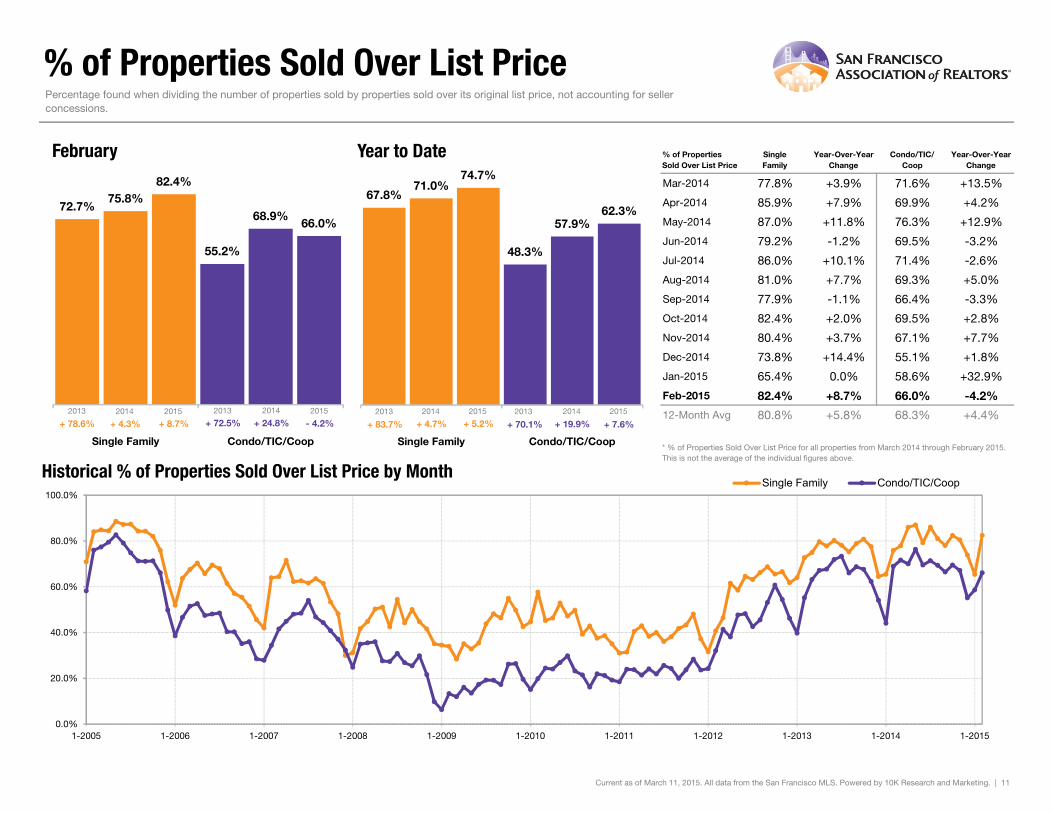
Historical % of Properties Sold Over List Price by Month
Percentage found when dividing the number of properties sold by properties sold over its original list price, not accounting for seller concessions.
* % of Properties Sold Over List Price for all properties from March 2014 through February 2015. This is not the average of the individual figures above.
Current as of March 11, 2015. All data from the San Francisco MLS. Powered by 10K Research and Marketing. | 11
Percentage found when dividing a property’s sales price by its most recent list price, then taking the average for all properties sold in a given month, not accounting for seller concessions.
* % of List Price Received for all properties from March 2014 through February 2015. This is not the average of the individual figures above.
Current as of March 11, 2015. All data from the San Francisco MLS. Powered by 10K Research and Marketing. | 12
This index measures housing affordability for the region. An index of 120 means the median household income is 120% of what is necessary to qualify for the median-priced home under prevailing interest rates. A higher number means greater affordability.
* Affordability Ratio for all properties from March 2014 through February 2015. This is not the average of the individual figures above.
Current as of March 11, 2015. All data from the San Francisco MLS. Powered by 10K Research and Marketing. | 13
SF District 1: Northwest (Sea Cliff, Lake, Jordan Park / Laurel Heights, Outer Richmond, Central Richmond, Inner Richmond, Lone Mountain)
SF District 2: Central West (Outer Sunset, Central Sunset, Inner Sunset, Outer Parkside, Parkside, Inner Parkside, Golden Gate Heights)
SF District 3: Southwest (Pine Lake Park, Lake Shore, Merced Manor, Stonestown, Lakeside, Merced Heights, Ingleside, Ingleside Heights, Oceanview)
SF District 4: Twin Peaks W (Forest Hill (& Ext), W Portal, St Francis Wd, Balboa Terr, Mt Dav Manor, Ingleside Terr, Monterey Hts, Wstwd Pk & H'lnds, Shrwd Fst, Miraloma Pk, Dmnd Hts, Mdtwn Terr)
SF District 5: Central (Haight Ashbury, Cole Vly / Prnssus Hts, Clarndn Hts, Corona Hts, Twin Pks, Glen Pk, Noe Vly, Eureka Vly / Dolores Hts, Mission Dolores, Duboce Trngl, Buena Vista / Ashbury Hts)
SF District 6: Central North (Lower Pacific Heights, Anza Vista, Western Addition, North Panhandle, Alamo Square, Hayes Valley)
SF District 7: North (Marina, Cow Hollow, Presidio Heights, Pacific Heights)
SF District 8: Northeast (North Waterfront, North Beach, Russian Hill, Telegraph Hill, Nob Hill, Financial District / Barbary Coast, Downtown, Van Ness / Civic Center, Tenderloin)
SF District 9: Central East (Yerba Buena, South Beach, South of Market, Mission Bay, Inner Mission, Potrero Hill, Central Waterfront / Dogpatch, Bernal Heights)
SF District 10: Southeast (Outer Mission, Mission Terr, Excelsior, Portola, Bayview, Silver Terr, Hunters Pt, Candlestick Pt, Bayview Hts, Little Hollywood, Visitation Vly, Crocker Amazon)