October 2015 Monthly Snapshot One-Year Change in One-Year Change in Median Sales Price Single Family Median Sales Price Condo/TIC/Coop 2 3 4 5 6 7 8 9 10 11 12 13 14 15 16 Monthly Indicators + 8.4% + 15.7% + 15.4% One-Year Change in Transitory periods in the market are common this time of year, and after a persistent period of steady year-over-year climbs in sales metrics, recent low national numbers have not fulfilled what many predicted. But on a positive note, jobless claims have also been at low levels, coming in as the lowest number since 1973. As always, every market and situation is unique, so some numbers seen in national trends may not always line up with local markets. New Listings were down 2.0 percent for single family homes and 10.7 percent for Condo/TIC/Coop properties. Pending Sales remained flat for single family homes but decreased 6.6 percent for Condo/TIC/Coop properties. The Median Sales Price was up 8.4 percent to $1,290,000 for single family homes and 15.7 percent to $1,105,000 for Condo/TIC/Coop properties. Months Supply of Inventory decreased 4.8 percent for single family units but was up 14.3 percent for Condo/TIC/Coop units. Interest rates are an area to pay attention to as rate hikes are widely expected before the year ends. The Federal Reserve Bank has skipped two opportunities to raise rates this fall, but the final meeting in December will likely include a minor rate hike. Although we are headed into a slower time of year, as housing activity goes, there are still many nuggets of optimism to mine from monthly figures. Median Sales Price All Property Types Residential real estate activity in San Francisco County (Districts 1-10), comprised of single-family properties, townhomes and condominiums. Percent changes are calculated using rounded figures. Single Family Activity Overview Months Supply of Inventory Current as of November 23, 2015. All data from the San Francisco MLS. Powered by 10K Research and Marketing. Condo/TIC/Coop Activity Overview Inventory of Active Listings % of Properties Sold Over List Price % of List Price Received Housing Affordability Ratio All Properties Activity Overview New Listings Pending Sales Sold Listings Median Sales Price Average Sales Price Days on Market Until Sale Activity by District
Transcript
October 2015 Monthly Snapshot
One-Year Change in One-Year Change inMedian Sales Price
Single FamilyMedian Sales Price Condo/TIC/Coop
23456789
10111213141516
Monthly Indicators
+ 8.4% + 15.7% + 15.4%One-Year Change in
Transitory periods in the market are common this time of year, and after a persistent period of steady year-over-year climbs in sales metrics, recent low national numbers have not fulfilled what many predicted. But on a positive note, jobless claims have also been at low levels, coming in as the lowest number since 1973. As always, every market and situation is unique, so some numbers seen in national trends may not always line up with local markets.
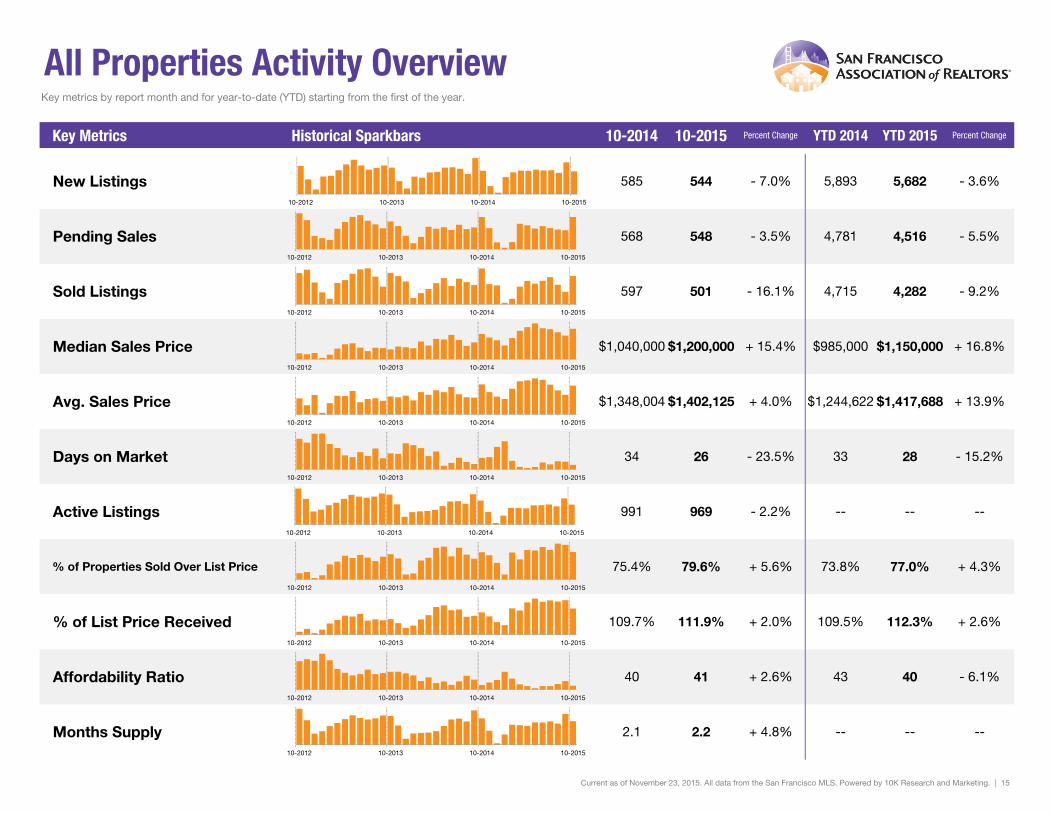
New Listings were down 2.0 percent for single family homes and 10.7 percent for Condo/TIC/Coop properties. Pending Sales remained flat for single family homes but decreased 6.6 percent for Condo/TIC/Coop properties.
The Median Sales Price was up 8.4 percent to $1,290,000 for single family homes and 15.7 percent to $1,105,000 for Condo/TIC/Coop properties. Months Supply of Inventory decreased 4.8 percent for single family units but was up 14.3 percent for Condo/TIC/Coop units.
Interest rates are an area to pay attention to as rate hikes are widely expected before the year ends. The Federal Reserve Bank has skipped two opportunities to raise rates this fall, but the final meeting in December will likely include a minor rate hike. Although we are headed into a slower time of year, as housing activity goes, there are still many nuggets of optimism to mine from monthly figures.
Median Sales Price All Property Types
Residential real estate activity in San Francisco County (Districts 1-10), comprised of single-family properties, townhomes and condominiums. Percent changes are calculated using rounded figures.
Single Family Activity Overview
Months Supply of Inventory
Current as of November 23, 2015. All data from the San Francisco MLS. Powered by 10K Research and Marketing.
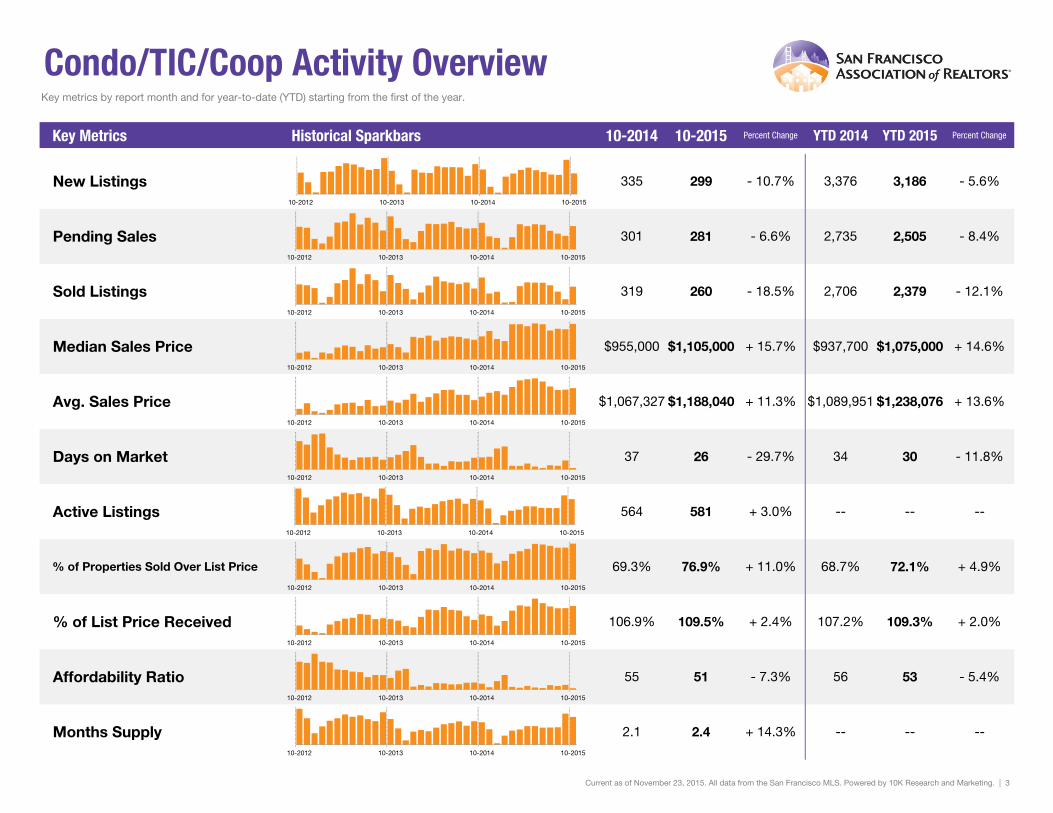
Condo/TIC/Coop Activity Overview
Inventory of Active Listings% of Properties Sold Over List Price% of List Price ReceivedHousing Affordability Ratio
All Properties Activity Overview
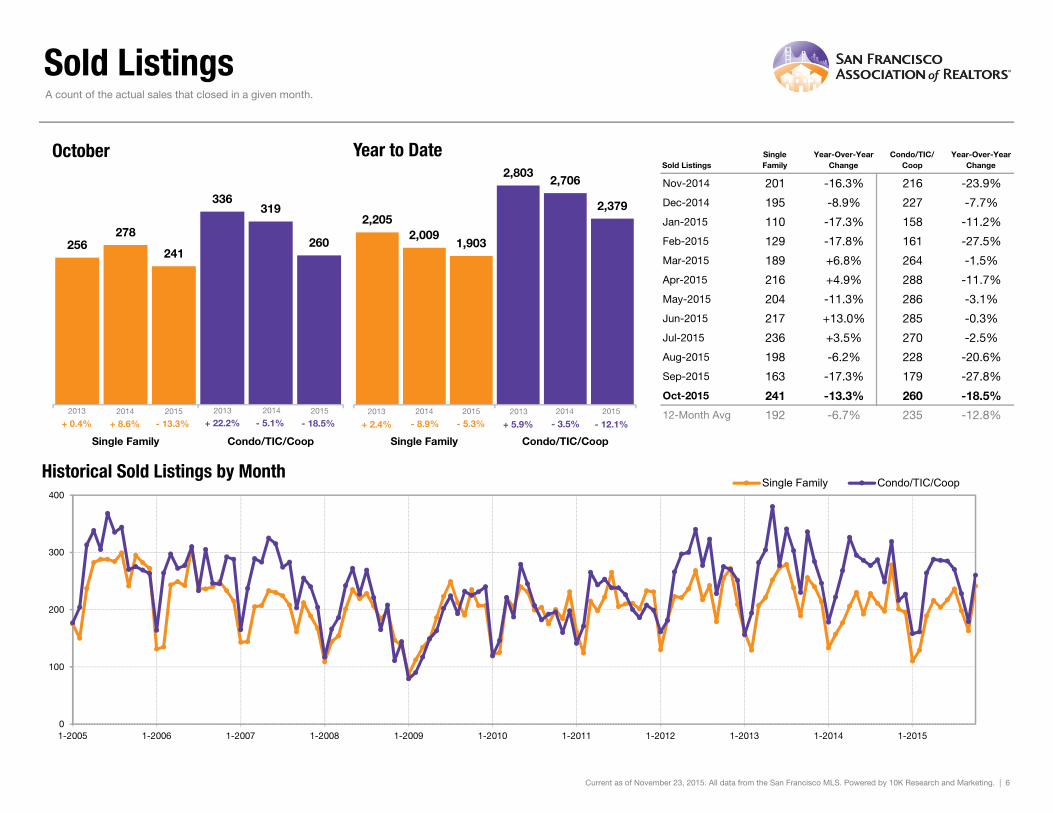
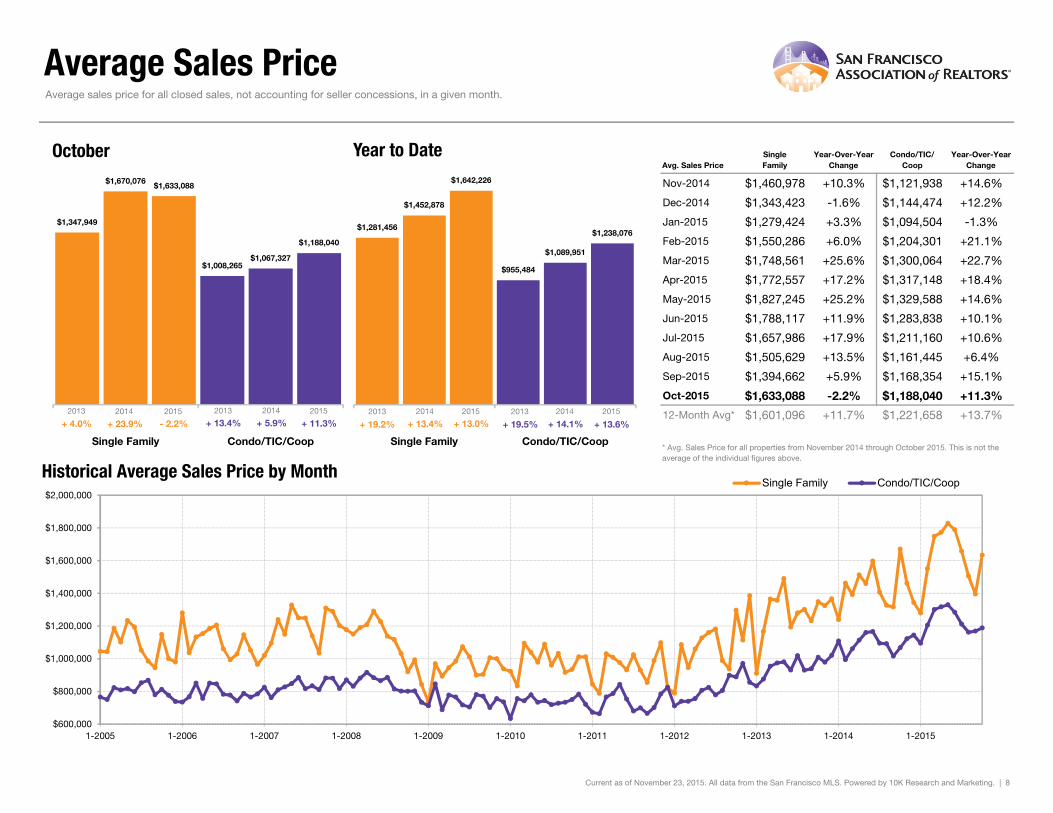
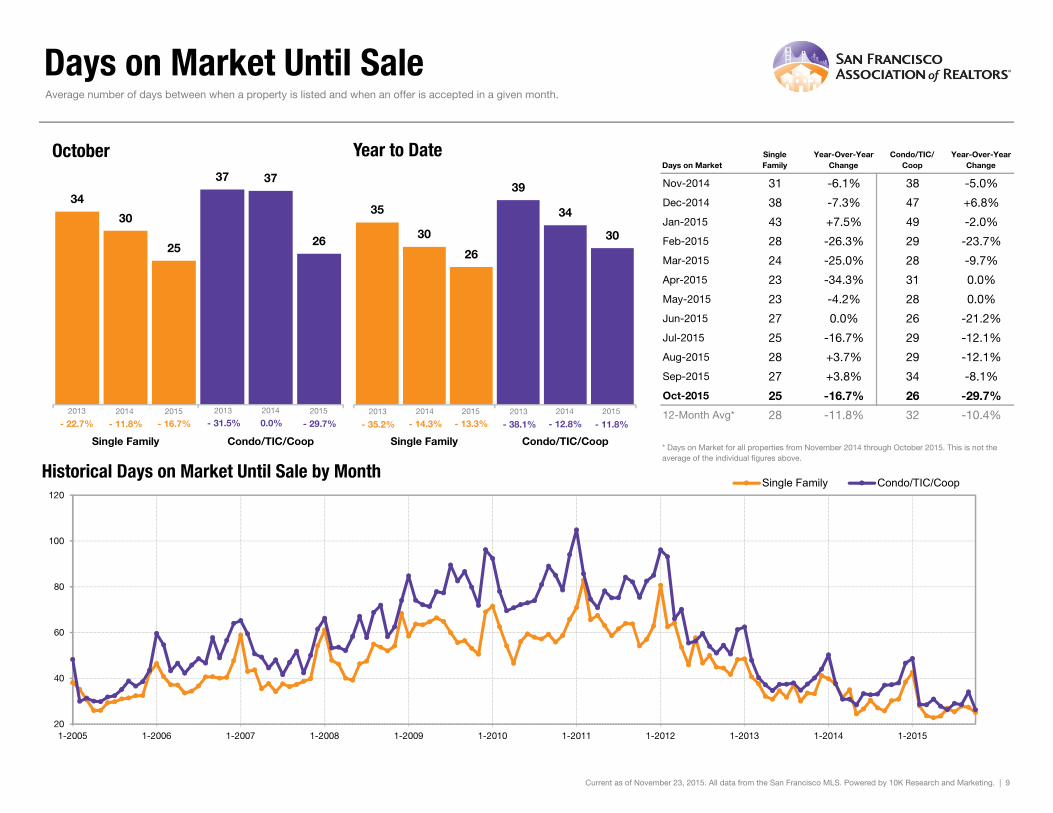
New ListingsPending SalesSold ListingsMedian Sales PriceAverage Sales PriceDays on Market Until Sale
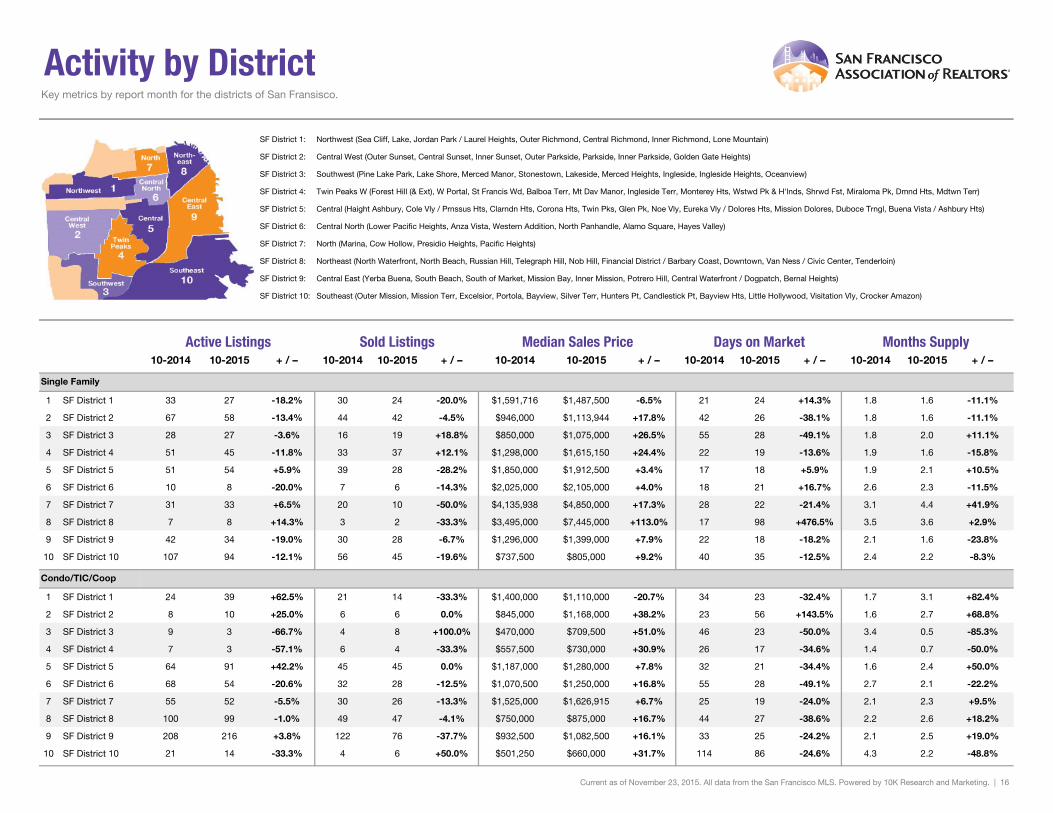
Activity by District
Single Family Activity OverviewKey metrics by report month and for year-to-date (YTD) starting from the first of the year.
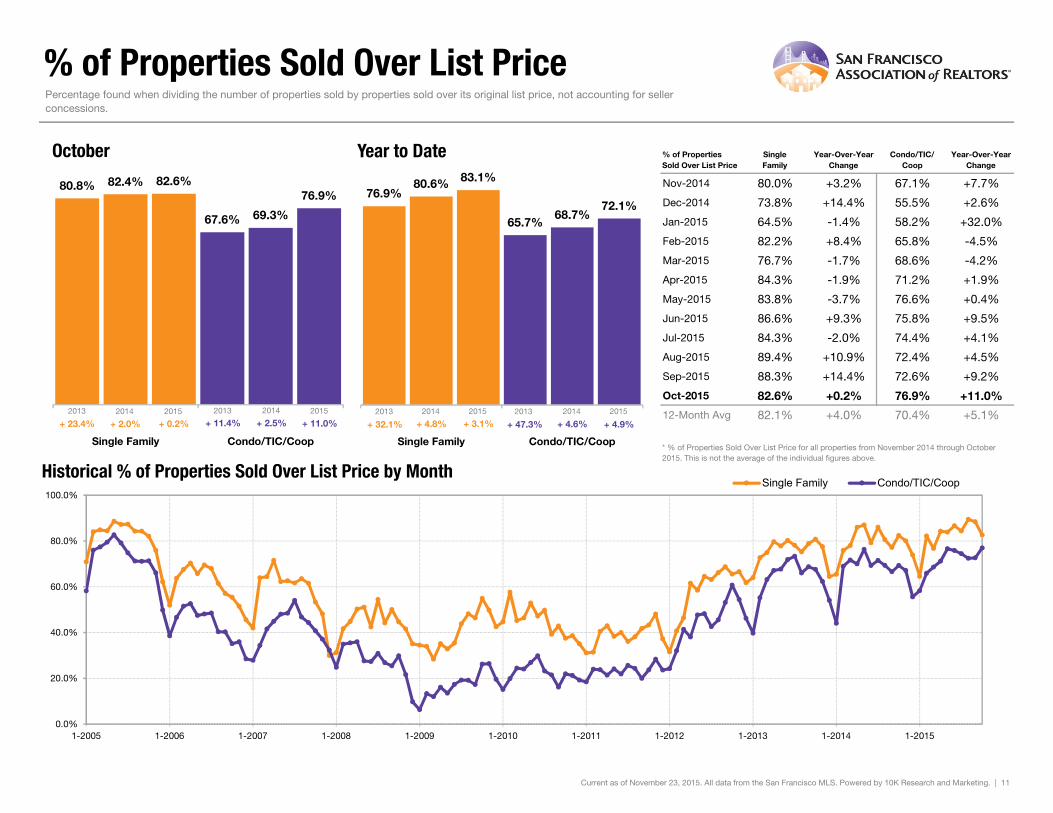
Historical % of Properties Sold Over List Price by Month
Percentage found when dividing the number of properties sold by properties sold over its original list price, not accounting for seller concessions.
* % of Properties Sold Over List Price for all properties from November 2014 through October 2015. This is not the average of the individual figures above.
Current as of November 23, 2015. All data from the San Francisco MLS. Powered by 10K Research and Marketing. | 11
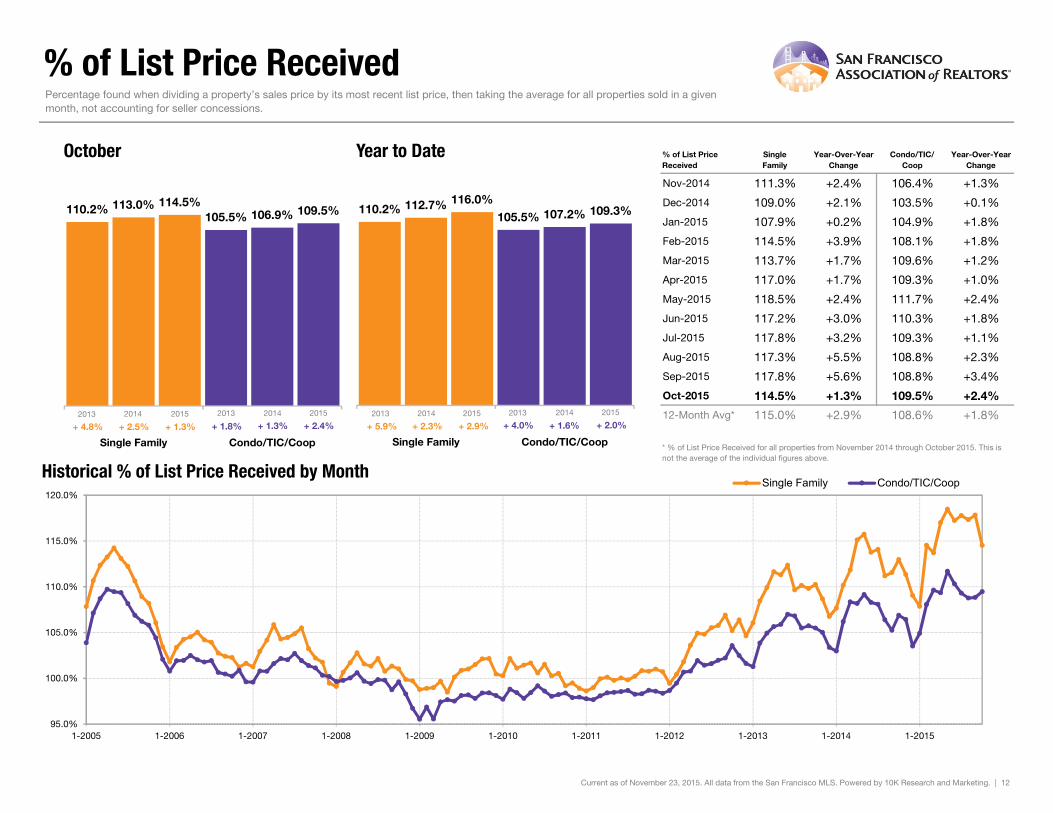
Percentage found when dividing a property’s sales price by its most recent list price, then taking the average for all properties sold in a given month, not accounting for seller concessions.
* % of List Price Received for all properties from November 2014 through October 2015. This is not the average of the individual figures above.
Current as of November 23, 2015. All data from the San Francisco MLS. Powered by 10K Research and Marketing. | 12
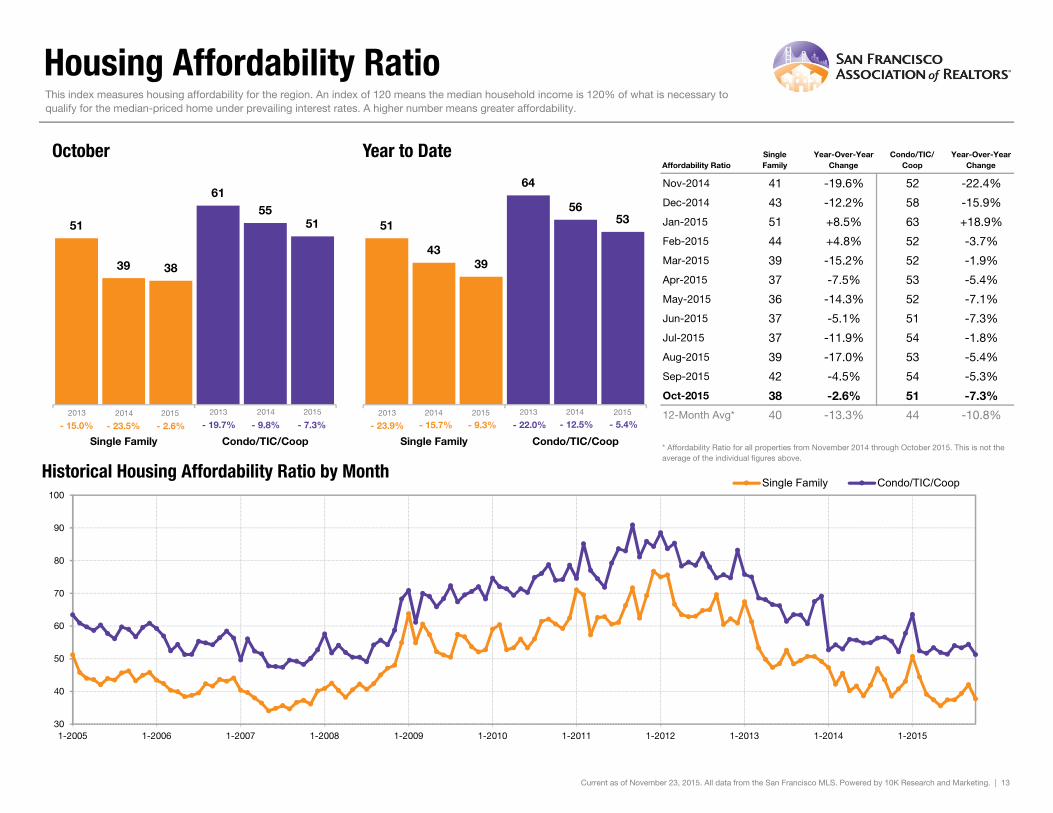
This index measures housing affordability for the region. An index of 120 means the median household income is 120% of what is necessary to qualify for the median-priced home under prevailing interest rates. A higher number means greater affordability.
* Affordability Ratio for all properties from November 2014 through October 2015. This is not the average of the individual figures above.
Current as of November 23, 2015. All data from the San Francisco MLS. Powered by 10K Research and Marketing. | 13
SF District 1: Northwest (Sea Cliff, Lake, Jordan Park / Laurel Heights, Outer Richmond, Central Richmond, Inner Richmond, Lone Mountain)
SF District 2: Central West (Outer Sunset, Central Sunset, Inner Sunset, Outer Parkside, Parkside, Inner Parkside, Golden Gate Heights)
SF District 3: Southwest (Pine Lake Park, Lake Shore, Merced Manor, Stonestown, Lakeside, Merced Heights, Ingleside, Ingleside Heights, Oceanview)
SF District 4: Twin Peaks W (Forest Hill (& Ext), W Portal, St Francis Wd, Balboa Terr, Mt Dav Manor, Ingleside Terr, Monterey Hts, Wstwd Pk & H'lnds, Shrwd Fst, Miraloma Pk, Dmnd Hts, Mdtwn Terr)
SF District 5: Central (Haight Ashbury, Cole Vly / Prnssus Hts, Clarndn Hts, Corona Hts, Twin Pks, Glen Pk, Noe Vly, Eureka Vly / Dolores Hts, Mission Dolores, Duboce Trngl, Buena Vista / Ashbury Hts)
SF District 6: Central North (Lower Pacific Heights, Anza Vista, Western Addition, North Panhandle, Alamo Square, Hayes Valley)
SF District 7: North (Marina, Cow Hollow, Presidio Heights, Pacific Heights)
SF District 8: Northeast (North Waterfront, North Beach, Russian Hill, Telegraph Hill, Nob Hill, Financial District / Barbary Coast, Downtown, Van Ness / Civic Center, Tenderloin)
SF District 9: Central East (Yerba Buena, South Beach, South of Market, Mission Bay, Inner Mission, Potrero Hill, Central Waterfront / Dogpatch, Bernal Heights)
SF District 10: Southeast (Outer Mission, Mission Terr, Excelsior, Portola, Bayview, Silver Terr, Hunters Pt, Candlestick Pt, Bayview Hts, Little Hollywood, Visitation Vly, Crocker Amazon)