8
with realtor Kira Mead Take the Sale of Your Home from GOOD TO GREAT SALES & MARKET STATISTICS Q 3 201 5
| Date post: | 24-Jul-2016 |
| Category: |
Documents |
| Upload: | modernrealestatesf |
| View: | 219 times |
| Download: | 2 times |

with realtor Kira Mead
Ta k e t h e S a l e o f Yo u r H o m e f r o m
G O O D TO G R E AT
S A L E S & M A R K E T S TAT I S T I C S
Q 3 201 5

Every block is a short story, every hill a novel.

WE ALL KNOW THE MARKET IS HOT.
We'll be honest: you could do nothing to your
property and you'd do okay right now. But
why settle for okay when you could sell your
home for more than you thought possible?
Expert design, staging, marketing and
exposure can take the sale of your property
to a whole new level. We focus on this market.
We know what buyers are looking for. We
know which properties set records and why.
Let us take the sale of your home from Good to Great.
• We produce design-centric one of a kind listings
that command top dollar for our clients.
• Data driven market knowledge+street level
insights give you the advantage in the ever
changing San Francisco real estate market.
• We love to win for our clients. You'll have the
full support of a professional and experienced
team on your side every step of the way.
GET IN TOUCH for a free consultation to find out what your home
could sell for
Honored to be in Climb Real Estate's
TOP 25 AGENTS OF 2014
C O M I N G S O O N181 Noe Street • Duboce Triangle • 3 bed / 1 bath • condo134 Langton St • SoMa • 2 bed / 1.5 bath • condo262 Guerrero Street • Mission Dolores • 3 bed / 1 bath • condo264 Guerrero Street • Mission Dolores • 3 bed / 1 bath • condo
J U S T S O L D3469 19th Street • Mission • 4 bed / 1 bath • tic3775 16th Street • Corona Heights • 4 bed / 2 bath • single family home 32 Wayne Place • North Beach • 2 bed / 1 bath • condo
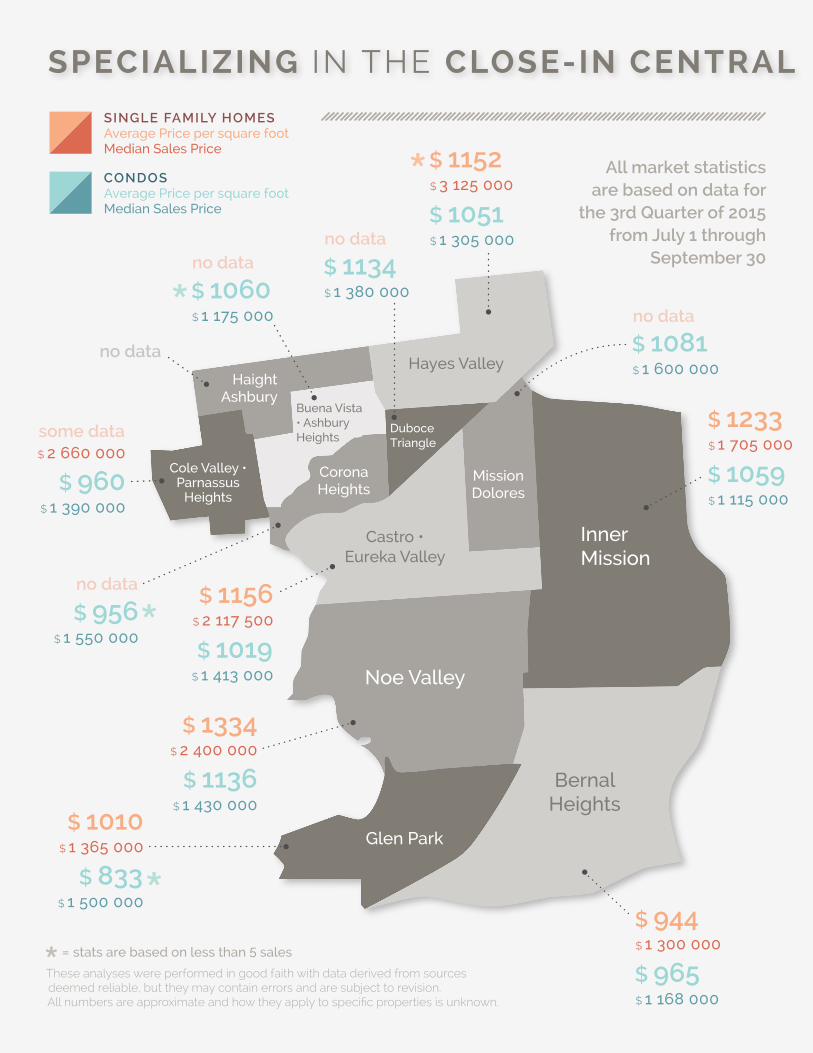
SPECIALIZING IN THE CLOSE-IN CENTRAL
$ 1081$ 1 600 000
$ 1051$ 1 305 000
$ 960$ 1 390 000
no data
$ 1060$ 1 175 000
$ 1134$ 1 380 000
$ 833$ 1 500 000
$ 1136$ 1 430 000
$ 1019$ 1 413 000
$ 1059$ 1 115 000
$ 965$ 1 168 000
$ 1152$ 3 125 000
some data$ 2 660 000
no data
no datano data
no data
$ 956$ 1 550 000
$ 1010$ 1 365 000
$ 1334$ 2 400 000
$ 1156$ 2 117 500
$ 1233$ 1 705 000
$ 944$ 1 300 000
Noe Valley
Inner Mission
Glen Park
Castro •Eureka Valley
Bernal Heights
Hayes ValleyHaight
Ashbury
Cole Valley •Parnassus
Heights
MissionDolores
CoronaHeights
DuboceTriangle
Buena Vista• AshburyHeights
All market statistics are based on data for
the 3rd Quarter of 2015 from July 1 through
September 30
These analyses were performed in good faith with data derived from sources deemed reliable, but they may contain errors and are subject to revision. All numbers are approximate and how they apply to specific properties is unknown.
*= stats are based on less than 5 sales
CONDOSAverage Price per square footMedian Sales Price
SINGLE FAMILY HOMESAverage Price per square footMedian Sales Price
*
*
*
*

MARKET UPDATEAs the third quarter of 2015 wraps up, the stats for almost every neighborhood continue to show huge year over year gains in both price per square foot and median price.
Which properties sell for the most? Homes that are properly prepared for market, beautifully staged and create an emotional connection with buyers.
The proper presentation and marketing plan is crucial to a successful sale. Check out our before and after photos on the next pages for examples of how we have helped sellers transform their homes. Get in touch now for a free consultation of how much you could sell your home for in today's market and let us help you take the sale of your home from Good to Great!
GET IN TOUCH TODAY for a free consultation !
24
NEIGHBORHOODS OF SAN FRANCISCO
HOW DOES THIS THIRD QUARTER COMPARE TO A YEAR AGO?All statistics below are comparing the 3rd Quarter of 2014 to the 3rd Quarter of 2015
design: Candymuse.com
Hayes Valley
% overasking
% change inmedian price
domdays on market
% overasking
% change inmedian price
domdays on market
8 23
23 13 21
Glen ParkBernal Heights
12 17 24 14 17 19
Mission Dolores
Haight Ashbury
Noe Valley
Inner Mission
10 24 37
40 5 25
23
31
17 19
10 15 23
42 27 15
Buena Vista • Ashbury Heights
-2 7 20
Castro • Eureka Valley
7 18
12 18 23
27
Cole Valley • Parnassus Heights
19 11
26 3 45
30
Corona Heights
Duboce Triangle
10 15 28
10 17 29
30 9 27
43 13
nodata
nodata no
data**
*
*

What does it really mean to transform a space?
Here is a look at our before and after photos to see what ‘creating a design-centric’ listing
really means. Call or email us for more photos and the case studies of our approach to taking
these homes from Good to Great.
B E F O R E & A F T E R
BEFORE AFTER
BEFORE AFTER
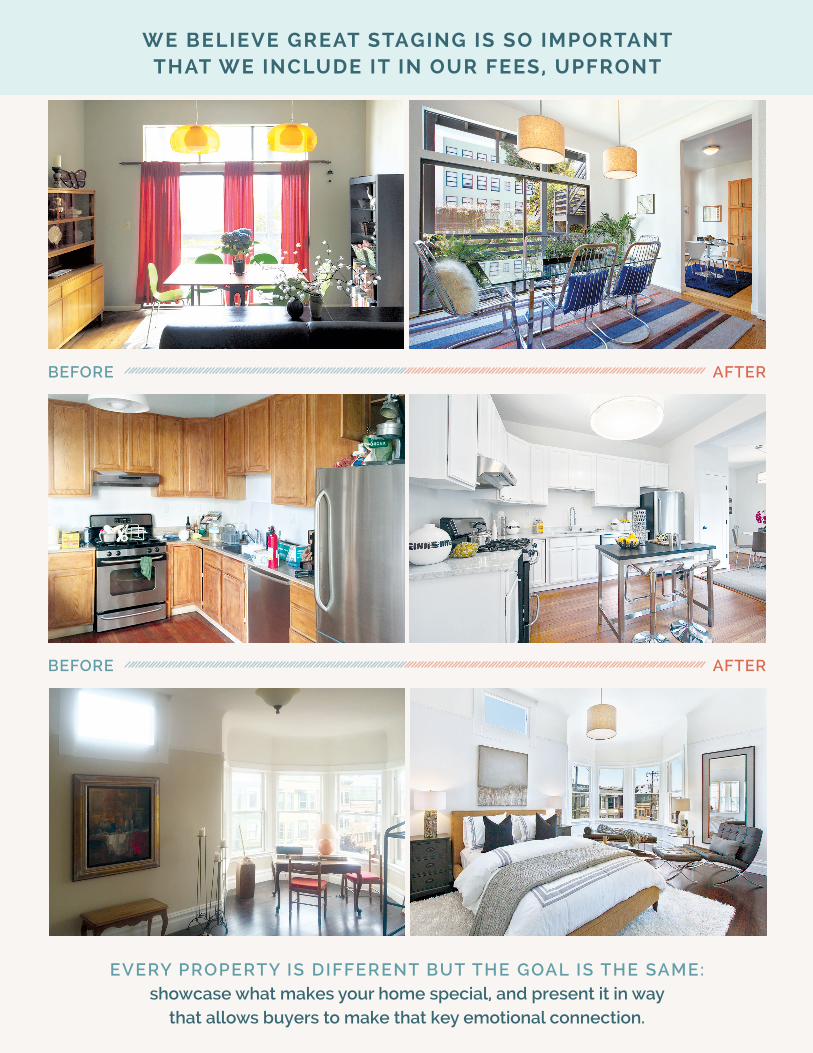
EVERY PROPERTY IS DIFFERENT BUT THE GOAL IS THE SAME: showcase what makes your home special, and present it in way
that allows buyers to make that key emotional connection.
BEFORE AFTER
BEFORE AFTER
WE BELIEVE GREAT STAGING IS SO IMPORTANT THAT WE INCLUDE IT IN OUR FEES, UPFRONT

C L I M B S F . C O M
251 Rhode Island St 105 San Francisco CA 94103
Modern Real Estate SF.com
KIRA MEADREAL ESTATE AGENT
CalBRE#: 01905944
Equal Housing Opportunity • If your property is now listed for sale this is not intended as a solicitation of the listing.
(415) [email protected]
We Referrals


