Sand column impact with a rigid target S. Park + , T. Uth + , N.A. Fleck + , H.N.G. Wadley* and V.S. Deshpande + + Department of Engineering, Cambridge University, Trumpington Street, Cambridge, CB2 1PZ, UK *Department of Materials Science & Engineering University of Virginia, Charlottesville, Va 22903 Abstract A laboratory-based methodology to launch cylindrical sand slugs at high velocities is developed. The experimental set-up comprises a launcher with a cylindrical cavity and a piston to push out the sand slug. The apparatus is used to launch both dry and fully water saturated sand slugs. High speed photography is used to characterise the evolution of the sand slugs after they are launched. We show that the diameter of the slugs remains unchanged with the sand particles having only an axial velocity component. However, the sand particles have a linear spatial axial velocity gradient which results in the lengthening of the slugs as they travel towards their target. Thus, while the density of the sand slugs decreases with increasing time the linear velocity gradient means that the slugs remain spatially homogenous. The velocity gradient is typically higher in the dry sand slugs compared to the water saturated slugs. The pressure exerted by the slugs on a rigid-stationary target is measured by impacting the slugs against a direct impact Kolsky bar. After an initial high transient pressure, the pressure reduces to a value equal to approximately 2 v where is the density of the impacting sand slug and v the particle velocity. This indicates that the loading due to the sand is primarily inertial. The momentum transmitted into the Kolsky bar was approximately equal to the incident momentum of both the dry and water saturated sand slugs. The methodology to launch sand slugs developed here generates well- characterised soil ejecta without the detonation of an explosive. This will permit a laboratory-based experimental investigation of the soil-structure events. Keywords: granular material, blast loading, sand-structure interaction.
Transcript
Sand column impact with a rigid target
S. Park+, T. Uth+, N.A. Fleck+, H.N.G. Wadley* and V.S. Deshpande+ +Department of Engineering, Cambridge University,
Trumpington Street, Cambridge, CB2 1PZ, UK
*Department of Materials Science & Engineering
University of Virginia, Charlottesville, Va 22903
Abstract
A laboratory-based methodology to launch cylindrical sand slugs at high velocities is
developed. The experimental set-up comprises a launcher with a cylindrical cavity and
a piston to push out the sand slug. The apparatus is used to launch both dry and fully
water saturated sand slugs. High speed photography is used to characterise the
evolution of the sand slugs after they are launched. We show that the diameter of the
slugs remains unchanged with the sand particles having only an axial velocity
component. However, the sand particles have a linear spatial axial velocity gradient
which results in the lengthening of the slugs as they travel towards their target. Thus,
while the density of the sand slugs decreases with increasing time the linear velocity
gradient means that the slugs remain spatially homogenous. The velocity gradient is
typically higher in the dry sand slugs compared to the water saturated slugs. The
pressure exerted by the slugs on a rigid-stationary target is measured by impacting the
slugs against a direct impact Kolsky bar. After an initial high transient pressure, the
pressure reduces to a value equal to approximately 2v where is the density of the
impacting sand slug and v the particle velocity. This indicates that the loading due to
the sand is primarily inertial. The momentum transmitted into the Kolsky bar was
approximately equal to the incident momentum of both the dry and water saturated sand
slugs. The methodology to launch sand slugs developed here generates well-
characterised soil ejecta without the detonation of an explosive. This will permit a
laboratory-based experimental investigation of the soil-structure events.
The response of structures to nearby explosions depends upon a variety of factors
including the mass, shape and type of explosive, its distance from the explosive and the
intervening medium (air, water, soil). While much attention has been devoted to the
dynamic response of structures when either water [1, 2, 3] or air [4, 5, 6, 7] resides
between the structure and the explosion, the response of structures subjected to loading
from a buried explosion has received much less attention.
A number of experimental studies have proposed empirical relations to quantify the
deformations of plates subjected to landmine explosions and also have quantified the
corresponding impulsive loads; see for example Westine et al. [8] and Neuberger et al
[9]. Based on these empirical relations, Morris [10] has proposed a design-for-
survivability code for structures subjected to such explosions. A parallel effort also
exists to simulate the deformations of structures subjected to the complex loadings
created by such explosions. For example, Rimoli et al [11] used a soil model [12] to
deduce the impulse applied to structures by explosively driven spherical sand shells and
then simulated the ensuing deformation of aluminium monolithic and sandwich plates
using finite element calculations. Gruijicic et al. [13] and Wang et al. [14] have
presented coupled Eulerian/Lagrangian simulations of landmine explosions and
attempted to compare their predictions with blast impulse and plate deformation
measurements from Bergeron and Temblay [15] and Foedinger [16]. More recently,
Borvik et al. [17] have developed a coupled discrete particle/continuum numerical
formulation to simulate the deformation of plates subjected to explosively accelerated
spherical sand shells. In all cases, discrepancies exist between measurements and
predictions and calibrations are needed before reliable predictions can be made.
The origin of these discrepancies is currently unclear. Two possibilities exist:
(i) The simulations are unable to accurately capture the transfer of momentum
from the explosive to the soil during the explosive event.
(ii) The simulations do not accurately capture the interactions between the high
velocity soil ejecta and the impacted structure.
An experimental method of generating well-characterised soil ejecta without the
detonation of an explosive would help in decoupling the above two issues by enabling
us to experimentally investigate the soil-structure interaction phenomena in a more
controlled manner. This is the primary aim of this study.
3
Pingle et al [18] have developed a sand particle impact model and used it to investigate
the response of rigid targets to impact by columns of particles of uniform, and axially
varied velocity. This rather idealised, but fundamental fluid-structure interaction (FSI)
problem is the “sand-blast” analogue to the classical water propagated shock FSI
problem studied by Taylor [19]. Liu et al. have recently [20] extended the sand
column model to investigate the impact of clamped sandwich and monolithic plates; see
Fig. 1a The numerical results indicate that some edge clamped sandwich panel
designs suffer significantly smaller deflections than equal mass per unit area monolithic
plates of identical span. However, unlike in the water blast situation, the performance
benefit in this case was discovered not to be governed by fluid-structure interaction
effects, but rather is dominated by the higher bending strength of sandwich plates.
The loading of structures by a column of high velocity sand particles not only provides
physical insight into the interaction of sand particles with structures, but also is directly
representative of the ejecta created during a landmine explosion. High speed
photographs of the sand ejecta from a landmine explosion impacting a V-shaped hull are
included in Fig. 1b (modified from Joynt and Williams [21]). The photographs show
that the initial soil ejected by the detonation of a buried explosive is well approximated
as a cylindrical column of high velocity sand particles. The impact of cylindrical
columns of high velocity sand particles against a test structure is therefore a problem of
considerable theoretical and experimental interest.
In this study we shall present a laboratory-based method to generate a cylindrical
column of high velocity sand particles. This cylindrical column shall subsequently be
referred to as a “sand slug”. The outline of the paper is as follows. First the
experimental apparatus and protocol to generate slugs comprising dry and fully water
saturated sand is described. The set-up to measure the loads these slugs exert on rigid
and stationary structures is also detailed. The experimental results are then presented
in two steps. First the evolution of the sand slugs as they are ejected from the launcher
is characterised via observations made from high speed photography and second we
report the measured pressures and impulses that arise from the impact of the slugs on a
direct impact Kolsky bar. These measurements are used to validate some of the
findings of the numerical study by Pingle et al. [18].
4
2. Experimental protocol
The aim of the experimental study is to develop a methodology to launch cylindrical
sand slugs using a laboratory-based gas gun and measure the pressure and momentum
imparted by the slugs to a stationary target. We first describe the apparatus used to
launch the sand slugs and then proceed to describe the instrumentation employed to
measure the pressure and momentum.
2.1 Sand slug launcher
The sand slug launcher comprises a cylindrical cavity wherein the sand slug to be
launched is located, a piston that is used to push this sand slug out of the cavity and a
high velocity striker that is launched from a gas gun. The striker impacts the piston
head and thereby launches the sand slug.
A cross-sectional view of the sand-slug launcher apparatus is sketched in Fig. 2 with all
critical dimensions labelled. Unless otherwise stated all components are made from
mild steel. We briefly describe each of the components:
(i) The launcher primarily comprises a 60 mm thick circular steel plate of diameter
125 mm with a central cylindrical cavity of diameter 12 mm.
(ii) The piston that can slide within the cylindrical cavity as shown in Fig. 2
comprises a 70 mm long rod with a piston head that arrests the piston. The front
40mm long segment of the piston rod is of diameter 12 mm such that it slides smoothly
within the cylindrical cavity with negligible friction. The rear 30 mm of the rod has
been turned down to a diameter of 11 mm so that there is a 1 mm clearance with the
cavity wall. This reduction in the diameter was needed to prevent the jamming of the
piston inside the cylindrical cavity after the impact of the striker (the high speed impact
of the striker results in fattening of the piston rod near the impacted end). In addition a
10 mm thick Aluminium alloy washer of inner diameter 11 mm and outer diameter 25.4
mm (equal to that of the piston head) is located so that it is in contact with the piston
head. This washer helps cushion the impact of the piston head against launcher.
(iii) A 10 mm thick launcher cap with a central cylindrical cavity also of diameter
12 mm. The launcher cap was bolted onto the front face of the launcher such that
cavities of both the launcher and the cap are axially aligned as shown in Fig. 2. The
launcher cap serves two purposes: (a) it allows us to locate a front cover that helps
maintain the shape of the stationary slug (typically baking paper is used as the front
cover as described below) and (b) the front end of the sand slug has to travel 10 mm
within the cavity after the slug has been launched: try-and-error experimentation
5
showed that this extra cavity length helps maintain the shape of the launched sand slug.
(iv) A striker of diameter 28.5 mm and mass 0.18 kg that is launched from a gas
gun. The striker impacts the piston head centrally and normally at impact velocities in
the range of -1100 ms - -1150 ms .
The launcher is bolted to a rigid support frame so that it remains stationary during the
impact event.
2.2 Sand slug preparation
The sand slug comprised silica sand with sub-angular particle sizes in the range 150-
300μm ; see Fig. 3. The density of solid silica is -32700 kgm while the measured
density of the sand compacted in the cylindrical cavity of the launcher was -31650 50 kgm giving a relative packing density of 0.61 0.02 . The sand slug
of length 19 mmL and diameter 12 mmD had a sand mass of 3.55g. It was
compacted (with a pressure of 60 kPa) into the cylindrical cavity of the launcher in five
layers of equal height. The sand slug was held in place by a piece of baking paper
covering the mouth of the launcher cavity and the piston pushed firmly against the rear
end as shown in Fig. 2. The baking paper was in turn held in place by bolting the
launcher cap onto the launcher. The launcher assembly along with the piston was then
bolted onto the rigid support frame.
In order to better visualise the deformation of the sand slugs, the sand particles in
alternate layers were dyed with water-based black ink. This created a “zebra striped”
sand slug as shown in Fig. 2. Two variants of the sand slugs are considered in this
study:
(i) Dry sand which was prepared as described above. This is subsequently be
referred to as the dry sand slug.
(ii) A sand slug with all interstitial spaces filled with water; this fully saturated
sand slug is referred to subsequently as the wet sand slug. Recall that the
sand particles packed to a relative density 0.61 0.02 . Thus, after the
sand slug was prepared 0.75g ( the weight of water required to fill in the 40
vol% interstitial spaces between the particles) of water was poured on the
top of the slug and allowed to seep through under the influence of gravity.
2.3 The dynamic test protocol
A circular cylindrical steel striker of diameter 28.5 mm and 0.18 kg mass was fired from
6
a gas gun so as to impact the head of the piston normally and centrally. The striker
was fired from a 28.5 mm diameter bore, 4.5 m long gas gun at velocities of either 1100 mspv or 1150 ms . The sand slug ejected from the barrel of the sand
launcher was visualised using a Phantom V121 high speed video camera. Typically,
the photographs were taken using an inter-frame time interval of 53 μs with an
exposure time of 2μs . The striker imparts a velocity ov to the piston that was also
measured via high speed video photography. For the two values of pv investigated,
the piston velocities were measured to be 168 msov and 194 ms , respectively.
Subsequently, we shall refer to the tests via these piston velocities ov .
The force (and corresponding impulse) exerted by the sand slug on a nominally rigid
and stationary target was measured via an instrumented direct impact Kolsky bar made
from a magnesium alloy (grade AZ31). The bar of diameter 22.5 mm and length
890 mm was placed on top of smooth rollers at a stand-off S from the stationary sand
slug in the launcher; this stand-off was measured as the distance from the baking paper
front cover of the sand slug to impacted end of the Kolsky bar as shown in Fig. 2. Two
stand-offs 50 mmS and 150 mm were used in this investigation.
The force exerted by the sand slug was measured using a pair of semiconductor strain
gauges2 mounted diametrically opposite to each other at a 5 bar diameter distance from
the impacted end of the Kolsky bar. These gauges were connected in series through a
resistor with a fixed resistance 2200R to a 15 VE DC supply provided by a
battery as shown in the circuit diagram in Fig. 4. The change in the potential drop
V across the resistor R was measured and related to the longitudinal strain
(compressive strain is defined as positive) in the Kolsky bar via the relation [22-23]
2SG
SG SG
2
2 2
V R R
R G RE R V R V
(2.1)
where 140G and SG 500R are the gauge factor and resistance of the semi-
conductor strain gauges, respectively. The force sF exerted by the sand slug on the
Kolsky bar is then calculated via the relation
s mF E A (2.2)
1 Vision Research, 100 Dey Rd. Wayne, NJ, USA. 2 Model AFP-500-090, Kulite Sensors Limited, Stroudley Rd., Kingsland Business Park, Basingstoke,
Hants, RG24 8UG, UK.
7
where 44 GPamE is the Young’s modulus of the magnesium alloy and A is the
cross-section area of the Kolsky bar. The longitudinal elastic wave speed in the bar
was measured to be 14920 ms giving a time-window of 310 μs before elastic
reflections from the distal end of the bar complicate the measurement of the force.
However, high speed photography (discussed later in Section 5.1) showed that the
duration of the impact event between the sand slugs and the Kolsky bar was typically in
excess of 0.4 ms. Thus, while the strain gauges could be used to measure the initial
force transient exerted by the sand slug, a separate measurement was required in order
to estimate the momentum transferred by the sand slug to Kolsky bar.
The measurement of the transmitted momentum was performed by using the Kolsky bar
as a ballistic pendulum. Recall that the bar was placed on smooth rollers and thus
undergoes rigid body motion due to the momentum transferred by the sand slug.
Typically, it is sufficient to approximate the bar as a rigid body after elastic waves due
to the impact event have traversed 10 times along the length of the bar, i.e. after 1.8 ms.
We measured the steady-state velocity barv acquired by the bar over a 30 ms duration.
Over this time interval, the Kolsky bar can be approximated as a rigid body and thus the
transmitted momentum is given as
t barI Mv (2.3)
where 0.65kgM is the mass of the Kolsky bar. Note that M is much greater
than the mass of the sand slug. Hence barv is much less than the velocity of the sand
slug and it is thus sufficient to regard the Kolsky bar as nominally stationary with
respect to the impact of the sand slugs.
3. Overview of the sand launching process
It is instructive to qualitatively describe the phenomena at play during the launch of the
sand slugs. The impact of the striker against the piston head imparts a velocity ov to
the piston. Since the mass of the piston is significantly greater than that of the sand
slug, ov remains approximately constant until the piston is abruptly brought to rest by
the impact of the piston head against the launcher. The motion of the piston initiates a
compressive wave at the interface between the piston and the sand slug. Since the
sand slug resides within the cylindrical cavity of the launcher, lateral expansion of the
slug is prevented and the sand undergoes uniaxial straining due to this compressive
wave. The compressive wave traverses the length of the sand slug and reflects as a
tensile wave when it reaches the baking paper covered surface at the distal end from the
8
piston. (The baking paper is very thin and light and has a negligible effect on wave
propagation in the slug, Appendix A.) The sand slug can sustain little or no tension
and hence the tensile wave results in spalling of the sand from the free surface. The
subsequent deformation of the sand slug is complicated by the interaction of this
reflected tensile wave and the compressive waves generated by the continued
compression of the rear end of the sand slug by the motion of the piston.
4. Quasi-static characterisation of the dry and wet sand slugs
The compressive response of the sand slugs under uniaxial straining conditions governs
the structure of the launched sand slug. Thus, for the sake of completeness we first
characterise this response for both the dry and wet sand slugs under quasi-static loading
conditions. A cross-sectional view of the set-up used to measure the quasi-static
uniaxial straining response of the sand slugs is sketched in Fig. 5a. The set-up comprises
a steel block with a cylindrical cavity of diameter 12 mm (equal to that of the sand slug)
and a double piston arrangement used to apply the compressive load. Each of the
pistons had a rubber O-ring as shown in Fig. 5a that allowed reasonably high pressures
to be applied before sand or water squeezed past through the gap between the piston and
the cylindrical cavity wall. The dry and wet sand slugs were compacted in the
cylindrical cavity exactly in the manner used to prepare the sand slugs as detailed in
Section 2.2.
The compressive response of the sand slugs was measured in a screw-driven tests
machine. The applied load was measured via the load cell of the test machine while
the relative displacement of the pistons was measured via a laser extensometer. The
measured applied stress versus uniaxial strain response of the wet and dry sand
slugs is plotted in Fig. 5b. Here, is defined as the ratio of the applied force to the
cross-sectional area of the cylindrical cavity and is the ratio of the measured
approach of the two pistons to the initial length 19 mmL of the compressed sand
slug. The tests were conducted at an applied strain rate 3 -110 s . A series of
unloading and re-loading cycles were also conducted in order to gauge the inelastic
deformation that occurs during uniaxial compressive loading. The applied stress
was constrained to <100 MPa as water leaked past the O-ring at higher pressures.
The initial loading response of both the dry and wet sand was linear, albeit the wet sand
is nearly 5 times stiffer with / 0.98 GPad d for the dry sand while
9
/ 4.5 GPad d for the wet sand. Upon unloading, the wet sand nearly re-traced
its loading behaviour indicating that the compressive response of the wet sand is
essentially linear elastic over the range of stresses investigated here. By contrast, the
initial unloading stiffness of the dry sand was 74 GPa with the unloading response
becoming strongly non-linear after had reduced to less than 20 MPa: this non-
linearity gave additional strain recovery. Thus, the compressive response of the dry
sand was highly dissipative with significant permanent deformations. For comparison
purposes the compressive response of water under uniaxial straining conditions as
measured in the same apparatus is included in Fig. 5b. The response was linear elastic
with stiffness approximately equal to 2.3 GPa consistent with a wide body of
experimental data on the bulk modulus of water [24].
The contrasting responses of the wet and dry sand are rationalised as follows. The
sand particles in the fully saturated wet sand slugs are constrained by the water that fills
the interstitial spaces between the sand particles. Thus, during compression, the sand
particles cannot re-arrange themselves and the response is essentially linear elastic due
to the hydrostatic compression of both the water and sand particles. On the other hand,
the 40% by volume interstitial spaces between the sand particles in the dry sand slug
allows significant re-arrangement of the sand particles to occur during the compression
of the slug. The observed inelastic deformation is a consequence of enhanced packing
that results from this re-arrangement. We note in passing that for the relatively low
applied pressures employed in this study (less than 100 MPa) no fracture of the sand
particles was observed: fracture of particles is an additional dissipation mechanism
that will be present for higher applied pressures.
5. Dynamic sand slug loading
The observations and measurements made during the dynamic launching of the sand
slugs are discussed in this section in two steps. First we characterise the evolution of
the sand slug as it is launched and travels towards its target. Then we discuss the
measurements made during the impact of the sand slug at the Kolsky bar. At-least two
repeat tests were conducted in each case to check the consistency of the measurements.
All the results reported in this section had the baking paper front cover on the slugs as
described above in Section 3. We show in the Appendix that this cover has a
negligible effect on both the deformation of the slug and the pressure exerted by the
slug as it impacts the Kolsky bar.
10
5.1 Characterisation of the evolution of the sand slug
High speed photography was used to observe the sand slug as it exits the launcher and
travels towards its target. The high speed photographs were used to characterise the
sand slug in terms of the following metrics:
(i) The particle velocity distribution along the length of the slug.
(ii) The total length of the slug.
(iii) The density distribution along the length of the slug.
High speed photographs of the dry and wet sand slugs fired with a piston velocity -194 msov are shown in Figure 6. The images pertain to impact against a Kolsky
bar at a stand-off 150 mmS . Time t indicated in each of the images is measured
from the instant of the impact of the striker against the piston head. Here we focus on
the images prior to the impact of the sand against the Kolsky bar and discuss the impact
process in Section 5.2. As the sand slugs exit the launcher and travel towards the
Kolsky bar, the slugs remain approximately cylindrical in cross sectional shape.
Moreover, while the diameter of the slugs remains almost unchanged, it is clear that the
length of both the wet and dry sand slugs increases with increasing time.
Two key differences are evident between the wet and dry sand slugs. First, the rate of
lengthening of the slugs is higher for the dry sand. Second, there is a mushrooming
effect at the head of the wet sand slug that is not so prominent in the case of the dry
sand slug. This mushrooming effect is due to air resistance effects and is rationalised
as follows. The particles of the dry sand move through the air as independent non-
interacting particles. Thus, the air only exerts a drag effect on the motion of the
particles (it will be shown subsequently that this drag has a negligible effect on the
particle velocity) which does not result in the deformation of the slug. By contrast,
when water fills in the interstitial spaces between the particles in the wet sand slug, an
interaction exists between the sand particles, and the wet sand slug behaves like a
continuum material with low shear strength. The pressure on the head of the slug due
to the air resistance causes deformation of the column and the mushrooming effect.
This is analogous to the deformation of a low shear strength cylindrical projectile after
it impacts a rigid target in the Taylor impact test [25]. A similar mushrooming effect
has also been observed by Bowden and Brunton [26] for a slug of water moving through
air at high velocities.
A similar sequence of high speed video photographs for dry and wet sand slugs fired
11
with a piston velocity -168msov are shown in Figure 7. The qualitative
observations are similar to those detailed above for the -194 msov with the main
difference being that a smaller mushrooming effect is observed for the wet sand slug
which is attributed to the lower air resistance experienced by the slug at this lower
velocity.
The high-speed photographs in Figs. 6 and 7 only show the edge of the slug facing the
camera. It is unclear from these images if the deformation is planar, i.e. whether plane
circular sections across the slug remain planar as the slug deforms. Thus, some
additional tests were conducted with a mirror placed at 45° as sketched in Fig. 8a in
order to view the part of the slug facing away from the high speed camera. A sequence
of images taken for the wet sand slug impacted at -168msov is included in Fig. 8b
where both the images of the direct image of the slug and the reflected image are
present. Comparing the direct and reflected images, it is clear that the variations
across the diameter of the slug are small and that for all practical purposes it is
reasonable to assume that plane sections across the slug remain planar with increasing
time. This assumption is employed in all the subsequent analyses that quantify the
deformation of the slug.
We proceed to analyse the evolution of the slug in terms of the metrics listed above.
The particle velocities along the length of the slug are measured by tracking the
boundaries between the light and dark layers of the sand slug via the high speed
photographs. These boundaries are labelled 1 through 6 with the boundary 1 denoting
the head of the sand slug as shown in the inset of Fig. 9a. The measured velocities bv
of the six boundaries of the dry and wet sand slugs fired at -194 msov are plotted in
Figs. 9a and 9b, respectively as function of time, t . Data for a particular boundary is
only available after it exits the cylindrical cavity of the launcher. Hence there is a time
lag between the start of the data for the consecutive boundary numbers. It is clear
from Figs. 9a and 9b that bv remains approximately constant after the slug exits the
launcher, i.e. air resistance does not have a significant deceleration effect over the time-
span in Fig. 9. However, there is spatial gradient in the velocities with the head of the
slug (i.e. boundary 1) travelling faster than the rear end of the slug (boundary 6). In
order to quantify this gradient we plot in Fig. 10 the temporal average boundary
velocities bv (i.e. average of bv over the time durations plotted in Fig. 9) in Figs. 10a
and 10b for the -168msov and -194 ms cases, respectively. In Fig. 10 the variation
of bv is plotted as a function of position X in the undeformed configuration of the
12
slug where 0X corresponds to the head of the slug and 19 mmX L
corresponds to the distal end of the slug as shown in the inset of Fig. 10a. To a
reasonable approximation, bv varies linearly with X in all cases with the gradient
/bv X higher for the dry sand slugs compared to the wet sand slugs.
The velocity gradient along the length of the slug results in a lengthening of the slugs
with increasing t . The total length of the dry and wet sand slugs as a function of
the distance s travelled by the head of the sand slug is plotted in Figs. 11a and 11b,
respectively for both piston velocities considered here. (The definition of s is
clarified in the sketch in Fig. 11c.) While can only be measured after the entire
sand slug has exited the launcher barrel we have included in Fig. 11 an extrapolation
back to 0s (where 19 mmL is the initial length of the sand slug).
Consistent with the larger spatial gradients /bv X observed for the dry sand slug
(Fig. 10), the length of the dry sand slugs is greater than that of the wet sand slugs for
any given value of s ; compare Figs. 11a and 11b. Moreover, the rate of lengthening
of the dry sand slug (with respect to s ) is higher for the lower impact velocity -168msov compared to the -194 msov case. On the other hand, / s is
reasonably independent of ov in the wet sand slug case (the differences seen in
Fig. 11b are within measurement error margins).
Recall that the spatial gradient of the particle velocities, /bv X , is almost linear
(Fig. 10). This indicates that the slug is lengthening in approximately a spatially
uniform manner and does not develop a density gradient along its length. The current
(spatially uniform) density of the slug is then related to its initial density 0 via
the relation
0
L
(5.1)
Given the one-to-one relation between and , the corresponding current density of
the slugs is also included on the right-hand y-axes in Fig. 11.
5.2 Impact of the sand slug against the direct impact Kolsky bar
The measurement of the pressure exerted by the sand slug and the momentum
transmitted by the slug into a nominally stationary target are discussed in this section.
The nominally stationary target is the instrumented magnesium alloy Kolsky bar placed
at a stand-off 50 mmS and 150 mm, as shown in Fig. 2. Also in line with the
results presented in Section 5.1, measurements are reported for both the dry and wet
13
sand slugs fired with piston velocities -168msov and -194 ms . Thus, in all there
are 8 cases considered in this section.
The pressure p exerted by the sand slugs on the Kolsky bar is defined as
2
4 sFp
D (5.2)
where sF is the force measured via the strain gauged Kolsky bar and 12 mmD is
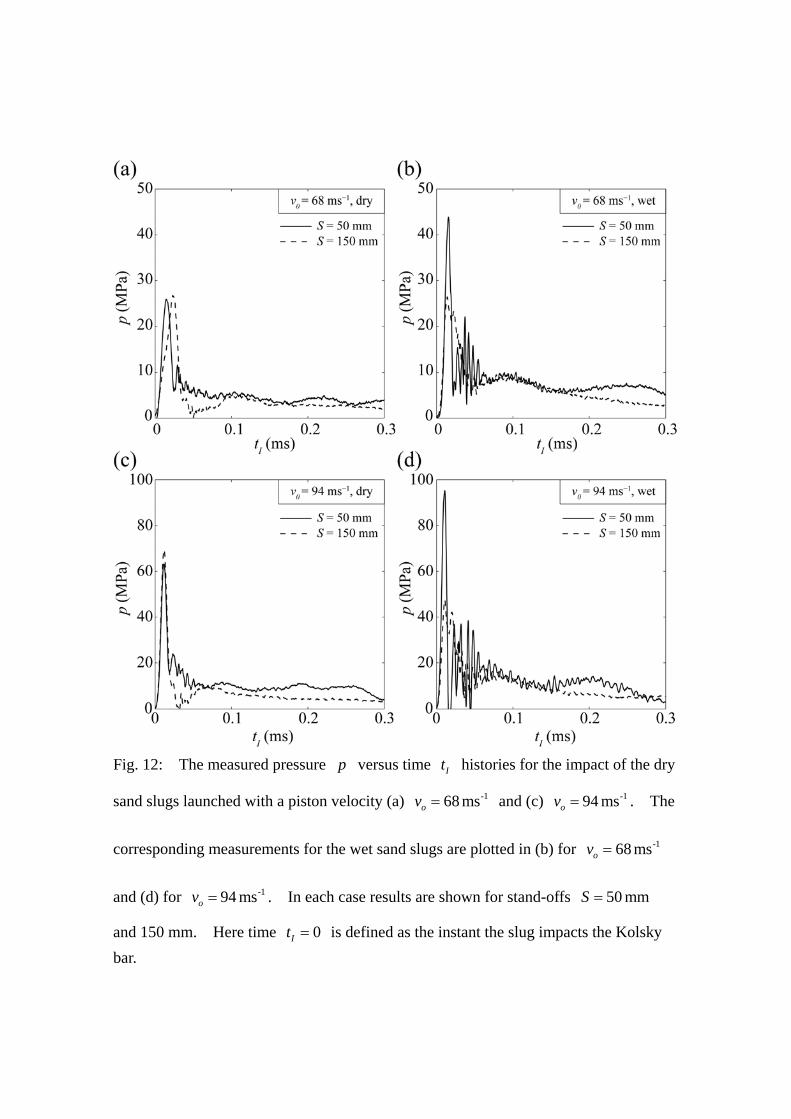
the initial diameter of the sand slug. The measured p versus time It histories for
all eight cases considered here are plotted in Fig. 12. Here It is the time measured
from the instant of impact of the sand slug against the Kolsky bar with 0p for
0It . Measurements are only included for 0.3msIt as the arrival of the reflected
wave from the distal end of the Kolsky bar complicates the measurements after this time
as explained in Section 2.3.
First consider the dry sand slug cases plotted in Figs. 12a and 12c for -168msov and -194 ms , respectively. While the measured pressure histories are reasonably
independent of the stand-off S , it is clear on comparing Figs. 12a and 12c that the sand
slugs fired with a piston velocity -194 msov exert a considerably higher pressure than
the -168msov case. We proceed to analyse and discuss these measurements.
The high speed photographs (Figs. 6a and 7a) clearly show that upon impact the sand
slugs spread laterally against the face of the Kolsky bar. Momentum conservation then
suggests that the sand slug exerts a pressure 2p v (5.3)
where is the density of the impacting sand slug and v the particle velocity. We
use Eq. (5.3) to predict the pressure exerted by the sand slug from the independent
measurements of and v as follows. Over the duration of the pressure data, the
change in the density of the sand slug is small and thus we assume that the density
is given by the density of the sand slug at the instant of impact. We denote this density
by the symbol I : it can be read-off from the curves in Figs. 11a and 11b by taking
50 mms S or 150 mms S as appropriate. Recall that the particle velocities
within the slug are approximately time-invariant (Fig. 9) and that these velocities vary
approximately linearly along the length of the slug (Fig. 10). We therefore fit a linear
relation of the form
Hv v cX (5.4)
to the data in Fig. 10, where Hv is the velocity of the head of the slug and c the
14
spatial gradient of the velocity. These best fit parameters ( , )Hv c obtained from a
least-square fit are listed in Table 1 for the four cases, i.e. dry and wet sand with piston
velocities -168msov and -194 ms . The predicted pressure versus time It response
for a stand-off S is then given as
2I Hp v cX (5.5)
where X is related to the time It via the relation
IH
S S Xt
v v
. (5.6)
Substituting for v from Eq. (5.3), gives the explicit relation between X and It as
1 /
H I
I H
v tX
ct cS v
. (5.7)
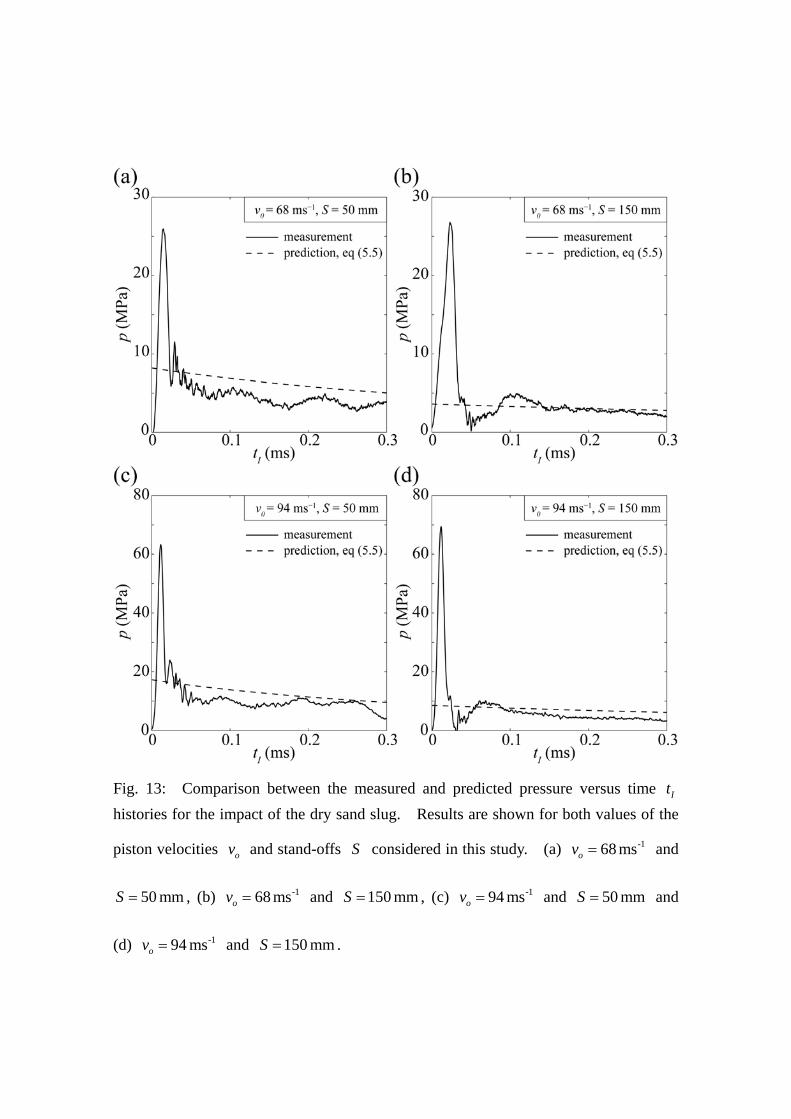
Predictions based on Eqs. (5.5) and (5.7) are included in Fig. 13 for the four dry sand
slug cases. The values of I , as read-off from Fig. 11a, and used in these predictions
are listed in Table 2.
The measured and predicted pressures are in reasonable agreement for 0.05 msIt
indicating that the inertial relation, Eq. (5.3) is applicable for the majority of the impact
duration. However, there is an initial transient in the measurements that gives
pressures significantly greater than 2v . Such an initial transient was also reported in
the discrete element calculations of the impact of a sand slug by Pingle et al.[18]; these
authors attributed this transient to elastic wave propagation effects within the sand slug
that are important prior to the steady-state lateral spreading deformation mode being
established.
Next consider the wet sand slugs pressure histories plotted in Figs. 12b and 12d for the -168msov and -194 ms cases, respectively. Three key differences are observed
when compared with the dry sand pressure histories in Figs. 12a and 12c:
(i) The pressures are higher for the wet sand slug when compared with the
corresponding dry sand slug impacts. This difference is primarily due to the fact that
the wet sand slug density is higher than the dry sand slug.
(ii) While the peak pressure is independent of stand-off for the dry sand slug, the peak
pressures for the wet sand slug at 150 mmS are significantly lower compared to the
corresponding peak pressure at 50 mmS . We attribute this reduction to the mushrooming
seen at the head of the wet sand slug that increases with increasing distance travelled by the
sand slug. The dry sand slug does not display this mushrooming effect and hence the peak
15
pressures are independent of stand-off.
(iii) Large oscillations are observed in the measured pressure versus time history of
the wet sand slug immediately after the peak pressure. These oscillations are not
observed during the impact of dry sand slugs. While the precise source of these
oscillations is unclear, they might be related to the Plateau-Rayleigh instability [27]
which results in the sand/water mixture breaking-up into smaller packets - the discrete
impact of these packets might give rise to the observed oscillations. By contrast, the
dry sand slug comprises independent sand particles and hence a similar instability
cannot occur in this case.
Comparisons between the measured pressure histories and predictions based on
Eqs. (5.5) and (5.7) showed similar trends to the dry sand slug case (Fig. 13), i.e. the
predictions captured the tail of the pressure history accurately but did not predict the
initial peak pressures. Hence, we omit these comparisons for the sake of brevity.
We now proceed to quantify the momentum transferred to the stationary target by the
sand slugs. The incoming momentum of the sand slug is calculated as
2
04
L
ooID
vdX (5.8)
where v is given by Eq. (5.4). The momentum transmitted tI into the target is
determined by measuring the velocity that the Kolsky bar acquires as detailed in Section
2.3. The ratio /t oI I is a measure of the so-called fluid-structure interaction effect.
If the sand upon impacting the target flows laterally with no bounce-back, then
/ 1t oI I ; while / 1t oI I corresponds to the case where some fraction of the sand
rebounds off the target. The measured values of oI , tI and /t oI I are listed in
Table 3 for the eight cases considered here. In all cases / 1t oI I : any deviations
from / 1t oI I seen in Table 3 are within the error margins associated with the
measurements made in this study.
There is a significant literature suggesting that the impact of wet sand on structures is
far more destructive compared to equivalent dry sand impacts. There two potential
reasons for this:
(i) The fluid-structure interaction between wet sand and structures is such that
/ 1t oI I for wet sand impacts while / 1t oI I for dry sand impacts, or
(ii) Wet sand has a higher density compared to dry sand. Thus, for the same
16
impact velocity the wet sand has a higher momentum and hence transmits more impulse
into the structure compared to dry sand.
The results presented here are consistent with (ii), i.e. / 1t oI I for both wet and dry
sand impacts with tI of the wet sand being higher due to the extra mass of water.
Pingle et al. [18] modelled slugs comprising discrete particles that impact rigid-
stationary structures. The numerical results showed that the pressure exerted by the
slugs is well approximated as 2p v , where is the effective density of the slug
and v the velocity of the impacting particles. Moreover, the momentum tI
transferred to the structure from the sand slug is approximately equal to the free-field
incoming momentum of the sand slug. The experimental results presented here are in
agreement with these numerical results and thus confirm that the loading of structures
due to the sand is primarily inertial. While Pingle et al. [18] only modelled dry sand,
the experimental results here indicate that the main conclusions of that study carry
forward to wet sand as well.
6. Concluding remarks
A laboratory-based methodology to launch cylindrical sand slugs at high velocities has
been developed. Both dry and fully water saturated sand slugs (wet sand slugs) were
launched, and the time evolution of these slugs has been characterised. The sand slugs
are initially at rest within a cylindrical barrel and were launched by the impact of a
piston at the rear end of the stationary slug. This impact process results in the slugs
having an approximately linear axial gradient of particle velocities with the sand
particles at the head of the slug having a higher velocity compared to those at the rear.
This means that the slugs lengthen as they travel towards their target. However, the
sand particles acquire nearly no radial velocity, and hence the diameter of the slugs
remains unchanged with increasing time. The linear spatial gradient in the velocity
means that while the density of the slugs decrease with increasing time, the slugs remain
spatially homogenous with no associated density gradient. In general the dry sand
slugs have a higher velocity gradient compared to the wet sand slugs.
The pressure exerted by the sand slugs on a rigid and nominally stationary target was
measured by impacting the slugs against an instrumented direct impact Kolsky bar.
After an initial high transient pressure, the pressure reduced to a value equal to
approximately 2v where is the density of the impacting sand slug and v the
particle velocity. This measured pressure is consistent with the observation that the
17
impacted sand flows laterally on the face of the Kolsky bar and clearly shows that the
loading due to the sand is primarily inertial. The wet sand slugs typically exert a
higher pressure due to their higher densities. The ratio of the transmitted to incident
momentum was approximately unity in all cases as there was negligible rebound of the
impacting sand slugs. This indicates that there are no differences in the so-called
fluid-structure interaction effects between wet and dry sand slugs.
This experimental study has clearly highlighted some key differences between wet and
dry sand aggregates travelling at high velocities. This includes the fact that dry sand
slugs lengthen at a faster rate compared to wet sand slugs and that wet sand slugs
display a mushrooming effect at the head of the slug. Numerical simulations are
required to understand these differences. This is a topic for future research.
Appendix: Effect of the baking paper front cover
A baking paper front cover was used to help maintain the shape of the sand slug within
the launcher cavity. While this cover is essential for dry sand, the higher cohesive
strength of the water saturated sand allows the wet sand slug to maintain its shape
without the front cover. We thus repeated some of the wet sand experiments without
the baking paper front cover in order to gauge the influence of this cover on the
measurements reported in the main part of this study.
A comparison between the measured pressure p versus time It histories for the wet
sand slugs launched with a piston velocity -168msov with and without the baking
paper front cover is shown in Figs. A1a and A1b for stand-off values 50 mmS and
150 mm, respectively. To within the scatter associated with these measurements, the
results with and without the front cover are indistinguishable. A sequence of high
speed photographs of the wet sand slug without the front cover launched with -168msov is included in Fig. A1c. These images confirm that the evolution of the
slug is also unaffected by the presence of front cover; compare Fig. 7b and Fig. A1c.
We thus conclude that the front cover has a negligible effect on both the deformation of
the slug and the pressure exerted by the sand slugs on the target.
18
Acknowledgements
The authors are grateful to Vernon Joynt and Keith Williams of General Dynamics for
providing the high speed video images of a buried explosive event and for many helpful
discussions. The research was supported by the Office of Naval Research under ONR
contract N00014-09-1-0573 (Dr D. Shifler, Programme Manager).
References
[1] H.N.G. Wadley, K.P. Dharmasena, D.T. Queheillalt, Y. Chen, P. Dudt, D. Knight, K.
Kiddy, Z. Xue, A. Vaziri. Dynamic compression of square honeycomb structures
subjected to impulsive underwater loading. J. Mech. Mat. Struc. 10 (2007) 2025–2048.
[2] H.D. Espinosa, S. Lee, N. Moldova. A novel fluid structure interaction experiment
to investigate deformation of structural elements subjected to impulsive loading. Exp.
Mech. 46 (2006) 805–824.
[3] V.S. Deshpande, A. Heaver, N.A. Fleck. An underwater shock simulator. Proc. R.
Soc. A, 462 (2006) 1021–1041.
[4] N. Kambouchev, L. Noels, R. Radovitzky. Nonlinear compressibility effects in fluid-
structure interaction and their implications on the air-blast loading of structures. J.
Appl. Phys. 100 (2006).
[5] A. Vaziri, J.W. Hutchinson. Metal sandwich plates subject to intense air shocks. Int.