20
The Impact of Measurement Uncertainty and Spatial Variability on the Accuracy of Regression-based SST Algorithms Sandra Castro, Gary Wick, Peter Minnett, Andrew Jessup & Bill Emery
| Date post: | 19-Dec-2015 |
| Category: |
Documents |
| View: | 216 times |
| Download: | 0 times |

The Impact of Measurement
Uncertainty and Spatial Variability on
the Accuracy of Regression-based
SST AlgorithmsSandra Castro, Gary Wick, Peter Minnett, Andrew Jessup &
Bill Emery

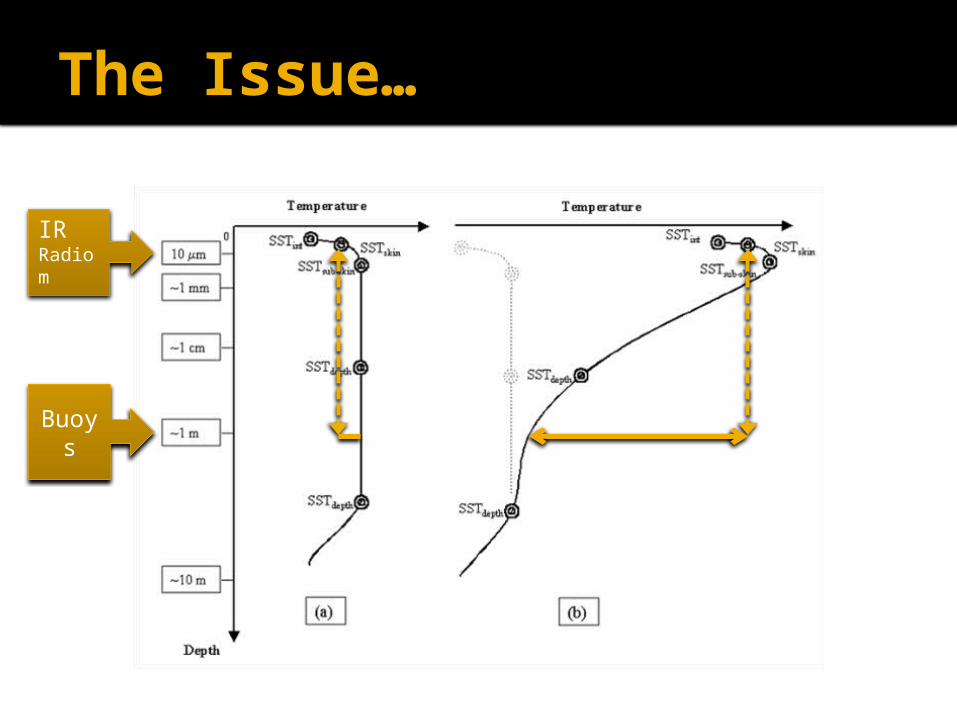
The Issue…
IR Radiom
Buoys

Initial Question
Does direct regression of satellite infrared brightness temperatures to observed in situ skin temperatures result in SST-product accuracy improvements over traditional regression retrievals to the subsurface temperature?

Approach
We evaluated parallel skin and subsurface MCSST-type models using coincident in situ skin and SST-at-depth measurements from research-quality ship data.
RMS accuracy of skin and SST-at-depth regression equations directly compared

Data: 2003-2005 NOPP Skin SST
ROYAL CARIBBEAN EXPLORER OF THE SEAS
SKIN SST: M-AERI INTERFEROMETER (RSMAS)
SST-AT-DEPTH: SEA-BIRD THERMOMETER (SBE-38) @ 2M
NOAA R/V RONALD H. BROWN
SKIN SST: CIRIMS RADIOMETER (APL)
SST-AT-DEPTH: SEA-BIRD THERMOMETER (SBE-39) @ 2M
Satellite IR: 2003-2005 AVHRR/N17 GAC and LAC NAVOCEANO BTs

Satellite - In situ SST Matchups Spatial windows: 25, 8, 4 km Temporal windows: 4, 1 hrs
All Mean Min Time

Results
There is no improvement in accuracy for the skin-only SST products in spite of the more direct relationship between the satellite BTs and the in situ skin SST observations!

Results Regression models fitted to the SST-at-depth
almost always resulted in better accuracies (lower RMSE) than skin models regardless of:
Algorithm type (split vs. dual window) Collocation criteria (window bounds/sampling) Satellite spatial resolution (GAC vs. LAC) Radiometric sensor (CIRIMS and M-AERI) Time of day (day, night, day and night) Time span (individual years vs. all years
combined) Geographical region

Next question
Can differences in measurement uncertainty and spatial variability explain the lack of accuracy improvement in the skin SST retrievals?

Approach
Explore the combination of the effects by adding increasing levels of noise to the SST-at-depth, such that:
RMSE bulk SST = RMSE skin SST
Attempt to decompose the supplemental noise into individual contributions from the two effects using Variogram techniques.

Added discrete realizations of white noise processes to SST-at-depth:
Note that, for equal number of observations:
RMSE SST-at-depth < RMSE SST skin, but
RMSE SST skin < RMSE SST emulated buoy
Build RMSE curve for noise-degraded SST-at-depth.
Where the RMSE (skin) intercepts the curve, corresponds to the supplemental noise needed for equivalence in RMSE

Estimates of Required Noise
The noise generally decreases with tighter collocation windows and finer satellite resolution Required supplemental noise ranged between 0.17 and 0.14 K for the GAC cases in which all the data streams were combined and between 0.09 and 0.14 for the LAC

Instrument Measurement Error From literature:
M-AERI: 0.079°C and CIRIMS: 0.081°C
IR Radiometers: σ~O(0.08°K) Thermometers: σ~O(0.01 K) Added Noise: σ~O(0.08°K)
Empirical distributions for the measurement uncertainty of M-AERI skin SST and coincident SST-at-depth support the required supplemental noise!!

Variogram Analysis
M-AERI CIRIMS
The variogram (Cressie, 1993, Kent et al., 1999) is a means by which it is possible to isolate the individual contributions from the 2 sources of variability, since the behavior at the origin yields an estimate of the measurement error variance, while the slope provides an indication of the changes in natural variability with separation distance.

Method
We fitted a linear variogram model by weighted least squares to both skin SST and SST-at-depth with separation distances up to 200 km, and extrapolated to the origin to obtain the variance at zero lag.
M-AERI
Measurement Uncertainty
Spatial Variability

SST Uncertainty Estimates
Method Variogram Graphic
Error Contribution
Measurement
Uncertainty
Spatial Variability
Total Variability
Supplemental Noise
M-AERI o.10 0.07 0.12 0.15
CIRIMS o.07 0.07 0.10 0.23
C & M 0.12 0.10 0.16 0.17
•Variogram estimates provide strong support to the notion that the combined role of differences in measurement uncertainty and spatial variability between the skin and SST-at-depth account for the range of required subsurface supplemental noise found graphically.
•Measurement uncertainty estimates are consistent with the noise required to reconcile the accuracy differences between thermometers and IR radiometers (σ~O(0.08 K)).
On spatial scales of O(25 km):

Conclusions Removal of the near-surface temperature profile effects
through directly fitting the regression models to radiometric skin SSTs did not result in satellite SST estimates with better accuracy than regression models fit to coincident, research-grade ship-borne subsurface SSTs.
Lack of improvement was consistent with the expected impact of both measurement uncertainty and enhanced spatial variability of the skin observations.
The noise level required to ensure a subsurface SST product accuracy equivalent to that of the skin products ranged between 0.09 and 0.17 K for those cases in which all data streams were combined.
Variogram analysis suggested that differences in measurement uncertainty could account for 0.07 to 0.10 K of the required supplemental noise, while differences in spatial variability could account for up to an additional 0.07–0.10 K on scales of 25 km.
Implications Even if technological advances allowed for IR radiometer
accuracies of σ~O(0.01 K), we still have spatial variability to worry about…
The role of spatial variability in the uncertainty budget arises in part because inadequacies in point-to-pixel comparisons Sparse radiometric sampling along a single track does
not provide full coverage of the spatial variability within the satellite footprint.
The satellite measurement is a spatial average over the FOV. This spatial average might be smoothing out the enhanced variability of the skin, making the variability of the estimate more representative of the variability of point measurements of SST-at-depths
To better understand and quantify these effects, we require increased observations of sub-pixel satellite SST variability. In particular, direct observations of spatial variability as a function of measurement depth are needed.
Need for higher accuracy buoy sensors and improved atmospheric corrections.

Sum of two random variables


