26
Sanguine: Visual Analysis for Patient Blood Management Ryan A. Metcalf, MD, CQA(ASQ) Medical Director, Transfusion Service University of Utah and ARUP Laboratories JUNE 2021
Sanguine: Visual Analysis for Patient Blood Management
Ryan A. Metcalf, MD, CQA(ASQ)
Medical Director, Transfusion Service
University of Utah and ARUP LaboratoriesJUNE 2021

Objectives
• List limitations of common patient blood management (PBM) metrics
• Consider how Creativity Workshops glean end user perspectives and insights
• Analyze Sanguine, a novel data visualization tool prototype for PBM in complex cardiothoracic surgery
• Evaluate how Sanguine can rapidly demonstrate PBM performance in context
• Consider how Sanguine can be used to generate “patients like mine”
2
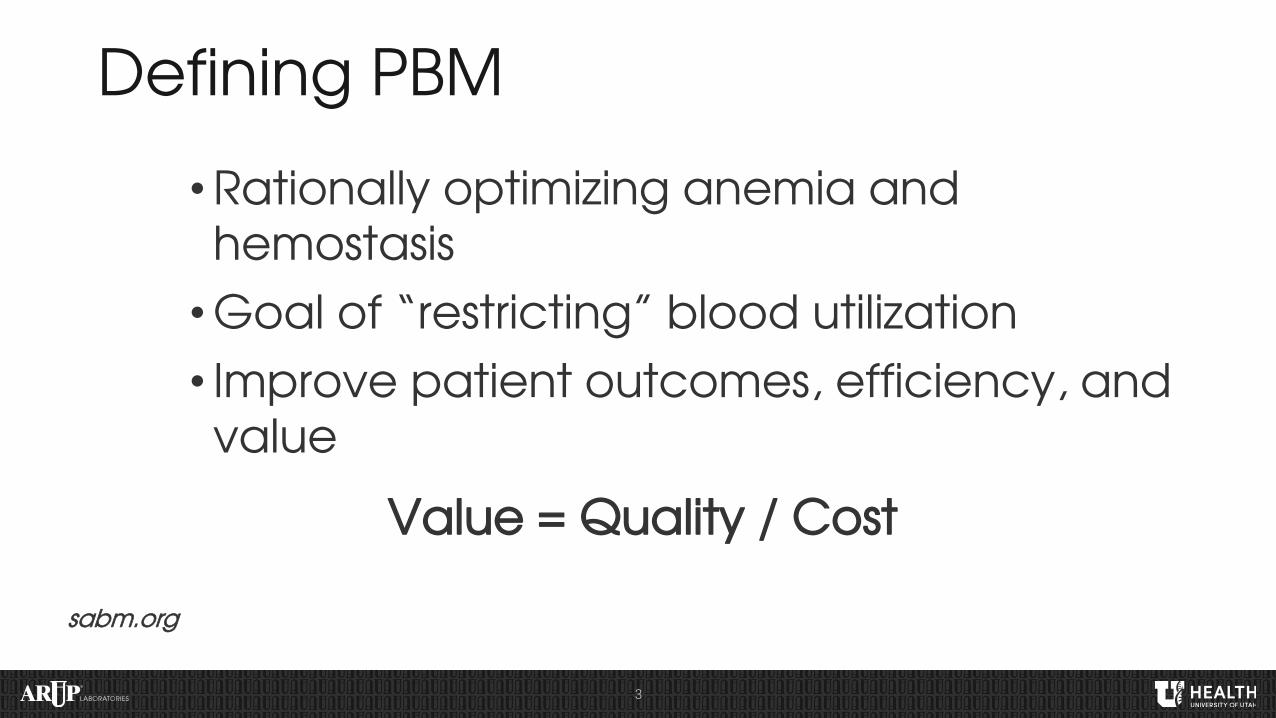
Defining PBM
•Rationally optimizing anemia and hemostasis
•Goal of “restricting” blood utilization
• Improve patient outcomes, efficiency, and value
3
Value = Quality / Cost
sabm.org
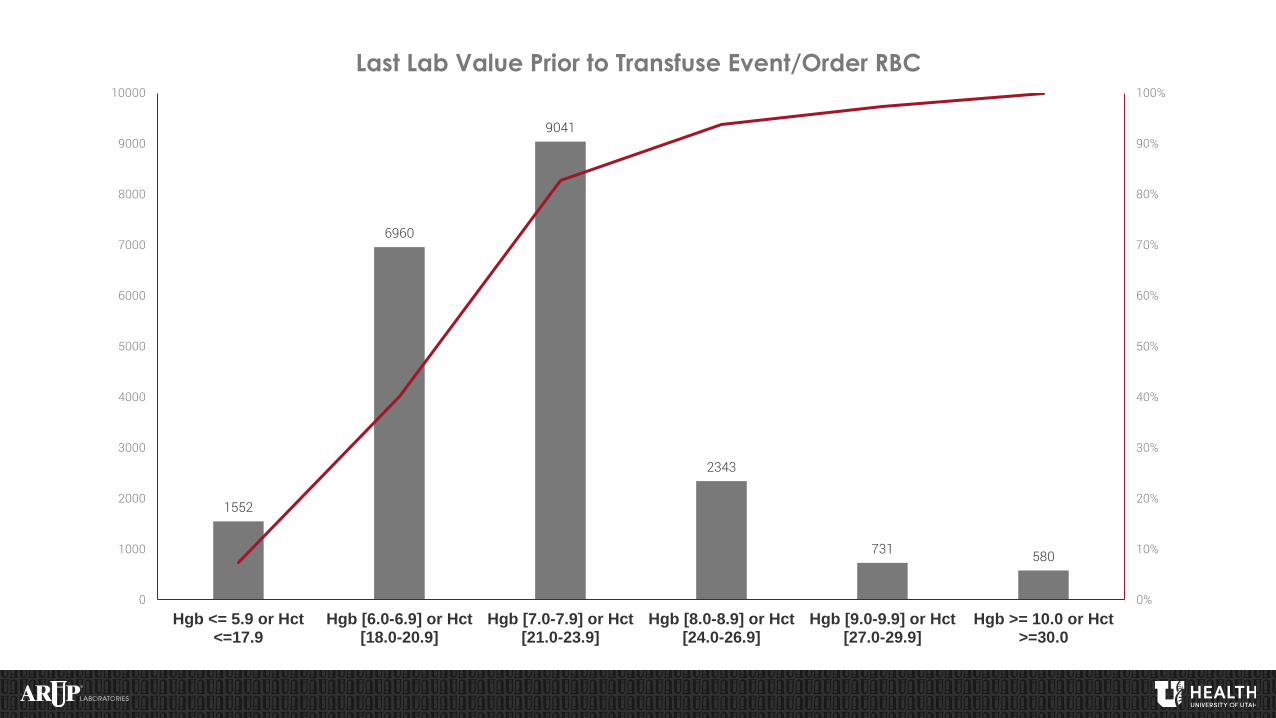
1552
6960
9041
2343
731 580
0%
10%
20%
30%
40%
50%
60%
70%
80%
90%
100%
0
1000
2000
3000
4000
5000
6000
7000
8000
9000
10000
Hgb <= 5.9 or Hct<=17.9
Hgb [6.0-6.9] or Hct[18.0-20.9]
Hgb [7.0-7.9] or Hct[21.0-23.9]
Hgb [8.0-8.9] or Hct[24.0-26.9]
Hgb [9.0-9.9] or Hct[27.0-29.9]
Hgb >= 10.0 or Hct>=30.0
Last Lab Value Prior to Transfuse Event/Order RBC
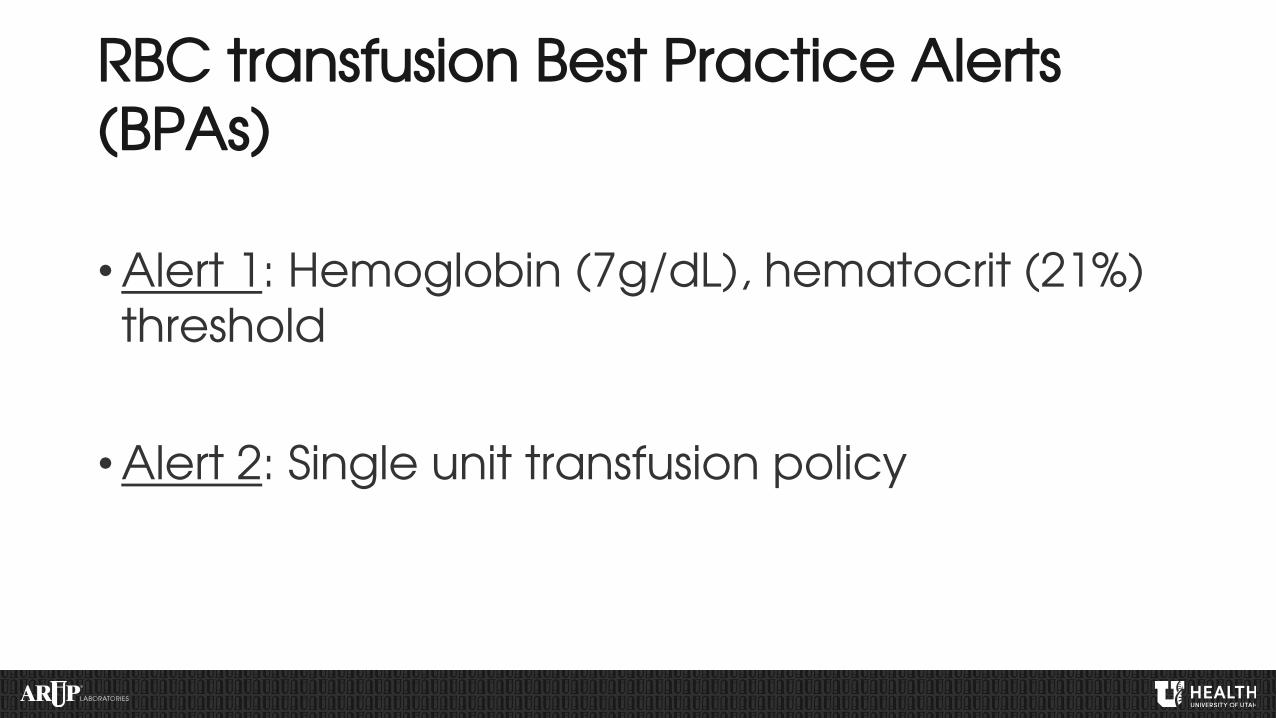
RBC transfusion Best Practice Alerts (BPAs)
•Alert 1: Hemoglobin (7g/dL), hematocrit (21%) threshold
•Alert 2: Single unit transfusion policy
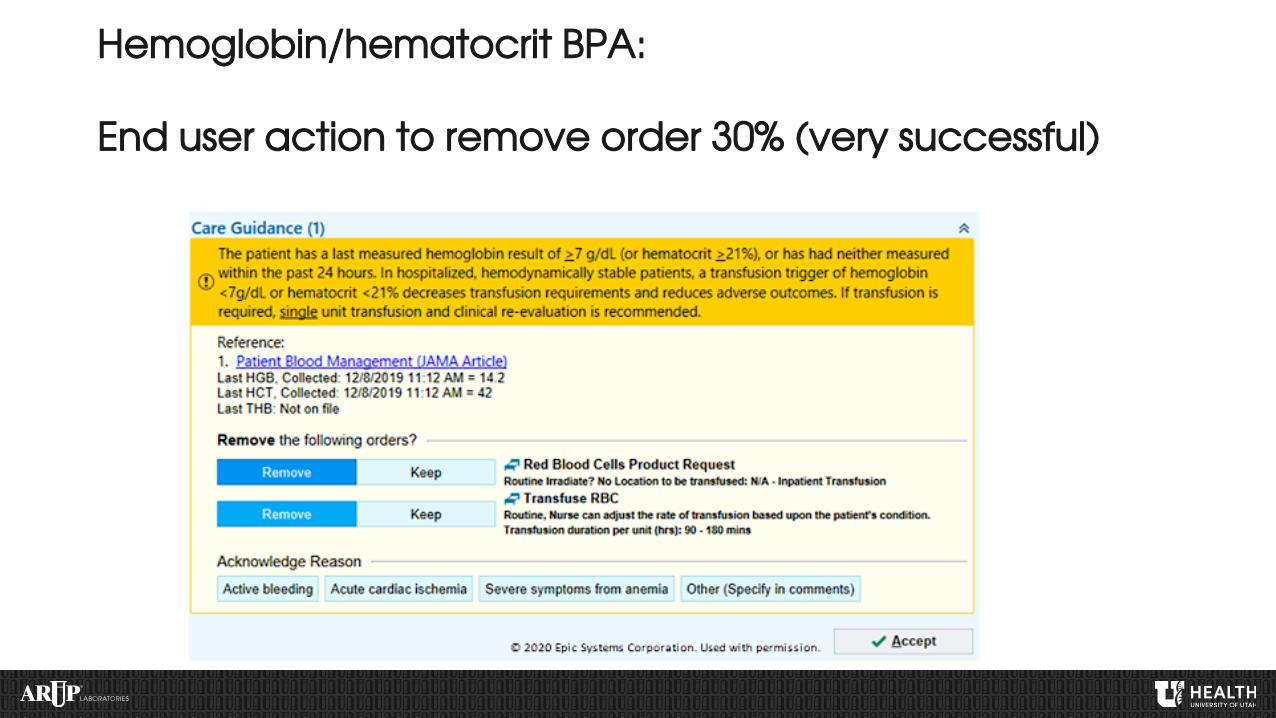
Hemoglobin/hematocrit BPA:
End user action to remove order 30% (very successful)

Single unit transfusion policy BPA
End user action to remove order <1% (not so good!)

An opportunity to further improve
•Changed single unit
BPA default action
» “Keep” → “remove”
• 4.5 month follow up
» End user action to
remove increased to
35%
» Default action influences
end-user behaviorMetcalf et al. Transfusion. 2021.

Best Practice Alert Results
• Pre-intervention: 4/2018 to 3/2019
• Post-intervention: 4/2019 to 3/2020
•Overall 11% reduction in RBCs transfused
• Projected acquisition cost savings ~$400k/year

Limitations of threshold approaches
•PBM is multifaceted» Perioperative anemia management
» Blood conservation
» Surgical technique
» Antifibrinolytic agents
• Evaluate blood use beyond lab values?» For example: high blood loss surgeries

Risk-adjustment by organizational unit using billing codes
All patients
Admissions with Surgery
AdmissionsWithout Surgery
Dept 1 Dept 2 Dept N Dept 1 Dept 2 Dept N
Physician 1 Physician 2 Physician N
Level 1
Level 2
Level 3
Level 4 Metcalf et al. Transfusion. 2019.

Statistical vs Clinical Significance
ModelDRG
weightIRR
p-valueClinical
LOSIRR
p-value
Overall 1.22 <0.001 1.03 <0.001
Surgical 1.26 <0.001 1.03 <0.001
Medical 1.05 <0.001 1.04 <0.001
DRG = diagnosis related group; IRR = incidence rate ratio
Metcalf et al. Transfusion. 2019.

Application & next steps
13
• Data visualization: graphical representations of data to facilitate understanding and insights into the data
• Sanguine: a novel tool with rapid, flexible data visualizations in relevant PBM contexts• Institutional review board
approval • Data use agreement
Lin et al. Info Vis. In press.

14
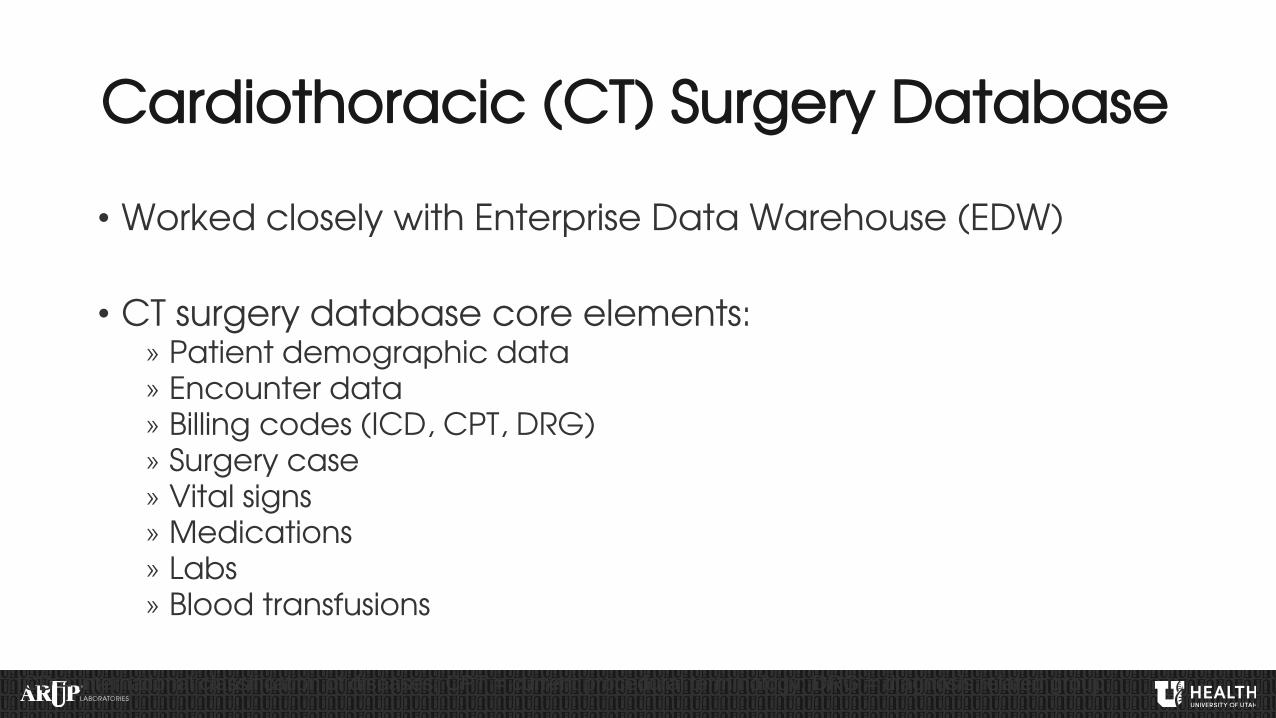
Cardiothoracic (CT) Surgery Database
• Worked closely with Enterprise Data Warehouse (EDW)
• CT surgery database core elements:» Patient demographic data» Encounter data» Billing codes (ICD, CPT, DRG)» Surgery case» Vital signs» Medications» Labs» Blood transfusions
ICD = international classification of diseases; CPT = current procedural terminology; DRG = diagnosis related group
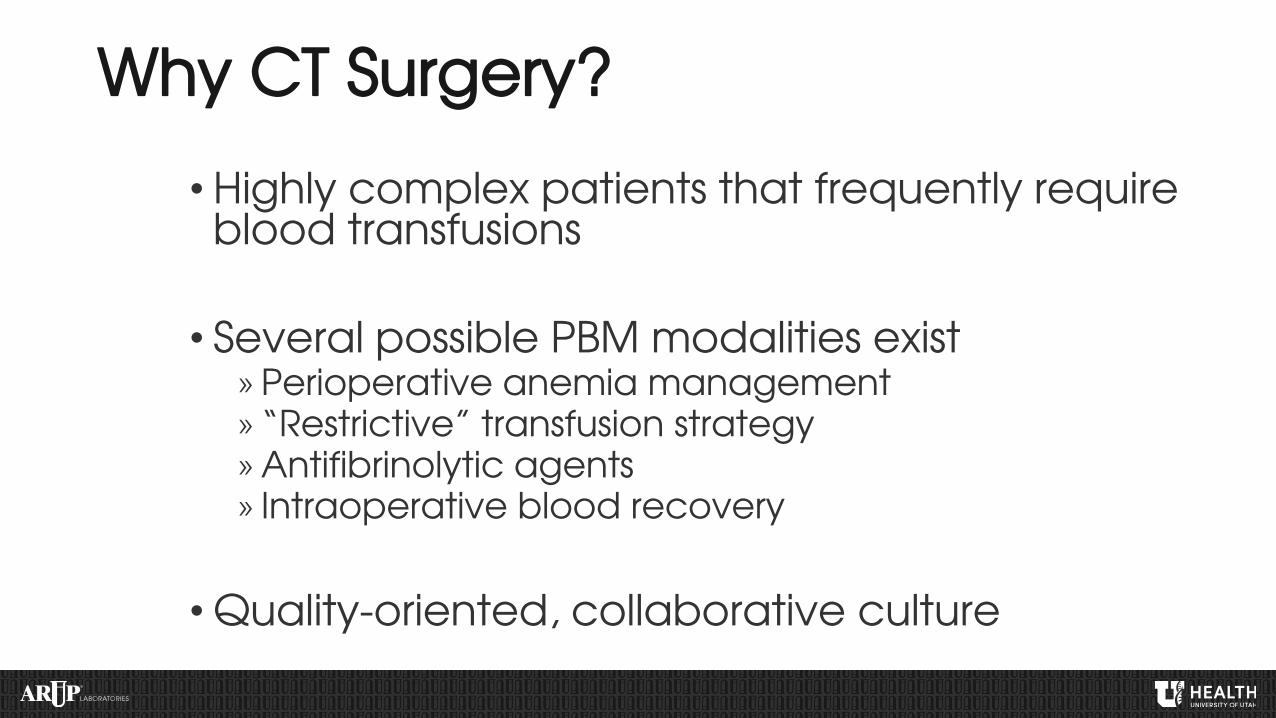
Why CT Surgery?
• Highly complex patients that frequently require blood transfusions
• Several possible PBM modalities exist» Perioperative anemia management» “Restrictive” transfusion strategy» Antifibrinolytic agents» Intraoperative blood recovery
•Quality-oriented, collaborative culture

Data Visualization: What is possible?
• Cohort filter/zoom to any organizational unit» Department, procedure type, physician, patient, etc
• Create meaningful context: » Blood utilization» Surgeon and anesthesiologist» Procedures» Risk adjustment» Laboratory values» Use of PBM modalities» Time/intervention» Outcomes: mortality, complications, etc.» Cost
Scientific Computing and Imaging (SCI) Institute: sci.utah.edu

Creativity Workshop • End user stakeholders (participants): CT surgeons, CT
anesthesiologists, IT decision support
• Facilitators: Visualization expert*, PBM expert
• Three hour session» Opening/background, tool demo (20min)» Current workflow (30min)» Wishful thinking (50min)» Visualization analogies (30min)» Barrier removal (40min)» Reflection and next steps (10min)
What would you like to know?What would you like to do?What would you like to see?
vdl.sci.utah.edu/CVOWorkshops*Scientific Computing and Imaging (SCI) Institute: sci.utah.edu

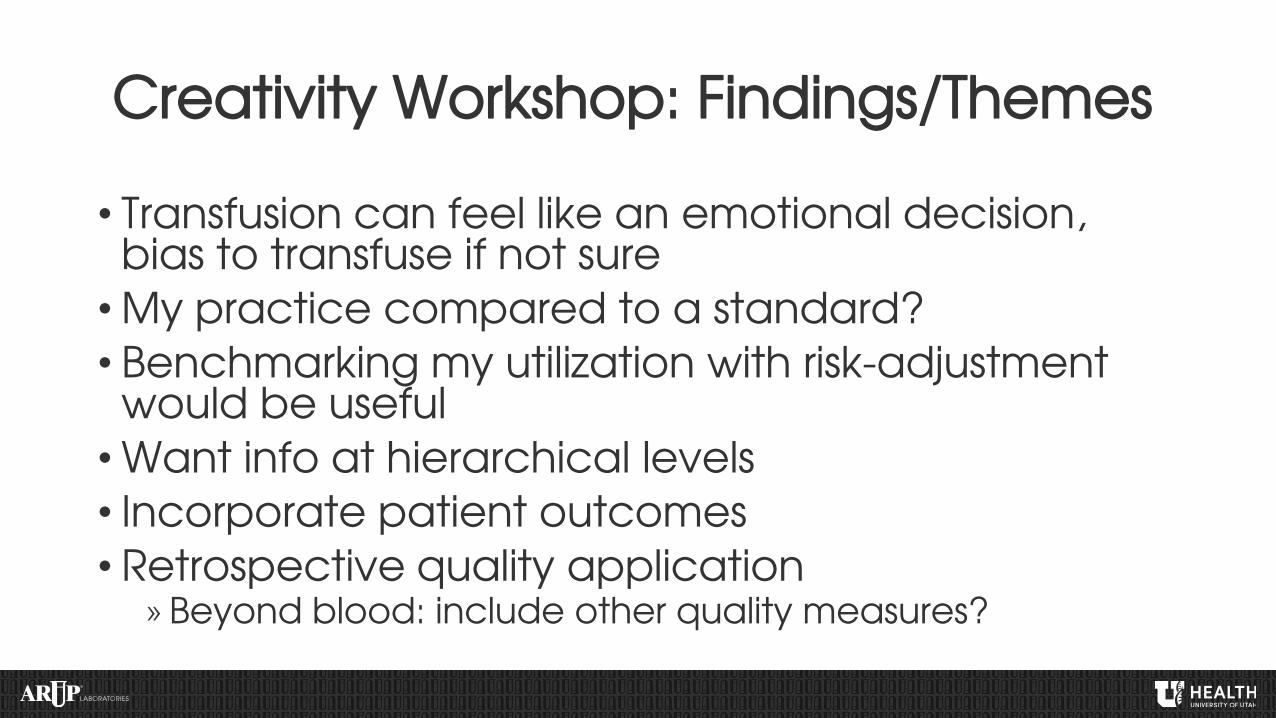
Creativity Workshop: Findings/Themes
• Transfusion can feel like an emotional decision, bias to transfuse if not sure
•My practice compared to a standard?
• Benchmarking my utilization with risk-adjustment would be useful
•Want info at hierarchical levels
• Incorporate patient outcomes
• Retrospective quality application» Beyond blood: include other quality measures?
Sanguine: Selected Use Cases
•Preoperative anemia management
• Transfusion appropriateness
•Antifibrinolytic agents
•Cell salvage
• “Patients like mine”
•General quality
• Financial impact
21
Sanguine: Visual Analysis Tool for Patient Blood Management
Switching Gears: Live Demo
22
Lin et al. Info Vis. In press.

Conclusions
• Limitations of static PBM metrics
• Risk-adjusted blood use for comparisons
•Creativity workshops for stakeholder input
• Sanguine identifies PBM patterns in context; examples:
» Preop anemia management» Transfusion appropriateness» Antifibrinolytic use» Cell salvage use» “Patients like mine”
23

Future directions and next steps for Sanguine
•Deployed locally
•Beta site deployment
• Iterative refinement» State sharing, annotation, line up, etc.
•Generalization
•Beyond PBM?
24

Acknowledgements
• Pathology and ARUP Laboratories
» Mark Astill and Adam Barker
» Tracy George
» Bob Schmidt and Sandy White
» Rob Blaylock and Kelly Cail
» Jason Goodfellow, Dee Peel and Jenni Micholetti
» Andrew Fletcher
• Enterprise Data Warehouse (EDW)
• Michael White
• Reed Barney
• Visualization (SCI)
• Alex Lex
• Haihan Lin
• Jack Wilburn
• CT surgery and anesthesiology• Josh Zimmerman• Candice Morrissey• Vikas Sharma• Joe Tonna
© 2020 ARUP LABORATORIES


