9
1 MSS SAP BEST PRACTICE SAP Return on Investment
| Date post: | 04-Jun-2018 |
| Category: |
Documents |
| Upload: | srinivaspanchakarla |
| View: | 221 times |
| Download: | 0 times |

1
MSS SAP BEST PRACTICE
SAP Return on Investment

2
MSS SAP BEST PRACTICE
Overview on ROI (Return on Investment) From SAP
Introduction
Return on Investments (ROI) Estimation is very tricky in the case of SAP Projects. More so in the casewhen an ERP system becomes the entire Foundational Backbone of an organization's functioning.Something very interesting facts about ROI
Significant increase in ROI can be achieved if the software application is appropriate to the needs ofthe organization. In the long term, an application that is flexible, and can adapt to changing businessrequirement, will reduce the cost of change and increase the ROI"
Once SAP has been implemented there is a stabilization phase, which typically lasts between sixmonths and a year. After that, organizations will try to calculate ROI in definite terms. But many arenot able to quantify ROI on ERP for certain reasons
Today the main challenge is the organizations are not able to quantify their ROI from ERPimplementation because at the beginning of the project the KPI (Key performance indicators) andmeasurement criteria not defined.
Some SAP Clients fail to realize the ROI as they think about it only after implementing ERP. There arecertain business metrics that need to be considered well in advance. This could be inventory levels,number of days for customer outstanding, the type of reports, the number of people in a particularfunction etc, For instance if out standings were X number of days, we planned to reduce it by 50percent within two years. This can be done with SAP.
SAP implementation changes the existing business processes in favor of ones that are streamlined tothe best ones followed in the industry. It changes the way business is done. The work profile at theend user level also changes. The productivity gains resulting both from improved processes andintegration of financial, business and transaction data are huge
The best thing to do is to identify the objective or purpose of ERP before implementation or rollout, and thencompare the achieved benefits to those desired
When do you start with SAP Return on Investment or SAP ROI?
SAP Implementation is an Investment not just event. How much is it going to cost and how long is it going totake? That is the classic approach to SAP implementations. Today it’s not enough and the marketplace isdemanding more from their IT dollars. Now there are questions about measuring cost reductions, processimprovements.Before SAP Implementation start it is good idea to know following
current legacy systems cost,
You know what your man hours are (staffing, personnel, benefits, overhead, etc., etc., etc.),
process cycle times,
per transaction costs for things like purchase orders, sales orders, production orders, etc.,
competitor transaction cost benchmarks,
current application license and maintenance costs,
Inventory levels etc., etc., etc.

3
MSS SAP BEST PRACTICE
ROI can be measureable? Tangible and Intangible benefits from SAPTangible benefits:
Improves the productivity of process and personnel
Lowering the cost of products and services purchased
Paper and postage cost reductions
Inventory reduction
Lead time reduction
Reduced stock obsolescence
Faster product / service look-up and ordering saving time and money
Automated ordering and payment, lowering payment processing and paper costs
Intangible benefits:
Increases organizational transparency and responsibility
Accurate and faster access to data for timely decisions
Can reach more vendors, producing more competitive bids ;
Improved customer response
Saves enormous time and effort in data entry ;
More controls thereby lowering the risk of mis-utilization of resources
Facilitates strategic planning
Uniform reporting according to global standards
Calculation of ROI
There is no standard method of calculation of ROI for an ERP project but a structured method of analysis isachievable. It may be too cumbersome and subjective to factor in intangible benefits. But these factors areimportant for creating an overall business case and in many instances, where ROI is not calculated, form a baseline objective for the project.
First step is to determine cost of various components of the project such as consulting fees license fees,modification and implementation cost, hardware cost etc. Maintenance fees for a pre determined period (sayfor three or five years) should be added to arrive at Total Cost of Ownership over the specified period. Theestimated expenditure should be time phased over the period, used to calculate TCO.Next step is the more difficult part which is to estimate expected benefits over a period of time. For estimatingthese figures, there should be wide consultation and reference to statistics emanating from various surveyreports. Benefits will largely occur from the reduction of inventory level, operation cost, labor cost andimproved production. Whereas the last three elements will have a direct impact on profit and loss account, the
4
MSS SAP BEST PRACTICE
reduction in inventory will cause release of additional cash which can be assigned to a yearly value of saving,based on organization’s standard internal rate of return.
Relationship between time phased cost and benefit will project a time phased ROI, which will be negative at
the outset and will turn positive over the payback period.
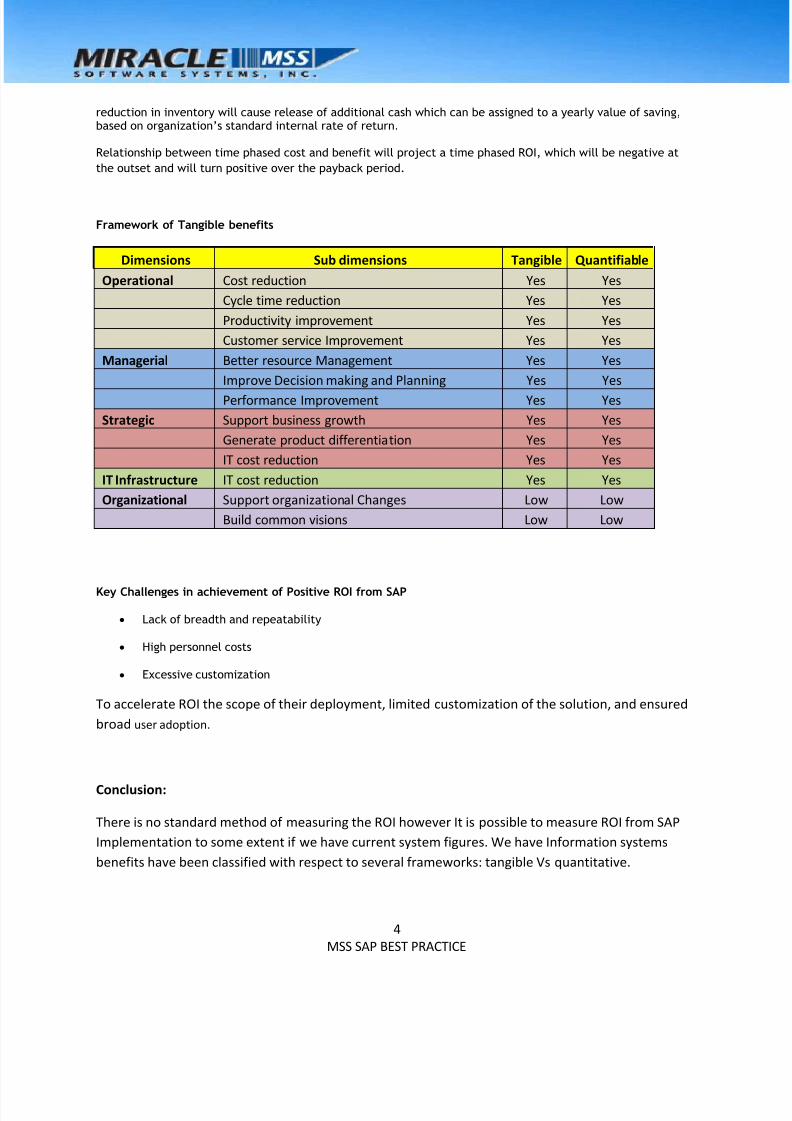
Framework of Tangible benefits
Dimensions Sub dimensions Tangible Quantifiable
Operational Cost reduction Yes Yes
Cycle time reduction Yes Yes
Productivity improvement Yes Yes
Customer service Improvement Yes Yes
Managerial Better resource Management Yes Yes
Improve Decision making and Planning Yes Yes
Performance Improvement Yes Yes
Strategic Support business growth Yes Yes
Generate product differentiation Yes Yes
IT cost reduction Yes Yes
IT Infrastructure IT cost reduction Yes Yes
Organizational Support organizational Changes Low Low
Build common visions Low Low
Key Challenges in achievement of Positive ROI from SAP
Lack of breadth and repeatability
High personnel costs
Excessive customization
To accelerate ROI the scope of their deployment, limited customization of the solution, and ensured
broad user adoption.
Conclusion:
There is no standard method of measuring the ROI however It is possible to measure ROI from SAP
Implementation to some extent if we have current system figures. We have Information systems
benefits have been classified with respect to several frameworks: tangible Vs quantitative.
5
MSS SAP BEST PRACTICE
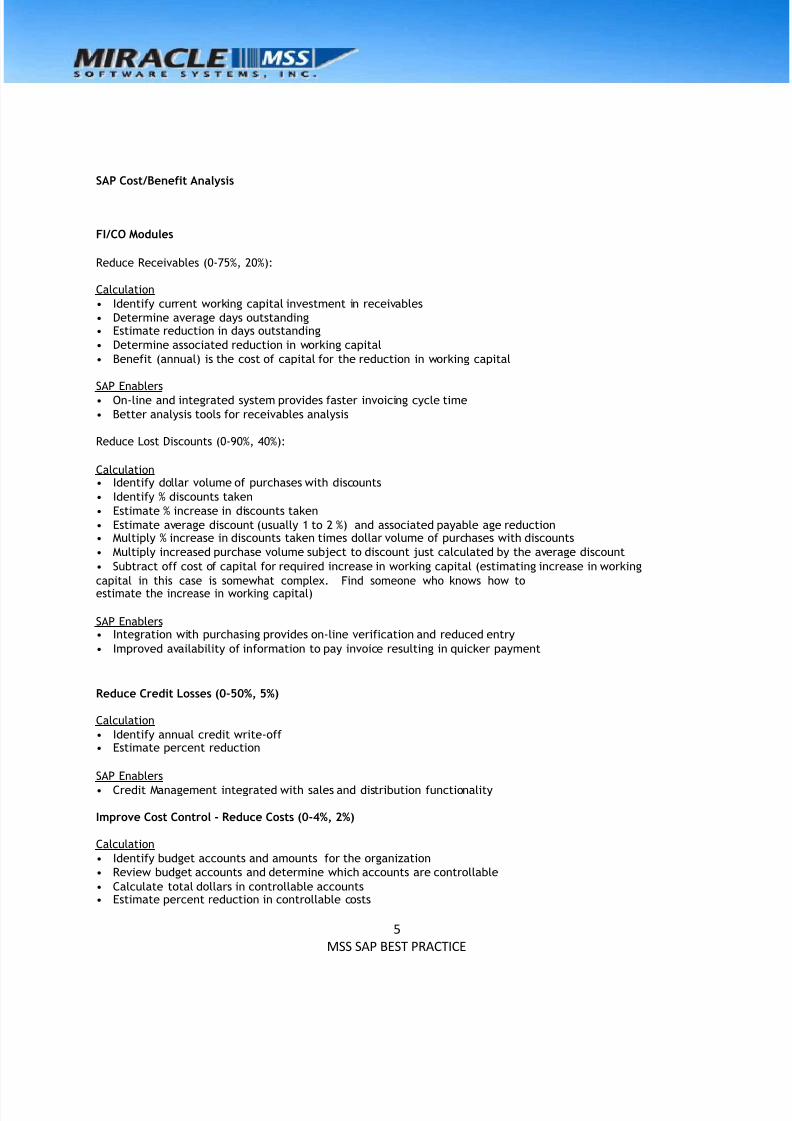
SAP Cost/Benefit Analysis
FI/CO Modules
Reduce Receivables (0-75%, 20%):
Calculation
• Identify current working capital investment in receivables
• Determine average days outstanding • Estimate reduction in days outstanding
• Determine associated reduction in working capital
• Benefit (annual) is the cost of capital for the reduction in working capital
SAP Enablers
• On-line and integrated system provides faster invoicing cycle time
• Better analysis tools for receivables analysis
Reduce Lost Discounts (0-90%, 40%):
Calculation• Identify dollar volume of purchases with discounts
• Identify % discounts taken
• Estimate % increase in discounts taken
• Estimate average discount (usually 1 to 2 %) and associated payable age reduction • Multiply % increase in discounts taken times dollar volume of purchases with discounts
• Multiply increased purchase volume subject to discount just calculated by the average discount
• Subtract off cost of capital for required increase in working capital (estimating increase in working
capital in this case is somewhat complex. Find someone who knows how toestimate the increase in working capital)
SAP Enablers• Integration with purchasing provides on-line verification and reduced entry
• Improved availability of information to pay invoice resulting in quicker payment
Reduce Credit Losses (0-50%, 5%)
Calculation
• Identify annual credit write-off • Estimate percent reduction
SAP Enablers
• Credit Management integrated with sales and distribution functionality
Improve Cost Control - Reduce Costs (0-4%, 2%)
Calculation
• Identify budget accounts and amounts for the organization
• Review budget accounts and determine which accounts are controllable
• Calculate total dollars in controllable accounts • Estimate percent reduction in controllable costs

6
MSS SAP BEST PRACTICE
SAP Enablers• On-line, Real-time cost management information
• On-line analysis tools
• Earlier visibility of costs and commitments
SD Module
Improve Pricing (0-10%, 1%)
Calculation
• Identify total sales by product line in dollars • Estimate % improvement in pricing
• Since improved pricing does not materially impact fixed or variable costs,
benefit is sales multiplied by improvement percentage
SAP Enablers
• On-line real-time capabilities increase responsiveness and customer service • Pricing procedures capability helps reduce “bad” deals
• On-line visibility of product cost and profitability analysis enables better decisions
Increase Sales (0-10%, 2%)
Calculation
• Identify sales volume by product line
• Estimate total sales capacity/production capacity (this should include
allowances for preventative and
unplanned downtime for maintenance reasons)• Estimate sales value of lost available production
• Estimate margin of lost production • Estimate portion of capacity that can be converted to sales
SAP Enablers• On-line real-time capabilities increase responsiveness and customer service
• Improved customer forecasting
MM Module
Reduce Inventory (0-50%, 10%)
Calculation
• Identify inventory value by category (if LIFO valuation, value is actually higher than reported) • Estimate inventory reduction goals by category
• One approach would be to treat reduction as a one-time benefit, but
• Another approach would be to recognize the annual benefit of reduction in
carrying costs (I believe
this better reflects reality)• Multiply inventory reductions by incremental carrying costs (Carrying cost includes cost of capital,
taxes, insurance, and damage allowances - should not include cost of assets,
labor, or building unless major reductions in inventory are anticipated)
SAP Enablers
• Improved visibility of inventory
• Improved forecasting • Improved data accuracy
7
MSS SAP BEST PRACTICE
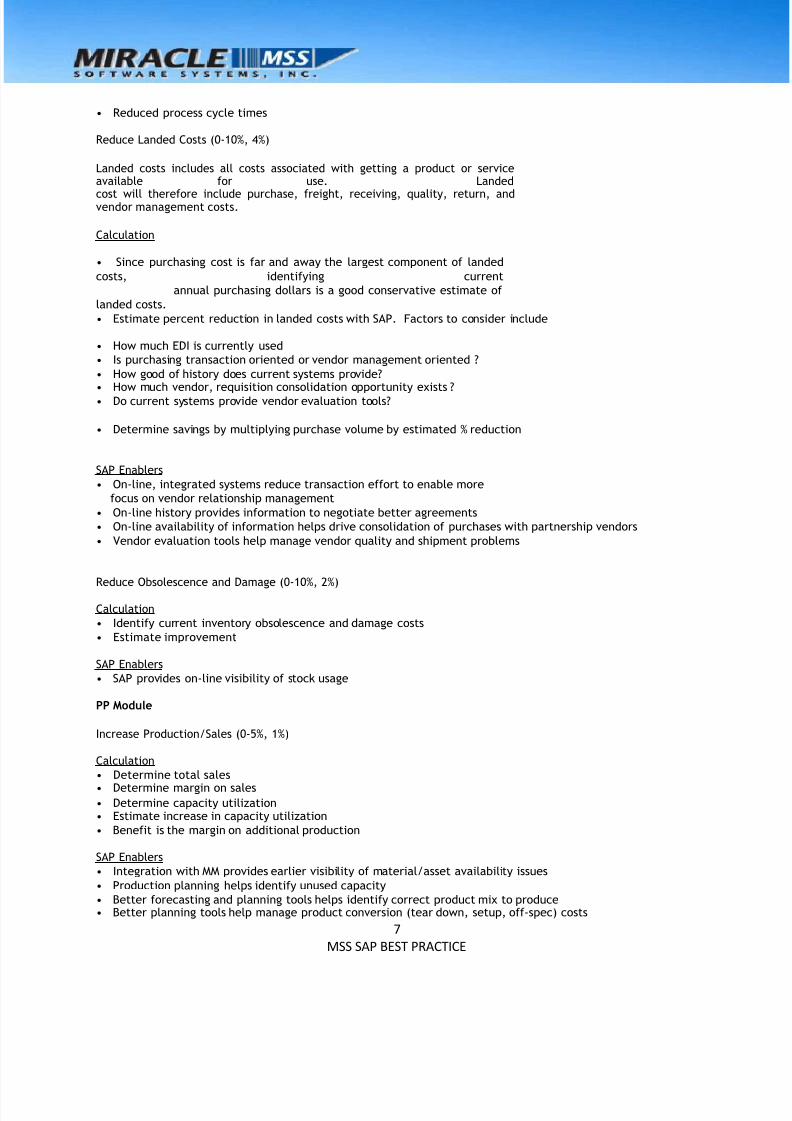
• Reduced process cycle times
Reduce Landed Costs (0-10%, 4%)
Landed costs includes all costs associated with getting a product or serviceavailable for use. Landedcost will therefore include purchase, freight, receiving, quality, return, andvendor management costs.
Calculation
• Since purchasing cost is far and away the largest component of landed
costs, identifying current
annual purchasing dollars is a good conservative estimate of
landed costs.
• Estimate percent reduction in landed costs with SAP. Factors to consider include
• How much EDI is currently used
• Is purchasing transaction oriented or vendor management oriented ?
• How good of history does current systems provide? • How much vendor, requisition consolidation opportunity exists ?
• Do current systems provide vendor evaluation tools?
• Determine savings by multiplying purchase volume by estimated % reduction
SAP Enablers
• On-line, integrated systems reduce transaction effort to enable more
focus on vendor relationship management
• On-line history provides information to negotiate better agreements
• On-line availability of information helps drive consolidation of purchases with partnership vendors
• Vendor evaluation tools help manage vendor quality and shipment problems
Reduce Obsolescence and Damage (0-10%, 2%)
Calculation
• Identify current inventory obsolescence and damage costs
• Estimate improvement
SAP Enablers
• SAP provides on-line visibility of stock usage
PP Module
Increase Production/Sales (0-5%, 1%)
Calculation
• Determine total sales • Determine margin on sales
• Determine capacity utilization • Estimate increase in capacity utilization
• Benefit is the margin on additional production
SAP Enablers
• Integration with MM provides earlier visibility of material/asset availability issues
• Production planning helps identify unused capacity
• Better forecasting and planning tools helps identify correct product mix to produce • Better planning tools help manage product conversion (tear down, setup, off-spec) costs
8
MSS SAP BEST PRACTICE
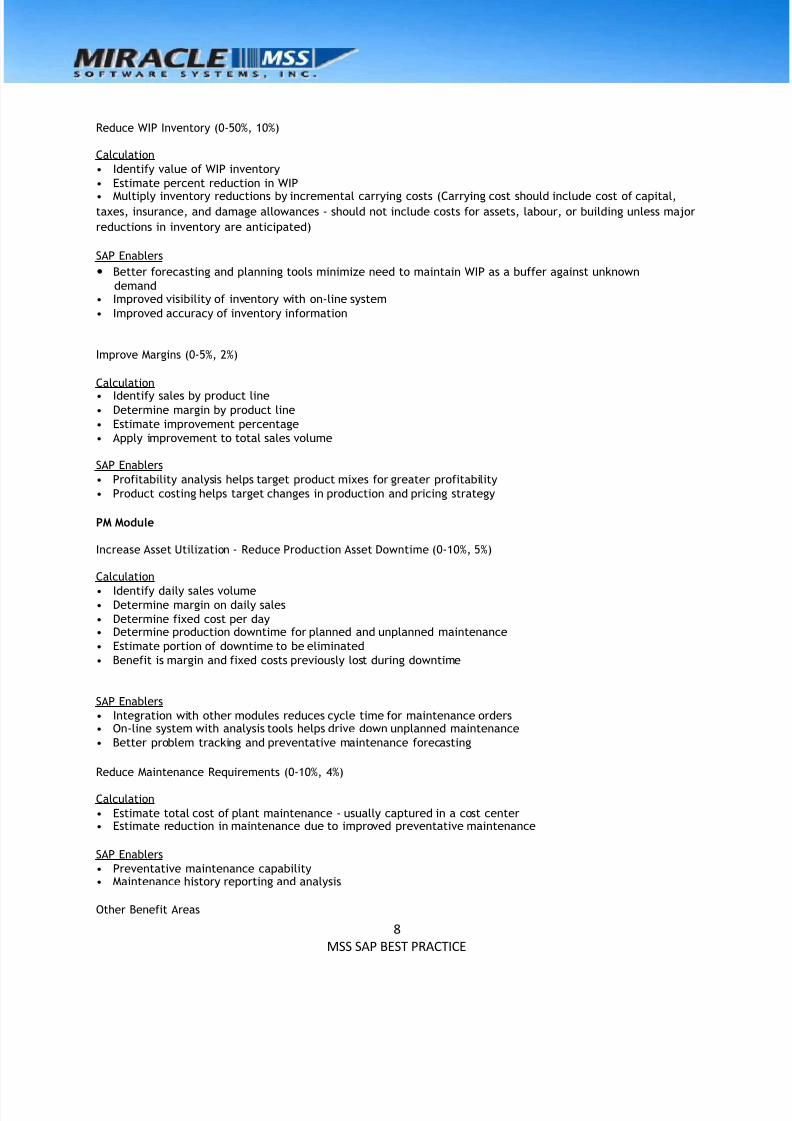
Reduce WIP Inventory (0-50%, 10%)
Calculation
• Identify value of WIP inventory
• Estimate percent reduction in WIP • Multiply inventory reductions by incremental carrying costs (Carrying cost should include cost of capital,
taxes, insurance, and damage allowances - should not include costs for assets, labour, or building unless major
reductions in inventory are anticipated)
SAP Enablers
• Better forecasting and planning tools minimize need to maintain WIP as a buffer against unknown
demand • Improved visibility of inventory with on-line system
• Improved accuracy of inventory information
Improve Margins (0-5%, 2%)
Calculation• Identify sales by product line
• Determine margin by product line
• Estimate improvement percentage
• Apply improvement to total sales volume
SAP Enablers
• Profitability analysis helps target product mixes for greater profitability
• Product costing helps target changes in production and pricing strategy
PM Module
Increase Asset Utilization - Reduce Production Asset Downtime (0-10%, 5%)
Calculation
• Identify daily sales volume
• Determine margin on daily sales
• Determine fixed cost per day • Determine production downtime for planned and unplanned maintenance
• Estimate portion of downtime to be eliminated
• Benefit is margin and fixed costs previously lost during downtime
SAP Enablers
• Integration with other modules reduces cycle time for maintenance orders • On-line system with analysis tools helps drive down unplanned maintenance
• Better problem tracking and preventative maintenance forecasting
Reduce Maintenance Requirements (0-10%, 4%)
Calculation
• Estimate total cost of plant maintenance - usually captured in a cost center • Estimate reduction in maintenance due to improved preventative maintenance
SAP Enablers
• Preventative maintenance capability • Maintenance history reporting and analysis
Other Benefit Areas
9
MSS SAP BEST PRACTICE
Existing Systems Infrastructure
Eliminate Mainframe and Other Equipment (100%)
• Identify hardware to be eliminated
• Estimate salvage value (or lease cost) of hardware
Eliminate Maintenance Contracts For Current Hardware and Software to be
Eliminated
(100%)
• Identify hardware and software to be eliminated
• Identify maintenance contracts on hardware/software to be eliminated
Reduce IT staff required to support current hardware and software (0-100%, 75%)
• Identify total FTE’s supporting existing hardware and software
• Allocate FTE’s to current hardware maintenance, software systems and overhead processes • Determine FTE’s allocated to maintenance of hardware and software to be eliminated
Year 2000 Cost Avoidance
• By now, this is probably no longer a viable savings area. However, the IT
department has probably estimated the cost of year 2000 problem.
Other
Project Avoidance (100%)
• Identify planned projects to develop point solutions (i.e. Plant Maintenance package) that will no
longer be required when SAP is installed
• Determine planned budget for all planned projects
Manpower Reductions (0-20%, 10%)
• Identify processes performed in all departments impacted by SAP implementation• Identify characteristics of each process identified above (i.e. frequent rework, excessive downtime, missing
information)
• Identify key ways that SAP will change each of the processes identified• Estimate the percent change in manpower effort required for each process
• Determine net change in manpower by department and by position
• Determine where opportunities exist to reduce manpower• Multiply reductions by manpower cost loaded with benefits only.


