Sarcomere length and joint kinematics during torque production in frog hindlimb RICHARD L. LIEBER AND JENNETTE L. BOAKES Division of Orthopedics and Rehabilitation, Department of Surgery, Veterans Administration Medical Center and University of California, San Diego, California 92161 LIEBER,RICHARD L., ANDJENNETTE L. BoAKEs.&zw~~~~~ length and joint kinematics during torque production in frog hindlimb. Am. J. Physiol. 254 (Cell Physiol. 23): C759-C768, 1988.-The relationship between semitendinosus muscle force and knee joint kinematics during isometric torque production was examined in the frog (Rana pipiens) hindlimb. Passive muscle sarcomere length was monitored by laser diffraction during knee rotation, and joint center of rotation was deter- mined later using principles of rigid body kinematics. Contract- ile force at the distal tibia, resulting from semitendinosus contraction, was also measured, and, using the kinematic data, a torque vs. joint angle curve constructed. Muscle sarcomere length varied from 3.6 pm at full knee extension to 2.0 ,urn at full knee flexion. Effective lever arm varied almost as a sine function, with optimal lever arm at 90” of flexion. Joint torque increased linearly from 0 to 140” of flexion and then sharply decreased to 160” of flexion. Thus the optimal joint angle occurred at an angle (140”) that was neither the angle at which muscle force was maximum (160”) nor the angle at which the effective lever arm was maximum (9OO). These data indicate that knee torque production in the frog results from the inter- action between muscular and joint properties and not either property alone, number of studies have related muscle sarcomere length to joint position in animals. The classic sarcomere length-tension relationship (10) stated that tetanic force generation in the isolated frog muscle fiber was a direct function of the amount of overlap between myosin and actin filaments. At sarcomere lengths from 2.2-3.6 pm (“descending limb” of the length-tension curve, Fig. l), force varied linearly with length caused by altered fila- ment overlap. At intermediate sarcomere lengths (2.0- 2.2 pm, “plateau region” of the length-tension curve, Fig. 1), force did not change with length caused by the absence of myosin cross bridges in the central region of the myosin filament. At short lengths (1.3-2.0 pm, “ascend- ing limb” of the length-tension curve, Fig. 1), force decreased caused from physical blockage of cross-bridge formation by the filaments themselves. Thus sarcomere length in the frog muscle fiber was directly related to muscle force production and served as a precise indicator of the relative force that a muscle generated at a given length. Interestingly, the majority of animal experiments in which sarcomere length and joint angle have been related joint torque; knee joint; semitendinosus muscle; laser diffrac- tion; Rana pipiens were performed on jaw muscles (13,27). In these studies, jaw musculoskeletal contractile properties were meas- ured and then jaw muscles chemically fixed at different degrees of gape. Investigators concluded that maximum JOINT TORQUE PRODUCTION is a normal part ofvolun- biting force occurred near the extreme of their ROM (at tary movement. It is well known that torque varies throughout the normal range of motion (ROM). Inves- large gape, 27) at which the sarcomere length was ~2.5 pm, on the presumed ascending limb of the mammalian tigators speculate, based on the anatomy of the muscu- length-tension curve (27). This differs from similar stud- loskeletal system, that joint torque variation represents ies on mammalian limb muscles in which the cat soleus the interaction between intrinsic skeletal muscle prop- and gastrocnemius muscles generated maximum tension erties (i.e., the length-tension relationship; 3,10) and the in the middle of their ROM with the ankle at a tibiotarsal moment arms about which the muscles act (i.e., the joint angle of 30-60” (30, 37) and rabbit hindlimb muscles kinematics). At the “optimal joint angle” (OJA, the angle operated over the plateau region of the mammalian length-tension curve, near a sarcomere length of 2.5 pm (6) . at which torqu ,e is maximum), muscle force is often assumed to be max imum. However, th .e literature is controversial on this issue. Some studies have concluded Investigators thus differ as to whether normal torque that the joint angle at which muscle force is maximum variation is caused by changing muscle moment arm, is actually outside the normal range of motion (1, 12,25, changing muscle force, or both. In addition, it is not clear 35), whereas others concluded that the OJA and the whether, in vivo, muscle normally functions at or near angle at which muscle force is maximum nearly coincided (17, 18). Additionally, investigators differ as to whether its optimal sarcomere length interpret sarcomere lengths ,. It may not measured in be .m possible .ammals to in joint torque is determined primarily by joint kinematics terms of contractile force, because there is no established (18, 35), muscle properties (11), or a combination of the sarcomere length-tension relationship available for two. mammalian muscle. Additionally, previous sarcomere To predict muscle force based on muscle structure, a length measurements were performed on chemically 0363-6143/M $1.50 Copyright 0 1988 the American Physiological Society c759
Transcript
Sarcomere length and joint kinematics during torque production in frog hindlimb
RICHARD L. LIEBER AND JENNETTE L. BOAKES Division of Orthopedics and Rehabilitation, Department of Surgery, Veterans Administration Medical Center and University of California, San Diego, California 92161
LIEBER,RICHARD L., ANDJENNETTE L. BoAKEs.&zw~~~~~ length and joint kinematics during torque production in frog hindlimb. Am. J. Physiol. 254 (Cell Physiol. 23): C759-C768, 1988.-The relationship between semitendinosus muscle force and knee joint kinematics during isometric torque production was examined in the frog (Rana pipiens) hindlimb. Passive muscle sarcomere length was monitored by laser diffraction during knee rotation, and joint center of rotation was deter- mined later using principles of rigid body kinematics. Contract- ile force at the distal tibia, resulting from semitendinosus contraction, was also measured, and, using the kinematic data, a torque vs. joint angle curve constructed. Muscle sarcomere length varied from 3.6 pm at full knee extension to 2.0 ,urn at full knee flexion. Effective lever arm varied almost as a sine function, with optimal lever arm at 90” of flexion. Joint torque increased linearly from 0 to 140” of flexion and then sharply decreased to 160” of flexion. Thus the optimal joint angle occurred at an angle (140”) that was neither the angle at which muscle force was maximum (160”) nor the angle at which the effective lever arm was maximum (9OO). These data indicate that knee torque production in the frog results from the inter- action between muscular and joint properties and not either property alone,
number of studies have related muscle sarcomere length to joint position in animals. The classic sarcomere length-tension relationship (10) stated that tetanic force generation in the isolated frog muscle fiber was a direct function of the amount of overlap between myosin and actin filaments. At sarcomere lengths from 2.2-3.6 pm (“descending limb” of the length-tension curve, Fig. l), force varied linearly with length caused by altered fila- ment overlap. At intermediate sarcomere lengths (2.0- 2.2 pm, “plateau region” of the length-tension curve, Fig. 1), force did not change with length caused by the absence of myosin cross bridges in the central region of the myosin filament. At short lengths (1.3-2.0 pm, “ascend- ing limb” of the length-tension curve, Fig. 1), force decreased caused from physical blockage of cross-bridge formation by the filaments themselves. Thus sarcomere length in the frog muscle fiber was directly related to muscle force production and served as a precise indicator of the relative force that a muscle generated at a given length.
Interestingly, the majority of animal experiments in which sarcomere length and joint angle have been related
were performed on jaw muscles (13,27). In these studies, jaw musculoskeletal contractile properties were meas- ured and then jaw muscles chemically fixed at different degrees of gape. Investigators concluded that maximum
JOINT TORQUE PRODUCTION is a normal part ofvolun- biting force occurred near the extreme of their ROM (at tary movement. It is well known that torque varies throughout the normal range of motion (ROM). Inves-
large gape, 27) at which the sarcomere length was ~2.5 pm, on the presumed ascending limb of the mammalian
tigators speculate, based on the anatomy of the muscu- length-tension curve (27). This differs from similar stud- loskeletal system, that joint torque variation represents ies on mammalian limb muscles in which the cat soleus the interaction between intrinsic skeletal muscle prop- and gastrocnemius muscles generated maximum tension erties (i.e., the length-tension relationship; 3,10) and the in the middle of their ROM with the ankle at a tibiotarsal moment arms about which the muscles act (i.e., the joint angle of 30-60” (30, 37) and rabbit hindlimb muscles kinematics). At the “optimal joint angle” (OJA, the angle operated over the plateau region of the mammalian
length-tension curve, near a sarcomere length of 2.5 pm (6) .
at which torqu ,e is maximum), muscle force is often assumed to be max imum. However, th .e literature is controversial on this issue. Some studies have concluded Investigators thus differ as to whether normal torque that the joint angle at which muscle force is maximum variation is caused by changing muscle moment arm, is actually outside the normal range of motion (1, 12,25, changing muscle force, or both. In addition, it is not clear 35), whereas others concluded that the OJA and the whether, in vivo, muscle normally functions at or near angle at which muscle force is maximum nearly coincided (17, 18). Additionally, investigators differ as to whether
its optimal sarcomere length interpret sarcomere lengths
,. It may not measured in
be .m
possible .ammals
to in
joint torque is determined primarily by joint kinematics terms of contractile force, because there is no established (18, 35), muscle properties (11), or a combination of the sarcomere length-tension relationship available for two. mammalian muscle. Additionally, previous sarcomere
To predict muscle force based on muscle structure, a length measurements were performed on chemically 0363-6143/M $1.50 Copyright 0 1988 the American Physiological Society c759
TORQUE GENERATION IN FROG HINDLIMB
Plateau .
Sarcomere Length ( pm)
fixed tissue, not on living muscle during in situ joint movement. Thus the objective of this study was to meas- ure sarcomere length, knee joint kinematics, and knee joint torque in the frog semitendinosus muscle-knee com- plex in situ. This is the same muscle from which the classic sarcomere length-tension relationship was ob- tained (lo), enabling direct prediction of force based on sarcomere length measurement. The objective was to elucidate the underlying mechanism of isometric flexor torque generation in the frog knee.
METHODS
Sarcomere length measurements. The dorsal head of the semitendinosus muscle from the grassfrog (Rana pipiens) was chosen because of its well-established sar- comere length-tension relationship (10) and longitudinal fiber architecture. The semitendinosus is a biarticular muscle, functioning primarily in the frontal plane as both a hip extensor and a knee flexor. Frogs were killed by double pithing. Average muscle sarcomere length was determined using the technique of laser-light diffraction (21, 33, 39). Sarcomere length was calculated by meas- uring the spacing between the two first-order diffraction lines that were imaged onto a photodiode array (22). Diffraction order spacing was converted to diffraction angle using appropriate calibration factors and sarco- mere length calculated from the plane grating equation, nX = &sin& where n is diffraction order (tl, t2 . l l ), X is laser wavelength (0.6328 pm for the helium-neon laser), 0 is diffraction angle, and d is sarcomere length. Resolution of the system was -5 nm, but because of peak width and peak asymmetry, practical accuracy was lim- ited to ~20 nm, which was similar to that reported by Paolini and Roos (29) for whole frog muscle.
Muscle fiber architecture. Muscle fiber architecture was determined according to a modification of the methods
of Sacks and Roy (34). Briefly, muscles were fixed in 10% buffered Formalin (formaldehyde solution) for 24- 72 h, rinsed in 0.4 M phosphate buffer at pH of 7.2, and placed in 15% HzS04 for 24 h. Muscle length was meas- ured with dial calipers as the distance from the origin of the most proximal muscle fibers to the insertion of the most distal fibers. Bundles consisting of lo-15 muscle fibers were then dissected from the muscle for bundle length measurement. It was determined, by dissection of single fibers, that the length of these small bundles was not significantly different from the length of the com- posite individual fibers. Pinnation angle, as measured using a dissecting microscope and goniometer, was not measurably different from 0”.
Sarcomere length along muscle length. To determine whether sarcomere length measurements at points on the muscle midportion were representative of the average sarcomere length along the entire muscle, the sarcomere length distribution along the length of 10 muscles that had been excised, was determined. The tendons of iso- lated semitendinosus muscles were fixed to glass slides using cyanoacrylate glue. Slides were then placed on the stage of the diffractometer, and sarcomere length was measured at l-mm increments along the muscle with 0 mm defined as the origin of the most proximal muscle fibers. It was impossible to obtain diffraction patterns from the proximal and distal 2-3 mm of the whole muscle caused by light scattering by the tendons. This resulted in a diffractable muscle length of ~15 mm in the mid- portion of the muscle (70% of the total muscle length). As a result, the shorter sarcomeres, which are known to occur at the extreme ends of the muscle fibers (16), were not measured in this study.
Sarcomere length us. joint angle. In 10 animals, im- mediately after death, the thighs were exposed bilater- ally, and all of the thigh musculature and skin were
TORQUE GENERATION IN FROG HINDLIMB C761
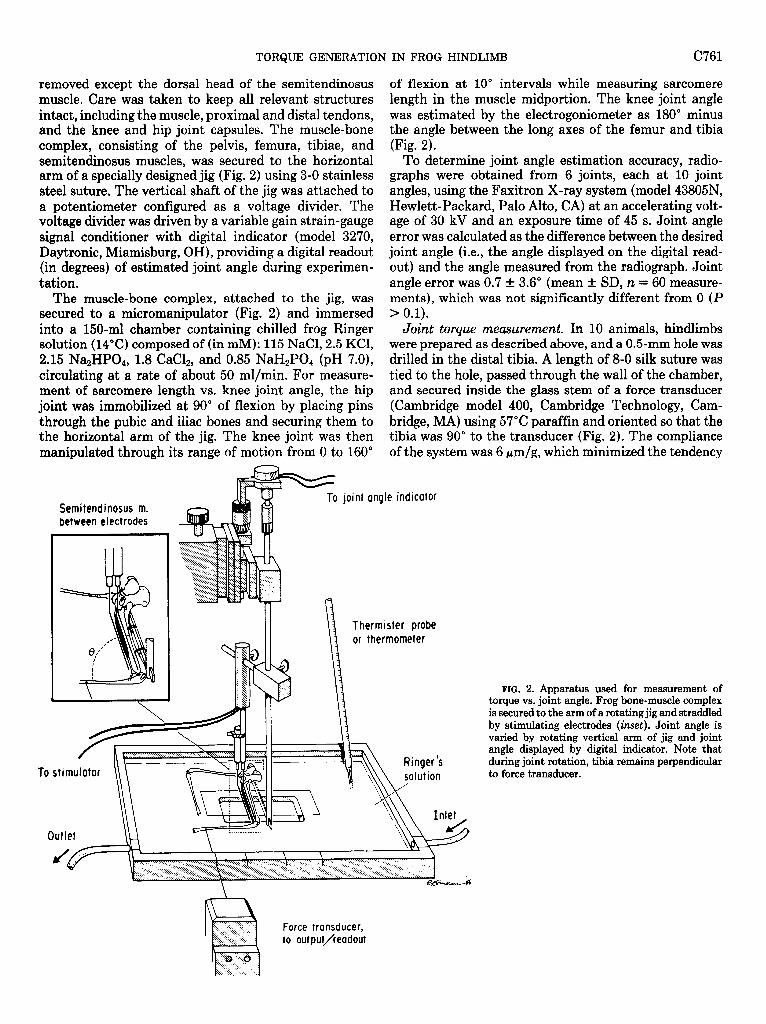
removed except the dorsal head of the semitendinosus muscle. Care was taken to keep all relevant structures intact, including the muscle, proximal and distal tendons, and the knee and hip joint capsules. The muscle-bone complex, consisting of the pelvis, femura, tibiae, and semitendinosus muscles, was secured to the horizontal arm of a specially designed jig (Fig. 2) using 3-O stainless steel suture. The vertical shaft of the jig was attached to a potentiometer configured as a voltage divider. The voltage divider was driven by a variable gain strain-gauge signal conditioner with digital indicator (model 3270, Daytronic, Miamisburg, OH), providing a digital readout (in degrees) of estimated joint angle during experimen- tation.
The muscle-bone complex, attached to the jig, was secured to a micromanipulator (Fig. 2) and immersed into a 150.ml chamber containing chilled frog Ringer solution (14°C) composed of (in mM): 115 NaCl, 2.5 KCl, 2.15 Na2HP04, 1.8 CaC12, and 0.85 NaH2P04 (pH 7.0), circulating at a rate of about 50 ml/min. For measure- ment of sarcomere length vs. knee joint angle, the hip joint was immobilized at 90” of flexion by placing pins through the pubic and iliac bones and securing them to the horizontal arm of the jig. The knee joint was then manipulated through its range of motion from 0 to 160”
Semi tendinosus m. between electrodes
To sti
of flexion at 10” intervals while measuring sarcomere length in the muscle midportion. The knee joint angle was estimated by the electrogoniometer as 180” minus the angle between the long axes of the femur and tibia (Fig. 2).
To determine joint angle estimation accuracy, radio- graphs were obtained from 6 joints, each at 10 joint angles, using the Faxitron X-ray system (model 43805N, Hewlett-Packard, Palo Alto, CA) at an accelerating volt- age of 30 kV and an exposure time of 45 s. Joint angle error was calculated as the difference between the desired joint angle (i.e., the angle displayed on the digital read- out) and the angle measured from the radiograph. Joint angle error was 0.7 t 3.6’ (mean t SD, n = 60 measure- ments), which was not significantly different from 0 (P > 0.1).
Joint torque measurement. In 10 animals, hindlimbs were prepared as described above, and a 0.5-mm hole was drilled in the distal tibia. A length of 8-O silk suture was tied to the hole, passed through the wall of the chamber, and secured inside the glass stem of a force transducer (Cambridge model 400, Cambridge Technology, Cam- bridge, MA) using 57°C paraffin and oriented so that the tibia was 90” to the transducer (Fig. 2). The compliance of the system was 6 pm/g, which minimized the tendency
To joint angle indicator
Thermister probe or thermometer
Force transducer, to out put/readout
FIG. 2. Apparatus used for measurement of torque vs. joint angle. Frog bone-muscle complex is secured to the arm of a rotating jig and straddled by stimulating electrodes (inset). Joint angle is varied by rotating vertical arm of jig and joint angle displayed by digital indicator. Note that during joint rotation, tibia remains perpendicular to force transducer.
C762 TORQUE GENERATION IN FROG HINDLIMB
for the tibia to internally rotate during muscle contrac- tion. (This tendency resulted from the medial insertion of the semitendinosus tendon and the pronounced knee laxity that occurred after removal of most of the thigh musculature. Therefore, during muscle stimulation, sem- itendinosus contraction tended to rotate the tibia on its long axis, stressing the 8-O suture.) Transducer sensitiv- ity was 2 V/g, resolution was 100 pg, and there was negligible drift over the experimental period (-4 h). Tetanic torque was determined by stimulating the sem- itendinosus using bipolar electrodes placed along the muscle length. Stimulation field strength was -50 V/cm, pulse duration 3 ms, frequency 60 Hz, and train duration 300 ms. Stimulation and data acquisition were synchro- nized by the data acquisition system described by Lieber et al. (23). The force generated at the distal tibia was recorded at 10” increments over the range O-160” of knee flexion. Every fifth measurement was made at 90” to determine whether a correction for muscle fatigue was necessary. This testing protocol resulted in no significant difference between successive 90” torque readings over the entire 4-h testing period (mean difference between successive 90” readings = 0.01 & 0.09 g-cm, P > 0.4). In addition, linear regression yielded no significant relation- ship between torque readings obtained at 90” and time (P >’ 0.8). As a result, no correction for muscle fatigue was employed.
Measurement of maximum tetanic tension. After torque measurements, the semitendinosus origin and insertion tendons were cut free from the pelvis and tibia, respec- tively, and secured with 4-O silk suture. One suture was attached to a force transducer (Entran model ELF-T500- 2, Entran Devices, Fairfield, NJ) driven by a strain- gauge conditioner (Daytronic model 3270, Daytronic), and the other tendon was secured to a micromanipulator. The muscle was stimulated in 0.5-mm increments in length through use of the above parameters. This pro- vided a muscle length-tension curve from which maxi- mum tetanic tension (PO) and optimal muscle length (L,) were obtained. The muscles were then dissected free of the.bones, muscle mass was determined, and the tibiae and femura were stored with the joint capsule intact at -10°C for future measurement of joint kinematics.
Normalized maximum tension was calculated using
F (kg/cm*) maximum tension (kg)/
= mass (g)/density (g/cm”) *fiber length (cm)
where F is normalized maximum tension and muscle density is 1.056 g/cm3 (26).
Joint kinematics measurements. Joint center of rota- tion was determined on the same 10 specimens from which contractile data were obtained. The method used was based on the technique of Reuleaux (31) with the added theoretical and experimental error reducing meth- ods of Panjabi et al. (28). First, a distal tibia1 marker point was created by drilling into the end of a distal tibia with a 1.6 mm Kirschner wire and creating a “rigid body extension” along the length of the tibia. This increased the distance from the marker point to the estimated center of rotation (i.e., the magnitude of r; 28) from 50
mm to about 75 mm. An additional marker point was created perpendicular to the long axis of the tibia, which increased the marker angle (8; Ref. 28) to -90”. In this way, center of rotation errors caused by small inaccura- cies in locating marker points were minimized (28). Fi- nally, a marker point was placed at the location of the semitendinosus muscle insertion. The bones with mark- ers (Fig. 3A) were then placed on the stage of a camera stand and rotated from 0 to 160” of flexion in 10” increments. At each angle, an exposure was taken on a single 35-mm negative (shutter speed l/15 s, f8) that
FIG. 3. Experimental methods for measurement of center of rota- tion. A: markers are placed (4 from top to bottom) on insertion point of semitendinosus, on a rigid extension perpendicular to tibia, increas- ing marker angle, 0, to -9O”, and on a rigid extension of distal tibia. Calibration bar = 1 cm. B: a series of exposures are taken on a single negative over the range O-160” in 10’ increments. Calibration bar = 1 cm. C: marker points are digitized and a graphic representation of center of rotation (0) and point of muscle origin (+) is obtained.
TORQUE GENERATION IN FROG HINDLIMB C763
yielded a multiply exposed image of the entire rotation sequence (Fig. 3B). For each joint, two such negatives were obtained. Prints (16 x 20 in.) were enlarged from each negative and the marker points digitized three times per print to reduce the effects of small positional fluc- tuations. The center of rotation was calculated by the Resuleaux method (31) and the semitendinosus muscle moment arm calculated as the perpendicular distance from the semitendinosus insertion point to the calculated center of rotation. Effective moment arm was calculated as the moment arm multiplied by the sine of the joint angle. After digitization, a graphic representation of the joint kinematics was generated by the computer (Fig. 30
To view detailed knee joint geometry, knee joints were fixed in 10% Formalin for 24 h, decalcified in 30% formic acid for 8 h, dehydrated in graded alcohols, and embedded in paraffin. The blocks were sectioned into 6-pm thick specimens on a Riechert rotary microtome (model 820 Histostat, Riechert Scientific Instruments, Buffalo, NY)
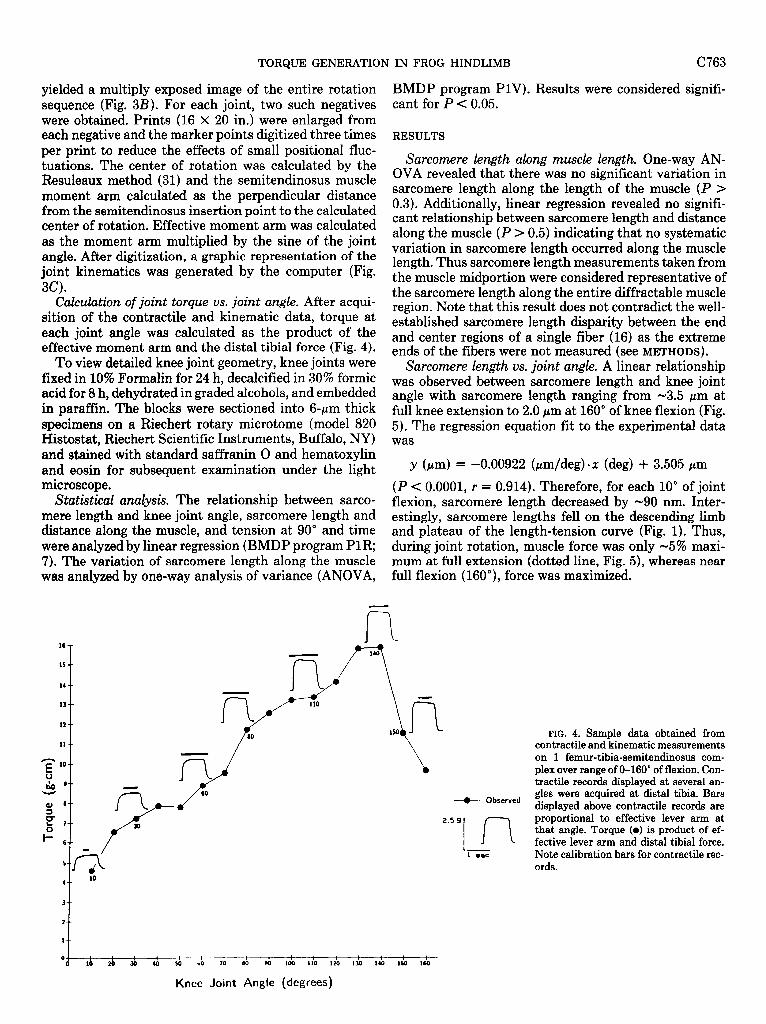
CAxdation of joint torque vs. joint angle. After acqui- sition of the contractile and kinematic data, torque at each joint angle was calculated as the product of the effective moment arm and the distal tibia1 force (Fig. 4).
BMDP program PlV). Results were considered signifi- cant for P < 0.05.
RESULTS
Sarcomere length along muscle length. One-way AN- OVA revealed that there was no significant variation in sarcomere length along the length of the muscle (P >
Sarcomere length vs. joint angle. A linear relationship
0.3). Additionally, linear regression revealed no signifi-
was observed between sarcomere length and knee joint
cant relationship between sarcomere length and distance along the muscle (P > 0.5) indicating that no systematic variation in sarcomere length occurred along the muscle
angle with sarcomere length ranging from -3.5 pm at
length. Thus sarcomere length measurements taken from the muscle midportion were considered representative of
full knee extension to 2.0 pm at 160” of knee flexion (Fig.
the sarcomere length along the entire diffractable muscle
5). The regression equation fit to the experimental data
region. Note that this result does not contradict the well-
was
established sarcomere length disparity between the end and center regions of a single fiber (16) as the extreme ends of the fibers were not measured (see METHODS).
and stained with standard saffranin 0 and hematoxylin and eosin for subsequent examination under the light Y (Pm) = -0.00922 (pm/deg) l x (deg) + 3.505 pm microscope. (P < 0.0001, r = 0.914). Therefore, for each 10" of joint
Statistical analysis. The relationship between sarco- flexion, sarcomere length decreased by -90 nm. Inter- mere length and knee joint angle, sarcomere length and estingly, sarcomere lengths fell on the descending limb distance along the muscle, and tension at 90” and time and plateau of the length-tension curve (Fig. 1). Thus, were analyzed by linear regression (BMDP program PlR; during joint rotation, muscle force was only -5% maxi- 7). The variation of sarcomere length along the muscle mum at full extension (dotted line, Fig. 5), whereas near was analyzed by one-way analysis of variance (ANOVA, full flexion (160”), force was maximized.
16
15
13
n
FIG. 4. Sample data obtained from contractile and kinematic measurements on 1 femur-tibia-semitendinosus com- plex over range of O-160” of flexion. Con- tractile records displayed at several an-
+ Observed gles were acquired at distal tibia. Bars displayed above contractile records are
2.5 9
In proportional to effective lever arm at that angle. Torque (0) is product of ef- fective lever arm and distal tibia1 force.
1 eoc Note calibration bars for contractile rec- ords.
FIG. 5. Sarcomere length (left axis in pm) vs. knee joint angle. Symbols and solid line: mean values * SE from 10 muscles. All sarcomere lengths are on descending limb and plateau of length-tension curve (compare Fig. 1). Dotted line and right axis: relative muscle force corresponding to measured sarcomere length. Note that muscle force varies linearly throughout joint range of motion.
Frog semitendinosus properties. Normalized tension measured at the conclusion of the experiment (1.4 kg/ cm2, Table 1) was in the normal range for frog semiten- dinosus muscle at 14°C (2), indicating no muscle deteri- oration. The bundle length-to-muscle length ratio was 0.70 (Table l), which is in good agreement with reported values for the semitendinosus muscles of cats (34), hu- mans (38), mice, rats, guinea pigs, and rabbits (32). Architecturally, therefore, the frog semitendinosus is similar to the mammalian semitendinosus.
Knee joint kinematics. A typical photographical record and associated computer analysis of joint kinematics are shown in Figs. 3, B and C, respectively. For simplifica- tion, only one set of rotation marker points are plotted. The center of rotation (Fig. 3C, l ) remained relatively constant and the insertion of the semitendinosus (Fig. 3C, +) traversed a relatively smooth arc. The muscle moment arm (i.e., the perpendicular distance between the center of rotation and muscle insertion) remained
TABLE 1. Frog semitendinosus muscle properties
Muscle Property Value Measured
Maximum tetanic tension, g 27.4k5.8 Wet muscle mass, mg 33.5t6.2 Muscle length, mm 22.6k1.5
Bundle length/muscle length 0.703t0.083 Normalized maximum tension, kg/cm2 1.38kO.14
Values are means t SD for 10 experiments. Contractile properties measured at 14°C.
relatively constant throughout the entire joint range of motion, varying from a minimum of 0.37 cm to a maxi- mum of 0.44 cm (Fig. 6A). Two local maxima were observed at 30 and 100” and a minimum at 60” of flexion. Despite these small variations, the joint behaved very much like an ideal hinge joint (Fig. 6C). Effective lever arm vs. joint angle was well approximated by a sine curve using the equation y (cm) = 0.41 (cm). sin (x) (r = 0.98, P < 0.0001). Light micrographs of the frog knee joint (Fig. 6B) revealed knee morphology that was simpler than the human knee. The “tibia1 plateau” was actually well approximated by an ellipse, and the femoral head did not demonstrate the dramatic posteriorly facing con- dyles observed in humans. In spite of attempts to fix and section frog knee joints at a number of different angles, the underlying structural basis for the small systematic moment arm variations was not clearly demonstrated.
Experimental torque measurements. For each muscle studied, the measured tibia1 forces and measured moment arms were combined to yield the relationship between torque and joint angle. At full knee extension, the force measured at the distal tibia was relatively small and the time required to reach peak tetanic tension was long, indicating high muscular passive tension (see tension record, lo”, Fig. 4). As the knee joint was flexed, tibia1 force increased and the time required to reach peak tetanic tension decreased. (Near full flexion, the muscle was in a slack position.) Maximum effective lever arm occurred at 90” and decreased as a sine function at larger
TORQUE GENERATION IN FROG HINDLIMB C765
FIG. 6. Kinematics of frog knee. A: semitendinosus muscle moment arm vs. joint angle (mean f SE, n = 9). Note minor peaks at 30 and 100” and minor valley at 60”. B: photomicrograph of frog knee. Relatively simple geometry of tibia1 (T) and femoral (F) joint surfaces support kinematic data obtained although detailed structural basis for peaks and valleys was not apparent. Calibration bar = 500 pm. C: curve fit of raw effective lever arm data to a simple sine function. Best fit equation: y (cm) = 0.41 (cm). sin (x). Correlation coefficient = 0.98. P < 0.0001.
and smaller angles (see bars above contractile records, Fig. 4; Fig. 6C). The summarized torque data for all animals (Fig. 7) demonstrated a linearly increasing torque from 0 to 140” and a sharp drop in torque from 140 to 160”. The small torque inflection at 60” corre- sponded to the small decrease in the muscle moment arm curve (Fig. 6). Inspection of contractile, kinematic, and torque data demonstrated that maximum torque oc- curred at an angle (140”, Fig. 7) that was neither the angle at which the moment arm was maximum (go”, Fig. 6) nor the angle at which muscle force was maximum (160”, Fig. 5).
DISCUSSION
The interaction between intrinsic muscle properties and joint kinematics that occurs during torque produc- tion is poorly understood, despite the detailed studies of whole muscle (14), isolated muscle fibers (15), and the kinematics of a number of joint systems (5, 24, 36).
Investigators differ as to whether joint torque variation results primarily from joint kinematics, intrinsic muscle properties, or both. For example, Marsh et al. (25) and Sale et al. (35) measured human ankle dorsiflexion and plantarflexion torque, respectively, as a function of ankle angle. They concluded, based on torque and radiographic measurements, that the OJA did not coincide with the resting joint angle (i.e., the angle assumed with no exter- nal forces imposed on the ankle) and that the angle at which muscle force was maximum was actually outside the normal ROM (35). They also concluded that the location of the OJA was more a function of ankle kine- matics than intrinsic muscle properties (35). Similar conclusions were reached by Hasan and Enoka (12) who studied elbow flexion at submaximal activation levels and Andriacchi et al. (1) who studied knee flexion.
In contrast, in a study of the human biceps brachii, Ismail and Ranatunga (17) measured elbow joint torque and kinematics and concluded that the OJA and the
C766 TORQUE GENERATION IN FROG HINDLIMB
Summarized Data
Knee Angle (degrees)
Knapik et al. (18) measured knee extension torque,
f i 1
ii
and, using the kinematic data of Smidt (36), concluded that the location of the OJA was determined primarily by knee kinematics. They postulated that the torque increase observed from 90 to 60” of knee flexion was caused by increasing lever arm (with muscle force re- maining relatively constant), and the torque decrease observed from 60 to 30” of flexion was caused by decreas- ing muscle force (with lever arm remaining relatively constant). Haffajee et al. (11) also measured knee joint torque while subjects were allowed to view their average electromyogram to maintain a constant muscle activa- tion level. In addition, they measured knee kinematics from plane radiographs. Because joint torque decreased by 50% from 50 to 90” of flexion and, in the same interval, quadriceps lever arm decreased by only 25%, they con- cluded that muscle length variations were of great im-
1 1 120
1 140
1 I 160
FIG. 7. Summarized torque data from 10 frogs. Data shown are mean * SE for all animals. Note that torque increases relatively linearly from 0 to 140" and drops off sharply from 140 to 16OO. Note also small inflection point at 60” corresponding to valley in muscle moment arm curve (compare Fig. 6A ).
angle at which muscle force was maximum (determined indirectly by calculation) very nearly coincided. How- ever, because the OJA of the isolated biceps brachii (measured during electrical stimulation) did not coincide with the OJA of the combined elbow flexors (measured during maximum voluntary contraction), they hypothe- sized that at least one elbow flexor group had length- tension properties that were substantially different from the biceps.
portance in determining torque magnitude. The data obtained in the present study document the
interaction between muscle properties and joint kine- matics for the frog knee flexor. The general curvilinear shape of the torque curve obtained (Fig. 7) is similar to curves obtained from human studies (12, 17, 25, 37). In the present study, optimal knee joint angle occurred at 140” of flexion. At this angle, muscle sarcomere length was -2.7 pm, corresponding to a muscle force of only 80% maximum. The sarcomere length that produced the greatest tension (2.0 pm) occurred at 160” of flexion, corresponding to a muscle force of 100% maximum, However, because the joint kinematics were not favorable at this angle (only 70% maximum moment arm), the resultant torque at 160” was only 75% of the torque at 140*. Thus, in the musculoskeletal system presented here, torque production resulted from the interaction
FIG. 8. Schematic relationship between rela- tive muscle force (curue F), relative effective lever arm (curue R) and relative joint torque (curue R x F) as a function of knee joint angle. Note that throughout range of motion, muscle force and effective lever arm interact to produce torque. Note that maximum muscle force (+ on curue F) and maximum effective lever arm (+ on curue R) do not coincide with optimal joint angle (+ on curve R x F).
Knee Joint Angle (degrees)
TORQUE GENERATION IN FROG HINDLIMB C767
between intrinsic muscle properties and joint kinematics (see schematic Fig. 8), not either property alone.
In the frog semitendinosus-knee system, sarcomere length linearly decreased, and thus, muscle force linearly increased during flexion throughout the ROM (Fig. 8, curue 3’). Thus, muscle force modulation during joint rotation was a physiological property of the torque-gen- erating system. As muscle force linearly increased, mus- cle moment arm varied approximately as a sine function (Fig. 8, curue R). Maximum mechanical advantage thus occurred at 90” of flexion. However, at this angle, muscle force was only -40% of maximum, so that the overall torque generated at the kinematic optimum (90”) was less than maximum torque. At the point where muscle force was maximum (1600), the kinematics were not sufficiently favorable to produce large torque. It follows from this argument that torque generation throughout the ROM (Fig. 8, curue R X F) resulted from the inter- action of both muscle and joint properties and did not simply reflect either property alone.
The fact that the angle at which muscle force in maximum does not necessarily occur at the optimal joint angle has significant implications in orthopedic surgery and rehabilitation. For example, it has been suggested that muscle strengthening is related to the amount of physical stress imposed on a muscle during exercise (8) or electrical stimulation (19). In the prevention of disuse atrophy, for example, functional electrical stimulation therapy is normally applied at the optimal joint angle. However, based on the results of this study, it may be preferable to apply functional electrical stimulation at the joint angle at which muscle force is maximum, rather than the optimal joint angle, for maximum strengthen- ing.
A second consequence of this study relates to the practice of the tendon transfer operation. This study demonstrated that the length-tension relationship rep- resented a physiological property of the torque-generat- ing system, not simply a functional consequence of mus- cle ultrastructure. If muscles are to be reattached at other than their normal length, then the nature of the torque-generation curve will be significantly altered. As similar data become available from mammalian systems, they may ultimately be used by the surgeon performing tendon transfer operations to determine appropriate do- nor muscles as well as optimal reattachment sites (4, 9, 20) .
We thank Profs. D. H. Sutherland and R. M. Braun for their many helpful suggestions offered during the course of this work and Eric Reindel, Jim Cernilia, and Thalia McKee-Woodburn for their excellent technical assistance in the kinematics experiments.
This work was supported by the Veterans Administration Rehabil- itation Research and Development program and National Institutes of Health Grants AM-25501 and AM-266344 (to Prof. Alan R. Hargens) and AR-35192 (to R. L. Lieber).
This project was completed in partial fulfillment of the requirements for graduation at the UCSD School of Medicine (for J. L. Boakes).
Received 16 July 1987; accepted in final form 13 January 1988.
REFERENCES
1. ANDRIACCHI, T. P., G. B. J. ANDERSSON, R. ORTENGREN, AND R. P. MIKOSZ. A study of factors influencing muscle activity about
2.
3.
4.
5.
6.
7.
8.
9.
10.
11.
12.
13.
14.
15.
16.
17.
18.
19.
20.
21.
22.
23.
24.
25.
26.
27.
the knee joint. J. Orthop. Res. 1: 266-275, 1984. BENNETT, A. F. Thermal dependence of muscle function. Am. J. Physiol. 247 (Regulatory Integrative Comp. Physiol. 16): R217- R229,19&4. BLIX, M. Die Lange und Die Spannung des Muskels. Slzand. Arch. PhysioZ. 5: 150-172, 173-206, 1895. BRAND, P. W., R. B. BEACH, AND D. E. THOMPSON. Relative tension and potential excursion of muscles in the forearm and hand. J. Hand Surg. 6: 209-219,19&l. CHAO, E. Y., AND B. F. MORREY. Three dimensional rotation of the elbow. J. Biomechan. 11: 57-73, 1978. DIMERY, N. J. Muscle and sarcomere lengths in the hind limb of the rabbit (Oryctolagus cuniculus) during a galloping stride. J. Zool. Lmzd. 205:373-3&3,19&5. DIXON, W. J. BMDP Statistical Software. Berkeley: Univ. of Cali- fornia Press, 1983.
EDGERTON, V. R. Neuromuscular adaptation to power and endur- ance work. Can. J. Appl. Sport Sci. 1: 49-58,1976.
FLEETER, T. B., J. P. ADAMS, B. BRENNER, AND R. J. PODOLSKY. A laser diffraction method for measuring muscle sarcomere length in vivo for application to tendon transfers. J. Hand Surg. 10: 542- 546,1985. GORDON, A. M., A. F. HUXLEY, AND F. J. JULIAN. The variation in isometric tension with sarcomere length in vertebrate muscle fibers. J. Physiol. Land. 184: 170-192, 1966. HAFFAJEE, D., U. MORITZ, AND G. SVANTESSON. Isometric knee extension strength as a function of joint angle, muscle length and motor unit activity. Acta Orthop. Stand. 43: 138-147, 1972. HASAN, Z., AND R. M. ENOKA. Isometric torque-angle relationship and movement-related activity of human elbow flexors: implica- tions for the equilibrium-point hypothesis. Exp. Brain Res. 59: 441- 450,1985. HERTZBERG, S. R., Z. F. MUHL, AND E. A. BEGOLE. Muscle sarcomere length following passive jaw opening in the rabbit. Anat. Rec. 197: 435-4&0,19&O. HILL, A. V. First and Last Experiments in Muscle Mechanics. London: Cambridge Univ. Press, 1970. HUXLEY, A. F. Review lecture. Muscular contraction. J. Physiol. Lord. 243:1-43,1974. HUXLEY, A. F., AND L. D. PEACHEY. The maximum length for contraction in vertebrate striated muscle. J. Physiol. Lond. 156: 150-165,196l. ISMAIL, H. M., AND K. W. RANATUNGA. Isometric tension devel- opment in a human skeletal muscle in relation to its working range of movement: the length-tension relation of biceps brachii muscle. Exp. Neurol. 62: 595-604, 1978. KNAPIK, J. J., J. E. WRIGHT, R. H. MAWDSLEY, AND J. BRAUN. Isometric, isotonic, and isokinetic torque variations in four muscle groups through a range of joint motion. Phys. Ther. 63: 938-947, 1983. LIEBER, R. L. Skeletal muscle adaptability. III. Muscle properties following chronic electrical stimulation. Develop. Med. Child Neu- rol. 28: 662-670, 1986. LIEBER, R. L., AND R. J. BASKIN (Inventors). Surgical Myometer Method. US Patent no. 4,570,641, 1986. LIEBER, R. L., R. J. BASKIN, AND Y. YEH. Sarcomere length determination using laser diffraction: the effect of beam and fiber diameter. Biophys. J. 45: 1009-1117,19&4. LIEBER, R. L., K. P. Roos, B. A. LUBELL, J. W. CLINE, AND R. J. BASKIN. High speed digital data acquisition of sarcomere lengths from isolated skeletal and cardiac muscle cells. IEEE Trans. Biomed. Eng. 30: 50-57,19&4. LIEBER, R. L., D. E. SMITH, R. C. CAMPBELL, AND A. R. HARGENS. Real-time acquisition and data analysis of skeletal muscle contrac- tion in a multi-user environment. Comp. Prog. Methods Biomed. 22: 259-265,19&6. LONDON, J. T. Kinematics of the elbow. J. Bone Joint Surg. 63: 529-535,19&l. MARSH, E., D. SALE, A. J. MCCOMAS, AND J. QUINLAN. Influence of joint position on ankle dorsiflexion in humans. J. Appl, Physiol. 51: 160-167,19&l. MENDEZ, J., AND A. KEYS. Density and composition of mammalian muscle. Metabolism 9: 184-188, 1960. NORDSTROM, S. H., AND R. YEMM. The relationship between jaw position and isometric active tension produced by direct stimula-
C768 TORQUE GENERATION IN
28.
29.
30.
31.
32.
tion of the rat masseter muscle. Arch. Oral Biol. 19: 353-359,1974. PANJABI, M. M., V. K. GOEL, S. D. WALTER, AND S. SCHICK. Errors in the center and angle of rotation of a joint: an experimental 34 study. J. Biomech. Eng. 104: 232-237, 1982. PAOLINI, P. J., AND K. P. Roos. Length dependent optical diffrac- 35. tion pattern changes in frog sartorius muscle. Physiol. Chem. Physics 7: 235-254, 1975. RACK, P. M. H., AND D. R. WESTBURY. The effects of length and 36* stimulus rate on isometric tension in the cat soleus muscle. J. Physiol. Lord. 204: 443-460,1969. 37.
REULEAUX, F. Kinematics of Machinery: Outline of a Theory of Machines (English translation), translated by A. B. W. Kennedy, edited by F. Vieweg. New York: Macmillan, 1963. ROY, R. R., POWELL, P. L., KANIM, P., AND D. R. SIMPSON.
38.
Architectural and histochemical analysis of the semitendinosus muscle in mice, rats, guinea pigs, and rabbits. J. Morphol. 181: 39. 155-160,1984.
33. RUDEL, R., AND F. ZITE-FERENCZY. Interpretation of light diffrac-
FROG HINDLIMB
tion by cross-striated muscle as Bragg reflexion of light by the lattice of contractile proteins. J. Physiol. Land. 290: 317-330,1979. SACKS, R. D., AND R. R. ROY. Architecture of the hind limb muscles of cats: functional significance. J. Morphol. 173: 185-195,1982. SALE, D., J. QUINLAN, E. MARSH, A. J. MCCOMAS, AND A. Y. BELANGER. Influence of joint position on ankle plantarflexion in humans. J. Appl. Physiol. 52: 1636-1642,1982. SMIDT, G. L. Biomechanical analysis of knee flexion and extension. J. Biomech. 6: 79-92, 1973. TARDIEU, C., J. C. TABARY, E. HUET DE LA TOUR, C. TABARY, AND G. TARDIEU. The relationship between sarcomere length in the soleus and tibialis anterior and the articular angle of the tibia- calcaneum in cats during growth. J. Anut. 124: 581-588,1977. WICKIEWICZ, T. L., R. R. ROY, P. L. POWELL, AND V. R. EDGER- TON. Muscle architecture of the human lower limb. Clin Orthol. Relut. Res. 179: 275-283,1983. YEH, Y., R. J. BASKIN, R. L. LIEBER, AND K. P. Roos. Theory of light diffraction by single skeletal muscle fibers. Biophys. J. 29: 509-522,198O.


![Biology - PapaCambridge · skeletal muscle and not smooth muscle [2] (b) The graph below shows the length of a sarcomere during muscle contraction. 0 1 Length of sarcomere/µm 2 3](https://static.documents.pub/doc/80x56/5ebaa1a098d10d5e417b19cc/biology-papacambridge-skeletal-muscle-and-not-smooth-muscle-2-b-the-graph.jpg)


![Torque, Angular momentum & equilibriumDec 05, 2016 · [TORQUE, ANGULAR MOMENTUM & EQUILIBRIUM] CHAPTER NO. 5 ò ó , Rotational Kinematics i.e. Angular Displacement, Velocity, Acceleration](https://static.documents.pub/doc/80x56/5e6f6c81ea7ec22c07242904/torque-angular-momentum-equilibrium-dec-05-2016-torque-angular-momentum.jpg)


