86
Annual Report 2020 Resilience and agility Saudi Arabian Oil Company Consolidated financial statements for the year ended December 31, 2020

Annual Report 2020
Resilience and agilitySaudi Arabian Oil CompanyConsolidated financial statementsfor the year ended December 31, 2020

PricewaterhouseCoopers, License No. 25, Saudi Aramco, P.O. Box 1659, Dhahran 31311, Kingdom of Saudi Arabia T: +966 (13) 873-6800, F: +966 (13) 873-8883, www.pwc.com/middle-east
Independent auditor’s report to the shareholders of Saudi Arabian Oil Company Report on the audit of the consolidated financial statements Our opinion In our opinion, the consolidated financial statements present fairly, in all material respects, the consolidated financial position of Saudi Arabian Oil Company (the “Company”) and its subsidiaries (together the “Group”) as at December 31, 2020, and its consolidated financial performance and its consolidated cash flows for the year then ended in accordance with International Financial Reporting Standards, that are endorsed in the Kingdom of Saudi Arabia, and other standards and pronouncements issued by the Saudi Organization for Certified Public Accountants (SOCPA). What we have audited The Group’s consolidated financial statements comprise: • the consolidated statement of income for the year ended December 31, 2020; • the consolidated statement of comprehensive income for the year ended December 31, 2020; • the consolidated balance sheet as at December 31, 2020; • the consolidated statement of changes in equity for the year ended December 31, 2020; • the consolidated statement of cash flows for the year ended December 31, 2020; and • the notes to the consolidated financial statements, which include significant accounting policies and
other explanatory information. Basis for opinion We conducted our audit in accordance with International Standards on Auditing, that are endorsed in the Kingdom of Saudi Arabia. Our responsibilities under those standards are further described in the Auditor’s responsibilities for the audit of the consolidated financial statements section of our report. We believe that the audit evidence we have obtained is sufficient and appropriate to provide a basis for our opinion. Independence We are independent of the Group in accordance with the code of professional conduct and ethics, endorsed in the Kingdom of Saudi Arabia, that are relevant to our audit of the consolidated financial statements and we have fulfilled our other ethical responsibilities in accordance with these requirements.
01
2
Independent auditor’s report to the shareholders of Saudi Arabian Oil Company (continued) Our audit approach Overview
• We determined overall Group materiality taking into account the profit-oriented nature of the Group.
• Based on income before income taxes and zakat of SAR 372.4 billion, we determined our overall Group materiality at SAR 14.2 billion.
• Our quantitative threshold for reporting misstatements to those charged with governance was set at SAR 1.1 billion.
Based on their size, complexity and risk: • We considered the Company’s standalone operations and four other
components located in the Kingdom of Saudi Arabia, the United States of America and the Republic of Korea as significant to the Group audit; and
• We also determined a number of other components to be in scope for the Group audit, in respect of which appropriate audit procedures were performed.
Our key audit matters comprise the following: • Accounting for the acquisition of Saudi Basic Industries Corporation
(“SABIC”); and • Assessment of recoverability of the goodwill and brand recognised as part
of the SABIC acquisition.
As part of designing our audit, we determined materiality and assessed the risks of material misstatement in the consolidated financial statements. In particular, we considered where the Board of Directors made subjective judgments; for example, in respect of significant accounting estimates that involved making assumptions and considering future events that are inherently uncertain. As in all of our audits, we also addressed the risk of management override of internal controls, including among other matters, consideration of whether there was evidence of bias that represented a risk of material misstatement due to fraud. Materiality The scope of our audit was influenced by our application of materiality. An audit is designed to obtain reasonable assurance whether the consolidated financial statements are free from material misstatement. Misstatements may arise due to fraud or error. They are considered material if, individually or in aggregate, they could reasonably be expected to influence the economic decisions of users taken on the basis of the consolidated financial statements. Based on our professional judgment, we determined certain quantitative thresholds for materiality, including the overall Group materiality for the consolidated financial statements as a whole as set out in the table below. These, together with qualitative considerations, helped us to determine the scope of our audit and the nature, timing and extent of our audit procedures and to evaluate the effect of misstatements, both individually and in aggregate, on the consolidated financial statements as a whole.
Materiality
Group scoping
Key audit matters
02

3
Independent auditor’s report to the shareholders of Saudi Arabian Oil Company (continued)
Overall Group materiality SAR 14.2 billion (2019: SAR 26.3 billion)
How we determined it Approximately 4% of income before income taxes and zakat
Rationale for the materiality benchmark applied
Income before income taxes and zakat is an important benchmark for the Group’s stakeholders and is a generally accepted benchmark for profit-oriented groups.
We agreed with those charged with governance that we would report to them misstatements identified during our audit above SAR 1.1 billion. How we tailored our Group audit scope We tailored the scope of our audit in order to perform sufficient work to enable us to provide an opinion on the consolidated financial statements as a whole, taking into account the structure of the Group, the accounting processes and controls, and the industry in which the Group operates. The Group’s operations are conducted through many components in several parts of the world. The most significant component within the Group is the Company itself and most of the audit effort was spent by the Group engagement team based in Dhahran, Kingdom of Saudi Arabia. The Group engagement team tested IT general controls, application and manual controls over systems and processes related to the Company’s financial information supplemented by tests of detail and analytical procedures. Certain audit procedures were carried out by the Group engagement team with assistance from internal accounting, valuation, pension, tax and IT experts and specialists. The Group engagement team also coordinated the work done by the various component teams across different locations and performed audit procedures on the consolidation workings and disclosures. We identified four additional significant components where a full scope audit on the respective components’ financial information was performed under our instructions. Members of the Group engagement team performed the full scope audit of the significant component located in Dhahran, Kingdom of Saudi Arabia. Component teams in Riyadh, Kingdom of Saudi Arabia, the United States of America and the Republic of Korea performed full scope audits of the components at those locations. We also requested certain other component teams to perform appropriate audit procedures. The selection of these components was based on qualitative and quantitative considerations, including whether the component accounted for a significant proportion of individual consolidated financial statement line items. The Group engagement team’s involvement in the audit work performed by component teams considered the relative significance and complexity of the individual component. This included allocating overall Group materiality to the different components, sending formal instructions, obtaining regular updates on progress and results of procedures as well as review of deliverables and the relevant underlying working papers. Key audit matters Key audit matters are those matters that, in our professional judgment, were of most significance in our audit of the consolidated financial statements of the current period. These matters were addressed in the context of our audit of the consolidated financial statements as a whole, and in forming our opinion thereon, and we do not provide a separate opinion on these matters.
03

4
Independent auditor’s report to the shareholders of Saudi Arabian Oil Company (continued)
Key audit matter How our audit addressed the key audit matter
Accounting for the acquisition of SABIC The Company acquired a 70% equity interest in SABIC in June 2020. The total purchase consideration was SAR 259.1 billion for acquisition of identifiable net assets with preliminary fair values of SAR 260.7 billion. Non-controlling interests of SAR 100.7 billion and goodwill of SAR 99.1 billion were recognised as part of the transaction. The acquisition was accounted for in accordance with IFRS 3 ‘Business Combinations’, that is endorsed in the Kingdom of Saudi Arabia, and required management to make significant estimates as part of determining the preliminary fair values of the identifiable assets acquired and liabilities assumed. The Group engaged an independent valuer in order to determine the fair value of the purchase consideration and the preliminary fair values that formed part of the purchase price allocation. We considered this to be a key audit matter given the significant estimates involved in determining the preliminary fair values of the identifiable assets acquired and liabilities assumed. Refer to Note 2(e) and Note 4 to the consolidated financial statements for further information.
Our procedures included the following: • We read the share purchase agreement and
tested the appropriateness of the fair value of the purchase consideration.
• We assessed the competency, objectivity and independence of the independent valuer engaged by the Group.
• With input from internal valuation experts
(where considered necessary), we performed the following procedures, in relation to the preliminary fair values of the identifiable net assets that formed part of the purchase price allocation, as deemed appropriate:
- Considered the appropriateness of the
methodology and assumptions used in determining the preliminary fair values based on the applicable financial reporting requirements and established market practice;
- Compared certain key unobservable inputs underlying the preliminary fair values to supporting documentation such as approved financial plans; and
- Evaluated the reasonableness of certain observable inputs and/or the resulting preliminary fair values based on comparable market data.
• We considered the appropriateness of the
related accounting policies and disclosures in the consolidated financial statements.
04
5
Independent auditor’s report to the shareholders of Saudi Arabian Oil Company (continued)
Key audit matter How our audit addressed the key audit matter
Assessment of recoverability of the goodwill and brand recognised as part of the SABIC acquisition IAS 36 ‘Impairment of Assets’, that is endorsed in the Kingdom of Saudi Arabia, requires goodwill and indefinite-lived intangible assets to be tested annually, irrespective of whether there is any indication of impairment. Management performed an assessment of recoverability of the goodwill and brand recognised as part of the SABIC acquisition. The carrying amounts of these assets were SAR 99.1 billion and SAR 18.2 billion, respectively, at December 31, 2020. Goodwill has been provisionally allocated to the Downstream operating segment. Therefore, the goodwill impairment test was performed at the Downstream operating segment level. The brand test was performed based on an aggregation of the relevant cash-generating units. The recoverable amounts were determined based on value-in-use calculations derived using discounted cash flow models. The models were based on the most recent financial plans and included 10-year projection periods with terminal values assumed thereafter. The exercise performed supported the goodwill and brand carrying values and did not identify the need for any impairment charges to be recognised. We considered this to be a key audit matter given the significant estimates involved in determining recoverable amounts and the uncertainty inherent in the underlying forecasts and assumptions. The key inputs to the recoverable amounts included the: • Cash flows during the 10-year periods including
the underlying assumptions; • Terminal values; and • Pre-tax discount rates. Refer to Note 2(f) and Note 7 to the consolidated financial statements for further information.
Our procedures included the following: • We reviewed the appropriateness of
management’s provisional allocation of goodwill to the Downstream operating segment and brand to the aggregation of the relevant cash-generating units, based on the requirements of IAS 36 ‘Impairment of assets’, that is endorsed in the Kingdom of Saudi Arabia.
• We assessed the appropriateness of the assets and liabilities considered as part of the impairment tests for the goodwill and brand.
• With input from internal valuation experts (where considered necessary), we performed the following procedures on management’s valuation models, as deemed appropriate: - Considered the consistency of certain
unobservable inputs underlying the 1o-year cash flows such as expected product volumes and future operating and development costs with approved financial plans;
- Compared a sample of forecast commodity prices underlying the 10-year cash flows to market data points;
- Evaluated the reasonableness of approved financial plans by comparison to historical results;
- Assessed the reasonableness of the approach and inputs used to determine the terminal values;
- Evaluated the reasonableness of the pre-tax discount rates used by cross-checking the underlying assumptions against observable market data;
- Tested the mathematical accuracy and logical integrity of the models; and
- Tested management’s sensitivity analyses that considered the impact of changes in assumptions on the outcome of the impairment assessments.
• We considered the appropriateness of the related accounting policies and disclosures in the consolidated financial statements.
05

6
Independent auditor’s report to the shareholders of Saudi Arabian Oil Company (continued) Other information The Board of Directors is responsible for the other information. The other information comprises the Annual Report (but does not include the consolidated financial statements and our auditor’s report thereon). Our opinion on the consolidated financial statements does not cover the other information and we do not express any form of assurance conclusion thereon. In connection with our audit of the consolidated financial statements, our responsibility is to read the other information identified above and, in doing so, consider whether the other information is materially inconsistent with the consolidated financial statements or our knowledge obtained in the audit, or otherwise appears to be materially misstated. If, based on the work we have performed, we conclude that there is a material misstatement of this other information, we are required to report that fact. We have nothing to report in this regard. Responsibilities of the Board of Directors and those charged with governance for the consolidated financial statements The Board of Directors is responsible for the preparation and fair presentation of the consolidated financial statements in accordance with International Financial Reporting Standards, that are endorsed in the Kingdom of Saudi Arabia and other standards and pronouncements issued by SOCPA, and the applicable requirements of the Regulations for Companies and the Company’s Bylaws, and for such internal control as they determine is necessary to enable the preparation of consolidated financial statements that are free from material misstatement, whether due to fraud or error. In preparing the consolidated financial statements, the Board of Directors is responsible for assessing the Group’s ability to continue as a going concern, disclosing, as applicable, matters related to going concern and using the going concern basis of accounting unless the Board of Directors either intends to liquidate the Group or to cease operations, or has no realistic alternative but to do so. Those charged with governance are responsible for overseeing the Group’s financial reporting process. Auditor’s responsibilities for the audit of the consolidated financial statements Our objectives are to obtain reasonable assurance about whether the consolidated financial statements as a whole are free from material misstatement, whether due to fraud or error, and to issue an auditor’s report that includes our opinion. Reasonable assurance is a high level of assurance, but is not a guarantee that an audit conducted in accordance with International Standards on Auditing, that are endorsed in the Kingdom of Saudi Arabia, will always detect a material misstatement when it exists. Misstatements can arise from fraud or error and are considered material if, individually or in the aggregate, they could reasonably be expected to influence the economic decisions of users taken on the basis of these consolidated financial statements.
06
7
Independent auditor’s report to the shareholders of Saudi Arabian Oil Company (continued) As part of an audit in accordance with International Standards on Auditing, that are endorsed in the Kingdom of Saudi Arabia, we exercise professional judgment and maintain professional scepticism throughout the audit. We also: • Identify and assess the risks of material misstatement of the consolidated financial statements, whether
due to fraud or error, design and perform audit procedures responsive to those risks, and obtain audit evidence that is sufficient and appropriate to provide a basis for our opinion. The risk of not detecting a material misstatement resulting from fraud is higher than for one resulting from error, as fraud may involve collusion, forgery, intentional omissions, misrepresentations, or the override of internal control.
• Obtain an understanding of internal control relevant to the audit in order to design audit procedures that are appropriate in the circumstances, but not for the purpose of expressing an opinion on the effectiveness of the Group’s internal control.
• Evaluate the appropriateness of accounting policies used and the reasonableness of accounting estimates and related disclosures made by the Board of Directors.
• Conclude on the appropriateness of the Board of Directors’ use of the going concern basis of accounting and, based on the audit evidence obtained, whether a material uncertainty exists related to events or conditions that may cast significant doubt on the Group’s ability to continue as a going concern. If we conclude that a material uncertainty exists, we are required to draw attention in our auditor’s report to the related disclosures in the consolidated financial statements or, if such disclosures are inadequate, to modify our opinion. Our conclusions are based on the audit evidence obtained up to the date of our auditor’s report. However, future events or conditions may cause the Group to cease to continue as a going concern.
• Evaluate the overall presentation, structure and content of the consolidated financial statements, including the disclosures, and whether the consolidated financial statements represent the underlying transactions and events in a manner that achieves fair presentation.
• Obtain sufficient appropriate audit evidence regarding the financial information of the entities or business activities within the Group to express an opinion on the consolidated financial statements. We are responsible for the direction, supervision and performance of the Group audit. We remain solely responsible for our audit opinion.
We communicate with those charged with governance regarding, among other matters, the planned scope and timing of the audit and significant audit findings, including any significant deficiencies in internal control that we identify during our audit. We also provide those charged with governance with a statement that we have complied with relevant ethical requirements regarding independence, and to communicate with them all relationships and other matters that may reasonably be thought to bear on our independence, and where applicable, related safeguards.
07
8
Independent auditor’s report to the shareholders of Saudi Arabian Oil Company (continued) From the matters communicated with those charged with governance, we determine those matters that were of most significance in the audit of the consolidated financial statements of the current period and are therefore the key audit matters. We describe these matters in our auditor’s report unless law or regulation precludes public disclosure about the matter or when, in extremely rare circumstances, we determine that a matter should not be communicated in our report because the adverse consequences of doing so would reasonably be expected to outweigh the public interest benefits of such communication. PricewaterhouseCoopers Bader I. Benmohareb License No. 471 March 18, 2021
08

Consolidated statement of income
SAR USD*
Year ended December 31 Year ended December 31
Note 2020 2019 2020 2019
Revenue 25 768,109 1,105,696 204,829 294,852 Other income related to sales 93,982 131,089 25,062 34,957Revenue and other income related to sales 862,091 1,236,785 229,891 329,809 Royalties and other taxes (89,964) (182,141) (23,991) (48,571) Purchases 26 (181,116) (225,170) (48,297) (60,045) Producing and manufacturing (74,350) (58,249) (19,827) (15,533) Selling, administrative and general (46,970) (36,647) (12,525) (9,773) Exploration (7,293) (7,291) (1,945) (1,944) Research and development (2,830) (2,150) (755) (573) Depreciation and amortization 6,7 (76,208) (50,266) (20,322) (13,404)Operating costs (478,731) (561,914) (127,662) (149,843)Operating income 383,360 674,871 102,229 179,966 Share of results of joint ventures and associates 8 (3,554) (9,455) (948) (2,521) Finance and other income 28 3,182 7,351 849 1,960 Finance costs 21 (10,564) (6,026) (2,817) (1,607)Income before income taxes and zakat 372,424 666,741 99,313 177,798Income taxes and zakat 9 (188,661) (336,048) (50,310) (89,613)Net income 183,763 330,693 49,003 88,185
Net income (loss) attributable to Shareholders' equity 184,926 330,816 49,313 88,218 Non-controlling interests (1,163) (123) (310) (33)
183,763 330,693 49,003 88,185
Earnings per share (basic and diluted) 37 0.93 1.65 0.25 0.44
* Supplementary information is converted at a fixed rate of U.S. dollar 1.00 = SAR 3.75 for convenience only.
H.E. Yasir O. Al-Rumayyan Amin H. Nasser Khalid H. Al-Dabbagh Chairman of the Board President & Chief Executive Officer Senior Vice President, Finance, Strategy & Development
All amounts in millions of Saudi Riyals unless otherwise stated09
Saud
i Ara
bian
Oil
Com
pany
| C
onso
lidat
ed fi
nanc
ial s
tate
men
ts f
or th
e ye
ar e
nded
Dec
embe
r 31
, 202
0

Consolidated statement of comprehensive income
SAR USD*
Year ended December 31 Year ended December 31
Note 2020 2019 2020 2019
Net income 183,763 330,693 49,003 88,185
Other comprehensive (loss) income, net of tax 19 Items that will not be reclassified to net income Remeasurement of post-employment benefit obligations (8,966) 2,628 (2,391) 701 Change in post-employment benefit deferred tax asset due to new income tax rate – (464) – (123) Share of post-employment benefit obligations remeasurement from joint ventures and associates – 2 – – Changes in fair value of equity investments classified as fair value through other comprehensive income 1,795 187 479 50 Change in equity investment deferred tax liability due to new income tax rate – 180 – 48 Items that may be reclassified subsequently to net income Cash flow hedges and other (300) (322) (80) (86) Changes in fair value of debt securities classified as fair value through other comprehensive income 297 59 79 16 Share of other comprehensive income (loss) of joint ventures and associates 550 (487) 147 (130) Currency translation differences 2,768 (1,027) 738 (274)
(3,856) 756 (1,028) 202Total comprehensive income 179,907 331,449 47,975 88,387
Total comprehensive income (loss) attributable to Shareholders' equity 180,960 331,896 48,256 88,506 Non-controlling interests (1,053) (447) (281) (119)
179,907 331,449 47,975 88,387
* Supplementary information is converted at a fixed rate of U.S. dollar 1.00 = SAR 3.75 for convenience only.
H.E. Yasir O. Al-Rumayyan Amin H. Nasser Khalid H. Al-Dabbagh Chairman of the Board President & Chief Executive Officer Senior Vice President, Finance, Strategy & Development
All amounts in millions of Saudi Riyals unless otherwise stated10
Saud
i Ara
bian
Oil
Com
pany
| C
onso
lidat
ed fi
nanc
ial s
tate
men
ts f
or th
e ye
ar e
nded
Dec
embe
r 31
, 202
0

Consolidated balance sheet
SAR USD*
At December 31 At December 31
Note 2020 2019 2020 2019AssetsNon-current assetsProperty, plant and equipment 6 1,209,460 982,014 322,523 261,870Intangible assets 7 164,547 30,122 43,879 8,033Investments in joint ventures and associates 8 65,976 19,738 17,594 5,263Deferred income tax assets 9 15,280 12,728 4,075 3,394Other assets and receivables 10 37,258 21,372 9,935 5,699Investments in securities 11 22,861 19,956 6,096 5,322
1,515,382 1,085,930 404,102 289,581Current assetsInventories 12 51,999 42,607 13,867 11,362Trade receivables 13 85,183 93,526 22,715 24,940Due from the Government 14 28,895 36,781 7,705 9,808Other assets and receivables 10 18,769 12,109 5,005 3,230Short-term investments 15 6,801 45,467 1,814 12,125Cash and cash equivalents 16 207,232 177,706 55,262 47,388
398,879 408,196 106,368 108,853Total assets 1,914,261 1,494,126 510,470 398,434
Equity and liabilitiesShareholders' equityShare capital 60,000 60,000 16,000 16,000Additional paid-in capital 26,981 26,981 7,195 7,195Treasury shares 17 (3,264) (3,750) (870) (1,000)Retained earnings: Unappropriated 895,273 943,758 238,739 251,669 Appropriated 6,000 6,000 1,600 1,600Other reserves 19 5,858 2,076 1,562 553
990,848 1,035,065 264,226 276,017Non-controlling interests 20 110,246 11,170 29,399 2,979
1,101,094 1,046,235 293,625 278,996Non-current liabilitiesBorrowings 21 436,920 150,690 116,512 40,184Deferred income tax liabilities 9 53,621 44,471 14,299 11,859Post-employment benefit obligations 22 54,207 21,174 14,455 5,646Provisions and other liabilities 23 25,208 15,985 6,722 4,263
569,956 232,320 151,988 61,952Current liabilitiesTrade and other payables 24 93,740 78,231 24,998 20,862Obligations to the Government: Income taxes and zakat 9 42,059 62,243 11,216 16,598 Dividend payable 36 – 35,475 – 9,460 Royalties 8,255 14,727 2,201 3,927Borrowings 21 99,157 24,895 26,442 6,639
243,211 215,571 64,857 57,486813,167 447,891 216,845 119,438
Total equity and liabilities 1,914,261 1,494,126 510,470 398,434
* Supplementary information is converted at a fixed rate of U.S. dollar 1.00 = SAR 3.75 for convenience only.
H.E. Yasir O. Al-Rumayyan Amin H. Nasser Khalid H. Al-Dabbagh Chairman of the Board President & Chief Executive Officer Senior Vice President, Finance, Strategy & Development
All amounts in millions of Saudi Riyals unless otherwise stated11
Saud
i Ara
bian
Oil
Com
pany
| C
onso
lidat
ed fi
nanc
ial s
tate
men
ts f
or th
e ye
ar e
nded
Dec
embe
r 31
, 202
0
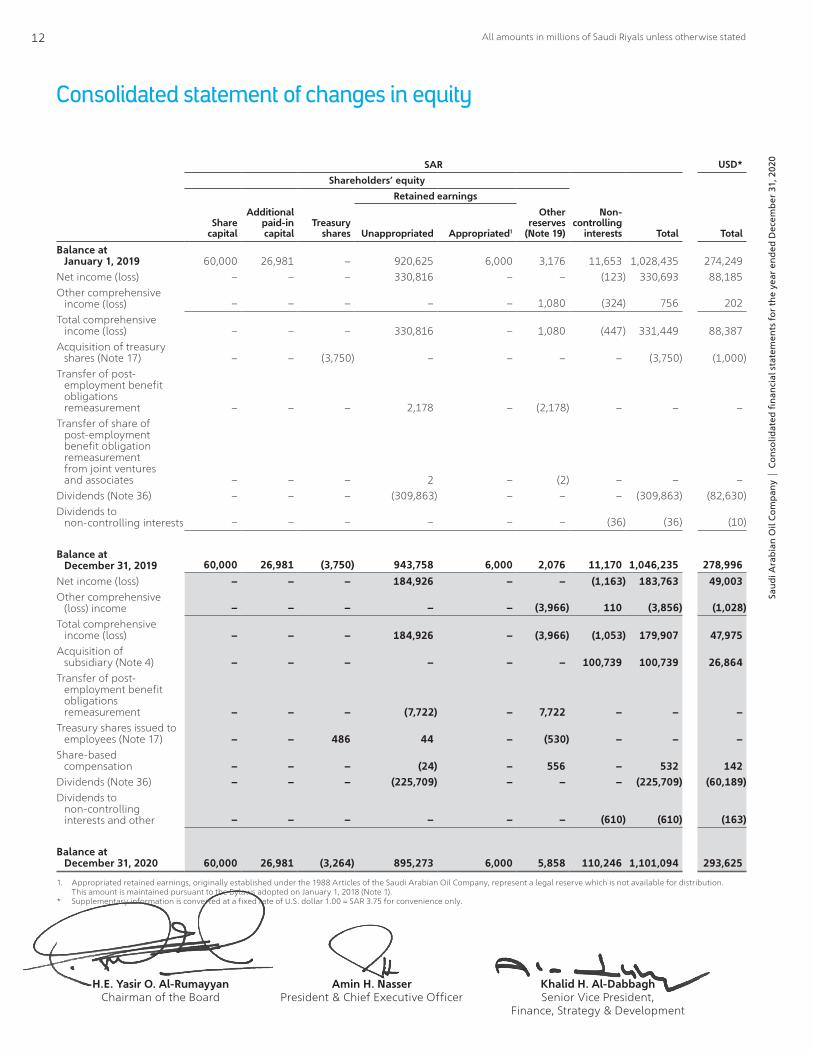
Consolidated statement of changes in equity
SAR USD*
Shareholders’ equity
Retained earnings
Share capital
Additional paid-in capital
Treasury shares Unappropriated Appropriated1
Other reserves
(Note 19)
Non-controlling
interests Total Total
Balance at January 1, 2019 60,000 26,981 – 920,625 6,000 3,176 11,653 1,028,435 274,249Net income (loss) – – – 330,816 – – (123) 330,693 88,185Other comprehensive income (loss) – – – – – 1,080 (324) 756 202Total comprehensive income (loss) – – – 330,816 – 1,080 (447) 331,449 88,387Acquisition of treasury shares (Note 17) – – (3,750) – – – – (3,750) (1,000)Transfer of post- employment benefit
obligations remeasurement – – – 2,178 – (2,178) – – –
Transfer of share of post-employment
benefit obligation remeasurement from joint ventures and associates – – – 2 – (2) – – –
Dividends (Note 36) – – – (309,863) – – – (309,863) (82,630)Dividends to non-controlling interests – – – – – – (36) (36) (10)
Balance at December 31, 2019 60,000 26,981 (3,750) 943,758 6,000 2,076 11,170 1,046,235 278,996Net income (loss) – – – 184,926 – – (1,163) 183,763 49,003Other comprehensive (loss) income – – – – – (3,966) 110 (3,856) (1,028)Total comprehensive income (loss) – – – 184,926 – (3,966) (1,053) 179,907 47,975Acquisition of subsidiary (Note 4) – – – – – – 100,739 100,739 26,864Transfer of post- employment benefit
obligations remeasurement – – – (7,722) – 7,722 – – –
Treasury shares issued to employees (Note 17) – – 486 44 – (530) – – –Share-based compensation – – – (24) – 556 – 532 142Dividends (Note 36) – – – (225,709) – – – (225,709) (60,189)Dividends to non-controlling
interests and other – – – – – – (610) (610) (163)
Balance at December 31, 2020 60,000 26,981 (3,264) 895,273 6,000 5,858 110,246 1,101,094 293,625
1. Appropriated retained earnings, originally established under the 1988 Articles of the Saudi Arabian Oil Company, represent a legal reserve which is not available for distribution. This amount is maintained pursuant to the Bylaws adopted on January 1, 2018 (Note 1).
* Supplementary information is converted at a fixed rate of U.S. dollar 1.00 = SAR 3.75 for convenience only.
H.E. Yasir O. Al-Rumayyan Amin H. Nasser Khalid H. Al-Dabbagh Chairman of the Board President & Chief Executive Officer Senior Vice President, Finance, Strategy & Development
All amounts in millions of Saudi Riyals unless otherwise stated12
Saud
i Ara
bian
Oil
Com
pany
| C
onso
lidat
ed fi
nanc
ial s
tate
men
ts f
or th
e ye
ar e
nded
Dec
embe
r 31
, 202
0

Consolidated statement of cash flows
SAR USD*
Year ended December 31 Year ended December 31
Note 2020 2019 2020 2019
Income before income taxes and zakat 372,424 666,741 99,313 177,798Adjustments to reconcile income before income taxes and zakat to net cash provided by operating activities Depreciation and amortization 6,7 76,208 50,266 20,322 13,404 Exploration and evaluation costs written off 7 3,544 3,217 945 858 Loss on disposal of property, plant and equipment 2,020 – 539 – Inventory movement 4,181 (91) 1,115 (24) Gain on remeasurement of existing interest in equity investments 28,35 – (1,278) – (341) Share of results of joint ventures and associates 8 3,554 9,455 948 2,521 Finance income 28 (2,771) (5,534) (739) (1,476) Finance costs 21 10,564 6,026 2,817 1,607 Dividends from investments in securities 28 (382) (509) (102) (136) Change in fair value of investments through profit or loss 28 (620) 7 (165) Change in joint ventures and associates inventory profit elimination 8 21 240 6 64 Other 794 1,257 211 335Change in working capital Inventories 15,890 1,960 4,237 523 Trade receivables 22,172 727 5,913 194 Due from the Government 7,886 12,083 2,103 3,222 Other assets and receivables (2,784) 3,268 (742) 872 Trade and other payables (16,250) 3,430 (4,333) 915 Royalties payable (6,472) 2,865 (1,726) 763Other changes Other assets and receivables (8,593) (9,951) (2,291) (2,654) Provisions and other liabilities 1,344 330 358 88 Post-employment benefit obligations 123 1,119 33 298 Settlement of income, zakat and other taxes 9 (198,204) (328,472) (52,855) (87,592)Net cash provided by operating activities 285,297 416,529 76,079 111,074
Capital expenditures 5 (101,030) (122,882) (26,942) (32,769) Cash acquired on acquisition of subsidiary 4 27,515 – 7,337 – Acquisition of affiliates, net of cash acquired 8,35 – (13,628) – (3,634) Distributions from joint ventures and associates 8 2,601 778 694 207 Additional investments in joint ventures and associates 8,32 (537) (341) (143) (91) Dividends from investments in securities 28 382 509 102 136 Interest received 3,698 4,561 987 1,216 Net investments in securities (599) (868) (160) (231) Net maturities (purchases) of short-term investments 47,071 (45,273) 12,552 (12,073)Net cash used in investing activities (20,899) (177,144) (5,573) (47,239)
Dividends paid to shareholders of the Company 36 (261,184) (274,388) (69,649) (73,170) Dividends paid to non-controlling interests in subsidiaries (718) (36) (191) (10) Acquisition of treasury shares 17 – (3,750) – (1,000) Proceeds from borrowings 87,520 51,960 23,339 13,856 Repayments of borrowings (42,125) (5,162) (11,233) (1,376) Principal portion of lease payments (10,868) (7,740) (2,898) (2,064) Interest paid (7,497) (5,715) (2,000) (1,524)Net cash used in financing activities (234,872) (244,831) (62,632) (65,288)
Net increase (decrease) in cash and cash equivalents 29,526 (5,446) 7,874 (1,453)Cash and cash equivalents at beginning of the year 177,706 183,152 47,388 48,841Cash and cash equivalents at end of the year 207,232 177,706 55,262 47,388
* Supplementary information is converted at a fixed rate of U.S. dollar 1.00 = SAR 3.75 for convenience only.
H.E. Yasir O. Al-Rumayyan Amin H. Nasser Khalid H. Al-Dabbagh Chairman of the Board President & Chief Executive Officer Senior Vice President, Finance, Strategy & Development
All amounts in millions of Saudi Riyals unless otherwise stated13
Saud
i Ara
bian
Oil
Com
pany
| C
onso
lidat
ed fi
nanc
ial s
tate
men
ts f
or th
e ye
ar e
nded
Dec
embe
r 31
, 202
0

Notes to the consolidated financial statements
1. General informationThe Saudi Arabian Oil Company (the “Company”), with headquarters located in Dhahran, Kingdom of Saudi Arabia (the “Kingdom”), is engaged in prospecting, exploring, drilling and extracting hydrocarbon substances (“Upstream”) and processing, manufacturing, refining and marketing these hydrocarbon substances (“Downstream”). The Company was formed on November 13, 1988 by Royal Decree No. M/8; however, its history dates back to May 29, 1933 when the Saudi Arabian Government (the “Government”) granted a concession to the Company’s predecessor the right to, among other things, explore the Kingdom for hydrocarbons.
On December 20, 2017, Royal Decree No. M/37 dated 2/4/1439H was issued approving the Hydrocarbons Law which applies to the Kingdom’s hydrocarbons and hydrocarbon operations. Under the Hydrocarbons Law, all hydrocarbon deposits, hydrocarbons and hydrocarbon resources are the property of the Kingdom until ownership is transferred at the well head or when extracted. Further, the Hydrocarbons Law codifies the Government’s sole authority to set the maximum amount of hydrocarbons production by the Company and the maximum sustainable capacity that the Company must maintain.
All natural resources within the Kingdom, including hydrocarbons, are owned by the Kingdom. Through a concession in 1933, the Government granted the Company the exclusive right to explore, develop and produce the Kingdom’s hydrocarbon resources, except in certain areas. As of December 24, 2017, the Company’s original concession agreement was replaced and superseded by an amended concession agreement (the “Concession Agreement”) which provides the Company the exclusive right to explore, drill, prospect, appraise, develop, extract, recover, and produce hydrocarbons in the concession area. The Company is also provided the exclusive right to market and distribute hydrocarbons, petroleum products and liquid petroleum gas (“LPG”) in the Kingdom along with the non-exclusive right to manufacture, refine, and treat production and to market, sell, transport and export such production.
The initial term of the Concession Agreement is for 40 years which shall be extended by the Government for 20 years unless the Company does not satisfy certain conditions commensurate with its then current operating practices. In addition, the Concession Agreement may be amended and extended for an additional 40 years beyond the original 60-year period subject to the Company and the Government agreeing on the terms of such extension.
Effective January 1, 2018, Council of Minister’s Resolution No. 180, dated 1/4/1439H (December 19, 2017) converted the Company to a Saudi Joint Stock Company with new Bylaws. The Company’s 1988 Articles were cancelled as of January 1, 2018 pursuant to Royal Decree No. M/36, dated 2/4/1439H (December 20, 2017). The Company’s share capital has been set at Saudi Riyal (“SAR”) 60,000, is fully paid and is divided into 200 billion ordinary shares with equal voting rights without par value. The Company’s Commercial Registration Number is 2052101150.
On December 11, 2019, the Company completed its Initial Public Offering (“IPO”) and its ordinary shares were listed on the Saudi Stock Exchange (“Tadawul”). In connection with the IPO, the Government, being the sole owner of the Company’s shares at such time, sold an aggregate of 3.45 billion ordinary shares, or 1.73% of the Company’s share capital. In addition, concurrent with the IPO, the Company acquired 117.2 million of its ordinary shares from the Government for a cash payment of SAR 3,750, which are being classified as treasury shares (Note 17). These shares are for use by the Company for its employee share plans (Note 18).
The consolidated financial statements of the Company and its subsidiaries (together “Saudi Aramco”) were approved by the Board of Directors on March 18, 2021.
2. Summary of significant accounting policies, judgments and estimatesThe principal accounting policies applied in the preparation of these consolidated financial statements are set out below. The consolidated financial statements provide comparative information in respect of the previous period.
(a) Basis of preparationThe consolidated financial statements have been prepared in accordance with International Financial Reporting Standards (“IFRS”), that are endorsed in the Kingdom, and other standards and pronouncements issued by the Saudi Organization for Certified Public Accountants (“SOCPA”). The consolidated financial statements are also in compliance with IFRS as issued by the International Accounting Standards Board (“IASB”). Amounts and balances relating to Shari’a compliant financial instruments of the Company, its subsidiaries and investments are disclosed separately. All other relevant amounts and balances relate to conventional financial instruments.
The consolidated financial statements have been prepared under the historical cost convention except for certain items measured at fair value which are, primarily, investments in securities, derivatives and certain trade receivables. The accounting policies that follow have been consistently applied to all years presented, unless otherwise stated.
All amounts in millions of Saudi Riyals unless otherwise stated14
Saud
i Ara
bian
Oil
Com
pany
| C
onso
lidat
ed fi
nanc
ial s
tate
men
ts f
or th
e ye
ar e
nded
Dec
embe
r 31
, 202
0

2. Summary of significant accounting policies, judgments and estimates continuedIn response to Novel Coronavirus (“COVID-19”), which has caused global economic disruption, Saudi Aramco has implemented active prevention programs at its sites and contingency plans in order to minimize the risks related to COVID-19 and to safeguard the continuity of business operations. Crude oil sales account for a substantial portion of the Company's revenue. Crude oil is also a fundamental feedstock to the Company’s Downstream operations. The COVID-19 pandemic has had an adverse impact on oil demand, which has led to an oversupply in global markets mostly during the second quarter of 2020, resulting in a reduction in crude oil prices. The markets showed signs of recovery during the second half of 2020 as governments began to ease restrictions and the improved economic activity translated into increased crude oil demand and higher prices. The increased prices have positively impacted Saudi Aramco’s financial performance during the second half of 2020. Management has taken measures to optimize spending, which resulted in reduced operational and capital expenditures during the year. Additionally, the Company entered into new financing arrangements (Note 21) to ensure sufficient funding to meet forecasted cash flow requirements and limit any potential financial exposure. Management continues to monitor the situation, including the impact on both results of operations and cash flows and will take further actions as necessary.
(b) Fiscal regime changesOn September 17, 2019, the following significant changes to the fiscal regime under which the Company operates were announced and are all effective January 1, 2020:
(i) The Company and the Government executed an amendment to the Concession Agreement, which changed the effective royalty rate applied to crude oil production based on the Company’s official selling prices. The effective royalty rate is determined based on a baseline marginal rate of 15% (from 20%) applied to prices up to $70 per barrel, increasing to 45% (from 40%) applied to prices above $70 per barrel and 80% (from 50%) applied to prices above $100 per barrel.
(ii) LPGs and certain other products were added to the price equalization mechanism to compensate the Company for revenue directly forgone as a result of the Company’s compliance with the Government mandates related to domestic sales of those products by the Company.
(iii) The tax rate applicable to the Company’s Downstream activities was reduced from the 50% rate applicable to qualified domestic oil and hydrocarbon production companies to the general corporate tax rate of 20% applicable to similar domestic downstream companies under the Saudi Arabian Income Tax Law of 2004 and its amendments (the “Tax Law”). The new rate is conditioned on the Company separating its Downstream activities under the control of one or more separate wholly owned subsidiaries before December 31, 2024, otherwise, the Company’s Downstream activities will be retroactively taxed at 50%. The Company expects to transfer all its Downstream activities into a separate legal entity or entities within the period specified (Note 9).
(iv) During 2020, the Tax Law was amended whereby shares held directly or indirectly in listed companies on the Tadawul by taxpayers engaged in oil and hydrocarbon activities are exempt from the application of corporate income tax. As a result, the Company’s ownership interests in Saudi Basic Industries Corporation (“SABIC”), Rabigh Refining and Petrochemical Company (“Petro Rabigh”), National Shipping Company of Saudi Arabia (“Bahri”) and Saudi Electricity Company (“SEC”) are now subject to zakat (Note 9).
(c) Significant accounting judgments and estimatesThe preparation of the consolidated financial statements in conformity with IFRS requires management to exercise judgment in applying Saudi Aramco’s accounting policies and in the use of certain critical accounting estimates and assumptions concerning the future. Management has made various judgments that may significantly impact the valuation and presentation of assets and liabilities. In addition, management also applies judgment when undertaking the estimation procedures necessary to calculate assets, liabilities, revenue and expenses. Accounting estimates, by definition, may not equal the related actual results and are subject to change based on experience and new information. The areas requiring the most significant judgments, estimates and assumptions in the preparation of the consolidated financial statements are: accounting for interests in subsidiaries, joint arrangements and associates, fair values of assets acquired and liabilities assumed on acquisition, recoverability of asset carrying amounts, determining the lease term, taxation, provisions, post-retirement obligations and determination of functional currency and are set out in the individual accounting policies below.
All amounts in millions of Saudi Riyals unless otherwise stated15
Saud
i Ara
bian
Oil
Com
pany
| C
onso
lidat
ed fi
nanc
ial s
tate
men
ts f
or th
e ye
ar e
nded
Dec
embe
r 31
, 202
0

2. Summary of significant accounting policies, judgments and estimates continued(d) New or amended standards(i) Saudi Aramco adopted the following IASB pronouncements, as endorsed in the Kingdom, effective for annual periods beginning
on or after January 1, 2020:
Interbank Offered Rate (“IBOR”) reform – Phase 1In September 2019, the IASB amended IAS 39, Financial Instruments: Recognition and Measurement, IFRS 7, Financial Instruments: Disclosures, and IFRS 9, Financial Instruments, which modify some specific hedge accounting requirements to provide relief from potential effects of the uncertainty caused by the IBOR reform in which the London Interbank Offered Rate (“LIBOR”) interest benchmark will cease after 2021. The amendments, part of Phase 1 of a two-phase project for IBOR reform, also require companies to provide additional information about their hedging relationships that are directly affected by these uncertainties. IBOR reforms and expectation of cessation of LIBOR will impact Saudi Aramco’s current risk management strategy and possibly accounting for certain financial instruments used for hedging. Saudi Aramco has recognized the following hedging instruments at fair value (Note 3(d)) which are exposed to the impact of LIBOR with a nominal value of SAR 12,075:
• Financial Liabilities: SAR 874
Saudi Aramco uses financial instruments as part of its risk management strategy to manage exposures arising from variation of interest rates that could affect net income or other comprehensive income and applies hedge accounting to these instruments. Saudi Aramco has certain borrowings where the reference rate is linked to LIBOR. Saudi Aramco is establishing a transition plan that follows a risk management approach to ensure a smooth transition to alternative reference rates. There is no material impact on Saudi Aramco’s consolidated financial statements from adopting the Phase 1 amendments to IAS 39, IFRS 7, and IFRS 9.
Amendments to IFRS 3, Business CombinationsIn October 2018, the IASB issued amendments to clarify the definition of a business in IFRS 3. To be considered a business, an acquired set of activities and assets must include, at a minimum, an input and a substantive process that together significantly contribute to the ability to create outputs. The amendments include clarification that while businesses usually have outputs, outputs are not required for an integrated set of activities and assets to qualify as a business. Additional guidance was also provided that helps to determine whether a substantive process has been acquired. These amendments have been applied prospectively to all transactions for which the acquisition date is on or after January 1, 2020. There is no material impact on Saudi Aramco’s consolidated financial statements from adopting these amendments to IFRS 3.
Amendments to IAS 1 and IAS 8 – Definition of MaterialIn October 2018, the IASB issued amendments to IAS 1, Presentation of Financial Statements and IAS 8, Accounting Policies, Changes in Accounting Estimates and Errors, effective January 1, 2020, to use a consistent definition of materiality throughout International Financial Reporting Standards and the Conceptual Framework for Financial Reporting, clarify when information is material and incorporate some of the guidance in IAS 1 about immaterial information. There is no material impact on Saudi Aramco’s consolidated financial statements from adopting these amendments to IAS 1 and IAS 8.
(ii) The following IASB pronouncement that is endorsed in the Kingdom will become effective for annual periods beginning on or after January 1, 2021 has not been early adopted by Saudi Aramco:
IBOR reform – Phase 2On August 27, 2020, the IASB issued amendments to IAS 39, Financial Instruments: Recognition and Measurement, IFRS 4, Insurance Contracts, IFRS 7, Financial Instruments: Disclosures, IFRS 9, Financial Instruments, and IFRS 16, Leases as part of Phase 2 of a two-phase project for IBOR reform, which address issues that arise from the implementation of the reforms, including the replacement of one benchmark with an alternative one. These amendments, effective January 1, 2021, include: (1) providing practical expedients in relation to accounting for instruments to which the amortized cost measurement applies by updating the effective interest rate to account for a change in the basis for determining the contractual cash flows without adjusting the carrying amount; (2) additional temporary exceptions from applying specific hedge accounting requirements, including permitted changes to hedge designation without the hedging relationship being discontinued when Phase 1 reliefs cease; and (3) additional disclosures related to IBOR reform, including managing the transition to alternative benchmark rates, its progress and the risks arising from the transition, quantitative information about financial instruments that have yet to transition to new benchmarks and changes in the entity’s risk management strategy where this arises. Saudi Aramco is currently assessing the impact of these Phase 2 amendments.
There are no other standards, amendments and interpretations that are not yet effective that are expected to have a material impact in the current or future reporting periods or on foreseeable future transactions.
All amounts in millions of Saudi Riyals unless otherwise stated16
Saud
i Ara
bian
Oil
Com
pany
| C
onso
lidat
ed fi
nanc
ial s
tate
men
ts f
or th
e ye
ar e
nded
Dec
embe
r 31
, 202
0
2. Summary of significant accounting policies, judgments and estimates continued(e) Principles of consolidation, acquisition and equity accounting(i) SubsidiariesThe consolidated financial statements reflect the assets, liabilities and operations of the Company and its subsidiaries. Subsidiaries are entities over which the Company has control. The Company controls an entity when it is exposed to, or has rights to, variable returns from its involvement with the entity and has the ability to affect those returns through its power over the entity. Subsidiaries are consolidated from the date on which the Company obtains control, and continue to be consolidated until the date that such control ceases.
Intercompany balances and transactions, including unrealized profits and losses arising from intragroup transactions, have been eliminated. Where necessary, adjustments are made to the financial statements of subsidiaries to align the accounting policies with those used by the Company.
The acquisition method of accounting is used to account for business combinations, including those acquisitions of businesses under common control that have commercial substance. Acquisition related costs are expensed as incurred. The consideration transferred for the acquisition of a subsidiary comprises the fair value of the assets transferred, liabilities incurred to the former owners of the acquired business, equity interests issued by the group, the fair value of any asset or liability resulting from a contingent consideration arrangement and the fair value of any pre-existing equity interest in the subsidiary. Identifiable assets acquired and liabilities and contingent liabilities assumed in a business combination are measured initially at fair value at the date the assets and liabilities are exchanged, irrespective of the extent of any non-controlling interests. The excess of the consideration transferred and the amount of any non-controlling interest in the acquired entity over the fair value of the acquired identifiable net assets is recorded as goodwill. Where settlement of any part of the cash consideration is deferred, the amounts payable in the future are discounted to their present value as of the date of exchange. The discount rate used is the entity’s incremental borrowing rate, being the rate at which a similar borrowing could be obtained under comparable terms and conditions. At the acquisition date, any goodwill arising is allocated to each of the cash-generating units, or groups of cash-generating units, expected to benefit from the business combination’s synergies. Non-controlling interests represent the equity in subsidiaries that is not attributable, directly or indirectly, to Saudi Aramco.
Saudi Aramco recognizes any non-controlling interest in the acquired entity on an acquisition-by-acquisition basis either at fair value or at the non-controlling interest’s proportionate share of the acquired entity’s net identifiable assets. Non-controlling interests in the results and equity of subsidiaries are shown separately in the Consolidated Statements of Income, the Consolidated Statement of Comprehensive Income, the Consolidated Statement of Changes in Equity, and the Consolidated Balance Sheet, respectively.
If the business combination is achieved in stages, the acquisition date carrying value of the previously held equity interest is remeasured to fair value at the acquisition date with any gains or losses arising from such remeasurement recognized in net income.
(ii) Joint arrangementsUnder IFRS 11, Joint Arrangements, an arrangement in which two or more parties have joint control is a joint arrangement. Joint control is the contractually agreed sharing of control of an arrangement, which exists only when decisions about the relevant activities require the unanimous consent of the parties sharing control. Investments in joint arrangements are classified as either joint operations or joint ventures. The classification depends on the contractual rights and obligations of each investor, rather than the legal structure of the joint arrangement. Saudi Aramco has both joint operations and joint ventures.
1) Joint operationsJoint operations arise where the investors have rights to the assets and obligations for the liabilities of a joint arrangement. In relation to its interests in joint operations, Saudi Aramco recognizes its:
– Assets, including its share of any assets held jointly; – Liabilities, including its share of any liabilities incurred jointly; – Revenue from the sale of its share of the output arising from the joint operation; and – Expenses, including its share of any expenses incurred jointly.
2) Joint venturesA joint venture is a type of joint arrangement whereby the parties that have joint control of the arrangement have rights to the net assets of the joint arrangement. Investments in joint ventures are accounted for using the equity method of accounting and are initially recognized at cost.
All amounts in millions of Saudi Riyals unless otherwise stated17
Saud
i Ara
bian
Oil
Com
pany
| C
onso
lidat
ed fi
nanc
ial s
tate
men
ts f
or th
e ye
ar e
nded
Dec
embe
r 31
, 202
0

2. Summary of significant accounting policies, judgments and estimates continuedSaudi Aramco’s share of results of its joint ventures is recognized within net income, while its share of post-acquisition movements in other comprehensive income is recognized within other comprehensive income. The cumulative effect of these changes is adjusted against the carrying amount of Saudi Aramco’s investments in joint ventures, which is presented separately in the Consolidated Balance Sheet. When Saudi Aramco’s share of losses in a joint venture equals or exceeds its interest in the joint venture, including any other unsecured non-current receivables, Saudi Aramco does not recognize further losses, unless it has incurred obligations or made payments on behalf of the joint venture.
Gains and losses on transactions between Saudi Aramco and joint ventures not realized through a sale to a third party are eliminated to the extent of Saudi Aramco’s interest in the joint ventures. Where necessary, adjustments are made to the financial statements of joint ventures to align their accounting policies with those used by Saudi Aramco.
Saudi Aramco’s investments in joint ventures includes, when applicable, goodwill identified on acquisition, net of any accumulated impairment loss. Goodwill represents the excess of the cost of an acquisition over the fair value of Saudi Aramco’s share of the net identifiable assets of the acquired joint venture at the date of acquisition. Dilution gains and losses arising from investments in joint ventures are recognized in net income.
Dividends received or receivable from joint ventures are recognized as a reduction in the carrying amount of the investment.
(iii) AssociatesAssociates are entities over which Saudi Aramco has significant influence. Significant influence is the power to participate in financial and operating policy decisions but with no control or joint control over those policies and is generally reflected by a shareholding of between 20% and 50% of the voting rights. Investments in associates are accounted for using the equity method of accounting and are initially recognized at cost. The accounting policies for joint ventures detailed in Note 2(e)(ii)(2) above are also applied by Saudi Aramco to its associates.
Significant accounting judgments and estimatesSignificant estimates relate to the acquisition of subsidiaries and require management to estimate the fair values of the assets acquired and liabilities assumed (Notes 4 and 35). In addition, judgments are applied in the determination of whether control, joint control or significant influence is present with respect to investments in non-wholly owned subsidiaries, joint arrangements or associates, respectively. For control, judgment is applied when determining if an entity is controlled by voting rights, potential voting rights or other rights granted through contractual arrangements and includes considering an entity’s purpose and design. For joint control, judgment is applied when assessing whether the arrangement is jointly controlled by all of its parties or by a group of the parties by taking decisions about relevant activities through unanimous consent of the parties sharing control. For joint control, judgment is also applied as to whether the joint arrangement is classified as a joint venture or joint operation taking into account specific facts and circumstances, such as the purpose and design of the arrangement, including with respect to its output, its relationship to the parties and its source of cash flows. For significant influence, judgment is applied in its determination by assessing factors such as representation on the board of directors, participation in policy-making processes, material transactions with the entity, interchange of managerial personnel and provision of essential technical information. Refer to Notes 8, 38, and 39.
(f) Intangible assetsGoodwill on acquisitions of subsidiaries is included in intangible assets. Goodwill is not amortized but it is tested for impairment annually, or more frequently if events or changes in circumstances indicate that it might be impaired, and is carried at cost less accumulated impairment losses. For the purpose of impairment testing, goodwill is allocated to cash-generating units or groups of cash-generating units that are expected to benefit from the acquisition in which the goodwill arose. The units or groups of units are identified at the lowest level at which goodwill is monitored for internal management purposes. Intangible assets other than exploration and evaluation costs (Note 2(g)) and those with indefinite useful lives such as goodwill and brand acquired on acquisition of SABIC (Note 4), consist primarily of brands and trademarks, franchise/customer relationships and computer software. If acquired in a business combination, these intangible assets are recognized at their fair value at the date of acquisition and, if acquired separately, these intangible assets are recognized at cost. All these intangible assets are subsequently amortized on a straight-line basis over their estimated useful lives.
All amounts in millions of Saudi Riyals unless otherwise stated18
Saud
i Ara
bian
Oil
Com
pany
| C
onso
lidat
ed fi
nanc
ial s
tate
men
ts f
or th
e ye
ar e
nded
Dec
embe
r 31
, 202
0

2. Summary of significant accounting policies, judgments and estimates continuedThe following table sets forth estimated useful lives, in years, of the principal groups of these intangible assets:
Brands and trademarks 10 to 22
Franchise/customer relationships 5 to 25
Computer software 3 to 15
Amortization is recorded in depreciation and amortization in the Consolidated Statement of Income.
(g) Exploration and evaluationExploration and evaluation costs are recorded under the successful efforts method. Under the successful efforts method, geological and geophysical costs are recognized as an expense when incurred and exploration costs associated with exploratory wells are initially capitalized on the Consolidated Balance Sheet as an intangible asset until the drilling of the well is complete and the results have been evaluated. If potential commercial quantities of hydrocarbons are found, these costs continue to be capitalized subject to further appraisal activities that would determine the commercial viability and technical feasibility of the reserves. If potentially commercial quantities of hydrocarbons have not been found, and no alternative use of the well is determined, the previously capitalized costs are written off to exploration in the Consolidated Statement of Income.
Exploratory wells remain capitalized while additional appraisal drilling on the potential oil and/or gas field is performed or while optimum development plans are established. All such capitalized costs are not subject to amortization, but at each reporting date are subject to regular technical and management review to confirm the continued intent to develop, or otherwise extract value from the well. Where such intent no longer exists, the costs are immediately written off to exploration in the Consolidated Statement of Income. Capitalized exploratory expenditures are, at each reporting date, subject to review for impairment indicators.
When proved reserves of hydrocarbons are determined and there is a firm plan for development approved by management, the relevant capitalized costs are transferred to property, plant and equipment.
(h) Property, plant and equipmentProperty, plant and equipment is stated on the Consolidated Balance Sheet at cost less accumulated depreciation and impairment losses, if any. Cost includes expenditures directly attributable to the construction and/or acquisition of the asset (Note 2(s)). Land and construction-in-progress are not depreciated. When a construction-in-progress asset is deemed ready for use as intended by management, depreciation commences.
Subsequent expenditures including major renovations are included in an asset’s carrying amount, or recognized as a separate asset only when it is probable that future economic benefits associated with the item will flow to Saudi Aramco and the cost of the item can be measured reliably. The carrying amount of the replaced item is derecognized. All other repair and maintenance expenditures are expensed as incurred. The present value of the expected cost for the decommissioning of an asset after its use is included in the cost of the respective asset if the recognition criteria for a provision are met (Note 2(v)).
Where the life of expected hydrocarbon reserves substantially exceeds the economic or technical lives of the underlying assets, the straight-line method of depreciation is used on a field-by-field basis. The unit of production method is used for fields where the expected reserve life is approximately equal to or less than the estimated useful lives of the underlying assets. Depletion rates are calculated on the basis of a group of wells or fields with similar characteristics based on proved developed reserves. The estimation of expected reserve lives reflects management’s assessment of proved developed reserves and the related depletion strategy on a field-by-field basis. Depreciation expense on all other assets is calculated using the straight-line method to allocate the cost less residual values over the estimated useful lives. Depreciation expense is recorded in the Consolidated Statement of Income.
Depreciation expense is calculated after determining an estimate of an asset’s expected useful life and the expected residual value at the end of its useful life. The useful lives and residual values are determined by management at the time the asset is initially recognized and reviewed annually for appropriateness or when events or conditions occur that impact capitalized costs, hydrocarbon reserves or estimated useful lives.
All amounts in millions of Saudi Riyals unless otherwise stated19
Saud
i Ara
bian
Oil
Com
pany
| C
onso
lidat
ed fi
nanc
ial s
tate
men
ts f
or th
e ye
ar e
nded
Dec
embe
r 31
, 202
0

2. Summary of significant accounting policies, judgments and estimates continuedThe following table sets forth estimated useful lives or, the lease term, if shorter, for right-of-use assets (Note 2(j)), in years of the principal groups of depreciable assets:
Crude oil facilities:
Pipelines and storage tanks 12 to 23
Drilling and construction equipment 5 to 25
Oil and gas properties 15 to 30
Marine equipment 13 to 30
Refinery and petrochemical facilities 2 to 50
Gas and Natural Gas Liquids (“NGL”) facilities 2 to 30
General service plant:
Permanent buildings 20 to 40
Roads and walkways 10 to 20
Aircraft 8 to 17
Autos and trucks 3 to 20
Office furniture and equipment 6 to 8
Computer equipment 3 to 5
Net gains and losses on disposals of depreciable assets are recognized in net income. Right of use assets are depreciated over the life of the asset or the lease term, if shorter (Note 2(j)).
(i) Impairment of non-financial assetsSaudi Aramco assesses, at each reporting date, whether there is an indication that a non-financial asset may be impaired except that assets with indefinite useful lives such as goodwill and brand acquired on acquisition of SABIC (Note 4) are reviewed for impairment on an annual basis. If an indication exists, or when annual impairment testing for an asset is required, the asset’s recoverable amount is estimated. An impairment loss is recognized for the amount by which the asset’s carrying amount exceeds its recoverable amount. The recoverable amount is the higher of an asset’s fair value less costs of disposal or value in use (“VIU”). The fair value less costs of disposal calculation is based on either, post-tax discounted cash flow models or available data from binding arm’s length sales transactions for similar assets, or observable market prices less incremental costs for disposing of the asset. The VIU calculation is based on a post-tax risk adjusted discounted cash flow model. The use of post-tax discount rates in determining value in use does not result in a materially different determination of the need for, or the amount of, impairment that would be required if pre-tax discount rates had been used.
Impairment losses are recognized as a component of net income. If, in a subsequent period, the amount of a non-goodwill impairment loss decreases, a reversal of the previously recognized impairment loss is recognized in net income. Significant accounting judgments and estimatesImpairment tests are undertaken on the basis of the smallest identifiable group of assets (cash-generating unit), or individual assets, for which there are largely independent cash inflows. The key assumptions used to determine the different cash-generating units involves significant judgment from management.
For the purposes of determining whether impairment of oil, refining and petrochemical, gas and NGL, general service plant or construction-in-progress assets has occurred, and the extent of any impairment or its reversal, the key assumptions management uses in estimating future cash flows for its VIU calculations are forecasted future oil and gas and chemical prices, expected production volumes, future operating and development costs, refining and petrochemical margins and changes to the discount rate used for the discounted cash flow model. There is an inherent uncertainty over forecasted information and assumptions. Changes in these assumptions and forecasts could impact the recoverable amounts of assets and any calculated impairment and reversals thereof.
All amounts in millions of Saudi Riyals unless otherwise stated20
Saud
i Ara
bian
Oil
Com
pany
| C
onso
lidat
ed fi
nanc
ial s
tate
men
ts f
or th
e ye
ar e
nded
Dec
embe
r 31
, 202
0

2. Summary of significant accounting policies, judgments and estimates continued(j) LeasesSaudi Aramco’s portfolio of leased assets mainly comprises land and buildings, drilling rigs, marine vessels, industrial facilities, equipment, storage and tanks, aircraft and vehicles. The determination of whether the contract is, or contains, a lease is based on the substance of the contract at the inception of the lease. A contract is, or contains, a lease if the contract conveys the right to control the use of an identified asset for a period of time in exchange for consideration.
Saudi Aramco recognizes right-of-use assets and lease liabilities at the lease commencement date. Right-of-use assets are initially measured at cost, which comprises lease liabilities at initial measurement, any initial direct costs incurred, any lease payments made at or before the commencement date, and restoration costs less any lease incentives received. Subsequent to initial recognition the right-of-use assets are measured at cost less accumulated depreciation and accumulated impairment losses, if any, and adjusted for any remeasurement of the lease liability. Right-of-use assets are depreciated over the shorter of the asset's useful life and the lease term on a straight-line basis unless the lease transfers ownership of the underlying asset by the end of the lease term or if the cost of the asset reflects the exercise of the purchase option, in which case right of use assets are depreciated over the useful life of the underlying asset. Depreciation expense is recorded in the Consolidated Statement of Income. Right-of-use assets are included under property, plant and equipment (Note 6). Lease liabilities are initially measured at the present value of lease payments. Lease payments include fixed lease payments, variable lease payments that depend on an index or rate, amounts payable for guaranteed residual values and payments to be made under extension or purchase or termination options, where applicable. The lease payments are discounted using the interest rate implicit in the lease. If that rate cannot be readily determined, which is generally the case, the lessee’s incremental borrowing rate is used, being the rate that the individual lessee would have to pay to borrow the funds necessary to obtain an asset of similar value to the right-of-use asset in a similar economic environment with similar terms, security and conditions. Subsequent to initial recognition, the lease liabilities are measured by increasing the carrying amount to reflect interest on the lease liability, reducing the carrying amount to reflect the lease payments made and adjusted for remeasurement to reflect any reassessments or lease modifications. Lease liabilities are included under borrowings (Note 21). Lease payments are allocated between the principal and finance costs. Finance costs are recorded as an expense in the Consolidated Statement of Income over the lease period so as to produce a constant periodic rate of interest on the remaining balance of the liability.
Saudi Aramco has elected not to recognize right-of-use assets and lease liabilities for short-term and low-value leases. Lease payments under short-term and low-value leases are recorded as an expense in the Consolidated Statement of Income on a straight-line basis over the lease term.
Significant accounting judgments and estimatesIn determining the lease term, management considers all facts and circumstances that create an economic incentive to exercise an extension option, or not exercise a termination option. Extension options are only included in the lease term if the lease is reasonably certain to not be terminated or to be extended. The assessment is reviewed if a significant event or a significant change in circumstances occurs which affects this assessment and is within the control of the lessee.
(k) Investments and other financial assets(i) ClassificationManagement determines the classification of its financial assets based on the business model for managing the financial assets and the contractual terms of the cash flows. Saudi Aramco’s financial assets are classified in the following measurement categories:
• those to be measured subsequently at fair value (either through other comprehensive income or through profit or loss), and
• those to be measured at amortized cost.
For financial assets measured at fair value, gains and losses are recorded either in net income or other comprehensive income. For investments in debt securities, this depends on the business model in which the investment is held. For investments in equity instruments that are not held for trading, this depends on whether Saudi Aramco has made an irrevocable election at the time of initial recognition, due to the strategic nature of these investments, to account for such equity investments at fair value through other comprehensive income. Saudi Aramco reclassifies debt securities when and only when its business model for managing those assets changes. Certain revenue contracts provide for provisional pricing at the time of shipment with the final pricing based on an average market price for a particular future period. Such trade receivables are measured at fair value because the contractual cash flows are not solely payments of principal and interest. All other trade receivables meet the criteria for amortized cost measurement under IFRS 9.
All amounts in millions of Saudi Riyals unless otherwise stated21
Saud
i Ara
bian
Oil
Com
pany
| C
onso
lidat
ed fi
nanc
ial s
tate
men
ts f
or th
e ye
ar e
nded
Dec
embe
r 31
, 202
0

2. Summary of significant accounting policies, judgments and estimates continued(ii) Recognition and derecognitionRegular purchases and sales of financial assets are recognized on the trade-date, which is the date on which Saudi Aramco commits to purchase or sell the asset. Financial assets are derecognized when the rights to receive cash flows from the financial assets have expired or have been transferred and Saudi Aramco has transferred substantially all the risks and rewards of ownership.
(iii) MeasurementAt initial recognition, Saudi Aramco measures a financial asset at its fair value plus, in the case of a financial asset not at fair value through profit or loss, transaction costs that are directly attributable to the acquisition of the financial asset. Transaction costs of financial assets carried at fair value through profit or loss are expensed as a component of net income. Saudi Aramco subsequently measures all equity investments at fair value.
Equity investments:Where Saudi Aramco has elected to present fair value gains and losses on equity investments in other comprehensive income, there is no subsequent reclassification of fair value gains and losses to net income following the derecognition of the investment. Dividends from such investments continue to be recognized as a component of net income when Saudi Aramco’s right to receive payments is established. Changes in the fair value of financial assets at fair value through profit or loss are recognized as a component of net income.
Debt securities:Subsequent measurement of debt securities depends on Saudi Aramco’s business model for managing the asset and the cash flow characteristics of the asset. Debt securities are classified into the following three measurement categories:
1. Amortized cost:Assets that are held for collection of contractual cash flows where those cash flows represent solely payments of principal and interest are measured at amortized cost using the effective interest method. A gain or loss on a debt investment that is subsequently measured at amortized cost and is not part of a hedging relationship is recognized as a component of net income when the asset is derecognized or impaired. Interest income from these financial assets is included in finance income using the effective interest rate method.
2. Fair value through other comprehensive income (“FVOCI”):Assets that are held for collection of contractual cash flows and for selling the financial assets, where the assets’ cash flows represent solely payments of principal and interest, are measured at FVOCI. Movements in the carrying amount are taken through other comprehensive income, except for impairment gains or losses, interest income and foreign exchange gains and losses which are recognized as a component of net income. When the financial asset is derecognized, the cumulative gain or loss previously recognized in other comprehensive income is reclassified from equity to net income. Interest income from these financial assets is included in finance income using the effective interest rate method.
3. Fair value through profit or loss (“FVPL”):Assets that do not meet the criteria for amortized cost or FVOCI are measured at FVPL. A gain or loss on a debt investment that is subsequently measured at FVPL and is not part of a hedging relationship is recognized as a component of net income in the period in which it arises. Financial assets at FVPL are included in non-current assets unless management intends to dispose of the asset within 12 months from the end of the reporting period, in which case the asset is included in current assets.
Other financial assets:Other financial assets are classified into the following categories:
1. Amortized cost:Assets that are held for collection of contractual cash flows where those cash flows represent solely payments of principal and interest are measured at amortized cost. A gain or loss on a financial asset that is subsequently measured at amortized cost and is not part of a hedging relationship is recognized as a component of net income when the asset is derecognized or impaired. Interest income from these financial assets is included in finance income using the effective interest rate.
Financial assets at amortized cost comprise cash and cash equivalents, short-term investments, other assets and receivables, due from the Government and trade receivables other than those subsequently measured at fair value through profit or loss.
2. Fair value through profit or loss:Trade receivables related to contracts with provisional pricing arrangements are subsequently measured at FVPL.
All amounts in millions of Saudi Riyals unless otherwise stated22
Saud
i Ara
bian
Oil
Com
pany
| C
onso
lidat
ed fi
nanc
ial s
tate
men
ts f
or th
e ye
ar e
nded
Dec
embe
r 31
, 202
0

2. Summary of significant accounting policies, judgments and estimates continued(iv) ImpairmentSaudi Aramco assesses on a forward-looking basis the expected credit losses associated with debt securities carried at either amortized cost or FVOCI. The impairment methodology applied depends on whether there has been a significant increase in credit risk.
For trade receivables, Saudi Aramco applies the simplified approach permitted by IFRS 9, which requires expected lifetime losses to be recognized from initial recognition of the receivables.
(l) Derivative instruments and hedging activitiesSaudi Aramco’s use of derivative instruments does not have a material effect on its financial position or results of operations.
(i) Derivative instruments classified as held for tradingSaudi Aramco uses commodity swap derivative financial instruments to manage exposure to price fluctuations which arise on purchase and sale transactions for physical deliveries of various refined products. The swaps are initially recognized, and subsequently remeasured at fair value and recorded as an asset, when the fair value is positive, or liability, when the fair value is negative, under trade receivables or trade and other payables in the Consolidated Balance Sheet, respectively.
The fair value of the swap is determined in accordance with Saudi Aramco’s derivative valuation policy by reference to the traded price of that instrument on the relevant exchange or over-the-counter markets at the Consolidated Balance Sheet date. The gain or loss from the changes in the fair value of the swap from its value at inception is recognized in net income.
(ii) Derivative instruments designated as hedgesSaudi Aramco uses interest rate swaps and currency forward contracts to manage its exposure to fluctuations in interest rates and foreign exchange rates. These derivative financial instruments, designated as either fair value or cash flow hedges, are purchased from counterparties of high credit standing and are initially recognized, and subsequently remeasured, at fair value.
At the inception of the hedging transaction, Saudi Aramco documents the economic relationship between the hedging instrument and the hedged item, as well as its risk management objectives and strategy for undertaking the hedge transaction.
The fair value of a derivative financial instrument used for hedging purposes is classified as a current asset or liability when the remaining maturity of the derivative is less than 12 months; otherwise, it is classified as a non-current asset or liability.
1) Fair value hedgesA fair value hedge is a hedge of the fair value of a recognized asset or liability or firm commitment. Saudi Aramco designates certain currency forward contracts as fair value hedges. The gain or loss from the changes in the fair value of the currency forward contracts is recognized in net income, together with changes in the fair value of the hedged item.
2) Cash flow hedgesA cash flow hedge is a hedge of a particular risk associated with all or a component of a recognized asset or liability or a highly probable forecast transaction, and could affect profit or loss. Any gain or loss relating to the effective portion of changes in the fair value of interest rate swap contracts is recognized in other comprehensive income, with the ineffective portion recognized immediately in net income.
Gains and losses deferred through other comprehensive income are reclassified to net income at the time the hedged item affects net income. However, when a hedged item is a forecast transaction resulting in the recognition of a non-financial asset or non-financial liability, the gains and losses deferred through other comprehensive income, if any, are included in the initial cost or other carrying amount of the asset or liability. When a hedging instrument expires, any cumulative gain or loss deferred through other comprehensive income will remain until the forecast transaction is recognized. When a forecast transaction is no longer expected to occur, the cumulative gain or loss deferred through other comprehensive income is immediately reclassified to net income.
All amounts in millions of Saudi Riyals unless otherwise stated23
Saud
i Ara
bian
Oil
Com
pany
| C
onso
lidat
ed fi
nanc
ial s
tate
men
ts f
or th
e ye
ar e
nded
Dec
embe
r 31
, 202
0
2. Summary of significant accounting policies, judgments and estimates continued(m) Income tax and zakatIncome tax expense for the period comprises current and deferred tax expense. Income tax expense is recognized in net income, except to the extent that it relates to items recognized in other comprehensive income. In this case, the related income tax is also recognized in other comprehensive income.
Current income tax expense is calculated primarily on the basis of the Tax Law. In addition, income tax expense results from taxable income generated by foreign affiliates.
Deferred income tax is provided in full, using the liability method at tax rates enacted or substantively enacted at the end of the reporting period and expected to apply when the related deferred income tax is realized or settled on temporary differences arising between the tax bases of assets and liabilities and their carrying amounts in the consolidated financial statements. In estimating such tax consequences, consideration is given to expected future events. Deferred income tax is not provided on initial recognition of an asset or liability in a transaction, other than a business combination that, at the time of the transaction, does not affect either the accounting profit or the taxable profit.
Deferred income tax assets are recognized where future recovery is probable. Deferred income tax assets and liabilities are offset when there is a legally enforceable right to offset current income tax assets against current income tax liabilities and when the deferred income taxes relate to the same fiscal authority. Deferred income tax is not provided for taxes on possible future distributions of retained earnings of subsidiaries where the timing of the distribution can be controlled and it is probable that the retained earnings will be substantially reinvested by the entities.
Zakat is levied at the higher of adjusted income subject to zakat or the zakat base in accordance with the Regulations of the General Authority of Zakat and Tax (“GAZT”) in the Kingdom. Zakat is computed using the zakat base. The zakat provision is charged to the Consolidated Statement of Income.
Significant accounting judgments and estimatesSaudi Aramco establishes provisions, based on reasonable estimates, for potential claims by the tax authorities of the respective countries in which it operates. The amount of such provisions is based on various factors, such as different interpretations of tax regulations by the taxable entity and the responsible tax authority and the outcome of previous negotiations. This requires the application of judgment as to the ultimate outcome, which can change over time depending on facts and circumstances. A change in estimate of the likelihood of a future outflow and/or in the expected amount to be settled would be recognized in net income in the period in which the change occurs. Deferred income tax assets are recognized only to the extent it is considered probable that those assets are recoverable. This includes an assessment of when those assets are likely to reverse, and a judgment as to whether or not there will be sufficient taxable income available to offset the assets when they do reverse. This requires assumptions regarding future profitability. To the extent assumptions regarding future profitability change, there can be an increase or decrease in the amounts recognized in respect of deferred income tax assets as well as in the amounts recognized in net income in the period in which the change occurs.
Detailed taxation information, including current expense and deferred income tax assets and liabilities, is presented in Note 9.
(n) InventoriesInventories are stated at the lower of cost or estimated net realizable value. Cost comprises all expenses to bring inventories to their present location and condition and, for hydrocarbon inventories, is determined using the first-in, first-out (“FIFO”) method. For materials and supplies inventories, cost is determined using the weighted average method less an allowance for disposal of obsolete and/or surplus materials and supplies. Net realizable value is the estimated selling price in the ordinary course of business, less applicable variable selling expenses.
(o) Due from the GovernmentThe Government compensates the Company through price equalization (Note 2(z)) and for past due trade receivables of specified Government, semi-Government and other entities with Government ownership or control to whom the Company supplies specified products and services.
All amounts in millions of Saudi Riyals unless otherwise stated24
Saud
i Ara
bian
Oil
Com
pany
| C
onso
lidat
ed fi
nanc
ial s
tate
men
ts f
or th
e ye
ar e
nded
Dec
embe
r 31
, 202
0

2. Summary of significant accounting policies, judgments and estimates continuedRevenue on sales to these specified Government, semi-Government and other entities with Government ownership or control is recognized upon the satisfaction of performance obligations, which occurs when control transfers to these customers. Control of the products is determined to be transferred when the title of products passes, which typically takes place when product is physically transferred to these customers. Once receivables from these customers are past due, these trade receivables are reclassified as a due from the Government current receivable. Implementing regulations issued by the Government allow the Company to offset any amounts due from the Government against payment of taxes, and in the event of insufficiency of tax balances, offset against any other amounts due and payable by the Company to the Government. Balances due from the Government at December 31 represent amounts to be settled through offset against tax payments.
(p) Cash and cash equivalentsCash and cash equivalents includes cash on hand and in banks together with all highly liquid investments purchased with original maturities of three months or less.
(q) Treasury sharesTreasury shares are recognized as a deduction from equity at the amount of consideration paid by the Company for their acquisition, including any directly attributable transaction costs incurred.
(r) Financial liabilitiesFinancial liabilities are classified as financial liabilities at FVPL or as financial liabilities measured at amortized cost, as appropriate. Management determines the classification of its financial liabilities at initial recognition.
Saudi Aramco’s financial liabilities are:
(i) Financial liabilities at FVPLDerivative financial liabilities are categorized as held for trading unless they are designated as hedges (Note 2(l)). Derivative financial liabilities held for trading are included in current liabilities under trade and other payables with gains or losses recognized in net income. (ii) Financial liabilities at amortized costFinancial liabilities other than financial liabilities at FVPL are classified as financial liabilities measured at amortized cost net of transaction costs. Such financial liabilities are initially recognized at fair value and subsequently measured at amortized cost using the effective interest method. Discounting is omitted when the effect is immaterial. Financial liabilities measured at amortized cost are included in current liabilities, except for those with maturities greater than 12 months after the end of the reporting period, which are classified as non-current liabilities.
Financial liabilities at amortized cost include trade and other payables and borrowings. Financial liabilities are disclosed separately from financial assets in the Consolidated Balance Sheet unless there is a right to offset.
(s) Borrowing costsAny difference between borrowing proceeds and the redemption value is recognized as finance costs in the Consolidated Statement of Income over the term of the borrowing using the effective interest method.
Borrowing costs are expensed as incurred except for those costs directly attributable to the acquisition, construction or production of a qualifying asset which are capitalized as part of the cost of that asset until the asset is complete for its intended use or sale. Qualifying assets are assets that necessarily take a substantial period of time to get ready for intended use or sale.
(t) Post-employment benefit plans(i) Pension plansFunded pension plans are non-contributory plans for the majority of employees and are generally funded by payments by Saudi Aramco and where applicable by group companies to independent trusts or other separate entities. Assets held by the independent trusts and other separate entities are held at their fair value. Valuations of both funded and unfunded plans are performed annually by independent actuaries using the projected unit credit method. The valuations take into account employees’ years of service, average or final pensionable remuneration, and are discounted to their present value using interest rates of high-quality corporate bonds that have terms to maturity approximating the terms of the related defined benefit obligation.
All amounts in millions of Saudi Riyals unless otherwise stated25
Saud
i Ara
bian
Oil
Com
pany
| C
onso
lidat
ed fi
nanc
ial s
tate
men
ts f
or th
e ye
ar e
nded
Dec
embe
r 31
, 202
0

2. Summary of significant accounting policies, judgments and estimates continuedThe amount recognized in the Consolidated Balance Sheet in respect of defined benefit pension plans is the present value of the defined benefit obligation at the end of the reporting period less the fair value of plan assets. The periodic pension cost included in operating costs in the Consolidated Statement of Income in respect of defined benefit pension plans primarily represents the increase in the actuarially assessed present value of the obligation for pension benefits based on employee service during the year and the net interest on the net defined benefit liability or asset. Net interest is calculated by multiplying the defined benefit liability and plan assets by the discount rate applied to each plan at the beginning of each year, amended for changes to the defined benefit liability and plan assets as a result of benefit payments or contributions.
Past service costs, representing plan amendments, are recognized immediately as pension costs in the Consolidated Statement of Income, regardless of the remaining vesting period.
Remeasurements representing actuarial gains and losses, arising from experience adjustments and changes in actuarial assumptions, and the actual returns on plan assets excluding interest on plan assets, are credited or charged to equity, net of tax, through other comprehensive income.
For defined contribution plans where benefits depend solely on the amount contributed to or due to the employee’s account and the returns earned from the investment of those contributions, plan cost is the amount contributed by or due from Saudi Aramco and is recognized as an expense in the Consolidated Statement of Income.
(ii) Other post-employment benefitsSaudi Aramco provides certain post-employment healthcare, life insurance and other benefits to retirees and certain former employees. The entitlement is usually based on the employee remaining in service up to retirement age and the completion of a minimum service period. To the extent these plans are not fully funded, a liability is recognized in the Consolidated Balance Sheet. Valuations of benefits are performed by independent actuaries.
Such plans follow the same accounting methodology as used for defined benefit pension plans. Significant accounting judgments and estimatesThe costs of defined benefit pension plans and post-employment medical benefits are determined using actuarial valuations. The actuarial valuation involves making assumptions, which are reviewed annually. Key assumptions include discount rates, future salary increases, future healthcare costs, mortality rates and future pension increases. Due to the complexity of the valuation, the underlying assumptions and the long-term nature of these plans, such estimates are subject to significant uncertainty. Information about amounts reported in respect of defined benefit plans, assumptions applicable to the plans and their sensitivity to changes are presented in Note 22.
(u) Share-based compensationThe cost of an equity-settled award granted to employees is measured by reference to the fair value of the equity instrument on the date the award is granted. This cost is recognized as an employee benefit expense in the income statement with a corresponding increase in equity.
The cost of a cash-settled award granted to employees is measured by reference to the fair value of the liability at each balance sheet date until settlement. This cost is recognized as an employee benefit expense in the income statement with the corresponding recognition of a liability on the balance sheet.
The cost of both the equity-settled and cash-settled awards is recognized over the vesting period, which is the period over which the employees render the required service for the award and any non-market performance condition attached to the award is required to be met. Additionally, for a cash-settled award, any changes in the fair value of the liability between the vesting date and the date of its settlement are also recognized in the income statement within employee benefit expense.
In determining the fair value of an equity-settled or cash-settled award, an appropriate valuation method is applied. Service and non-market performance conditions are not taken into account in determining the fair value of the award, but during the vesting period the likelihood of the conditions being met is assessed as part of the Company’s best estimate of the number of awards that are expected to vest. Any market performance conditions and non-vesting conditions are taken into account in determining the award’s fair value.
(v) Provisions and contingenciesProvisions are liabilities where the timing or amount of future expenditures is uncertain. Provisions are recognized when Saudi Aramco has a present legal or constructive obligation as a result of past events, it is probable that an outflow of economic resources will be required to settle the obligation and the amount can be reliably estimated.
All amounts in millions of Saudi Riyals unless otherwise stated26
Saud
i Ara
bian
Oil
Com
pany
| C
onso
lidat
ed fi
nanc
ial s
tate
men
ts f
or th
e ye
ar e
nded
Dec
embe
r 31
, 202
0
2. Summary of significant accounting policies, judgments and estimates continuedProvisions are recorded at the best estimate of the present value of the expenditure required to settle the obligation at the end of the reporting period. Amounts are discounted, unless the effect of discounting is immaterial, using an appropriate discount rate that reflects the current market assessments of the time value of money and the risks specific to the obligation. The increase in the provision due to the passage of time is recognized as interest expense within finance costs in the Consolidated Statement of Income.
Saudi Aramco records a provision and a corresponding asset for decommissioning activities in Upstream operations for well plugging and abandonment activities. The obligation for a well is recognized when it is drilled. Decommissioning provisions associated with Downstream facilities are generally not recognized, as the potential obligations cannot be measured, given their indeterminate settlement dates. The liability for decommissioning obligations will be recognized in the period when sufficient information becomes available to estimate a range of potential settlement dates. Decommissioning costs are provided for at the present value of expected costs to settle the obligation using estimated cash flows. The value of the obligation is added to the carrying amount of the related asset and amortized over the useful life of the asset. The increase in the provision due to the passage of time is recognized as finance costs in the Consolidated Statement of Income. Changes in future cash flow estimates resulting from revisions to the estimated timing or amount of undiscounted cash flows are recognized as a change in provision and related asset.
A contingent liability is disclosed where the existence of a possible obligation will only be confirmed by future events or where the amount of a present obligation cannot be measured with reasonable reliability or it is not probable that there will be an outflow of resources to settle that obligation. Contingent assets are not recognized, but are disclosed where the inflow of economic benefits is probable.
Significant accounting judgments and estimatesMost of Saudi Aramco’s well plugging and abandonment activities are many years into the future with technology and costs constantly changing. Estimates of the amounts of a provision are recognized based on current legal and constructive requirements and costs associated to abandon using existing technologies. Actual costs are uncertain and estimates can vary as a result of changes in the scope of the project and/or relevant laws and regulation. The estimated timing of decommissioning may change due to certain factors, such as reserve life, a decision to terminate operations, or changes in legislation. Changes to estimates related to future expected costs, discount rates and timing may have a material impact on the amounts presented. As a result, significant judgment is applied in the initial recognition and subsequent adjustment of the provision and the capitalized cost associated with decommissioning, plugging and abandonment obligations. Any subsequent adjustments to the provision are made prospectively. Detail on the particular assumptions applied when making certain non-current provisions is included in Note 23.
(w) Foreign currency translationThe USD is the functional currency of the Company and most of its subsidiaries. Foreign currency transactions are translated into the functional currency using the exchange rates prevailing at the dates of the transactions. Any foreign currency monetary assets or liabilities are translated at each reporting date using the prevailing reporting date exchange rate. Foreign exchange gains and losses resulting from the settlement of such transactions and from the translation of monetary assets and liabilities denominated in foreign currencies are recognized as a component of net income. Non-monetary assets and liabilities, other than those measured at fair value, are translated using the exchange rate at the date of the transactions.
Significant accounting judgments and estimatesThe Company has determined that USD is the functional currency as a substantial amount of its products are traded in USD in international markets. However, a substantial amount of costs of the Company are denominated in SAR which has been exchanged at a fixed rate to USD since 1986. A change in the fixed exchange rate could impact the recorded revenue, expenses, assets and liabilities of the Company.
(x) Presentation currencyThe consolidated financial statements are presented in SAR. The financial position and results of the operations of the Company, subsidiaries, joint arrangements and associates that have a functional currency which is different from the presentation currency are translated at reporting date exchange rates and the average exchange rates that approximate the cumulative effect of rates prevailing at the transaction dates, respectively. All resulting exchange differences are recognized through other comprehensive income. On disposal of a foreign operation, the component of other comprehensive income relating to that foreign operation is recognized in net income.
Any goodwill arising on the acquisition of a foreign operation and any fair value adjustments to the carrying amounts of assets and liabilities arising on the acquisition are treated as assets and liabilities of the foreign operation and translated at the spot rate of exchange at the reporting date.
Translations from SAR to USD presented as supplementary information in the Consolidated Statement of Income, Consolidated Statement of Comprehensive Income, Consolidated Balance Sheet, Consolidated Statement of Changes in Equity, and Consolidated Statement of Cash Flows at December 31, 2020 and 2019, are for convenience and were calculated at the rate of USD 1.00 = SAR 3.75 representing the exchange rate at the balance sheet dates.
All amounts in millions of Saudi Riyals unless otherwise stated27
Saud
i Ara
bian
Oil
Com
pany
| C
onso
lidat
ed fi
nanc
ial s
tate
men
ts f
or th
e ye
ar e
nded
Dec
embe
r 31
, 202
0
2. Summary of significant accounting policies, judgments and estimates continued(y) Revenue recognition and sales pricesRevenue from sales of crude oil and related products is recognized upon the satisfaction of performance obligations, which occurs when control transfers to the customer. Control of the products is determined to be transferred to the customer when the title of crude oil and related products passes to the customer, which typically takes place when product is physically transferred into a vessel, pipe or other delivery mechanism.
Revenue contracts for crude and certain related products provide for provisional pricing at the time of shipment, with final pricing based on the average market price for a particular future period. Revenue on these contracts is recorded based on the estimate of the final price at the time control is transferred to the customer. Any difference between the estimate and the final price is recorded as a change in fair value of the related receivable, as part of revenue, in the Consolidated Statement of Income. Where applicable the transaction price is allocated to the individual performance obligations of a contract based on their relative stand-alone selling prices.
(z) Other income related to salesThe Government compensates the Company through price equalization for revenue directly forgone as a result of the Company’s compliance with local regulations governing domestic sales and distribution of certain liquid products, LPG and other products (Note 2(b)(ii)). This compensation reflected in these consolidated financial statements, is calculated by the Company as the difference between the product’s equalization price and the corresponding domestic regulated price, net of Government fees, in accordance with the implementing regulations issued by the Government in 2017 and 2019.
This compensation is recorded as other income related to sales, that is taxable, when the Company has satisfied its performance obligations through transfer of the title to the buyer, which occurs when product is physically transferred. The compensation due from the Government is characterized as a due from the Government (Note 2(o)) current receivable and is recognized initially at fair value and subsequently measured at amortized cost using the effective interest rate method less impairment losses, if any.
The implementing regulations allow the Company to offset any amounts due from the Government against payment of taxes, and in the event of insufficiency of tax balances, offsetting may extend against any other amounts due and payable by the Company to the Government.
(aa) Production royaltiesRoyalties to the Government are calculated based on a progressive scheme applied to crude oil and condensate production. An effective royalty rate is applied to production based on the Company’s official selling prices. The effective royalty rate is determined based on a baseline marginal rate of 15% applied to prices up to $70 per barrel, increasing to 45% applied to prices above $70 per barrel and 80% applied to prices above $100 per barrel (Note 2(b)(i)). All such royalties are accounted for as an expense in the Consolidated Statement of Income and are deductible costs for Government income tax calculations.
(bb) Research and developmentDevelopment costs that are expected to generate probable future economic benefits are capitalized as intangible assets and amortized over their estimated useful life. During the period of development, the asset is tested for impairment annually. All other research and development costs are recognized in net income as incurred.
(cc) DividendsProvision is made for the amount of any dividend declared, being appropriately authorized and no longer at the discretion of the Company, on or before the end of the reporting period but not distributed at the end of the reporting period.
(dd) Earnings per share(i) Basic earnings per shareBasic earnings per share is calculated by dividing:
• the net income attributable to the ordinary shareholder of the Company;
• by the weighted average number of ordinary shares outstanding during the reporting period, adjusted for bonus elements in ordinary shares issued during the period and excluding treasury shares.
(ii) Diluted earnings per shareDiluted earnings per share adjusts the figures used in the determination of basic earnings per share to take into account:
• the after income tax effect of interest and other financing costs associated with dilutive potential ordinary shares; and
• the weighted average number of additional ordinary shares that would have been outstanding assuming the conversion of all dilutive potential ordinary shares.
All amounts in millions of Saudi Riyals unless otherwise stated28
Saud
i Ara
bian
Oil
Com
pany
| C
onso
lidat
ed fi
nanc
ial s
tate
men
ts f
or th
e ye
ar e
nded
Dec
embe
r 31
, 202
0

3. Financial risk managementSaudi Aramco operates internationally but has limited exposure to financial risks. Financial risks include market risk (including foreign currency exchange risk, price risk, and interest rate risk), credit risk, and liquidity risk. Financial risk management is carried out primarily by a central treasury department. The adequacy of financial risk management policies is regularly reviewed with consideration of current activities and market conditions on a consolidated basis. Saudi Aramco uses derivative financial instruments with limited complexity to manage certain risk exposures and does not enter into or trade financial instruments, including derivative financial instruments, for speculative purposes.
(a) Financial risk factors(i) Market risk1) Foreign currency exchange risk – The risk that the fair value or future cash flows of a financial instrument will fluctuate due to changes in foreign currency exchange rates.
Saudi Aramco operates internationally but has limited exposure to financial risk due to changes in foreign currency exchange rates as most significant transactions are denominated in its functional currency (Note 2(w)), are linked to its functional currency or are hedged. Saudi Aramco’s limited foreign currency exchange risk arises from future commercial transactions or recognized assets or liabilities denominated in a currency that is not Saudi Aramco’s functional currency. In addition, a substantial amount of costs of Saudi Aramco are denominated in SAR which has been at a fixed rate to USD since 1986. A change in the fixed exchange rate would result in foreign exchange differences being recognized in the consolidated financial statements.
Saudi Aramco engages foreign currency hedging activities through the use of currency forward contracts to manage its exchange exposure from significant transactions denominated in a foreign currency. The hedge ratio considers variability in potential outcomes, spot rates, as well as interest rates, and on a transaction by transaction basis, can cover up to 100% of the exposure at inception.
The notional amounts of outstanding currency forward contracts designated as hedging instruments are included in Note 31.
2) Price risk – The risk that the fair value or future cash flows of a financial instrument will fluctuate because of changes in market prices. Price risk primarily stems from investments in securities and commodity trading.
a) Investments in securitiesSaudi Aramco has limited exposure to price risk with such risk arising from investments in securities carried at fair value.
Saudi Aramco regularly reviews its positions in investments in securities considering current and expected future economic trends.
At December 31, 2020 and 2019, a change in fair value due to a movement of 5% in the price of listed equity securities would result in a change in other comprehensive income before income taxes of SAR 403 and SAR 412, respectively.
At December 31, 2020 and 2019, a change in fair value due to a movement of 5% in the unit price of equities and mutual and hedge funds would result in a change in income before income taxes of SAR 124 and SAR 173, respectively.
b) Commodity swapsSaudi Aramco trades refined, natural gas liquid, and bulk petrochemical products and uses commodity swaps as a means of managing price and timing of risks arising from this trading. In effecting these transactions, Saudi Aramco operates within policies and procedures designed to ensure that risks, including those related to the default of counterparties, are managed within authorized limits. The notional amounts of outstanding commodity swap contracts are included in Note 31. 3) Interest rate risk – The risk that the fair value or future cash flows of a financial instrument will fluctuate because of changes in market interest rates.
Saudi Aramco is exposed to interest rate risk from changes in interest rates that affect the fair value or future cash flows of financial instruments, principally borrowings, issued at variable and fixed rates. Borrowings issued at variable rates expose Saudi Aramco to cash flow interest rate risk which is partially offset by short-term time deposits and debt securities held at variable rates. Borrowings issued at fixed rates expose Saudi Aramco to fair value interest rate risk. Saudi Aramco may enter into interest rate swap agreements as part of its overall strategy to manage the interest rate risk on its debt.
At December 31, 2020 and 2019, a change of 1% in market interest rates, with all other variables held constant, would result in a net change of SAR 696 and SAR 435, respectively, in Saudi Aramco’s income before income taxes as a result of the effect of higher or lower market interest rates.
The notional amounts of interest rate swap contracts are included in Note 31.
All amounts in millions of Saudi Riyals unless otherwise stated29
Saud
i Ara
bian
Oil
Com
pany
| C
onso
lidat
ed fi
nanc
ial s
tate
men
ts f
or th
e ye
ar e
nded
Dec
embe
r 31
, 202
0
3. Financial risk management continued(ii) Credit riskCredit risk is the risk that counterparties might not fulfill their contractual payment obligations towards an entity.
Saudi Aramco is exposed to credit risk related to its counterparties not performing or honoring their obligations which would result in financial loss. Credit risk arises from credit exposures on trade receivables as well as from cash and cash equivalents, short-term investments, debt securities, and derivatives with financial institutions. The maximum exposure to credit risk is the carrying value of these assets.
Saudi Aramco’s trade receivables arise from a global customer base which limits geographic concentrations of credit risk. Moreover, a credit risk policy is in place to ensure credit limits are extended to creditworthy counterparties and risk mitigation measures are defined and implemented accordingly. Saudi Aramco performs ongoing evaluations of its counterparties’ financial standing and takes additional measures to mitigate credit risk when considered appropriate by means of letter of credits, bank guarantees or parent company guarantees.
In addition, the credit policy limits the amount of credit exposure to any individual counterparty based on their credit rating as well as other factors. Moreover, Saudi Aramco’s investment policy limits exposure to credit risk arising from investment activities. The policy requires that cash and cash equivalents and short-term investments be invested with a diversified group of financial institutions with acceptable credit ratings. Saudi Aramco ensures that each counterparty is of an acceptable credit quality by relying on quantitative and qualitative measures compiled from internal and third party rating models. At December 31, 2020, all the short-term investments were with financial institutions assigned a long-term credit rating of “BBB” (2019: “BBB”) or above.
Employee home loans (Note 10) and debt securities are generally considered to have low credit risk based on history of default and thus the impairment provision recognized during the year based on the general approach allowed by IFRS 9, where applicable, was substantially limited to 12-month expected losses.
Saudi Aramco applies the simplified approach allowed by IFRS 9 in providing for expected credit losses for trade receivables which uses the lifetime expected credit loss provision for all trade receivables. Such credit losses have historically been nominal and the loss allowance for trade receivables (Note 13) is not material.
(iii) Liquidity riskLiquidity risk is the risk that an entity will encounter difficulty in meeting obligations associated with financial liabilities.
Saudi Aramco’s liquidity risk management includes maintaining sufficient cash and cash equivalents and ensuring the availability of incremental funding through credit facilities (Note 21). Management also monitors and forecasts Saudi Aramco’s liquidity requirements based on current and non-current expected cash flows.
Saudi Aramco invests surplus cash in current accounts, time deposits, money market deposits, government repurchase agreements, and marketable securities, choosing instruments with appropriate maturities or sufficient liquidity to meet forecasted cash flow requirements. Saudi Aramco prioritizes security and liquidity over yield.
Note 21 analyzes Saudi Aramco’s borrowings into relevant maturity groupings based on the balances associated with each contractual maturity date at the end of the reporting period.
All amounts in millions of Saudi Riyals unless otherwise stated30
Saud
i Ara
bian
Oil
Com
pany
| C
onso
lidat
ed fi
nanc
ial s
tate
men
ts f
or th
e ye
ar e
nded
Dec
embe
r 31
, 202
0
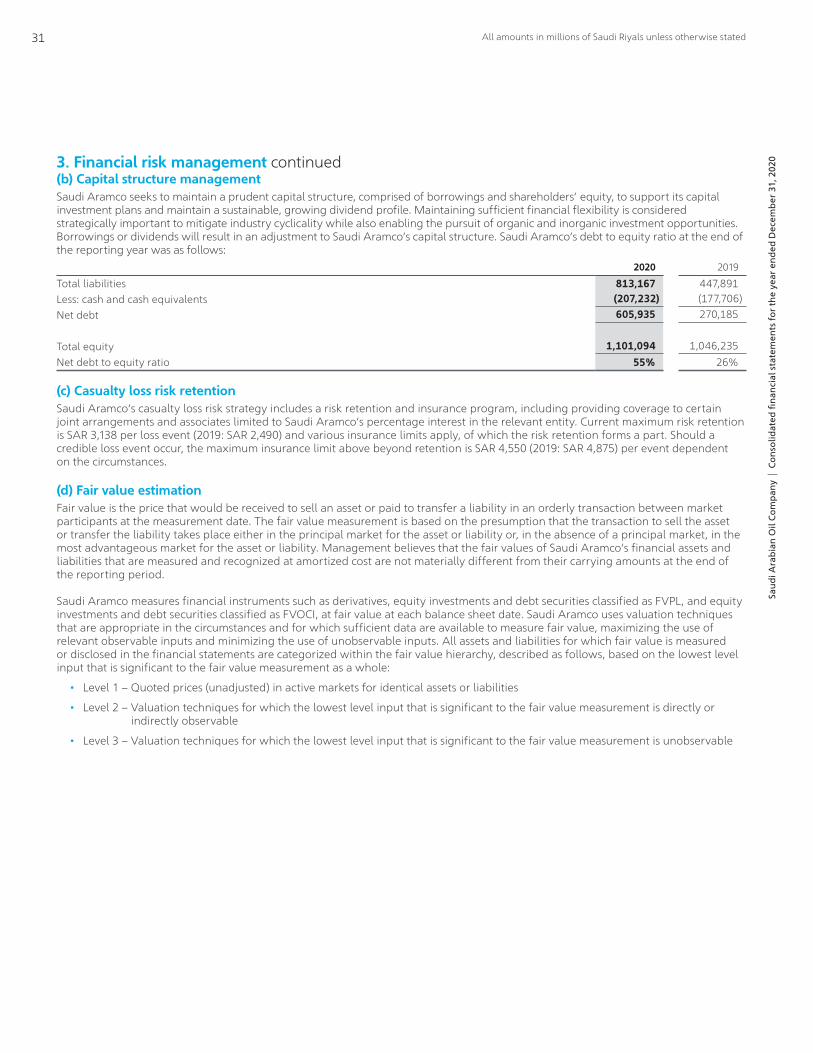
3. Financial risk management continued(b) Capital structure managementSaudi Aramco seeks to maintain a prudent capital structure, comprised of borrowings and shareholders’ equity, to support its capital investment plans and maintain a sustainable, growing dividend profile. Maintaining sufficient financial flexibility is considered strategically important to mitigate industry cyclicality while also enabling the pursuit of organic and inorganic investment opportunities. Borrowings or dividends will result in an adjustment to Saudi Aramco’s capital structure. Saudi Aramco’s debt to equity ratio at the end of the reporting year was as follows:
2020 2019
Total liabilities 813,167 447,891Less: cash and cash equivalents (207,232) (177,706)Net debt 605,935 270,185
Total equity 1,101,094 1,046,235Net debt to equity ratio 55% 26%
(c) Casualty loss risk retentionSaudi Aramco’s casualty loss risk strategy includes a risk retention and insurance program, including providing coverage to certain joint arrangements and associates limited to Saudi Aramco’s percentage interest in the relevant entity. Current maximum risk retention is SAR 3,138 per loss event (2019: SAR 2,490) and various insurance limits apply, of which the risk retention forms a part. Should a credible loss event occur, the maximum insurance limit above beyond retention is SAR 4,550 (2019: SAR 4,875) per event dependent on the circumstances.
(d) Fair value estimationFair value is the price that would be received to sell an asset or paid to transfer a liability in an orderly transaction between market participants at the measurement date. The fair value measurement is based on the presumption that the transaction to sell the asset or transfer the liability takes place either in the principal market for the asset or liability or, in the absence of a principal market, in the most advantageous market for the asset or liability. Management believes that the fair values of Saudi Aramco’s financial assets and liabilities that are measured and recognized at amortized cost are not materially different from their carrying amounts at the end of the reporting period.
Saudi Aramco measures financial instruments such as derivatives, equity investments and debt securities classified as FVPL, and equity investments and debt securities classified as FVOCI, at fair value at each balance sheet date. Saudi Aramco uses valuation techniques that are appropriate in the circumstances and for which sufficient data are available to measure fair value, maximizing the use of relevant observable inputs and minimizing the use of unobservable inputs. All assets and liabilities for which fair value is measured or disclosed in the financial statements are categorized within the fair value hierarchy, described as follows, based on the lowest level input that is significant to the fair value measurement as a whole:
• Level 1 – Quoted prices (unadjusted) in active markets for identical assets or liabilities
• Level 2 – Valuation techniques for which the lowest level input that is significant to the fair value measurement is directly or indirectly observable
• Level 3 – Valuation techniques for which the lowest level input that is significant to the fair value measurement is unobservable
All amounts in millions of Saudi Riyals unless otherwise stated31
Saud
i Ara
bian
Oil
Com
pany
| C
onso
lidat
ed fi
nanc
ial s
tate
men
ts f
or th
e ye
ar e
nded
Dec
embe
r 31
, 202
0
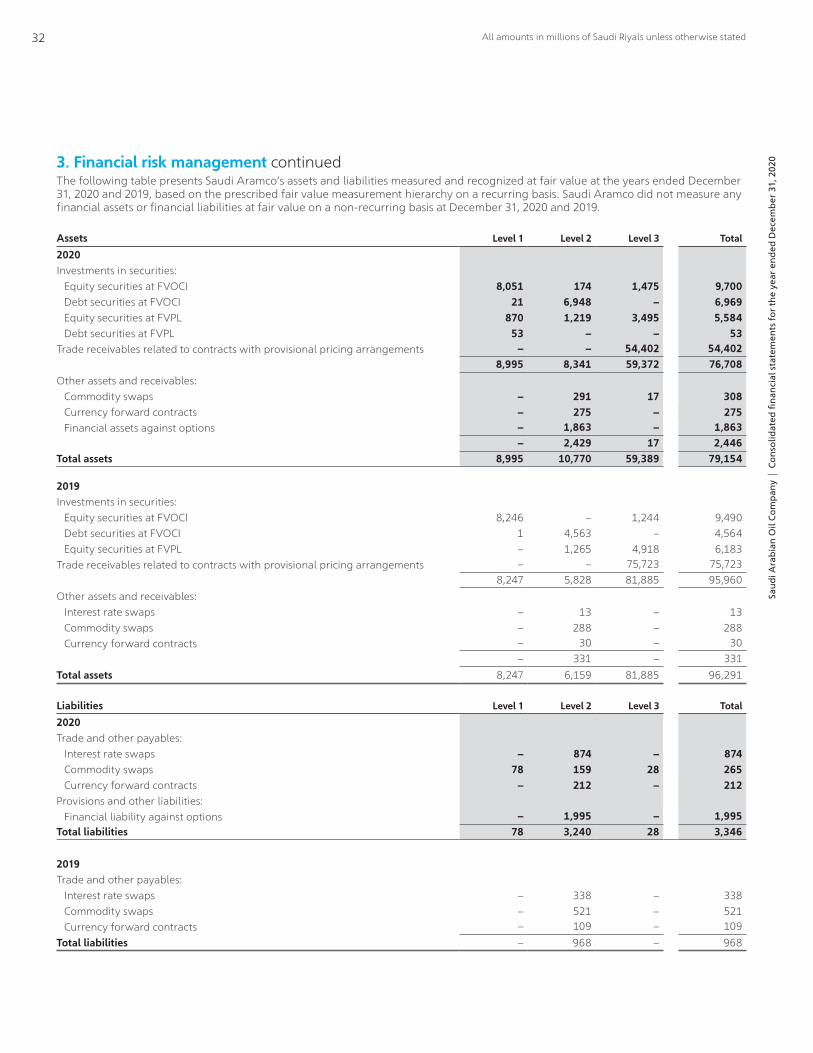
3. Financial risk management continuedThe following table presents Saudi Aramco’s assets and liabilities measured and recognized at fair value at the years ended December 31, 2020 and 2019, based on the prescribed fair value measurement hierarchy on a recurring basis. Saudi Aramco did not measure any financial assets or financial liabilities at fair value on a non-recurring basis at December 31, 2020 and 2019.
Assets Level 1 Level 2 Level 3 Total
2020Investments in securities: Equity securities at FVOCI 8,051 174 1,475 9,700 Debt securities at FVOCI 21 6,948 – 6,969 Equity securities at FVPL 870 1,219 3,495 5,584 Debt securities at FVPL 53 – – 53Trade receivables related to contracts with provisional pricing arrangements – – 54,402 54,402
8,995 8,341 59,372 76,708Other assets and receivables: Commodity swaps – 291 17 308 Currency forward contracts – 275 – 275 Financial assets against options – 1,863 – 1,863
– 2,429 17 2,446Total assets 8,995 10,770 59,389 79,154
2019Investments in securities: Equity securities at FVOCI 8,246 – 1,244 9,490 Debt securities at FVOCI 1 4,563 – 4,564 Equity securities at FVPL – 1,265 4,918 6,183Trade receivables related to contracts with provisional pricing arrangements – – 75,723 75,723
8,247 5,828 81,885 95,960Other assets and receivables: Interest rate swaps – 13 – 13 Commodity swaps – 288 – 288 Currency forward contracts – 30 – 30
– 331 – 331Total assets 8,247 6,159 81,885 96,291
Liabilities Level 1 Level 2 Level 3 Total
2020Trade and other payables: Interest rate swaps – 874 – 874 Commodity swaps 78 159 28 265 Currency forward contracts – 212 – 212Provisions and other liabilities: Financial liability against options – 1,995 – 1,995Total liabilities 78 3,240 28 3,346
2019Trade and other payables: Interest rate swaps – 338 – 338 Commodity swaps – 521 – 521 Currency forward contracts – 109 – 109Total liabilities – 968 – 968
All amounts in millions of Saudi Riyals unless otherwise stated32
Saud
i Ara
bian
Oil
Com
pany
| C
onso
lidat
ed fi
nanc
ial s
tate
men
ts f
or th
e ye
ar e
nded
Dec
embe
r 31
, 202
0

3. Financial risk management continuedThe valuation techniques for Saudi Aramco’s investments in securities are described in Note 11. The changes in Level 3 investments in securities for the years ended December 31, 2020 and 2019 are as follows:
2020 2019
January 1 6,162 5,530Acquisition 262 –Net (disposals) additions (1,681) 286Net movement in unrealized fair value (299) 296Realized gain 526 50December 31 4,970 6,162
The movement in trade receivables related to contracts with provisional pricing arrangements mainly relates to sales transactions, net of settlements, made during the period, resulting from contracts with customers (Note 13). Unrealized fair value movements on these trade receivables are not significant.
The change in commodity swaps primarily relate to purchase and sales derivative contracts including recognition of a gain or loss that results from adjusting a derivative to fair value. Fair value movements on these commodity swaps are not significant.
4. Acquisition of SABIC On June 16, 2020, the Company acquired a 70% equity interest in SABIC from the Public Investment Fund ("PIF"), for SAR 259,125 ($69,100). This equates to SAR 123.39 ($32.90) per share.
SABIC is a global diversified chemicals company headquartered in Riyadh, Saudi Arabia. SABIC manufactures on a global scale in the Americas, Europe, Middle East, and Asia Pacific, making different products, including chemicals, commodity and high-performance plastics, specialties, agri-nutrients and metals. The acquisition of the equity interest in SABIC is consistent with Saudi Aramco’s long-term Downstream strategy to grow its integrated refining and petrochemicals capacity and create value from integration across the hydrocarbon value chain.
The transaction resulted in the Company obtaining control of SABIC. The Company accounts for acquisitions of subsidiaries using the acquisition method of accounting, including those acquisitions under common control and having commercial substance. This requires recognition of the assets acquired and liabilities assumed at fair value as of the acquisition date.
Saudi Aramco has engaged an independent valuer in order to determine the fair values of the assets and liabilities of SABIC as part of the purchase price allocation. The preliminary fair values of the identifiable assets and liabilities are as follows:
Cash and cash equivalents 27,515Trade receivables 13,829Inventories 24,919Other current assets and receivables 4,803Short-term investments 8,405Property, plant and equipment (Note 6) 179,313Intangible assets (Note 7) 37,079Investments in joint ventures and associates 51,864Other non-current assets 11,598Trade and other payables (23,460)Income tax and zakat payable (4,178)Current borrowings (8,149)Non-current borrowings (37,174)Post-employment benefit obligations (16,549)Other non-current liabilities (9,067)Total identified net assets at fair value 260,748Non-controlling interests (100,739)Goodwill (Note 7) 99,116Purchase consideration in the form of promissory notes 259,125
Non-controlling interests which result from both the Company’s partial ownership of SABIC, as well as SABIC’s partial ownership of a number of its subsidiaries, were measured at their proportionate share of recognized net assets.
All amounts in millions of Saudi Riyals unless otherwise stated33
Saud
i Ara
bian
Oil
Com
pany
| C
onso
lidat
ed fi
nanc
ial s
tate
men
ts f
or th
e ye
ar e
nded
Dec
embe
r 31
, 202
0

4. Acquisition of SABIC continuedThe purchase price amount is to be paid over several installments pursuant to a seller loan provided by PIF. Loan payments, which are represented by promissory notes denominated in US Dollars, are as follows:
Principal loan amount Loan charge
On or before August 2, 2020 26,250 –On or before April 7, 2021 18,750 –On or before April 7, 2022 31,875 1,875On or before April 7, 2023 39,375 1,875On or before April 7, 2024 39,375 2,250On or before April 7, 2025 39,375 3,000On or before April 7, 2026 64,125 5,625On or before April 7, 2027 – 3,750On or before April 7, 2028 – 3,750Total purchase price and loan charges 259,125 22,125Payments during the period (26,250) –Total amount of outstanding installments 232,875 22,125
The combined fair value of the principal loan amounts and loan charges on the date of acquisition amounted to SAR 259,125 ($69,100). This is subsequently measured at amortized cost using the effective interest method and is presented on a combined basis as ‘Deferred consideration’ within ‘Borrowings’ (Note 21).
Saudi Aramco has also agreed to make an accelerated payment of SAR 11,250 ($3,000) in April 2022 based on the occurrence of certain market conditions in 2021. If the accelerated payment is made, it will reduce the principal amount that would otherwise be payable on or before April 2026 by SAR 11,250 ($3,000) and the loan charge in April 2022 will be reduced from SAR 1,875 ($500) to SAR 750 ($200).
The provisional goodwill of SAR 99,116 arising from the transaction includes synergies expected from the transaction, representing value chain capture through downstream integration, procurement, supply chain, manufacturing, marketing and sales, future customer relationships and intangibles such as acquired work force. Goodwill has been provisionally allocated to the Downstream operating segment, which is expected to benefit from the synergies of the acquisition.
Acquisition and transaction costs of SAR 343 were expensed as selling, administrative and general expenses in the Consolidated Statement of Income.
SABIC contributed revenues of SAR 64,659 and net loss of SAR 2,426 to Saudi Aramco for the period from June 16, 2020 to December 31, 2020. If the acquisition had occurred on January 1, 2020, management estimates that consolidated pro-forma revenue and net income for the year ended December 31, 2020 would have been SAR 809,204 and SAR 179,168, respectively. These amounts have been calculated using SABIC’s results and adjusting them mainly for depreciation, amortization and unwinding adjustments that would have been recorded assuming the acquisition-date fair value adjustments had applied from January 1, 2020.
5. Operating segmentsSaudi Aramco is engaged in prospecting, exploring, drilling, extracting, processing, manufacturing, refining and marketing hydrocarbon substances within the Kingdom and has interests in refining, petrochemical, distribution, marketing and storage facilities outside the Kingdom.
Saudi Aramco’s operating segments are established on the basis of those components that are evaluated regularly by the CEO, considered to be the Chief Operating Decision Maker. The Chief Operating Decision Maker monitors the operating results of Saudi Aramco’s operating segments separately for the purpose of making decisions about resource allocation and performance assessment. Segment performance is evaluated based on revenues, costs and a broad range of key performance indicators in addition to segment profitability.
For management purposes, Saudi Aramco is organized into business units based on the main types of activities. At December 31, 2020, Saudi Aramco had two reportable segments, Upstream and Downstream, with all other supporting functions aggregated into a Corporate segment. Upstream activities include crude oil, natural gas and natural gas liquids exploration, field development and production. Downstream activities, which now include SABIC’s operations from the date of acquisition, consist primarily of refining and petrochemical manufacturing, supply and trading, distribution and power generation, logistics, and marketing of crude oil and related services to international and domestic customers. Corporate activities include primarily supporting services including Human Resources, Finance and IT not allocated to Upstream and Downstream. Transfer prices between operating segments are on an arm’s length basis in a manner similar to transactions with third parties.
All amounts in millions of Saudi Riyals unless otherwise stated34
Saud
i Ara
bian
Oil
Com
pany
| C
onso
lidat
ed fi
nanc
ial s
tate
men
ts f
or th
e ye
ar e
nded
Dec
embe
r 31
, 202
0
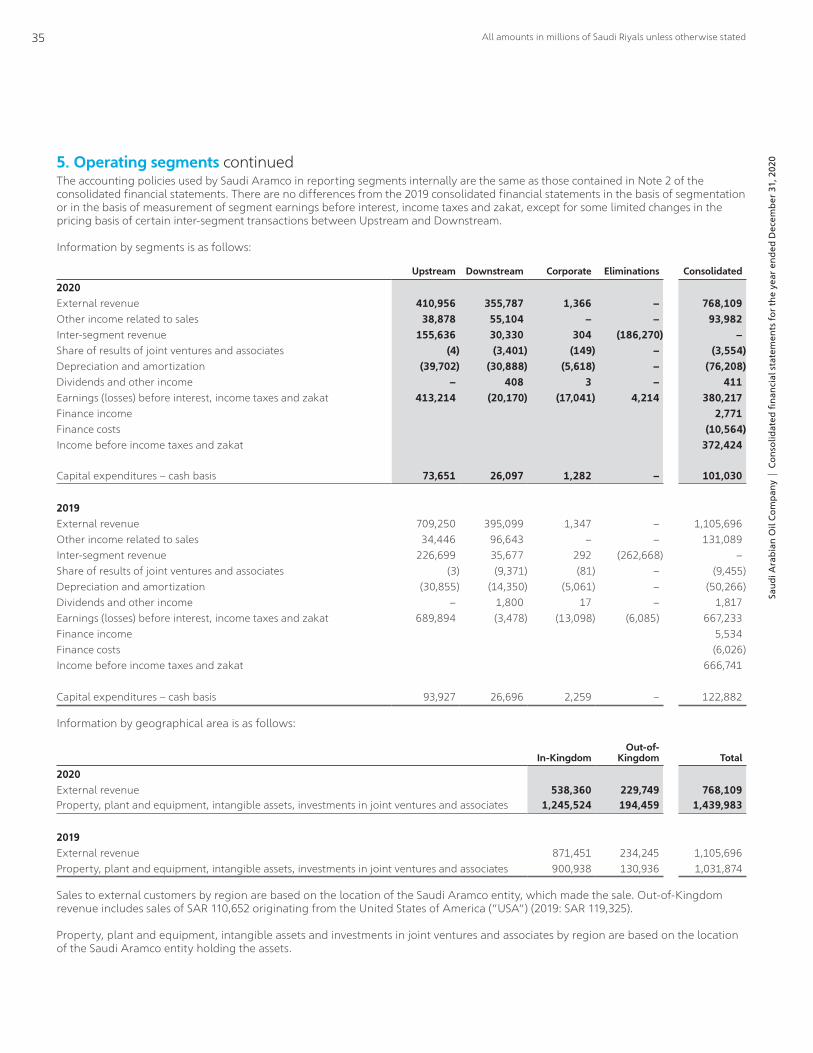
5. Operating segments continuedThe accounting policies used by Saudi Aramco in reporting segments internally are the same as those contained in Note 2 of the consolidated financial statements. There are no differences from the 2019 consolidated financial statements in the basis of segmentation or in the basis of measurement of segment earnings before interest, income taxes and zakat, except for some limited changes in the pricing basis of certain inter-segment transactions between Upstream and Downstream.
Information by segments is as follows:
Upstream Downstream Corporate Eliminations Consolidated
2020External revenue 410,956 355,787 1,366 – 768,109Other income related to sales 38,878 55,104 – – 93,982Inter-segment revenue 155,636 30,330 304 (186,270) –Share of results of joint ventures and associates (4) (3,401) (149) – (3,554)Depreciation and amortization (39,702) (30,888) (5,618) – (76,208)Dividends and other income – 408 3 – 411Earnings (losses) before interest, income taxes and zakat 413,214 (20,170) (17,041) 4,214 380,217Finance income 2,771Finance costs (10,564)Income before income taxes and zakat 372,424
Capital expenditures – cash basis 73,651 26,097 1,282 – 101,030
2019External revenue 709,250 395,099 1,347 – 1,105,696Other income related to sales 34,446 96,643 – – 131,089Inter-segment revenue 226,699 35,677 292 (262,668) –Share of results of joint ventures and associates (3) (9,371) (81) – (9,455)Depreciation and amortization (30,855) (14,350) (5,061) – (50,266)Dividends and other income – 1,800 17 – 1,817Earnings (losses) before interest, income taxes and zakat 689,894 (3,478) (13,098) (6,085) 667,233Finance income 5,534Finance costs (6,026)Income before income taxes and zakat 666,741
Capital expenditures – cash basis 93,927 26,696 2,259 – 122,882
Information by geographical area is as follows:
In-KingdomOut-of-
Kingdom Total
2020External revenue 538,360 229,749 768,109Property, plant and equipment, intangible assets, investments in joint ventures and associates 1,245,524 194,459 1,439,983
2019External revenue 871,451 234,245 1,105,696Property, plant and equipment, intangible assets, investments in joint ventures and associates 900,938 130,936 1,031,874
Sales to external customers by region are based on the location of the Saudi Aramco entity, which made the sale. Out-of-Kingdom revenue includes sales of SAR 110,652 originating from the United States of America (“USA”) (2019: SAR 119,325).
Property, plant and equipment, intangible assets and investments in joint ventures and associates by region are based on the location of the Saudi Aramco entity holding the assets.
All amounts in millions of Saudi Riyals unless otherwise stated35
Saud
i Ara
bian
Oil
Com
pany
| C
onso
lidat
ed fi
nanc
ial s
tate
men
ts f
or th
e ye
ar e
nded
Dec
embe
r 31
, 202
0

6. Property, plant and equipment
Crude oil facilities
Refinery and petrochemical
facilitiesGas and NGL
facilitiesGeneral
service plantConstruction-
in-progress Total
CostJanuary 1, 2020 537,299 231,049 396,400 108,582 291,482 1,564,812Additions1 8,965 4,881 484 6,144 102,024 122,498Acquisition (Note 4) – 150,889 – – 28,424 179,313Construction completed 67,333 24,853 58,232 28,937 (179,355) –Currency translation differences – 7,158 – (2) 816 7,972Transfers and adjustments2 (17) 9 40 (724) (1,922) (2,614)Transfer of exploration and evaluation assets – – – – 1,102 1,102Retirements and sales (1,717) (4,900) (362) (3,509) (121) (10,609)December 31, 2020 611,863 413,939 454,794 139,428 242,450 1,862,474
Accumulated depreciationJanuary 1, 2020 (271,105) (78,033) (174,300) (59,360) – (582,798)Charge for the year (23,910) (23,189) (17,476) (8,135) – (72,710)Currency translation differences – (4,568) – – – (4,568)Transfers and adjustments 9 (215) 32 (47) – (221)Retirements and sales 699 4,572 345 1,667 – 7,283December 31, 2020 (294,307) (101,433) (191,399) (65,875) – (653,014)Property, plant and equipment – net, December 31, 2020 317,556 312,506 263,395 73,553 242,450 1,209,460
CostJanuary 1, 2019 503,281 205,233 361,141 88,482 257,607 1,415,744Adjustment for change in accounting policy 6,337 8,005 254 11,455 – 26,051Additions1 4,929 3,545 164 2,559 110,995 122,192Acquisitions (Note 35) – 10,395 – – 1,329 11,724Derecognition on acquisition of joint operation (Note 35(a)(i)) – (5,240) – – (977) (6,217)Construction completed 25,517 12,764 34,647 6,865 (79,793) –Currency translation differences – (1,892) – – (98) (1,990)Transfers and adjustments (646) 513 307 (23) 300 451Transfer of exploration and evaluation assets – – – – 2,119 2,119Retirements and sales (2,119) (2,274) (113) (756) – (5,262)December 31, 2019 537,299 231,049 396,400 108,582 291,482 1,564,812
Accumulated depreciationJanuary 1, 2019 (253,544) (74,438) (160,220) (53,715) – (541,917)Charge for the year (18,729) (10,213) (13,828) (6,370) – (49,140)Derecognition on acquisition of joint operation (Note 35(a)(i)) – 4,231 – – – 4,231Currency translation differences – 659 – – – 659Transfers and adjustments (25) (510) (354) 18 – (871)Retirements and sales 1,193 2,238 102 707 – 4,240December 31, 2019 (271,105) (78,033) (174,300) (59,360) – (582,798)Property, plant and equipment – net, December 31, 2019 266,194 153,016 222,100 49,222 291,482 982,014
1. Borrowing cost capitalized during the year ended December 31, 2020, amounted to SAR 1,316 (2019: SAR 1,443).2. Saudi Aramco recognized write-down of SAR 2,631 on certain downstream facilities, including a facility under construction of SAR 1,741.
All amounts in millions of Saudi Riyals unless otherwise stated36
Saud
i Ara
bian
Oil
Com
pany
| C
onso
lidat
ed fi
nanc
ial s
tate
men
ts f
or th
e ye
ar e
nded
Dec
embe
r 31
, 202
0

6. Property, plant and equipment continuedAdditions to right-of-use assets during the year ended December 31, 2020 were SAR 16,278 (2019: SAR 9,670). Acquisition of right-of-use assets during the year ended December 31, 2020 were SAR 7,003 (2019: SAR 207). The following table presents depreciation charges and carrying amounts of right-of-use assets by class of assets.
Depreciation expense for
the year ended
December 31, 2020
Net carrying amount at
December 31, 2020
Depreciation expense for
the year ended
December 31, 2019
Net carrying amount at
December 31, 2019
Crude oil facilities 3,624 11,163 2,591 8,202Refinery and petrochemical facilities 2,597 17,336 1,276 10,045Gas and NGL facilities 163 395 178 190General service plant 4,118 24,844 3,634 22,222
10,502 53,738 7,679 40,659
7. Intangible assets
Goodwill
Exploration and
evaluation1Brands and trademarks
Franchise/ customer
relationshipsComputer software Other2 Total
CostJanuary 1, 2020 1,077 21,913 4,791 1,764 4,428 1,680 35,653Additions – 3,894 – – 226 197 4,317Acquisition (Note 4) 99,116 – 18,215 17,985 260 619 136,195Currency translation differences 11 – 20 23 42 143 239Transfers and adjustments – (1) 51 55 142 259 506Transfer of exploration and evaluation assets – (1,102) – – – – (1,102)Retirements and write offs – (3,544) – – (33) (49) (3,626)December 31, 2020 100,204 21,160 23,077 19,827 5,065 2,849 172,182
Accumulated amortizationJanuary 1, 2020 – – (1,448) (866) (2,835) (382) (5,531)Charge for the year – – (405) (572) (437) (343) (1,757)Currency translation differences – – (11) (8) (30) (89) (138)Transfers and adjustments – – (51) (55) (1) (161) (268)Retirements and write offs – – – – 33 26 59December 31, 2020 – – (1,915) (1,501) (3,270) (949) (7,635)Intangible assets – net, December 31, 2020 100,204 21,160 21,162 18,326 1,795 1,900 164,547
1. Cash used for exploration and evaluation operating activities in 2020 was SAR 3,749 (2019: SAR 4,074) and expenditures for investing activities were SAR 3,894 (2019: SAR 8,333).2. Other intangible assets include licenses and usage rights of SAR 652 (2019: SAR 762), patents and intellectual property of SAR 629 (2019: SAR 536) and new intangible assets
recognized as a result of the acquisition of SABIC consisting of technology and licenses of SAR 619.
All amounts in millions of Saudi Riyals unless otherwise stated37
Saud
i Ara
bian
Oil
Com
pany
| C
onso
lidat
ed fi
nanc
ial s
tate
men
ts f
or th
e ye
ar e
nded
Dec
embe
r 31
, 202
0
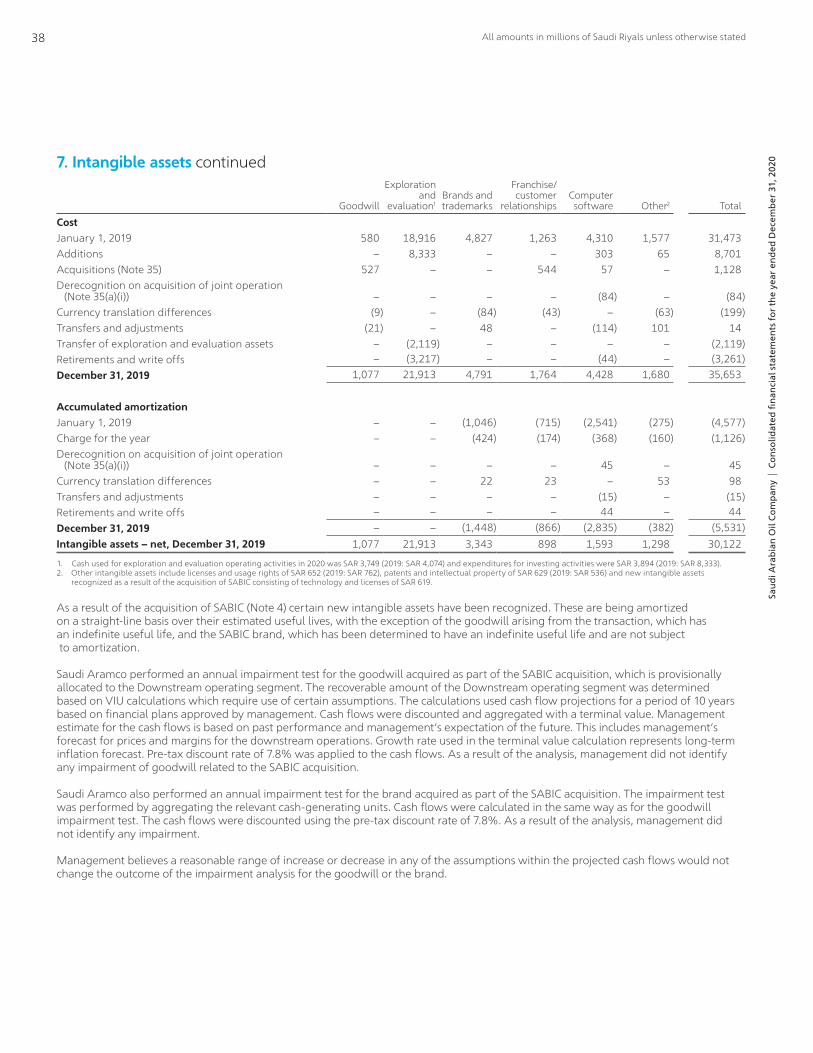
Goodwill
Exploration and
evaluation1Brands and trademarks
Franchise/ customer
relationshipsComputer software Other2 Total
CostJanuary 1, 2019 580 18,916 4,827 1,263 4,310 1,577 31,473Additions – 8,333 – – 303 65 8,701Acquisitions (Note 35) 527 – – 544 57 – 1,128Derecognition on acquisition of joint operation (Note 35(a)(i)) – – – – (84) – (84)Currency translation differences (9) – (84) (43) – (63) (199)Transfers and adjustments (21) – 48 – (114) 101 14Transfer of exploration and evaluation assets – (2,119) – – – – (2,119)Retirements and write offs – (3,217) – – (44) – (3,261)December 31, 2019 1,077 21,913 4,791 1,764 4,428 1,680 35,653
Accumulated amortizationJanuary 1, 2019 – – (1,046) (715) (2,541) (275) (4,577)Charge for the year – – (424) (174) (368) (160) (1,126)Derecognition on acquisition of joint operation (Note 35(a)(i)) – – – – 45 – 45Currency translation differences – – 22 23 – 53 98Transfers and adjustments – – – – (15) – (15)Retirements and write offs – – – – 44 – 44December 31, 2019 – – (1,448) (866) (2,835) (382) (5,531)Intangible assets – net, December 31, 2019 1,077 21,913 3,343 898 1,593 1,298 30,122
1. Cash used for exploration and evaluation operating activities in 2020 was SAR 3,749 (2019: SAR 4,074) and expenditures for investing activities were SAR 3,894 (2019: SAR 8,333).2. Other intangible assets include licenses and usage rights of SAR 652 (2019: SAR 762), patents and intellectual property of SAR 629 (2019: SAR 536) and new intangible assets
recognized as a result of the acquisition of SABIC consisting of technology and licenses of SAR 619.
As a result of the acquisition of SABIC (Note 4) certain new intangible assets have been recognized. These are being amortized on a straight-line basis over their estimated useful lives, with the exception of the goodwill arising from the transaction, which has an indefinite useful life, and the SABIC brand, which has been determined to have an indefinite useful life and are not subject to amortization.
Saudi Aramco performed an annual impairment test for the goodwill acquired as part of the SABIC acquisition, which is provisionally allocated to the Downstream operating segment. The recoverable amount of the Downstream operating segment was determined based on VIU calculations which require use of certain assumptions. The calculations used cash flow projections for a period of 10 years based on financial plans approved by management. Cash flows were discounted and aggregated with a terminal value. Management estimate for the cash flows is based on past performance and management’s expectation of the future. This includes management’s forecast for prices and margins for the downstream operations. Growth rate used in the terminal value calculation represents long-term inflation forecast. Pre-tax discount rate of 7.8% was applied to the cash flows. As a result of the analysis, management did not identify any impairment of goodwill related to the SABIC acquisition.
Saudi Aramco also performed an annual impairment test for the brand acquired as part of the SABIC acquisition. The impairment test was performed by aggregating the relevant cash-generating units. Cash flows were calculated in the same way as for the goodwill impairment test. The cash flows were discounted using the pre-tax discount rate of 7.8%. As a result of the analysis, management did not identify any impairment.
Management believes a reasonable range of increase or decrease in any of the assumptions within the projected cash flows would not change the outcome of the impairment analysis for the goodwill or the brand.
7. Intangible assets continued
All amounts in millions of Saudi Riyals unless otherwise stated38
Saud
i Ara
bian
Oil
Com
pany
| C
onso
lidat
ed fi
nanc
ial s
tate
men
ts f
or th
e ye
ar e
nded
Dec
embe
r 31
, 202
0
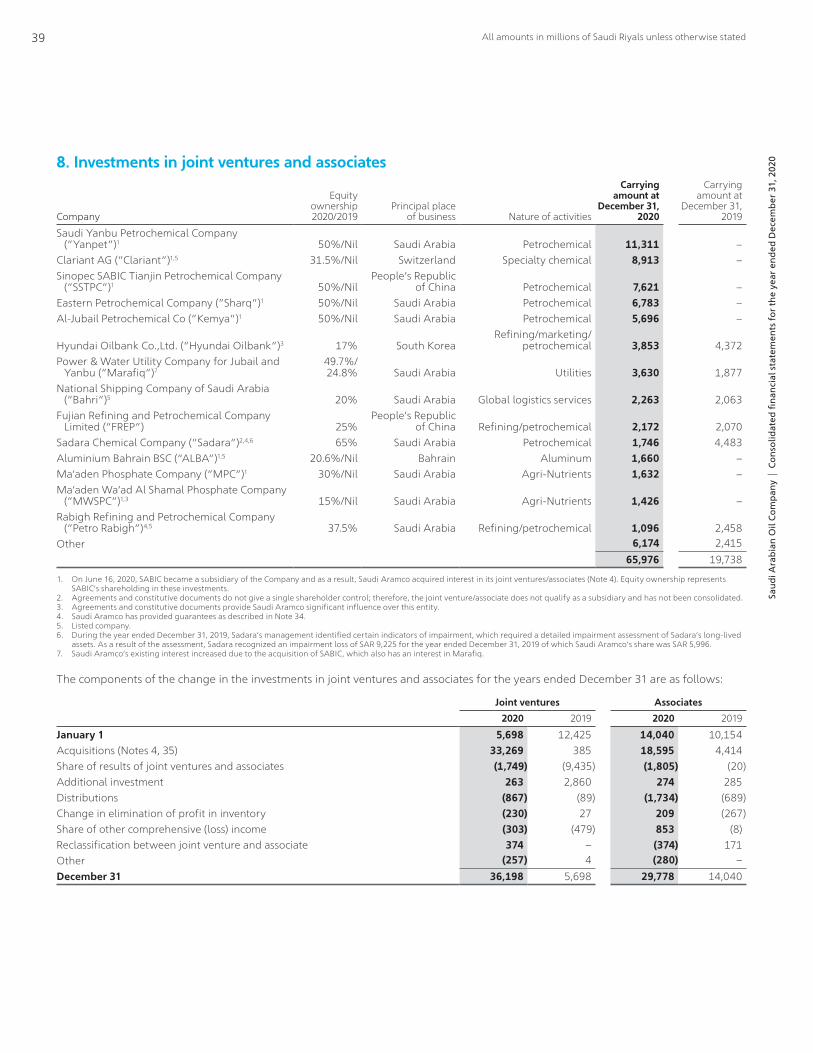
8. Investments in joint ventures and associates
Company
Equity ownership 2020/2019
Principal place of business Nature of activities
Carrying amount at
December 31, 2020
Carrying amount at
December 31, 2019
Saudi Yanbu Petrochemical Company (“Yanpet”)1 50%/Nil Saudi Arabia Petrochemical 11,311 –Clariant AG (“Clariant”)1,5 31.5%/Nil Switzerland Specialty chemical 8,913 –Sinopec SABIC Tianjin Petrochemical Company (“SSTPC”)1 50%/Nil
People’s Republic of China Petrochemical 7,621 –
Eastern Petrochemical Company (“Sharq”)1 50%/Nil Saudi Arabia Petrochemical 6,783 –Al-Jubail Petrochemical Co ("Kemya")1 50%/Nil Saudi Arabia Petrochemical 5,696 –
Hyundai Oilbank Co.,Ltd. ("Hyundai Oilbank")3 17% South KoreaRefining/marketing/
petrochemical 3,853 4,372Power & Water Utility Company for Jubail and Yanbu (“Marafiq”)7
49.7%/ 24.8% Saudi Arabia Utilities 3,630 1,877
National Shipping Company of Saudi Arabia (“Bahri”)5 20% Saudi Arabia Global logistics services 2,263 2,063Fujian Refining and Petrochemical Company Limited (“FREP”) 25%
People’s Republic of China Refining/petrochemical 2,172 2,070
Sadara Chemical Company (“Sadara”)2,4,6 65% Saudi Arabia Petrochemical 1,746 4,483Aluminium Bahrain BSC (“ALBA”)1,5 20.6%/Nil Bahrain Aluminum 1,660 –Ma’aden Phosphate Company (“MPC”)1 30%/Nil Saudi Arabia Agri-Nutrients 1,632 –Ma’aden Wa’ad Al Shamal Phosphate Company (“MWSPC”)1,3 15%/Nil Saudi Arabia Agri-Nutrients 1,426 –Rabigh Refining and Petrochemical Company (“Petro Rabigh”)4,5 37.5% Saudi Arabia Refining/petrochemical 1,096 2,458Other 6,174 2,415
65,976 19,738
1. On June 16, 2020, SABIC became a subsidiary of the Company and as a result, Saudi Aramco acquired interest in its joint ventures/associates (Note 4). Equity ownership represents SABIC’s shareholding in these investments.
2. Agreements and constitutive documents do not give a single shareholder control; therefore, the joint venture/associate does not qualify as a subsidiary and has not been consolidated.3. Agreements and constitutive documents provide Saudi Aramco significant influence over this entity.4. Saudi Aramco has provided guarantees as described in Note 34.5. Listed company.6. During the year ended December 31, 2019, Sadara’s management identified certain indicators of impairment, which required a detailed impairment assessment of Sadara’s long-lived
assets. As a result of the assessment, Sadara recognized an impairment loss of SAR 9,225 for the year ended December 31, 2019 of which Saudi Aramco’s share was SAR 5,996.7. Saudi Aramco’s existing interest increased due to the acquisition of SABIC, which also has an interest in Marafiq.
The components of the change in the investments in joint ventures and associates for the years ended December 31 are as follows:
Joint ventures Associates
2020 2019 2020 2019
January 1 5,698 12,425 14,040 10,154Acquisitions (Notes 4, 35) 33,269 385 18,595 4,414Share of results of joint ventures and associates (1,749) (9,435) (1,805) (20)Additional investment 263 2,860 274 285Distributions (867) (89) (1,734) (689)Change in elimination of profit in inventory (230) 27 209 (267)Share of other comprehensive (loss) income (303) (479) 853 (8)Reclassification between joint venture and associate 374 – (374) 171Other (257) 4 (280) –December 31 36,198 5,698 29,778 14,040
All amounts in millions of Saudi Riyals unless otherwise stated39
Saud
i Ara
bian
Oil
Com
pany
| C
onso
lidat
ed fi
nanc
ial s
tate
men
ts f
or th
e ye
ar e
nded
Dec
embe
r 31
, 202
0

8. Investments in joint ventures and associates continuedSummarized financial information (100%) for joint ventures and associates and reconciliation with the carrying amount of the investments in the consolidated financial statements at December 31, 2020, are set out below. Statement of comprehensive income is presented for the full year including for entities acquired during the year:
Summarized Balance Sheet At December 31, 2020
Yanpet1 Clariant1 SSTPC1 Sharq1 Kemya1Hyundai Oilbank Marafiq2 Bahri FREP
Current assets:Cash and cash equivalents 543 3,126 3,024 454 204 738 372 543 4,281Other 3,706 10,894 1,533 4,850 3,224 9,949 2,463 3,538 4,329Total current assets 4,249 14,020 4,557 5,304 3,428 10,687 2,835 4,081 8,610
Non-current assets 4,406 24,930 11,323 12,865 12,244 33,720 19,672 16,865 8,899
Current liabilities:Financial liabilities (excluding trade and other payables) 964 1,688 1,371 776 1,713 3,234 1,076 885 691Other 481 7,083 958 680 491 7,294 949 1,485 2,959Total current liabilities 1,445 8,771 2,329 1,456 2,204 10,528 2,025 2,370 3,650
Non-current liabilities 1,424 14,760 4,113 2,816 3,126 17,220 12,796 8,154 5,170Net assets 5,786 15,419 9,438 13,897 10,342 16,659 7,686 10,422 8,689Saudi Aramco interest 50% 31.5% 50% 50% 50% 17% 49.7% 20% 25%
Saudi Aramco share 2,893 4,857 4,719 6,949 5,171 2,832 3,814 2,084 2,172Fair value and other adjustments at Saudi Aramco level 8,418 4,056 2,902 (166) 525 1,021 (184) 179 –Investment balance at December 31 11,311 8,913 7,621 6,783 5,696 3,853 3,630 2,263 2,172
1. Saudi Aramco interest represents SABIC’s shareholding in these investments.2. Saudi Aramco’s existing interest increased due to the acquisition of SABIC, which also has an interest in Marafiq.
Summarized Statement of Comprehensive Income Year ended December 31, 2020
Yanpet Clariant SSTPC Sharq KemyaHyundai Oilbank Marafiq Bahri FREP
Revenue 5,139 15,713 6,652 6,944 6,679 32,720 3,854 9,064 21,029Depreciation and amortization 562 1,141 622 1,363 909 1,388 1,192 876 1,379Conventional interest income 5 64 105 4 2 327 11 – 64Interest expense 45 428 76 33 135 536 219 294 291Income tax expense 27 407 135 90 38 (662) 71 94 47Net income (loss) 998 (721) 410 298 672 (1,364) 319 1,787 172
Dividends received from JVs/associates 348 1,247 – 350 105 105 56 149 79
All amounts in millions of Saudi Riyals unless otherwise stated40
Saud
i Ara
bian
Oil
Com
pany
| C
onso
lidat
ed fi
nanc
ial s
tate
men
ts f
or th
e ye
ar e
nded
Dec
embe
r 31
, 202
0
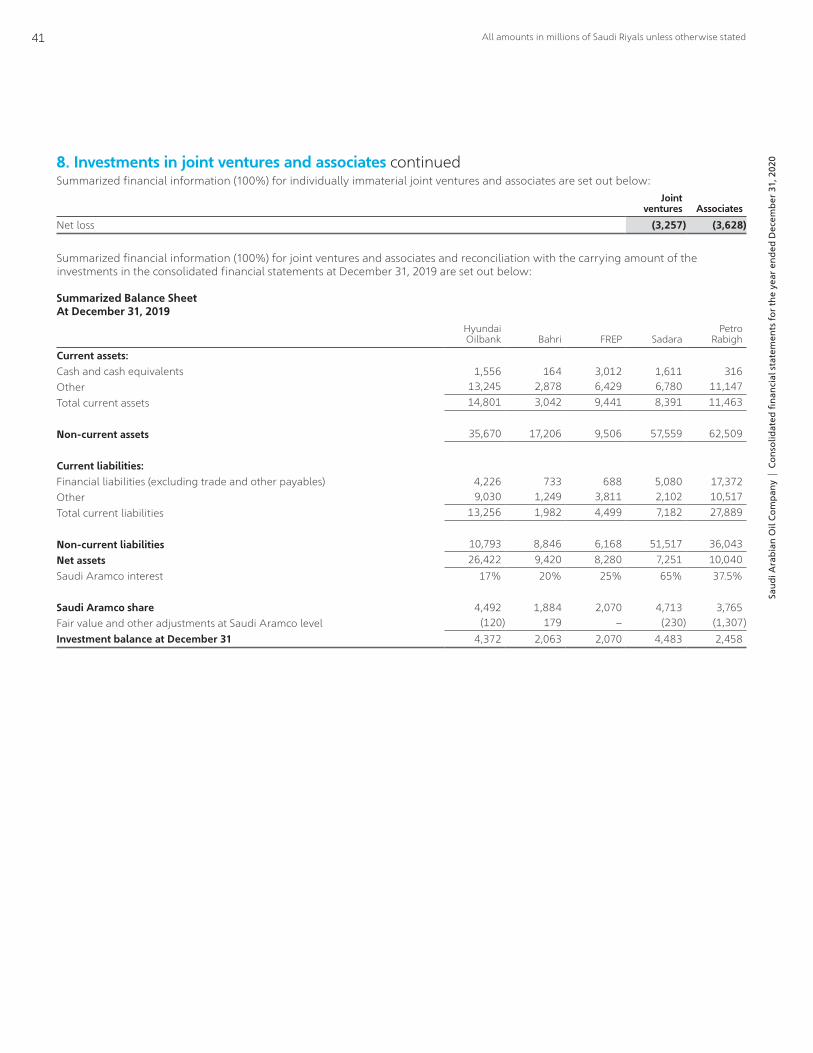
8. Investments in joint ventures and associates continuedSummarized financial information (100%) for individually immaterial joint ventures and associates are set out below:
Joint ventures Associates
Net loss (3,257) (3,628)
Summarized financial information (100%) for joint ventures and associates and reconciliation with the carrying amount of the investments in the consolidated financial statements at December 31, 2019 are set out below:
Summarized Balance SheetAt December 31, 2019
Hyundai Oilbank Bahri FREP Sadara
Petro Rabigh
Current assets:Cash and cash equivalents 1,556 164 3,012 1,611 316Other 13,245 2,878 6,429 6,780 11,147Total current assets 14,801 3,042 9,441 8,391 11,463
Non-current assets 35,670 17,206 9,506 57,559 62,509
Current liabilities:Financial liabilities (excluding trade and other payables) 4,226 733 688 5,080 17,372Other 9,030 1,249 3,811 2,102 10,517Total current liabilities 13,256 1,982 4,499 7,182 27,889
Non-current liabilities 10,793 8,846 6,168 51,517 36,043Net assets 26,422 9,420 8,280 7,251 10,040Saudi Aramco interest 17% 20% 25% 65% 37.5%
Saudi Aramco share 4,492 1,884 2,070 4,713 3,765Fair value and other adjustments at Saudi Aramco level (120) 179 – (230) (1,307)Investment balance at December 31 4,372 2,063 2,070 4,483 2,458
All amounts in millions of Saudi Riyals unless otherwise stated41
Saud
i Ara
bian
Oil
Com
pany
| C
onso
lidat
ed fi
nanc
ial s
tate
men
ts f
or th
e ye
ar e
nded
Dec
embe
r 31
, 202
0

8. Investments in joint ventures and associates continuedSummarized Statement of Comprehensive IncomeYear ended December 31, 2019
Hyundai Oilbank Bahri FREP Sadara
Petro Rabigh
Revenue 2,814 6,409 31,017 10,108 42,420Depreciation and amortization 6 933 1,381 3,850 2,973Conventional interest income 8 – 67 – 384Interest expense 29 566 325 2,448 1,225Income tax expense 12 91 107 76 225Net income (loss) 42 477 271 (14,653) (650)
Dividends received from JVs/associates – 158 390 – –
Summarized financial information (100%) for individually immaterial joint ventures and associates are set out below:
Joint ventures Associates
Net income 174 439
Saudi Aramco’s share of the fair value of the listed associates at December 31 together with their carrying value at those dates is as follows:
Fair value Carrying value
2020 2019 2020 2019
Clariant 8,380 – 8,913 –Petro Rabigh 4,540 7,115 1,096 2,458Bahri 3,193 3,150 2,263 2,063ALBA 1,450 – 1,660 –
9. Income taxes and zakat(a) Kingdom income tax ratesThe Company is subject to an income tax rate of 20% on the activities of exploration and production of non-associated natural gas, including gas condensates, as well as the collection, treatment, processing, fractionation and transportation of associated and non-associated natural gas and their liquids, gas condensates and other associated elements, and an income tax rate of 50% on all other activities, in accordance with the Tax Law.
Effective January 1, 2020, the tax rate applicable to the Company’s Downstream activities was reduced from the 50% rate applicable to qualified domestic oil and hydrocarbon production companies to the general corporate tax rate of 20% applicable to similar domestic downstream companies under the Tax Law. The new rate is conditional on the Company separating its Downstream activities under the control of one or more separate wholly owned subsidiaries before December 31, 2024, otherwise the Company’s Downstream activities will be retroactively taxed at 50%. The Company expects to transfer all its Downstream activities into a separate legal entity or entities within the period specified (Note 2(b)(iii)).
All amounts in millions of Saudi Riyals unless otherwise stated42
Saud
i Ara
bian
Oil
Com
pany
| C
onso
lidat
ed fi
nanc
ial s
tate
men
ts f
or th
e ye
ar e
nded
Dec
embe
r 31
, 202
0

9. Income taxes and zakat continuedDuring 2020, the Tax Law was amended, effective January 1, 2020, whereby shares held directly or indirectly in listed companies on the Tadawul by taxpayers engaged in oil and hydrocarbon activities are exempt from the application of corporate income tax. As a result, the Company’s ownership interests in SABIC, Petro Rabigh, Bahri and SEC are now subject to zakat (Note 2(b)(iv)).
The reconciliation of tax charge at the Kingdom statutory rates to consolidated tax and zakat expense is as follows:
2020 2019
Income before income taxes and zakat 372,424 666,741Less: Income subject to zakat (3,754) –Income subject to income tax 368,670 666,741
Income taxes at the Kingdom’s statutory tax rates 178,808 328,721
Tax effect of:Impact of change in income tax rates on deferred tax – 2,655Income not subject to tax at statutory rates and other 9,082 4,672Income tax expense 187,890 336,048Zakat expense 771 –Total income tax and zakat expense 188,661 336,048
(b) Income tax and zakat expense2020 2019
Current income tax – Kingdom 173,534 319,979Current income tax – Foreign 614 353Deferred income tax – Kingdom: Impact of change in income tax rates – 2,655 Charge for the period 16,932 12,610Deferred income tax – Foreign (3,190) 451Zakat – Kingdom 771 –
188,661 336,048
Saudi Aramco paid foreign taxes of SAR 427 and SAR 437 for the years ended December 31, 2020 and 2019, respectively.
Income tax credit recorded through other comprehensive income was SAR 9,331 for the year ended December 31, 2020 (2019: income tax expense of SAR 1,542).
(c) Income tax and zakat obligation to the Government2020 2019
January 1 62,243 70,299Acquisition 3,288 –Provided during the period 174,305 319,979Payments during the period by the Company (Note 29) (72,582) (149,780)Payments during the period by subsidiaries and joint operations (2,806) (1,023)Settlements of due from the Government (116,872) (172,301)Other settlements (5,517) (4,931)December 31 42,059 62,243
All amounts in millions of Saudi Riyals unless otherwise stated43
Saud
i Ara
bian
Oil
Com
pany
| C
onso
lidat
ed fi
nanc
ial s
tate
men
ts f
or th
e ye
ar e
nded
Dec
embe
r 31
, 202
0

9. Income taxes and zakat continued(d) Deferred income tax
2020 2019
Deferred income tax assets:Kingdom 13,749 12,386U.S. Federal and State 84 31Other foreign 1,447 311
15,280 12,728
Deferred income tax liabilities:Kingdom 48,019 37,943U.S. Federal and State 2,469 3,312Other foreign 3,133 3,216
53,621 44,471Net deferred income tax liabilities (38,341) (31,743)
The gross movement of the net deferred income tax position is as follows:2020 2019
January 1 (31,743) (14,011)Acquisition (2,176) –Impact of change in income tax rate – charge to income – (2,655)Impact of change in income tax rate – Other reserves – (284)Current period charge to income (13,742) (13,061)Adjustments to equity – Other reserves 9,331 (1,258)Other adjustments (11) (474)December 31 (38,341) (31,743)
2020 2019
Deferred income tax to be settled after more than 12 months (38,341) (31,743)Deferred income tax to be recovered within 12 months – –Net deferred income tax liabilities (38,341) (31,743)
All amounts in millions of Saudi Riyals unless otherwise stated44
Saud
i Ara
bian
Oil
Com
pany
| C
onso
lidat
ed fi
nanc
ial s
tate
men
ts f
or th
e ye
ar e
nded
Dec
embe
r 31
, 202
0

9. Income taxes and zakat continuedThe movement in deferred income tax assets (liabilities) for the years ended December 31 is as follows:
Post-employment
benefit obligations
Investment in subsidiary
Undistributed earnings
Provisions and other
Loss carry-forward
Property plant and
equipment and
intangibles
Investments in securities
at FVOCI Total
January 1, 2019 Deferred tax assets 1,873 – – 1,192 7,088 (287) – 9,866 Deferred tax liabilities 9,379 (3,632) (780) 9,060 3,357 (39,631) (1,630) (23,877)
11,252 (3,632) (780) 10,252 10,445 (39,918) (1,630) (14,011)Recognized during the year Impact of change in income tax rate (464) – – (457) – (2,198) 180 (2,939) Current period credits (charges) to income 194 (1,196) 44 2,095 3,637 (17,835) – (13,061) Impact of adoption of IFRS 16 – – – 7,906 – (7,906) – – Other reserves charges (526) – – – – – (732) (1,258) Other adjustments – – – (474) – – – (474)
(796) (1,196) 44 9,070 3,637 (27,939) (552) (17,732)December 31, 2019 Deferred tax assets 3,328 – – 653 9,263 (516) – 12,728 Deferred tax liabilities 7,128 (4,828) (736) 18,669 4,819 (67,341) (2,182) (44,471)
10,456 (4,828) (736) 19,322 14,082 (67,857) (2,182) (31,743)Recognized during the year Acquisition 631 – (86) (2,721) – – – (2,176) Current period (charges) credits to income (524) 309 35 2,869 7,595 (24,026) – (13,742) Other reserves credits 7,395 – – – – – 1,936 9,331 Other adjustments – – – (11) – – – (11)
7,502 309 (51) 137 7,595 (24,026) 1,936 (6,598)December 31, 2020 Deferred tax assets 4,301 – – 1,650 9,983 (654) – 15,280 Deferred tax liabilities 13,657 (4,519) (787) 17,809 11,694 (91,229) (246) (53,621)
17,958 (4,519) (787) 19,459 21,677 (91,883) (246) (38,341)
To reflect the change in income tax rate effective January 1, 2020 for Downstream activities, in 2019, deferred tax liabilities, net of deferred tax assets, were increased by SAR 2,939, of which SAR 2,655 was recognized as an increase of income taxes in the Consolidated Statement of Income, and SAR 284 was recognized as an increase of income taxes in the Consolidated Statement of Comprehensive Income.
A deferred income tax liability has not been recognized with regard to the undistributed earnings of certain subsidiaries, which are considered to be permanently reinvested in their respective businesses. Such earnings would be taxed only upon distribution. The cumulative amount of the undistributed earnings of such subsidiaries is SAR 29,080 and SAR 32,674 at December 31, 2020 and 2019, respectively, and the unrecognized deferred income tax liability is SAR 1,969 and SAR 3,215 at December 31, 2020 and 2019, respectively. Also, a deferred income tax asset has not been recognized with regard to cumulative unused tax losses of certain subsidiaries with carry-forward periods from 2022 to indefinite. Such losses are available for offsetting against future taxable profits of the subsidiaries in which the losses arose. The cumulative amount of the unused tax losses is SAR 32,336 and SAR 443 at December 31, 2020 and 2019, respectively, and the unrecognized deferred tax asset is SAR 7,924 and SAR 109 at December 31, 2020 and 2019, respectively.
All amounts in millions of Saudi Riyals unless otherwise stated45
Saud
i Ara
bian
Oil
Com
pany
| C
onso
lidat
ed fi
nanc
ial s
tate
men
ts f
or th
e ye
ar e
nded
Dec
embe
r 31
, 202
0
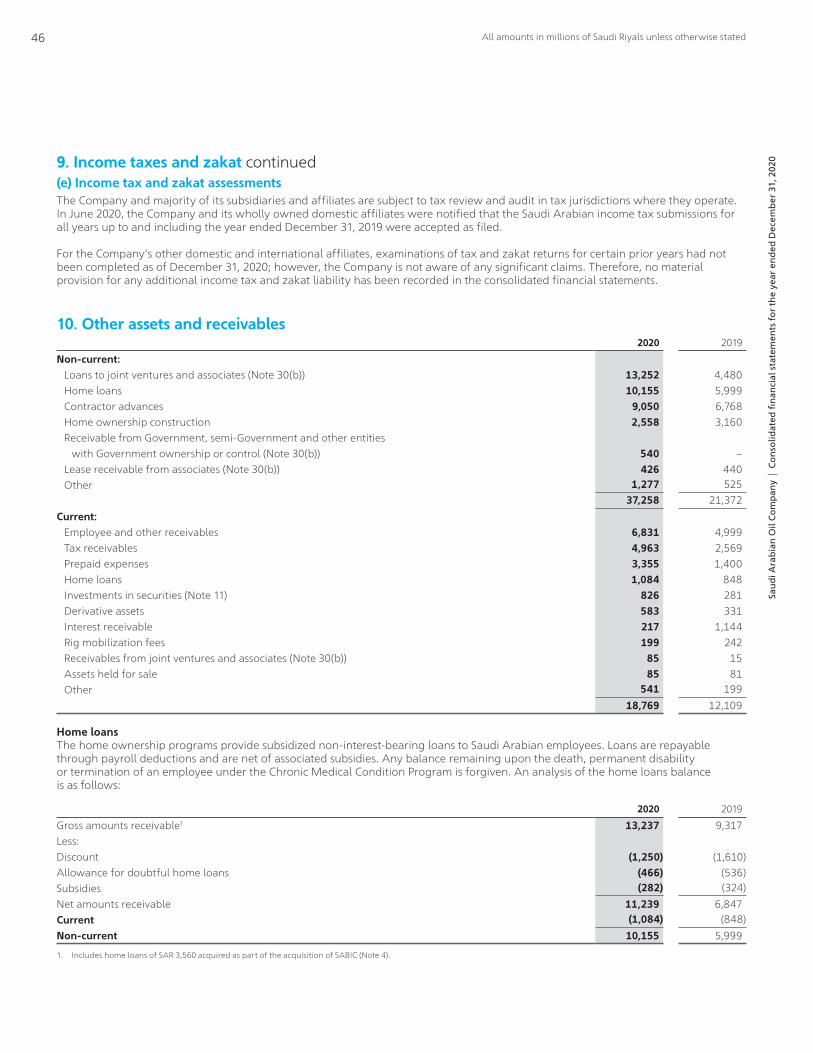
9. Income taxes and zakat continued(e) Income tax and zakat assessmentsThe Company and majority of its subsidiaries and affiliates are subject to tax review and audit in tax jurisdictions where they operate. In June 2020, the Company and its wholly owned domestic affiliates were notified that the Saudi Arabian income tax submissions for all years up to and including the year ended December 31, 2019 were accepted as filed.
For the Company’s other domestic and international affiliates, examinations of tax and zakat returns for certain prior years had not been completed as of December 31, 2020; however, the Company is not aware of any significant claims. Therefore, no material provision for any additional income tax and zakat liability has been recorded in the consolidated financial statements.
10. Other assets and receivables2020 2019
Non-current: Loans to joint ventures and associates (Note 30(b)) 13,252 4,480 Home loans 10,155 5,999 Contractor advances 9,050 6,768 Home ownership construction 2,558 3,160 Receivable from Government, semi-Government and other entities with Government ownership or control (Note 30(b)) 540 – Lease receivable from associates (Note 30(b)) 426 440 Other 1,277 525
37,258 21,372Current: Employee and other receivables 6,831 4,999 Tax receivables 4,963 2,569 Prepaid expenses 3,355 1,400 Home loans 1,084 848 Investments in securities (Note 11) 826 281 Derivative assets 583 331 Interest receivable 217 1,144 Rig mobilization fees 199 242 Receivables from joint ventures and associates (Note 30(b)) 85 15 Assets held for sale 85 81 Other 541 199
18,769 12,109
Home loansThe home ownership programs provide subsidized non-interest-bearing loans to Saudi Arabian employees. Loans are repayable through payroll deductions and are net of associated subsidies. Any balance remaining upon the death, permanent disability or termination of an employee under the Chronic Medical Condition Program is forgiven. An analysis of the home loans balance is as follows:
2020 2019
Gross amounts receivable1 13,237 9,317Less:Discount (1,250) (1,610)Allowance for doubtful home loans (466) (536)Subsidies (282) (324)Net amounts receivable 11,239 6,847Current (1,084) (848)Non-current 10,155 5,999
1. Includes home loans of SAR 3,560 acquired as part of the acquisition of SABIC (Note 4).
All amounts in millions of Saudi Riyals unless otherwise stated46
Saud
i Ara
bian
Oil
Com
pany
| C
onso
lidat
ed fi
nanc
ial s
tate
men
ts f
or th
e ye
ar e
nded
Dec
embe
r 31
, 202
0

11. Investments in securities2020 2019
January 1 20,237 17,772Acquisitions 2,470 –Net additions 789 889Net unrealized fair value gain 128 1,598Net unrealized foreign currency gain (loss) 63 (22)December 31 23,687 20,237Current (Note 10) (826) (281)Non-current 22,861 19,956
Net additions include unsettled transactions of SAR 190 at December 31, 2020 (2019: SAR 21). Investments in securities are carried at fair value.
The components of Investments in securities are as follows:2020
Percentage ownership
Carrying amount as of December 31
Equity investments at FVOCI: Equity investments – listed securities: Saudi Electricity Company (“SEC”) 6.9% 6,146 Idemitsu Kosan Co., Ltd. (“Idemitsu”) 7.8% 1,905
Equity investments – unlisted securities: Arab Petroleum Pipeline Company (“Sumed”) 15.0% 870 Industrialization & Energy Services Company (“TAQA”) 4.6% 195 Daehan Oil Pipeline Corporation (“Daehan”) 8.9% 154 Other 430
Investments in debt securities at FVOCI: USD debt securities with fixed interest rates ranging from 0.1% to 13.9% and maturity dates between January 2021 and May 2069 6,239 USD debt securities with variable interest rates and maturity dates between May 2021 and May 2069 730
16,669Equity and debt investments at FVPL: Listed securities – mutual and hedge funds 1,614 Listed securities – equities 870 Listed securities – debt 53 Unlisted securities 3,100
5,637Investments in debt securities at amortized cost: Debt securities with fixed interest rates ranging from 2.5% to 5.1% and maturity dates between 2021 and 2043 747 Debt securities with variable interest rates and maturity dates between 2021 and 2028 634
1,381
23,687Current portion (Note 10) (826)Non-current 22,861
All amounts in millions of Saudi Riyals unless otherwise stated47
Saud
i Ara
bian
Oil
Com
pany
| C
onso
lidat
ed fi
nanc
ial s
tate
men
ts f
or th
e ye
ar e
nded
Dec
embe
r 31
, 202
0

11. Investments in securities continued2019
Percentage ownership
Carrying amount as of December 31
Equity investments at FVOCI: Equity investments – listed securities: Saudi Electricity Company (“SEC”) 6.9% 5,835 Idemitsu Kosan Co., Ltd. (“Idemitsu”) 7.7% 2,411
Equity investments – unlisted securities: Arab Petroleum Pipeline Company (“Sumed”) 15.0% 817 Industrialization & Energy Services Company (“TAQA”) 4.6% 270 Daehan Oil Pipeline Corporation (“Daehan”) 8.9% 157
Investments in debt securities at FVOCI: USD debt securities with fixed interest rates ranging from 0.7% to 8.8% and maturity dates between January 2020 and September 2057 3,840 USD debt securities with variable interest rates and maturity dates between January 2020 and October 2069 724
14,054Equity investments at FVPL: Listed securities – mutual and hedge funds 3,450 Unlisted securities 2,733
6,183
20,237Current portion (Note 10) (281)Non-current 19,956
Equity investments designated at FVOCI are not held for trading. Instead, they are held for medium to long-term strategic purposes. Accordingly, management has elected to designate these equity investments at FVOCI as recognizing short-term fluctuations in these investments’ fair value in net income would not be consistent with Saudi Aramco’s strategy of holding these investments for long-term purposes and realizing their performance potential in the long run.
The fair value of Sumed is based on expected cash flows discounted using a rate based on market interest rates and a risk premium specific to the unlisted security which was 7.7% and 8.0% at December 31, 2020 and 2019, respectively. The fair value of TAQA is based on an earnings growth factor for unlisted equity securities from market information for similar types of companies. The fair value of Daehan is determined using discounted cash flow analysis based on the risk-adjusted yield.
On April 1, 2019, Saudi Aramco received 23.1 million common shares of Idemitsu in exchange for its shareholding of 56.4 million common shares of Showa Shell Sekiyu, K.K. (“Showa Shell”). As a result of this transaction, Saudi Aramco’s interest in Idemitsu is 7.8% of Idemitsu’s total common shares, which does not meet the requirement for significant influence. The investment in Idemitsu in the amount of SAR 1,905 at December 31, 2020 (2019: SAR 2,411) is accounted for at fair value through other comprehensive income.
The maximum exposure to credit risk at the reporting date of the investments in debt securities is the fair value. To limit credit risk, Saudi Aramco’s investment policy requires that these securities be diversified. Credit ratings for debt securities held at December 31, 2020 range from AAA to BB (2019: AAA to BB) as set out by internationally recognized credit rating agencies.
All amounts in millions of Saudi Riyals unless otherwise stated48
Saud
i Ara
bian
Oil
Com
pany
| C
onso
lidat
ed fi
nanc
ial s
tate
men
ts f
or th
e ye
ar e
nded
Dec
embe
r 31
, 202
0
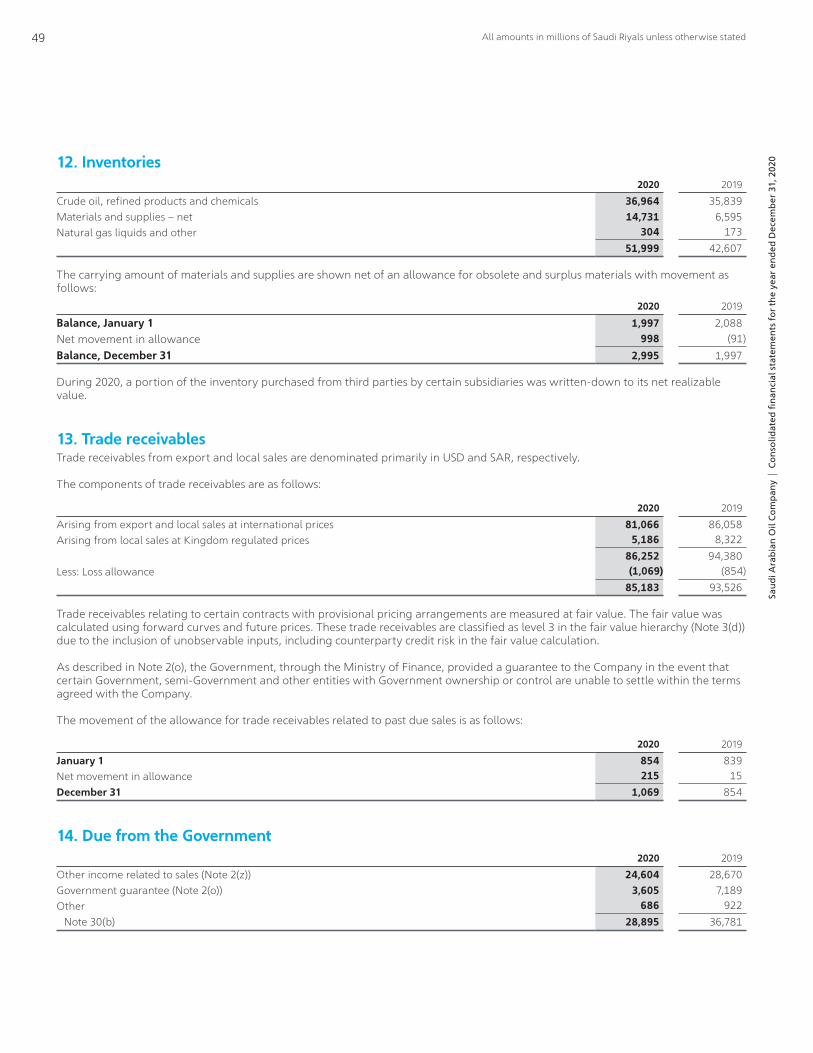
12. Inventories2020 2019
Crude oil, refined products and chemicals 36,964 35,839Materials and supplies – net 14,731 6,595Natural gas liquids and other 304 173
51,999 42,607
The carrying amount of materials and supplies are shown net of an allowance for obsolete and surplus materials with movement as follows:
2020 2019
Balance, January 1 1,997 2,088Net movement in allowance 998 (91)
Balance, December 31 2,995 1,997
During 2020, a portion of the inventory purchased from third parties by certain subsidiaries was written-down to its net realizable value.
13. Trade receivablesTrade receivables from export and local sales are denominated primarily in USD and SAR, respectively.
The components of trade receivables are as follows:
2020 2019
Arising from export and local sales at international prices 81,066 86,058Arising from local sales at Kingdom regulated prices 5,186 8,322
86,252 94,380Less: Loss allowance (1,069) (854)
85,183 93,526
Trade receivables relating to certain contracts with provisional pricing arrangements are measured at fair value. The fair value was calculated using forward curves and future prices. These trade receivables are classified as level 3 in the fair value hierarchy (Note 3(d)) due to the inclusion of unobservable inputs, including counterparty credit risk in the fair value calculation.
As described in Note 2(o), the Government, through the Ministry of Finance, provided a guarantee to the Company in the event that certain Government, semi-Government and other entities with Government ownership or control are unable to settle within the terms agreed with the Company.
The movement of the allowance for trade receivables related to past due sales is as follows:
2020 2019
January 1 854 839Net movement in allowance 215 15December 31 1,069 854
14. Due from the Government2020 2019
Other income related to sales (Note 2(z)) 24,604 28,670Government guarantee (Note 2(o)) 3,605 7,189Other 686 922 Note 30(b) 28,895 36,781
All amounts in millions of Saudi Riyals unless otherwise stated49
Saud
i Ara
bian
Oil
Com
pany
| C
onso
lidat
ed fi
nanc
ial s
tate
men
ts f
or th
e ye
ar e
nded
Dec
embe
r 31
, 202
0
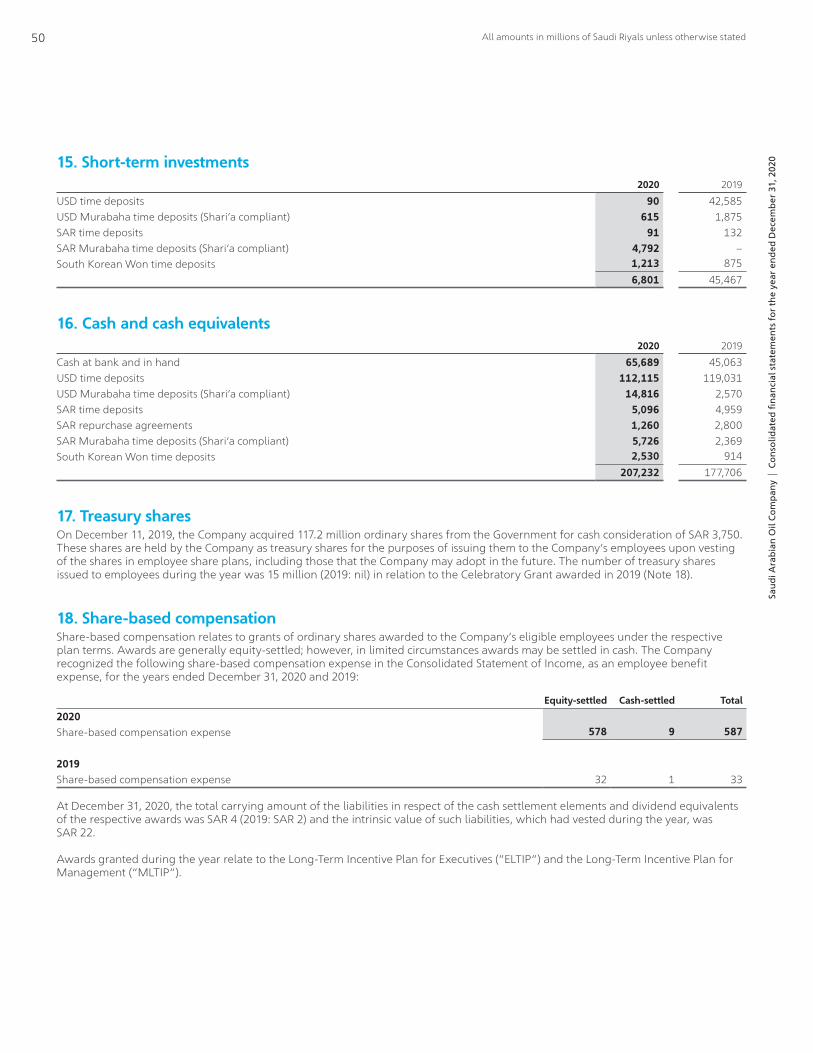
15. Short-term investments2020 2019
USD time deposits 90 42,585USD Murabaha time deposits (Shari’a compliant) 615 1,875SAR time deposits 91 132SAR Murabaha time deposits (Shari’a compliant) 4,792 –South Korean Won time deposits 1,213 875
6,801 45,467
16. Cash and cash equivalents2020 2019
Cash at bank and in hand 65,689 45,063USD time deposits 112,115 119,031USD Murabaha time deposits (Shari’a compliant) 14,816 2,570SAR time deposits 5,096 4,959SAR repurchase agreements 1,260 2,800SAR Murabaha time deposits (Shari’a compliant) 5,726 2,369South Korean Won time deposits 2,530 914
207,232 177,706
17. Treasury sharesOn December 11, 2019, the Company acquired 117.2 million ordinary shares from the Government for cash consideration of SAR 3,750. These shares are held by the Company as treasury shares for the purposes of issuing them to the Company’s employees upon vesting of the shares in employee share plans, including those that the Company may adopt in the future. The number of treasury shares issued to employees during the year was 15 million (2019: nil) in relation to the Celebratory Grant awarded in 2019 (Note 18).
18. Share-based compensationShare-based compensation relates to grants of ordinary shares awarded to the Company’s eligible employees under the respective plan terms. Awards are generally equity-settled; however, in limited circumstances awards may be settled in cash. The Company recognized the following share-based compensation expense in the Consolidated Statement of Income, as an employee benefit expense, for the years ended December 31, 2020 and 2019:
Equity-settled Cash-settled Total
2020Share-based compensation expense 578 9 587
2019Share-based compensation expense 32 1 33
At December 31, 2020, the total carrying amount of the liabilities in respect of the cash settlement elements and dividend equivalents of the respective awards was SAR 4 (2019: SAR 2) and the intrinsic value of such liabilities, which had vested during the year, was SAR 22.
Awards granted during the year relate to the Long-Term Incentive Plan for Executives (“ELTIP”) and the Long-Term Incentive Plan for Management (“MLTIP”).
All amounts in millions of Saudi Riyals unless otherwise stated50
Saud
i Ara
bian
Oil
Com
pany
| C
onso
lidat
ed fi
nanc
ial s
tate
men
ts f
or th
e ye
ar e
nded
Dec
embe
r 31
, 202
0
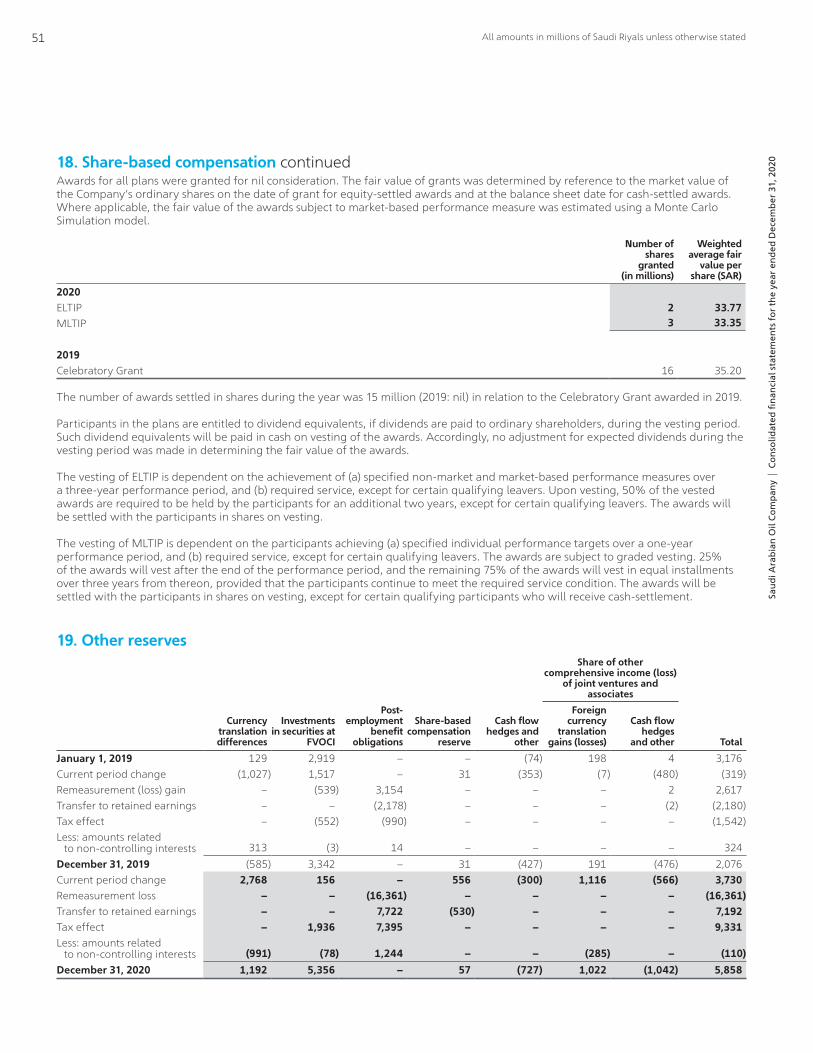
18. Share-based compensation continuedAwards for all plans were granted for nil consideration. The fair value of grants was determined by reference to the market value of the Company’s ordinary shares on the date of grant for equity-settled awards and at the balance sheet date for cash-settled awards. Where applicable, the fair value of the awards subject to market-based performance measure was estimated using a Monte Carlo Simulation model.
Number of shares
granted(in millions)
Weighted average fair
value per share (SAR)
2020ELTIP 2 33.77MLTIP 3 33.35
2019Celebratory Grant 16 35.20
The number of awards settled in shares during the year was 15 million (2019: nil) in relation to the Celebratory Grant awarded in 2019.
Participants in the plans are entitled to dividend equivalents, if dividends are paid to ordinary shareholders, during the vesting period. Such dividend equivalents will be paid in cash on vesting of the awards. Accordingly, no adjustment for expected dividends during the vesting period was made in determining the fair value of the awards.
The vesting of ELTIP is dependent on the achievement of (a) specified non-market and market-based performance measures over a three-year performance period, and (b) required service, except for certain qualifying leavers. Upon vesting, 50% of the vested awards are required to be held by the participants for an additional two years, except for certain qualifying leavers. The awards will be settled with the participants in shares on vesting.
The vesting of MLTIP is dependent on the participants achieving (a) specified individual performance targets over a one-year performance period, and (b) required service, except for certain qualifying leavers. The awards are subject to graded vesting. 25% of the awards will vest after the end of the performance period, and the remaining 75% of the awards will vest in equal installments over three years from thereon, provided that the participants continue to meet the required service condition. The awards will be settled with the participants in shares on vesting, except for certain qualifying participants who will receive cash-settlement.
19. Other reservesShare of other
comprehensive income (loss) of joint ventures and
associates
Currency translation differences
Investments in securities at
FVOCI
Post-employment
benefit obligations
Share-based compensation
reserve
Cash flow hedges and
other
Foreign currency
translation gains (losses)
Cash flow hedges
and other Total
January 1, 2019 129 2,919 – – (74) 198 4 3,176Current period change (1,027) 1,517 – 31 (353) (7) (480) (319)Remeasurement (loss) gain – (539) 3,154 – – – 2 2,617Transfer to retained earnings – – (2,178) – – – (2) (2,180)Tax effect – (552) (990) – – – – (1,542)Less: amounts related to non-controlling interests 313 (3) 14 – – – – 324December 31, 2019 (585) 3,342 – 31 (427) 191 (476) 2,076Current period change 2,768 156 – 556 (300) 1,116 (566) 3,730Remeasurement loss – – (16,361) – – – – (16,361)Transfer to retained earnings – – 7,722 (530) – – – 7,192Tax effect – 1,936 7,395 – – – – 9,331Less: amounts related to non-controlling interests (991) (78) 1,244 – – (285) – (110)December 31, 2020 1,192 5,356 – 57 (727) 1,022 (1,042) 5,858
All amounts in millions of Saudi Riyals unless otherwise stated51
Saud
i Ara
bian
Oil
Com
pany
| C
onso
lidat
ed fi
nanc
ial s
tate
men
ts f
or th
e ye
ar e
nded
Dec
embe
r 31
, 202
0

20. Non-controlling interestsSummarized consolidated financial information (100%) for each subsidiary that has non-controlling interests that are material to Saudi Aramco are set out below. The amounts disclosed for each subsidiary are before inter-company eliminations:
Summarized Balance Sheet
At December 31
2020 2019
SABICS-Oil
CorporationS-Oil
Corporation
Current assets 81,032 17,244 18,204Non-current assets 278,939 41,372 39,841Total assets 359,971 58,616 58,045
Current liabilities 37,709 22,696 18,617Non-current liabilities 67,891 12,880 14,718Total liabilities 105,600 35,576 33,335
Net assets 254,371 23,040 24,710
Accumulated non-controlling interest 99,603 8,842 9,484
Summarized Statement of Comprehensive IncomeYear ended December 31
2020 2019
SABIC1S-Oil
CorporationS-Oil
Corporation
Revenue 66,678 53,482 78,478
Net loss (2,426) (2,940) (491)
Other comprehensive (loss) income (197) 1,336 (809)
Total comprehensive loss (2,623) (1,604) (1,300)
Net loss attributable to non-controlling interests (150) (1,128) (188)
Dividends paid to non-controlling interests (704) (14) (36)
1. Amounts included are for the period from the date of acquisition of SABIC.
Summarized Statement of Cash FlowsYear ended December 31
2020 2019
SABIC1S-Oil
CorporationS-Oil
Corporation
Cash flows from operating activities 12,079 5,852 3,071
Cash flows from investing activities (2,827) (1,974) (3,414)
Cash flows from financing activities (3,611) (2,279) (953)
Net increase (decrease) in cash and cash equivalents 5,641 1,599 (1,296)
1. Amounts included are for the period from the date of acquisition of SABIC.
All amounts in millions of Saudi Riyals unless otherwise stated52
Saud
i Ara
bian
Oil
Com
pany
| C
onso
lidat
ed fi
nanc
ial s
tate
men
ts f
or th
e ye
ar e
nded
Dec
embe
r 31
, 202
0

21. Borrowings2020 2019
Non-current:Deferred consideration (Note 4) 217,231 –Borrowings 55,954 39,957Debentures 104,425 60,957Sukuk 12,420 12,649Lease liabilities 43,567 33,831Other1 3,323 3,296
436,920 150,690Current:Deferred consideration (Note 4) 18,636 – Short-term bank financing 60,085 12,660Borrowings 10,197 4,957Sukuk 231 175Lease liabilities 10,008 7,103
99,157 24,895
2020 2019
Finance costs:Conventional borrowings 7,391 3,144Lease liabilities 2,089 1,790Shari’a compliant financial instruments 645 652Unwinding of discount (Note 23) 439 440
10,564 6,026
1. Other borrowings comprise loans from non-financial institutions under commercial terms.
Borrowing facilitiesSaudi Aramco has entered into long-term financing arrangements with various lenders. These financing arrangements limit the creation of additional liens and/or financing obligations and certain of these arrangements are secured over certain property, plant and equipment of Saudi Aramco with a carrying value of SAR 10,015 (2019: SAR 38,074). Additionally, certain financing arrangements require compliance by Saudi Aramco with covenants to maintain certain financial and other conditions. Saudi Aramco has complied with these covenants throughout the reporting period.
All amounts in millions of Saudi Riyals unless otherwise stated53
Saud
i Ara
bian
Oil
Com
pany
| C
onso
lidat
ed fi
nanc
ial s
tate
men
ts f
or th
e ye
ar e
nded
Dec
embe
r 31
, 202
0
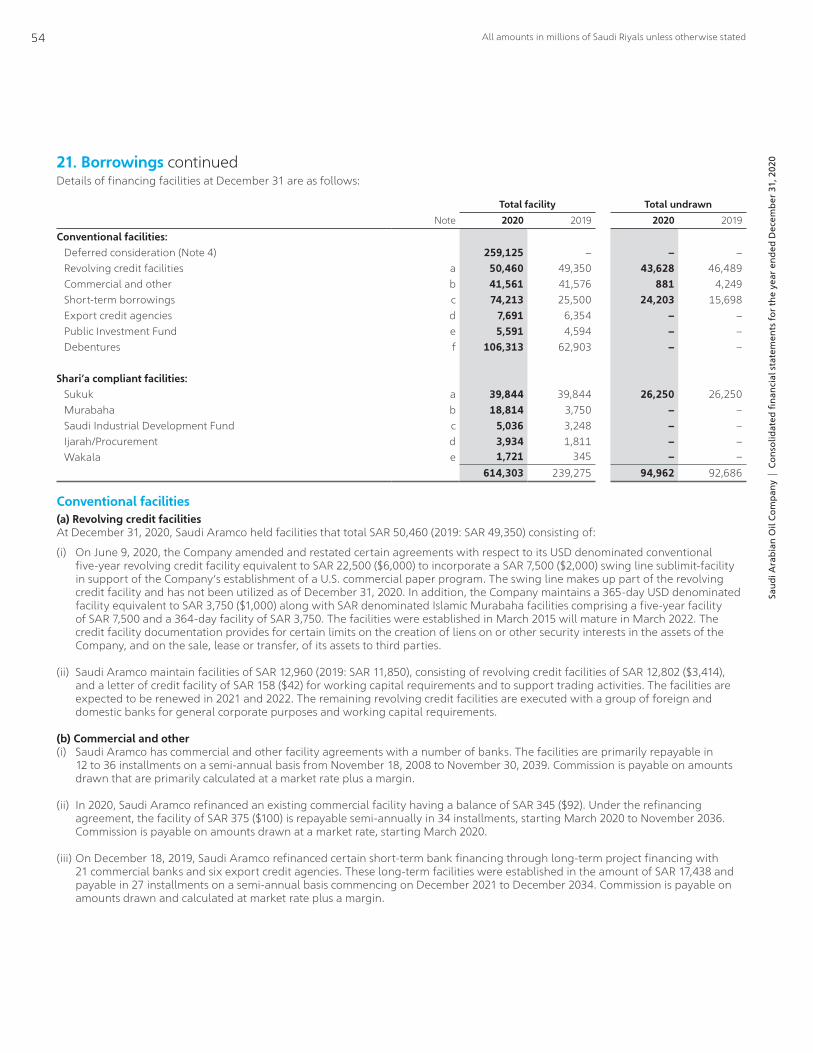
21. Borrowings continuedDetails of financing facilities at December 31 are as follows:
Total facility Total undrawn
Note 2020 2019 2020 2019
Conventional facilities: Deferred consideration (Note 4) 259,125 – – – Revolving credit facilities a 50,460 49,350 43,628 46,489 Commercial and other b 41,561 41,576 881 4,249 Short-term borrowings c 74,213 25,500 24,203 15,698 Export credit agencies d 7,691 6,354 – – Public Investment Fund e 5,591 4,594 – – Debentures f 106,313 62,903 – –
Shari'a compliant facilities: Sukuk a 39,844 39,844 26,250 26,250 Murabaha b 18,814 3,750 – – Saudi Industrial Development Fund c 5,036 3,248 – – Ijarah/Procurement d 3,934 1,811 – – Wakala e 1,721 345 – –
614,303 239,275 94,962 92,686
Conventional facilities(a) Revolving credit facilitiesAt December 31, 2020, Saudi Aramco held facilities that total SAR 50,460 (2019: SAR 49,350) consisting of:
(i) On June 9, 2020, the Company amended and restated certain agreements with respect to its USD denominated conventional five-year revolving credit facility equivalent to SAR 22,500 ($6,000) to incorporate a SAR 7,500 ($2,000) swing line sublimit-facility in support of the Company’s establishment of a U.S. commercial paper program. The swing line makes up part of the revolving credit facility and has not been utilized as of December 31, 2020. In addition, the Company maintains a 365-day USD denominated facility equivalent to SAR 3,750 ($1,000) along with SAR denominated Islamic Murabaha facilities comprising a five-year facility of SAR 7,500 and a 364-day facility of SAR 3,750. The facilities were established in March 2015 will mature in March 2022. The credit facility documentation provides for certain limits on the creation of liens on or other security interests in the assets of the Company, and on the sale, lease or transfer, of its assets to third parties.
(ii) Saudi Aramco maintain facilities of SAR 12,960 (2019: SAR 11,850), consisting of revolving credit facilities of SAR 12,802 ($3,414), and a letter of credit facility of SAR 158 ($42) for working capital requirements and to support trading activities. The facilities are expected to be renewed in 2021 and 2022. The remaining revolving credit facilities are executed with a group of foreign and domestic banks for general corporate purposes and working capital requirements.
(b) Commercial and other(i) Saudi Aramco has commercial and other facility agreements with a number of banks. The facilities are primarily repayable in
12 to 36 installments on a semi-annual basis from November 18, 2008 to November 30, 2039. Commission is payable on amounts drawn that are primarily calculated at a market rate plus a margin.
(ii) In 2020, Saudi Aramco refinanced an existing commercial facility having a balance of SAR 345 ($92). Under the refinancing agreement, the facility of SAR 375 ($100) is repayable semi-annually in 34 installments, starting March 2020 to November 2036. Commission is payable on amounts drawn at a market rate, starting March 2020.
(iii) On December 18, 2019, Saudi Aramco refinanced certain short-term bank financing through long-term project financing with 21 commercial banks and six export credit agencies. These long-term facilities were established in the amount of SAR 17,438 and payable in 27 installments on a semi-annual basis commencing on December 2021 to December 2034. Commission is payable on amounts drawn and calculated at market rate plus a margin.
All amounts in millions of Saudi Riyals unless otherwise stated54
Saud
i Ara
bian
Oil
Com
pany
| C
onso
lidat
ed fi
nanc
ial s
tate
men
ts f
or th
e ye
ar e
nded
Dec
embe
r 31
, 202
0

21. Borrowings continued(c) Short-term borrowings(i) On May 7, 2020, the Company entered into a SAR 37,500 ($10,000) one-year term loan facility with various financial institutions
for general corporate purposes. The one-year term loan facility currently terminates on May 6, 2021 but the Company has the option to extend the facility date by up to 364 days from May 6, 2021. As of December 31, 2020, the facility was fully utilized with the outstanding loan balance of SAR 37,500 ($10,000). The facility bears interest at LIBOR plus a margin commencing May 7, 2020.
(ii) In 2020, Saudi Aramco entered into debt factoring arrangements in relation to certain intercompany receivables, repayable over a four-month period and on market terms. A total of SAR 3,285 was outstanding at December 31, 2020 (2019: nil).
(iii) Saudi Aramco has facilities with a number of banks for short-term borrowing, with each borrowing less than one year and which incur interest at market rates plus a margin.
(d) Export credit agenciesSaudi Aramco has facility agreements with a number of export credit agencies. The facilities are repayable in 23 to 28 installments on a semi-annual basis from November 18, 2008 to December 20, 2025. Commission is payable on amounts drawn and is calculated at a market rate plus a margin.
(e) Public Investment FundSaudi Aramco has facility agreements with the Saudi Public Investment Fund. The facilities are repayable in 14 to 28 installments on a semi-annual basis from November 18, 2008 to December 20, 2025. Commission is payable on amounts drawn and is calculated at a market rate plus a margin.
(f) Debentures(i) On April 16, 2019, the Company issued five tranches of USD denominated unsecured notes aggregating equivalent to SAR 45,000
($12,000) and consisting of three-year maturities for SAR 3,750 ($1,000) with a coupon rate of 2.75%, five-year maturities for SAR 7,500 ($2,000) with a coupon rate of 2.875%, 10-year maturities for SAR 11,250 ($3,000) with a coupon rate of 3.5%, 20-year maturities for SAR 11,250 ($3,000) with a coupon rate of 4.25%, and 30-year maturities for SAR 11,250 ($3,000) with a coupon rate of 4.375%. The notes were issued and sold in accordance with Rule 144A/Regulation S under the U.S. Securities Act of 1933, as amended. Interest is payable semi-annually in arrears on April 16 and October 16. The notes are listed on the London Stock Exchange’s Regulated Market and the proceeds were for general corporate purposes. At initial recognition, the Company recorded an amount of SAR 44,460 ($11,856) for the issuance proceeds, net of discounts and estimated transaction costs. On November 24, 2020, the Company issued a series of USD Senior Unsecured Notes under the same program, aggregating SAR 30,000 ($8,000) consisting of maturity dates of three years to 50 years paid at the end of the maturity date with coupon rate ranging from 1.25% to 3.50%. At initial recognition, the Company recorded an amount of SAR 29,625 ($7,900) for the issuance proceeds, net of discounts. Discounts and transaction costs are amortized using the effective interest method and are reflected as finance costs in the Consolidated Statement of Income.
(ii) Certain debentures denominated in USD are issued in capital markets. Interest rates are fixed and variable with maturities that range between 2027 and 2040.
(iii) Debentures denominated in Korean Won are issued in capital markets. Interest rates range from 1.65% to 3.53% with maturities beginning in 2021 through 2030.
(iv) In November 2020, SABIC issued a 10-year and 30-year USD denominated $500 bond each, equivalent to a total of SAR 3,750 ($1,000). These bonds are unsecured and carry coupon rates of 2.15% and 3.00% for those maturing in 10 and 30 years, respectively. Both bonds are issued in accordance with Regulation S offering requirements under the U.S. Securities Act of 1933, as amended. These bonds are listed on the Irish Stock Exchange (Euronext Dublin) and the 30-year bond is dual listed in Taipei Exchange in Taiwan. The proceeds were used for general propose and refinancing maturing debt.
(v) In October 2018, SABIC issued a five-year and a 10-year USD denominated $1,000 bond equivalent to a total of SAR 7,500 ($2,000). These bonds are unsecured and carry coupon rates of 4% and 4.5%, respectively. The bonds are issued in accordance with the Rule 144A/Reg S offering requirements under the U.S. Securities Act of 1933, as amended. The bonds are listed on the Irish Stock Exchange (Euronext Dublin) and the proceeds were used for refinancing maturing debt.
All amounts in millions of Saudi Riyals unless otherwise stated55
Saud
i Ara
bian
Oil
Com
pany
| C
onso
lidat
ed fi
nanc
ial s
tate
men
ts f
or th
e ye
ar e
nded
Dec
embe
r 31
, 202
0

21. Borrowings continuedShari'a compliant facilities(a) SukukA Sukuk is a financial instrument similar to a bond that complies with Islamic financing principles.
(i) On April 10, 2017, Saudi Aramco issued a Sukuk for SAR 11,250 at par value as part of a SAR 37,500 program. The Sukuk issuance provides a return based on Saudi Arabian Interbank Offered Rate (“SAIBOR”) plus a pre-determined margin payable semi-annually on April 10 and October 10. The Sukuk matures on April 10, 2024. In accordance with the terms of the Sukuk, 51% of the proceeds from issuance are invested in Mudaraba assets and the remaining 49% are used in a Murabaha arrangement.
(ii) On October 9, 2011, Saudi Aramco issued a Sukuk for SAR 2,344 at par value with semi-annual payments from December 20, 2014 to December 20, 2025 that provides a rate of return above SAIBOR. The Sukuk was structured as Istisnah for pre-construction and Ijarah for post-construction of the project.
(b) MurabahaSaudi Aramco has a Murabaha Shari’a compliant Islamic facilities. The facilities are repayable in 10 to 44 installments on a semi-annual basis payments between 2008 and 2030. Commission is payable on amounts drawn and is calculated at a market rate plus a margin.
(c) Saudi Industrial Development FundSaudi Aramco has facility agreements with the Saudi Industrial Development Fund. The facilities bear no periodic financial charges and borrowings are repayable in 14 to 34 installments on a semi-annual basis, commencing from 2008 to 2030.
(d) Ijarah/ProcurementSaudi Aramco had Procurement and Ijarah Shari’a compliant Islamic facility agreements with a number of banks. The facilities were repayable in seven to 28 installments on a semi-annual basis, commencing November 18, 2008 to June 20, 2029. In 2019, Saudi Aramco refinanced the balance of the procurement facility with an Ijarah Shari’a compliant facility to be repayable on a semi-annual basis starting June 20, 2026. Commission is payable on amounts drawn that are primarily calculated at a market rate plus a margin.
(e) WakalaSaudi Aramco has Shari’a compliant Islamic facility agreements with three lenders. The facilities utilize a Wakala financing structure which is an agency arrangement.
In 2020, Saudi Aramco entered into a new Wakala facility with semi-annual payment terms commencing from 2020 to 2036. Commission is payable on amounts drawn that are primarily calculated at a market rate.
In 2019, Saudi Aramco refinanced the Wakala Shari’a compliant Islamic facilities. The facilities were repayable in 23 unequal installments on a semi-annual basis commencing December 20, 2014 to December 20, 2025. In 2019, Saudi Aramco refinanced the balance of the facility to be repayable in seven unequal installments on a semi-annual basis starting June 20, 2026 to June 20, 2029. Commission is payable on amounts drawn that are primarily calculated at a market rate plus a margin starting June 20, 2020.
At the Consolidated Balance Sheet date, the carrying values of Saudi Aramco’s borrowings approximate their fair values.
All amounts in millions of Saudi Riyals unless otherwise stated56
Saud
i Ara
bian
Oil
Com
pany
| C
onso
lidat
ed fi
nanc
ial s
tate
men
ts f
or th
e ye
ar e
nded
Dec
embe
r 31
, 202
0

21. Borrowings continuedThe carrying amounts of borrowings, excluding lease liabilities and deferred consideration, at December 31 are as follows:
2020 2019
Conventional facilities: Revolving credit facilities 6,830 2,861 Commercial and other 34,478 32,564 Short-term borrowings 53,255 9,799 Export credit agencies 4,560 3,743 Public Investment Fund (Note 30(b)) 3,656 2,880 Debentures 104,425 60,957 Other 3,323 3,296
Shari'a compliant facilities: Sukuk 12,651 12,824 Murabaha 15,379 1,085 Saudi Industrial Development Fund (Note 30(b)) 3,855 2,486 Ijarah/Procurement 3,360 1,811 Wakala 863 345
246,635 134,651
Movements in unamortized transaction costs are as follows:
2020 2019
January 1 968 461Additional transaction costs incurred 1,170 769Less: amortization (353) (262)December 31 1,785 968
Lease liabilitiesCovenants of certain long-term financing facilities require Saudi Aramco to maintain defined financial and other conditions. Lease liabilities are effectively secured as the rights to the leased asset revert to the lessor in the event of default. The lessor has ownership of the assets during the term of the contract and is responsible for the operation, insurance and maintenance of the assets until termination of the underlying agreements. For certain leases, the lessor shall transfer its rights, title and interest in the assets to the lessee on the last day of the agreements; for others, there are no further obligations on completion of agreements. Performance guarantees are provided by the lessor under the terms of the agreements.
The total cash outflow for leases for the year ended December 31, 2020 was SAR 10,868 (2019: SAR 7,740). Expenses relating to short-term and low value leases were recognized in the Consolidated Statement of Income for the year ended December 31, 2020 and amounted to SAR 378 (2019: SAR 2,558) and SAR 278 (2019: SAR 540), respectively.
Maturities of borrowings and leases are as follows:
No later than one year
Later than one year and no later than
five yearsLater than five years
Total contractual
amount
Total carrying amount
2020Borrowings 101,505 244,553 242,929 588,987 482,502Leases 11,228 26,051 23,854 61,133 53,575
112,733 270,604 266,783 650,120 536,0772019Borrowings 8,165 51,383 104,202 163,750 134,651Leases 8,405 21,867 30,067 60,339 40,934
16,570 73,250 134,269 224,089 175,585
All amounts in millions of Saudi Riyals unless otherwise stated57
Saud
i Ara
bian
Oil
Com
pany
| C
onso
lidat
ed fi
nanc
ial s
tate
men
ts f
or th
e ye
ar e
nded
Dec
embe
r 31
, 202
0
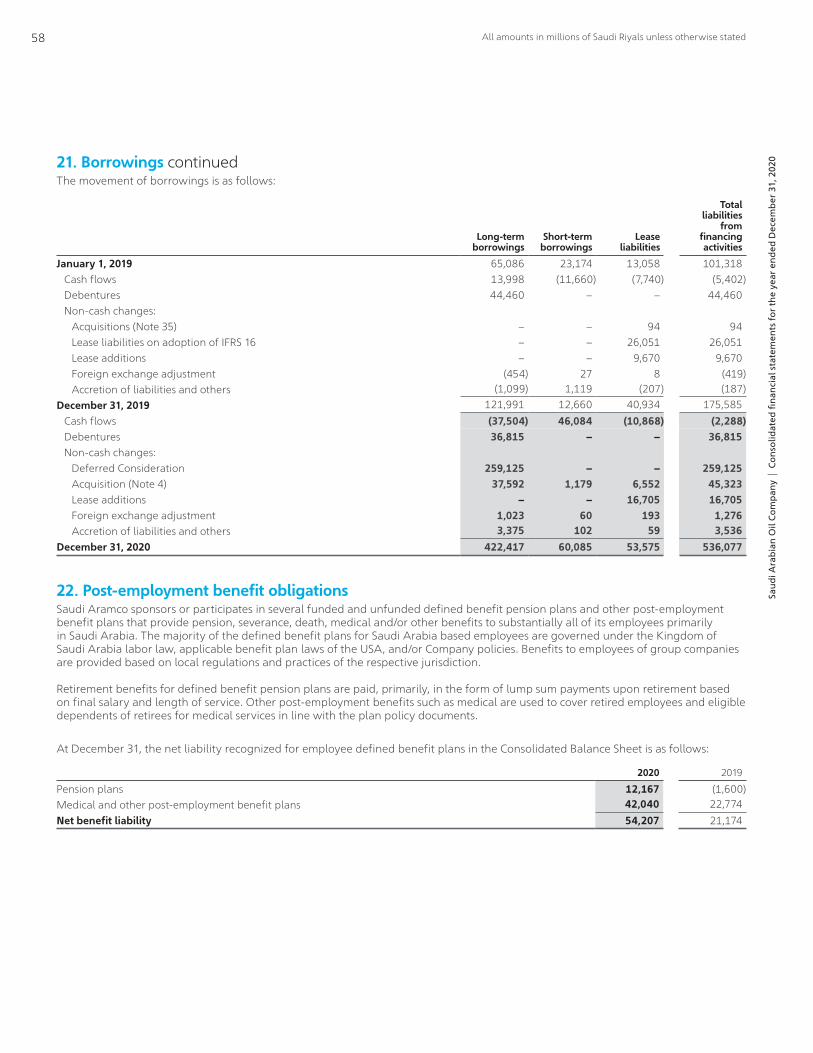
21. Borrowings continuedThe movement of borrowings is as follows:
Long-term borrowings
Short-term borrowings
Lease liabilities
Total liabilities
from financing activities
January 1, 2019 65,086 23,174 13,058 101,318 Cash flows 13,998 (11,660) (7,740) (5,402) Debentures 44,460 – – 44,460 Non-cash changes:
Acquisitions (Note 35) – – 94 94 Lease liabilities on adoption of IFRS 16 – – 26,051 26,051 Lease additions – – 9,670 9,670 Foreign exchange adjustment (454) 27 8 (419) Accretion of liabilities and others (1,099) 1,119 (207) (187)
December 31, 2019 121,991 12,660 40,934 175,585 Cash flows (37,504) 46,084 (10,868) (2,288) Debentures 36,815 – – 36,815 Non-cash changes:
Deferred Consideration 259,125 – – 259,125 Acquisition (Note 4) 37,592 1,179 6,552 45,323 Lease additions – – 16,705 16,705 Foreign exchange adjustment 1,023 60 193 1,276 Accretion of liabilities and others 3,375 102 59 3,536
December 31, 2020 422,417 60,085 53,575 536,077
22. Post-employment benefit obligationsSaudi Aramco sponsors or participates in several funded and unfunded defined benefit pension plans and other post-employment benefit plans that provide pension, severance, death, medical and/or other benefits to substantially all of its employees primarily in Saudi Arabia. The majority of the defined benefit plans for Saudi Arabia based employees are governed under the Kingdom of Saudi Arabia labor law, applicable benefit plan laws of the USA, and/or Company policies. Benefits to employees of group companies are provided based on local regulations and practices of the respective jurisdiction.
Retirement benefits for defined benefit pension plans are paid, primarily, in the form of lump sum payments upon retirement based on final salary and length of service. Other post-employment benefits such as medical are used to cover retired employees and eligible dependents of retirees for medical services in line with the plan policy documents.
At December 31, the net liability recognized for employee defined benefit plans in the Consolidated Balance Sheet is as follows:
2020 2019
Pension plans 12,167 (1,600)Medical and other post-employment benefit plans 42,040 22,774Net benefit liability 54,207 21,174
All amounts in millions of Saudi Riyals unless otherwise stated58
Saud
i Ara
bian
Oil
Com
pany
| C
onso
lidat
ed fi
nanc
ial s
tate
men
ts f
or th
e ye
ar e
nded
Dec
embe
r 31
, 202
0

22. Post-employment benefit obligations continuedThe status of Saudi Aramco’s pension and other post-employment defined benefit plans is as follows:
Pension benefits Other benefits
2020 2019 2020 2019
Net benefit obligation by funding: Present value of funded obligations 84,998 59,824 114,289 87,090 Fair value of plan assets (78,328) (67,156) (82,629) (73,136)Benefit deficit (surplus) 6,670 (7,332) 31,660 13,954 Present value of unfunded obligations 5,497 5,732 10,380 8,820Net benefit liability (asset) 12,167 (1,600) 42,040 22,774
Change in benefit obligations: Benefit obligations, January 1 65,556 57,296 95,910 85,047 Current service cost 3,799 3,004 2,576 1,924 Interest cost 2,254 2,453 3,458 3,720 Past service (credit) cost (465) (8) 2,340 –
Remeasurement 8,243 6,481 21,480 6,754 Plan participants’ contribution 75 105 – – Benefits paid (8,134) (3,563) (1,886) (1,804) Settlements (386) (274) – – Acquisitions (Notes 4, 35) 19,651 131 975 94 Foreign currency translation and other (98) (69) (184) 175Benefit obligations, December 31 90,495 65,556 124,669 95,910
Change in plan assets: Fair value of plan assets January 1 (67,156) (58,376) (73,136) (60,758) Interest income (2,018) (2,475) (2,438) (2,696) Remeasurement (6,214) (6,604) (7,148) (9,785) Employer contributions (7,406) (3,480) (1,793) (1,699) Benefits paid 8,134 3,563 1,886 1,804 Settlements 386 274 – – Acquisitions (Notes 4, 35) (4,077) (56) – – Foreign currency translation and other 23 (2) – (2)Fair value of plan assets, December 31 (78,328) (67,156) (82,629) (73,136)
Net benefit liability (asset) at December 31 12,167 (1,600) 42,040 22,774
The weighted average duration of the pension benefit obligations is 13 years at December 31, 2020 and December 31, 2019. The weighted average duration of the other benefit obligations is 21 years at December 31, 2020 and December 31, 2019.
All amounts in millions of Saudi Riyals unless otherwise stated59
Saud
i Ara
bian
Oil
Com
pany
| C
onso
lidat
ed fi
nanc
ial s
tate
men
ts f
or th
e ye
ar e
nded
Dec
embe
r 31
, 202
0
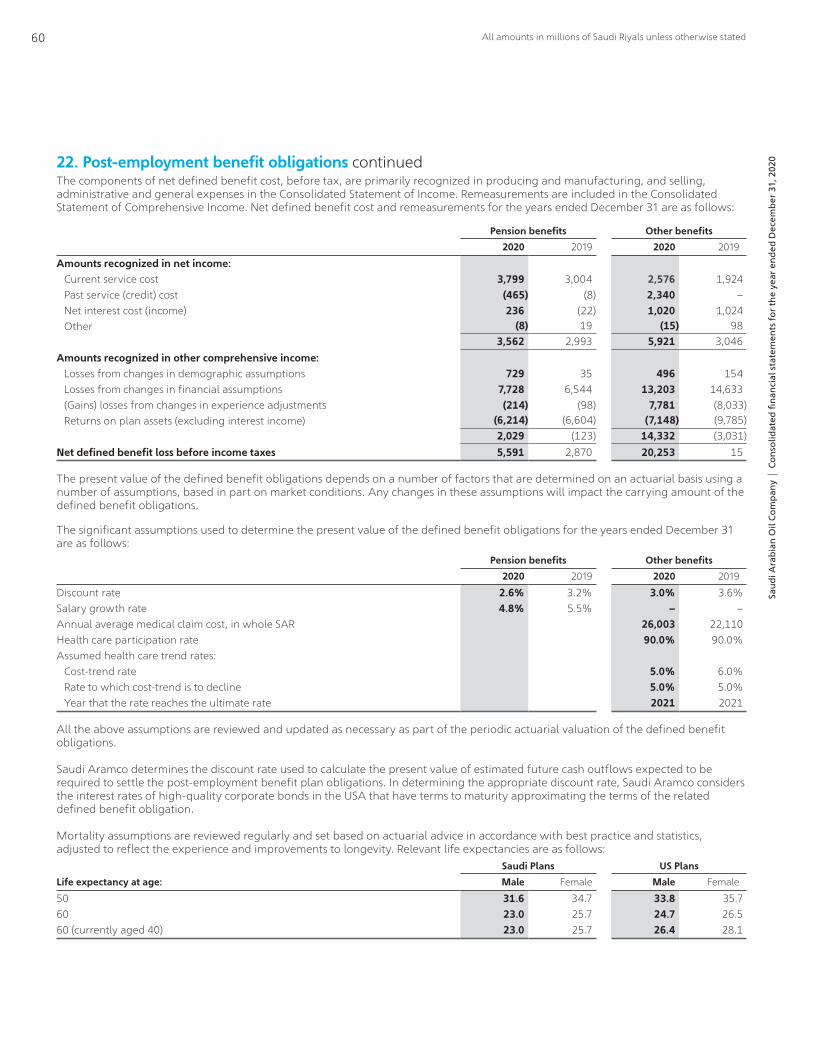
22. Post-employment benefit obligations continuedThe components of net defined benefit cost, before tax, are primarily recognized in producing and manufacturing, and selling, administrative and general expenses in the Consolidated Statement of Income. Remeasurements are included in the Consolidated Statement of Comprehensive Income. Net defined benefit cost and remeasurements for the years ended December 31 are as follows:
Pension benefits Other benefits
2020 2019 2020 2019
Amounts recognized in net income: Current service cost 3,799 3,004 2,576 1,924 Past service (credit) cost (465) (8) 2,340 – Net interest cost (income) 236 (22) 1,020 1,024 Other (8) 19 (15) 98
3,562 2,993 5,921 3,046Amounts recognized in other comprehensive income: Losses from changes in demographic assumptions 729 35 496 154 Losses from changes in financial assumptions 7,728 6,544 13,203 14,633 (Gains) losses from changes in experience adjustments (214) (98) 7,781 (8,033) Returns on plan assets (excluding interest income) (6,214) (6,604) (7,148) (9,785)
2,029 (123) 14,332 (3,031)Net defined benefit loss before income taxes 5,591 2,870 20,253 15
The present value of the defined benefit obligations depends on a number of factors that are determined on an actuarial basis using a number of assumptions, based in part on market conditions. Any changes in these assumptions will impact the carrying amount of the defined benefit obligations.
The significant assumptions used to determine the present value of the defined benefit obligations for the years ended December 31 are as follows:
Pension benefits Other benefits
2020 2019 2020 2019
Discount rate 2.6% 3.2% 3.0% 3.6%Salary growth rate 4.8% 5.5% – –Annual average medical claim cost, in whole SAR 26,003 22,110Health care participation rate 90.0% 90.0%Assumed health care trend rates: Cost-trend rate 5.0% 6.0% Rate to which cost-trend is to decline 5.0% 5.0% Year that the rate reaches the ultimate rate 2021 2021
All the above assumptions are reviewed and updated as necessary as part of the periodic actuarial valuation of the defined benefit obligations.
Saudi Aramco determines the discount rate used to calculate the present value of estimated future cash outflows expected to be required to settle the post-employment benefit plan obligations. In determining the appropriate discount rate, Saudi Aramco considers the interest rates of high-quality corporate bonds in the USA that have terms to maturity approximating the terms of the related defined benefit obligation.
Mortality assumptions are reviewed regularly and set based on actuarial advice in accordance with best practice and statistics, adjusted to reflect the experience and improvements to longevity. Relevant life expectancies are as follows:
Saudi Plans US Plans
Life expectancy at age: Male Female Male Female
50 31.6 34.7 33.8 35.760 23.0 25.7 24.7 26.560 (currently aged 40) 23.0 25.7 26.4 28.1
All amounts in millions of Saudi Riyals unless otherwise stated60
Saud
i Ara
bian
Oil
Com
pany
| C
onso
lidat
ed fi
nanc
ial s
tate
men
ts f
or th
e ye
ar e
nded
Dec
embe
r 31
, 202
0

22. Post-employment benefit obligations continuedThe salary growth rate assumption is based on a study of recent years’ salary experience and reflects management’s outlook for future increases. The annual average medical claim cost assumption is based on medical costs incurred in external medical providers, on behalf of the Company’s employees and retirees. The health care participation rate considers the historical participation rate, amongst others, derived from the best available historical data. The assumed health care cost-trend rates reflect Saudi Aramco’s historical experience and management’s expectations regarding future trends.
The sensitivity of the overall defined benefit obligations to changes in the principal assumptions, keeping all other assumptions constant, is presented below. The sensitivity analysis may not be representative of an actual change in the defined benefit obligations as it is unlikely that changes in assumptions would occur in isolation from one another.
Change in assumption
Impact on obligation 2020 2019
Ultimate health care cost-trend rates Increase by 0.5% Increase by 13,485 9,926Decrease by 0.5% Decrease by (11,726) (8,659)
Discount rate - other benefits Increase by 0.5% Decrease by (12,311) (9,195)Decrease by 0.5% Increase by 14,359 10,669
Discount rate - pension benefits Increase by 0.5% Decrease by (6,146) (3,889)Decrease by 0.5% Increase by 6,818 4,331
Salary growth rate Increase by 0.5% Increase by 2,974 1,890Decrease by 0.5% Decrease by (3,364) (2,201)
Annual average medical claim cost Increase by 5% Increase by 5,903 4,463Decrease by 5% Decrease by (5,903) (4,463)
Life expectancy Increase by 1 year Increase by 5,880 4,245Decrease by 1 year Decrease by (5,914) (4,234)
Health care participation rate Increase by 5% Increase by 1,823 1,706Decrease by 5% Decrease by (1,875) (1,751)
Plan assets consisted of the following:2020 2019
Cash 5,816 2,670Time deposits 8 –Equity instruments 41,710 39,199Investment funds 61,947 48,845Bonds 50,516 48,202Sukuk (Shari’a compliant) 960 1,376
160,957 140,292
Plan assets are administered under the oversight of the Company or one of its subsidiaries and managed by independent trustees or separate entities, in a manner consistent with fiduciary obligations and principles, acting in the best interest of plan participants. The objectives of the plans are to maximize investment returns consistent with prudent risk over a long-term investment horizon in order to secure retiree benefits and minimize corporate funding. All plan assets are held separately, solely to pay retiree benefits. Saudi Aramco has no rights to plan assets. Funded Saudi Plans have the right to transfer assets held in excess of the plan’s defined benefit obligation to another funded Saudi plan. The right to transfer such assets is solely in respect of amounts held in excess of the plan’s defined benefit obligations and solely to Plans with defined benefit obligations exceeding the value of assets held.
Through its post-employment benefit plans, Saudi Aramco is exposed to a number of risks including asset volatility, changes in bond yields, inflation and life expectancy. Investment risk is minimized through diversification of investments among fixed income, equity, and alternative asset classes. Asset allocation is determined by an asset liability modeling study. The target asset allocation is, approximately, 36% (2019: 38%) equity instruments, 31% (2019: 32%) debt instruments, and 33% (2019: 30%) alternative assets. Inflation risk is partially offset by equities inflation and life expectancy risk is borne by Saudi Aramco.
All amounts in millions of Saudi Riyals unless otherwise stated61
Saud
i Ara
bian
Oil
Com
pany
| C
onso
lidat
ed fi
nanc
ial s
tate
men
ts f
or th
e ye
ar e
nded
Dec
embe
r 31
, 202
0
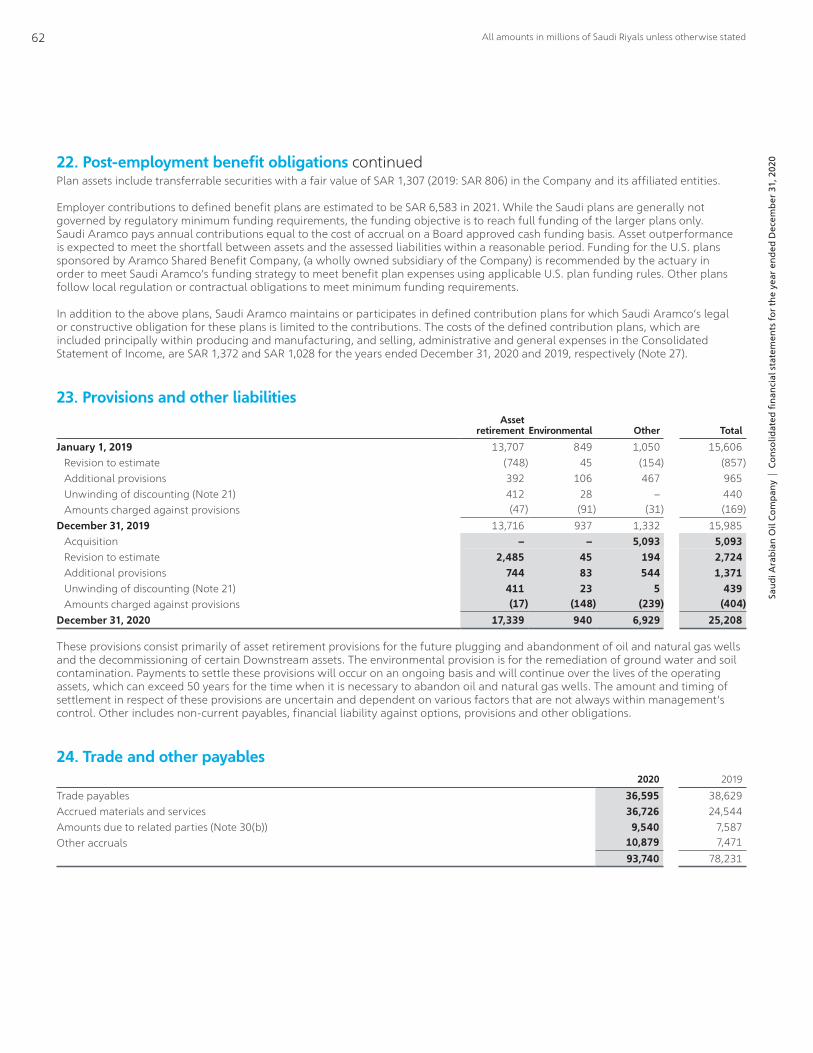
22. Post-employment benefit obligations continuedPlan assets include transferrable securities with a fair value of SAR 1,307 (2019: SAR 806) in the Company and its affiliated entities.
Employer contributions to defined benefit plans are estimated to be SAR 6,583 in 2021. While the Saudi plans are generally not governed by regulatory minimum funding requirements, the funding objective is to reach full funding of the larger plans only. Saudi Aramco pays annual contributions equal to the cost of accrual on a Board approved cash funding basis. Asset outperformance is expected to meet the shortfall between assets and the assessed liabilities within a reasonable period. Funding for the U.S. plans sponsored by Aramco Shared Benefit Company, (a wholly owned subsidiary of the Company) is recommended by the actuary in order to meet Saudi Aramco’s funding strategy to meet benefit plan expenses using applicable U.S. plan funding rules. Other plans follow local regulation or contractual obligations to meet minimum funding requirements.
In addition to the above plans, Saudi Aramco maintains or participates in defined contribution plans for which Saudi Aramco’s legal or constructive obligation for these plans is limited to the contributions. The costs of the defined contribution plans, which are included principally within producing and manufacturing, and selling, administrative and general expenses in the Consolidated Statement of Income, are SAR 1,372 and SAR 1,028 for the years ended December 31, 2020 and 2019, respectively (Note 27).
23. Provisions and other liabilitiesAsset
retirement Environmental Other Total
January 1, 2019 13,707 849 1,050 15,606 Revision to estimate (748) 45 (154) (857) Additional provisions 392 106 467 965 Unwinding of discounting (Note 21) 412 28 – 440 Amounts charged against provisions (47) (91) (31) (169)December 31, 2019 13,716 937 1,332 15,985 Acquisition – – 5,093 5,093 Revision to estimate 2,485 45 194 2,724 Additional provisions 744 83 544 1,371 Unwinding of discounting (Note 21) 411 23 5 439 Amounts charged against provisions (17) (148) (239) (404)December 31, 2020 17,339 940 6,929 25,208
These provisions consist primarily of asset retirement provisions for the future plugging and abandonment of oil and natural gas wells and the decommissioning of certain Downstream assets. The environmental provision is for the remediation of ground water and soil contamination. Payments to settle these provisions will occur on an ongoing basis and will continue over the lives of the operating assets, which can exceed 50 years for the time when it is necessary to abandon oil and natural gas wells. The amount and timing of settlement in respect of these provisions are uncertain and dependent on various factors that are not always within management’s control. Other includes non-current payables, financial liability against options, provisions and other obligations.
24. Trade and other payables2020 2019
Trade payables 36,595 38,629Accrued materials and services 36,726 24,544Amounts due to related parties (Note 30(b)) 9,540 7,587Other accruals 10,879 7,471
93,740 78,231
All amounts in millions of Saudi Riyals unless otherwise stated62
Saud
i Ara
bian
Oil
Com
pany
| C
onso
lidat
ed fi
nanc
ial s
tate
men
ts f
or th
e ye
ar e
nded
Dec
embe
r 31
, 202
0
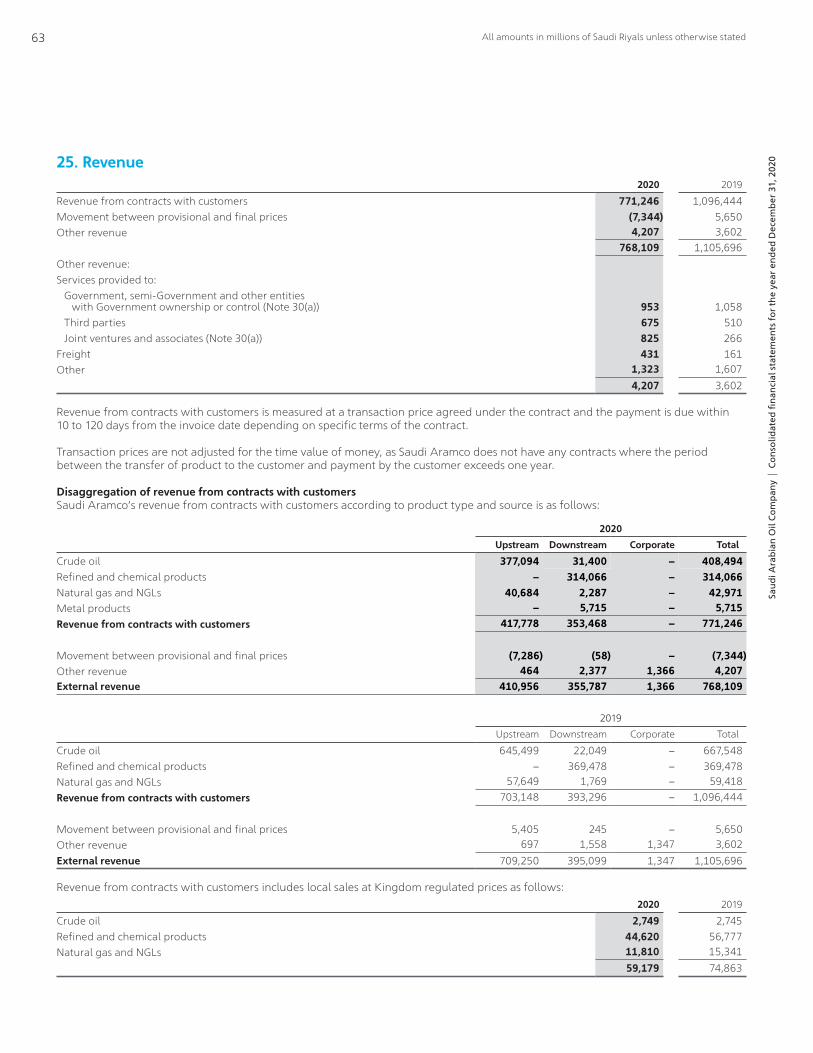
25. Revenue2020 2019
Revenue from contracts with customers 771,246 1,096,444Movement between provisional and final prices (7,344) 5,650Other revenue 4,207 3,602
768,109 1,105,696Other revenue: Services provided to: Government, semi-Government and other entities with Government ownership or control (Note 30(a)) 953 1,058 Third parties 675 510 Joint ventures and associates (Note 30(a)) 825 266Freight 431 161Other 1,323 1,607
4,207 3,602
Revenue from contracts with customers is measured at a transaction price agreed under the contract and the payment is due within 10 to 120 days from the invoice date depending on specific terms of the contract.
Transaction prices are not adjusted for the time value of money, as Saudi Aramco does not have any contracts where the period between the transfer of product to the customer and payment by the customer exceeds one year.
Disaggregation of revenue from contracts with customersSaudi Aramco’s revenue from contracts with customers according to product type and source is as follows:
2020
Upstream Downstream Corporate Total
Crude oil 377,094 31,400 – 408,494Refined and chemical products – 314,066 – 314,066Natural gas and NGLs 40,684 2,287 – 42,971Metal products – 5,715 – 5,715Revenue from contracts with customers 417,778 353,468 – 771,246
Movement between provisional and final prices (7,286) (58) – (7,344)Other revenue 464 2,377 1,366 4,207External revenue 410,956 355,787 1,366 768,109
2019
Upstream Downstream Corporate Total
Crude oil 645,499 22,049 – 667,548Refined and chemical products – 369,478 – 369,478Natural gas and NGLs 57,649 1,769 – 59,418Revenue from contracts with customers 703,148 393,296 – 1,096,444
Movement between provisional and final prices 5,405 245 – 5,650Other revenue 697 1,558 1,347 3,602External revenue 709,250 395,099 1,347 1,105,696
Revenue from contracts with customers includes local sales at Kingdom regulated prices as follows:2020 2019
Crude oil 2,749 2,745Refined and chemical products 44,620 56,777Natural gas and NGLs 11,810 15,341
59,179 74,863
All amounts in millions of Saudi Riyals unless otherwise stated63
Saud
i Ara
bian
Oil
Com
pany
| C
onso
lidat
ed fi
nanc
ial s
tate
men
ts f
or th
e ye
ar e
nded
Dec
embe
r 31
, 202
0
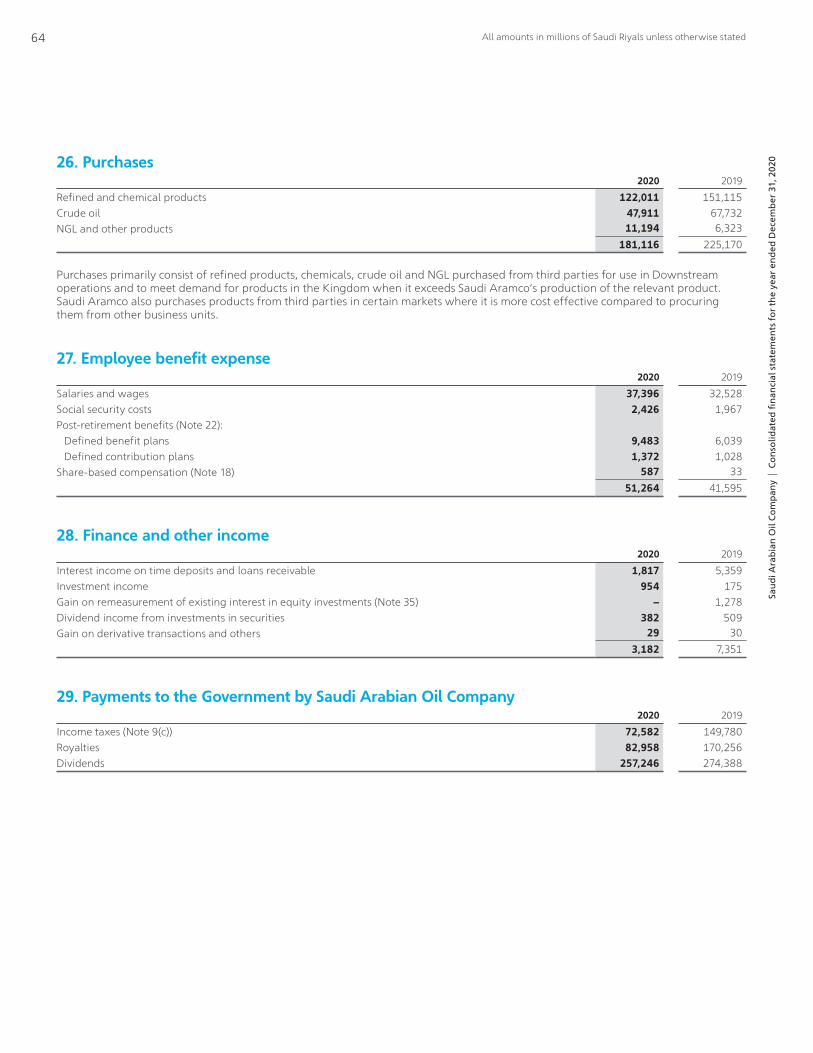
26. Purchases2020 2019
Refined and chemical products 122,011 151,115Crude oil 47,911 67,732NGL and other products 11,194 6,323
181,116 225,170
Purchases primarily consist of refined products, chemicals, crude oil and NGL purchased from third parties for use in Downstream operations and to meet demand for products in the Kingdom when it exceeds Saudi Aramco’s production of the relevant product. Saudi Aramco also purchases products from third parties in certain markets where it is more cost effective compared to procuring them from other business units.
27. Employee benefit expense2020 2019
Salaries and wages 37,396 32,528Social security costs 2,426 1,967Post-retirement benefits (Note 22): Defined benefit plans 9,483 6,039 Defined contribution plans 1,372 1,028Share-based compensation (Note 18) 587 33
51,264 41,595
28. Finance and other income2020 2019
Interest income on time deposits and loans receivable 1,817 5,359Investment income 954 175Gain on remeasurement of existing interest in equity investments (Note 35) – 1,278Dividend income from investments in securities 382 509Gain on derivative transactions and others 29 30
3,182 7,351
29. Payments to the Government by Saudi Arabian Oil Company2020 2019
Income taxes (Note 9(c)) 72,582 149,780Royalties 82,958 170,256Dividends 257,246 274,388
All amounts in millions of Saudi Riyals unless otherwise stated64
Saud
i Ara
bian
Oil
Com
pany
| C
onso
lidat
ed fi
nanc
ial s
tate
men
ts f
or th
e ye
ar e
nded
Dec
embe
r 31
, 202
0

30. Related party transactions(a) Transactions
2020 2019
Joint ventures: Revenue from sales 14,393 7,485 Other revenue (Note 25) 72 83 Interest income 98 30 Purchases 8,719 544 Service expenses 11 19
Associates: Revenue from sales 32,580 36,866 Other revenue (Note 25) 753 183 Interest income 120 165 Purchases 28,451 36,960 Service expenses 199 188
Government, semi-Government and other entities with Government ownership or control: Revenue from sales 24,866 45,079 Other income related to sales 93,982 131,089 Other revenue (Note 25) 953 1,058 Purchases 10,384 11,606 Service expenses 454 409 Acquisition of treasury shares (Note 17) – 3,750 Sale of partial interest in joint venture – 14
Goods are purchased and sold according to supply agreements in force. Note 34 includes additional information on loans to joint ventures and associates.
(b) Balances2020 2019
Joint ventures: Other assets and receivables (Note 10) 6,368 1,609 Trade receivables 3,210 836 Interest receivable 128 30 Trade and other payables (Note 24) 3,986 15
Associates: Other assets and receivables (Note 10) 7,395 3,326 Trade receivables 8,415 8,715 Trade and other payables (Note 24) 3,784 4,553
Government, semi-Government and other entities with Government ownership or control: Other assets and receivables (Note 10) 540 – Trade receivables 1,429 5,985 Due from the Government (Note 14) 28,895 36,781 Trade and other payables (Note 24) 1,770 3,019 Borrowings (Note 21) 243,378 5,366
Sales to and receivables from Government, semi-Government and other entities with Government ownership or control are made on specific terms within the relevant regulatory framework in the Kingdom.
All amounts in millions of Saudi Riyals unless otherwise stated65
Saud
i Ara
bian
Oil
Com
pany
| C
onso
lidat
ed fi
nanc
ial s
tate
men
ts f
or th
e ye
ar e
nded
Dec
embe
r 31
, 202
0

30. Related party transactions continued(c) Compensation of key management personnelKey management personnel of Saudi Aramco included directors and senior executive management. The compensation paid or payable to key management for services is shown below:
2020 2019
Short-term employee benefits 59 63Post-employment benefits 29 31Other long-term benefits 23 7Termination benefits 17 –
128 101
(d) Other transactions with key management personnelOther than as set out in Note 30(c), there were no reportable transactions between Saudi Aramco and members of key management personnel and their close family members during the year ended December 31, 2020 (2019: nil).
31. Derivative instruments and hedging activitiesSaudi Aramco uses interest rate swap contracts to manage exposure to interest rate risk resulting from borrowings. These hedges are designated as cash flow hedges. Saudi Aramco also engages in hedging activities through the use of currency forward contracts in relation to firm commitments under procurement contracts and transactions for foreign currency payrolls. These hedges are designated as fair value hedges. Further, Saudi Aramco uses short-term commodity swap contracts to manage exposure to price fluctuations.
The notional amounts of currency forward contracts and interest rate swap contracts designated as hedging instruments and outstanding commodity swap contracts are as follows:
2020 2019
Interest rate swaps 12,075 12,911Commodity swap contracts 19,894 17,370Currency forward contracts 9,780 8,452
41,749 38,733
32. Non-cash investing and financing activitiesInvesting and financing activities during 2020 include the acquisition of SABIC for deferred consideration of SAR 259,125 (Note 4), additions to right-of-use assets of SAR 16,278 (2019: SAR 9,670), subordinated shareholder loans and trade receivables with a joint venture that were converted to equity of nil and nil (2019: SAR 1,706 and SAR 1,098), respectively, asset retirement provisions of SAR 2,786 (2019: SAR 50) and equity awards issued to employees for no consideration (Note 18) (2019: nil).
33. Commitments(a) Capital commitmentsCapital expenditures contracted for but not yet incurred were SAR 153,326 and SAR 154,181 at December 31, 2020 and 2019, respectively. In addition, leases contracted for but not yet commenced were SAR 7,990 and SAR 7,467 at December 31, 2020 and 2019, respectively.
(b) SadaraIn March 2020, Saudi Aramco and Dow Chemical Company equally committed to comply with the Ministry of Energy feedstock agreement to support the development of Chemical Value Parks in the Kingdom with an amount of SAR 375. The first payment of SAR 38 will be deposited within one month from the date of supplying Sadara with additional ethane. The remaining funds will be deposited over nine years at SAR 38 annually. Saudi Aramco’s commitment of SAR 188 is outstanding at December 31, 2020.
All amounts in millions of Saudi Riyals unless otherwise stated66
Saud
i Ara
bian
Oil
Com
pany
| C
onso
lidat
ed fi
nanc
ial s
tate
men
ts f
or th
e ye
ar e
nded
Dec
embe
r 31
, 202
0

33. Commitments continued(c) IMICIn 2017, Saudi Aramco Development Company (“SADCO”), a wholly owned subsidiary of the Company, and Lamprell plc (“Lamprell”), Bahri and Korea Shipbuilding Offshore Engineering (“KSOE”), formerly known as Hyundai Heavy Industries, formed a company, IMIC, in which SADCO owns 50.1%, Lamprell owns 20%, Bahri owns 19.9% and KSOE owns 10%. The principal activities of IMIC are the development, operation, and maintenance of a maritime yard under construction by the Government, as well as, the design, manufacture, maintenance and repair of ships and rigs. The maritime yard will be divided into four main zones and completion of the construction of the individual zones will vary but is expected to be partially completed and operational by 2021. SADCO has committed to fund IMIC up to SAR 1,315 through equity contributions. At December 31, 2020, SAR 638 (2019: SAR 555) has been drawn down by IMIC.
(d) Saudi Aramco Rowan Offshore Drilling Company (“ARO Drilling”)In 2017, SADCO and Rowan Rex Limited formed a company, ARO Drilling (Note 38), to provide offshore drilling services to the Company. In 2018, Mukamala Oil Field Services Limited (“MOFSL”) was incorporated as a subsidiary of SADCO and all the investment and related commitments of ARO Drilling were transferred to MOFSL by way of a Novation Agreement. MOFSL has committed to invest SAR 2,719 through equity and shareholder loans, of which SAR 2,453 (2019: SAR 2,453) has been drawn down at December 31, 2020.
(e) Saudi Aramco Nabors Drilling Company (“SANAD”)In 2017, SADCO and Nabors International Netherlands BV formed a company, SANAD (Note 38), to provide onshore drilling services to the Company. In 2018, MOFSL was incorporated as a subsidiary of SADCO and all of SADCO’s investments and related commitments in and to ARO Drilling were transferred to MOFSL by way of a Novation Agreement. Saudi Aramco has committed to lease 50 onshore rigs over a ten-year period beginning in 2021 for an estimated value of SAR 24,263. In addition, Saudi Aramco has committed to award drilling contracts for an estimated value of SAR 52,489 for up to 20 new build offshore rigs to be purchased by ARO Drilling over a 10-year period.
(f) Arabian Rig Manufacturing Company (‘‘ARM’’)In June 2018, SADCO and NOV Downhole Eurasia Limited formed a company, ARM, to provide onshore land drilling manufacturing, equipment and services to SANAD and the Middle East and North Africa region. Saudi Aramco committed to invest SAR 225, of which, SAR 53 is invested at December 31, 2020 (2019: SAR 9). In addition, SADCO has guaranteed the purchase of 50 onshore rigs over a 12-year period beginning in 2021 for an estimated value of SAR 6,741, and has the option to cancel the onshore rig orders for a maximum financial exposure of SAR 1,358.
(g) Other(i) In order to comply with past Government directives, the Company expects to sell portions of its equity in Saudi Aramco Total
Refining and Petrochemical Company and Yanbu Aramco Sinopec Refining Company Ltd. (Note 39) through a public offering of shares in Saudi Arabia. Also in order to comply with a past Government directive, Excellent Performance Chemical Company (“EPCC”), a wholly owned subsidiary of the Company, expects to sell portions of its equity in Sadara (Note 34(a)) through a public offering of shares in Saudi Arabia.
(ii) Saudi Aramco is committed to comply with the Government directive to guarantee that Saudi Aramco Total Refining and Petrochemical Company and Yanbu Aramco Sinopec Refining Company Ltd. shall spend a total of SAR 750 over a 10-year period ending December 31, 2025 on social responsibility programs. At December 31, 2020, SAR 446 (2019: SAR 461) remains to be spent.
(iii) Saudi Aramco has commitments of SAR 328 (2019: SAR 384) to invest in private equity investments both inside and outside the Kingdom. Such commitments can be called on demand.
(iv) Saudi Aramco has commitments of SAR 55 (2019: SAR 58) to fund additional loans and acquire additional unlisted equity investments of certain small to mid-sized enterprises in the Kingdom. The commitments can be called by the enterprises upon meeting certain conditions.
All amounts in millions of Saudi Riyals unless otherwise stated67
Saud
i Ara
bian
Oil
Com
pany
| C
onso
lidat
ed fi
nanc
ial s
tate
men
ts f
or th
e ye
ar e
nded
Dec
embe
r 31
, 202
0
34. ContingenciesSaudi Aramco has contingent assets and liabilities with respect to certain disputed matters, including claims by and against contractors and lawsuits and arbitrations involving a variety of issues. These contingencies arise in the ordinary course of business. It is not anticipated that any material adjustments will result from these contingencies.
Saudi Aramco also has bank guarantees with respect to the acquisition of a subsidiary (Note 4) amounting to SAR 2,867 as of December 31, 2020 arising in the ordinary course of business.
Saudi Aramco also has contingent liabilities with respect to the following:
(a) SadaraIn 2011, EPCC and Dow Saudi Arabia Holding B.V. (together to be referred to as the “Founding Shareholders”) signed a shareholder agreement with a term of 99 years to construct and operate a fully-integrated chemicals complex at Jubail II Industrial City in Saudi Arabia (“the Project”). Shortly thereafter, the Founding Shareholders formed Sadara to execute the Project. In May 2019, Saudi Aramco committed to increase the total financing facility provided to Sadara from SAR 25,125 to SAR 32,035. As of December 31, 2020, SAR 30,678 (2019: SAR 28,362) has been drawn down.
In 2013, Sadara entered into definitive agreements with certain export credit agencies and commercial banks for approximately SAR 39,505 of project financing. In 2013, Sadara also conducted a project Sukuk issuance in Saudi Arabia for approximately SAR 7,500 with a final maturity in December 2028. Saudi Aramco previously provided guarantees of 65% of the senior debt (including Sukuk) amounts owed by Sadara to its senior creditors. Sadara achieved project completion on November 23, 2020, which triggered the automatic termination of these guarantees. As part of project completion, Saudi Aramco, on a several basis, provided a guarantee for the funding of 65% of the debt service reserve account (DSRA) balance required by the senior creditors to cover Sadara’s semi-annual scheduled senior debt principal and interest payments. Saudi Aramco’s guarantee amounts to approximately SAR 1,410 on a semi-annual basis. The DSRA guarantee terminates on the earliest of the final repayment date, a payment made under the DSRA guarantee, and a written release from the senior creditors’ security agent.
With respect to Sadara’s fuel and feed-stock allocation, Saudi Aramco has provided two letters of credit to the Ministry of Energy for SAR 169 and SAR 225 to construct epoxy plants and for the development of projects to support conversion industries in the Kingdom.
(b) Petro RabighIn March 2015, the two founding shareholders of Petro Rabigh, the Company and Sumitomo Chemical Co. Ltd., concluded external long-term debt financing arrangements (“Rabigh II Financing”) with lenders on behalf of Petro Rabigh for the Rabigh II Project (“the Project”) for which the two shareholders provided guarantees for their equal share of the Rabigh II Financing. On September 30, 2020, project completion under the Rabigh II Financing was successfully achieved. As a result, the guarantees provided of SAR 17,093 were released. Concurrently, a Debt Service Undertaking (“DSU”) was provided by the two founding shareholders that covers shortfalls in scheduled (not accelerated) debt service under the Rabigh II Financing until at least 50% of the shareholder guaranteed SAR 11,250 equity bridge loans (the “EBLs”) are repaid using share capital or shareholder-funded subordinated loans. The EBLs are due to be repaid on October 1, 2022. The amount utilized under the DSU as of December 31, 2020 was SAR 1,041 (Company’s share SAR 521).
In addition, the two founding shareholders provided Petro Rabigh with shareholder funded revolving facilities (the “Shareholder Facilities”) of up to SAR 7,500 with the Company’s share being SAR 4,688. As of December 31, 2020, Petro Rabigh has utilized SAR 6,750 (the Company’s share SAR 4,219). The Shareholder Facilities are scheduled to mature in September 2023, but provide for further tenor extensions, which are subject to certain conditions being met at that time.
All amounts in millions of Saudi Riyals unless otherwise stated68
Saud
i Ara
bian
Oil
Com
pany
| C
onso
lidat
ed fi
nanc
ial s
tate
men
ts f
or th
e ye
ar e
nded
Dec
embe
r 31
, 202
0
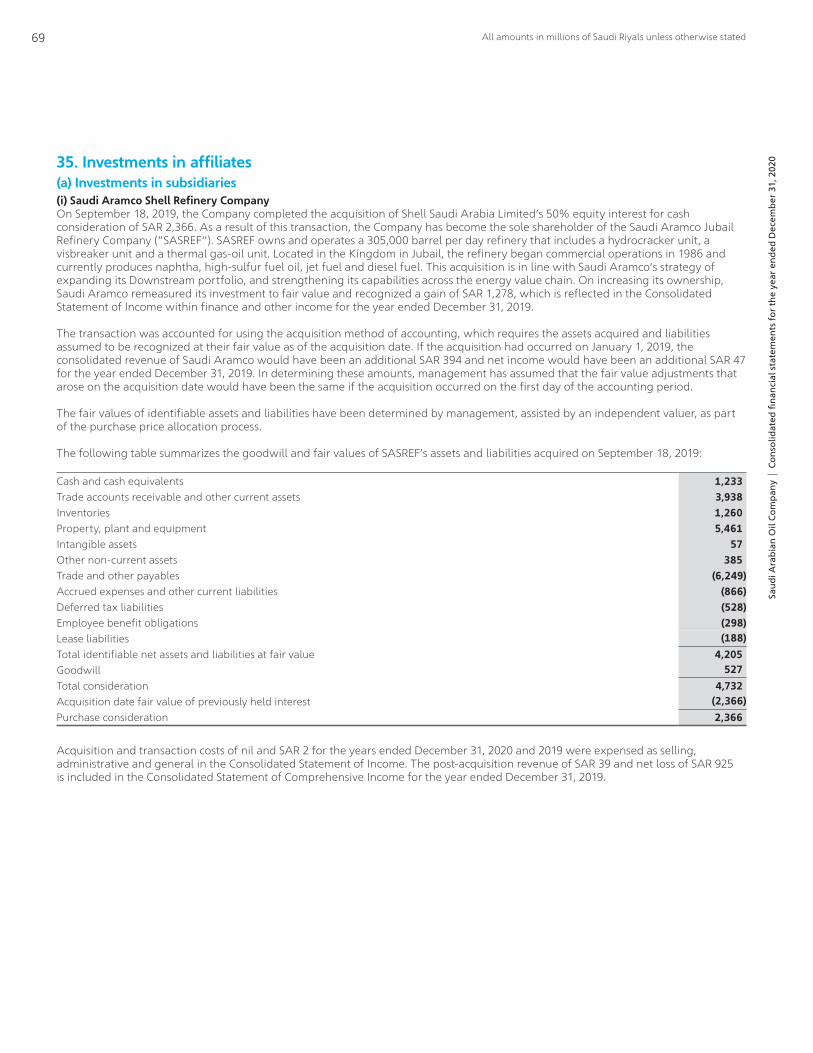
35. Investments in affiliates(a) Investments in subsidiaries(i) Saudi Aramco Shell Refinery CompanyOn September 18, 2019, the Company completed the acquisition of Shell Saudi Arabia Limited’s 50% equity interest for cash consideration of SAR 2,366. As a result of this transaction, the Company has become the sole shareholder of the Saudi Aramco Jubail Refinery Company (“SASREF”). SASREF owns and operates a 305,000 barrel per day refinery that includes a hydrocracker unit, a visbreaker unit and a thermal gas-oil unit. Located in the Kingdom in Jubail, the refinery began commercial operations in 1986 and currently produces naphtha, high-sulfur fuel oil, jet fuel and diesel fuel. This acquisition is in line with Saudi Aramco’s strategy of expanding its Downstream portfolio, and strengthening its capabilities across the energy value chain. On increasing its ownership, Saudi Aramco remeasured its investment to fair value and recognized a gain of SAR 1,278, which is reflected in the Consolidated Statement of Income within finance and other income for the year ended December 31, 2019.
The transaction was accounted for using the acquisition method of accounting, which requires the assets acquired and liabilities assumed to be recognized at their fair value as of the acquisition date. If the acquisition had occurred on January 1, 2019, the consolidated revenue of Saudi Aramco would have been an additional SAR 394 and net income would have been an additional SAR 47 for the year ended December 31, 2019. In determining these amounts, management has assumed that the fair value adjustments that arose on the acquisition date would have been the same if the acquisition occurred on the first day of the accounting period.
The fair values of identifiable assets and liabilities have been determined by management, assisted by an independent valuer, as part of the purchase price allocation process.
The following table summarizes the goodwill and fair values of SASREF’s assets and liabilities acquired on September 18, 2019:
Cash and cash equivalents 1,233Trade accounts receivable and other current assets 3,938Inventories 1,260Property, plant and equipment 5,461Intangible assets 57Other non-current assets 385Trade and other payables (6,249)Accrued expenses and other current liabilities (866)Deferred tax liabilities (528)Employee benefit obligations (298)Lease liabilities (188)Total identifiable net assets and liabilities at fair value 4,205Goodwill 527Total consideration 4,732Acquisition date fair value of previously held interest (2,366)Purchase consideration 2,366
Acquisition and transaction costs of nil and SAR 2 for the years ended December 31, 2020 and 2019 were expensed as selling, administrative and general in the Consolidated Statement of Income. The post-acquisition revenue of SAR 39 and net loss of SAR 925 is included in the Consolidated Statement of Comprehensive Income for the year ended December 31, 2019.
All amounts in millions of Saudi Riyals unless otherwise stated69
Saud
i Ara
bian
Oil
Com
pany
| C
onso
lidat
ed fi
nanc
ial s
tate
men
ts f
or th
e ye
ar e
nded
Dec
embe
r 31
, 202
0
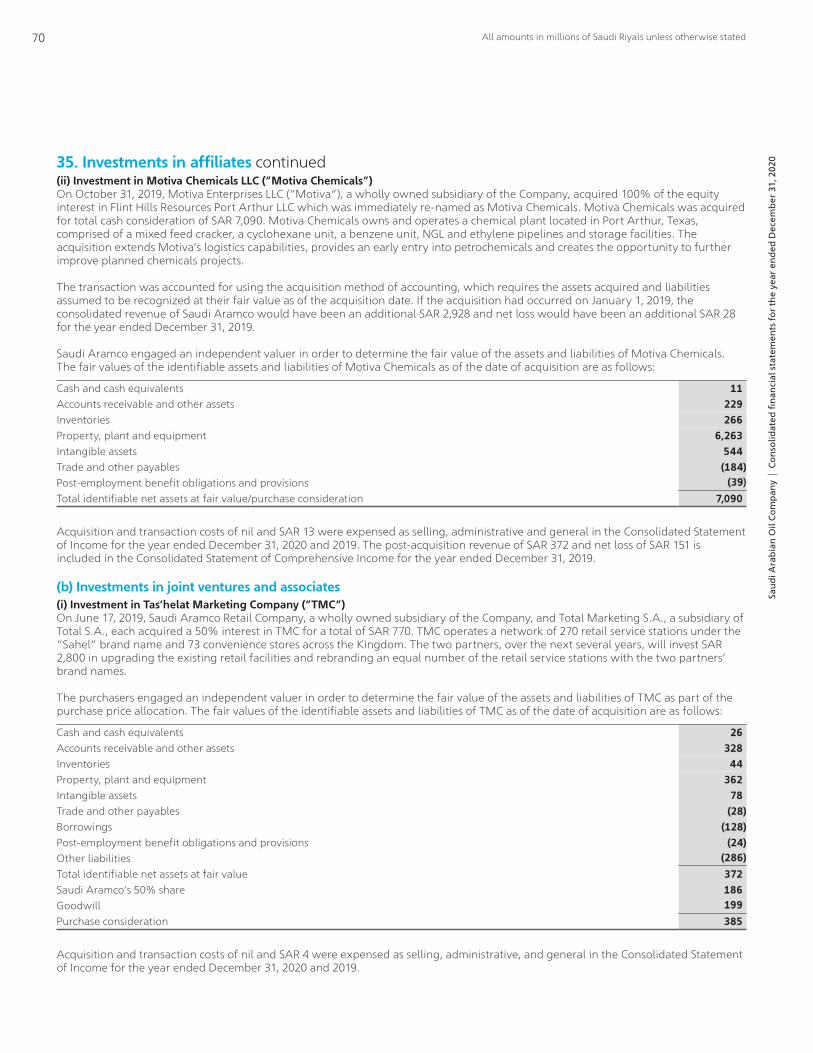
35. Investments in affiliates continued(ii) Investment in Motiva Chemicals LLC (“Motiva Chemicals”)On October 31, 2019, Motiva Enterprises LLC (“Motiva”), a wholly owned subsidiary of the Company, acquired 100% of the equity interest in Flint Hills Resources Port Arthur LLC which was immediately re-named as Motiva Chemicals. Motiva Chemicals was acquired for total cash consideration of SAR 7,090. Motiva Chemicals owns and operates a chemical plant located in Port Arthur, Texas, comprised of a mixed feed cracker, a cyclohexane unit, a benzene unit, NGL and ethylene pipelines and storage facilities. The acquisition extends Motiva’s logistics capabilities, provides an early entry into petrochemicals and creates the opportunity to further improve planned chemicals projects.
The transaction was accounted for using the acquisition method of accounting, which requires the assets acquired and liabilities assumed to be recognized at their fair value as of the acquisition date. If the acquisition had occurred on January 1, 2019, the consolidated revenue of Saudi Aramco would have been an additional SAR 2,928 and net loss would have been an additional SAR 28 for the year ended December 31, 2019.
Saudi Aramco engaged an independent valuer in order to determine the fair value of the assets and liabilities of Motiva Chemicals. The fair values of the identifiable assets and liabilities of Motiva Chemicals as of the date of acquisition are as follows:
Cash and cash equivalents 11Accounts receivable and other assets 229Inventories 266Property, plant and equipment 6,263Intangible assets 544Trade and other payables (184)Post-employment benefit obligations and provisions (39)Total identifiable net assets at fair value/purchase consideration 7,090
Acquisition and transaction costs of nil and SAR 13 were expensed as selling, administrative and general in the Consolidated Statement of Income for the year ended December 31, 2020 and 2019. The post-acquisition revenue of SAR 372 and net loss of SAR 151 is included in the Consolidated Statement of Comprehensive Income for the year ended December 31, 2019.
(b) Investments in joint ventures and associates(i) Investment in Tas’helat Marketing Company (“TMC”)On June 17, 2019, Saudi Aramco Retail Company, a wholly owned subsidiary of the Company, and Total Marketing S.A., a subsidiary of Total S.A., each acquired a 50% interest in TMC for a total of SAR 770. TMC operates a network of 270 retail service stations under the “Sahel” brand name and 73 convenience stores across the Kingdom. The two partners, over the next several years, will invest SAR 2,800 in upgrading the existing retail facilities and rebranding an equal number of the retail service stations with the two partners’ brand names.
The purchasers engaged an independent valuer in order to determine the fair value of the assets and liabilities of TMC as part of the purchase price allocation. The fair values of the identifiable assets and liabilities of TMC as of the date of acquisition are as follows:
Cash and cash equivalents 26Accounts receivable and other assets 328Inventories 44Property, plant and equipment 362Intangible assets 78Trade and other payables (28)Borrowings (128)Post-employment benefit obligations and provisions (24)Other liabilities (286)Total identifiable net assets at fair value 372Saudi Aramco’s 50% share 186Goodwill 199Purchase consideration 385
Acquisition and transaction costs of nil and SAR 4 were expensed as selling, administrative, and general in the Consolidated Statement of Income for the year ended December 31, 2020 and 2019.
All amounts in millions of Saudi Riyals unless otherwise stated70
Saud
i Ara
bian
Oil
Com
pany
| C
onso
lidat
ed fi
nanc
ial s
tate
men
ts f
or th
e ye
ar e
nded
Dec
embe
r 31
, 202
0

35. Investments in affiliates continued(ii) Hyundai OilbankOn December 17, 2019, Aramco Overseas Company B.V. (“AOC”), a wholly owned subsidiary of the Company, acquired a 17% equity interest in Hyundai Oilbank, a subsidiary of Hyundai Heavy Industries Holdings, for SAR 4,414 with an option to acquire an additional 2.9% which can be exercised at any time before the earlier of five years or Hyundai Oilbank’s IPO. Hyundai Oilbank is a private oil refining company in South Korea established in 1964. The business portfolio of Hyundai Oilbank and its subsidiaries includes oil refining, base oil, petrochemicals, and a network of gas stations. The investment in Hyundai Oilbank supports Saudi Aramco’s Downstream growth strategy of expanding its global footprint in key markets in profitable integrated refining, chemicals and marketing businesses which enable Saudi Aramco to place crude oil and leverage its trading capabilities.
The carrying value of Hyundai Oilbank is recorded as an investment in associate (Note 8). Saudi Aramco engaged an independent valuer in order to determine the fair values of the assets and liabilities of Hyundai Oilbank. As a result of the independent valuer’s concluded purchase price allocation report, the previously reported fair values of the identifiable investments in affiliates and intangible assets were updated. Accordingly, the fair values of the identifiable assets and liabilities of Hyundai Oilbank as of the date of acquisition are as follows:
Cash and cash equivalents 1,541Trade and other receivables 5,096Inventories 8,074Other assets 634Investments in affiliates 6,769Property, plant and equipment 26,100Intangible assets 3,566Trade and other payables (9,491)Borrowings (12,604)Other liabilities (4,432)Total identifiable net assets at fair value 25,253Hybrid securities (720)Non-controlling interest (3,045)Total identifiable net assets attributable to equity owners 21,488Saudi Aramco's 17% share 3,653Call option 143Goodwill 618Purchase consideration 4,414
(iii) Saudi Engines Manufacturing Company (“SEMC”)On May 19, 2019, Saudi Aramco Development Company (“SADCO”), a wholly owned subsidiary of the Company, Korea Shipbuilding Offshore Engineering (“KSOE”), and the Saudi Arabian Industrial Investments Company (“Dussur”) concluded an agreement to establish an affiliate to form an engine manufacturing and aftersales facility in the Kingdom. The affiliate, Saudi Engines Manufacturing Company (“SEMC”), is a limited liability company and was formed on November 16, 2020 by SADCO, which owns 55% of the affiliate, and KSOE and Dussur own 30% and 15%, respectively. SADCO is a 25% shareholder of Dussur. The total investment in SEMC will be up to SAR 646, of which SADCO’s share will be up to SAR 355.
(iv) Novel Non-Metallic Solutions Manufacturing (“Novel”)On October 22, 2020, SADCO and Baker Hughes Energy Technology UK Limited (“Baker Hughes”) established an affiliate to create a multi sectorial nonmetallic investment platform in the Kingdom. The affiliate, Novel Non-Metallic Solutions Manufacturing (“Novel”), is a limited liability company and is owned 50% each by SADCO and Baker Hughes. The total investment in Novel will be up to SAR 400, of which SADCO’s share will be up to SAR 200.
All amounts in millions of Saudi Riyals unless otherwise stated71
Saud
i Ara
bian
Oil
Com
pany
| C
onso
lidat
ed fi
nanc
ial s
tate
men
ts f
or th
e ye
ar e
nded
Dec
embe
r 31
, 202
0
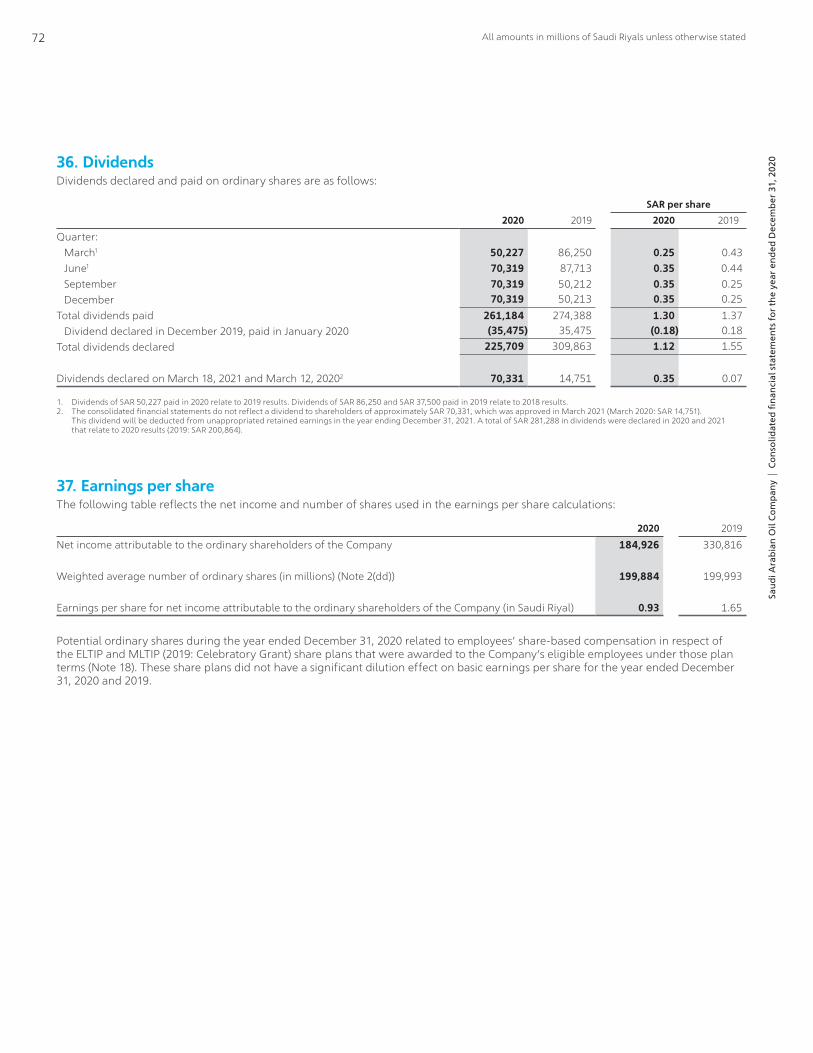
36. DividendsDividends declared and paid on ordinary shares are as follows:
SAR per share
2020 2019 2020 2019
Quarter: March1 50,227 86,250 0.25 0.43 June1 70,319 87,713 0.35 0.44 September 70,319 50,212 0.35 0.25 December 70,319 50,213 0.35 0.25Total dividends paid 261,184 274,388 1.30 1.37 Dividend declared in December 2019, paid in January 2020 (35,475) 35,475 (0.18) 0.18Total dividends declared 225,709 309,863 1.12 1.55
Dividends declared on March 18, 2021 and March 12, 20202 70,331 14,751 0.35 0.07
1. Dividends of SAR 50,227 paid in 2020 relate to 2019 results. Dividends of SAR 86,250 and SAR 37,500 paid in 2019 relate to 2018 results.2. The consolidated financial statements do not reflect a dividend to shareholders of approximately SAR 70,331, which was approved in March 2021 (March 2020: SAR 14,751).
This dividend will be deducted from unappropriated retained earnings in the year ending December 31, 2021. A total of SAR 281,288 in dividends were declared in 2020 and 2021 that relate to 2020 results (2019: SAR 200,864).
37. Earnings per shareThe following table reflects the net income and number of shares used in the earnings per share calculations:
2020 2019
Net income attributable to the ordinary shareholders of the Company 184,926 330,816
Weighted average number of ordinary shares (in millions) (Note 2(dd)) 199,884 199,993
Earnings per share for net income attributable to the ordinary shareholders of the Company (in Saudi Riyal) 0.93 1.65
Potential ordinary shares during the year ended December 31, 2020 related to employees’ share-based compensation in respect of the ELTIP and MLTIP (2019: Celebratory Grant) share plans that were awarded to the Company’s eligible employees under those plan terms (Note 18). These share plans did not have a significant dilution effect on basic earnings per share for the year ended December 31, 2020 and 2019.
All amounts in millions of Saudi Riyals unless otherwise stated72
Saud
i Ara
bian
Oil
Com
pany
| C
onso
lidat
ed fi
nanc
ial s
tate
men
ts f
or th
e ye
ar e
nded
Dec
embe
r 31
, 202
0

38. Subsidiaries of Saudi Arabian Oil Company
Principal business activity
Place of business/
country of incorporation
Conventional financial
assets as of December 31,
20201,2
Conventional financial
liabilities as of December 31,
20202
Interest income from conventional
financial assets for the
year ended December 31,
20202
A. Wholly owned:4 Rivers Energy LLC Retail fuel operations USA – – –
Aramco (Beijing) Venture Management Consultant Co. Ltd Investment
People’s Republic of
China 1 1 –Aramco Affiliated Services Company Support services USA 1 – –
Aramco Asia India Private LimitedPurchasing and other services India 15 25 –
Aramco Asia Japan K.K.Purchasing and other services Japan 226 486 –
Aramco Asia Korea Ltd.Purchasing and other services South Korea 39 8 –
Aramco Asia Singapore Pte. Ltd.Purchasing and other services Singapore 23 48 –
Aramco Associated Company Aircraft operations USA 213 501 20Aramco Capital Company, LLC Aircraft leasing USA 10 1 1Aramco Chemicals Company Chemicals Saudi Arabia 799 518 2
Aramco Far East (Beijing) Business Services Co., Ltd.
Petrochemical purchasing/sales and other services
People’s Republic of
China 490 122 6Aramco Financial Services Company Financing USA 1 (1) –
Aramco Gulf Operations Company Ltd.Production and sale of crude oil Saudi Arabia 752 1,155 1
Aramco Innovations LLCResearch and commercialization Russia 12 2 –
Aramco International Company Limited Support servicesBritish Virgin
Islands – – –Aramco Lubricants and Retail Company (formerly: Saudi Aramco Retail Company) Retail fuel marketing Saudi Arabia 37 – –Aramco Overseas Company Azerbaijan Support services Azerbaijan – (1) –
Aramco Overseas Company B.V.Purchasing and other services Netherlands 3,623 2,059 60
Aramco Overseas Company Spain, S.L.Personnel and other support services Spain – – –
Aramco Overseas Company UK, LimitedPersonnel and other support services
United Kingdom 3 139 –
Aramco Overseas Egypt LLCPersonnel and other support services Egypt – – –
Aramco Overseas Indonesia PT PMA ("AOI")Project management support Indonesia – – –
Aramco Overseas Malaysia Sdn. BhdPersonnel and other support services Malaysia 12 – –
Aramco Performance Materials LLCPetrochemical manufacture and sales USA 10 6 –
Aramco Services CompanyPurchasing, engineering and other services USA 345 404 1
Aramco Shared Benefits Company Benefit administration USA – – –
Aramco Trading Company
Importing, exporting and trading of crude oil, refined and chemical products Saudi Arabia 6,882 3,280 70
Aramco Trading Fujairah FZE Importing/exporting refined products UAE 997 680 1
All amounts in millions of Saudi Riyals unless otherwise stated73
Saud
i Ara
bian
Oil
Com
pany
| C
onso
lidat
ed fi
nanc
ial s
tate
men
ts f
or th
e ye
ar e
nded
Dec
embe
r 31
, 202
0
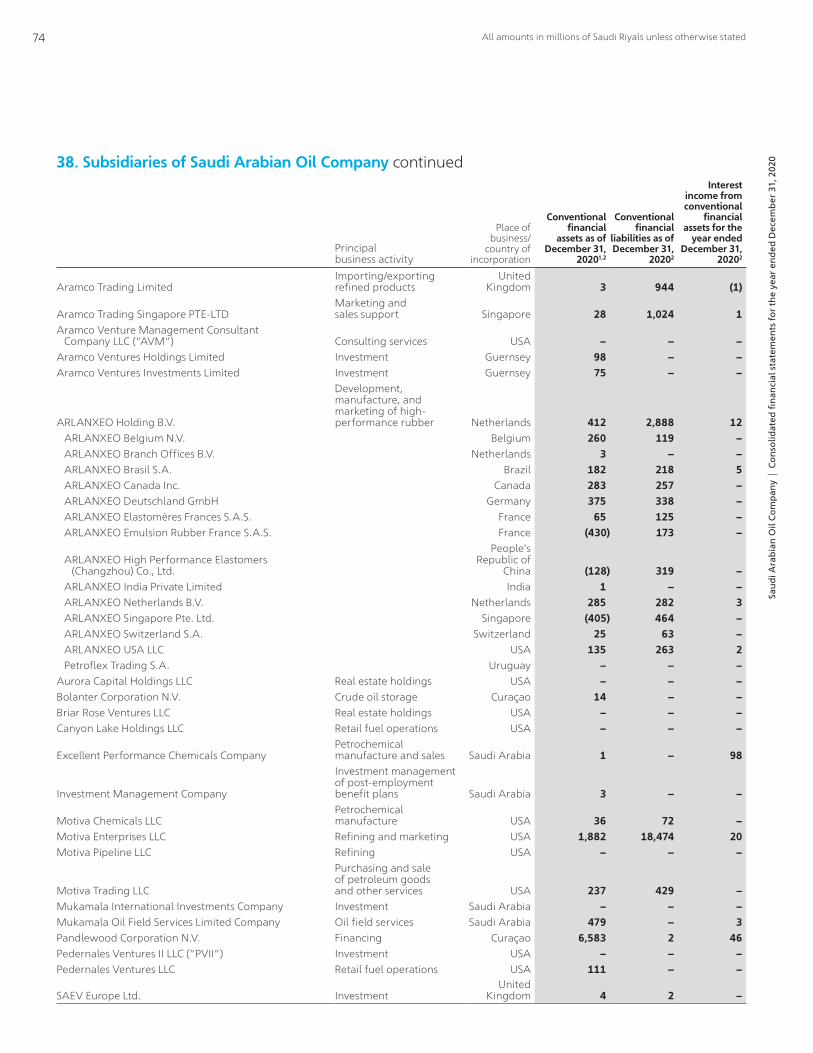
Principal business activity
Place of business/
country of incorporation
Conventional financial
assets as of December 31,
20201,2
Conventional financial
liabilities as of December 31,
20202
Interest income from conventional
financial assets for the
year ended December 31,
20202
Aramco Trading LimitedImporting/exporting refined products
United Kingdom 3 944 (1)
Aramco Trading Singapore PTE-LTDMarketing and sales support Singapore 28 1,024 1
Aramco Venture Management Consultant Company LLC (“AVM”) Consulting services USA – – –Aramco Ventures Holdings Limited Investment Guernsey 98 – –Aramco Ventures Investments Limited Investment Guernsey 75 – –
ARLANXEO Holding B.V.
Development, manufacture, and marketing of high-performance rubber Netherlands 412 2,888 12
ARLANXEO Belgium N.V. Belgium 260 119 – ARLANXEO Branch Offices B.V. Netherlands 3 – – ARLANXEO Brasil S.A. Brazil 182 218 5 ARLANXEO Canada Inc. Canada 283 257 – ARLANXEO Deutschland GmbH Germany 375 338 – ARLANXEO Elastomères Frances S.A.S. France 65 125 – ARLANXEO Emulsion Rubber France S.A.S. France (430) 173 –
ARLANXEO High Performance Elastomers (Changzhou) Co., Ltd.
People's Republic of
China (128) 319 – ARLANXEO India Private Limited India 1 – – ARLANXEO Netherlands B.V. Netherlands 285 282 3 ARLANXEO Singapore Pte. Ltd. Singapore (405) 464 – ARLANXEO Switzerland S.A. Switzerland 25 63 – ARLANXEO USA LLC USA 135 263 2 Petroflex Trading S.A. Uruguay – – –Aurora Capital Holdings LLC Real estate holdings USA – – –Bolanter Corporation N.V. Crude oil storage Curaçao 14 – –Briar Rose Ventures LLC Real estate holdings USA – – –Canyon Lake Holdings LLC Retail fuel operations USA – – –
Excellent Performance Chemicals CompanyPetrochemical manufacture and sales Saudi Arabia 1 – 98
Investment Management Company
Investment management of post-employment benefit plans Saudi Arabia 3 – –
Motiva Chemicals LLCPetrochemical manufacture USA 36 72 –
Motiva Enterprises LLC Refining and marketing USA 1,882 18,474 20Motiva Pipeline LLC Refining USA – – –
Motiva Trading LLC
Purchasing and sale of petroleum goods and other services USA 237 429 –
Mukamala International Investments Company Investment Saudi Arabia – – –Mukamala Oil Field Services Limited Company Oil field services Saudi Arabia 479 – 3Pandlewood Corporation N.V. Financing Curaçao 6,583 2 46Pedernales Ventures II LLC ("PVII") Investment USA – – –Pedernales Ventures LLC Retail fuel operations USA 111 – –
SAEV Europe Ltd. InvestmentUnited
Kingdom 4 2 –
38. Subsidiaries of Saudi Arabian Oil Company continued
All amounts in millions of Saudi Riyals unless otherwise stated74
Saud
i Ara
bian
Oil
Com
pany
| C
onso
lidat
ed fi
nanc
ial s
tate
men
ts f
or th
e ye
ar e
nded
Dec
embe
r 31
, 202
0

Principal business activity
Place of business/
country of incorporation
Conventional financial
assets as of December 31,
20201,2
Conventional financial
liabilities as of December 31,
20202
Interest income from conventional
financial assets for the
year ended December 31,
20202
SAEV Guernsey 1 Ltd. Investment Guernsey 147 – –SAEV Guernsey Holdings Ltd. Investment Guernsey 1,273 – 1Saudi Aramco Asia Company Ltd. Investment Saudi Arabia 2,079 – 15Saudi Aramco Capital Company Limited Investment Guernsey – – –Saudi Aramco Development Company Investment Saudi Arabia 536 – 1Saudi Aramco Energy Ventures – U.S. LLC Investment USA 2 1 –Saudi Aramco Energy Ventures LLC Investment Saudi Arabia 17 – –Saudi Aramco Entrepreneurship Center Company Ltd. Financing Saudi Arabia 151 4 5Saudi Aramco Entrepreneurship Venture Company, Ltd. Investment Saudi Arabia 229 – –Saudi Aramco Jubail Refinery Company Refining Saudi Arabia – 2,757 –Saudi Aramco Power Company Power generation Saudi Arabia 6,197 3 16Saudi Aramco Sukuk Company Investment Saudi Arabia – 28 –
Saudi Aramco TechnologiesResearch and commercialization Saudi Arabia 116 40 –
Saudi Aramco Upstream Technology CompanyResearch and commercialization Saudi Arabia 10 – –
Saudi Petroleum International, Inc.Marketing support services USA 40 47 –
Saudi Petroleum Overseas, Ltd.Marketing support and tanker services
United Kingdom 52 37 –
Saudi Petroleum, Ltd.Marketing support and tanker services
British Virgin Islands 38 – –
Saudi Refining, Inc. Refining and marketing USA 277 62 1Stellar Insurance, Ltd. Insurance Bermuda 9,854 990 619
Vela International Marine Ltd.Marine management and transportation Liberia 27,317 – 128
Wisayah Global Investment Company Financial support Saudi Arabia 202 21 1
B. Unconsolidated structured entityEnergy City Development Company ("SPARK") Industrial development Saudi Arabia – – –Energy City Operating Company ("SPARK") Industrial development Saudi Arabia – – –
C. Non-wholly owned4
49% Ownership of Aramco Training Services Company3 Training USA 1 – –
50% Ownership of ARLANXEO-TSRC (Nantong) Chemical Industries Co., Ltd.3
Development, manufacture, and marketing of high-performance rubber
People’s Republic of
China 17 57 –80% Ownership of Johns Hopkins Aramco Healthcare Company Healthcare Saudi Arabia 623 568 3
70% Ownership of Saudi Aramco Base Oil Company – LUBEREF
Production and sale of petroleum based lubricants Saudi Arabia 510 2,766 2
50% Ownership of Saudi Aramco Nabors Drilling Company3 Drilling Saudi Arabia 1,370 1,998 1150% Ownership of Saudi Aramco Rowan Offshore Drilling Company3 Drilling Saudi Arabia 891 2,168 2561.6% Ownership of S-Oil Corporation Refining South Korea 3,930 31,471 3961.6% Ownership of S-Oil Singapore Pte. Ltd. Marketing support Singapore 5 45 –
61.6% Ownership of S-International Ltd.Purchasing and sale of petroleum goods
The Independent
State of Samoa 4 – –
38. Subsidiaries of Saudi Arabian Oil Company continued
All amounts in millions of Saudi Riyals unless otherwise stated75
Saud
i Ara
bian
Oil
Com
pany
| C
onso
lidat
ed fi
nanc
ial s
tate
men
ts f
or th
e ye
ar e
nded
Dec
embe
r 31
, 202
0

Principal business activity
Place of business/
country of incorporation
Conventional financial
assets as of December 31,
20201,2
Conventional financial
liabilities as of December 31,
20202
Interest income from conventional
financial assets for the
year ended December 31,
20202
70% Ownership of Saudi Basic Industries Corporation (“SABIC”)5 Holding Saudi Arabia
70% Ownership of SABIC Luxembourg S.àr.l. ("SLUX") Holding Luxembourg70% Ownership of SABIC Industrial Investments Company ("SIIC") Holding Saudi Arabia70% Ownership of Arabian Petrochemical Company ("PETROKEMYA")7 Toller Saudi Arabia70% Ownership of Saudi Iron and Steel Company ("HADEED") Metals Saudi Arabia70% Ownership of SABIC Investment and Local Content Development Company ("NUSANED") Investment Saudi Arabia70% Ownership of SABIC Agri-Nutrients Investment Company ("SANIC") Agri-Nutrients Saudi Arabia70% Ownership of International Shipping and Transportation Co. ("ISTC") Support services Saudi Arabia70% Ownership of SABIC Supply Chain Services Limited Company ("SSCS") Petrochemical Saudi Arabia70% Ownership of Saudi Specialty chemicals company ("SP. CHEM")7 Petrochemical Saudi Arabia70% Ownership of Saudi Organometallic Chemicals Company ("SOCC")7 Petrochemical Saudi Arabia50% Ownership of National Chemical Fertiliser Company ("IBN AL-BAYTAR")3 Agri-Nutrients Saudi Arabia49% Ownership of National Industrial Gases Company ("GAS")3 Toller Saudi Arabia36.4% Ownership of Yanbu National Petrochemical Company ("YANSAB")3 Toller Saudi Arabia52.5% Ownership of Saudi Methanol Company ("AR-RAZI") Toller Saudi Arabia35% Ownership of Al-Jubail Fertiliser Company ("AL BAYRONI")3 Agri-Nutrients Saudi Arabia35% Ownership of National Methanol Company ("IBN-SINA")3 Toller Saudi Arabia33.6% Ownership of Arabian Industrial Fibers Company ("IBN RUSHD")3 Toller Saudi Arabia30% Ownership of SABIC Agri-Nutrients Company (“SABIC AGRI-NUTRIENTS”) (formerly: Saudi Arabian Fertilizer Company ("SAFCO"))3 Agri-Nutrients Saudi Arabia24.5% Ownership of Saudi Kayan Petrochemical Company ("SAUDI KAYAN")3 Toller Saudi ArabiaOwnership of SABIC Industrial Catalyst Company ("SABCAT")6 Petrochemical Saudi ArabiaOwnership of Saudi Carbon Fibre Company ("SCFC")6 Petrochemical Saudi ArabiaOwnership of Saudi Japanese Acrylonitrile Company ("SHROUQ")6 Petrochemical Saudi Arabia70% Ownership of SABIC Innovative Plastics Argentina SRL
Petrochemical manufacture and sales Argentina
70% Ownership of SHPP Argentina SRLPetrochemical manufacture and sales Argentina
70% Ownership of SABIC Australia Pty Ltd. Holding Australia70% Ownership of SABIC Innovative Plastics GmbH & Co. KG Agent Austria
38. Subsidiaries of Saudi Arabian Oil Company continued
All amounts in millions of Saudi Riyals unless otherwise stated76
Saud
i Ara
bian
Oil
Com
pany
| C
onso
lidat
ed fi
nanc
ial s
tate
men
ts f
or th
e ye
ar e
nded
Dec
embe
r 31
, 202
0

Principal business activity
Place of business/
country of incorporation
Conventional financial
assets as of December 31,
20201,2
Conventional financial
liabilities as of December 31,
20202
Interest income from conventional
financial assets for the
year ended December 31,
20202
70% Ownership of SABIC Innovative Plastics South America-Indústria e Comércio de Plásticos Ltda
Petrochemical manufacture and sales Brazil
70% Ownership of SHPP South America Comércio de Plásticos Ltda
Petrochemical manufacture and sales Brazil
70% Ownership of NV Pijpleiding Antwerpen-Limburg-Luik ("PALL") Support services Belgium70% Ownership of SABIC Belgium NV Petrochemical Belgium70% Ownership of SHPP Canada, Inc. Petrochemical Canada
70% Ownership of SABIC Petrochemicals Canada, Inc. Petrochemical manufacture and sales Canada
70% Ownership of SABIC Innovative Plastics (China) Co., Ltd. Petrochemical
People's Republic of
China
70% Ownership of SABIC Innovative Plastics (Chongqing) Co., Ltd.
Petrochemical manufacture and sales
People's Republic of
China
70% Ownership of SABIC Innovative Plastics International Trading (Shanghai) Ltd. Reseller
People's Republic of
China
70% Ownership of SABIC Innovative Plastics Management (Shanghai) Co., Ltd. Support services
People's Republic of
China
70% Ownership of SHPP (Shanghai) Co., Ltd. Petrochemical
People's Republic of
China
70% Ownership of SABIC (Shanghai) Trading Co. Ltd. Reseller
People's Republic of
China
70% Ownership of SABIC (China) Research & Development Co. Ltd. T&I
People's Republic of
China
70% Ownership of SABIC China Holding Co. Ltd. Petrochemical
People's Republic of
China70% Ownership of SABIC Innovative Plastics Czech s.r.o. Agent
Czech Republic
70% Ownership of SHPP Czech s.r.o. ResellerCzech
Republic70% Ownership of SABIC Innovative Plastics Denmark Aps Agent Denmark70% Ownership of SABIC Nordic A/S Agent Denmark70% Ownership of SHPP Denmark Aps Reseller Denmark70% Ownership of SABIC Innovative Plastics Finland Oy Agent Finland70% Ownership of SHPP Finland Oy Reseller Finland70% Ownership of SABIC France S.A.S. Reseller France70% Ownership of SABIC Innovative Plastics France S.A.S. Agent France70% Ownership of SHPP France S.A.S. Reseller France70% Ownership of SABIC Deutschland GmbH Reseller Germany70% Ownership of SABIC Holding Deutschland GmbH Holding Germany70% Ownership of SABIC Innovative Plastics GmbH Agent Germany70% Ownership of SABIC Innovative Plastics Holding Germany GmbH Holding Germany
38. Subsidiaries of Saudi Arabian Oil Company continued
All amounts in millions of Saudi Riyals unless otherwise stated77
Saud
i Ara
bian
Oil
Com
pany
| C
onso
lidat
ed fi
nanc
ial s
tate
men
ts f
or th
e ye
ar e
nded
Dec
embe
r 31
, 202
0

Principal business activity
Place of business/
country of incorporation
Conventional financial
assets as of December 31,
20201,2
Conventional financial
liabilities as of December 31,
20202
Interest income from conventional
financial assets for the
year ended December 31,
20202
70% Ownership of SABIC Polyolefine GmbH Toller Germany70% Ownership of SHPP Germany GmbH Reseller Germany70% Ownership of SABIC Greece M.E.P.E. Agent Greece70% Ownership of SABIC Innovative Plastics Hong Kong Ltd. Reseller Hong Kong70% Ownership of SABIC Innovative Plastics SIT Holding Ltd. Holding Hong Kong70% Ownership of SABIC Innovative Plastics Taiwan Holding Ltd. Petrochemical Hong Kong70% Ownership of SHPP Hong Kong Reseller Hong Kong70% Ownership of SABIC Hungary Kft. Agent Hungary70% Ownership of SABIC Innovative Plastics Kereskedelmi Kft. Agent Hungary70% Ownership of SHPP Hungary Kft. Reseller Hungary70% Ownership of SABIC India Pvt Ltd. Agent India70% Ownership of SABIC Innovative Plastics India Private Ltd.
Petrochemical manufacture and sales India
70% Ownership of SABIC R&T Pvt Ltd. T&I India70% Ownership of High Performance Plastics India Pvt Ltd.
Petrochemical manufacture and sales India
70% Ownership of SABIC Innovative Plastics Italy Srl Toller Italy70% Ownership of SABIC Italia Srl Reseller Italy70% Ownership of SABIC Sales Italy Srl Agent Italy70% Ownership of SHPP Italy Srl Toller Italy70% Ownership of SHPP Sales Italy Srl Reseller Italy
70% Ownership of SHPP Japan LLCPetrochemical manufacture and sales Japan
70% Ownership of SABIC Petrochemicals Japan LLC Petrochemical Japan70% Ownership of SABIC Korea Ltd. Petrochemical South Korea70% Ownership of SHPP Korea Ltd. Reseller South Korea70% Ownership of SABIC Innovative Plastics Malaysia Sdn Bhd Agent Malaysia70% Ownership of SHPP Malaysia Sdn Bhd Reseller Malaysia70% Ownership of SABIC Innovative Plastics Mexico S de RL de CV
Petrochemical manufacture and sales Mexico
70% Ownership of SABIC Innovative Plastics Servicios Mexico S de RL de CV Support services Mexico70% Ownership of High Performance Plastics Manufacturing Mexico S de RL de CV
Petrochemical manufacture and sales Mexico
70% Ownership of High Performance Plastics Service Mexico S de RL de CV Support services Mexico
70% Ownership of BV Snij-Unie HiFiPetrochemical manufacture and sales Netherlands
70% Ownership of SABIC Capital B.V. Financing Netherlands70% Ownership of SABIC Capital I B.V. Financing Netherlands70% Ownership of Petrochemical Pipeline Services B.V. Support services Netherlands70% Ownership of SABIC Europe B.V. Holding Netherlands70% Ownership of SABIC Global Technologies B.V. T&I Netherlands70% Ownership of SABIC International Holdings B.V. Holding Netherlands
70% Ownership of SABIC Innovative Plastics B.V.Principal (Manufacturing, Sales, R&D) Netherlands
38. Subsidiaries of Saudi Arabian Oil Company continued
All amounts in millions of Saudi Riyals unless otherwise stated78
Saud
i Ara
bian
Oil
Com
pany
| C
onso
lidat
ed fi
nanc
ial s
tate
men
ts f
or th
e ye
ar e
nded
Dec
embe
r 31
, 202
0
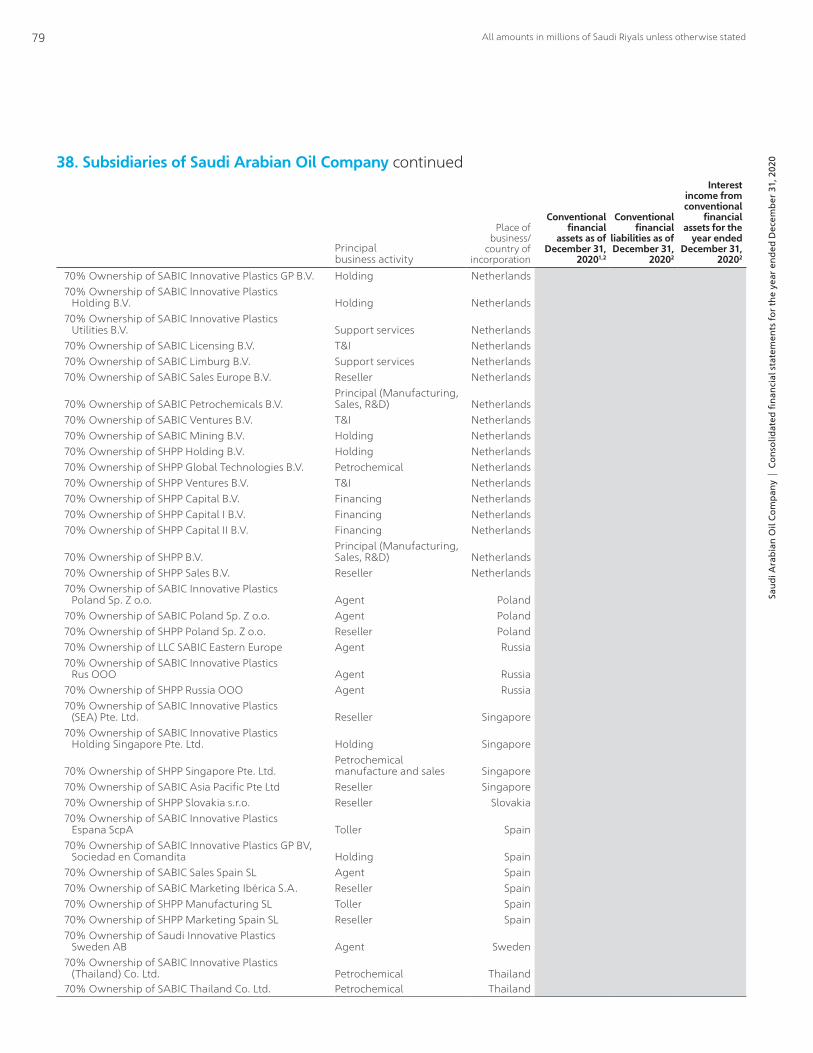
Principal business activity
Place of business/
country of incorporation
Conventional financial
assets as of December 31,
20201,2
Conventional financial
liabilities as of December 31,
20202
Interest income from conventional
financial assets for the
year ended December 31,
20202
70% Ownership of SABIC Innovative Plastics GP B.V. Holding Netherlands70% Ownership of SABIC Innovative Plastics Holding B.V. Holding Netherlands70% Ownership of SABIC Innovative Plastics Utilities B.V. Support services Netherlands70% Ownership of SABIC Licensing B.V. T&I Netherlands70% Ownership of SABIC Limburg B.V. Support services Netherlands70% Ownership of SABIC Sales Europe B.V. Reseller Netherlands
70% Ownership of SABIC Petrochemicals B.V.Principal (Manufacturing, Sales, R&D) Netherlands
70% Ownership of SABIC Ventures B.V. T&I Netherlands70% Ownership of SABIC Mining B.V. Holding Netherlands70% Ownership of SHPP Holding B.V. Holding Netherlands70% Ownership of SHPP Global Technologies B.V. Petrochemical Netherlands70% Ownership of SHPP Ventures B.V. T&I Netherlands70% Ownership of SHPP Capital B.V. Financing Netherlands70% Ownership of SHPP Capital I B.V. Financing Netherlands70% Ownership of SHPP Capital II B.V. Financing Netherlands
70% Ownership of SHPP B.V.Principal (Manufacturing, Sales, R&D) Netherlands
70% Ownership of SHPP Sales B.V. Reseller Netherlands70% Ownership of SABIC Innovative Plastics Poland Sp. Z o.o. Agent Poland70% Ownership of SABIC Poland Sp. Z o.o. Agent Poland70% Ownership of SHPP Poland Sp. Z o.o. Reseller Poland70% Ownership of LLC SABIC Eastern Europe Agent Russia70% Ownership of SABIC Innovative Plastics Rus OOO Agent Russia70% Ownership of SHPP Russia OOO Agent Russia70% Ownership of SABIC Innovative Plastics (SEA) Pte. Ltd. Reseller Singapore70% Ownership of SABIC Innovative Plastics Holding Singapore Pte. Ltd. Holding Singapore
70% Ownership of SHPP Singapore Pte. Ltd.Petrochemical manufacture and sales Singapore
70% Ownership of SABIC Asia Pacific Pte Ltd Reseller Singapore70% Ownership of SHPP Slovakia s.r.o. Reseller Slovakia70% Ownership of SABIC Innovative Plastics Espana ScpA Toller Spain70% Ownership of SABIC Innovative Plastics GP BV, Sociedad en Comandita Holding Spain70% Ownership of SABIC Sales Spain SL Agent Spain70% Ownership of SABIC Marketing Ibérica S.A. Reseller Spain70% Ownership of SHPP Manufacturing SL Toller Spain70% Ownership of SHPP Marketing Spain SL Reseller Spain70% Ownership of Saudi Innovative Plastics Sweden AB Agent Sweden70% Ownership of SABIC Innovative Plastics (Thailand) Co. Ltd. Petrochemical Thailand70% Ownership of SABIC Thailand Co. Ltd. Petrochemical Thailand
38. Subsidiaries of Saudi Arabian Oil Company continued
All amounts in millions of Saudi Riyals unless otherwise stated79
Saud
i Ara
bian
Oil
Com
pany
| C
onso
lidat
ed fi
nanc
ial s
tate
men
ts f
or th
e ye
ar e
nded
Dec
embe
r 31
, 202
0
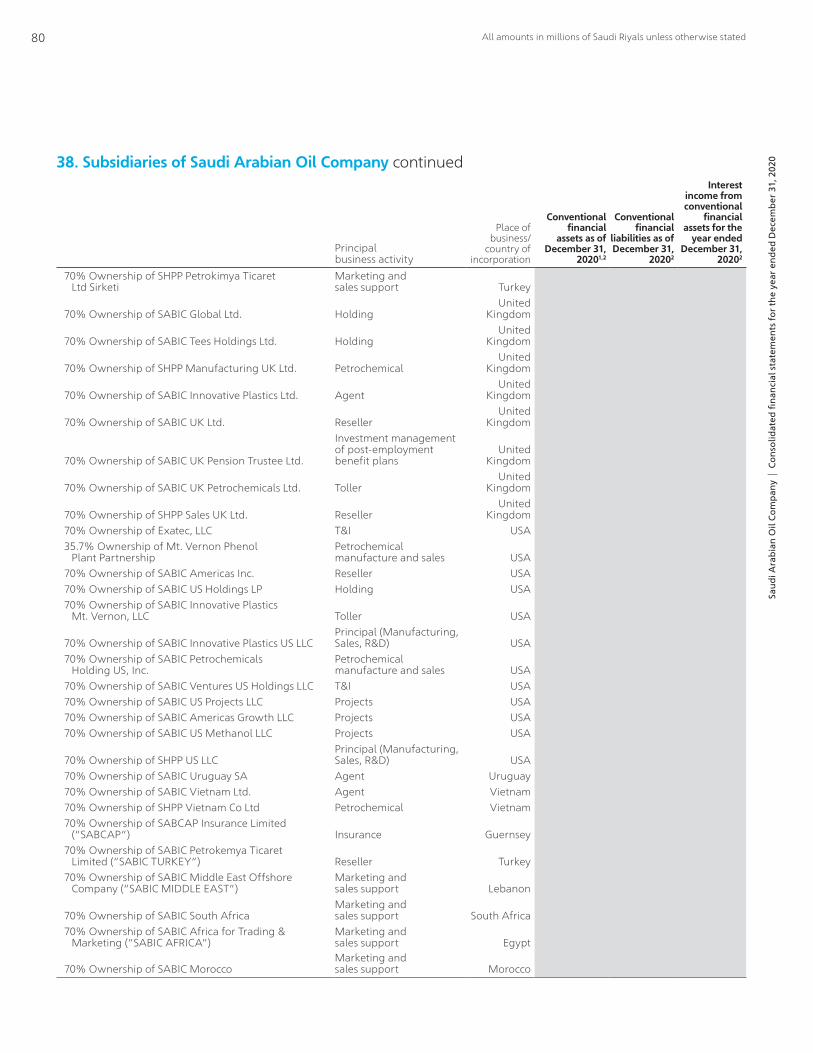
Principal business activity
Place of business/
country of incorporation
Conventional financial
assets as of December 31,
20201,2
Conventional financial
liabilities as of December 31,
20202
Interest income from conventional
financial assets for the
year ended December 31,
20202
70% Ownership of SHPP Petrokimya Ticaret Ltd Sirketi
Marketing and sales support Turkey
70% Ownership of SABIC Global Ltd. HoldingUnited
Kingdom
70% Ownership of SABIC Tees Holdings Ltd. HoldingUnited
Kingdom
70% Ownership of SHPP Manufacturing UK Ltd. PetrochemicalUnited
Kingdom
70% Ownership of SABIC Innovative Plastics Ltd. AgentUnited
Kingdom
70% Ownership of SABIC UK Ltd. ResellerUnited
Kingdom
70% Ownership of SABIC UK Pension Trustee Ltd.
Investment management of post-employment benefit plans
United Kingdom
70% Ownership of SABIC UK Petrochemicals Ltd. TollerUnited
Kingdom
70% Ownership of SHPP Sales UK Ltd. ResellerUnited
Kingdom70% Ownership of Exatec, LLC T&I USA35.7% Ownership of Mt. Vernon Phenol Plant Partnership
Petrochemical manufacture and sales USA
70% Ownership of SABIC Americas Inc. Reseller USA70% Ownership of SABIC US Holdings LP Holding USA70% Ownership of SABIC Innovative Plastics Mt. Vernon, LLC Toller USA
70% Ownership of SABIC Innovative Plastics US LLCPrincipal (Manufacturing, Sales, R&D) USA
70% Ownership of SABIC Petrochemicals Holding US, Inc.
Petrochemical manufacture and sales USA
70% Ownership of SABIC Ventures US Holdings LLC T&I USA70% Ownership of SABIC US Projects LLC Projects USA70% Ownership of SABIC Americas Growth LLC Projects USA70% Ownership of SABIC US Methanol LLC Projects USA
70% Ownership of SHPP US LLCPrincipal (Manufacturing, Sales, R&D) USA
70% Ownership of SABIC Uruguay SA Agent Uruguay70% Ownership of SABIC Vietnam Ltd. Agent Vietnam70% Ownership of SHPP Vietnam Co Ltd Petrochemical Vietnam70% Ownership of SABCAP Insurance Limited ("SABCAP") Insurance Guernsey70% Ownership of SABIC Petrokemya Ticaret Limited ("SABIC TURKEY") Reseller Turkey70% Ownership of SABIC Middle East Offshore Company ("SABIC MIDDLE EAST")
Marketing and sales support Lebanon
70% Ownership of SABIC South AfricaMarketing and sales support South Africa
70% Ownership of SABIC Africa for Trading & Marketing ("SABIC AFRICA")
Marketing and sales support Egypt
70% Ownership of SABIC MoroccoMarketing and sales support Morocco
38. Subsidiaries of Saudi Arabian Oil Company continued
All amounts in millions of Saudi Riyals unless otherwise stated80
Saud
i Ara
bian
Oil
Com
pany
| C
onso
lidat
ed fi
nanc
ial s
tate
men
ts f
or th
e ye
ar e
nded
Dec
embe
r 31
, 202
0
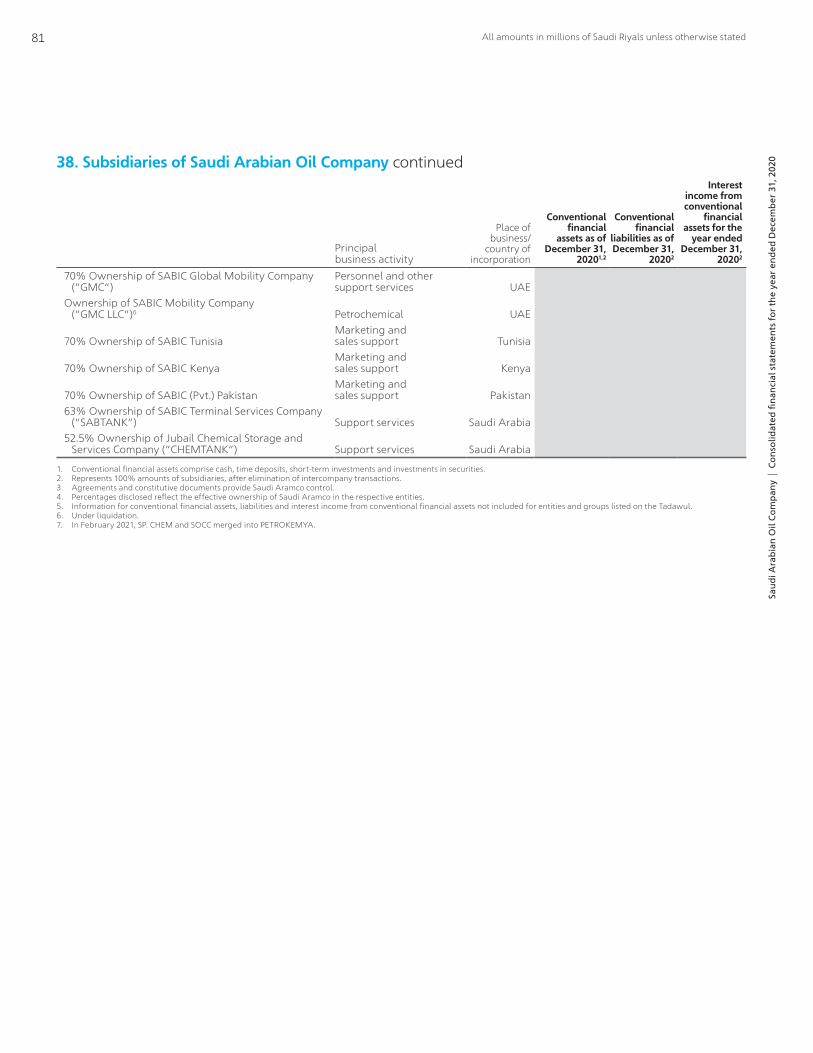
Principal business activity
Place of business/
country of incorporation
Conventional financial
assets as of December 31,
20201,2
Conventional financial
liabilities as of December 31,
20202
Interest income from conventional
financial assets for the
year ended December 31,
20202
70% Ownership of SABIC Global Mobility Company ("GMC")
Personnel and other support services UAE
Ownership of SABIC Mobility Company ("GMC LLC")6 Petrochemical UAE
70% Ownership of SABIC TunisiaMarketing and sales support Tunisia
70% Ownership of SABIC KenyaMarketing and sales support Kenya
70% Ownership of SABIC (Pvt.) PakistanMarketing and sales support Pakistan
63% Ownership of SABIC Terminal Services Company ("SABTANK") Support services Saudi Arabia52.5% Ownership of Jubail Chemical Storage and Services Company ("CHEMTANK") Support services Saudi Arabia
1. Conventional financial assets comprise cash, time deposits, short-term investments and investments in securities.2. Represents 100% amounts of subsidiaries, after elimination of intercompany transactions.3. Agreements and constitutive documents provide Saudi Aramco control.4. Percentages disclosed reflect the effective ownership of Saudi Aramco in the respective entities.5. Information for conventional financial assets, liabilities and interest income from conventional financial assets not included for entities and groups listed on the Tadawul.6. Under liquidation.7. In February 2021, SP. CHEM and SOCC merged into PETROKEMYA.
38. Subsidiaries of Saudi Arabian Oil Company continued
All amounts in millions of Saudi Riyals unless otherwise stated81
Saud
i Ara
bian
Oil
Com
pany
| C
onso
lidat
ed fi
nanc
ial s
tate
men
ts f
or th
e ye
ar e
nded
Dec
embe
r 31
, 202
0

39. Joint arrangements and associates of Saudi Arabian Oil Company
Principal business activity
Percent ownership4
Place of business /
country of incorporation
Conventional financial
assets as of December 31,
20201,2
Conventional financial
liabilities as of December 31,
20202
Interest income from conventional
financial assets for the
year ended December 31,
20202
A. Joint Operations:
Al-Khafji Joint OperationsOil and gas exploration and production 50%
Saudi-Kuwaiti Partitioned
Zone – – –Fadhili Plant Cogeneration Company Power generation 30% Saudi Arabia 62 1,223 –Maasvlakte Olie Terminal C.V. Tank storage 9.6% Netherlands – 70 –Maasvlakte Olie Terminal N.V. Tank storage 16.7% Netherlands – 122 –Pengerang Petrochemical Company Sdn. Bhd. Petrochemical 50% Malaysia 8 2,824 1Pengerang Refining Company Sdn. Bhd. Refining 50% Malaysia 574 22,221 4Power Cogeneration Plant Company, LLC Power generation 50% Saudi Arabia 47 463 54Saudi Aramco Mobil Refinery Company Ltd. Refining 50% Saudi Arabia 312 3,111 2Saudi Aramco Total Refining and Petrochemical Company3 Refining/Petrochemical 62.5% Saudi Arabia 185 10,918 4Yanbu Aramco Sinopec Refining Company Limited3 Refining 62.5% Saudi Arabia 506 6,308 –Gulf Coast Growth Venture LLC (“GCGV”)5 Petrochemical 35% USAUtility Support Group B.V. (“USG”)5 Petrochemical 35% NetherlandsSaudi Methacrylates Company (“SAMAC”)5 Petrochemical 35% Saudi Arabia
B. Joint Ventures:Arabian Rig Manufacturing ("ARM") Rig manufacturing 30% Saudi Arabia 6 356 –First Coast Energy LLP ("FCE") Marketing 50% USA 4 364 1Jasara Program Management Company ("Jasara") Engineering services 20% Saudi Arabia 124 75 –Juniper Ventures of Texas LLP ("JVTX") Marketing 60% USA 23 – –Novel Non-Metallics Solutions Manufacturing (“Novel”) Manufacturing 50% Saudi Arabia 150 – –Sadara Chemical Company ("Sadara") Petrochemical 65% Saudi Arabia 5,588 44,989 –Saudi Arabian Industrial Investment Company (“Dussur”) Investment 42.5% Saudi Arabia 1,255 20 20Saudi Silk Road Industrial Services Company ("SSRIS") Investment services 20% Saudi Arabia 115 – 3
S-Oil TOTAL Lubricants Co. LimitedLubricants production/sale 50% South Korea 292 204 –
Star Enterprises LLC (“Star-Ent”) Pension administration 50% USA 4 – –Tas'helat Marketing Company ("TMC") Marketing 50% Saudi Arabia 142 141 4Advanced Energy Storage System Company (“AESSC”)5 Petrochemical 30.1% Saudi ArabiaAl-Jubail Petrochemical Company ("Kemya")5 Petrochemical 35% Saudi ArabiaEastern Petrochemical Company ("Sharq")5 Petrochemical 35% Saudi ArabiaSABIC Plastic Energy Advanced Recycling BV (“SABIC Plastic Energy”)5 Petrochemical 35% NetherlandsSABIC SK Nexelene Company (“SSNC”)5 Petrochemical 35% SingaporeCosmar Inc. ("COSMAR")5 Petrochemical 35% USASaudi Yanbu Petrochemical Company ("Yanpet")5 Petrochemical 35% Saudi Arabia
All amounts in millions of Saudi Riyals unless otherwise stated82
Saud
i Ara
bian
Oil
Com
pany
| C
onso
lidat
ed fi
nanc
ial s
tate
men
ts f
or th
e ye
ar e
nded
Dec
embe
r 31
, 202
0

Principal business activity
Percent ownership4
Place of business /
country of incorporation
Conventional financial
assets as of December 31,
20201,2
Conventional financial
liabilities as of December 31,
20202
Interest income from conventional
financial assets for the
year ended December 31,
20202
Sinopec SABIC Tianjin Petrochemical Company ("SSTPC")5 Petrochemical 35%
People's Republic of
China
C. AssociatesBP AOC Pumpstation Maatschap Storage 50% Netherlands – – –BP ESSO AOC Maatschap Storage 34% Netherlands – – –
Fujian Refining and Petrochemical Company Limited (“FREP”) Refining/Petrochemical 25%
People's Republic of
China 5,967 5,730 64GCC Electrical Equipment Testing Lab (“GCC Lab”) Inspection 20% Saudi Arabia 83 5 –Hyundai Oilbank Co. Ltd. ("Hyundai Oilbank")
Refining /Marketing/Petrochemical 17% South Korea 6,160 20,079 327
International Maritime Industries Company (“IMIC”) Maritime 50.1% Saudi Arabia 586 – –Lukoil Saudi Arabia Energy Ltd. (“LUKSAR”) Exploration 20%
British Virgin Islands – – –
Power & Water Utility Company for Jubail and Yanbu (“Marafiq”) Utilities 42.2% Saudi Arabia 2,197 11,070 11
Sinopec SenMei (Fujian) Petroleum Company Limited (“SSPC”) Marketing/Petrochemical 22.5%
People's Republic of
China 1,668 2,137 25Team Terminal B.V. Storage 34.4% Netherlands 20,355 – –Aluminium Bahrain BSC ("ALBA")5 Aluminum 14.4% BahrainARG mbH & Co. KG (“ARG”)5 Pipeline 23.8% GermanyClariant AG ("Clariant")5 Specialty chemical 22.1% SwitzerlandGulf Aluminum and Rolling Mills Company (“GARMCO”)5 Aluminum 21.3% BahrainGulf Petrochemical Industries Company (“GPIC”)5 Petrochemical 23.3% BahrainMa'aden Phosphate Company ("MPC")5 Agri-Nutrients 21% Saudi ArabiaMa'aden Wa'ad Al Shamal Phosphate Company ("MWSPC")5 Agri-Nutrients 10.5% Saudi ArabiaNational Chemical Carrier Company (“NCC”)5 Transportation 14% Saudi ArabiaNational Shipping Company of Saudi Arabia (“Bahri”)5 Global logistics services 20% Saudi ArabiaRabigh Refining and Petrochemical Company (“Petro Rabigh”)5 Refining/Petrochemical 37.5% Saudi ArabiaSaudi Acrylic Butanol Company (“SABUCO”)5 Petrochemical 23.3% Saudi Arabia
1. Conventional financial assets comprise cash, time deposits, short-term investments and investments in securities.2. Represents Saudi Aramco’s share of conventional financial assets, financial liabilities and interest income.3. Agreements and constitutive documents do not give a single shareholder control; therefore, the joint operation does not qualify as a subsidiary.4. Percentages disclosed reflect the effective ownership of Saudi Aramco in the respective entities.5. Information for conventional financial assets, liabilities and interest income from conventional financial assets not included for entities and groups listed on the Tadawul.
39. Joint arrangements and associates of Saudi Arabian Oil Company continued
All amounts in millions of Saudi Riyals unless otherwise stated83
Saud
i Ara
bian
Oil
Com
pany
| C
onso
lidat
ed fi
nanc
ial s
tate
men
ts f
or th
e ye
ar e
nded
Dec
embe
r 31
, 202
0

40. Events after the reporting periodOn January 4, 2021, SABIC Agri-Nutrients Company (“SABIC AGRI-NUTRIENTS”), formerly Saudi Arabian Fertilizer Company (“SAFCO”), acquired 100% of the issued share capital of SABIC Agri-Nutrients Investment Company (“SANIC”) from SABIC in consideration for the issue by SAFCO of 59,368,738 additional shares to SABIC thereby increasing SABIC’s ownership of SAFCO from 43% to 50.1%. Under the terms of the transaction, SABIC injected cash of SAR 392 into SANIC prior to its transfer to SAFCO and an adjustment to the purchase price will be required depending on the levels of net working capital and net cash at completion.
All amounts in millions of Saudi Riyals unless otherwise stated84
Saud
i Ara
bian
Oil
Com
pany
| C
onso
lidat
ed fi
nanc
ial s
tate
men
ts f
or th
e ye
ar e
nded
Dec
embe
r 31
, 202
0

saudiaramco.comaramco.com


