51
October 2015 SAUDI PETROCHEMICALS SECTOR VOLATILE TIMES, SELECTIVE OPPORTUNITIES
October 2015
SAUDI PETROCHEMICALS SECTOR VOLATILE TIMES, SELECTIVE OPPORTUNITIES
October 13, 2015
2 | nbkcapita l .com
EXECUTIVE SUMMARY
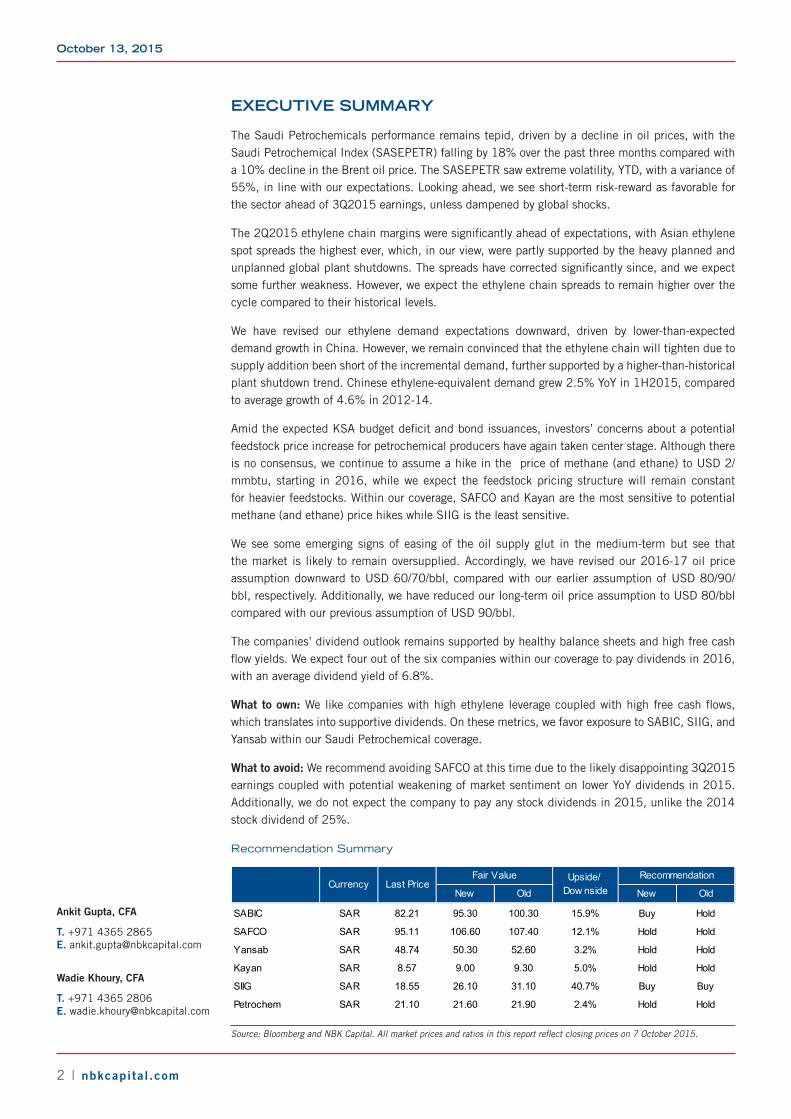
The Saudi Petrochemicals performance remains tepid, driven by a decline in oil prices, with the Saudi Petrochemical Index (SASEPETR) falling by 18% over the past three months compared with a 10% decline in the Brent oil price. The SASEPETR saw extreme volatility, YTD, with a variance of 55%, in line with our expectations. Looking ahead, we see short-term risk-reward as favorable for the sector ahead of 3Q2015 earnings, unless dampened by global shocks.
The 2Q2015 ethylene chain margins were significantly ahead of expectations, with Asian ethylene spot spreads the highest ever, which, in our view, were partly supported by the heavy planned and unplanned global plant shutdowns. The spreads have corrected significantly since, and we expect some further weakness. However, we expect the ethylene chain spreads to remain higher over the cycle compared to their historical levels.
We have revised our ethylene demand expectations downward, driven by lower-than-expected demand growth in China. However, we remain convinced that the ethylene chain will tighten due to supply addition been short of the incremental demand, further supported by a higher-than-historical plant shutdown trend. Chinese ethylene-equivalent demand grew 2.5% YoY in 1H2015, compared to average growth of 4.6% in 2012-14.
Amid the expected KSA budget deficit and bond issuances, investors’ concerns about a potential feedstock price increase for petrochemical producers have again taken center stage. Although there is no consensus, we continue to assume a hike in the price of methane (and ethane) to USD 2/mmbtu, starting in 2016, while we expect the feedstock pricing structure will remain constant for heavier feedstocks. Within our coverage, SAFCO and Kayan are the most sensitive to potential methane (and ethane) price hikes while SIIG is the least sensitive.
We see some emerging signs of easing of the oil supply glut in the medium-term but see that the market is likely to remain oversupplied. Accordingly, we have revised our 2016-17 oil price assumption downward to USD 60/70/bbl, compared with our earlier assumption of USD 80/90/bbl, respectively. Additionally, we have reduced our long-term oil price assumption to USD 80/bbl compared with our previous assumption of USD 90/bbl.
The companies’ dividend outlook remains supported by healthy balance sheets and high free cash flow yields. We expect four out of the six companies within our coverage to pay dividends in 2016, with an average dividend yield of 6.8%.
What to own: We like companies with high ethylene leverage coupled with high free cash flows, which translates into supportive dividends. On these metrics, we favor exposure to SABIC, SIIG, and Yansab within our Saudi Petrochemical coverage.
What to avoid: We recommend avoiding SAFCO at this time due to the likely disappointing 3Q2015 earnings coupled with potential weakening of market sentiment on lower YoY dividends in 2015. Additionally, we do not expect the company to pay any stock dividends in 2015, unlike the 2014 stock dividend of 25%.
Recommendation Summary
New Old New Old
SABIC SAR 82.21 95.30 100.30 15.9% Buy Hold
SAFCO SAR 95.11 106.60 107.40 12.1% Hold Hold
Yansab SAR 48.74 50.30 52.60 3.2% Hold Hold
Kayan SAR 8.57 9.00 9.30 5.0% Hold Hold
SIIG SAR 18.55 26.10 31.10 40.7% Buy Buy
Petrochem SAR 21.10 21.60 21.90 2.4% Hold Hold
Fair Value RecommendationCurrency Last Price
Upside/ Dow nside
Source: Bloomberg and NBK Capital. All market prices and ratios in this report reflect closing prices on 7 October 2015.
Ankit Gupta, CFA
T. +971 4365 2865E. [email protected]
Wadie Khoury, CFA
T. +971 4365 2806E. [email protected]
Saudi Arabia Petrochemicals Sector
nbkcapita l .com | 3
CONTENTS
Sector Highlights ............................................................................................................................... 4
Company Profiles............................................................................................................................. 15
SABIC ........................................................................................................................................ 15
YANSAB .................................................................................................................................... 21
KAYAN ...................................................................................................................................... 26
SAFCO ....................................................................................................................................... 31
PETROCHEM ............................................................................................................................. 36
SIIG ............................................................................................................................................. 41
October 13, 2015
4 | nbkcapita l .com
SECTOR HIGHLIGHTS
Ethylene spreads held up well, expect some short-term weakness but overall outlook remain relatively upbeat
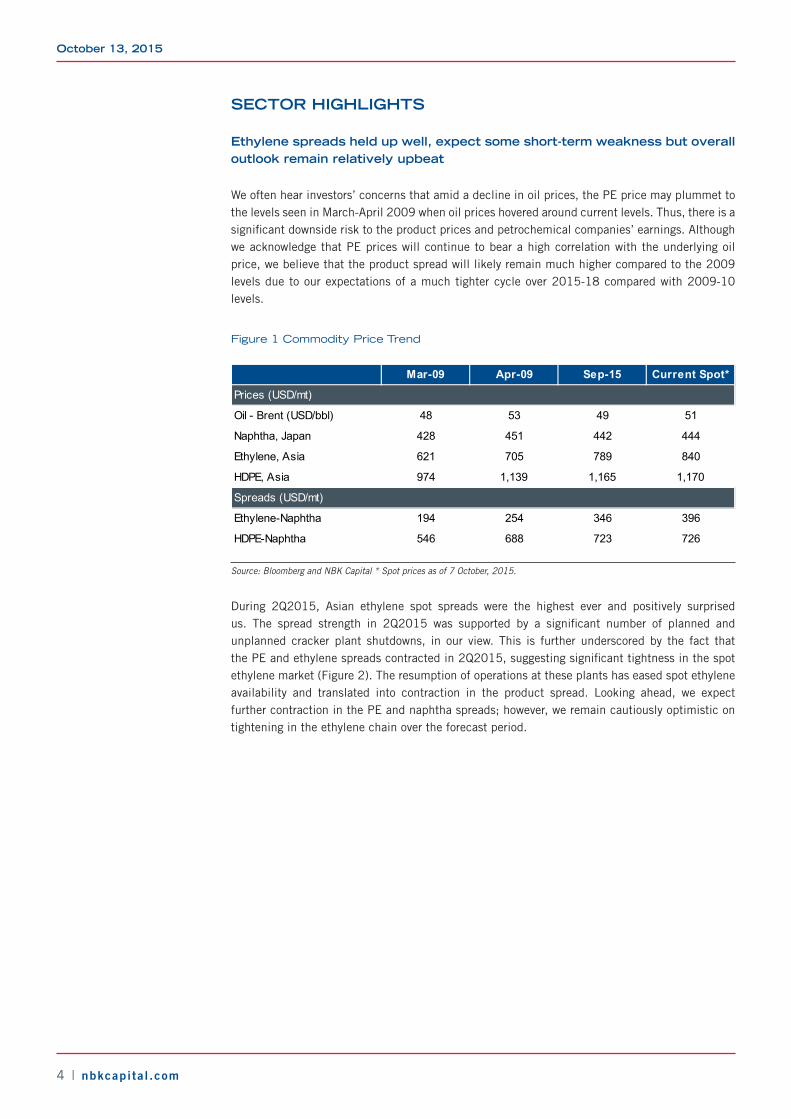
We often hear investors’ concerns that amid a decline in oil prices, the PE price may plummet to the levels seen in March-April 2009 when oil prices hovered around current levels. Thus, there is a significant downside risk to the product prices and petrochemical companies’ earnings. Although we acknowledge that PE prices will continue to bear a high correlation with the underlying oil price, we believe that the product spread will likely remain much higher compared to the 2009 levels due to our expectations of a much tighter cycle over 2015-18 compared with 2009-10 levels.
Figure 1 Commodity Price Trend
Mar-09 Apr-09 Sep-15 Current Spot*
Prices (USD/mt)
Oil - Brent (USD/bbl) 48 53 49 51
Naphtha, Japan 428 451 442 444
Ethylene, Asia 621 705 789 840
HDPE, Asia 974 1,139 1,165 1,170
Spreads (USD/mt)
Ethylene-Naphtha 194 254 346 396
HDPE-Naphtha 546 688 723 726
Source: Bloomberg and NBK Capital * Spot prices as of 7 October, 2015.
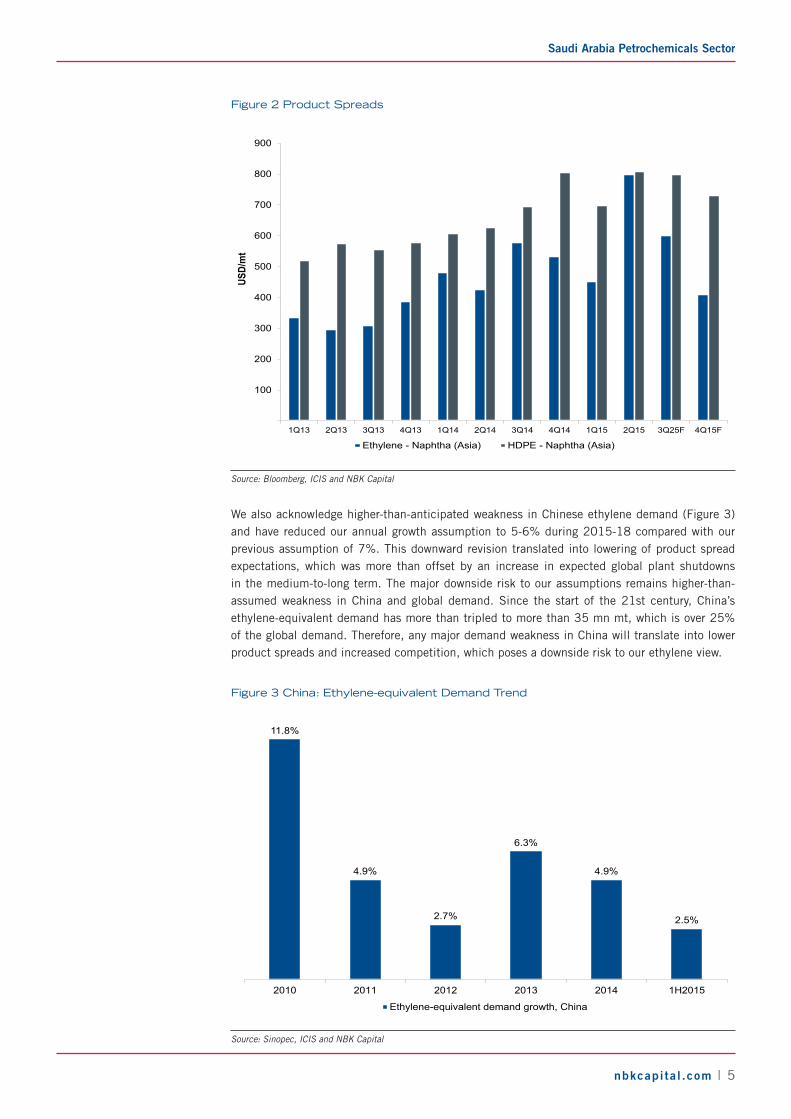
During 2Q2015, Asian ethylene spot spreads were the highest ever and positively surprised us. The spread strength in 2Q2015 was supported by a significant number of planned and unplanned cracker plant shutdowns, in our view. This is further underscored by the fact that the PE and ethylene spreads contracted in 2Q2015, suggesting significant tightness in the spot ethylene market (Figure 2). The resumption of operations at these plants has eased spot ethylene availability and translated into contraction in the product spread. Looking ahead, we expect further contraction in the PE and naphtha spreads; however, we remain cautiously optimistic on tightening in the ethylene chain over the forecast period.
Saudi Arabia Petrochemicals Sector
nbkcapita l .com | 5
Figure 2 Product Spreads
100
200
300
400
500
600
700
800
900
1Q13 2Q13 3Q13 4Q13 1Q14 2Q14 3Q14 4Q14 1Q15 2Q15 3Q25F 4Q15F
USD/
mt
Ethylene - Naphtha (Asia) HDPE - Naphtha (Asia)
Source: Bloomberg, ICIS and NBK Capital
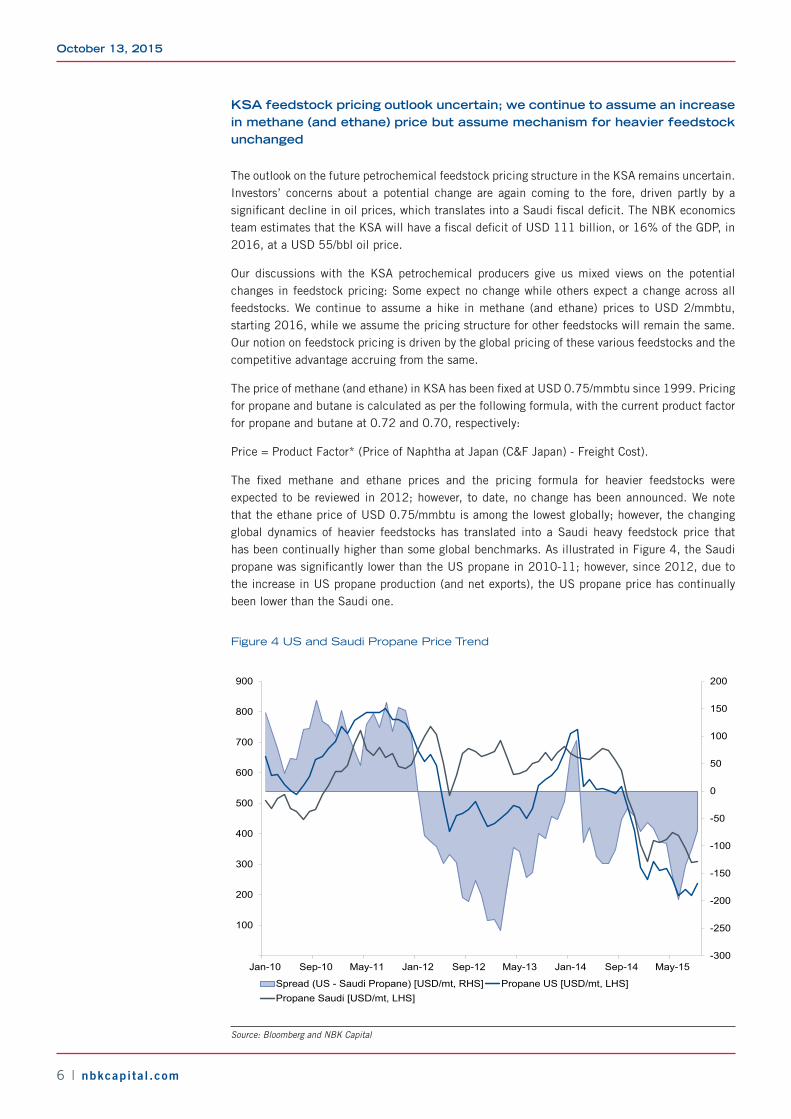
We also acknowledge higher-than-anticipated weakness in Chinese ethylene demand (Figure 3) and have reduced our annual growth assumption to 5-6% during 2015-18 compared with our previous assumption of 7%. This downward revision translated into lowering of product spread expectations, which was more than offset by an increase in expected global plant shutdowns in the medium-to-long term. The major downside risk to our assumptions remains higher-than-assumed weakness in China and global demand. Since the start of the 21st century, China’s ethylene-equivalent demand has more than tripled to more than 35 mn mt, which is over 25% of the global demand. Therefore, any major demand weakness in China will translate into lower product spreads and increased competition, which poses a downside risk to our ethylene view.
Figure 3 China: Ethylene-equivalent Demand Trend
11.8%
4.9%
2.7%
6.3%
4.9%
2.5%
2010 2011 2012 2013 2014 1H2015
Ethylene-equivalent demand growth, China
Source: Sinopec, ICIS and NBK Capital
October 13, 2015
6 | nbkcapita l .com
KSA feedstock pricing outlook uncertain; we continue to assume an increase in methane (and ethane) price but assume mechanism for heavier feedstock unchanged
The outlook on the future petrochemical feedstock pricing structure in the KSA remains uncertain. Investors’ concerns about a potential change are again coming to the fore, driven partly by a significant decline in oil prices, which translates into a Saudi fiscal deficit. The NBK economics team estimates that the KSA will have a fiscal deficit of USD 111 billion, or 16% of the GDP, in 2016, at a USD 55/bbl oil price.
Our discussions with the KSA petrochemical producers give us mixed views on the potential changes in feedstock pricing: Some expect no change while others expect a change across all feedstocks. We continue to assume a hike in methane (and ethane) prices to USD 2/mmbtu, starting 2016, while we assume the pricing structure for other feedstocks will remain the same. Our notion on feedstock pricing is driven by the global pricing of these various feedstocks and the competitive advantage accruing from the same.
The price of methane (and ethane) in KSA has been fixed at USD 0.75/mmbtu since 1999. Pricing for propane and butane is calculated as per the following formula, with the current product factor for propane and butane at 0.72 and 0.70, respectively:
Price = Product Factor* (Price of Naphtha at Japan (C&F Japan) - Freight Cost).
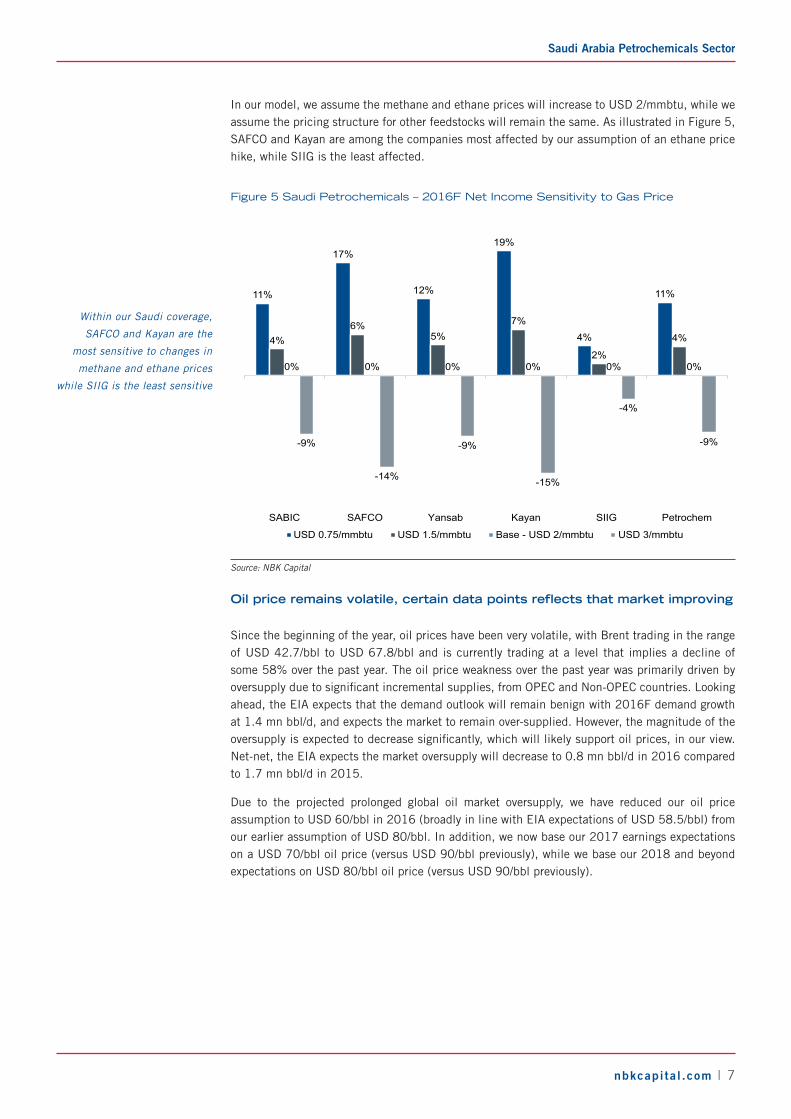
The fixed methane and ethane prices and the pricing formula for heavier feedstocks were expected to be reviewed in 2012; however, to date, no change has been announced. We note that the ethane price of USD 0.75/mmbtu is among the lowest globally; however, the changing global dynamics of heavier feedstocks has translated into a Saudi heavy feedstock price that has been continually higher than some global benchmarks. As illustrated in Figure 4, the Saudi propane was significantly lower than the US propane in 2010-11; however, since 2012, due to the increase in US propane production (and net exports), the US propane price has continually been lower than the Saudi one.
Figure 4 US and Saudi Propane Price Trend
-300
-250
-200
-150
-100
-50
0
50
100
150
200
100
200
300
400
500
600
700
800
900
Jan-10 Sep-10 May-11 Jan-12 Sep-12 May-13 Jan-14 Sep-14 May-15
Spread (US - Saudi Propane) [USD/mt, RHS] Propane US [USD/mt, LHS]Propane Saudi [USD/mt, LHS]
Source: Bloomberg and NBK Capital
Saudi Arabia Petrochemicals Sector
nbkcapita l .com | 7
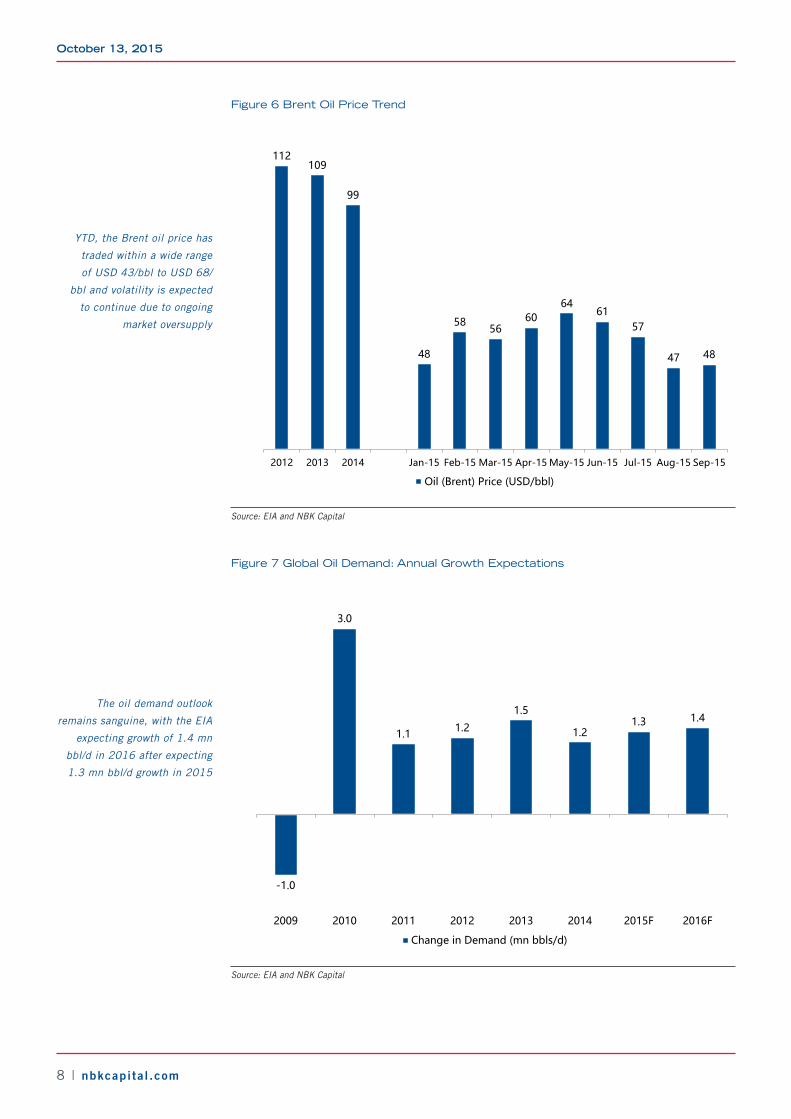
In our model, we assume the methane and ethane prices will increase to USD 2/mmbtu, while we assume the pricing structure for other feedstocks will remain the same. As illustrated in Figure 5, SAFCO and Kayan are among the companies most affected by our assumption of an ethane price hike, while SIIG is the least affected.
Figure 5 Saudi Petrochemicals – 2016F Net Income Sensitivity to Gas Price
11%
17%
12%
19%
4%
11%
4%6%
5%7%
2%
4%
0% 0% 0% 0% 0% 0%
-9%
-14%
-9%
-15%
-4%
-9%
SABIC SAFCO Yansab Kayan SIIG Petrochem
USD 0.75/mmbtu USD 1.5/mmbtu Base - USD 2/mmbtu USD 3/mmbtu
Source: NBK Capital
Oil price remains volatile, certain data points reflects that market improving
Since the beginning of the year, oil prices have been very volatile, with Brent trading in the range of USD 42.7/bbl to USD 67.8/bbl and is currently trading at a level that implies a decline of some 58% over the past year. The oil price weakness over the past year was primarily driven by oversupply due to significant incremental supplies, from OPEC and Non-OPEC countries. Looking ahead, the EIA expects that the demand outlook will remain benign with 2016F demand growth at 1.4 mn bbl/d, and expects the market to remain over-supplied. However, the magnitude of the oversupply is expected to decrease significantly, which will likely support oil prices, in our view. Net-net, the EIA expects the market oversupply will decrease to 0.8 mn bbl/d in 2016 compared to 1.7 mn bbl/d in 2015.
Due to the projected prolonged global oil market oversupply, we have reduced our oil price assumption to USD 60/bbl in 2016 (broadly in line with EIA expectations of USD 58.5/bbl) from our earlier assumption of USD 80/bbl. In addition, we now base our 2017 earnings expectations on a USD 70/bbl oil price (versus USD 90/bbl previously), while we base our 2018 and beyond expectations on USD 80/bbl oil price (versus USD 90/bbl previously).
Within our Saudi coverage,
SAFCO and Kayan are the
most sensitive to changes in
methane and ethane prices
while SIIG is the least sensitive
October 13, 2015
8 | nbkcapita l .com
Figure 6 Brent Oil Price Trend
112109
99
48
5856
6064
6157
47 48
20
30
40
50
60
70
80
90
100
110
120
2012 2013 2014 Jan-15 Feb-15 Mar-15 Apr-15 May-15 Jun-15 Jul-15 Aug-15 Sep-15
Oil (Brent) Price (USD/bbl)
Source: EIA and NBK Capital
Figure 7 Global Oil Demand: Annual Growth Expectations
-1.0
3.0
1.1 1.2
1.5
1.21.3 1.4
-2
-1
-1
1
1
2
2
3
3
4
2009 2010 2011 2012 2013 2014 2015F 2016F
Change in Demand (mn bbls/d)
Source: EIA and NBK Capital
YTD, the Brent oil price has
traded within a wide range
of USD 43/bbl to USD 68/
bbl and volatility is expected
to continue due to ongoing
market oversupply
The oil demand outlook
remains sanguine, with the EIA
expecting growth of 1.4 mn
bbl/d in 2016 after expecting
1.3 mn bbl/d growth in 2015
Saudi Arabia Petrochemicals Sector
nbkcapita l .com | 9
Figure 8 US Crude Oil Production Trend
6.5
7.5
8.7
9.3 9.39.6 9.6
9.4 9.3 9.49.1 9.0
9.2
8.9
4
5
6
7
8
9
10
US Oil Production (mn bbls/d)
Source: EIA and NBK Capital
Figure 9 Non-OPEC Oil Supply Trend
0.7
1.6
0.2
0.6
1.7
2.3
1.3
0.1
1
1
2
2
3
2009 2010 2011 2012 2013 2014 2015F 2016F
Additions in Non-Opec Supply (mn bbls/d)
Source: EIA and NBK Capital
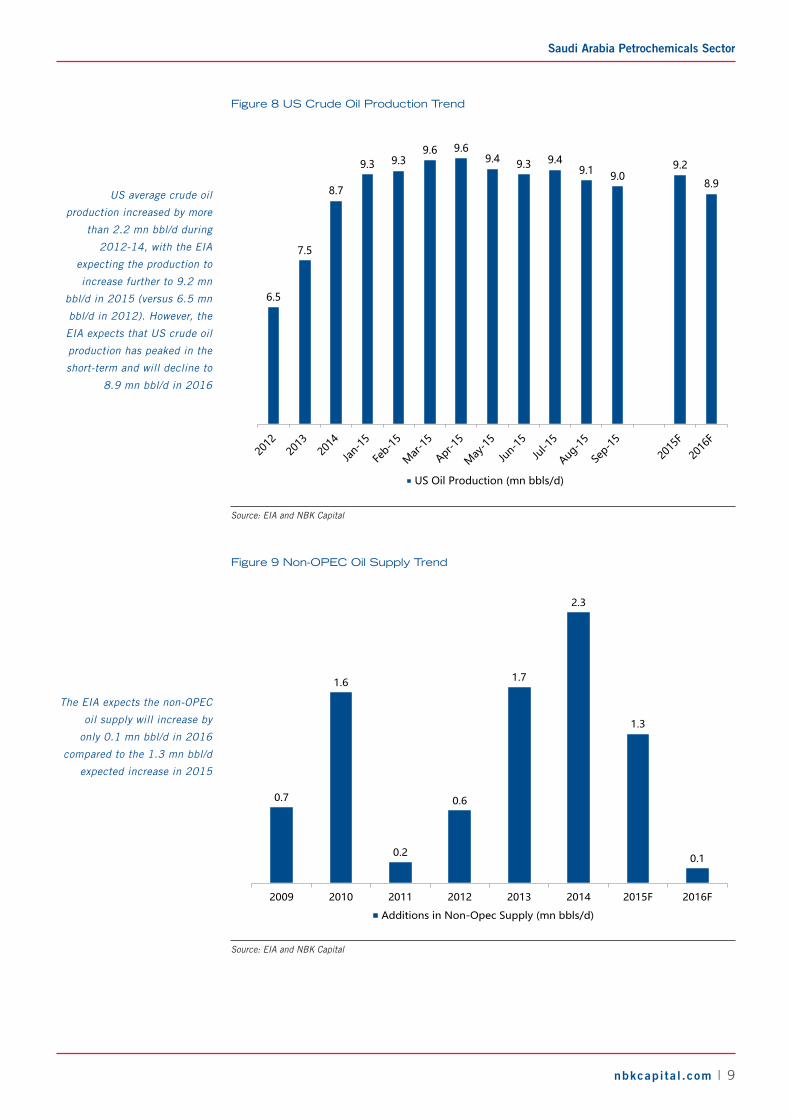
US average crude oil
production increased by more
than 2.2 mn bbl/d during
2012-14, with the EIA
expecting the production to
increase further to 9.2 mn
bbl/d in 2015 (versus 6.5 mn
bbl/d in 2012). However, the
EIA expects that US crude oil
production has peaked in the
short-term and will decline to
8.9 mn bbl/d in 2016
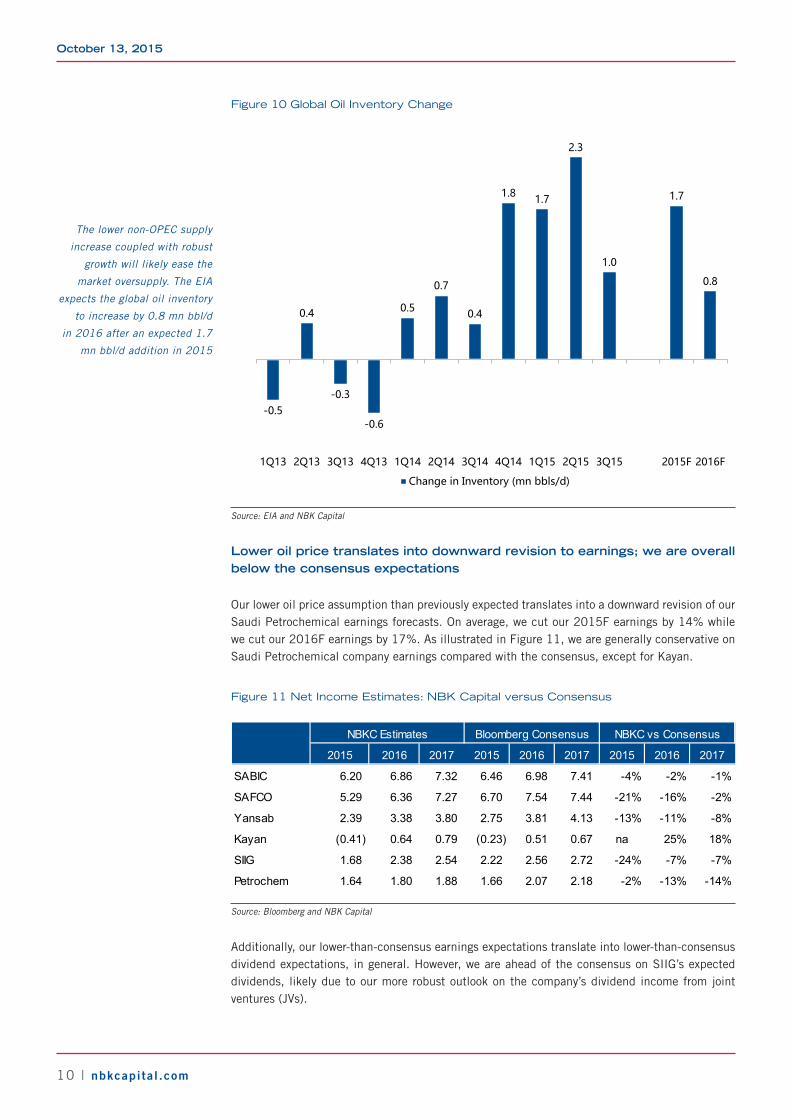
The EIA expects the non-OPEC
oil supply will increase by
only 0.1 mn bbl/d in 2016
compared to the 1.3 mn bbl/d
expected increase in 2015
October 13, 2015
10 | nbkcapita l .com
Figure 10 Global Oil Inventory Change
-0.5
0.4
-0.3
-0.6
0.5
0.7
0.4
1.8 1.7
2.3
1.0
1.7
0.8
-1
-1
1
1
2
2
3
1Q13 2Q13 3Q13 4Q13 1Q14 2Q14 3Q14 4Q14 1Q15 2Q15 3Q15 2015F 2016F
Change in Inventory (mn bbls/d)
Source: EIA and NBK Capital
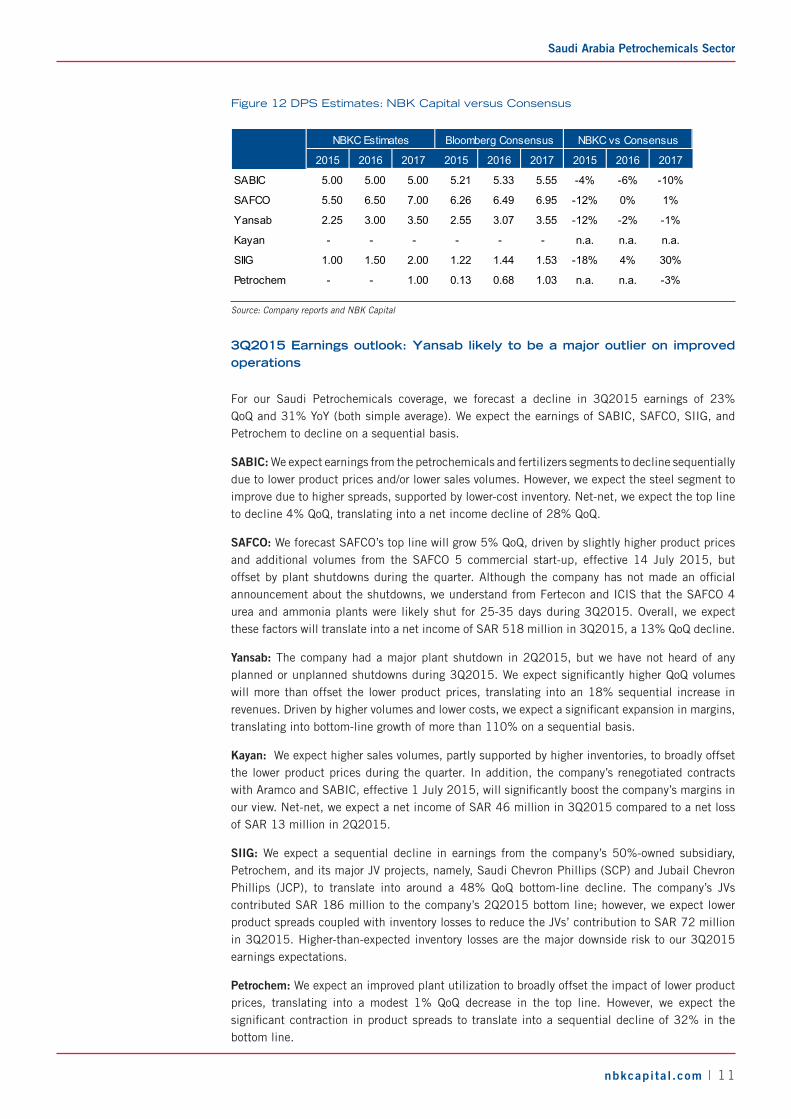
Lower oil price translates into downward revision to earnings; we are overall below the consensus expectations
Our lower oil price assumption than previously expected translates into a downward revision of our Saudi Petrochemical earnings forecasts. On average, we cut our 2015F earnings by 14% while we cut our 2016F earnings by 17%. As illustrated in Figure 11, we are generally conservative on Saudi Petrochemical company earnings compared with the consensus, except for Kayan.
Figure 11 Net Income Estimates: NBK Capital versus Consensus
2015 2016 2017 2015 2016 2017 2015 2016 2017
SABIC 6.20 6.86 7.32 6.46 6.98 7.41 -4% -2% -1%
SAFCO 5.29 6.36 7.27 6.70 7.54 7.44 -21% -16% -2%
Yansab 2.39 3.38 3.80 2.75 3.81 4.13 -13% -11% -8%
Kayan (0.41) 0.64 0.79 (0.23) 0.51 0.67 na 25% 18%
SIIG 1.68 2.38 2.54 2.22 2.56 2.72 -24% -7% -7%
Petrochem 1.64 1.80 1.88 1.66 2.07 2.18 -2% -13% -14%
NBKC Estimates Bloomberg Consensus NBKC vs Consensus
Source: Bloomberg and NBK Capital
Additionally, our lower-than-consensus earnings expectations translate into lower-than-consensus dividend expectations, in general. However, we are ahead of the consensus on SIIG’s expected dividends, likely due to our more robust outlook on the company’s dividend income from joint ventures (JVs).
The lower non-OPEC supply
increase coupled with robust
growth will likely ease the
market oversupply. The EIA
expects the global oil inventory
to increase by 0.8 mn bbl/d
in 2016 after an expected 1.7
mn bbl/d addition in 2015
Saudi Arabia Petrochemicals Sector
nbkcapita l .com | 11
Figure 12 DPS Estimates: NBK Capital versus Consensus
2015 2016 2017 2015 2016 2017 2015 2016 2017
SABIC 5.00 5.00 5.00 5.21 5.33 5.55 -4% -6% -10%
SAFCO 5.50 6.50 7.00 6.26 6.49 6.95 -12% 0% 1%
Yansab 2.25 3.00 3.50 2.55 3.07 3.55 -12% -2% -1%
Kayan - - - - - - n.a. n.a. n.a.
SIIG 1.00 1.50 2.00 1.22 1.44 1.53 -18% 4% 30%
Petrochem - - 1.00 0.13 0.68 1.03 n.a. n.a. -3%
NBKC Estimates Bloomberg Consensus NBKC vs Consensus
Source: Company reports and NBK Capital
3Q2015 Earnings outlook: Yansab likely to be a major outlier on improved operations
For our Saudi Petrochemicals coverage, we forecast a decline in 3Q2015 earnings of 23% QoQ and 31% YoY (both simple average). We expect the earnings of SABIC, SAFCO, SIIG, and Petrochem to decline on a sequential basis.
SABIC: We expect earnings from the petrochemicals and fertilizers segments to decline sequentially due to lower product prices and/or lower sales volumes. However, we expect the steel segment to improve due to higher spreads, supported by lower-cost inventory. Net-net, we expect the top line to decline 4% QoQ, translating into a net income decline of 28% QoQ.
SAFCO: We forecast SAFCO’s top line will grow 5% QoQ, driven by slightly higher product prices and additional volumes from the SAFCO 5 commercial start-up, effective 14 July 2015, but offset by plant shutdowns during the quarter. Although the company has not made an official announcement about the shutdowns, we understand from Fertecon and ICIS that the SAFCO 4 urea and ammonia plants were likely shut for 25-35 days during 3Q2015. Overall, we expect these factors will translate into a net income of SAR 518 million in 3Q2015, a 13% QoQ decline.
Yansab: The company had a major plant shutdown in 2Q2015, but we have not heard of any planned or unplanned shutdowns during 3Q2015. We expect significantly higher QoQ volumes will more than offset the lower product prices, translating into an 18% sequential increase in revenues. Driven by higher volumes and lower costs, we expect a significant expansion in margins, translating into bottom-line growth of more than 110% on a sequential basis.
Kayan: We expect higher sales volumes, partly supported by higher inventories, to broadly offset the lower product prices during the quarter. In addition, the company’s renegotiated contracts with Aramco and SABIC, effective 1 July 2015, will significantly boost the company’s margins in our view. Net-net, we expect a net income of SAR 46 million in 3Q2015 compared to a net loss of SAR 13 million in 2Q2015.
SIIG: We expect a sequential decline in earnings from the company’s 50%-owned subsidiary, Petrochem, and its major JV projects, namely, Saudi Chevron Phillips (SCP) and Jubail Chevron Phillips (JCP), to translate into around a 48% QoQ bottom-line decline. The company’s JVs contributed SAR 186 million to the company’s 2Q2015 bottom line; however, we expect lower product spreads coupled with inventory losses to reduce the JVs’ contribution to SAR 72 million in 3Q2015. Higher-than-expected inventory losses are the major downside risk to our 3Q2015 earnings expectations.
Petrochem: We expect an improved plant utilization to broadly offset the impact of lower product prices, translating into a modest 1% QoQ decrease in the top line. However, we expect the significant contraction in product spreads to translate into a sequential decline of 32% in the bottom line.

October 13, 2015
12 | nbkcapita l .com
Figure 13 Saudi Petrochemicals: 3Q2015 Net Income Forecasts
3Q2015F 3Q2014 2Q2015 YoY QoQ
SABIC 4,427 6,179 6,171 -28.3% -28.3%
SAFCO 518 913 596 -43.3% -13.0%
Yansab 482 691 227 -30.2% 112.2%
Kayan 46 67 (13) -32.0% na
SIIG 177 377 339 -53.1% -47.9%
Petrochem 209 244 305 -14.4% -31.6%
Net Income (SAR millions) Change (%)
Source: Company reports and NBK Capital
Valuation: Not significantly undervalued on average, but there is some selective value; we prefer SIIG and SABIC, and to a lower extent Yansab
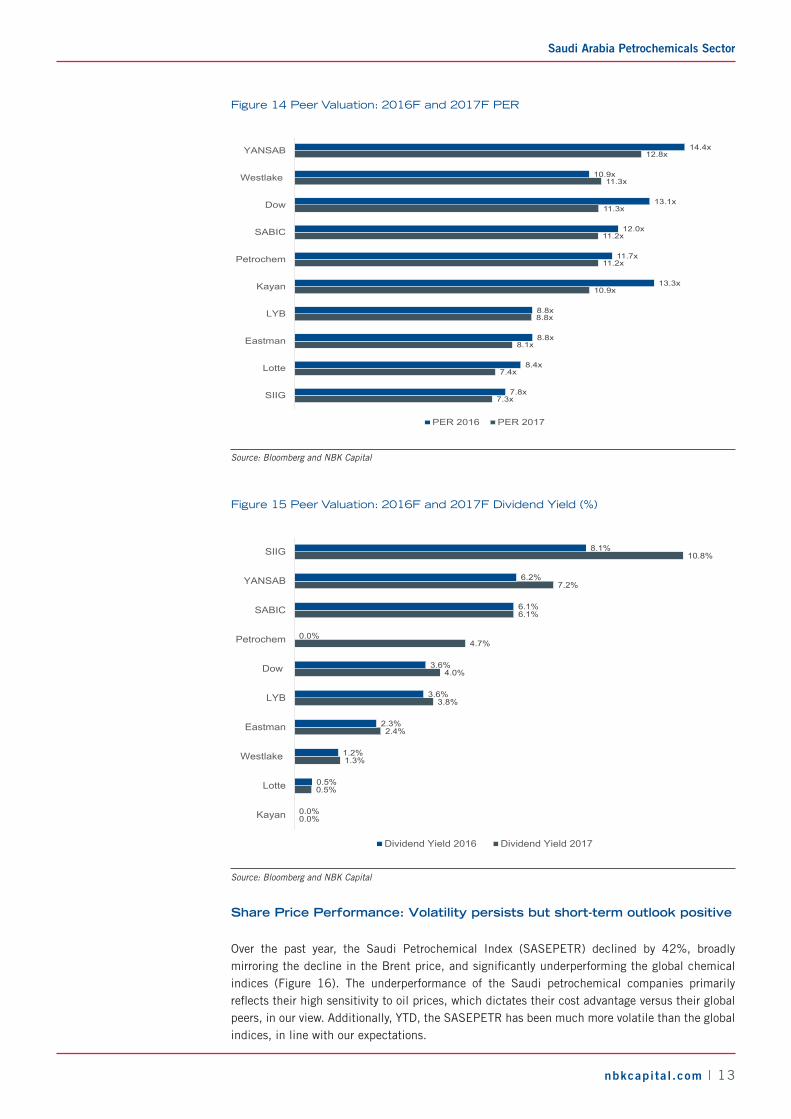
The Saudi companies’ global chemical peers currently trade at an average 2016F PER of 10x, while our Saudi coverage companies currently trade in the range of 8x to 14x (Figure 14). Thus, the valuations are not necessarily cheap on a relative basis; we see value in SIIG, SABIC, and Yansab.
SIIG is the cheapest stock within our chemicals peers’ universe, trading at 2016F PER of 7.8x. We believe this cheap valuation may partly reflect investors’ concerns about the company’s limited disclosure and high earnings volatility; however, we believe the 20% discount to the company’s global peers is unwarranted. Additionally, we see the company’s dividend yield as attractive, with a 2016/17F yield of 8.1%/10.8%.
We like SABIC due to its attractive dividend profile, which is well supported by the company’s low leverage (2Q2015 debt/capital: 0.27x) and the potential increase in shareholder returns driven by the planned restructuring. SABIC announced to restructure its business lines, which is expected to be completed by Jan 2016. As per the announcement, one of the company’s business unit, Sabic Innovative Plastics (SIP), will cease to exist and its commodities business will be merged within SABIC’s chemical and polymer business, while the rest will be a part of a newly-created business unit.
We see limited upside potential in Yansab but we think the short-term risk-reward balance is favorable driven by a significant QoQ growth in earnings in 3Q2015. We also like the company’s dividend profile (2016/17F yield: 6.2%/7.2%). Yansab currently trades at a premium valuation to peers, which we believe is warranted given Yansab’s exceptional cash flow generation ability, with a 2016-18F average FCF yield of 12%.
Saudi Arabia Petrochemicals Sector
nbkcapita l .com | 13
Figure 14 Peer Valuation: 2016F and 2017F PER
7.3x
7.4x
8.1x
8.8x
10.9x
11.2x
11.2x
11.3x
11.3x
12.8x
7.8x
8.4x
8.8x
8.8x
13.3x
11.7x
12.0x
13.1x
10.9x
14.4x
SIIG
Lotte
Eastman
LYB
Kayan
Petrochem
SABIC
Dow
Westlake
YANSAB
PER 2016 PER 2017
Source: Bloomberg and NBK Capital
Figure 15 Peer Valuation: 2016F and 2017F Dividend Yield (%)
0.0%
0.5%
1.3%
2.4%
3.8%
4.0%
4.7%
6.1%
7.2%
10.8%
0.0%
0.5%
1.2%
2.3%
3.6%
3.6%
0.0%
6.1%
6.2%
8.1%
Kayan
Lotte
Westlake
Eastman
LYB
Dow
Petrochem
SABIC
YANSAB
SIIG
Dividend Yield 2016 Dividend Yield 2017
Source: Bloomberg and NBK Capital
Share Price Performance: Volatility persists but short-term outlook positive
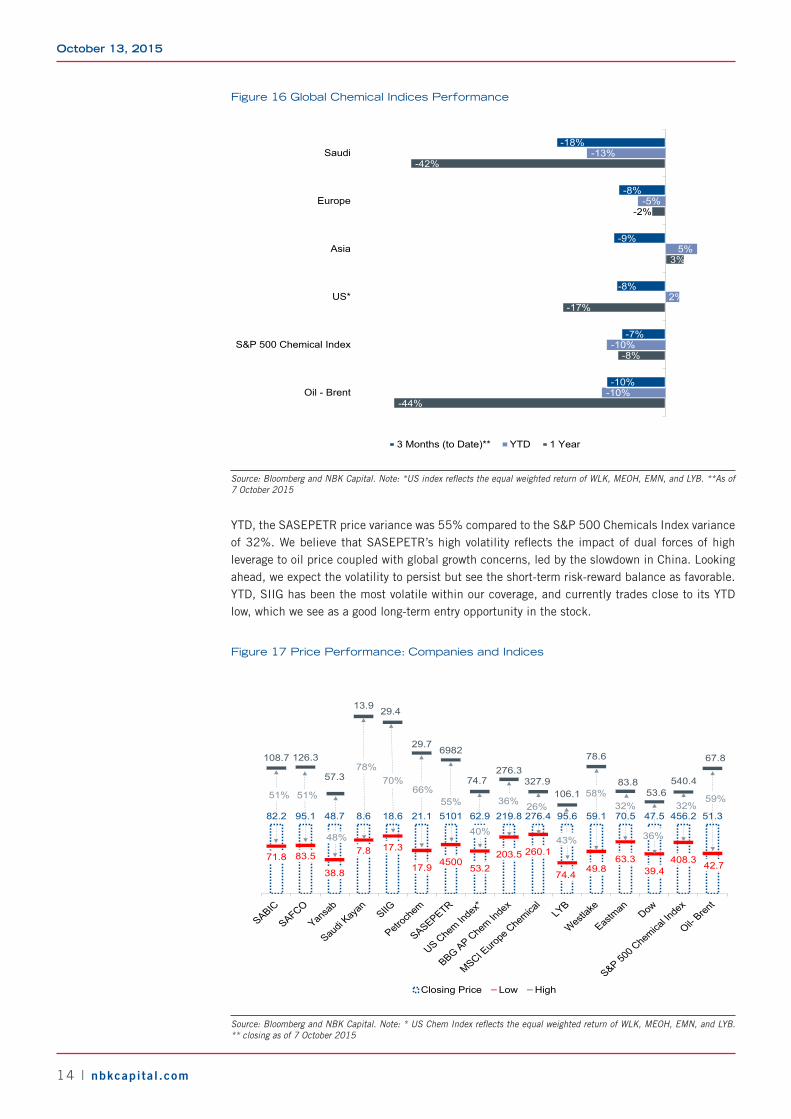
Over the past year, the Saudi Petrochemical Index (SASEPETR) declined by 42%, broadly mirroring the decline in the Brent price, and significantly underperforming the global chemical indices (Figure 16). The underperformance of the Saudi petrochemical companies primarily reflects their high sensitivity to oil prices, which dictates their cost advantage versus their global peers, in our view. Additionally, YTD, the SASEPETR has been much more volatile than the global indices, in line with our expectations.
October 13, 2015
14 | nbkcapita l .com
Figure 16 Global Chemical Indices Performance
-44%
-8%
-17%
3%
-2%
-42%
-10%
-10%
2%
5%
-5%
-13%
-10%
-7%
-8%
-9%
-8%
-18%
-1
Oil - Brent
S&P 500 Chemical Index
US*
Asia
Europe
Saudi
3 Months (to Date)** YTD 1 Year
Source: Bloomberg and NBK Capital. Note: *US index reflects the equal weighted return of WLK, MEOH, EMN, and LYB. **As of 7 October 2015
YTD, the SASEPETR price variance was 55% compared to the S&P 500 Chemicals Index variance of 32%. We believe that SASEPETR’s high volatility reflects the impact of dual forces of high leverage to oil price coupled with global growth concerns, led by the slowdown in China. Looking ahead, we expect the volatility to persist but see the short-term risk-reward balance as favorable. YTD, SIIG has been the most volatile within our coverage, and currently trades close to its YTD low, which we see as a good long-term entry opportunity in the stock.
Figure 17 Price Performance: Companies and Indices
82.2 95.1 48.7 8.6 18.6 21.1 5101 62.9 219.8 276.4 95.6 59.1 70.5 47.5 456.2 51.3
71.8 83.5
38.8
7.8 17.3
17.9 450053.2
203.5 260.1
74.449.8
63.339.4
408.3 42.7
108.7 126.3
57.3
13.9 29.4
29.76982
74.7276.3
327.9106.1
78.6
83.853.6
540.4
67.8
60
80
100
120
140
160
180
Closing Price Low High
51% 51%
48%
78%70%
66%55%
40%
36% 26%
43%
58%32%
36%
32%59%
Source: Bloomberg and NBK Capital. Note: * US Chem Index reflects the equal weighted return of WLK, MEOH, EMN, and LYB. ** closing as of 7 October 2015
Saudi Arabia Petrochemicals Sector
nbkcapita l .com | 15
SABICUpgraded to Buy; risk-reward now favorable
Key Data
Fair Value per Share (SAR) 95.30Closing Price (SAR) * 82.2152-w eek High / Low (SAR) 127 / 70.3YTD / 12-month Return -2%/-37%P/E (TTM) 11.9 Shares Outstanding (Millions) 3,000 Market Cap (USD Millions) 65,768 Free Float 24.6%Daily Trading Turnover ( 6-mo avg.,USD Millions) 148.6 Reuters / Bloomberg Code 2010.SE/SABIC AB
*As of October 07, 2015. Source: Bloomberg and NBK Capital
Key Metrics
2014A 2015F 2016F 2017FEPS (SAR) 7.8 6.2 6.9 7.3EPS Grow th -7% -21% 11% 7%P/E 10.5 13.3 12.0 11.2Dividend Yield 6.7% 6.1% 6.1% 6.1%EV/EBITDA 7.1 8.4 7.4 7.2Revenue (SAR Millions) 188,775 155,158 164,989 174,445 Revenue Grow th 0% -18% 6% 6%EBITDA (SAR Millions) 53,686 45,388 50,945 52,841 EBITDA Grow th -5% -15% 12% 4%EBITDA Margin 28% 29% 31% 30%
Source: Company Reports and NBK Capital
Quarterly Forecasts
SAR Millions 3Q2014A 2Q2015A 3Q2015F 4Q2015FRevenue 48,071 42,095 40,448 37,051EBITDA 14,153 12,853 11,941 10,872
Source: Company Reports and NBK Capital
Rebased Price Performance
50
60
70
80
90
100
110
Oct-14 Jan-15 Apr-15 Jul-15 Oct-15
SABIC SASEPETR TASI
Source: Company Reports and NBK Capital
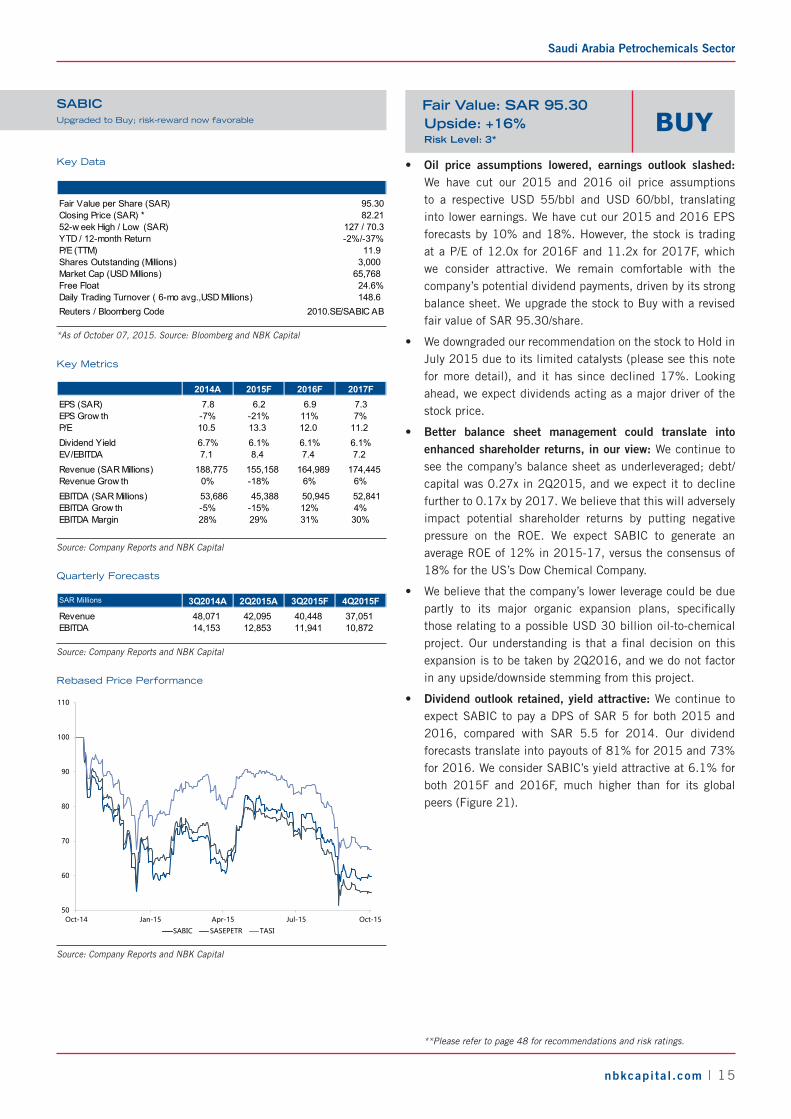
• Oil price assumptions lowered, earnings outlook slashed: We have cut our 2015 and 2016 oil price assumptions to a respective USD 55/bbl and USD 60/bbl, translating into lower earnings. We have cut our 2015 and 2016 EPS forecasts by 10% and 18%. However, the stock is trading at a P/E of 12.0x for 2016F and 11.2x for 2017F, which we consider attractive. We remain comfortable with the company’s potential dividend payments, driven by its strong balance sheet. We upgrade the stock to Buy with a revised fair value of SAR 95.30/share.
• We downgraded our recommendation on the stock to Hold in July 2015 due to its limited catalysts (please see this note for more detail), and it has since declined 17%. Looking ahead, we expect dividends acting as a major driver of the stock price.
• Better balance sheet management could translate into enhanced shareholder returns, in our view: We continue to see the company’s balance sheet as underleveraged; debt/capital was 0.27x in 2Q2015, and we expect it to decline further to 0.17x by 2017. We believe that this will adversely impact potential shareholder returns by putting negative pressure on the ROE. We expect SABIC to generate an average ROE of 12% in 2015-17, versus the consensus of 18% for the US’s Dow Chemical Company.
• We believe that the company’s lower leverage could be due partly to its major organic expansion plans, specifically those relating to a possible USD 30 billion oil-to-chemical project. Our understanding is that a final decision on this expansion is to be taken by 2Q2016, and we do not factor in any upside/downside stemming from this project.
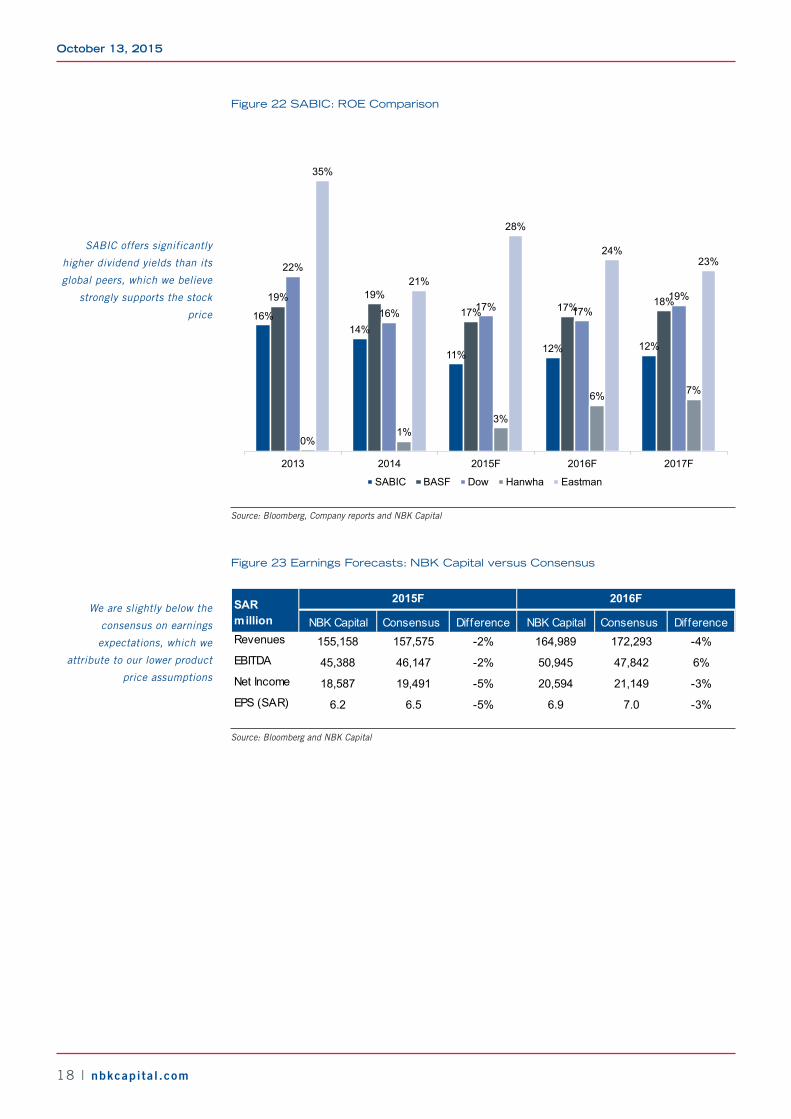
• Dividend outlook retained, yield attractive: We continue to expect SABIC to pay a DPS of SAR 5 for both 2015 and 2016, compared with SAR 5.5 for 2014. Our dividend forecasts translate into payouts of 81% for 2015 and 73% for 2016. We consider SABIC’s yield attractive at 6.1% for both 2015F and 2016F, much higher than for its global peers (Figure 21).
**Please refer to page 48 for recommendations and risk ratings.
BUYFair Value: SAR 95.30Upside: +16%Risk Level: 3*
October 13, 2015
16 | nbkcapita l .com
Figure 18 SABIC: Leverage (Debt/Capital) Comparison
35%
33%
28% 28%27%
34% 33% 34%35%
37%
48% 49%
39%
46%44%
49%
44%
55%
51% 51%
46%
61%
52%
68%66%
2011 2012 2013 2014 2Q2015
SABIC BASF Dow Hanwha Eastman
Source: Bloomberg, Company reports and NBK Capital
Figure 19 SABIC: Dividend Yield Peer Comparison
6.1% 6.1%
4.2%4.4%
3.6%
4.0%
0.8%1.0%
2.2%2.4%
Div Yield 2015F Div Yield 2016F
SABIC BASF Dow Hanwha Eastman
Source: Bloomberg and NBK Capital
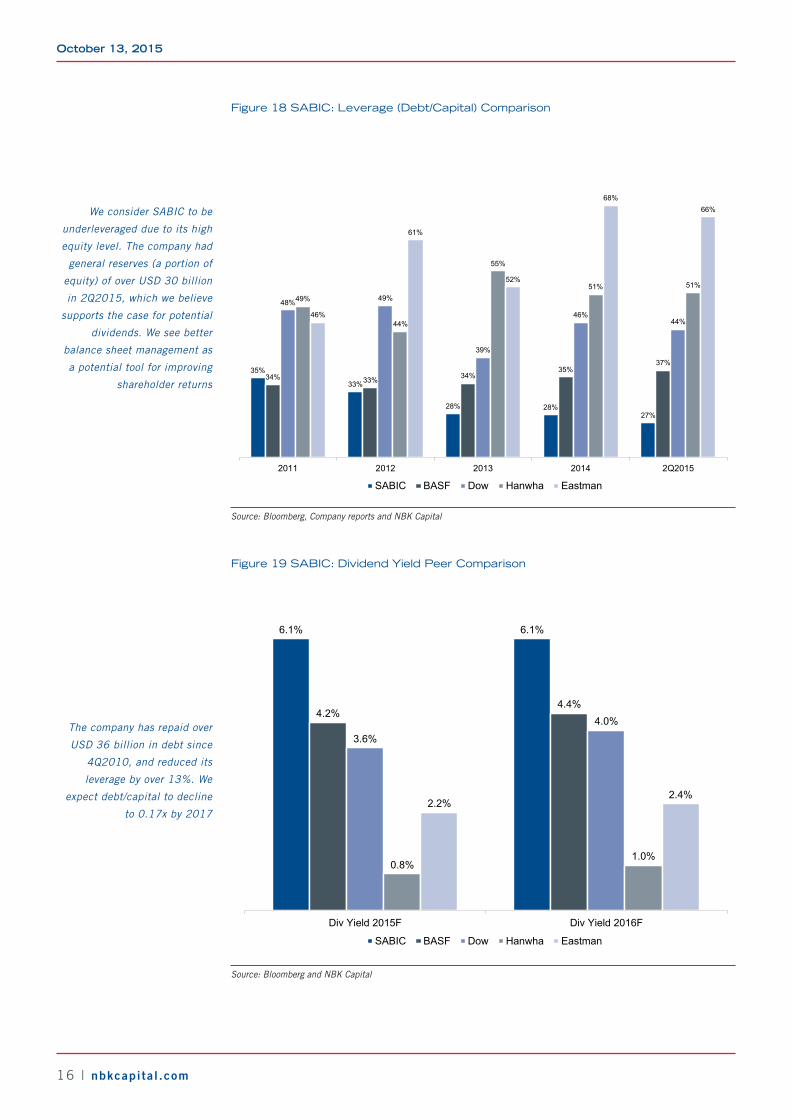
We consider SABIC to be
underleveraged due to its high
equity level. The company had
general reserves (a portion of
equity) of over USD 30 billion
in 2Q2015, which we believe
supports the case for potential
dividends. We see better
balance sheet management as
a potential tool for improving
shareholder returns
The company has repaid over
USD 36 billion in debt since
4Q2010, and reduced its
leverage by over 13%. We
expect debt/capital to decline
to 0.17x by 2017
Saudi Arabia Petrochemicals Sector
nbkcapita l .com | 17
Figure 20 SABIC: Leverage Trend
41%40%
35%
33%
28% 28%
25%
21%
17%
2009 2010 2011 2012 2013 2014 2015F 2016F 2017F
Leverage (Debt/Capital)
Source: Company Reports and NBK Capital
Figure 21 SABIC: DPS and Payout Trend
5.0
5.5
5.0 5.0 5.0
59%
70%
81%
73%68%
0%
10%
20%
30%
40%
50%
60%
70%
80%
90%
4.0
4.5
5.0
5.5
6.0
2013 2014 2015F 2016F 2017F
DPS (SAR) Dividend Payout Ratio
Source: Company Reports and NBK Capital
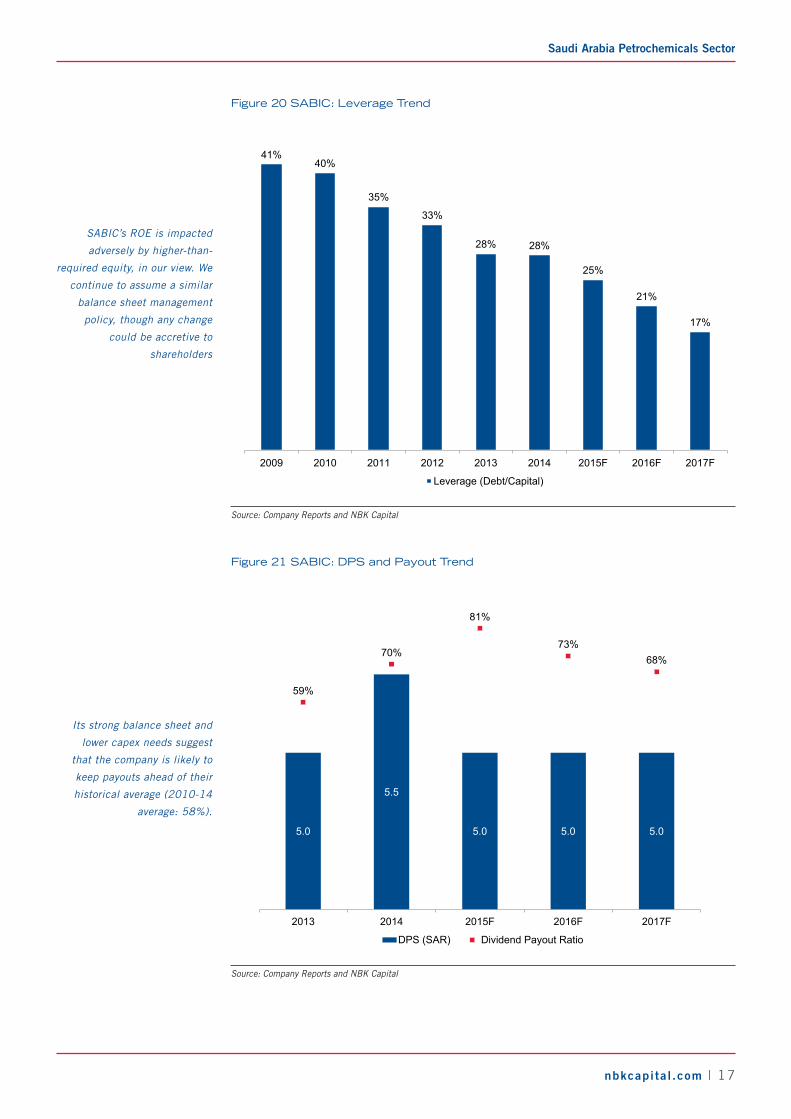
SABIC’s ROE is impacted
adversely by higher-than-
required equity, in our view. We
continue to assume a similar
balance sheet management
policy, though any change
could be accretive to
shareholders
Its strong balance sheet and
lower capex needs suggest
that the company is likely to
keep payouts ahead of their
historical average (2010-14
average: 58%).
October 13, 2015
18 | nbkcapita l .com
Figure 22 SABIC: ROE Comparison
16%14%
11% 12% 12%
19% 19%
17% 17% 18%
22%
16% 17% 17%19%
0%1%
3%
6% 7%
35%
21%
28%
24%23%
2013 2014 2015F 2016F 2017F
SABIC BASF Dow Hanwha Eastman
Source: Bloomberg, Company reports and NBK Capital
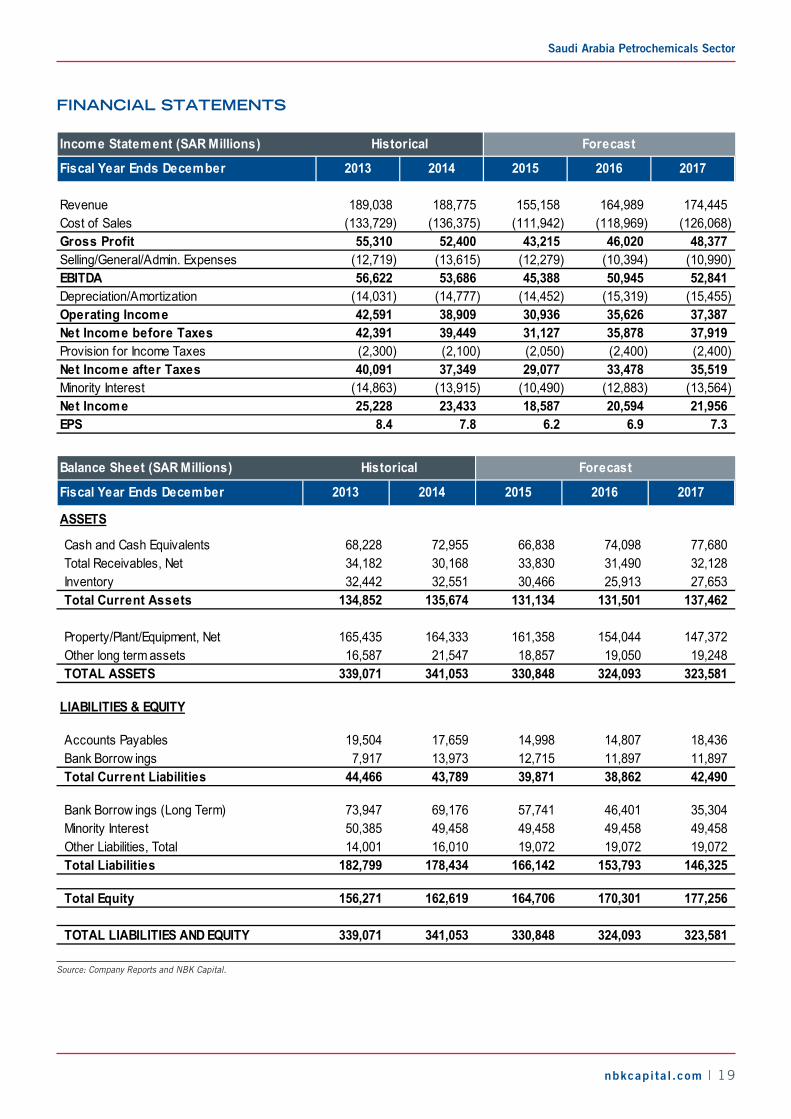
Figure 23 Earnings Forecasts: NBK Capital versus Consensus
NBK Capital Consensus Difference NBK Capital Consensus DifferenceRevenues 155,158 157,575 -2% 164,989 172,293 -4%EBITDA 45,388 46,147 -2% 50,945 47,842 6%Net Income 18,587 19,491 -5% 20,594 21,149 -3%EPS (SAR) 6.2 6.5 -5% 6.9 7.0 -3%
SAR million
2015F 2016F
Source: Bloomberg and NBK Capital
We are slightly below the
consensus on earnings
expectations, which we
attribute to our lower product
price assumptions
SABIC offers significantly
higher dividend yields than its
global peers, which we believe
strongly supports the stock
price
Saudi Arabia Petrochemicals Sector
nbkcapita l .com | 19
FINANCIAL STATEMENTS
Income Statement (SAR Millions)
Fiscal Year Ends December 2013 2014 2015 2016 2017
Revenue 189,038 188,775 155,158 164,989 174,445 Cost of Sales (133,729) (136,375) (111,942) (118,969) (126,068) Gross Profit 55,310 52,400 43,215 46,020 48,377 Selling/General/Admin. Expenses (12,719) (13,615) (12,279) (10,394) (10,990) EBITDA 56,622 53,686 45,388 50,945 52,841 Depreciation/Amortization (14,031) (14,777) (14,452) (15,319) (15,455) Operating Income 42,591 38,909 30,936 35,626 37,387 Net Income before Taxes 42,391 39,449 31,127 35,878 37,919 Provision for Income Taxes (2,300) (2,100) (2,050) (2,400) (2,400) Net Income after Taxes 40,091 37,349 29,077 33,478 35,519 Minority Interest (14,863) (13,915) (10,490) (12,883) (13,564) Net Income 25,228 23,433 18,587 20,594 21,956 EPS 8.4 7.8 6.2 6.9 7.3
Historical Forecast
Balance Sheet (SAR Millions)
Fiscal Year Ends December 2013 2014 2015 2016 2017
ASSETS
Cash and Cash Equivalents 68,228 72,955 66,838 74,098 77,680 Total Receivables, Net 34,182 30,168 33,830 31,490 32,128 Inventory 32,442 32,551 30,466 25,913 27,653 Total Current Assets 134,852 135,674 131,134 131,501 137,462
Property/Plant/Equipment, Net 165,435 164,333 161,358 154,044 147,372 Other long term assets 16,587 21,547 18,857 19,050 19,248 TOTAL ASSETS 339,071 341,053 330,848 324,093 323,581
LIABILITIES & EQUITY
Accounts Payables 19,504 17,659 14,998 14,807 18,436 Bank Borrow ings 7,917 13,973 12,715 11,897 11,897 Total Current Liabilities 44,466 43,789 39,871 38,862 42,490
Bank Borrow ings (Long Term) 73,947 69,176 57,741 46,401 35,304 Minority Interest 50,385 49,458 49,458 49,458 49,458 Other Liabilities, Total 14,001 16,010 19,072 19,072 19,072 Total Liabilities 182,799 178,434 166,142 153,793 146,325
Total Equity 156,271 162,619 164,706 170,301 177,256
TOTAL LIABILITIES AND EQUITY 339,071 341,053 330,848 324,093 323,581
Historical Forecast
Source: Company Reports and NBK Capital.
October 13, 2015
20 | nbkcapita l .com
Cash Flow (SAR Millions)
Fiscal Year Ends December 2013 2014 2015 2016 2017
Cash from Operating Activities 59,997 54,171 44,348 54,542 51,246 Cash from Investing Activities (18,039) (25,684) (10,781) (7,233) (7,994) Cash from Financing Activities (41,246) (33,066) (38,183) (40,041) (39,660)
Historical Forecast
Key Metrics and RatiosFiscal Year Ends December 2013 2014 2015 2016 2017
GrowthRevenue 0% 0% -18% 6% 6%Operating Profit 4% -9% -20% 15% 5%EBITDA 4% -5% -15% 12% 4%Net Profit 2% -7% -21% 11% 7%
Margin and ProfitabilityEBITDA margin 30% 28% 29% 31% 30%Net Profit Margin (before minorities) 21% 12% 19% 20% 20%
ValuationEPS (SAR) 8.4 7.8 6.2 6.9 7.3 DPS (SAR) 5.0 5.5 5.0 5.0 5.0 Payout Ratio (%) 59% 70% 81% 73% 68%Dividend Yield (%) 6.1% 6.7% 6.1% 6.1% 6.1%
P/E (x) 9.8 10.5 13.3 12.0 11.2 P/BV (x) 1.6 1.5 1.5 1.4 1.4 EV/Sales (x) 2.0 2.0 2.4 2.3 2.2 EV/EBITDA (x) 6.7 7.1 8.4 7.4 7.2
Historical Forecast
Source: Company Reports and NBK Capital.
Saudi Arabia Petrochemicals Sector
nbkcapita l .com | 21
YANSABShort-term Attractive, FCF supportive
Key Data
Fair Value per Share (SAR) 50.30Closing Price (SAR) * 48.7452-w eek High / Low (SAR) 69.5 / 38.3YTD / 12-month Return 2.3%/-31.7%P/E (TTM) 15.1 Shares Outstanding (Millions) 562.5 Market Cap (USD Millions) 7,311 Free Float 38.0%Daily Trading Turnover ( 6-mo avg.,USD Millions) 9.1 Reuters / Bloomberg Code 2290.SE/ YANSAB AB
*As of October 07, 2015. Source: Bloomberg and NBK Capital
Key Metrics
2014A 2015F 2016F 2017FEPS (SAR) 4.4 2.4 3.4 3.8EPS Grow th -6% -46% 41% 13%P/E 11.1 20.4 14.4 12.8Dividend Yield 6.2% 4.6% 6.2% 7.2%EV/EBITDA 6.9 10.0 8.6 8.1Revenue (SAR Millions) 9,511 6,794 7,354 7,759Revenue Grow th 2% -29% 8% 6%EBITDA (SAR Millions) 4,130 2,851 3,319 3,542EBITDA Grow th 1% -31% 16% 7%EBITDA Margin 43% 42% 45% 46%
Source: Company Reports and NBK Capital
Quarterly Forecasts
SAR Millions 3Q2014A 2Q2015A 3Q2015F 4Q2015FRevenue 2,494 1,563 1,846 1,668 EBITDA 1,107 593 870 724
Source: Company Reports and NBK Capital
Rebased Price Performance
50
60
70
80
90
100
110
Oct-14 Jan-15 Apr-15 Jul-15 Oct-15
YANSAB SASEPETR TASI
Source: Company Reports and NBK Capital
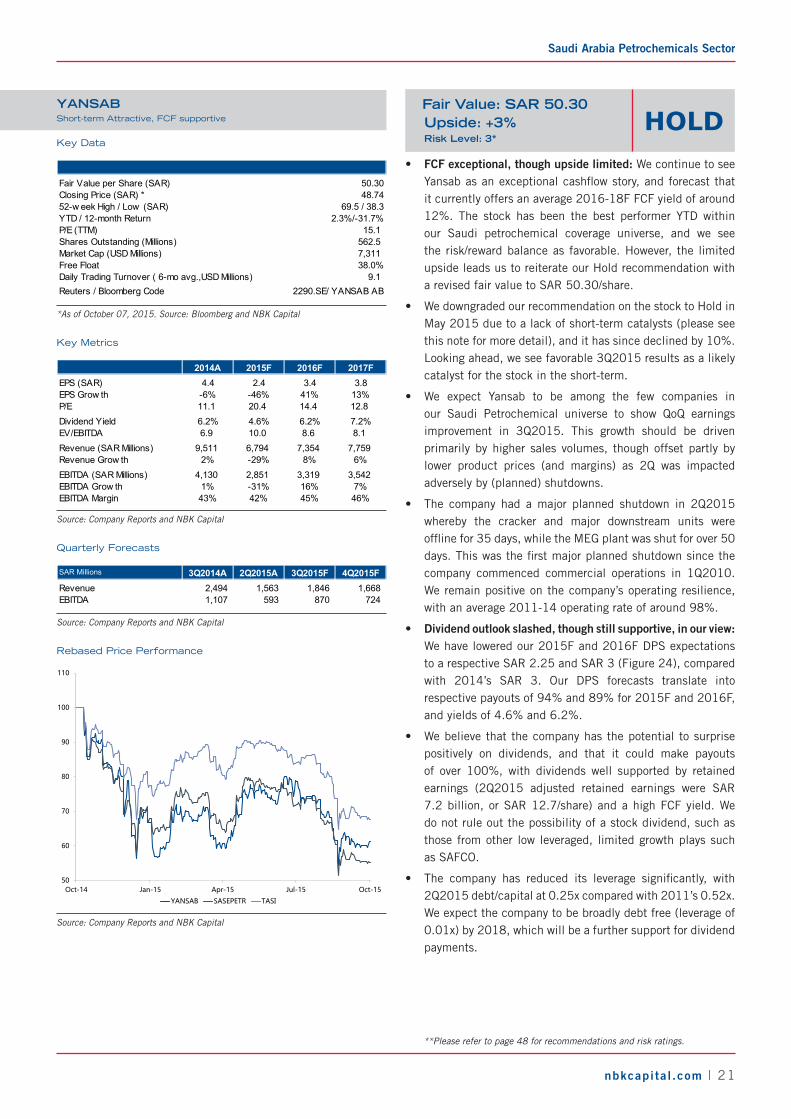
• FCF exceptional, though upside limited: We continue to see Yansab as an exceptional cashflow story, and forecast that it currently offers an average 2016-18F FCF yield of around 12%. The stock has been the best performer YTD within our Saudi petrochemical coverage universe, and we see the risk/reward balance as favorable. However, the limited upside leads us to reiterate our Hold recommendation with a revised fair value to SAR 50.30/share.
• We downgraded our recommendation on the stock to Hold in May 2015 due to a lack of short-term catalysts (please see this note for more detail), and it has since declined by 10%. Looking ahead, we see favorable 3Q2015 results as a likely catalyst for the stock in the short-term.
• We expect Yansab to be among the few companies in our Saudi Petrochemical universe to show QoQ earnings improvement in 3Q2015. This growth should be driven primarily by higher sales volumes, though offset partly by lower product prices (and margins) as 2Q was impacted adversely by (planned) shutdowns.
• The company had a major planned shutdown in 2Q2015 whereby the cracker and major downstream units were offline for 35 days, while the MEG plant was shut for over 50 days. This was the first major planned shutdown since the company commenced commercial operations in 1Q2010. We remain positive on the company’s operating resilience, with an average 2011-14 operating rate of around 98%.
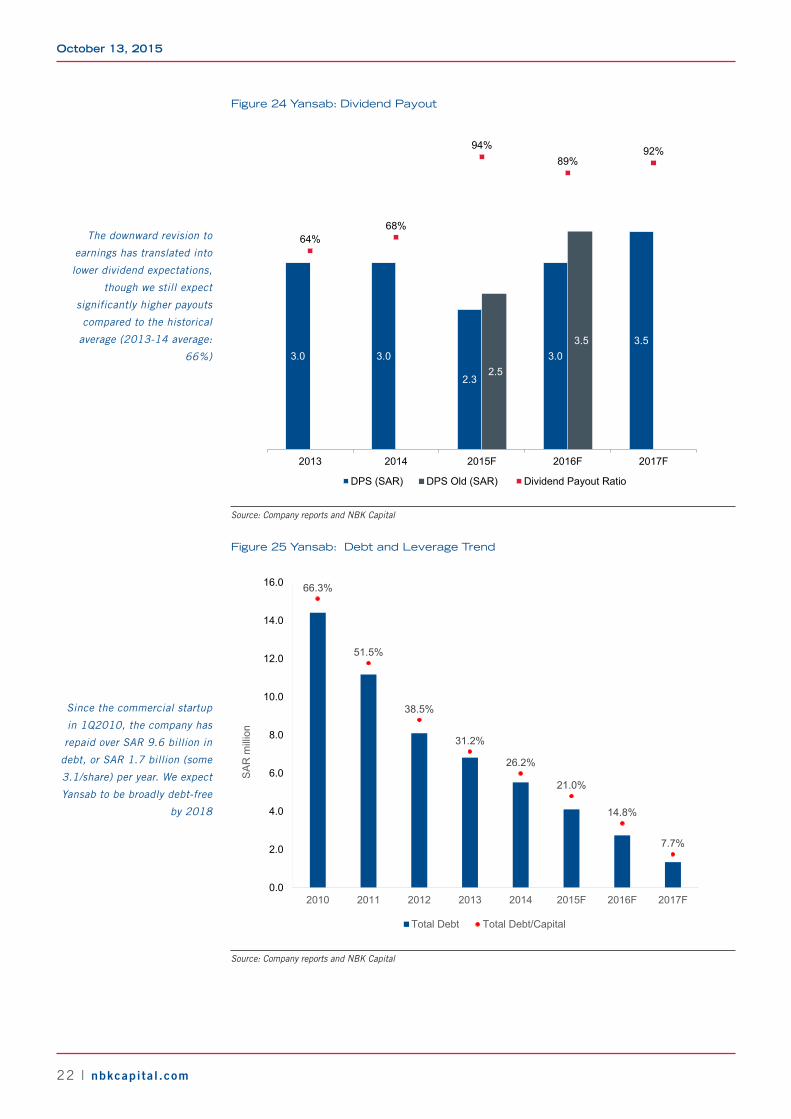
• Dividend outlook slashed, though still supportive, in our view: We have lowered our 2015F and 2016F DPS expectations to a respective SAR 2.25 and SAR 3 (Figure 24), compared with 2014’s SAR 3. Our DPS forecasts translate into respective payouts of 94% and 89% for 2015F and 2016F, and yields of 4.6% and 6.2%.
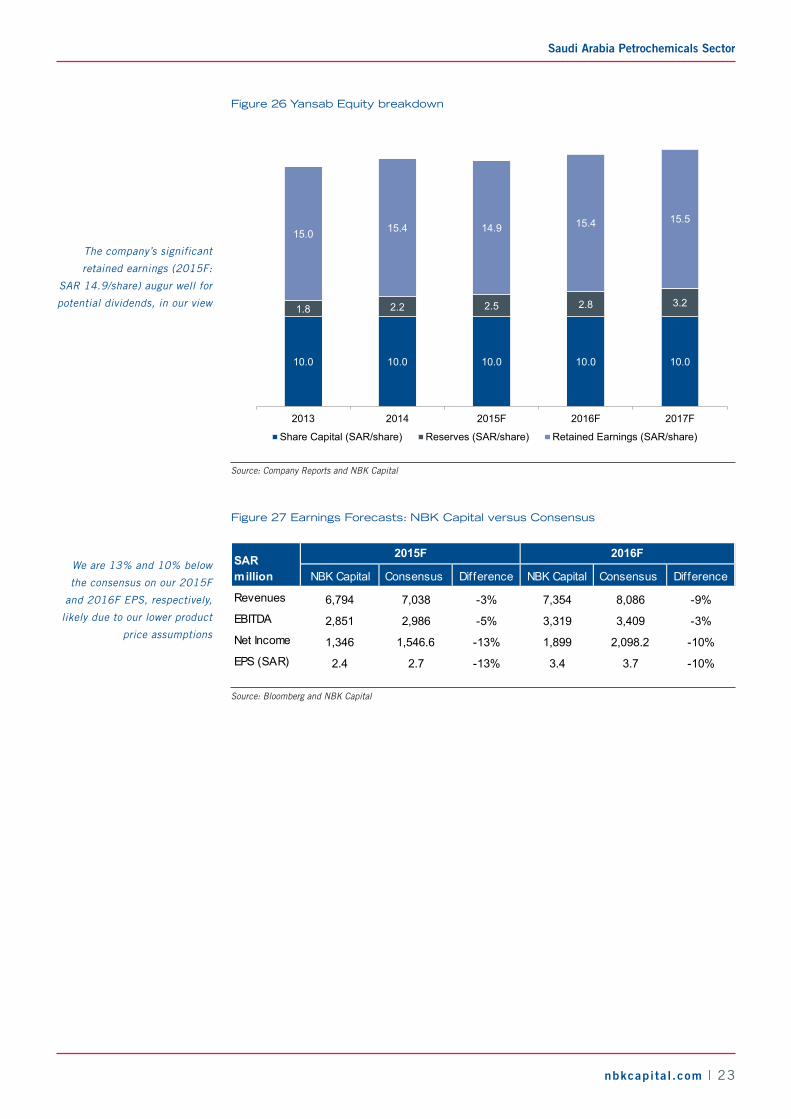
• We believe that the company has the potential to surprise positively on dividends, and that it could make payouts of over 100%, with dividends well supported by retained earnings (2Q2015 adjusted retained earnings were SAR 7.2 billion, or SAR 12.7/share) and a high FCF yield. We do not rule out the possibility of a stock dividend, such as those from other low leveraged, limited growth plays such as SAFCO.
• The company has reduced its leverage significantly, with 2Q2015 debt/capital at 0.25x compared with 2011’s 0.52x. We expect the company to be broadly debt free (leverage of 0.01x) by 2018, which will be a further support for dividend payments.
**Please refer to page 48 for recommendations and risk ratings.
HOLDFair Value: SAR 50.30Upside: +3%Risk Level: 3*
October 13, 2015
22 | nbkcapita l .com
Figure 24 Yansab: Dividend Payout
3.0 3.0
2.3
3.03.5
2.5
3.5
64%68%
94%89%
92%
0%
10%
20%
30%
40%
50%
60%
70%
80%
90%
100%
-
0.5
1.0
1.5
2.0
2.5
3.0
3.5
4.0
4.5
5.0
2013 2014 2015F 2016F 2017F
DPS (SAR) DPS Old (SAR) Dividend Payout Ratio
Source: Company reports and NBK Capital
Figure 25 Yansab: Debt and Leverage Trend
66.3%
51.5%
38.5%
31.2%
26.2%
21.0%
14.8%
7.7%
0%
10%
20%
30%
40%
50%
60%
70%
0.0
2.0
4.0
6.0
8.0
10.0
12.0
14.0
16.0
2010 2011 2012 2013 2014 2015F 2016F 2017F
SA
R m
illion
Total Debt Total Debt/Capital
Source: Company reports and NBK Capital
The downward revision to
earnings has translated into
lower dividend expectations,
though we still expect
significantly higher payouts
compared to the historical
average (2013-14 average:
66%)
Since the commercial startup
in 1Q2010, the company has
repaid over SAR 9.6 billion in
debt, or SAR 1.7 billion (some
3.1/share) per year. We expect
Yansab to be broadly debt-free
by 2018
Saudi Arabia Petrochemicals Sector
nbkcapita l .com | 23
Figure 26 Yansab Equity breakdown
10.0 10.0 10.0 10.0 10.0
1.8 2.2 2.5 2.8 3.2
15.0 15.4 14.9 15.4 15.5
5
10
15
20
25
30
35
2013 2014 2015F 2016F 2017F
Share Capital (SAR/share) Reserves (SAR/share) Retained Earnings (SAR/share)
Source: Company Reports and NBK Capital
Figure 27 Earnings Forecasts: NBK Capital versus Consensus
NBK Capital Consensus Difference NBK Capital Consensus Difference
Revenues 6,794 7,038 -3% 7,354 8,086 -9%EBITDA 2,851 2,986 -5% 3,319 3,409 -3%Net Income 1,346 1,546.6 -13% 1,899 2,098.2 -10%EPS (SAR) 2.4 2.7 -13% 3.4 3.7 -10%
SAR million
2015F 2016F
Source: Bloomberg and NBK Capital
The company’s significant
retained earnings (2015F:
SAR 14.9/share) augur well for
potential dividends, in our view
We are 13% and 10% below
the consensus on our 2015F
and 2016F EPS, respectively,
likely due to our lower product
price assumptions

October 13, 2015
24 | nbkcapita l .com
FINANCIAL STATEMENTS
Income Statement (SAR Millions)
Fiscal Year Ends December 2013 2014 2015 2016 2017
Revenue 9,354 9,511 6,794 7,354 7,759 Cost of Sales (6,129) (6,424) (4,900) (4,969) (5,151) Gross Profit 3,225 3,087 1,894 2,386 2,608 Selling/General/Admin. Expenses (232) (244) (211) (199) (209) EBITDA 4,073 4,130 2,851 3,319 3,542 Depreciation/Amortization (1,080) (1,287) (1,167) (1,132) (1,143) Operating Income 2,993 2,843 1,684 2,187 2,399 Finance Income (Costs), Net (260) (224) (196) (144) (96) Other Income, Net 29 11 20 20 20 Net Income before Taxes 2,762 2,630 1,508 2,064 2,323 Provision for Income Taxes (118) (152) (162) (165) (186) Net Income after Taxes 2,645 2,478 1,346 1,899 2,137 Minority Interest - - - - - Net Income 2,645 2,478 1,346 1,899 2,137 EPS 4.7 4.4 2.4 3.4 3.8
Historical Forecast
Balance Sheet (SAR Millions)
Fiscal Year Ends December 2013 2014 2015 2016 2017
ASSETSCash and Cash Equivalents 3,021 3,656 2,694 2,674 2,542 Total Receivables, Net 2,642 2,525 2,492 2,526 2,652 Inventory 1,119 1,316 1,287 1,279 1,145 Total Current Assets 6,782 7,497 6,474 6,479 6,340 Property/Plant/Equipment, Net 15,623 14,589 13,869 12,935 11,993 Goodw ill and Other Intangibles, Net 305 192 192 192 192 Other long term assets 191 189 189 189 189 TOTAL ASSETS 22,901 22,467 20,724 19,796 18,714
LIABILITIES & EQUITYAccounts Payables 252 463 267 274 286 Bank Borrow ings 1,298 1,462 1,357 1,403 1,145 Other Current liabilities 623 729 729 729 729 Total Current Liabilities 2,174 2,655 2,353 2,407 2,161 Bank Borrow ings (Long Term) 5,523 4,060 2,749 1,346 201 Other Liabilities, Total 161 200 200 200 200 Total Liabilities 7,857 6,915 5,302 3,952 2,561 Total Equity 15,043 15,552 15,421 15,843 16,152 TOTAL LIABILITIES AND EQUITY 22,901 22,467 20,724 19,796 18,714
Historical Forecast
Source: Company Reports and NBK Capital.
Saudi Arabia Petrochemicals Sector
nbkcapita l .com | 25
Cash Flow (SAR Millions)
Fiscal Year Ends December 2013 2014 2015 2016 2017
Cash from Operating Activities 3,620 4,035 2,320 3,013 3,300 Cash from Investing Activities (204) (190) (389) (199) (201) Cash from Financing Activities (1,840) (3,260) (2,893) (2,834) (3,231)
Historical Forecast
Key Metrics and Ratios
Fiscal Year Ends December 2013 2014 2015 2016 2017
GrowthRevenue 1% 2% -29% 8% 6%Operating Profit 4% -5% -41% 30% 10%EBITDA 5% 1% -31% 16% 7%Net Profit 8% -6% -46% 41% 13%
Margin and ProfitabilityEBITDA margin 44% 43% 42% 45% 46%Net Profit Margin 28% 26% 20% 26% 28%
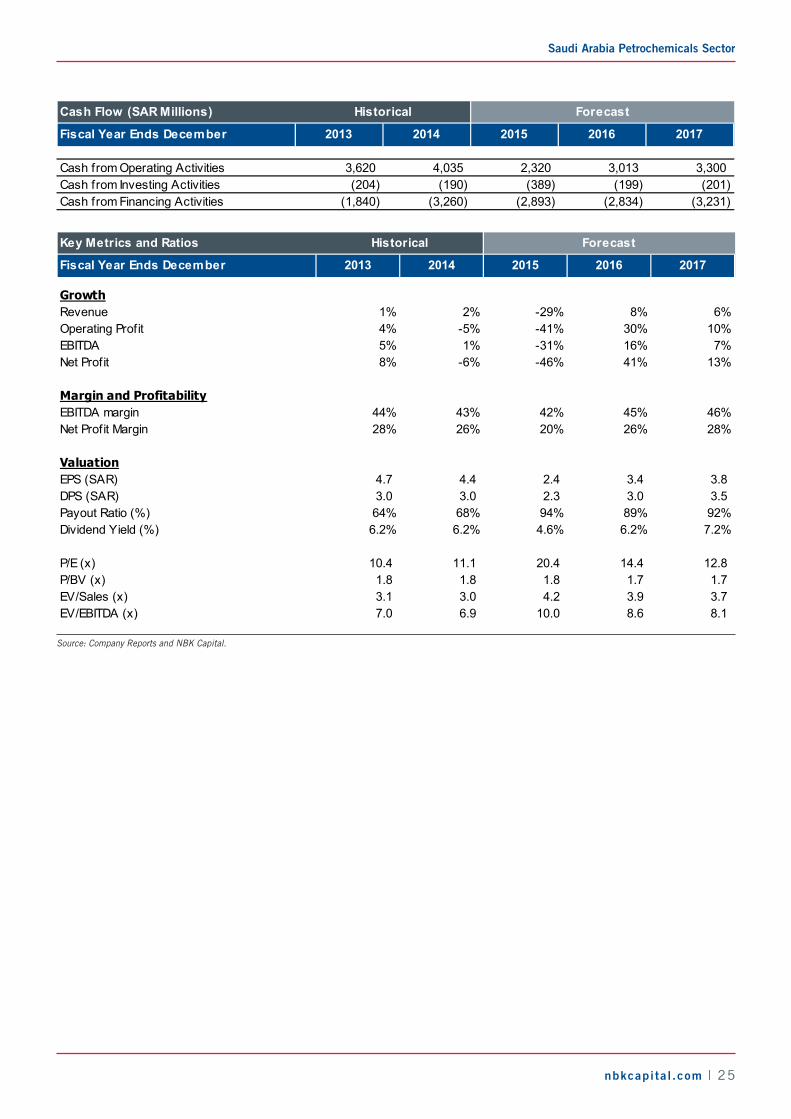
ValuationEPS (SAR) 4.7 4.4 2.4 3.4 3.8 DPS (SAR) 3.0 3.0 2.3 3.0 3.5 Payout Ratio (%) 64% 68% 94% 89% 92%Dividend Yield (%) 6.2% 6.2% 4.6% 6.2% 7.2%
P/E (x) 10.4 11.1 20.4 14.4 12.8 P/BV (x) 1.8 1.8 1.8 1.7 1.7 EV/Sales (x) 3.1 3.0 4.2 3.9 3.7 EV/EBITDA (x) 7.0 6.9 10.0 8.6 8.1
Historical Forecast
Source: Company Reports and NBK Capital.
October 13, 2015
26 | nbkcapita l .com
KAYANAnother year of losses
Key Data
Fair Value per Share (SAR) 9.00Closing Price (SAR) * 8.5752-w eek High / Low (SAR) 15.7/7.4YTD / 12-month Return -22%/-47%P/E (TTM) nmfShares Outstanding (Millions) 1,500 Market Cap (USD Millions) 3,428 Free Float 61.0%Daily Trading Turnover ( 6-mo avg.,USD Millions) 23.6 Reuters / Bloomberg Code 2350.SE/KAYAN AB
*As of October 07, 2015. Source: Bloomberg and NBK Capital
Key Metrics
2014A 2015F 2016F 2017FEPS (SAR) (0.0) (0.4) 0.6 0.8EPS Grow th nmf nmf nmf 22%P/E nmf nmf 13.3 10.9Dividend Yield 0.0% 0.0% 0.0% 0.0%EV/EBITDA 12.4 14.1 8.5 8.2Revenue (SAR Millions) 11,636 8,037 9,374 9,913Revenue Grow th 12% -31% 17% 6%EBITDA (SAR Millions) 2,862 2,519 4,158 4,319EBITDA Grow th 13% -12% 65% 4%EBITDA Margin 25% 31% 44% 44%
Source: Company Reports and NBK Capital
Quarterly Forecasts
SAR Millions 3Q2014A 2Q2015A 3Q2015F 4Q2015FRevenue 3,235 2,149 2,166 1,969EBITDA 818 770 819 722
Source: Company Reports and NBK Capital
Rebased Price Performance
40
50
60
70
80
90
100
110
Oct-14 Jan-15 Apr-15 Jul-15 Oct-15
KAYAN SASEPETR TASI
Source: Company Reports and NBK Capital
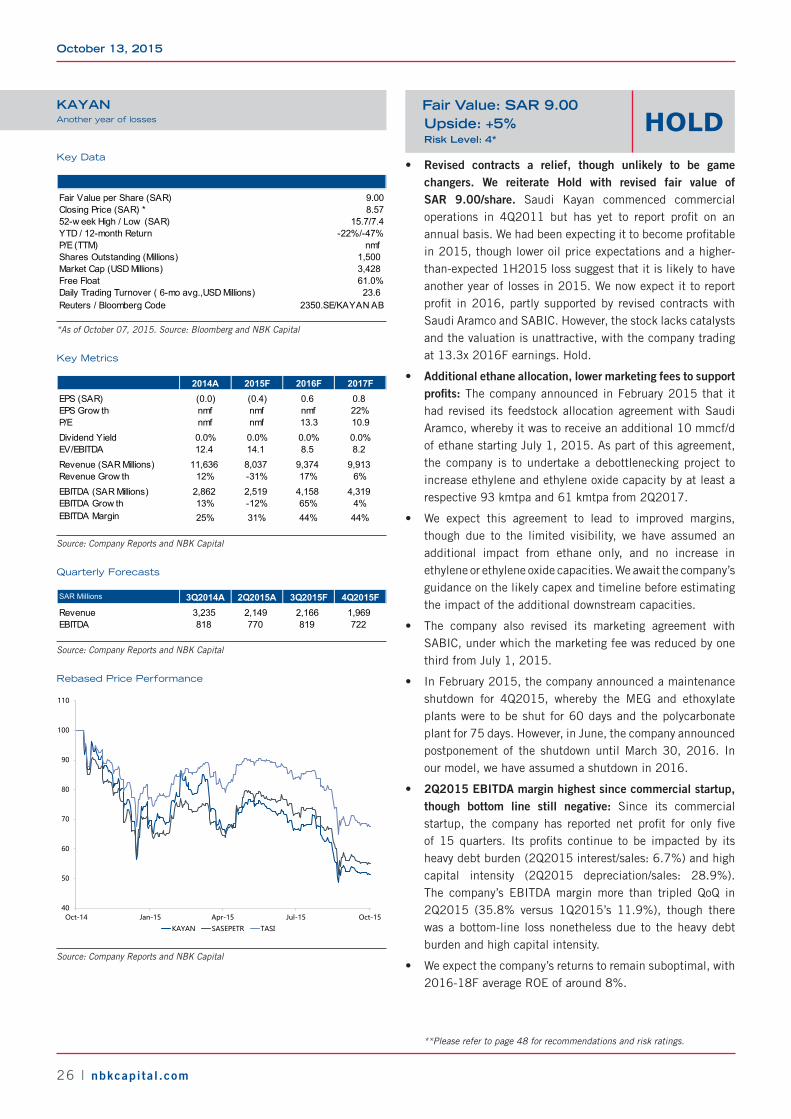
• Revised contracts a relief, though unlikely to be game changers. We reiterate Hold with revised fair value of SAR 9.00/share. Saudi Kayan commenced commercial operations in 4Q2011 but has yet to report profit on an annual basis. We had been expecting it to become profitable in 2015, though lower oil price expectations and a higher-than-expected 1H2015 loss suggest that it is likely to have another year of losses in 2015. We now expect it to report profit in 2016, partly supported by revised contracts with Saudi Aramco and SABIC. However, the stock lacks catalysts and the valuation is unattractive, with the company trading at 13.3x 2016F earnings. Hold.
• Additional ethane allocation, lower marketing fees to support profits: The company announced in February 2015 that it had revised its feedstock allocation agreement with Saudi Aramco, whereby it was to receive an additional 10 mmcf/d of ethane starting July 1, 2015. As part of this agreement, the company is to undertake a debottlenecking project to increase ethylene and ethylene oxide capacity by at least a respective 93 kmtpa and 61 kmtpa from 2Q2017.
• We expect this agreement to lead to improved margins, though due to the limited visibility, we have assumed an additional impact from ethane only, and no increase in ethylene or ethylene oxide capacities. We await the company’s guidance on the likely capex and timeline before estimating the impact of the additional downstream capacities.
• The company also revised its marketing agreement with SABIC, under which the marketing fee was reduced by one third from July 1, 2015.
• In February 2015, the company announced a maintenance shutdown for 4Q2015, whereby the MEG and ethoxylate plants were to be shut for 60 days and the polycarbonate plant for 75 days. However, in June, the company announced postponement of the shutdown until March 30, 2016. In our model, we have assumed a shutdown in 2016.
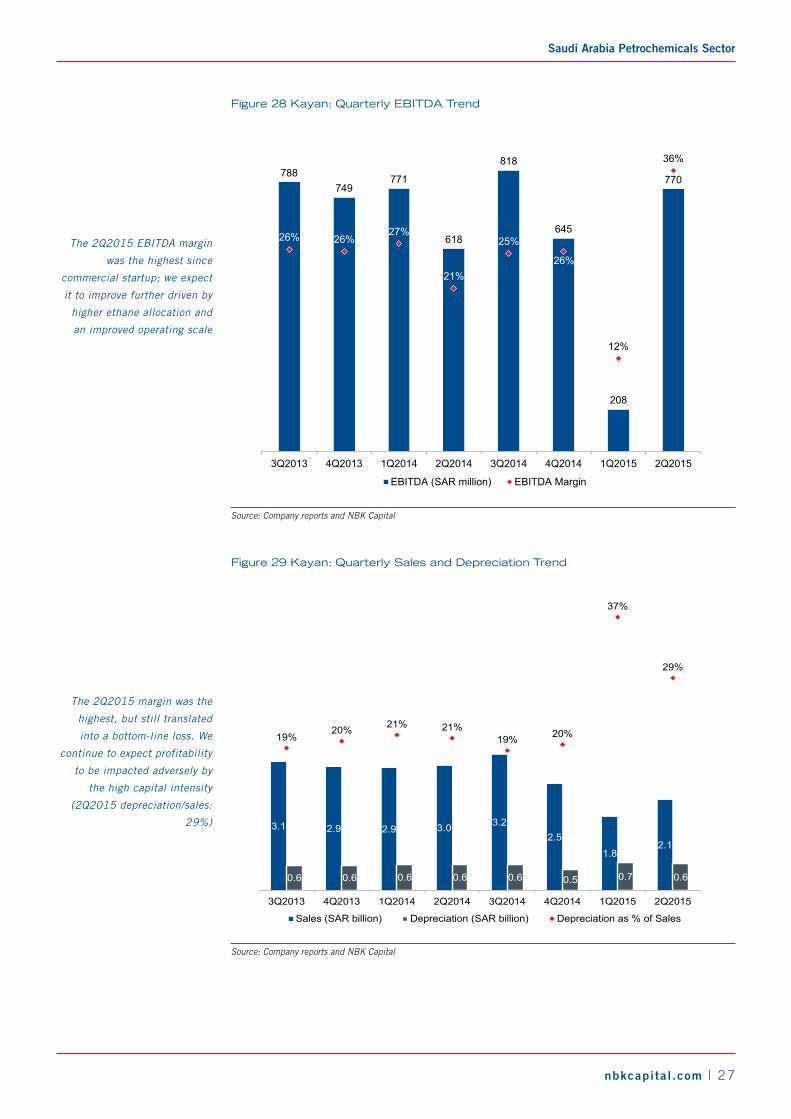
• 2Q2015 EBITDA margin highest since commercial startup, though bottom line still negative: Since its commercial startup, the company has reported net profit for only five of 15 quarters. Its profits continue to be impacted by its heavy debt burden (2Q2015 interest/sales: 6.7%) and high capital intensity (2Q2015 depreciation/sales: 28.9%). The company’s EBITDA margin more than tripled QoQ in 2Q2015 (35.8% versus 1Q2015’s 11.9%), though there was a bottom-line loss nonetheless due to the heavy debt burden and high capital intensity.
• We expect the company’s returns to remain suboptimal, with 2016-18F average ROE of around 8%.
**Please refer to page 48 for recommendations and risk ratings.
HOLDFair Value: SAR 9.00Upside: +5%Risk Level: 4*
Saudi Arabia Petrochemicals Sector
nbkcapita l .com | 27
Figure 28 Kayan: Quarterly EBITDA Trend
788749
771
618
818
645
208
770
26% 26%27%
21%
25%
26%
12%
36%
0%
5%
10%
15%
20%
25%
30%
35%
40%
100
200
300
400
500
600
700
800
900
3Q2013 4Q2013 1Q2014 2Q2014 3Q2014 4Q2014 1Q2015 2Q2015
EBITDA (SAR million) EBITDA Margin
Source: Company reports and NBK Capital
Figure 29 Kayan: Quarterly Sales and Depreciation Trend
3.1 2.9 2.9 3.0 3.22.5
1.82.1
0.6 0.6 0.6 0.6 0.6 0.5 0.7 0.6
19%20% 21% 21%
19% 20%
37%
29%
0%
5%
10%
15%
20%
25%
30%
35%
40%
0.0
1.0
2.0
3.0
4.0
5.0
6.0
7.0
3Q2013 4Q2013 1Q2014 2Q2014 3Q2014 4Q2014 1Q2015 2Q2015
Sales (SAR billion) Depreciation (SAR billion) Depreciation as % of Sales
Source: Company reports and NBK Capital
The 2Q2015 EBITDA margin
was the highest since
commercial startup; we expect
it to improve further driven by
higher ethane allocation and
an improved operating scale
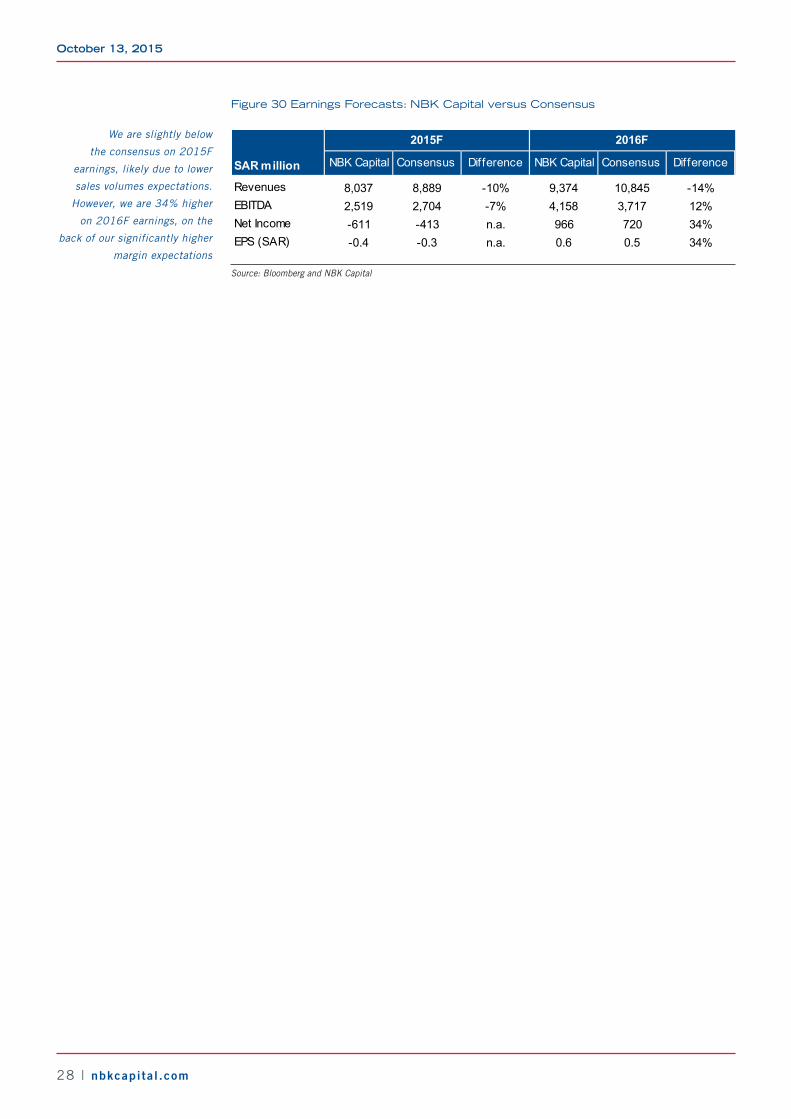
The 2Q2015 margin was the
highest, but still translated
into a bottom-line loss. We
continue to expect profitability
to be impacted adversely by
the high capital intensity
(2Q2015 depreciation/sales:
29%)
October 13, 2015
28 | nbkcapita l .com
Figure 30 Earnings Forecasts: NBK Capital versus Consensus
NBK Capital Consensus Difference NBK Capital Consensus Difference
Revenues 8,037 8,889 -10% 9,374 10,845 -14%EBITDA 2,519 2,704 -7% 4,158 3,717 12%Net Income -611 -413 n.a. 966 720 34%EPS (SAR) -0.4 -0.3 n.a. 0.6 0.5 34%
SAR million
2015F 2016F
Source: Bloomberg and NBK Capital
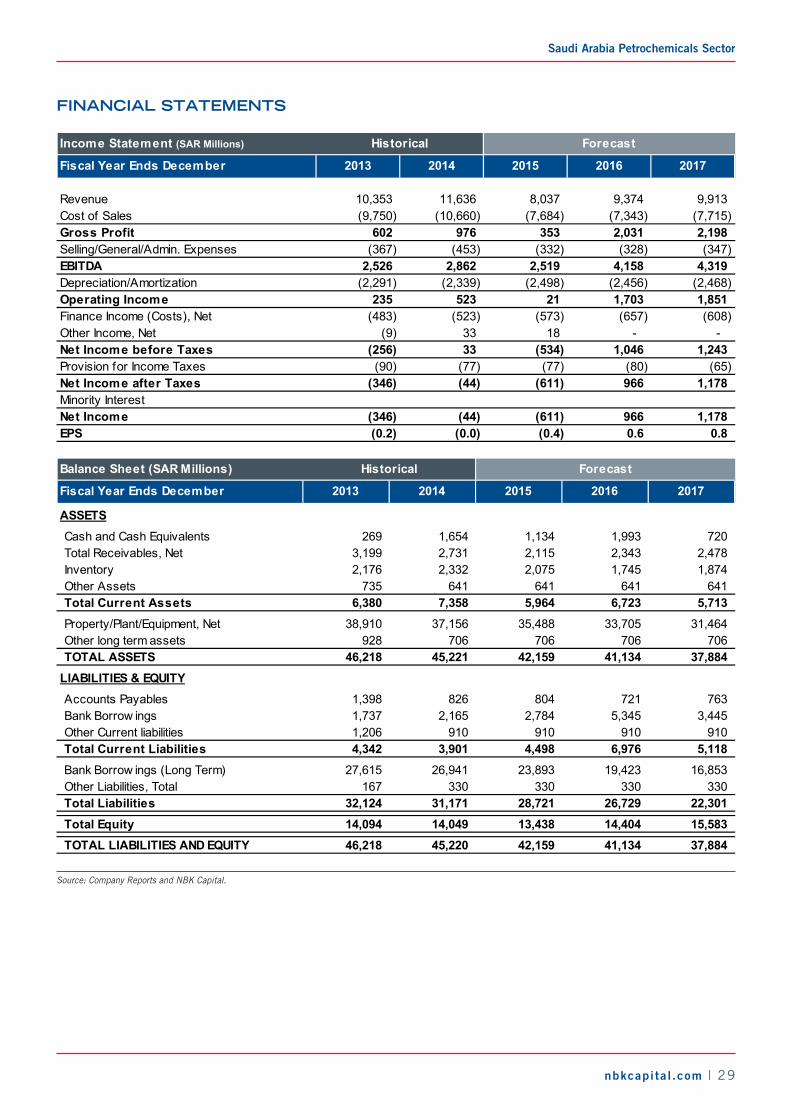
We are slightly below
the consensus on 2015F
earnings, likely due to lower
sales volumes expectations.
However, we are 34% higher
on 2016F earnings, on the
back of our significantly higher
margin expectations
Saudi Arabia Petrochemicals Sector
nbkcapita l .com | 29
FINANCIAL STATEMENTS
Income Statement (SAR Millions)
Fiscal Year Ends December 2013 2014 2015 2016 2017
Revenue 10,353 11,636 8,037 9,374 9,913 Cost of Sales (9,750) (10,660) (7,684) (7,343) (7,715) Gross Profit 602 976 353 2,031 2,198 Selling/General/Admin. Expenses (367) (453) (332) (328) (347) EBITDA 2,526 2,862 2,519 4,158 4,319 Depreciation/Amortization (2,291) (2,339) (2,498) (2,456) (2,468) Operating Income 235 523 21 1,703 1,851 Finance Income (Costs), Net (483) (523) (573) (657) (608) Other Income, Net (9) 33 18 - - Net Income before Taxes (256) 33 (534) 1,046 1,243 Provision for Income Taxes (90) (77) (77) (80) (65) Net Income after Taxes (346) (44) (611) 966 1,178 Minority InterestNet Income (346) (44) (611) 966 1,178 EPS (0.2) (0.0) (0.4) 0.6 0.8
Historical Forecast
Balance Sheet (SAR Millions)
Fiscal Year Ends December 2013 2014 2015 2016 2017
ASSETSCash and Cash Equivalents 269 1,654 1,134 1,993 720 Total Receivables, Net 3,199 2,731 2,115 2,343 2,478 Inventory 2,176 2,332 2,075 1,745 1,874 Other Assets 735 641 641 641 641 Total Current Assets 6,380 7,358 5,964 6,723 5,713 Property/Plant/Equipment, Net 38,910 37,156 35,488 33,705 31,464 Other long term assets 928 706 706 706 706 TOTAL ASSETS 46,218 45,221 42,159 41,134 37,884
LIABILITIES & EQUITYAccounts Payables 1,398 826 804 721 763 Bank Borrow ings 1,737 2,165 2,784 5,345 3,445 Other Current liabilities 1,206 910 910 910 910 Total Current Liabilities 4,342 3,901 4,498 6,976 5,118 Bank Borrow ings (Long Term) 27,615 26,941 23,893 19,423 16,853 Other Liabilities, Total 167 330 330 330 330 Total Liabilities 32,124 31,171 28,721 26,729 22,301 Total Equity 14,094 14,049 13,438 14,404 15,583 TOTAL LIABILITIES AND EQUITY 46,218 45,220 42,159 41,134 37,884
Historical Forecast
Source: Company Reports and NBK Capital.
October 13, 2015
30 | nbkcapita l .com
Cash Flow (SAR Millions)
Fiscal Year Ends December 2013 2014 2015 2016 2017
Cash from Operating Activities 1,403 1,940 2,569 3,440 3,425 Cash from Investing Activities (1,375) (675) (662) (672) (227) Cash from Financing Activities (328) 120 (2,428) (1,909) (4,470)
Historical Forecast
Key Metrics and Ratios
Fiscal Year Ends December 2013 2014 2015 2016 2017
GrowthRevenue 9% 12% -31% 17% 6%Operating Profit nmf 122% -96% 7950% 9%EBITDA 34% 13% -12% 65% 4%Net Profit nmf nmf nmf nmf 22%
Margin and ProfitabilityEBITDA margin 24% 25% 31% 44% 44%Net Profit Margin -3% 0% -8% 10% 12%
ValuationEPS (SAR) (0.2) (0.0) (0.4) 0.6 0.8 DPS (SAR) - - - - - Payout Ratio (%) 0% 0% 0% 0% 0%Dividend Yield (%) 0.0% 0.0% 0.0% 0.0% 0%
P/E (x) nmf nmf nmf 13.3 10.9 P/BV (x) 0.9 0.9 1.0 0.9 0.8 EV/Sales (x) 3.4 3.0 4.4 3.8 3.6 EV/EBITDA (x) 14.0 12.4 14.1 8.5 8.2
Historical Forecast
Source: Company Reports and NBK Capital.
Saudi Arabia Petrochemicals Sector
nbkcapita l .com | 31
SAFCONo short-term catalysts
Key Data
Fair Value per Share (SAR) 106.60Closing Price (SAR) * 95.1152-w eek High / Low (SAR) 130.8/82.0YTD / 12-month Return -16%/-28%P/E (TTM) 13.8 Shares Outstanding (Millions) 416.6 Market Cap (USD Millions) 10,566 Free Float 40.3%Daily Trading Turnover ( 6-mo avg.,USD Millions) 11.8 Reuters / Bloomberg Code 2020. SE/ SAFCO AB
*As of October 07, 2015. Source: Bloomberg and NBK Capital
Key Metrics
2014A 2015F 2016F 2017FEPS (SAR) 7.6 5.3 6.4 7.3EPS Grow th 0% -31% 20% 14%P/E 12.5 18.0 14.9 13.1
Dividend Yield 5.9% 5.8% 6.8% 7.4%Revenue (SAR Millions) 4,456 3,671 4,460 4,820Revenue Grow th 5% -18% 22% 8%EBITDA (SAR Millions) 3,325 2,478 2,819 3,173EBITDA Grow th 5% -25% 14% 13%EBITDA Margin 74.6% 67.5% 63.2% 65.8%
Source: Company Reports and NBK Capital
Quarterly Forecasts
SAR Millions 3Q2014A 2Q2015A 3Q2015F 4Q2015FRevenue 1,249 884 927 898 EBITDA 942 614 628 577
Source: Company Reports and NBK Capital
Rebased Price Performance
50
60
70
80
90
100
110
Oct-14 Jan-15 Apr-15 Jul-15 Oct-15
SAFCO SASEPETR TASI
Source: Company Reports and NBK Capital
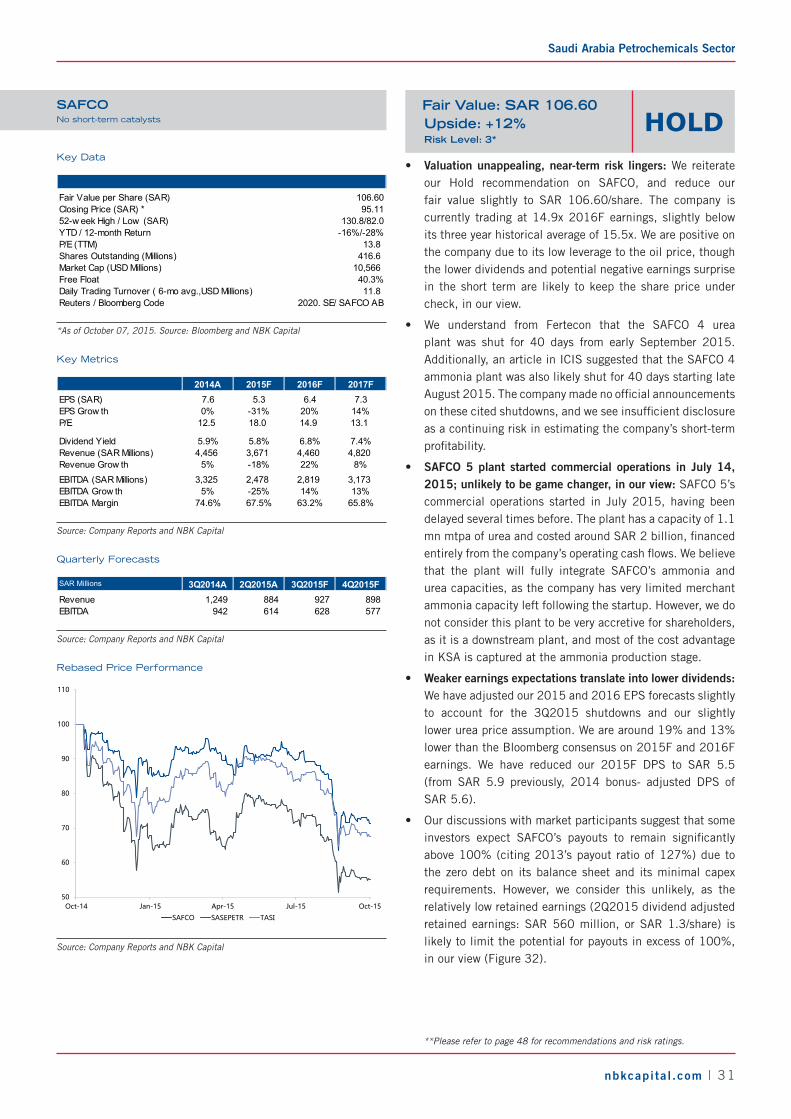
• Valuation unappealing, near-term risk lingers: We reiterate our Hold recommendation on SAFCO, and reduce our fair value slightly to SAR 106.60/share. The company is currently trading at 14.9x 2016F earnings, slightly below its three year historical average of 15.5x. We are positive on the company due to its low leverage to the oil price, though the lower dividends and potential negative earnings surprise in the short term are likely to keep the share price under check, in our view.
• We understand from Fertecon that the SAFCO 4 urea plant was shut for 40 days from early September 2015. Additionally, an article in ICIS suggested that the SAFCO 4 ammonia plant was also likely shut for 40 days starting late August 2015. The company made no official announcements on these cited shutdowns, and we see insufficient disclosure as a continuing risk in estimating the company’s short-term profitability.
• SAFCO 5 plant started commercial operations in July 14, 2015; unlikely to be game changer, in our view: SAFCO 5’s commercial operations started in July 2015, having been delayed several times before. The plant has a capacity of 1.1 mn mtpa of urea and costed around SAR 2 billion, financed entirely from the company’s operating cash flows. We believe that the plant will fully integrate SAFCO’s ammonia and urea capacities, as the company has very limited merchant ammonia capacity left following the startup. However, we do not consider this plant to be very accretive for shareholders, as it is a downstream plant, and most of the cost advantage in KSA is captured at the ammonia production stage.
• Weaker earnings expectations translate into lower dividends: We have adjusted our 2015 and 2016 EPS forecasts slightly to account for the 3Q2015 shutdowns and our slightly lower urea price assumption. We are around 19% and 13% lower than the Bloomberg consensus on 2015F and 2016F earnings. We have reduced our 2015F DPS to SAR 5.5 (from SAR 5.9 previously, 2014 bonus- adjusted DPS of SAR 5.6).
• Our discussions with market participants suggest that some investors expect SAFCO’s payouts to remain significantly above 100% (citing 2013’s payout ratio of 127%) due to the zero debt on its balance sheet and its minimal capex requirements. However, we consider this unlikely, as the relatively low retained earnings (2Q2015 dividend adjusted retained earnings: SAR 560 million, or SAR 1.3/share) is likely to limit the potential for payouts in excess of 100%, in our view (Figure 32).
**Please refer to page 48 for recommendations and risk ratings.
HOLDFair Value: SAR 106.60Upside: +12%Risk Level: 3*
October 13, 2015
32 | nbkcapita l .com
Figure 31 China Urea Exports (million mt)
1.5 1.3
4.1
6.6
8.5
2.1
5.6
4.2
7.0
2
4
6
8
10
12
14
16
2011 2012 2013 2014 YTD 2015
China Urea Exports (Jan-Aug) China Urea Exports (Sep- Dec)
3.6
6.9
8.3
13.6
Source: China Customs and NBK Capital
Figure 32 SAFCO: Equity breakdown (SAR/share)
8.0 8.010.0 10.0 10.0
4.1 4.1
4.6 5.1 5.1
7.7 6.84.1 4.3 4.8
5
10
15
20
25
2013 2014 2015F 2016F 2017F
Share Capital (SAR/share) Reserves (SAR/share) Retained Earnings/Others (SAR /share)
Source: Company reports and NBK Capital
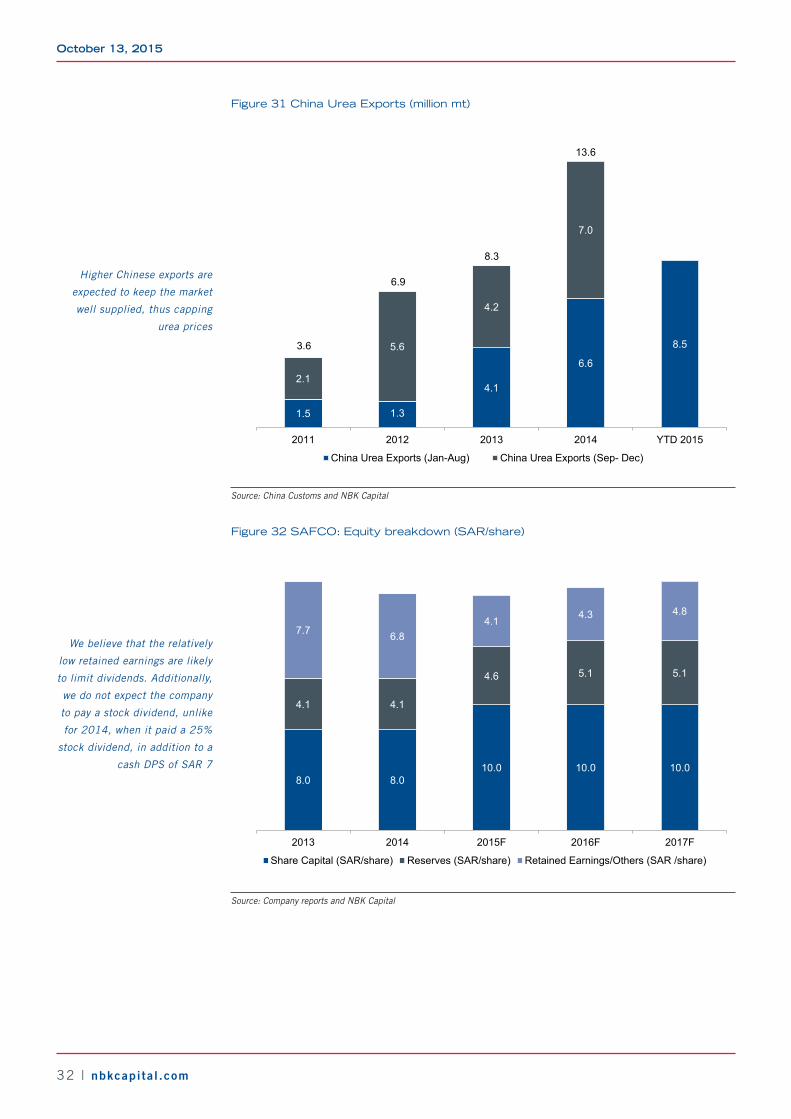
Higher Chinese exports are
expected to keep the market
well supplied, thus capping
urea prices
We believe that the relatively
low retained earnings are likely
to limit dividends. Additionally,
we do not expect the company
to pay a stock dividend, unlike
for 2014, when it paid a 25%
stock dividend, in addition to a
cash DPS of SAR 7
Saudi Arabia Petrochemicals Sector
nbkcapita l .com | 33
Figure 33 SAFCO: Dividends and Payout Trend
9.6
5.6 5.5 6.5 7.0
5.9 6.3
127%
74%
104% 102%96%
0%
20%
40%
60%
80%
100%
120%
140%
-
2.0
4.0
6.0
8.0
10.0
12.0
2013 2014 2015F 2016F 2017FDPS (SAR) DPS Old (SAR) Dividend Payout Ratio
Source: Company Reports and NBK Capital
Figure 34 Earnings Forecasts: NBK Capital versus Consensus
NBK Capital Consensus Difference NBK Capital Consensus Difference
Revenue 3,671 4,124 -11.0% 4,460 4,692 -4.9%
EBITDA 2,478 2,910 -14.8% 2,819 3,243 -13.1%
Net Income 2,205 2,734 -19.3% 2,651 3,127 -15.2%
EPS (SAR) 5.3 6.6 -19.3% 6.4 7.5 -15.2%
SAR million
2015F 2016F
Source: Bloomberg and NBK Capital
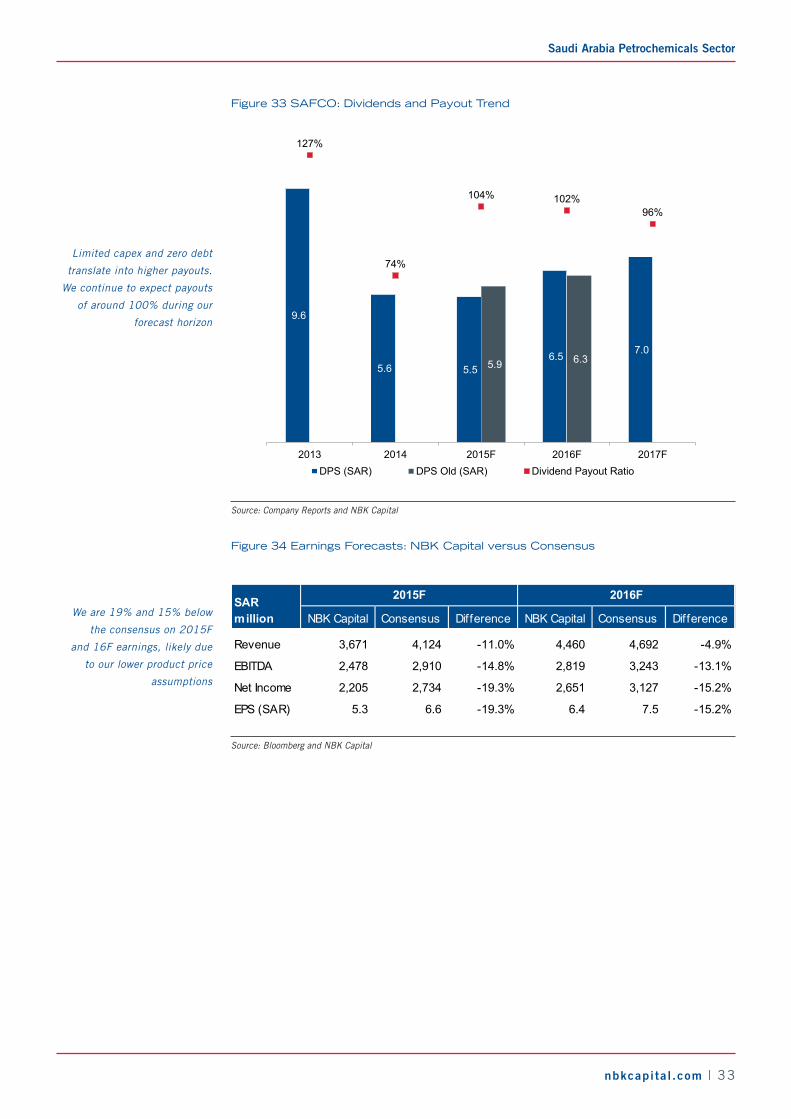
Limited capex and zero debt
translate into higher payouts.
We continue to expect payouts
of around 100% during our
forecast horizon
We are 19% and 15% below
the consensus on 2015F
and 16F earnings, likely due
to our lower product price
assumptions
October 13, 2015
34 | nbkcapita l .com
FINANCIAL STATEMENTS
Income Statement (SAR Millions)
Fiscal Year Ends December 2013 2014 2015 2016 2017
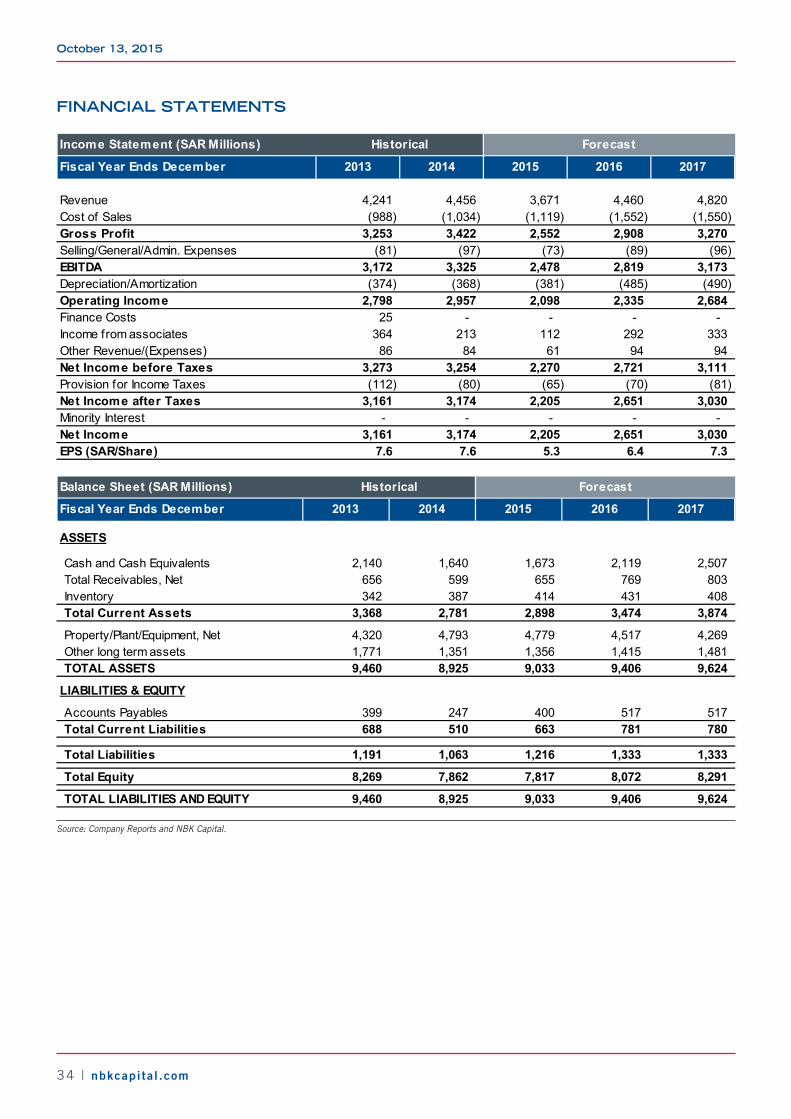
Revenue 4,241 4,456 3,671 4,460 4,820 Cost of Sales (988) (1,034) (1,119) (1,552) (1,550) Gross Profit 3,253 3,422 2,552 2,908 3,270 Selling/General/Admin. Expenses (81) (97) (73) (89) (96) EBITDA 3,172 3,325 2,478 2,819 3,173 Depreciation/Amortization (374) (368) (381) (485) (490) Operating Income 2,798 2,957 2,098 2,335 2,684 Finance Costs 25 - - - - Income from associates 364 213 112 292 333 Other Revenue/(Expenses) 86 84 61 94 94 Net Income before Taxes 3,273 3,254 2,270 2,721 3,111 Provision for Income Taxes (112) (80) (65) (70) (81) Net Income after Taxes 3,161 3,174 2,205 2,651 3,030 Minority Interest - - - - - Net Income 3,161 3,174 2,205 2,651 3,030 EPS (SAR/Share) 7.6 7.6 5.3 6.4 7.3
Historical Forecast
Balance Sheet (SAR Millions)
Fiscal Year Ends December 2013 2014 2015 2016 2017
ASSETS
Cash and Cash Equivalents 2,140 1,640 1,673 2,119 2,507 Total Receivables, Net 656 599 655 769 803 Inventory 342 387 414 431 408 Total Current Assets 3,368 2,781 2,898 3,474 3,874
Property/Plant/Equipment, Net 4,320 4,793 4,779 4,517 4,269 Other long term assets 1,771 1,351 1,356 1,415 1,481 TOTAL ASSETS 9,460 8,925 9,033 9,406 9,624
LIABILITIES & EQUITY
Accounts Payables 399 247 400 517 517 Total Current Liabilities 688 510 663 781 780
Total Liabilities 1,191 1,063 1,216 1,333 1,333
Total Equity 8,269 7,862 7,817 8,072 8,291
TOTAL LIABILITIES AND EQUITY 9,460 8,925 9,033 9,406 9,624
Historical Forecast
Source: Company Reports and NBK Capital.
Saudi Arabia Petrochemicals Sector
nbkcapita l .com | 35
Cash Flow (SAR Millions)
Fiscal Year Ends December 2013 2014 2015 2016 2017
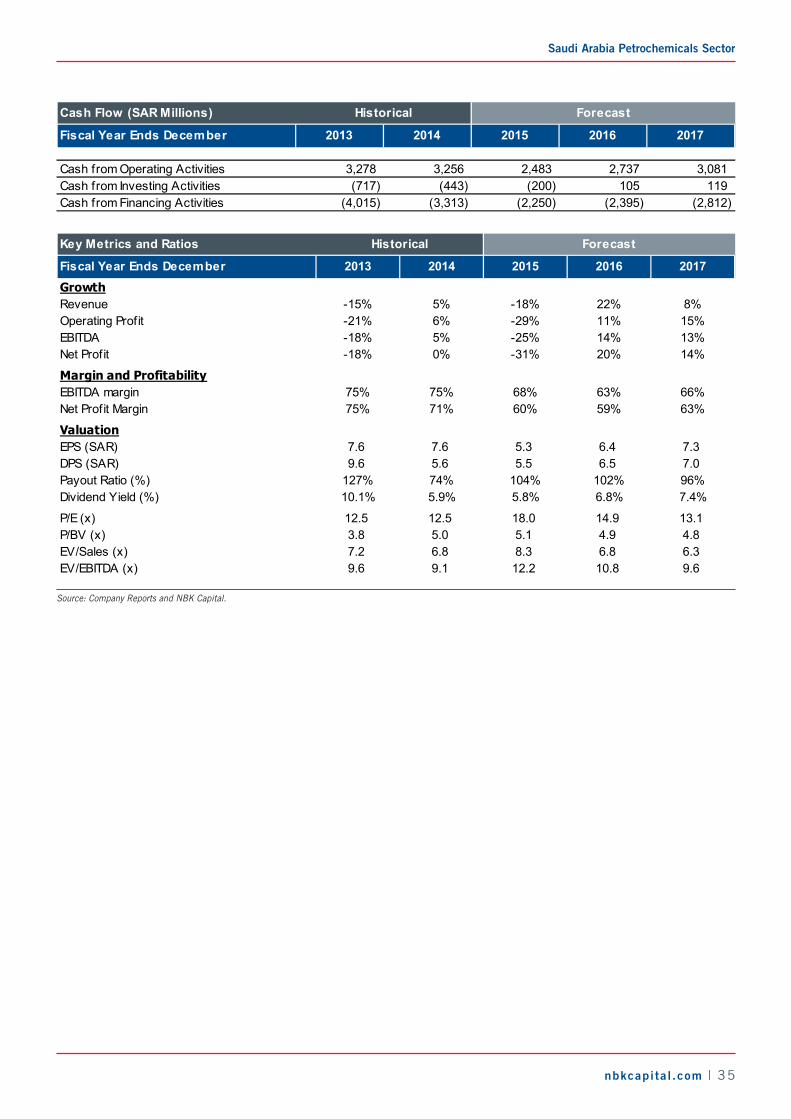
Cash from Operating Activities 3,278 3,256 2,483 2,737 3,081 Cash from Investing Activities (717) (443) (200) 105 119 Cash from Financing Activities (4,015) (3,313) (2,250) (2,395) (2,812)
Historical Forecast
Key Metrics and Ratios
Fiscal Year Ends December 2013 2014 2015 2016 2017GrowthRevenue -15% 5% -18% 22% 8%Operating Profit -21% 6% -29% 11% 15%EBITDA -18% 5% -25% 14% 13%Net Profit -18% 0% -31% 20% 14%
Margin and ProfitabilityEBITDA margin 75% 75% 68% 63% 66%Net Profit Margin 75% 71% 60% 59% 63%
ValuationEPS (SAR) 7.6 7.6 5.3 6.4 7.3DPS (SAR) 9.6 5.6 5.5 6.5 7.0Payout Ratio (%) 127% 74% 104% 102% 96%Dividend Yield (%) 10.1% 5.9% 5.8% 6.8% 7.4%
P/E (x) 12.5 12.5 18.0 14.9 13.1P/BV (x) 3.8 5.0 5.1 4.9 4.8EV/Sales (x) 7.2 6.8 8.3 6.8 6.3EV/EBITDA (x) 9.6 9.1 12.2 10.8 9.6
Historical Forecast
Source: Company Reports and NBK Capital.
October 13, 2015
36 | nbkcapita l .com
PETROCHEMStory strong, though leverage remains high
Key Data
Fair Value per Share (SAR) 21.60Closing Price (SAR) * 21.1052-w eek High / Low (SAR) 35/17.7YTD / 12-month Return -4%/-41%P/E (TTM) 12.0 Shares Outstanding (Millions) 480 Market Cap (USD Millions) 2,701 Free Float 18.0%Daily Trading Turnover ( 6-mo avg.,USD Millions) 2.9 Reuters / Bloomberg Code 2002.SE/ PETROCH AB
*As of October 07, 2015. Source: Bloomberg and NBK Capital
Key Metrics
2014A 2015F 2016F 2017FEPS (SAR) 1.4 1.6 1.8 1.9EPS Grow th nmf 15% 10% 5%P/E 14.8 12.9 11.7 11.2Dividend Yield 0.0% 0.0% 0.0% 4.7%EV/EBITDA 10.1 9.8 9.2 9.0Revenue (SAR Millions) 7,859 7,389 8,133 8,710Revenue Grow th 77% -6% 10% 7%EBITDA (SAR Millions) 2,331 2,403 2,540 2,614EBITDA Grow th 145% 3% 6% 3%EBITDA Margin 30% 33% 31% 30%
Source: Company Reports and NBK Capital
Quarterly Forecasts
SAR Millions 3Q2014A 2Q2015A 3Q2015F 4Q2015FRevenue 1,953 1,967 1,929 1,723EBITDA 645 772 660 534
Source: Company Reports and NBK Capital
Rebased Price Performance
50
60
70
80
90
100
110
Oct-14 Jan-15 Apr-15 Jul-15 Oct-15
Petrochem SASEPETR TASI
Source: Company Reports and NBK Capital
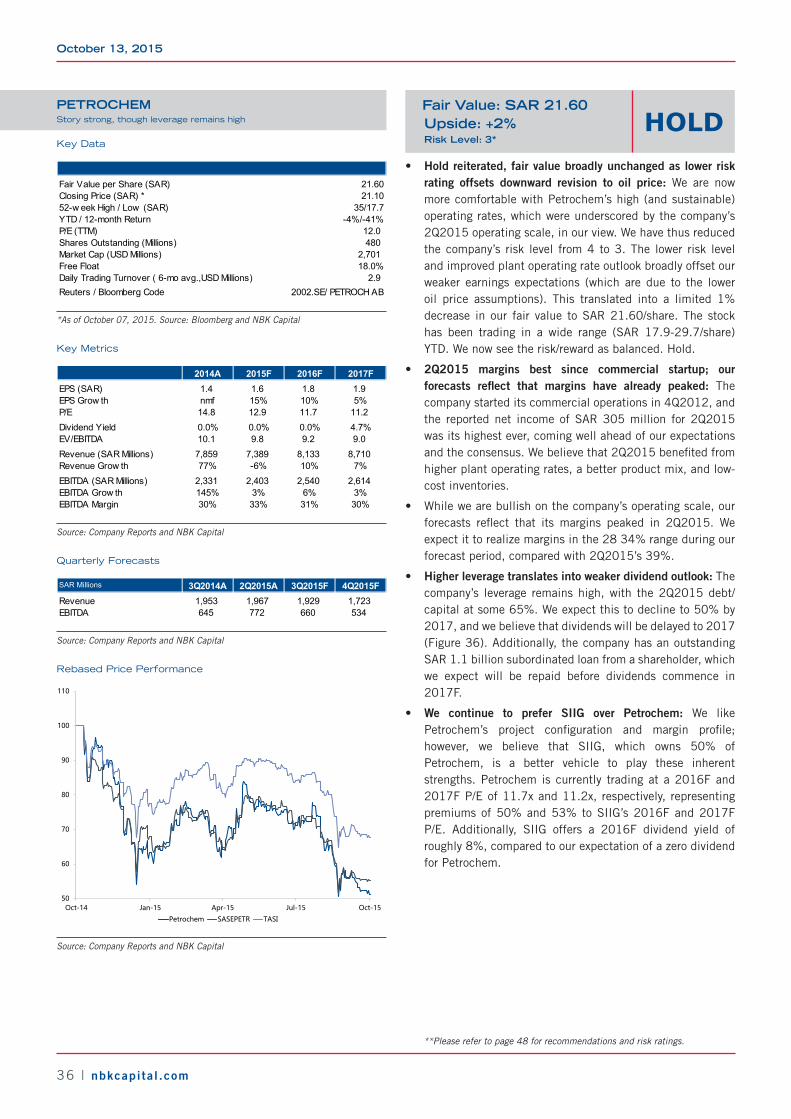
• Hold reiterated, fair value broadly unchanged as lower risk rating offsets downward revision to oil price: We are now more comfortable with Petrochem’s high (and sustainable) operating rates, which were underscored by the company’s 2Q2015 operating scale, in our view. We have thus reduced the company’s risk level from 4 to 3. The lower risk level and improved plant operating rate outlook broadly offset our weaker earnings expectations (which are due to the lower oil price assumptions). This translated into a limited 1% decrease in our fair value to SAR 21.60/share. The stock has been trading in a wide range (SAR 17.9-29.7/share) YTD. We now see the risk/reward as balanced. Hold.
• 2Q2015 margins best since commercial startup; our forecasts reflect that margins have already peaked: The company started its commercial operations in 4Q2012, and the reported net income of SAR 305 million for 2Q2015 was its highest ever, coming well ahead of our expectations and the consensus. We believe that 2Q2015 benefited from higher plant operating rates, a better product mix, and low-cost inventories.
• While we are bullish on the company’s operating scale, our forecasts reflect that its margins peaked in 2Q2015. We expect it to realize margins in the 28 34% range during our forecast period, compared with 2Q2015’s 39%.
• Higher leverage translates into weaker dividend outlook: The company’s leverage remains high, with the 2Q2015 debt/capital at some 65%. We expect this to decline to 50% by 2017, and we believe that dividends will be delayed to 2017 (Figure 36). Additionally, the company has an outstanding SAR 1.1 billion subordinated loan from a shareholder, which we expect will be repaid before dividends commence in 2017F.
• We continue to prefer SIIG over Petrochem: We like Petrochem’s project configuration and margin profile; however, we believe that SIIG, which owns 50% of Petrochem, is a better vehicle to play these inherent strengths. Petrochem is currently trading at a 2016F and 2017F P/E of 11.7x and 11.2x, respectively, representing premiums of 50% and 53% to SIIG’s 2016F and 2017F P/E. Additionally, SIIG offers a 2016F dividend yield of roughly 8%, compared to our expectation of a zero dividend for Petrochem.
**Please refer to page 48 for recommendations and risk ratings.
HOLDFair Value: SAR 21.60Upside: +2%Risk Level: 3*
Saudi Arabia Petrochemicals Sector
nbkcapita l .com | 37
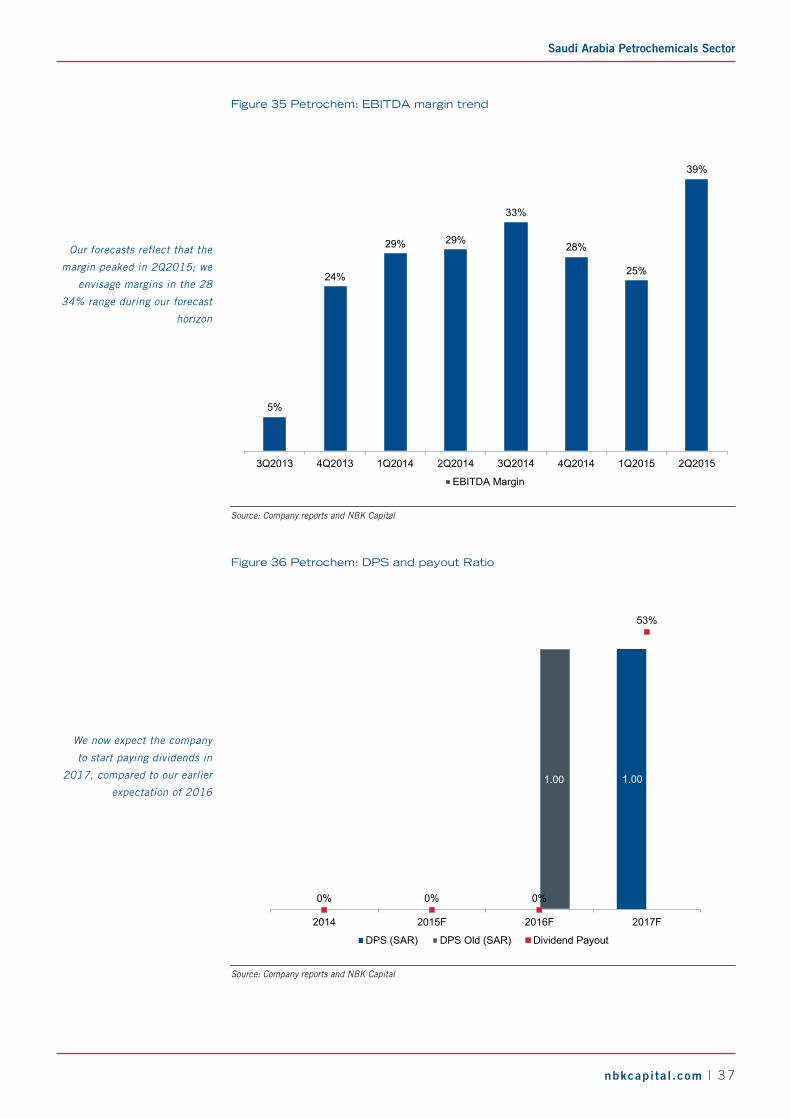
Figure 35 Petrochem: EBITDA margin trend
5%
24%
29% 29%
33%
28%
25%
39%
3Q2013 4Q2013 1Q2014 2Q2014 3Q2014 4Q2014 1Q2015 2Q2015
EBITDA Margin
Source: Company reports and NBK Capital
Figure 36 Petrochem: DPS and payout Ratio
1.00
-
1.00
0% 0% 0%
53%
0%
10%
20%
30%
40%
50%
60%
-
0.20
0.40
0.60
0.80
1.00
1.20
2014 2015F 2016F 2017F
DPS (SAR) DPS Old (SAR) Dividend Payout
Source: Company reports and NBK Capital
Our forecasts reflect that the
margin peaked in 2Q2015; we
envisage margins in the 28
34% range during our forecast
horizon
We now expect the company
to start paying dividends in
2017, compared to our earlier
expectation of 2016
October 13, 2015
38 | nbkcapita l .com
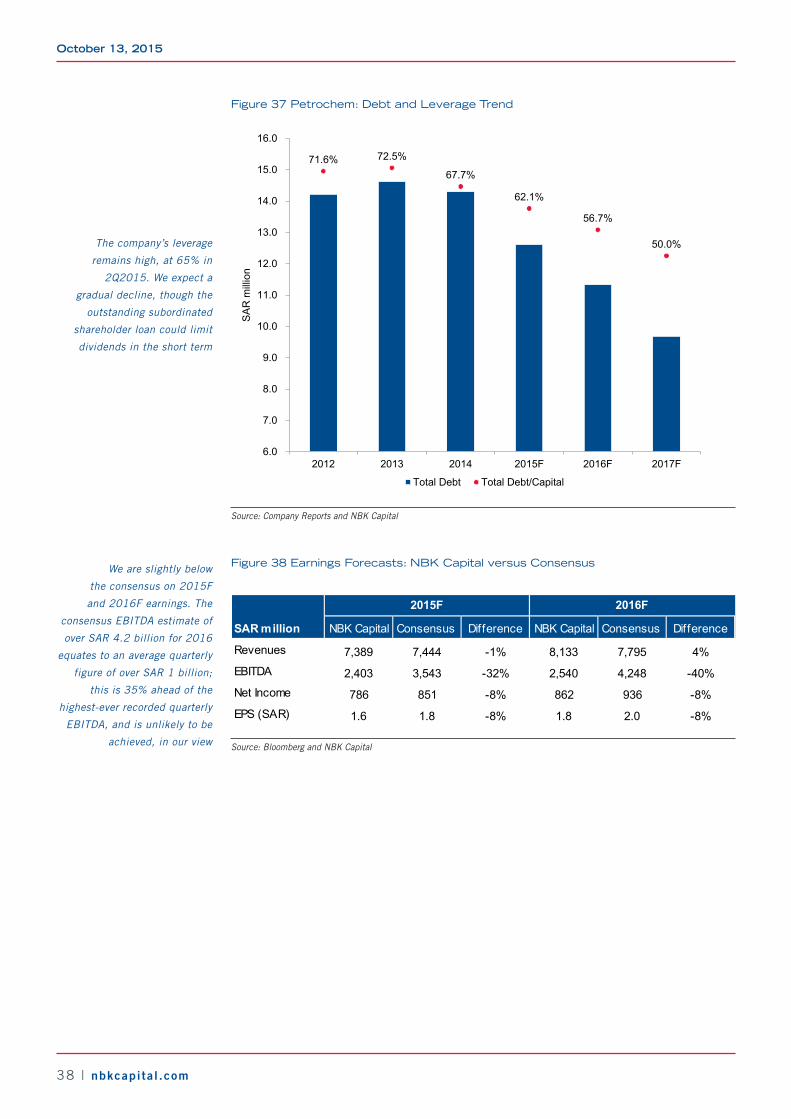
Figure 37 Petrochem: Debt and Leverage Trend
71.6% 72.5%
67.7%
62.1%
56.7%
50.0%
0%
10%
20%
30%
40%
50%
60%
70%
80%
6.0
7.0
8.0
9.0
10.0
11.0
12.0
13.0
14.0
15.0
16.0
2012 2013 2014 2015F 2016F 2017F
SA
R m
illio
n
Total Debt Total Debt/Capital
Source: Company Reports and NBK Capital
Figure 38 Earnings Forecasts: NBK Capital versus Consensus
NBK Capital Consensus Difference NBK Capital Consensus Difference
Revenues 7,389 7,444 -1% 8,133 7,795 4%EBITDA 2,403 3,543 -32% 2,540 4,248 -40%Net Income 786 851 -8% 862 936 -8%EPS (SAR) 1.6 1.8 -8% 1.8 2.0 -8%
SAR million
2015F 2016F
Source: Bloomberg and NBK Capital
The company’s leverage
remains high, at 65% in
2Q2015. We expect a
gradual decline, though the
outstanding subordinated
shareholder loan could limit
dividends in the short term
We are slightly below
the consensus on 2015F
and 2016F earnings. The
consensus EBITDA estimate of
over SAR 4.2 billion for 2016
equates to an average quarterly
figure of over SAR 1 billion;
this is 35% ahead of the
highest-ever recorded quarterly
EBITDA, and is unlikely to be
achieved, in our view
Saudi Arabia Petrochemicals Sector
nbkcapita l .com | 39
FINANCIAL STATEMENTS
Income Statement (SAR Millions)
Fiscal Year Ends December 2013 2014 2015 2016 2017
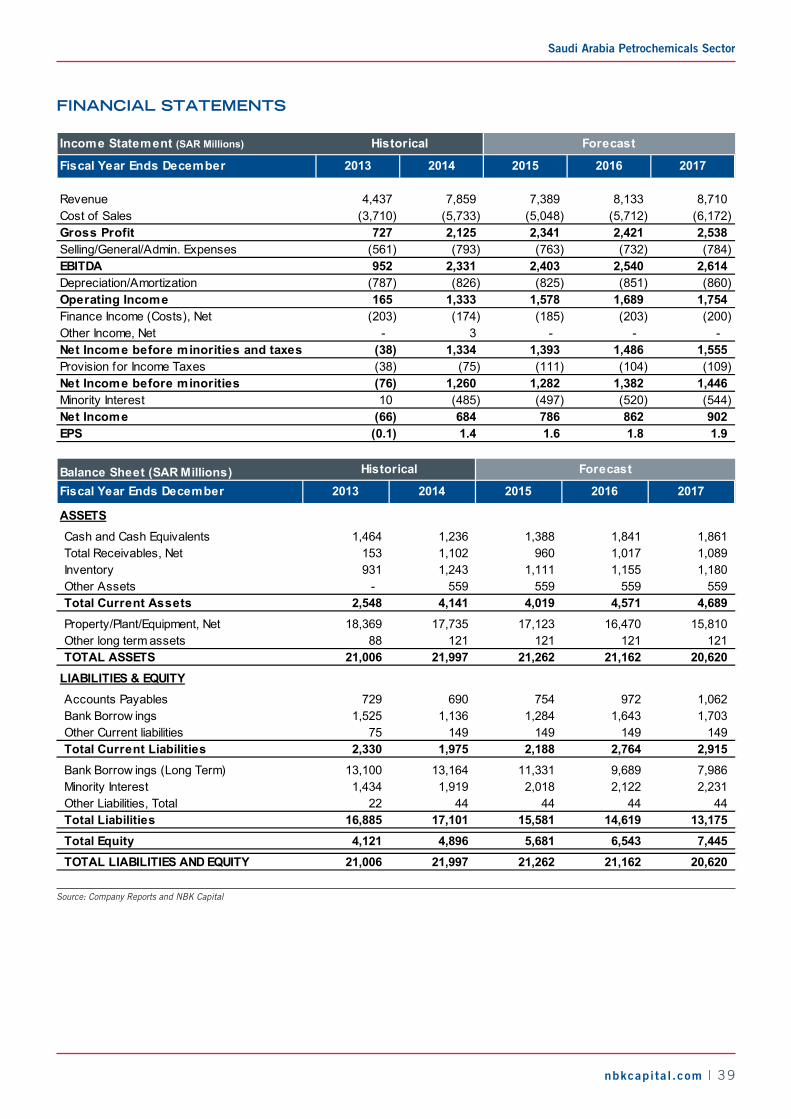
Revenue 4,437 7,859 7,389 8,133 8,710 Cost of Sales (3,710) (5,733) (5,048) (5,712) (6,172) Gross Profit 727 2,125 2,341 2,421 2,538 Selling/General/Admin. Expenses (561) (793) (763) (732) (784) EBITDA 952 2,331 2,403 2,540 2,614 Depreciation/Amortization (787) (826) (825) (851) (860) Operating Income 165 1,333 1,578 1,689 1,754 Finance Income (Costs), Net (203) (174) (185) (203) (200) Other Income, Net - 3 - - - Net Income before minorities and taxes (38) 1,334 1,393 1,486 1,555 Provision for Income Taxes (38) (75) (111) (104) (109) Net Income before minorities (76) 1,260 1,282 1,382 1,446 Minority Interest 10 (485) (497) (520) (544) Net Income (66) 684 786 862 902 EPS (0.1) 1.4 1.6 1.8 1.9
Historical Forecast
Balance Sheet (SAR Millions)Fiscal Year Ends December 2013 2014 2015 2016 2017
ASSETSCash and Cash Equivalents 1,464 1,236 1,388 1,841 1,861 Total Receivables, Net 153 1,102 960 1,017 1,089 Inventory 931 1,243 1,111 1,155 1,180 Other Assets - 559 559 559 559 Total Current Assets 2,548 4,141 4,019 4,571 4,689 Property/Plant/Equipment, Net 18,369 17,735 17,123 16,470 15,810 Other long term assets 88 121 121 121 121 TOTAL ASSETS 21,006 21,997 21,262 21,162 20,620
LIABILITIES & EQUITYAccounts Payables 729 690 754 972 1,062 Bank Borrow ings 1,525 1,136 1,284 1,643 1,703 Other Current liabilities 75 149 149 149 149 Total Current Liabilities 2,330 1,975 2,188 2,764 2,915 Bank Borrow ings (Long Term) 13,100 13,164 11,331 9,689 7,986 Minority Interest 1,434 1,919 2,018 2,122 2,231 Other Liabilities, Total 22 44 44 44 44 Total Liabilities 16,885 17,101 15,581 14,619 13,175 Total Equity 4,121 4,896 5,681 6,543 7,445 TOTAL LIABILITIES AND EQUITY 21,006 21,997 21,262 21,162 20,620
Historical Forecast
Source: Company Reports and NBK Capital
October 13, 2015
40 | nbkcapita l .com
Cash Flow (SAR Millions)Fiscal Year Ends December 2013 2014 2015 2016 2017
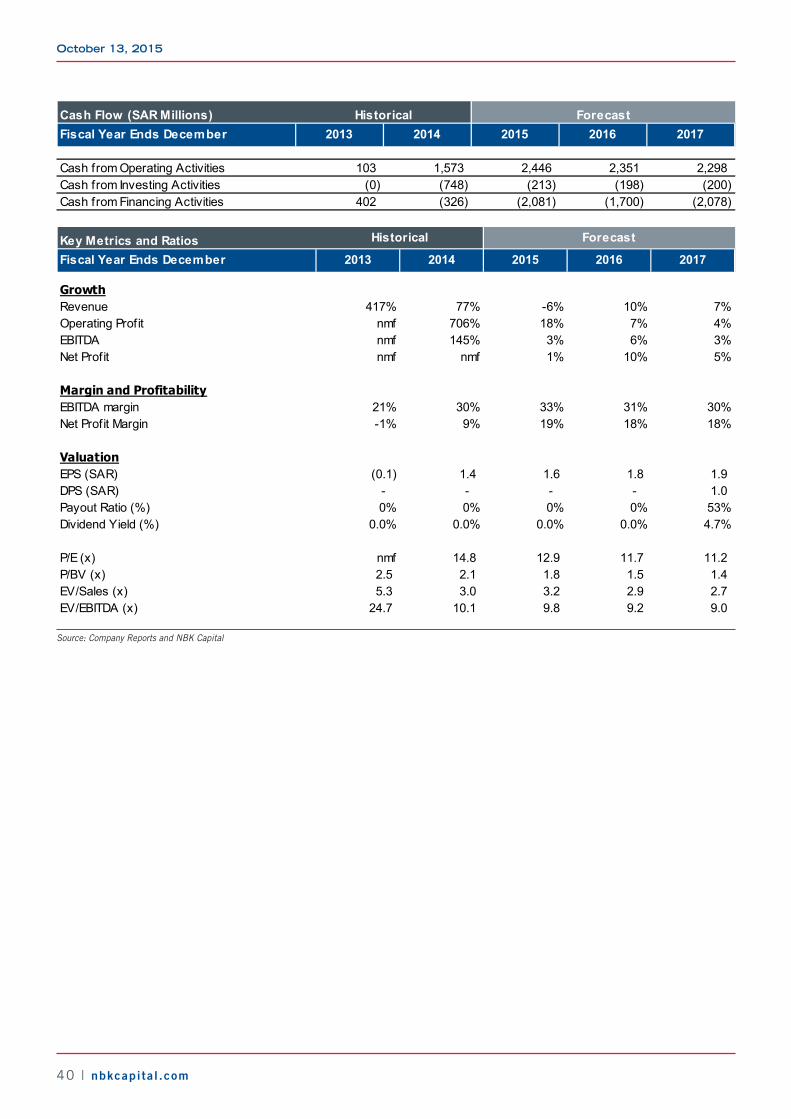
Cash from Operating Activities 103 1,573 2,446 2,351 2,298 Cash from Investing Activities (0) (748) (213) (198) (200) Cash from Financing Activities 402 (326) (2,081) (1,700) (2,078)
Historical Forecast
Key Metrics and RatiosFiscal Year Ends December 2013 2014 2015 2016 2017
GrowthRevenue 417% 77% -6% 10% 7%Operating Profit nmf 706% 18% 7% 4%EBITDA nmf 145% 3% 6% 3%Net Profit nmf nmf 1% 10% 5%
Margin and ProfitabilityEBITDA margin 21% 30% 33% 31% 30%Net Profit Margin -1% 9% 19% 18% 18%
ValuationEPS (SAR) (0.1) 1.4 1.6 1.8 1.9 DPS (SAR) - - - - 1.0 Payout Ratio (%) 0% 0% 0% 0% 53%Dividend Yield (%) 0.0% 0.0% 0.0% 0.0% 4.7%
P/E (x) nmf 14.8 12.9 11.7 11.2 P/BV (x) 2.5 2.1 1.8 1.5 1.4 EV/Sales (x) 5.3 3.0 3.2 2.9 2.7 EV/EBITDA (x) 24.7 10.1 9.8 9.2 9.0
Historical Forecast
Source: Company Reports and NBK Capital
Saudi Arabia Petrochemicals Sector
nbkcapita l .com | 41
SIIGStock beaten down, but outlook positive
Key Data
Fair Value per Share (SAR) 26.10Closing Price (SAR) * 18.5552-w eek High / Low (SAR) 38.2/17.2YTD / 12-month Return -27%/-53%P/E (TTM) 9.0 Shares Outstanding (Millions) 450 Market Cap (USD Millions) 2,226 Free Float 83.1%Daily Trading Turnover ( 6-mo avg.,USD Millions) 9.3 Reuters / Bloomberg Code 2250.SE/ SIIG AB
*As of October 07, 2015. Source: Bloomberg and NBK Capital
Key Metrics
2014A 2015F 2016F 2017FEPS (SAR) 2.1 1.7 2.4 2.5EPS Grow th 31% -19% 41% 7%P/E 9.0 11.0 7.8 7.3Dividend Yield 5.4% 5.4% 8.1% 10.8%EV/EBITDA 8.0 8.3 7.3 7.0Revenue (SAR Millions) 7,858 7,389 8,133 8,710Revenue Grow th 77% -6% 10% 7%EBITDA (SAR Millions) 2,318 2,392 2,529 2,602EBITDA Grow th 153% 3% 6% 3%EBITDA Margin 30% 32% 31% 30%
Source: Company Reports and NBK Capital
Quarterly Forecasts
SAR Millions 3Q2014A 2Q2015A 3Q2015F 4Q2015FRevenue 1,486 1,953 2,230 1,771EBITDA 349 642 621 434
Source: Company Reports and NBK Capital
Rebased Price Performance
40
50
60
70
80
90
100
110
Oct-14 Jan-15 Apr-15 Jul-15 Oct-15
SIIG SASEPETR TASI
Source: Company Reports and NBK Capital
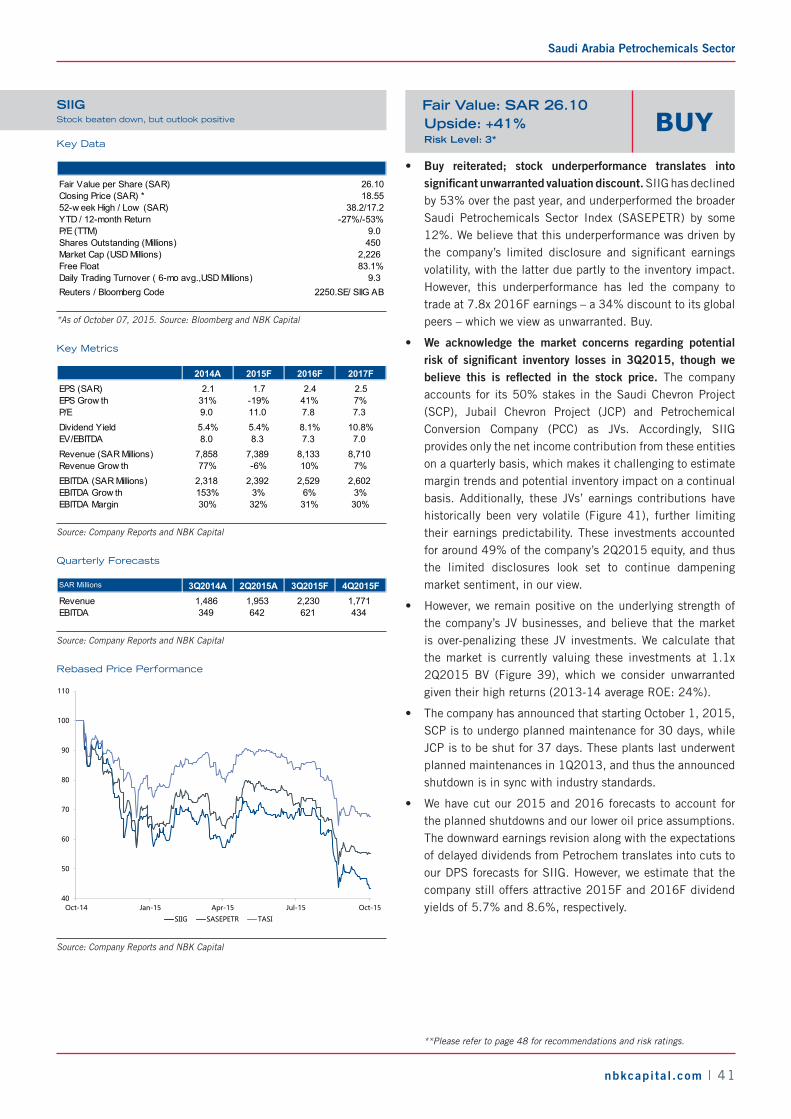
• Buy reiterated; stock underperformance translates into significant unwarranted valuation discount. SIIG has declined by 53% over the past year, and underperformed the broader Saudi Petrochemicals Sector Index (SASEPETR) by some 12%. We believe that this underperformance was driven by the company’s limited disclosure and significant earnings volatility, with the latter due partly to the inventory impact. However, this underperformance has led the company to trade at 7.8x 2016F earnings – a 34% discount to its global peers – which we view as unwarranted. Buy.
• We acknowledge the market concerns regarding potential risk of significant inventory losses in 3Q2015, though we believe this is reflected in the stock price. The company accounts for its 50% stakes in the Saudi Chevron Project (SCP), Jubail Chevron Project (JCP) and Petrochemical Conversion Company (PCC) as JVs. Accordingly, SIIG provides only the net income contribution from these entities on a quarterly basis, which makes it challenging to estimate margin trends and potential inventory impact on a continual basis. Additionally, these JVs’ earnings contributions have historically been very volatile (Figure 41), further limiting their earnings predictability. These investments accounted for around 49% of the company’s 2Q2015 equity, and thus the limited disclosures look set to continue dampening market sentiment, in our view.
• However, we remain positive on the underlying strength of the company’s JV businesses, and believe that the market is over-penalizing these JV investments. We calculate that the market is currently valuing these investments at 1.1x 2Q2015 BV (Figure 39), which we consider unwarranted given their high returns (2013-14 average ROE: 24%).
• The company has announced that starting October 1, 2015, SCP is to undergo planned maintenance for 30 days, while JCP is to be shut for 37 days. These plants last underwent planned maintenances in 1Q2013, and thus the announced shutdown is in sync with industry standards.
• We have cut our 2015 and 2016 forecasts to account for the planned shutdowns and our lower oil price assumptions. The downward earnings revision along with the expectations of delayed dividends from Petrochem translates into cuts to our DPS forecasts for SIIG. However, we estimate that the company still offers attractive 2015F and 2016F dividend yields of 5.7% and 8.6%, respectively.
**Please refer to page 48 for recommendations and risk ratings.
BUYFair Value: SAR 26.10Upside: +41%Risk Level: 3*
October 13, 2015
42 | nbkcapita l .com
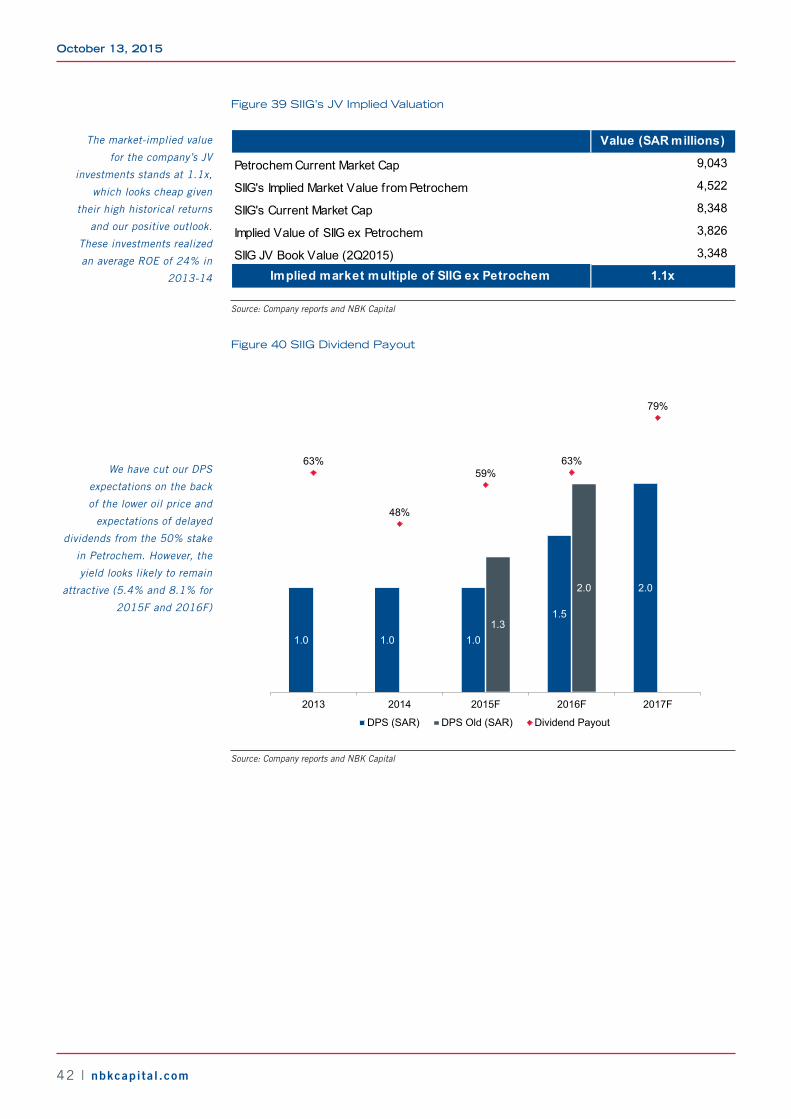
Figure 39 SIIG’s JV Implied Valuation
Petrochem Current Market Cap 9,043
SIIG's Implied Market Value from Petrochem 4,522
SIIG's Current Market Cap 8,348
Implied Value of SIIG ex Petrochem 3,826
SIIG JV Book Value (2Q2015) 3,348
Value (SAR millions)
Implied market multiple of SIIG ex Petrochem 1.1x
Source: Company reports and NBK Capital
Figure 40 SIIG Dividend Payout
1.0 1.0 1.0
1.5
2.0
1.3
2.0
63%
48%
59%63%
79%
0%
10%
20%
30%
40%
50%
60%
70%
80%
90%
-
0.50
1.00
1.50
2.00
2.50
3.00
2013 2014 2015F 2016F 2017F
DPS (SAR) DPS Old (SAR) Dividend Payout
Source: Company reports and NBK Capital
The market-implied value
for the company’s JV
investments stands at 1.1x,
which looks cheap given
their high historical returns
and our positive outlook.
These investments realized
an average ROE of 24% in
2013-14
We have cut our DPS
expectations on the back
of the lower oil price and
expectations of delayed
dividends from the 50% stake
in Petrochem. However, the
yield looks likely to remain
attractive (5.4% and 8.1% for
2015F and 2016F)
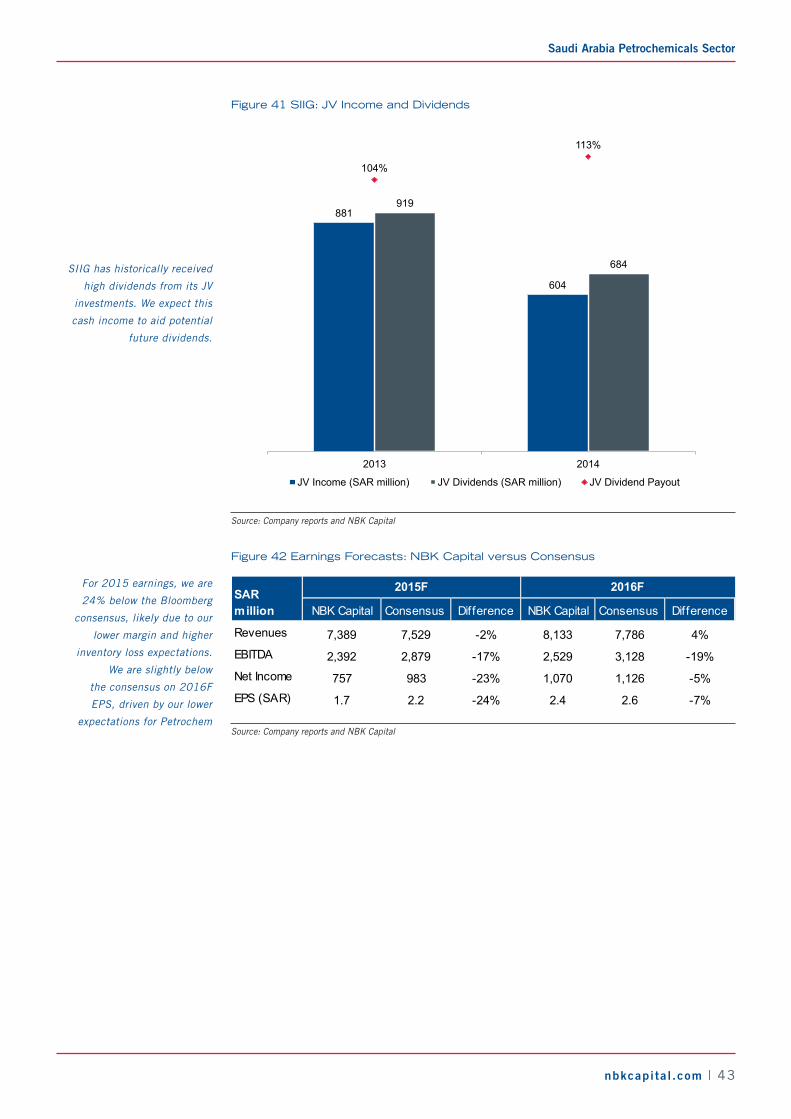
Saudi Arabia Petrochemicals Sector
nbkcapita l .com | 43
Figure 41 SIIG: JV Income and Dividends
881
604
919
684
104%
113%
0%
20%
40%
60%
80%
100%
120%
0
200
400
600
800
1000
1200
2013 2014
JV Income (SAR million) JV Dividends (SAR million) JV Dividend Payout
Source: Company reports and NBK Capital
Figure 42 Earnings Forecasts: NBK Capital versus Consensus
NBK Capital Consensus Difference NBK Capital Consensus Difference
Revenues 7,389 7,529 -2% 8,133 7,786 4%EBITDA 2,392 2,879 -17% 2,529 3,128 -19%Net Income 757 983 -23% 1,070 1,126 -5%EPS (SAR) 1.7 2.2 -24% 2.4 2.6 -7%
SAR million
2015F 2016F
Source: Company reports and NBK Capital
SIIG has historically received
high dividends from its JV
investments. We expect this
cash income to aid potential
future dividends.
For 2015 earnings, we are
24% below the Bloomberg
consensus, likely due to our
lower margin and higher
inventory loss expectations.
We are slightly below
the consensus on 2016F
EPS, driven by our lower
expectations for Petrochem
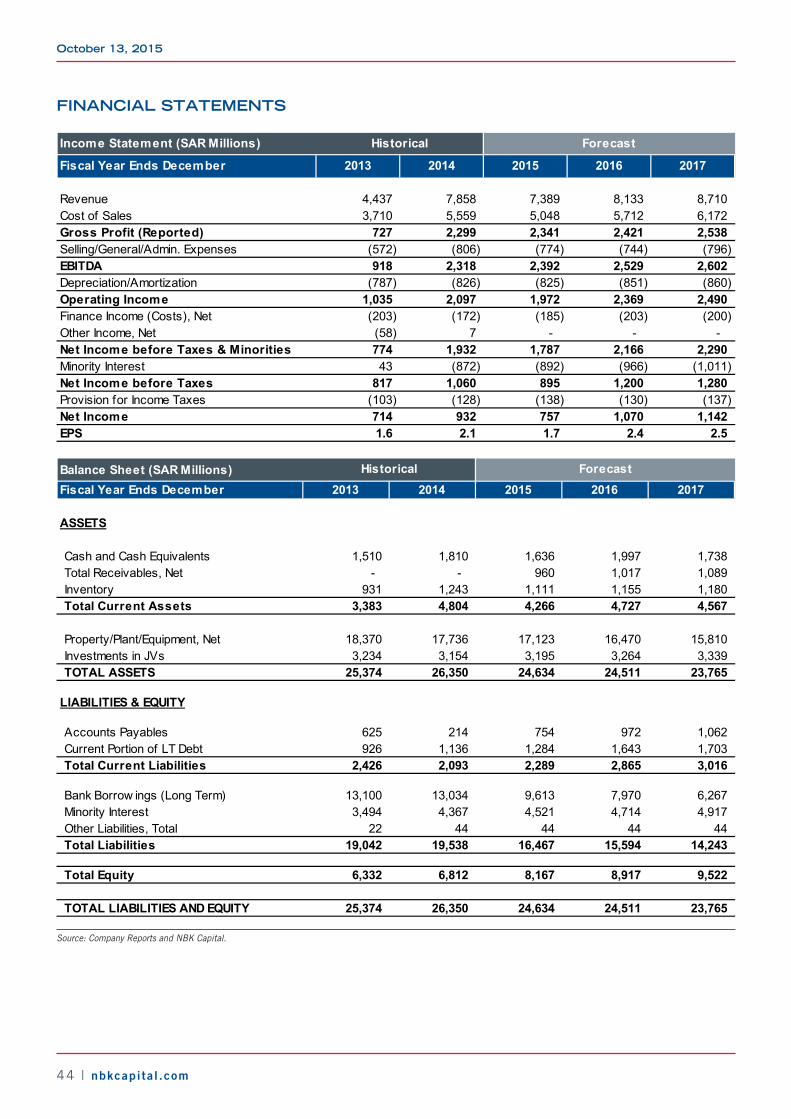
October 13, 2015
44 | nbkcapita l .com
FINANCIAL STATEMENTS
Income Statement (SAR Millions)
Fiscal Year Ends December 2013 2014 2015 2016 2017
Revenue 4,437 7,858 7,389 8,133 8,710 Cost of Sales 3,710 5,559 5,048 5,712 6,172 Gross Profit (Reported) 727 2,299 2,341 2,421 2,538 Selling/General/Admin. Expenses (572) (806) (774) (744) (796) EBITDA 918 2,318 2,392 2,529 2,602 Depreciation/Amortization (787) (826) (825) (851) (860) Operating Income 1,035 2,097 1,972 2,369 2,490 Finance Income (Costs), Net (203) (172) (185) (203) (200) Other Income, Net (58) 7 - - - Net Income before Taxes & Minorities 774 1,932 1,787 2,166 2,290 Minority Interest 43 (872) (892) (966) (1,011) Net Income before Taxes 817 1,060 895 1,200 1,280 Provision for Income Taxes (103) (128) (138) (130) (137) Net Income 714 932 757 1,070 1,142 EPS 1.6 2.1 1.7 2.4 2.5
Historical Forecast
Balance Sheet (SAR Millions)Fiscal Year Ends December 2013 2014 2015 2016 2017
ASSETS
Cash and Cash Equivalents 1,510 1,810 1,636 1,997 1,738 Total Receivables, Net - - 960 1,017 1,089 Inventory 931 1,243 1,111 1,155 1,180 Total Current Assets 3,383 4,804 4,266 4,727 4,567
Property/Plant/Equipment, Net 18,370 17,736 17,123 16,470 15,810 Investments in JVs 3,234 3,154 3,195 3,264 3,339 TOTAL ASSETS 25,374 26,350 24,634 24,511 23,765
LIABILITIES & EQUITY
Accounts Payables 625 214 754 972 1,062 Current Portion of LT Debt 926 1,136 1,284 1,643 1,703 Total Current Liabilities 2,426 2,093 2,289 2,865 3,016
Bank Borrow ings (Long Term) 13,100 13,034 9,613 7,970 6,267 Minority Interest 3,494 4,367 4,521 4,714 4,917 Other Liabilities, Total 22 44 44 44 44 Total Liabilities 19,042 19,538 16,467 15,594 14,243
Total Equity 6,332 6,812 8,167 8,917 9,522
TOTAL LIABILITIES AND EQUITY 25,374 26,350 24,634 24,511 23,765
Historical Forecast
Source: Company Reports and NBK Capital.

Saudi Arabia Petrochemicals Sector
nbkcapita l .com | 45
Cash Flow (SAR Millions)
Fiscal Year Ends December 2013 2014 2015 2016 2017
Cash from Operating Activities 22 1,536 2,546 2,443 2,395 Cash from Investing Activities 556 (64) 152 425 473 Cash from Financing Activities (244) (1,172) (2,872) (2,507) (3,126)
Historical Forecast
Key Metrics and Ratios
Fiscal Year Ends December 2013 2014 2015 2016 2017
GrowthRevenue -22% 77% -6% 10% 7%EBITDA 73% 153% 3% 6% 3%Operating Profit 529% 103% -6% 20% 5%Net Profit 31% 31% -19% 41% 7%
Margin and ProfitabilityEBITDA margin 21% 30% 32% 31% 30%Net Profit Margin (before minorities) 15% 12% 22% 25% 25%
ValuationEPS (SAR) 1.6 2.1 1.7 2.4 2.5 DPS (SAR) 1.0 1.0 1.00 1.5 2.0 Payout Ratio (%) 63% 48% 59% 63% 79%Dividend Yield (%) 5.4% 5.4% 5.4% 8.1% 10.8%
P/E (x) 11.7 9.0 11.0 7.8 7.3 P/BV (x) 1.3 1.2 1.0 0.9 0.9 EV/EBITDA (x) 12.4 8.0 8.3 7.3 7.0
Historical Forecast
Source: Company Reports and NBK Capital.
Saudi Arabia Petrochemicals Sector
nbkcapita l .com | 47
NOTES
Saudi Arabia Petrochemicals Sector
nbkcapita l .com | 49
RISK AND RECOMMENDATION GUIDE*
RECOMMENDATION UPSIDE (DOWNSIDE)
BUY MORE THAN 15%
HOLD BETWEEN -15% AND 15%
SELL LESS THAN -15%
RISK LEVEL
LOW RISK HIGH RISK
1 2 3 4 5*In exceptional situations, the analyst can exercise discretion and assign a recommendation for a stock which differs from the one indicated by the bands.
DISCLAIMER
The information, opinions, tools, and materials contained in this report (the “Content”) are not addressed to, or intended for publication, distribution to, or use by, any individual or legal entity who is a citizen or resident of or domiciled in any jurisdiction where such distribution, publication, availability, or use would constitute a breach of the laws or regulations of such jurisdiction or that would require Watani Investment Company KSCC (“NBK Capital”) or its parent company, its subsidiaries or its affiliates (together “NBK Group”) to obtain licenses, approvals, or permissions from the regulatory bodies or authorities of such jurisdiction. The Content, unless expressly mentioned otherwise, is under copyright to NBK Capital. Neither the Content nor any copy of it may be in any way reproduced, amended, transmitted to, copied, or distributed to any other party without the prior express written consent of NBK Capital. All trademarks, service marks, and logos used in this report are trademarks or service marks or registered trademarks or registered service marks of NBK Capital.
The Content is provided to you for information purposes only and is not to be used, construed, or considered as an offer or the solicitation of an offer to sell or to buy or to subscribe for any investment (including but not limited to securities or other financial instruments). No representation or warranty, express or implied, is given by NBK Capital or any of its respective directors, partners, officers, affiliates, employees, advisors, or representatives that the investment referred to in this report is suitable for you or for any particular investor. Receiving this report shall not mean or be interpreted that NBK Capital will treat you as its customer. If you are in doubt about such investment, we recommend that you consult an independent investment advisor since the investment contained or referred to in this report may not be suitable for you and NBK Capital makes no representation or warranty in this respect.
The Content shall not be considered investment, legal, accounting, or tax advice or a representation that any investment or strategy is suitable or appropriate for your individual circumstances or otherwise constitutes a personal recommendation to you. NBK Capital does not offer advice on the tax consequences of investments, and you are advised to contact an independent tax adviser.
The information and opinions contained in this report have been obtained or derived from sources that NBK Capital believes are reliable without being independently verified as to their accuracy or completeness. NBK Capital believes the information and opinions expressed in this report are accurate and complete; however, NBK Capital gives no representations or warranty, express or implied, as to the accuracy or completeness of the Content. Additional information may be available upon request. NBK Capital accepts no liability for any direct, indirect, or consequential loss arising from the use of the Content. This report is not to be relied upon as a substitution for the exercise of independent judgment. All technical recommendations should be combined with a review of the fundamentals of the company before making any investment decision. In addition, NBK Capital may have issued, and may in the future issue, other reports that are inconsistent with and reach different conclusions from the information presented in this report. Those reports reflect the different assumptions, views, and analytical methods of the analysts who prepared the reports, and NBK Capital is under no obligation to ensure that such other reports are brought to your attention. NBK Capital may be involved in many businesses that relate to companies mentioned in this report and may engage with them. Past performance should not be taken as an indication or guarantee of future performance, and no representation or warranty, express or implied, is made regarding future performance. Information, opinions, and estimates contained in this report reflect a judgment at the report’s original date of publication by NBK Capital and are subject to change without notice.
The value of any investment or income may fall as well as rise, and you may not get back the full amount invested. Where an investment is denominated in a currency other than the local currency of the recipient of the research report, changes in the exchange rates may have an adverse effect on the value, price, or income of that investment. In the case of investments for which there is no recognized market, it may be difficult for investors to sell their investments or to obtain reliable information about their value or the extent of the risk to which they are exposed.
NBK Capital has not reviewed the addresses of, the hyperlinks to, or the websites referred to in the report and takes no responsibility for the content contained therein. Such address or hyperlink (including addresses or hyperlinks to NBK Capital’s own website material) is provided solely for your convenience and information, and the content of the linked site does not in any way form part of this document. Accessing such websites or following such links through this report or NBK Capital’s website shall be at your own risk.
NBK Group may have a financial interest in one or any of the securities that are the subject of this report. Funds managed by NBK Group may own the securities that are the subject of this report. NBK Group may own units in one or more of the aforementioned funds.
NBK Group may be in the process of soliciting or executing fee-earning mandate or doing business for companies that are either the subject of this report or are mentioned in this report. As a result, you should be aware that NBK Group may have material conflict of interest that could affect the objectivity of this report.
© COPYRIGHT NOTICE
This is a publication of NBK Capital. No part of this publication may be reproduced or duplicated without the prior consent of NBK Capital.
October 13, 2015
50 | nbkcapita l .com
Kuwait
Head Office38th Floor, Arraya IIAl Shuhada Street, Block 6, SharqP.O.Box 4950, Safat 13050KuwaitT. +965 2224 6900F. +965 2224 6905
Brokerage37th Floor, Arraya IIAl Shuhada Street, Block 6, SharqP.O.Box 4950, Safat 13050, KuwaitT. +965 2224 6964F. +965 2224 6978E. [email protected]
United Arab Emirates
NBK Capital LimitedGate Village 06, Unit 203Dubai International Financial CentreP.O. Box 506506, Dubai, UAET. +971 4 365 2833F. +971 4 365 2805E. [email protected]
Egypt
NBK Capital SecuritiesEgypt SAE20 Aisha EL Taymouria St. Garden City Cairo, EgyptT. +202 2798 5900F. +202 2798 5905
NBK CAPITAL
NATIONAL BANK OF KUWAIT
Kuwait
National Bank of Kuwait SAKAbdullah Al-Ahmed StreetP.O. Box 95, Safat 13001Kuwait City, KuwaitT. +965 2242 2011F. +965 2243 1888Telex: 22043-22451 NATBANK
INTERNATIONAL NETWORK
Bahrain
National Bank of Kuwait SAKBahrain BranchGB Corp Tower, Block 346Road 4626, Building 1411P.O.Box 5290, ManamaKingdom of BahrainTel: +973 17 155 555Fax: +973 17 104 860
Saudi Arabia
National Bank of Kuwait SAKJeddah BranchAl-Khalidiah Distric Al-Mukmal Tower, P.O.Box 15385 Jeddah 21444, Saudi Arabia Tel: +966 2 603 6300 Fax: +966 2 603 6318
United Arab Emirates
National Bank of Kuwait SAKDubai BranchSheikh Rashed Road, Port Saeed AreaACICO Business ParkP.O.Box 88867, Dubai, U.A.ETel: +971 4 2929 222Fax: +971 4 2943 337
Jordan
National Bank of Kuwait SAKHead OfficeAl Hajj Mohd Abdul Rahim StreetHijazi Plaza, Building # 70P.O.Box 941297Amman – 11194, Jordan Tel: +962 6 580 0400Fax: +962 6 580 0441
Lebanon
National Bank of Kuwait(Lebanon) SALSanayeh Head OfficeBAC Building, Justinien StreetP.O.Box 11-5727, Riad El-Solh1107 2200 Beirut, LebanonTel: +961 1 759 700Fax: +961 1 747 866
Iraq
Credit Bank of IraqStreet 9, Building 187Sadoun Street, District 102P.O.Box 3420Baghdad, IraqTel: +964 1 7182198/7191944 +964 1 7188406/7171673Fax: +964 1 7170156
Egypt
National Bank of Kuwait - EgyptPlot No. 155, City Center, First Sector, 5th Settlement New Cairo, EgyptP.O Box 229 - Postal Code 11835Tel: +202 2614 9300Fax: +202 2613 3978
United Kingdom
National Bank of Kuwait(International) PLCHead Office13 George streetLondon, W1U 3QJ, UKTel: +44 20 7224 2277Fax: +44 20 7224 2101
France
National Bank of Kuwait(International) PLCParis Branch90 Avenue des Champs-Elysees75008 Paris, FranceTel: +33 1 5659 8600Fax: +33 1 5659 8623
Turkey
Turkish BankHead OfficeValikonagi Avenue No. 1P.O.Box: 34371 NisantasiIstanbulTel: +90 212 373 6373Fax: +90 212 225 0353
Singapore
National Bank of Kuwait SAKSingapore Branch9 Raffles Place #24-02Republic PlazaSingapore 048619Tel: +65 6222 5348Fax: +65 6224 5438
China
National Bank of Kuwait SAKShanghai Representative OfficeSuite 1003, 10th floorAzia Center1233 Lujiazui Ring RoadShanghai 200120ChinaTel: +86 21 6888 1092Fax: +86 21 5047 1011
United States of America
National Bank of Kuwait SAKNew York Branch299 Park Avenue, 17th FloorNew York, NY 10171USATel: +1 212 303 9800Fax: +1 212 319 8269

KUWAIT DUBAI CAIRO