i FULL RISK ANALYSIS 9 September 2015 Sawit Sumbermas Sarana HIGH RISK Palm oil company Stock code: SSMS Summary In December 2013, Chain Reaction Research (CRR) published a report on Sawit Sumbermas Sarana (SSMS), just before the palm oil company was listed on the Indonesia Stock Exchange (IDX). CRR warned that investors buying shares of SSMS would be exposed to serious governance and sustainability risks. SSMS is a medium large Indonesian palm oil company. It presently has 60,000 hectares of oil palm trees planted in Central Kalimantan, and it wants to increase this figure with 5,0006,000 hectares per year. SSMS is controlled by Abdul Rasyid, a former Indonesian parliamentarian. In the past his companies have been accused of massive illegal logging. SSMS maintains close relations with its parent company PT Citra Borneo Indah, which also has its own oil palm businesses. New sustainability standards filling the market place Since late 2013, new sustainability standards affecting SSMS’ business have filled the market place. Global traders controlling at least 60% of the commercial palm oil market have adopted No Deforestation, No Peat, No Exploitation (NDPE) policies. These companies require suppliers to stop clearing all High Conservation Value (HCV) areas, High Carbon Stock (HCS) areas and carbonrich peatlands, regardless of depth. In addition, they require all suppliers to uphold human and labor rights, and to recognize the right of local communities to give or withhold Free, Prior and Informed Consent (FPIC) to any new developments on their lands. Three companies with NDPE policies (Golden AgriResources, the Apical group and Wilmar International) account for 80% of SSMS’ total revenue. In Wilmar’s and Apical’s case SSMS must be compliant with the NDPE policy by the end of 2015 and 2016 respectively. In June 2015 SSMS experienced that its three main customers all suspended their trade with SSMS. The NGOs Environmental Investigation Agency (EIA) and JPIK Kalteng filed a RSPO complaint, after SSMS announced to clear more than 10,000 ha of good forest and potential/actual orangutan habitat. The complainants argued that documents with regard to HCV and FPIC were seriously flawed. At the same
Transcript
-‐i-‐
FULL RISK ANALYSIS 9 September 2015 Sawit Sumbermas Sarana HIGH RISK Palm oil company Stock code: SSMS
Summary
In December 2013, Chain Reaction Research (CRR) published a report on Sawit Sumbermas Sarana (SSMS), just before the palm oil company was listed on the Indonesia Stock Exchange (IDX). CRR warned that investors buying shares of SSMS would be exposed to serious governance and sustainability risks. SSMS is a medium large Indonesian palm oil company. It presently has 60,000 hectares of oil palm trees planted in Central Kalimantan, and it wants to increase this figure with 5,000-‐6,000 hectares per year. SSMS is controlled by Abdul Rasyid, a former Indonesian parliamentarian. In the past his companies have been accused of massive illegal logging. SSMS maintains close relations with its parent company PT Citra Borneo Indah, which also has its own oil palm businesses. New sustainability standards filling the market place Since late 2013, new sustainability standards affecting SSMS’ business have filled the market place. Global traders controlling at least 60% of the commercial palm oil market have adopted No Deforestation, No Peat, No Exploitation (NDPE) policies. These companies require suppliers to stop clearing all High Conservation Value (HCV) areas, High Carbon Stock (HCS) areas and carbon-‐rich peatlands, regardless of depth. In addition, they require all suppliers to uphold human and labor rights, and to recognize the right of local communities to give or withhold Free, Prior and Informed Consent (FPIC) to any new developments on their lands. Three companies with NDPE policies (Golden Agri-‐Resources, the Apical group and Wilmar International) account for 80% of SSMS’ total revenue. In Wilmar’s and Apical’s case SSMS must be compliant with the NDPE policy by the end of 2015 and 2016 respectively. In June 2015 SSMS experienced that its three main customers all suspended their trade with SSMS. The NGOs Environmental Investigation Agency (EIA) and JPIK Kalteng filed a RSPO complaint, after SSMS announced to clear more than 10,000 ha of good forest and potential/actual orangutan habitat. The complainants argued that documents with regard to HCV and FPIC were seriously flawed. At the same
-‐ii-‐
time the Indonesian NGO Greenomics reported about recent clearings of peatland forests by a subsidiary of SSMS. Following the NGO reports Golden Agri-‐Resources and the Apical Group suspended trading with SSMS for “new purchases” and “further purchases” respectively. After announcing its NDPE policy in December 2013, Wilmar had already largely stopped buying from SSMS. Sustainability assessment For this report an assessment was conducted with regard to SSMS’ sustainability policy and its practices on the ground. The research focused on deforestation, peatlands, biodiversity and FPIC. SSMS lists several commitments focused on sustainability, including no burning, no planting on High Conservation Value (HCV) areas, zero waste, and a commitment to conduct HCV assessments. However, SSMS has no publicly announced policies on peatlands, High Carbon Stock (HCS) areas and FPIC. Therefore, the sustainability policy of SSMS is not in line with NDPE requirements. SSMS is a member to the RSPO, but so far only one of its five running palm oil mills has received RSPO certification. Plantation companies of SSMS have cleared 14,000 ha of forests in the period 2003-‐2015. The vast majority of the deforestation took place through occupying forestland, without central government authorization for conversion to oil palm plantations. Therefore the deforestation was illegal. Satellite imagery shows that the company has been clearing peatland forests and forests in May/June 2015, through its plantation companies PT Kalimantan Sawit Abadi and PT Sawit Multi Utama respectively. The development plan of SSMS’ plantation company PT Sawit Mandiri Lestari contains than 10,000 ha of good lowland tropical rainforest and potential/actual orangutan habitat. SSMS’ other undeveloped landbank refers to the plantation company PT Ahmad Saleh Perkasa (PT ASP). For PT ASP the company currently does not have a location permit, essentially meaning that it has no right at all to begin development. PT ASP’s area comprises 6,300 ha of peatland and 5,500 ha of actual or potential orangutan habitat. Together the peatland and orangutan areas almost entirely cover PT ASP’s surface. Potential loss of main customers SSMS is at high risk of being permanently suspended by its main customers. Its sustainability policies and practices are not in line with NDPE requirements. SSMS’s main customers Golden Agri-‐Resources (GAR), the Apical group, and Wilmar have each adopted sustainability policies that should require them to cut ties with SSMS if serious reform is not made soon. SSMS has the ambition to plant 5,000 – 6,000 ha of oil palm each year, yet the company’s present undeveloped landbank doesn’t allow the company to do so without breaching the NDPE ambitions of its main customers. If SSMS were to lose one or more of these major commodity traders as its major customers, it could have a significant negative impact on its revenue, net income, and share price. Compensation costs Under the Indonesian Government Regulation No. 60/2012 from 6 July 2012, SSMS should have to acquire and reforest 11,700 ha of land in the “Other Land Use” (APL) category and return this land to the
-‐iii-‐
state. The costs of acquiring and reforesting compensation land to be handed over to the government are estimated to be USD 3,000 per hectare. For this amount of land, the compensation costs would then be USD 35.1 million (around IDR 460 billion). SSMS has no clear financial plan to address this significant financial liability, suggesting the potential for further law-‐avoidance. Financial risk analysis In our financial risk analysis, we compared three potential scenarios. The first, the baseline scenario, assumes that sustainability issues have no impact on SSMS’s business. The second scenario assesses the impacts of SSMS losing its major customers, which results in more than double digit declines in Asset Turnover, ROA and ROE. It is likely that in this case the company will not be able to optimize its leverage and gearing would remain relatively high. A third scenario assumes that the company will be forced to pay the government to have its occupation of forestland estates legalized in order to stay in operation and avoid further costs. In this case, the company spending on forestland legalization is a positive move in the long-‐term, although the immediate effect on the company performance might appear negative. Indeed the profitability is expected to change downwards, due to the increased expenses. This in turn would result in a moderation of ROA and ROE. A full recovery is though expected, since the legalization of forestland estates can be viewed as an investment in the company itself. There is also a possibility that these different scenarios could occur simultaneously, creating cumulative and more serious impacts on the company’s bottom line. In addition, a significant risk embedded in all scenarios is that they could result in further serious damage to SSMS’s reputation among customers, investors, and the public. This could trigger further scenarios with negative consequences on the financial health of the company, such as major customers cancelling purchasing contracts, or banks and investors denying financing and investments. CRR’s financial risk analysis therefore underlines that addressing current and past sustainability issues – deforestation and legality issues in particular – will be directly relevant for SSMS’s future financial health.
Contents
Company profile of Sawit Sumbermas Sarana ................................................. 1 1
3.1 Financing structure .................................................................................................. 13 3.1.1 Shareholders .................................................................................................................. 15 3.1.2 Banks .............................................................................................................................. 16 3.2 Objective and approach of the Financial Risk Assessment ........................................ 16 3.3 Baseline scenario ..................................................................................................... 17 3.4 Scenario 1: SSMS loses major customers .................................................................. 18 3.5 Scenario 2: SSMS legalizes its occupied forestland .................................................... 21 3.6 Conclusion of the Financial Risk Assessment ............................................................ 23
-‐1-‐
Company profile of Sawit Sumbermas Sarana 1
Brief overview 1.1
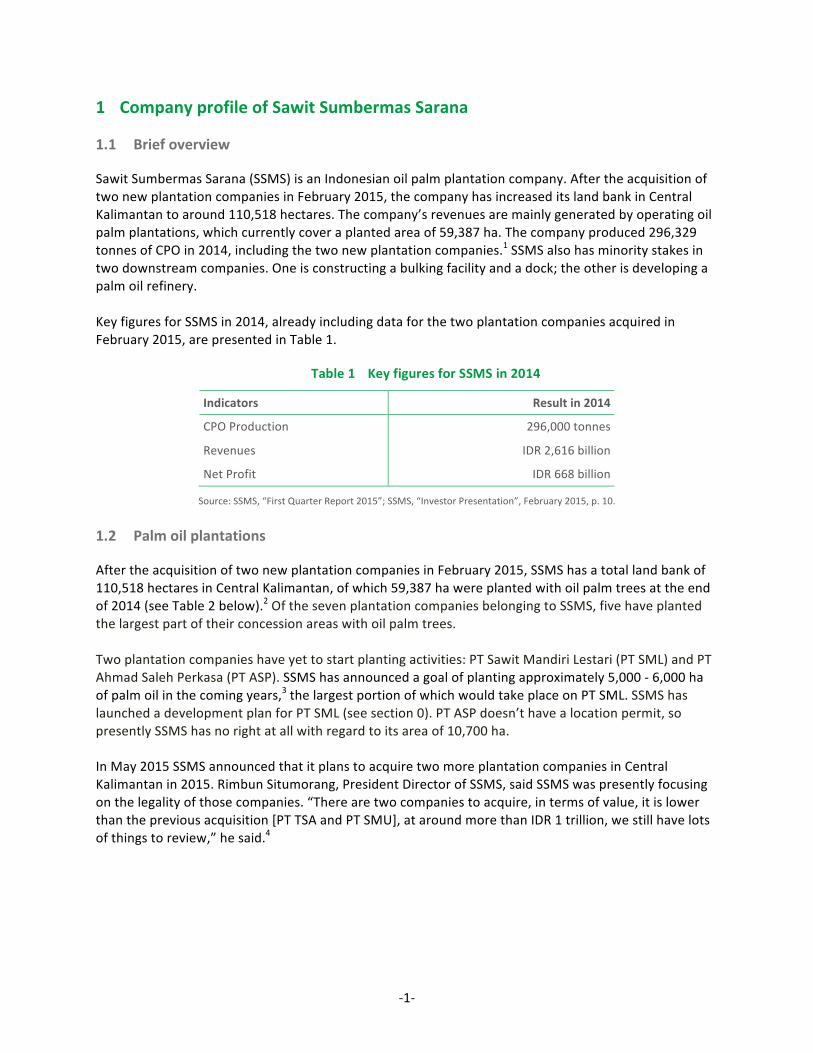
Sawit Sumbermas Sarana (SSMS) is an Indonesian oil palm plantation company. After the acquisition of two new plantation companies in February 2015, the company has increased its land bank in Central Kalimantan to around 110,518 hectares. The company’s revenues are mainly generated by operating oil palm plantations, which currently cover a planted area of 59,387 ha. The company produced 296,329 tonnes of CPO in 2014, including the two new plantation companies.1 SSMS also has minority stakes in two downstream companies. One is constructing a bulking facility and a dock; the other is developing a palm oil refinery. Key figures for SSMS in 2014, already including data for the two plantation companies acquired in February 2015, are presented in Table 1.
Table 1 Key figures for SSMS in 2014
Indicators Result in 2014
CPO Production 296,000 tonnes
Revenues IDR 2,616 billion
Net Profit IDR 668 billion
Source: SSMS, “First Quarter Report 2015”; SSMS, “Investor Presentation”, February 2015, p. 10.
Palm oil plantations 1.2
After the acquisition of two new plantation companies in February 2015, SSMS has a total land bank of 110,518 hectares in Central Kalimantan, of which 59,387 ha were planted with oil palm trees at the end of 2014 (see Table 2 below).2 Of the seven plantation companies belonging to SSMS, five have planted the largest part of their concession areas with oil palm trees. Two plantation companies have yet to start planting activities: PT Sawit Mandiri Lestari (PT SML) and PT Ahmad Saleh Perkasa (PT ASP). SSMS has announced a goal of planting approximately 5,000 -‐ 6,000 ha of palm oil in the coming years,3 the largest portion of which would take place on PT SML. SSMS has launched a development plan for PT SML (see section 0). PT ASP doesn’t have a location permit, so presently SSMS has no right at all with regard to its area of 10,700 ha. In May 2015 SSMS announced that it plans to acquire two more plantation companies in Central Kalimantan in 2015. Rimbun Situmorang, President Director of SSMS, said SSMS was presently focusing on the legality of those companies. “There are two companies to acquire, in terms of value, it is lower than the previous acquisition [PT TSA and PT SMU], at around more than IDR 1 trillion, we still have lots of things to review,” he said.4
-‐2-‐
Table 2 Oil palm plantations of SSMS as of end 2014 (in ha)
PT Sawit Multi Utama (PT SMU) 17,485 14,861 389 503 1,732
Total 110,518 59,387 2,019 2,136 46,976
Sources: SSMS, “Kegiatan Usaha Utama”, 19 November 2014, http://bit.ly/1Dotc8a; SSMS, “Management presentation”, July 2015, http://bit.ly/1DT8gsW;
SSMS, “Investor Presentation”, February 2015, p. 9-‐10
CPO production 1.3
Table 3 gives an overview of the operational indicators of SSMS in the period 2011-‐2014. The overview shows that the area of mature plantations of the company increased from 28,420 ha in 2011 to 45,830 ha in 2014. This increase is largely caused by the acquisition of two plantation companies with a mature area of 12,923 ha in February 2015 (already included in 2014 figures). Including the harvest of the two new subsidiaries, the volume of FFB harvested therefore increased to 1.02 million tonnes in 2014. With this acquisition, SSMS increased its milling capacity to 1.89 million tonnes of FFB per year, with another 360,000 tonnes/year under construction. The actual volume of FFB processed (including acquired companies) increased to 1.26 million tonnes in 2014. This includes 241,000 tonnes of FFB procured from external suppliers -‐ 19% of the total FFB volume processed. With an extraction rate of 23.5%, the company produced 296,329 tonnes of CPO in 2014.
Table 3 Operational indicators of SSMS, 2011-‐2014
CPO production (tons) 176,945 227,900 230,622 296,329
Sources: SSMS, “Annual reports 2013 and 2014”; SSMS, “Preliminary Offering Memorandum”, 5 November 2013; SSMS, “Investor Presentation”, February 2015, p. 9-‐10; CRR estimates.
-‐3-‐
Downstream investments 1.4
SSMS is also investing in downstream activities. The company effectively owns 18.4% of both PT Surya Borneo Industry (PT SBI) and PT Citra Borneo Utama (PT CBU). PT SBI is building a bulking facility and a dock. These were supposed to be completed in 2014, but at present construction is still going on.5 PT CBU is developing a palm oil refinery to start producing CPO derivatives in the beginning of 2016,6 or possibly in late 2016 or beginning of 2017.7 The majority of the shares in both companies are owned by Abdul Rasyid and his family, the company’s majority shareholders.
Customers 1.5
SSMS’ customer base changed in several significant ways from 2013 to 2014. Wilmar largely stopped buying from the company in 2014, while GAR and the Apical group have increased their purchases. As Table 4 shows, GAR currently accounts for almost half of SSMS’ revenue, while the Apical Group comprises a quarter of its revenues.8
Table 4 Main customers SSMS, 2013-‐2014
Customer 2013 2014
IDR billion % IDR billion %
Golden Agri-‐Resources 518 26 1,026 47
Apical Group 39 2 535 25
Wilmar 995 51 177 8
Related party: PT Tanjung Sawit Abadi 285 15 51 2
Others 125 6 391 18
Total sales 1,962 100 2,181 100
Source: SSMS, “Quarterly and annual reports 2013 and 2014”, http://bit.ly/1zCAW6t Figure 1 shows the quarterly purchases of Golden Agri-‐Resources, Wilmar International and the Apical Group as a percentage of SSMS’ revenues from 2013 until Q2 of 2015. The chart shows that Wilmar started buying from SSMS again in the fourth quarter of 2014, but its purchases have fallen off again in in 2015 again. The company has stated that its temporarily purchase increase in late 2014 was due to sustainability promises by SSMS. In June 2015 Golden Agri-‐Resources (GAR) and the Apical Group suspended trading with SSMS for “new purchases” and “temporarily suspended further purchases” respectively.9 This was directly after the launch of the RSPO complaint by EIA/JPIK with regard to the deforestation plans of PT Sawit Mandiri Lestari10, and the launch of a report by the Indonesian NGO Greenomics at the same time on recent clearings of forests and peatland by SSMS.11 For GAR the suspension is not visible in the 2Q reports by SSMS. This has probably to do with a long-‐term contract for purchases by GAR from SSMS.
-‐4-‐
Figure 1 Revenues of SSMS generated by GAR, Wilmar and Apical, 2013 – 2015
Source: SSMS, “Quarterly and annual reports”, http://bit.ly/1zCAW6t
Ownership structure 1.6
SSMS was listed on the Indonesian Stock Exchange (IDX) in December 2013. The founder of SSMS, Abdul Rasyid, controls 75.1% of the company’s shares through the shareholdings of family members and four investment companies. The public has a share of 24.9% in the company.12 SSMS holds a vast majority share (over 90%) in all of its plantation companies.13 0 shows the ownership structure of SSMS.14
Sources: SSMS, “Financial statements as of 30 June 2015”, 28 July 2015, http://bit.ly/1Nxd5b9 SSMS, Shareholders holding more than 5% of the shares per 31/08/2015, http://bit.ly/1K24TAx
Mr. Abdul Rasyid, the founder and principal owner of SSMS, is a former Indonesian parliamentarian. In the past, he has been accused by NGOs and the Ministry of Forestry of leading illegal logging in Indonesia, particularly in the Tanjung Puting National Park in Central Kalimantan, though he has denied any wrongdoing and has never been formally charged.15 In December 2014, Forbes ranked Rasyid 41st in a list of Indonesia’s 50 richest persons, with an estimated wealth of USD 805 million. In its story, Forbes included details about the alleged illegal deforestation in Tanjung Puting, the captivity and abuse of British members of the Environmental Investigation Agency and a local NGO for three days in 2000, and recent allegations of SSMS encroaching on orangutan habitat.16
-‐6-‐
Sustainability Risk Assessment 2
Sustainability policy 2.1
SSMS and NDPE policies Since late 2013, global traders controlling at least 60% of the commercial palm oil market have adopted No Deforestation, No Peat, No Exploitation (NDPE) policies. These companies include Wilmar International, Golden Agri-‐Resources, Bunge, Musim Mas, IOI Group, the Apical group, Cargill, and others.17 The policies apply to the entire palm oil supply chain, including third-‐party suppliers. NDPE policies are presently the most demanding sustainability standards in the market place. Companies committed to NDPE policies require suppliers to stop clearing all High Conservation Value (HCV) areas, High Carbon Stock (HCS) areas and carbon-‐rich peatlands, regardless of depth. In addition, they require all suppliers to uphold human and labor rights, and to recognize the right of local communities to give or withhold Free, Prior and Informed Consent (FPIC) to any new developments on their lands. In a presentation to investors in July 2015, SSMS lists several commitments focused on sustainability, including no burning, no planting on High Conservation Value (HCV) areas, zero waste, and a commitment to conduct HCV assessments.18 However, SSMS has not made public its policies regarding the development of peatlands, High Carbon stock (HCS) areas, or upholding FPIC with local communities. Therefore, the sustainability policy of SSMS is not in line with NDPE requirements. Three companies with NDPE policies (Golden Agri-‐Resources, the Apical group and Wilmar International) account for 80% of SSMS’ total revenue. In Wilmar’s and Apical’s case SSMS must be compliant with the NDPE policy by the end of 2015 and 2016 respectively.19 SSMS and the RSPO SSMS has been a member of the Roundtable on Sustainable Palm Oil (RSPO) since April 2007.20 In their investor presentation from July 2015, SSMS states that it is “RSPO and ISPO certified,”21 however only one out of SSMS’ five running palm oil mills22 (Sulung Palm Oil Mill and its supply base, PT SSMS) has been given RSPO certification. Another mill has been assessed in October 2014, but is not yet certified.23 In its latest Annual Communication of Progress (ACOP) on RSPO activities, SSMS states that its plantation companies PT Mitra Mendawai Sejati and PT Kalimantan Sawit Abadi want to have their mills and supply bases certified by 2016.24 SSMS has published two proposals under the New Planting Procedures of the RSPO, one for PT Sawit Mandiri Lestari in March 201525, and one for the West Kotawaringin plantation of PT Kalimantan Sawit Abadi in October 2014.26 By submitting these proposals, SSMS allows stakeholders to assess the value of its policy statements on FPIC and HCV during the development of oil palm plantations (and comment on it). This is a positive development. Assessment of practices on the ground The following sections of this chapter describe findings of an assessment of SSMS’s practices on the ground. The approach involved tracking and mapping plantation locations from several documents, and using satellite imagery (Landsat) and overlays to check for signs of deforestation, peatland conversion, hotspots (fires) and clearance of habitats for endangered species. This was accompanied by desk
-‐7-‐
research and occasional enquiries to NGOs. There was no assessment of SSMS’s working conditions on the ground. Research focused on deforestation, peatland conversion, biodiversity and land disputes.
Deforestation figures 2.2
CRR’s earlier report, published in December 2013, calculated that the plantation companies PT SSMS, PT KSA and PT MMS have jointly deforested approximately 10,800 ha from 2003-‐2012 within the company’s land bank for which a Right to Exploit (Hak Guna Usaha, HGU) was obtained.27 For this update, CRR has checked the level of deforestation since CRR’s initial risk analysis: • SSMS’s plantation company PT SMU deforested around 600 ha in 201428, with some deforestation
continuing in 2015 (even up to May/June).29 PT SMU was acquired by SSMS in February 2015, with SSMS already taking care of the management.
• PT TSA was also acquired by SSMS in February 2015. It had cleared 2,300 ha of forest in the period 2009-‐2014, with no significant clearances in 2014.30
• The deforestation by PT Kalimantan Sawit Abadi (PT KSA) between November 2014 and June 2015 is estimated at 400 ha.31 Around 150 ha were cleared between 13 May 2015 and 30 Jun 2015.32
This brings the company’s total deforestation to 14,100 ha for the period 2003 -‐ 2015. The vast majority of the deforestation took place through occupying forestland (see section 2.5), without central government authorization for conversion to oil palm plantations. Therefore the deforestation was illegal.
A new deforestation plan 2.3
10,000 ha of good forest at risk Figure 3 below shows the development plan of SSMS with regard to PT Sawit Mandiri Lestari (PT SML). On 12 March 2015, a New Planting Procedure (NPP) notification for PT SML was put on the website of the Roundtable on Sustainable Palm Oil (RSPO). On 19 March 2015 SSMS received a forestland release permit for the conversion of the forestland into a palm oil plantation. Out of the total permitted area (19,240 ha) it would plant 14,800 ha with oil palm in the period 2015 -‐ 2017, of which 3,100 ha already in 2015.33 The total amount of lowland tropical rainforest at risk due to this development plan comprises 10,100 ha34, while more than 10,000 ha of the area to be planted is potential or known orangutan habitat.35
Source: RSPO, “PT Sawit Mandiri Lestari, New Planting Procedures Public Notification”,
12 March 2015, http://bit.ly/1Ehmbm8
Orangutans The orangutan is an Endangered Species according to the IUCN Red List of Threatened Species.36 The latest Population and Habitat Viability Assessment for orangutans concluded that in the Arut-‐Belantikan region of Kalimantan (in which PT SML is located) orangutans are common, and that local people do not hunt orangutans here. This area is one of the most promising upland areas for orangutans on dry-‐land forest in Kalimantan and is considered to be high conservation priority.37 The reports accompanying SSMS’ NPP notification stated that orangutans were only found on hills too steep for palm oil plantations and in the riparian buffer zone in this area.38 However, this was not substantiated by scientific evidence and was in clear contrast with Principle 5.2 of the RSPO Principles & Criteria, which states:
“The status of rare, threatened or endangered species and other High Conservation Value habitats… shall be identified and operations managed to best ensure that they are maintained and/or enhanced.” 39
RSPO complaint On 8 June 2015 the UK-‐based NGO Environmental Investigation Agency (EIA) and its Indonesian partner JPIK Kalteng lodged a formal complaint with the RSPO against SSMS and its subsidiary PT Sawit Mandiri
-‐9-‐
Lestari (PT SML). EIA argued, after a field investigation, that the required HCV Assessment and Social and Environmental Impact Assessment (SEIA), as documented in the NPP notification, were seriously flawed. Consultations with communities of the villages Cuhai, Ginih and Kinipan did not take place as described in the NPP documents, the communities were not provided the opportunity to participate in the HCV Assessment and SEIA, and the right of local communities to give or withhold their Free, Prior and Informed Consent (FPIC) to new developments was not respected.40 In June 2015 Golden Agri-‐Resources and the Apical Group suspended trading with SSMS for “new purchases” and “temporarily suspended further purchases” respectively.41 This was directly after the launch of the RSPO complaint by EIA/JPIK with regard to the deforestation plans of PT Sawit Mandiri Lestari42, and the launch of a report by the Indonesian NGO Greenomics at the same time on recent clearings of forests and peatland by SSMS.43 Wilmar’s trade was already at a low level. Present situation The complainants EIA/JPIK, RSPO and SSMS have met two times since the launch of the complaint. Key issues with regard to the RSPO complaint are HCV and FPIC. To date SSMS has committed to a more comprehensive study of orangutan habitat. There has been little or no progress on the flaws with the FPIC progress identified by EIA/JPIK. Further field research by JPIK indicates that land conflicts predicted by EIA/JPIK in their complaint have now emerged in at least one village whose customary territory falls within the concession, Desa Suja.44 It remains to be seen if this will be resolved through the RSPO complaints process, which to date has proved ineffective in adjudicating over and providing solutions to violations of customary rights. The case has not yet been added to the RSPO’s website page on the status of complaints.45 For the main customers of SSMS (Golden Agri-‐Resources, Apical Group and Wilmar) the conservation of High Carbon Stock (HCS) areas is also an important matter, while this is not a standard proclaimed by the RSPO. While SSMS has also commissioned a study with regard to HCS, it has not committed to respecting the results of the studies on orangutans and HCS. HCS areas and orangutan habitat may yet be cleared. To investors SSMS still states that the company wants to plant 5,000 – 6,000 ha of oil palm each year, while development of PT SML is presently the only way to reach these figures.46
Peatlands 2.4
Satellite imagery (see 0 below) reveals that SSMS’s plantation company PT Kalimantan Sawit Abadi (PT KSA) has cleared 200 ha peatland between 18 November 2014 and 30 June 2015.47 The cleared area was also potential or actual orangutan habitat.48 The total peatland area of this plantation in West Kotawaringin district amounts to 600 ha. Around 300 ha of this area presently remains intact. Some 300 ha peatland has already been opened up for oil palm plantations, of which 200 ha recently.49
-‐10-‐
Figure 4 The cleared and intact peatlands of PT Kalimantan Sawit Abadi
Sources: Landsat 8 imagery of 18 November 2014 and 30 June 2015. RSPO, “Summary Report of SEIA and HCV Assessments PT Kalimantan Sawit Abadi, peat distribution, September 2014, http://bit.ly/1PjKVRH
Another SSMS plantation company with substantial amounts of peatland is PT Ahmad Saleh Perkasa (PT ASP). For PT ASP the company currently does not have a location permit, essentially meaning that it has no right at all to begin development. The first location permit expired in December 2012. In its financial statements as of 30 June 2015 SSMS states: “Until the completion date of these interim consolidated financial statements, PT ASP is in process to extend the location permit.”50 PT ASP’s area comprises 6,300 ha of peatland and 5,500 ha of actual or potential orangutan habitat. Together the peatland and orang-‐utan areas almost entirely cover PT ASP’s surface.51 Converting the area into a palm oil plantation would violate the NDPE policies of SSMS’s main customers and the RSPO Principles & Criteria 5.2 and 7.4, of which the latter states: “extensive planting on steep terrain, and/or marginal and fragile soils, including peat, is avoided.”52
Forestland occupation 2.5
The Indonesian Forestry Act Nr. 41/1999 prohibits any person from occupying and exploiting forestland without prior permission from the Ministry of Forestry. Regardless, many local authorities have issued oil palm permits on forestland. While Indonesian forestry law often allows for forestland to be relinquished for other land uses, plantation companies often do not follow the proper procedures. Government Regulation No. 60/2012 from 6 July 2012 aimed to address this problem,53 mandating that companies with plantations in Convertible Production Forest (HPK) areas be required to apply for forestland release permits post hoc. However, plantation companies holding an oil palm license on forestland categorized as Production Forest (HP) and Limited Production Forest (HPT) were offered a one-‐time opportunity to apply for compensation land until 6 January 2013 in exchange for any newly opened forestland. Table 5 below shows that SSMS has applied for a forestland release for all of its plantation companies.54 The land bank of SSMS overlaps with a total of 89,200 ha forestland estate, which is 81% of its land bank.55 SSMS has already occupied 54,700 ha of forestland, of which 43,000 ha concern HPK and 11,700 ha concern HP/HPT. For the latter, SSMS has to acquire and reforest compensation land.
-‐11-‐
Table 5 Forestland occupation by SSMS (hectares)
HP/HPT HPK
Developed as of 6 July 2012
PT Tanjung Sawit Abadi (PT TSA) 6,200 5,200
PT Sawit Sumbermas Sarana (PT SSMS) 3,700 15,800
PT Mitra Mendawai Sejati (PT MMS) 1,600 6,800
PT Sawit Multi Utama (PT SMU) 200 15,200
11,700 43,000
Not developed as of 6 July 2012
PT Ahmad Saleh Perkasa (PT ASP) 200 8,100
PT Sawit Mandiri Lestari (PT SML) 0 26,200
200 34,300
Total 11,900 77,300
Sources: Land Use Designation Map, Ministry of Forestry (529 Central Kalimantan), 2013. Ministry of Forestry, “Application for forest release permit with regard to PP 60/2012”, 4 October
2013, http://bit.ly/1mIFZb0
Main risks identified 2.6
Loss of customers 2.6.1
Since late 2013, global traders controlling at least 60% of the commercial palm oil market have adopted No Deforestation, No Peat, No Exploitation (NDPE) policies. These companies include Wilmar International, Golden Agri-‐Resources, Bunge, Musim Mas, IOI Group, the Apical group, Cargill, and others.56 The policies apply to the entire palm oil supply chain, including third-‐party suppliers. Companies committed to NDPE policies require suppliers to stop clearing all High Conservation Value (HCV) areas, High Carbon Stock (HCS) areas and carbon-‐rich peatlands, regardless of depth. In addition, they require all suppliers to uphold human and labor rights, and to recognize the right of local communities to give or withhold Free, Prior and Informed Consent (FPIC) to any new developments on their lands. Three companies with NDPE policies (Golden Agri-‐Resources, the Apical group and Wilmar International) account for 80% of SSMS’ total revenue. In Wilmar’s and Apical’s case SSMS must be compliant with the NDPE policy by the end of 2015 and 2016 respectively. Otherwise, their partnership with SSMS will be terminated.57 In June 2015 Golden Agri-‐Resources and the Apical Group (temporarily) suspended trading with SSMS for “new purchases” and “further purchases” respectively.58 This was directly after the launch of the RSPO complaint by EIA/JPIK with regard to the deforestation plans of PT Sawit Mandiri Lestari59, and the launch of a report by the Indonesian NGO Greenomics at the same time on recent clearings of forests and peatland by SSMS.60
-‐12-‐
SSMS is at high risk of being permanently suspended by its main customers. In practice, the company seems to care little about reducing climate change, conserving biodiversity, and respecting community rights. Its blunt announcement in March 2015 of wanting to clear the highly forested orangutan area of PT Sawit Mandiri Lestari speaks for itself. Satellite imagery shows that the company has also been clearing forests and peatlands in 2015, like it has no customers with NDPE policies. If SSMS continues its current practices, it faces a serious risk of losing these customers, which would have a significant impact on its net income and share price.
Forestland occupation compensation costs 2.6.2
Government Regulation 60/2012 requires SSMS to identify, acquire and restore uncontested land bank in Kalimantan, equal to its occupied land area of HP/HPT. Assuming that SSMS’ applications are processed, the company would have to acquire and reforest 11,700 ha of land in the Other Land Use (APL) category and return this land to the government. The costs of acquiring and reforesting this compensation land are estimated to be USD 3,000 per hectare.61 For the total land, the costs would then be USD 35.1 million (around IDR 460 billion). The impact of these compensation costs on SSMS’ key financial indicators will be discussed in section 3.5.
-‐13-‐
Financial Risk Assessment 3
Financing structure 3.1
The financial structure of SSMS seems to have been and continues to be dynamically changing. Put briefly, at the end of 2014, the company had one and a half times more debt than equity, i.e. gearing of 144%; in the first quarter of 2015, it was 88% geared, and in the most recent quarterly report, the figures show 123%i. While it is interesting to analyse the quarterly performance of SSMS, for comparative purposes and to retain consistency throughout the financial analysis, all analyses that follow rest on the companies’ last annual filings unless otherwise stated. As of the restated 2014 annual figures, the company’s financial structure was more dominated by liabilities as contrasted to equity.
Figure 5 Financing structure SSMS, FY 2014
Source: SSMS, “First Quarter report 2015”, http://bit.ly/1zCAW6t Figure 5 shows that 41% of the company’s capital came from shareholdings, 27% in the form of bank loans, 31% as other liabilities. This compares to the industry average of 93% seen in Figure 6. The company had the fourth highest gearing ratio among all its palm oil competitors based in Indonesia.
i Gearing is hereby measured as the Long Term Debt & Short Term Debt / Shareholders’ equity. Differences between other public estimates
and the hereby presented ones should be attributed to different definitions of formulae constituents. For the sake of better comparison, Annual Reports of companies are also standardized by Bloomberg and Thomson. Henceforth, this might result in varying estimates, the presented ones considered most insightful.
Shareholders 41%
Joint-‐venture partners
1%
Bank loans 27%
Trading partners 1%
Other liabilides 30%
-‐14-‐
Figure 6 Gearing of companies in the Indonesian Palm Oil Sector (as of last annual reports)
Data Source: Bloomberg, July 2015; SSMS 1Q 2015 report (since containing 2014 restated figures)
During the first quarter of 2015, however, SSMS acquired two new plantation companies, bringing its total assets to a value of IDR 5,888 billion (USD 516 million) at the end of March. This contributed to moderating down the actual gearing of the company to 88%, bringing SSMS closer to the industry average. The situation, however, changed again in the second quarter of 2015, when the company reached 123% gearing through debt refinancing and attracting loans for further expansion and acquisitions. The financial structure of the company is important since it reveals the scope for SSMS to seek additional funding, the terms for sourcing it and the risks run by the company and its financiers. If SSMS’ risks increase, than its investors and shareholders get exposed to additional risks too, for which they will e.g. demand further compensation. Thus both borrowing and raising equity could become tougher and at worse terms for SSMS, diminishing the company value. Eventually each party could experience the risk in financial terms. On the one hand side, taking up more debt increases the interest expenses of the company and thus the financial risks it faces. Because of its high gearing, the firm will hardly be able to get exposure to further new debt. In addition, the sustainability issues of SSMS are also tantamount to increased risks. As a consequence, both the investors and the loan-‐holders of the company could demand higher compensation for their investments. Thus the firm’s costs of debt and equity are likely to go up. Furthermore, SSMS’s high gearing also restricts its options to cushion the effect of increased equity cost by taking up more liabilities (which are the cheaper). Eventually, this development could thus impair the
0 7 16
37 53 56 60
79 93 99 103 103 105 110
130 144
154 249
284
0 50 100 150 200 250 300
PP London Sumatra Auspndo Nusantara Mulp Agro Gemilang
Astra Agro Lestari Salim Ivomas Pratama
Sampoerna Agro Bumitama Agri
Gozco Plantapons Average
PT SMART Wilmar Cahaya
Golden Plantapon Eagle High Plantapon
J.A. Waqe Tunas Baru Lampung
Sawit Sumbermas Sarana Dharma Satya Nusantara
Bakrie Sumatera Eterindo Wahanatama
-‐15-‐
company value, which is highly intertwined with its cost of capital. If the company value or share price declines, the shareholders will too be at loss. With attention to similar considerations, the next sections venture to further analyse the SSMS financing, to better analyse the company’s stakeholders and the risks they face.
Shareholders 3.1.1
Figure 5 shows that shareholders account for 41% of total capital. As described in section 1.6, the main shareholder of SSMS is its founder Abdul Rasyid, who controls 75.1% of the outstanding shares. An amount due to related parties – equalling another 23% of total capital – is also due to this dominant shareholder. As already mentioned, the majority of the shares 75.1% are held by Abdul Rasyid, the founder of the company, who is retaining the controlling interest with his family. Institutional and private investors own the remaining 25.1% of SSMS’s shares. The largest public shareholder is the Swiss Falcon Private Bank Ltd that purchased 8.4% of the shares in July/August 2015.62 Falcon is ultimately owned by the Government of Abu Dhabi, and has been linked to the Malaysian 1MDB scandal. The bank had allegedly transferred hundreds of million dollars to personal bank accounts of Malaysia’s Prime Minister, Najib Razak.63 There is only limited information about who the other public shareholders are, but Table 6 provides an overview of the foreign investors that were identified.
Table 6 Foreign shareholders of SSMS
Investor Country % of
outstanding shares
Value (in USD million)
Bessemer Trust United States 0.09 1.19
Okasan Asset Management Japan 0.06 0.78
Kokusai Asset Management Japan 0.03 0.35
Kames Capital, part of Aegon Netherlands 0.03 0.36
New York Life Investment Management United States 0.01 0.13
BlackRock United States 0.01 0.13
Daiwa Asset Management Japan 0.01 0.12
IndexIQ Advisors United States 0.01 0.12
Mitsubishi UFJ Asset Management Japan 0.01 0.11
HSBC United Kingdom 0.01 0.07
Enhanced Investment Products Hong Kong 0.00 0.04
Source: ThomsonOne database, Viewed in June 2015; Website FT Markets (markets.ft.com/research/Markets/Tearsheets/Business-‐profile?s=SSMS:JKT), Viewed in June 2015.
The other foreign shareholders identified in Table 6 do not own more than 0.3% of the company’s shares in total. The concentrated ownership structure, non-‐transparent corporate governance and sustainability risks to which the company is linked may deter foreign investors. Considering that ESG
-‐16-‐
factors (environmental, social and governance) play an increasing role in the global investment markets, they limit its exposure to international funding and SSMS remains restricted to local and tight markets until it starts to address its sustainability issues. The latter pose unaccounted risks to the existing shareholders, with the potential to push the share price down and diminish the value of their investments.
Banks 3.1.2
The Indonesian banks that have provided loans to SSMS are also exposed to the potential financial risks of its high gearing and its poor sustainability performance. Even though they pose collaterals on the debt, they might increase the required interest, allowing for the increased risks. Figure 5 shows that bank loans made up a substantial part (27%) of the total capital of the firm. The loans still outstanding to the company and its subsidiaries, with a total value of IDR 1,788 billion (USD 136.2 million) at the end of March 2015, were provided by two Indonesian state-‐owned banks. As of March 31, 2015, SMMS and its subsidiaries owed loans with a total value of IDR 1,414 billion to Bank Mandiri and loans with a value of IDR 374 billion to Indonesia Eximbank.64 In the recent past, other banks were exposed to the company as well. The Malaysian RHB Banking Group, the French bank BNP Paribas and the Indonesian Bank Mandiri were the underwriters of the IPO of SSMS on the Indonesian Stock Exchange in December 2013. Their underwriting commitments amounted to 86.0%, 7.5% and 6.2% of the offered shares respectively.65 At the end of July 2015, BNP Paribas hosted a roadshow for SSMS in the United States.66 Given SSMS’s poor sustainability record, as described in chapter 2, the strong financial relationships with the company could possibly create reputational risks for Bank Mandiri, Indonesia Eximbank, RHB banking and BNP Paribas. In addition, SSMS’s poor sustainability performance could also create financial risks for the banks and investors involved, pushing up their required compensation. As a consequence, the value of the company can be impaired and the shareholders also negatively affected. To provide an overview of some likely near term risks the company faces, the following sections review different plausible developments of some of its Key Performance Indicators (KPIs).
Objective and approach of the Financial Risk Assessment 3.2
The following sections discuss the financial risks that SSMS as well as the banks and investors of the company could face as a result of the sustainability risks identified in chapter 2. Several scenarios are developed and presented. Aiming not to predict the future, they are rather designed to show how SSMS’s sustainability issues could potentially impact its financial indicators. The scenarios aim to describe how previously inconceivable or imperceptible developments may play out. To evaluate the potential financial impacts of the company’s sustainability risks, CRR developed a model based on SSMS’s annual financial statements and estimated its potential future earnings. CRR first designed a baseline scenario in which sustainability issues have no impact on SSMS’s business, followed by two alternative scenarios that account for varying impacts. The underlying assumptions of both scenarios are described in section 2.6, briefly: 1. SSMS could potentially lose 80% of its customers since its practices are not compliant with
companies, such as Wilmar, GAR and Apical that have adopted No Deforestation policies.
-‐17-‐
2. SSMS could be required to acquire and reforest compensation land to be handed over to the government due to its illegal occupation of HP/HPT forestland, for a total estimated cost of USD 35.1 million (approximately IDR 464 billion).
For both scenarios, CRR identified the risks’ impact on key financial indicators such as Return on Equity, Return on Assets, leverage and Profit Margins. For comparative purposes, each scenario is assumed to occur at the beginning of FY 2016. To assess the financial impacts of the two scenarios in FY2016 and FY2017, both are compared with the baseline scenario.
Baseline scenario 3.3
Table 7 gives an overview of SSMS’s main financial indicators for the period 2013-‐2017. The estimates for the upcoming periods rest on the historical company performance, assuming its future growth. The baseline scenario presents a business-‐as-‐usual development for SSMS, in which the sustainability issues discussed in chapter 2 do not have a significant impact on its bottom line. Table 7 shows how SSMS’s key financial indicators could develop from 2013-‐2017 in a favourable manner.
Table 7 SSMS: Baseline scenario 2013-‐2017
Indicator FY 2012 FY 2013 FY 2014 E 2015 E 2016 E 2017
Sales IDR million 1,880,275 1,962,435 2,616,365 3,261,691 4,066,186 5,069,110
Net income IDR million 473,980 631,669 737,829 908,673 1,155,453 1,468,689
Profit Margin % 25% 29% 25% 28% 28% 29%
Asset Turnover % 89% 53% 39% 41% 43% 45%
Equity Multiplier x 4.5 1.6 2.4 2.3 2.2 2.1
ROA % 22% 16% 10% 11% 12% 13%
ROE(shareholders) % 102% 25% 26% 26% 27% 27%
Debt/Equity % 354% 60% 141% 131% 122% 115%
Sources: SSMS, “Annual Report 2014”; SSMS, First Quarter report 2015”; CRR model calculations
In the Baseline Scenario, the company maintains its rapid growth of 25% in terms of Revenues. Thus, both sales and net income show a clear upward trend. The net income margin also increases assuming the company’s ability to moderate operating expenses to at least their historical average (as percent of sales). The asset turnover is also optimized and the equity multiplier is lessened, both driving a healthy increase in Return on Equity (ROE). Return on Assets (ROA) remains of stable growth of more than half percent per annum while ROE goes to peak values – 26.9% in 2017. The leverage (debt-‐equity ratio) improves from 141% to 115% in 2017. The assumptions and figures are thus in line with the long-‐term convergence of the leverage to the corresponding industry mean value of gearing. The ROE keeps on increasing corresponding to the early growth stage of the company, outstripping peers by far (In its maturity period the ROE is also likely to approximate the industry average of 8.3%). Thus, as seen from Figure 7, SSMS currently ranks 2rd by Return on Shareholders’ Equity among its Indonesian peers.
-‐18-‐
Figure 7 ROE of SSMS compared to peers and industry average, as of last annual reports
Data Source: Bloomberg, July 2015; SSMS 1Q 2015 report (since containing 2014 restated figures)
However, SSMS’s financial development in the baseline scenario is assessed without considering the reality of the No Deforestation, No Peat, No Exploitation policies adopted by its customers, and is therefore not completely objective. The company will inevitably face these changing market forces. This will either lead SSMS to lose customers or adopt comprehensive sustainability policies to mitigate the risks. If the company does commit to a strong policy, it would have to be implemented at the expense of its land bank expansion targets. While this might cause a slight downward movement of its key financial ratios, there would be less forest clearing, less peatland development, less local conflicts, and generally less risk for the company. The following sections will analyse two alternative scenarios, indicating how the company’s financial indicators might be impacted by the sustainability issues described in chapter 2.
Scenario 1: SSMS loses major customers 3.4
Wilmar International’s landmark No Deforestation policy in December 2013 started a wave of commitments from global palm oil traders to improve sustainability in their supply chains. These policies have focused on eliminating deforestation, protecting High Conservation Value (HCV) and High Carbon
-‐19-‐
Stock (HCS) areas, avoiding peatlands, and respecting the concept of Free, Prior and Informed Consent (FPIC) for communities. CRR estimates that customers comprising around 80% of SSMS’s revenues have committed to No Deforestation, No Peat, No Exploitation policies. These include SSMS’s customers Wilmar, Golden Agri-‐Resources and Apical Group.67 These three companies also require third-‐party suppliers to apply the same policies and practices. In Wilmar’s case, for example, all suppliers must be compliant with its policy by the end of 2015 or their partnership will be terminated. SSMS stands in clear violation of these policies, and risks being terminated as a supplier. If SSMS were to lose one or more of its major customers, this could have a serious impact on its net income. The global marketplace is increasingly demanding palm oil that is produced responsibly, and SSMS’s lack of safeguards (including its lack of RSPO certification) could severely restrict the company’s access to international markets going forward. In this scenario, we estimate that SSMS could lose 80% of its existing customer base in 2016. We estimate that the Cost of Goods sold, which in the past amount to half of the revenue, will likely not be able to fully respond to the loss of customers, and in the period 2016-‐2017, the COGS will remain at 60% the value of Revenues. As SSMS is buying around 19% of the FFB processed from external suppliers (see Table 3), the company is expected to be able to reduce costs by stopping FFB procurements from external suppliers. However, finding new customers would be difficult in the short term. As a result, we assume that SSMS would only be able to replace 10% of its lost sales in 2016, and additional 20% in 2017. The revenues not lost retain the historic growth of 25% per annum. Based on these assumptions, we modelled the impacts of this scenario on the key financial indicators for SSMS in 2016 and 2017. The results are presented in Table 8.
Table 8 Scenario 1: SSMS loses customers with non-‐deforestation policies
Indicator FY 2012 FY 2013 FY 2014 E 2015 E 2016 E 2017
Sales IDR million 1,880,275 1,962,435 2,616,365 3,261,691 1,219,856 2,984,560
Net income IDR million 473,980 631,669 737,829 778,179 72,639 470,663
In this scenario, sales drop dramatically by 63% in 2016 relative to the projected value in 2015, resulting in a significant reduction of net earnings as well. In 2017, the figures improve, yet hardly reaching previous levels. The Profit Margin, Asset Turnover, Return on Assets and Return on Equity are all substantially reduced. The equity multiplier and the leverage are also affected. Since the loss of profitability can be translated to a significant risk for shareholders (e.g. not receiving dividends, realizing
-‐20-‐
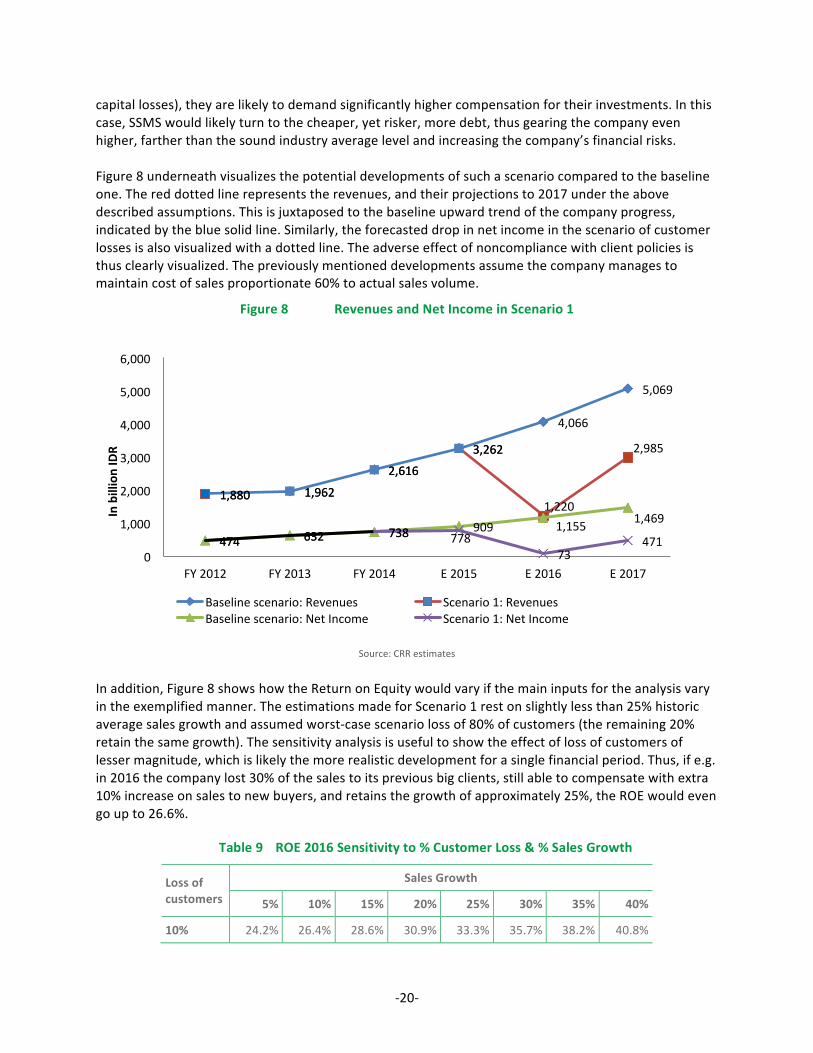
capital losses), they are likely to demand significantly higher compensation for their investments. In this case, SSMS would likely turn to the cheaper, yet risker, more debt, thus gearing the company even higher, farther than the sound industry average level and increasing the company’s financial risks. Figure 8 underneath visualizes the potential developments of such a scenario compared to the baseline one. The red dotted line represents the revenues, and their projections to 2017 under the above described assumptions. This is juxtaposed to the baseline upward trend of the company progress, indicated by the blue solid line. Similarly, the forecasted drop in net income in the scenario of customer losses is also visualized with a dotted line. The adverse effect of noncompliance with client policies is thus clearly visualized. The previously mentioned developments assume the company manages to maintain cost of sales proportionate 60% to actual sales volume.
Figure 8 Revenues and Net Income in Scenario 1
Source: CRR estimates
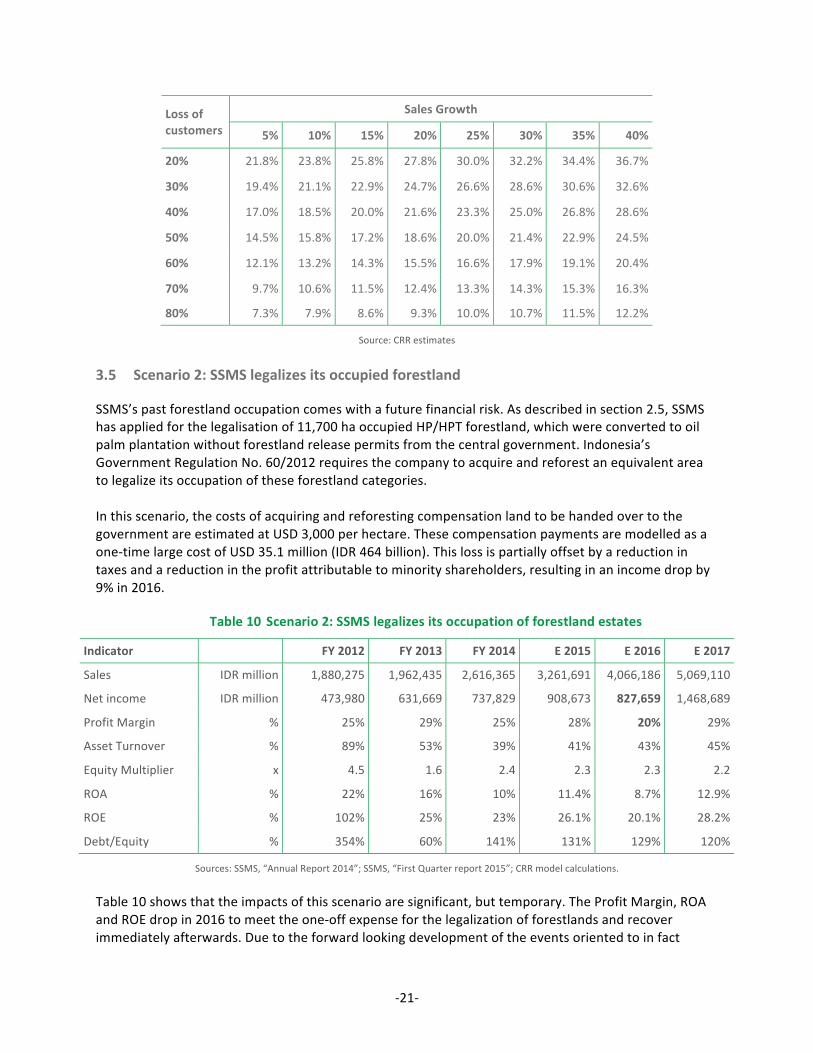
In addition, Figure 8 shows how the Return on Equity would vary if the main inputs for the analysis vary in the exemplified manner. The estimations made for Scenario 1 rest on slightly less than 25% historic average sales growth and assumed worst-‐case scenario loss of 80% of customers (the remaining 20% retain the same growth). The sensitivity analysis is useful to show the effect of loss of customers of lesser magnitude, which is likely the more realistic development for a single financial period. Thus, if e.g. in 2016 the company lost 30% of the sales to its previous big clients, still able to compensate with extra 10% increase on sales to new buyers, and retains the growth of approximately 25%, the ROE would even go up to 26.6%.
Table 9 ROE 2016 Sensitivity to % Customer Loss & % Sales Growth
Scenario 2: SSMS legalizes its occupied forestland 3.5
SSMS’s past forestland occupation comes with a future financial risk. As described in section 2.5, SSMS has applied for the legalisation of 11,700 ha occupied HP/HPT forestland, which were converted to oil palm plantation without forestland release permits from the central government. Indonesia’s Government Regulation No. 60/2012 requires the company to acquire and reforest an equivalent area to legalize its occupation of these forestland categories. In this scenario, the costs of acquiring and reforesting compensation land to be handed over to the government are estimated at USD 3,000 per hectare. These compensation payments are modelled as a one-‐time large cost of USD 35.1 million (IDR 464 billion). This loss is partially offset by a reduction in taxes and a reduction in the profit attributable to minority shareholders, resulting in an income drop by 9% in 2016.
Table 10 Scenario 2: SSMS legalizes its occupation of forestland estates
Indicator FY 2012 FY 2013 FY 2014 E 2015 E 2016 E 2017
Sales IDR million 1,880,275 1,962,435 2,616,365 3,261,691 4,066,186 5,069,110
Net income IDR million 473,980 631,669 737,829 908,673 827,659 1,468,689
Profit Margin % 25% 29% 25% 28% 20% 29%
Asset Turnover % 89% 53% 39% 41% 43% 45%
Equity Multiplier x 4.5 1.6 2.4 2.3 2.3 2.2
ROA % 22% 16% 10% 11.4% 8.7% 12.9%
ROE % 102% 25% 23% 26.1% 20.1% 28.2%
Debt/Equity % 354% 60% 141% 131% 129% 120%
Sources: SSMS, “Annual Report 2014”; SSMS, “First Quarter report 2015”; CRR model calculations. Table 10 shows that the impacts of this scenario are significant, but temporary. The Profit Margin, ROA and ROE drop in 2016 to meet the one-‐off expense for the legalization of forestlands and recover immediately afterwards. Due to the forward looking development of the events oriented to in fact
-‐22-‐
minimizing risks, and the incurred just one-‐off costs, there is no consecutive impact on the costs of equity and debt or the company’s leverage. SSMS continues its growth development path. Figure 9 visualizes the likely development path of the Profit margin and the ROA, the latter exhibiting a lesser effect. The developments consider the company’s ability to maintain Cost of Goods Sold proportional to its Sales volume. In the opposite case, the margins can go negative and the impact felt stronger.
Figure 9 Profit Margin and ROA in Scenario 2
Source: CRR estimates
Further, the expected decline in ROE is tested for sensitivity to the amount the company might have to spend to legalize its occupation of forestland estates. In section 2.4 we estimated these costs at IDR 464 billion, based on average costs of IDR 3,000 per hectare, but that figure in fact depends on the area and costs needed to acquire and reforest compensation land. Table 11 shows the impact on the ROE in 2016 of different costs estimates.
Table 11 ROE 2016 Sensitivity to Compensation Land Costs and % Sales Growth
Table 11 shows that if e.g. the actual compensation land costs amounted to IDR 250 billion and SSMS retained historical average sales growth of 25%, the ROE would be 23.3% in 2016. Thus, it reads that if the company manages to realize sales growth at a higher pace, than no impairment on the financial indicators would be observed due to the incurred costs. From another perspective, the legalization of its occupation of forestland estates also amounts to a risk reduction adding to the long term value of the firm.
Conclusion of the Financial Risk Assessment 3.6
Chain Reaction Research’ previous report on SSMS, released just before the company joined the Indonesia Stock Exchange (IDX) in December 2013, warned that investors buying shares of SSMS would be exposed to serious governance and sustainability risks. Since then SSMS has undergone several major changes, including acquiring two new plantation companies and announcing plans to clear over 10,000 ha of lowland rainforest and orangutan habitat. Clearing this land would violate the No Deforestation, No Peat, No Exploitation policies that SSMS’ major customers have recently adopted. These policies apply to the entire palm oil supply chain, including SSMS. Thus SSMS faces serious near-‐term risk of losing customers that buy 80% of its production. While there has been very little documented deforestation by SSMS since Wilmar, a major client of SSMS announced its policy in December 2013, SSMS has fails to adopt or implement any measures to curb past practices, and its plans for future development would therefore violate the standards of its other main customers, GAR and Apical. Table 12 summarises the outcomes of the previously described scenarios for further development of SSMS. A baseline scenario in which the company continues its strong growth is juxtaposed with the impacts of the case in which SSMS is losing its major customers or incurring one off expenses for the legalization of its forestland. Scenario 1, in which the company loses important customers, would lead to the worst possible impacts, like more than double digit declines in Asset Turnover, ROA and ROE. It is likely that in this case the company will not be able to optimize its leverage and gearing would remain relatively high. Scenario 2, in which the company undertakes spending on forestland legalization, is a long term positive one, although the immediately felt effect on the company performance might appear negative. Indeed the profitability is expected to change downwards, due to the increased expenses. This in turn would result in a moderation of ROA and ROE. A full recovery is though expected, since the legalization of forestland estates can be viewed as an investment in the company itself. In this scenario the company would be better off, minimizing its sustainability risks and elevating its operational standards.
-‐24-‐
Table 12 Summary of key financial indicators per scenario in 2016
Indicator
Key financial indicator per scenario in 2016
Baseline 1: Loss of customers
2: Forestland legalization
Sales IDR million 4,066,186 1,219,856 4,066,186
Net income IDR million 1,155,453 72,639 827,659
Profit Margin % 28% 6% 20%
Asset Turnover % 43% 17% 43%
Equity Multiplier x 2.2 2.1 2.3
ROA % 12.2% 1.0% 8.7%
ROE % 26.5% 2.1% 20.1%
Debt/Equity % 122% 154% 129%
Sources: SSMS, “Annual Report 2014”; SSMS, “First Quarter report 2015”; CRR model calculations. As visible from Figure 10, the return on Equity would be highest in 2017 if the company spends on forestland legalization. Further, the intermediate effect of the expenses would impact the firm much less than the potential loss of customers.
Figure 10 SSMS ROE under the 3 different scenarios
Source: CRR estimates
Eventually, the scenarios put forward here could occur with different magnitudes and overlap in e.g. one financial year. If it so happens that SSMS losses customers and then is forced to obtain the forestland licences, the company could well end up in the red, recording profits below zero. This development is plausible, considering the global trend to turning ever more attention to sustainability and raising awareness among major investors and financiers about the risks imposed by e.g. lack of proper policies governing deforestation, use of peat land or labour exploitation. Never the less, there is the risk of
26% 27%
27%
09%
11%
23% 20%
28%
0%
5%
10%
15%
20%
25%
30%
FY 2014 E 2015 E 2016 E 2017
Baseline scenario
Loss of customers
Forestland legalizapon
-‐25-‐
reputational damage which could stall the rapid growth of the company. Among the more tangible changes which can be expected in the worst case scenario, is increase in costs of debt and equity, major customers cancelling purchasing contracts and banks and investors withholding financing. Such a financial distress could impair the firm value. Conclusively, CRR’s financial risk analysis therefore underlines that addressing current and past sustainability issues -‐ deforestation and legality issues in particular -‐ is directly relevant for SSMS’s future financial health.
-‐26-‐
Colophon This report was co-‐authored by Jan Willem van Gelder, Milena Levicharova, Ben Cushing, and Joel Finkelstein. Chain Reaction Research 1320 19th Street NW, Suite 400 Washington, DC 20036 United States Website: www.chainreactionresearch.com Email: [email protected]
Disclaimer This report and the information therein are derived from selected public sources. Chain Reaction Research is an unincorporated project of Climate Advisers and Profundo (individually and together, the "Sponsors"). The Sponsors believe the information in this report comes from reliable sources, but they do not guarantee the accuracy or completeness of this information, which is subject to change without notice, and nothing in this document shall be construed as such a guarantee. The statements reflect the current judgment of the authors of the relevant articles or features, and do not necessarily reflect the opinion of the Sponsors. The Sponsors disclaim any liability, joint or severable, arising from use of this document and its contents. Nothing herein shall constitute or be construed as an offering of financial instruments or as investment advice or recommendations by the Sponsors of an investment or other strategy (e.g., whether or not to “buy”, “sell”, or “hold” an investment). Employees of the Sponsors may hold positions in the companies, projects or investments covered by this report. No aspect of this report is based on the consideration of an investor or potential investor's individual circumstances. You should determine on your own whether you agree with the content of this document and any information or data provided by the Sponsors.
-‐27-‐
Appendix 1 References
1 SSMS, “Annual Report 2014”, page 17, http://bit.ly/1MwYMGu SSMS, “Investor Presentation”, February 2015, pages 9 and 10, http://bit.ly/1HN5GlB
2 SSMS, “Investor Presentation”, February 2015, http://bit.ly/1HN5GlB SSMS, “Management presentation”, July 2015, http://bit.ly/1DT8gsW
3 SSMS, “Investor Presentation”, February 2015, http://bit.ly/1HN5GlB SSMS, “Management presentation”, July 2015, http://bit.ly/1DT8gsW
4 Indonesian Business Daily, “Sawit Sumbermas Prepares IDR1 Trillion for Acquisition”, 21 May 2015, http://bit.ly/1IVaaYy
5 SSMS, “Annual Report 2014”, page 37 of annual report and page 65 of financial statements, http://bit.ly/1MwYMGu SSMS, “Annual report 2013”, 11 April 2014, page 26, http://bit.ly/1wp4a0V
6 SSMS, “Annual Report 2014”, page 37 of annual report and page 65 of financial statements, http://bit.ly/1MwYMGu SSMS, “Annual report 2013”, 11 April 2014, page 26, http://bit.ly/1wp4a0V
7 Borneo News, “Dialog dengan H Abdul Rasyid (2) : Grup CBI Bangun Kompleks Industri Pengolahan Di Kumai`”, 24 March 2015, http://bit.ly/1ESp3q3
8 SSMS, “Quarterly reports and annual report 2013”, http://bit.ly/1zCAW6t
9 Mongabay, “Oil palm company accused of violating RSPO, IPOP standards in Indonesia”, 11 June 2015, http://bit.ly/1Gd5CIX Apical Group, “E-‐mail to EIA and other stakeholders”, 22 June 2015.
10 Environmental Investigation Agency, “Ex timber crook’s palm oil firm threatens orangutan habitat”, 8 June 2015, http://bit.ly/1dJpDjm Vimeo, “EIA releases footage of indigenous forest threatened by palm oil firm”, 10 June 2015, http://bit.ly/1IjM8Ug Mongabay, “Oil palm company accused of violating RSPO, IPOP standards in Indonesia”, 11 June 2015, http://bit.ly/1Gd5CIX
11 Greenomics Indonesia, “IPOP signatories are the biggest buyers of palm oil from a company that is conducting new planting through the clearing of forested peatlands and orangutan habitat”, 4 June 2015, http://bit.ly/1GtDSzU
12 SSMS, Information to the Indonesian Stock Exchange, Shareholders holding more than 5% of the shares per 31/08/2015, 7 September 2015, http://bit.ly/1K24TAx
13 SSMS, prospectus “Offer of 1,500,000,000 Ordinary Shares of Par Value Rp.100 each. Offer Price: Rp.670 per Offering Share”, 2 December 2013, page 142, http://bit.ly/1t3LwLG Indonesian Stock Exchange, “Initial Listing of PT Sawit Sumbermas Sarana Tbk (SSMS) on December 12, 2013“, 11 December 2013, http://bit.ly/1x4i7cb SSMS, “Financial statements as of 30 June 2015”, 28 July 2015, http://bit.ly/1Nxd5b9
14 SSMS, “Financial statements as of 30 June 2015”, 28 July 2015, http://bit.ly/1Nxd5b9
15 Reuters, “Indonesia's Citra Borneo aims to raise up to $360 mln in palm oil IPO”, 1 June 2011, http://reut.rs/1MBX5TN Telepak/Environmental Investigation Agency, report “The Final Cut. Illegal Logging in Indonesia's Orangutan Parks”, 1999, http://bit.ly/1MCjIJm Environmental Investigation Agency, “Ex-‐kingpin’s palm oil threat to orangutans & investors”, 12 December 2013, http://bit.ly/1wLCF8F
16 Forbes, “Rasyid Abdul #41 Indonesia's 50 Richest”, December 2014, http://onforb.es/1NmJQ9P
17 Wilmar, “No Deforestation, No Peat, No Exploitation Policy”, 5 December 2013, http://bit.ly/1hDCOBB Golden Agri-‐Resources, “GAR sustainability dashboard”, http://bit.ly/1DsN1er Golden Agri-‐Resources Ltd, presentation “Full Year 2013 Results Performance”, 28 February 2014, page 15, http://bit.ly/1vZomgt Musim Mas Group, “Musim Mas affirms its commitment to sustainability”, 4 December 2014, http://bit.ly/1vyEi9C Apical Group, “Sustainability Policy”, September 2014, http://bit.ly/1AHo0qE
18 SSMS, “Management presentation”, July 2015, http://bit.ly/1DT8gsW
-‐28-‐
19 Wilmar, “No Deforestation, No Peat, No Exploitation Policy”, 5 December 2013, http://bit.ly/1hDCOBB
Golden Agri-‐Resources, “GAR sustainability dashboard”, http://bit.ly/1DsN1er Golden Agri-‐Resources Ltd, “Full Year 2013 Results Performance, 28 February 2014”, page 15, http://bit.ly/1vZomgt Apical Group, “Sustainability Policy”, September 2014, http://bit.ly/1AHo0qE Apical Group, “Asian Agri and Apical Team Up with TFT to Enhance Supply Chain Traceability”, 16 June 2015, http://bit.ly/1CeXaIh
20 RSPO, member “PT Sawit Sumbermas Sarana”, http://bit.ly/1Lh3Izk
21 SSMS, “Management presentation”, July 2015, http://bit.ly/1DT8gsW
29 Landsat 8 imagery 27 April 2015 and 30 June 2015
30 Landsat 8 imagery
31 Comparison Landsat 8 imagery of 18 November 2014 and 13 May 2015. Greenomics Indonesia, “IPOP signatories are the biggest buyers of palm oil from a company that is conducting new planting through the clearing of forested peatlands and orangutan habitat”, 4 June 2015, http://bit.ly/1GtDSzU
32 Landsat 8 imagery 13 May 2015 and 30 June 2015.
33 TÜVRheinland, Amendment of the RSPO New Planting Procedure Assessment Report PT Sawit Mandiri Lestari – Central Kalimantan, 26 May 2015, http://bit.ly/1Ehmbm8 Ministry of Environment and Forestry (Indonesia), Progress forestland release for cultivation of plantation forests, May 2015, http://bit.ly/1TQExrE
34 RSPO, “PT Sawit Mandiri Lestari, New Planting Procedures Public Notification”, 12 March 2015, http://bit.ly/1Ehmbm8
35 UNEP World Conservation Monitoring Centre, “World Atlas of Great Apes and their Conservation”, http://bit.ly/1lbGEQ2, 2005.
36 IUCN Red List of Threatened Species, version 2014.3, “Pongo pygmaeus (Bornean Orangutan)”, http://bit.ly/IOFRZz, as viewed on 29 March 2015.
37 IUCN/SSC Conservation Breeding Specialist Group, Singleton, I., S. Wich, S. Husson, S. Stephens, S. Utami Atmoko, M. Leighton, N. Rosen, K. Traylor-‐Holzer, R. Lacy and O. Byers (eds.), “Orangutan Population and Habitat Viability Assessment: Final Report”, August 2004, page 192, http://bit.ly/1iFJcnJ
38 RSPO, “PT Sawit Mandiri Lestari, New Planting Procedures Public Notification”, 12 March 2015, http://bit.ly/1Ehmbm8
39 RSPO, “Principles and Criteria for the Production of Sustainable Palm Oil”, 25 April 2013, available at http://bit.ly/1tosTWh
40 Environmental Investigation Agency, “Ex timber crook’s palm oil firm threatens orangutan habitat”, 8 June 2015, http://bit.ly/1dJpDjm Vimeo, “EIA releases footage of indigenous forest threatened by palm oil firm”, 10 June 2015, http://bit.ly/1IjM8Ug Mongabay, “Oil palm company accused of violating RSPO, IPOP standards in Indonesia”, 11 June 2015, http://bit.ly/1Gd5CIX
-‐29-‐
41 Mongabay, “Oil palm company accused of violating RSPO, IPOP standards in Indonesia”, 11 June 2015,
http://bit.ly/1Gd5CIX Apical Group, E-‐mail to EIA and other stakeholders, 22 June 2015.
42 Environmental Investigation Agency, “Ex timber crook’s palm oil firm threatens orangutan habitat”, 8 June 2015, http://bit.ly/1dJpDjm Vimeo, “EIA releases footage of indigenous forest threatened by palm oil firm”, 10 June 2015, http://bit.ly/1IjM8Ug Mongabay, “Oil palm company accused of violating RSPO, IPOP standards in Indonesia”, 11 June 2015, http://bit.ly/1Gd5CIX
43 Greenomics Indonesia, “IPOP signatories are the biggest buyers of palm oil from a company that is conducting new planting through the clearing of forested peatlands and orangutan habitat”, 4 June 2015, http://bit.ly/1GtDSzU
44 Personal communication with EIA, 19 August 2015
45 RSPO, Status of complaints, http://bit.ly/1Dmp63g
46 SSMS, “Management presentation”, July 2015, http://bit.ly/1DT8gsW
47 Landsat 8 imagery of 18 November 2014 and 30 June 2015. RSPO, “Summary Report of SEIA and HCV Assessments PT Kalimantan Sawit Abadi, peat distribution, September 2014, http://bit.ly/1PjKVRH
48 Landsat 8 imagery of 18 November 2014 and 30 June 2015. Sources OU habitat: UNEP World Conservation Monitoring Centre, “World Atlas of Great Apes and their Conservation”, http://bit.ly/1lbGEQ2, 2005.
49 Permit data district West Kotawaringin. Landsat family. Peatland map Kalimantan and Sumatra of Ministry of Agriculture Indonesia, 2012. Wetlands International -‐ Indonesia Programme & Wildlife Habitat Canada (WHC), “Map of Peatland Distribution Area and Carbon Content in Kalimantan, 2000 – 2002”, http://bit.ly/1hc6CSo, 2004.
50 SSMS, “Financial statements as of 30 June 2015”, 28 July 2015, http://bit.ly/1Nxd5b9
51 Permit data district Seruyan. UNEP World Conservation Monitoring Centre, “World Atlas of Great Apes and their Conservation”, http://bit.ly/1lbGEQ2, 2005. Peatland map Kalimantan and Sumatra of Ministry of Agriculture Indonesia, 2012. Wetlands International -‐ Indonesia Programme & Wildlife Habitat Canada (WHC), “Map of Peatland Distribution Area and Carbon Content in Kalimantan, 2000 – 2002”, http://bit.ly/1hc6CSo, 2004.
52 RSPO, “Principles and Criteria for the Production of Sustainable Palm Oil”, 25 April 2013, available at http://bit.ly/1tosTWh
53 Presiden Republik Indonesia, “Regulation 60/2012, amendment of No. 10 of 2010, procedures for change to the allocation and function of forestlands”, 6 July 2012, available at http://bit.ly/1mYAiWI Aidenvironment, unpublished report for ClimateWorks Foundation -‐ Climate and Land Use Alliance (CLUA), “State revenue losses caused by unauthorized oil palm plantation expansion in the forestlands of West and Central Kalimantan in 2005-‐2011”, May 2013.
54 Ministry of Forestry, “Application for forest release permit with regard to PP 60/2012”, 4 October 2013, http://bit.ly/1mIFZb0,.
55 Land Use Designation Map, Ministry of Forestry (529 Central Kalimantan), 2013.
56 Wilmar, “No Deforestation, No Peat, No Exploitation Policy”, 5 December 2013, http://bit.ly/1hDCOBB Golden Agri-‐Resources, “GAR sustainability dashboard”, http://bit.ly/1DsN1er Golden Agri-‐Resources Ltd, presentation “Full Year 2013 Results Performance”, 28 February 2014, page 15, http://bit.ly/1vZomgt Musim Mas Group, “Musim Mas affirms its commitment to sustainability”, 4 December 2014, http://bit.ly/1vyEi9C Apical Group, “Sustainability Policy”, September 2014, http://bit.ly/1AHo0qE
57 Wilmar, “No Deforestation, No Peat, No Exploitation Policy”, 5 December 2013, http://bit.ly/1hDCOBB Golden Agri-‐Resources, “GAR sustainability dashboard”, http://bit.ly/1DsN1er Golden Agri-‐Resources Ltd, “Full Year 2013 Results Performance, 28 February 2014”, page 15, http://bit.ly/1vZomgt Apical Group, “Sustainability Policy”, September 2014, http://bit.ly/1AHo0qE
-‐30-‐
Apical Group, “Asian Agri and Apical Team Up with TFT to Enhance Supply Chain Traceability”, 16 June 2015, http://bit.ly/1CeXaIh
58 Mongabay, “Oil palm company accused of violating RSPO, IPOP standards in Indonesia”, 11 June 2015, http://bit.ly/1Gd5CIX Apical Group, E-‐mail to EIA and other stakeholders, 22 June 2015.
59 Environmental Investigation Agency, “Ex timber crook’s palm oil firm threatens orangutan habitat”, 8 June 2015, http://bit.ly/1dJpDjm Vimeo, “EIA releases footage of indigenous forest threatened by palm oil firm”, 10 June 2015, http://bit.ly/1IjM8Ug Mongabay, “Oil palm company accused of violating RSPO, IPOP standards in Indonesia”, 11 June 2015, http://bit.ly/1Gd5CIX
60 Greenomics Indonesia, “IPOP signatories are the biggest buyers of palm oil from a company that is conducting new planting through the clearing of forested peatlands and orangutan habitat”, 4 June 2015, http://bit.ly/1GtDSzU
61 RSPO Remediation and Compensation Working Group, “RSPO Remediation and Compensation Procedures Related to Land Clearance Without Prior HCV Assessment”, May 2014, page 13, http://bit.ly/1hdIfKK
62 SSMS, Information to the Indonesian Stock Exchange, Shareholders holding more than 5% of the shares per 31/08/2015, 7 September 2015, http://bit.ly/1K24TAx
63 Berita Daily, “Arab tycoons key players in the 1MDB scandal, 3 July 2015”, http://bit.ly/1IT8M5I Wall Street Journal Asia, “Malaysian financier Jho Low is tied to inquiry into 1MDB”, 10 July 2015, http://bit.ly/1JORNFz
64 SSMS, “First Quarter report 2015”, p. 97-‐99.
65 SSMS, prospectus “Offer of 1,500,000,000 Ordinary Shares of Par Value Rp.100 each. Offer Price: Rp.670 per Offering Share”, 2 December 2013, page 163, http://bit.ly/1LNqBqH
66 SSMS, “Investor Bulletin PT Sawit Sumbermas Sarana”, Jakarta, 27 August 2015.
67 Wilmar International, news release “Wilmar International Announces Policy to Protect Forests and Communities”, http://bit.ly/IOviVF, 5 December 2013. Wilmar International, “No Deforestation, No Peat, No Exploitation Policy”, http://bit.ly/1hDCOBB, 5 December 2013. Golden Agri-‐Resources Ltd, presentation “Full Year 2013 Results Performance”, 28 February 2014, p. 15, http://bit.ly/1vZomgt Golden Agri-‐Resources Ltd, The Forest Trust (TFT) and Greenpeace, presentation “High Carbon Stock Forest Conservation”, 12 February 2014, http://bit.ly/1lW0vZC; Apical Group, “Sustainability Policy”, September 2014, http://bit.ly/1AHo0qE