154
2018 SCA ANNUAL REPORT 2018

2018
SC
A A
NN
UA
L R
EP
OR
T 2
01
8
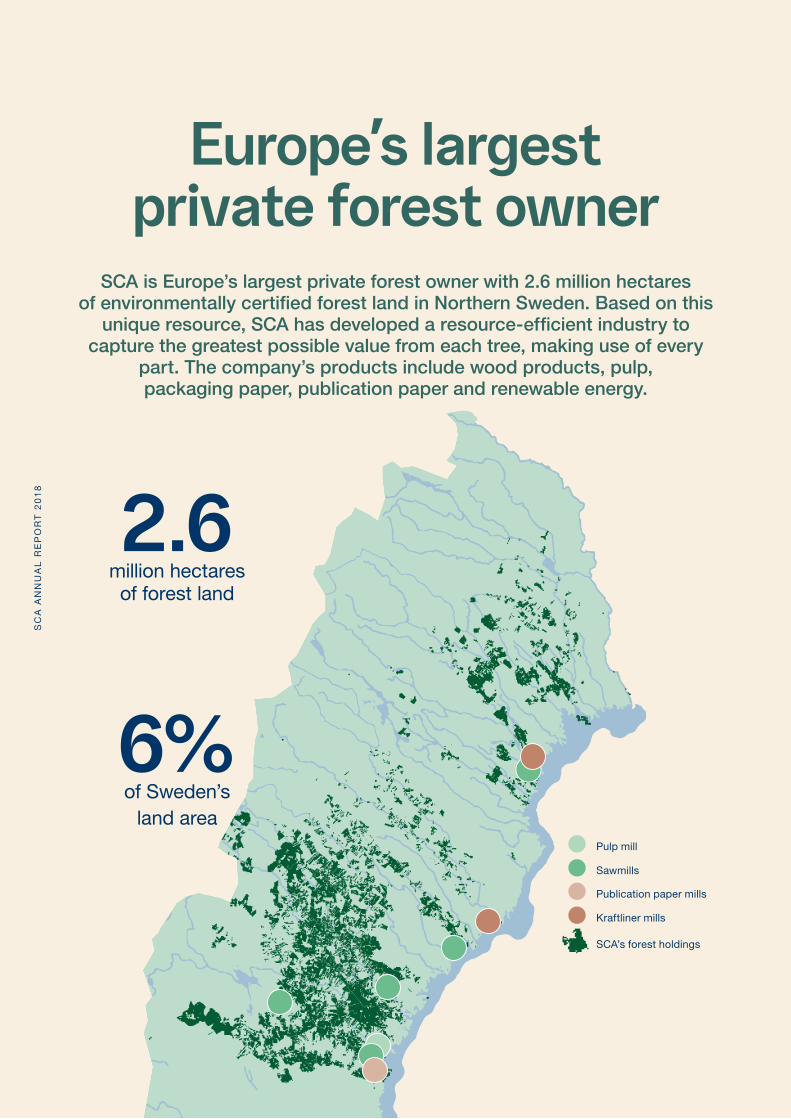
Europe’s largest private forest owner
SCA is Europe’s largest private forest owner with 2.6 million hectares of environmentally certified forest land in Northern Sweden. Based on this
unique resource, SCA has developed a resource-efficient industry to capture the greatest possible value from each tree, making use of every
part. The company’s products include wood products, pulp, packaging paper, publication paper and renewable energy.
2.6million hectares of forest land
6%of Sweden’s
land area
Publication paper mills
Pulp mill
Kraftliner mills
Sawmills
SCA’s forest holdings
SC
A A
NN
UA
L R
EP
OR
T 2
01
8
3

This is SCA
WoodSCA is one of Europe’s leading suppliers of wood-based prod-ucts for the wood industry and building materials trade, with an annual production capacity of 2.2 million m3 of solid-wood prod-ucts. SCA has five cost-efficient sawmills located close to its forest holdings in Northern Sweden, as well as wood processing and dis-tribution to the building materials trade in Scandinavia, the UK and France.
ForestSCA owns a total of 2.6 million hectares of forest in Northern Sweden, an area nearly the size of Belgium. SCA’s unique forest holding is a growing resource that provides access to high-quality forest raw materials while absorb-ing a net of 8% of Sweden’s fossil CO2 emissions.
Pulp SCA produces market pulp at Östrand pulp mill. The expansion of the mill was completed in the sum-mer of 2018. Östrand is now one of the largest and most cost-efficient production lines for softwood kraft pulp in the world. Together with chemo thermomechanical pulp production, Östrand’s annual ca-pacity amounts to 1 million tonnes. SCA’s pulp has high-strength properties, suitable for tissue and specialty paper.
Paper SCA produces kraftliner – paper for corrugated transport packaging – and publication paper for maga-zines, catalogues and commercial print. SCA is Europe’s largest inde-pendent producer of kraftliner, with a total capacity of 865,000 tonnes per year. Kraftliner is produced at the paper mills in Munksund, Piteå, and in Obbola, Umeå. Publication paper is produced at the Ortviken paper mill in Sundsvall, with a ca-pacity of 775,000 tonnes per year.
Renewable energySCA is now one of Europe’s largest producers of forest-based bio-energy, with a total production of about 9 TWh per year. In Sweden, SCA has three pellets factories that have an annual production capacity of 300,000 tonnes. SCA leases out forest land for wind power produc-tion. In 2018, 324 wind turbines were operating on SCA’s land with a total annual production capacity of 2.6 TWh. SCA also develops products for the next-generation of biofuels and green chemicals.
Introduction 3 This is SCA 4 The year at a glance 6 CEO’s message 8 Value chain 10 Forest and climate 12 Trends
Strategy and operations 14 Strategy 18 Forest 22 Wood 24 Pulp 28 Paper 30 Renewable energy 32 Logistics 34 Sustainable development 36 Fossil-free world 38 Valuable forests 40 Efficient use of resources 42 Individuals and society 44 The share and shareholders
Board of Directors’ Report 46 Board of Directors’ Report 50 Sustainability report in accordance
with Swedish Annual Accounts Act 51 Risks and risk management 55 Corporate Governance Report 62 Presentation of the Board of Directors
and Auditors 64 Presentation of the Executive
Management Team
Financial statements and notes 66 Contents 68 Consolidated statements and notes 109 Parent Company statements and notes
Sustainability facts 120 Value creation 122 Governance and materiality 124 About the Sustainability Report 126 Strategic priorities and sustainability
targets 128 Ethics and core values 131 Employees and the community 134 Product development and innovation 134 Responsible forest management 136 Climate impact and climate benefits 136 Resource management and environ-
mental impact 139 Social data 140 Environmental data
Other 142 Adoption of the annual accounts 143 Auditor’s report 146 Limited Assurance Report on the
Sustainability Report 147 GRI Index 149 Multi-year summary 150 Definitions and glossary 151 About the Annual General Meeting 151 Addresses 153 SCA in the world
Contents
3
SCA’s Annual and Sustainability report 2018 is published in Swedish and this is an English translation. If there are differences between the Swedish and the English version, the Swedish version will prevail.
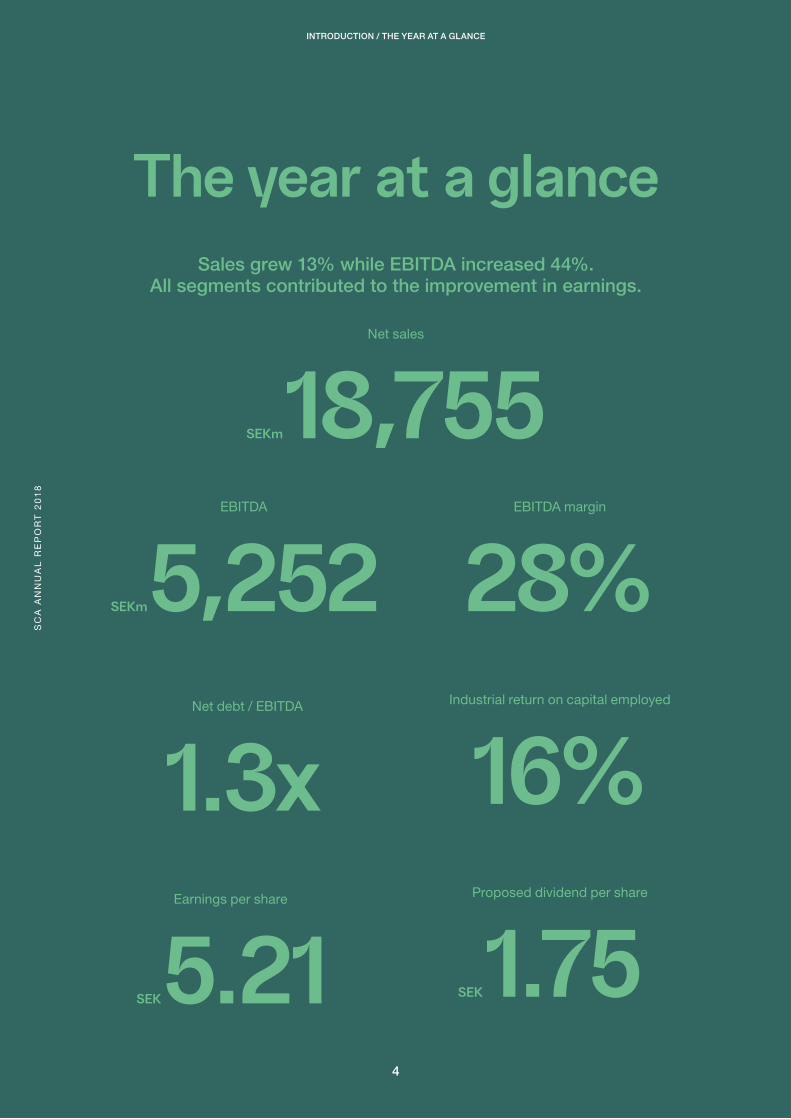
Sales grew 13% while EBITDA increased 44%. All segments contributed to the improvement in earnings.
The year at a glance
Net sales
SEKm 18,755EBITDA
SEKm 5,252 Net debt / EBITDA
1.3xEarnings per share
SEK 5.21
EBITDA margin
28%Industrial return on capital employed
16%Proposed dividend per share
SEK 1.754
SC
A A
NN
UA
L R
EP
OR
T 2
01
8INTRODUCTION / THE YEAR AT A GLANCE
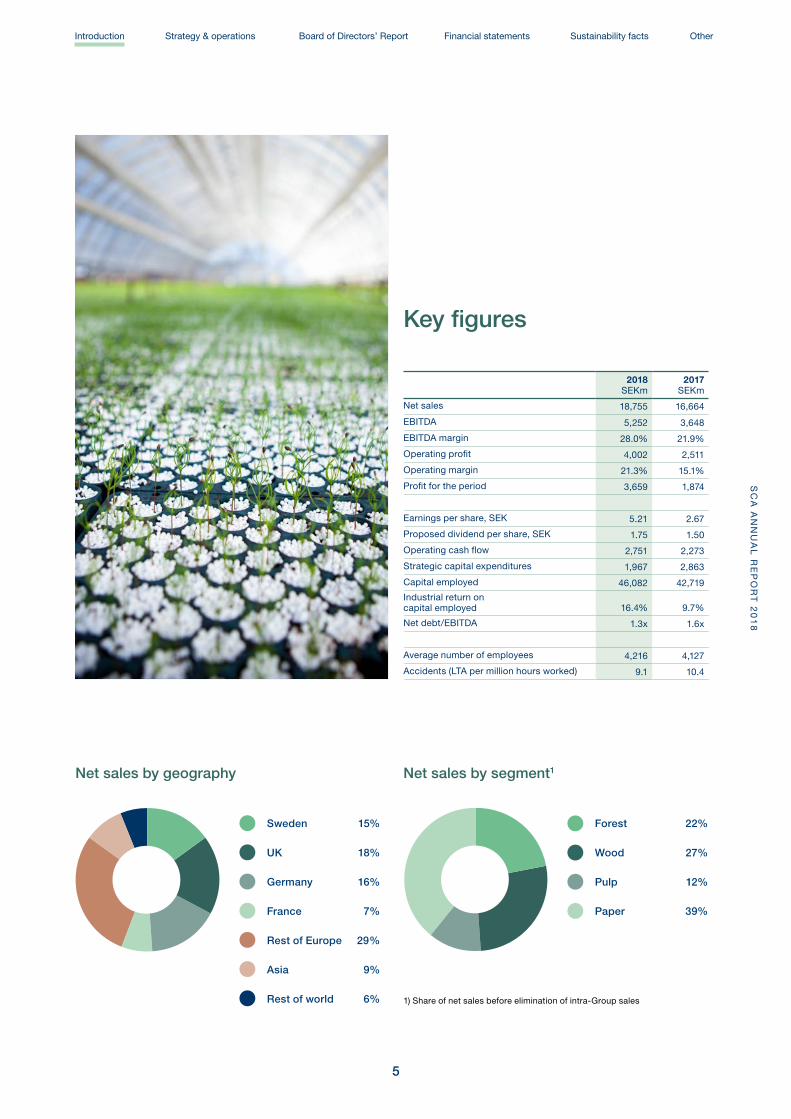
Net sales by geography
Key figures
Net sales by segment1
Sweden 15%
UK 18%
Germany 16%
France 7%
Rest of Europe 29 %
Asia 9%
Rest of world 6%
Forest 22%
Wood 27%
Pulp 12%
Paper 39%
1) Share of net sales before elimination of intra-Group sales
2018SEKm
2017SEKm
Net sales 18,755 16,664
EBITDA 5,252 3,648
EBITDA margin 28.0% 21.9%
Operating profit 4,002 2,511
Operating margin 21.3% 15.1%
Profit for the period 3,659 1,874
Earnings per share, SEK 5.21 2.67
Proposed dividend per share, SEK 1.75 1.50
Operating cash flow 2,751 2,273
Strategic capital expenditures 1,967 2,863
Capital employed 46,082 42,719
Industrial return on capital employed 16.4% 9.7%
Net debt/EBITDA 1.3x 1.6x
Average number of employees 4,216 4,127
Accidents (LTA per million hours worked) 9.1 10.4
5
SC
A A
NN
UA
L R
EP
OR
T 2
01
8Introduction Strategy & operations Board of Directors’ Report Financial statements Sustainability facts Other
The forest is the future. We create value for the climate, our employees, customers and shareholders, while also generating prosperity and employment opportunities.
A future characterized by sustainable growth
SCA’s earnings in 2018 were the best to date. Operating profit improved by nearly 60%, at the same time as we completed one of Sweden’s largest industrial projects, the expansion of the Östrand pulp mill. We have maintained good cost control and achieved a high level of production efficiency in a strong market.
Doubling pulp capacityWe have invested nearly SEK 8 billion in doubling pulp capacity, an investment financed from operating cash flow. The project was carried out safely and on schedule and budget, and the commissioning has exceeded our expectations in terms of volume and quality. We have every reason to feel proud, together with those who contributed to the success of the project – employees, suppliers and project management. Today, we can offer our customers an exceptionally strong and bright pulp, at the same time as the plant will generate about 1% of the total electricity consumed in Sweden.
Continued growthWe are preparing for continued growth. Rising population and climate change are increasing demand for products based on renewable raw materials, and the growth in e-commerce is driving demand for strong packaging. Our kraftliner, based on strong fiber from Northern Sweden, can meet customers’ require-ments for strong and sustainably manufactured packaging. This is why we are conducting a pre-project to evaluate the potential production increase of packaging paper in Obbola, in parallel with increasing the capacity for white-top kraftliner in Munksund next year.
Our next major growth area is renewable energy. Every year, 2.6 TWh of electricity is produced from wind power on SCA’s land, equivalent to 15% of total wind power production in Sweden. Within the next five years, production capacity on SCA’s land will triple.
During the year, we started a strategic partnership with the energy company St1 in order to produce liquid biofuels based on tall oil, and we are working hard with research and development to move Östrand closer to becoming a full-scale biorefinery with complementary products in biofuels and green chemicals.
Sustainability integrated in the business conceptSustainability is a natural part of SCA’s business concept. As Europe’s largest private forest owner, we produce renewable raw material in responsibly managed and certified forests. We balance consideration for biodiversity, Sami reindeer herding and other important societal concerns with a high level of production of valuable raw material for products with a low carbon footprint and for a high quality of life.
We work with climate-smart growth opportunities in all of our business areas – paper to replace plastic, wood products to replace steel and concrete, renewable energy instead of fossil fuels. SCA therefore has a crucial role to play in the transition to a sustainable society. We support the UN Global Compact and its principles.
Employees create valueMajor investments achieve nothing without motivated and skilled employees. It is employees who realize the value of the invest-ments and it is employees who create the conditions for growth. SCA works proactively to create safe workplaces with a climate of openness, characterized by solidarity and trust. Innovation, efficiency and job satisfaction thrive in such an environment.
SCA is a unique company; Europe’s largest private forest holding integrated with an industry that has one of the world’s lowest carbon footprints. Through innovations and carefully judged investments, we create value for our owners and build strong customer relationships, growth, prosperity and dynamic communities. Together, we can build the future.
Ulf Larsson, President and CEO
SC
A A
NN
UA
L R
EP
OR
T 2
01
8
6
INTRODUCTION / CEO’S MESSAGE
“We work with climate-smart growth opportunities in all
of our business areas”
7
Introduction Strategy & operations Board of Directors’ Report Financial statements Sustainability facts OtherS
CA
AN
NU
AL
RE
PO
RT
20
18
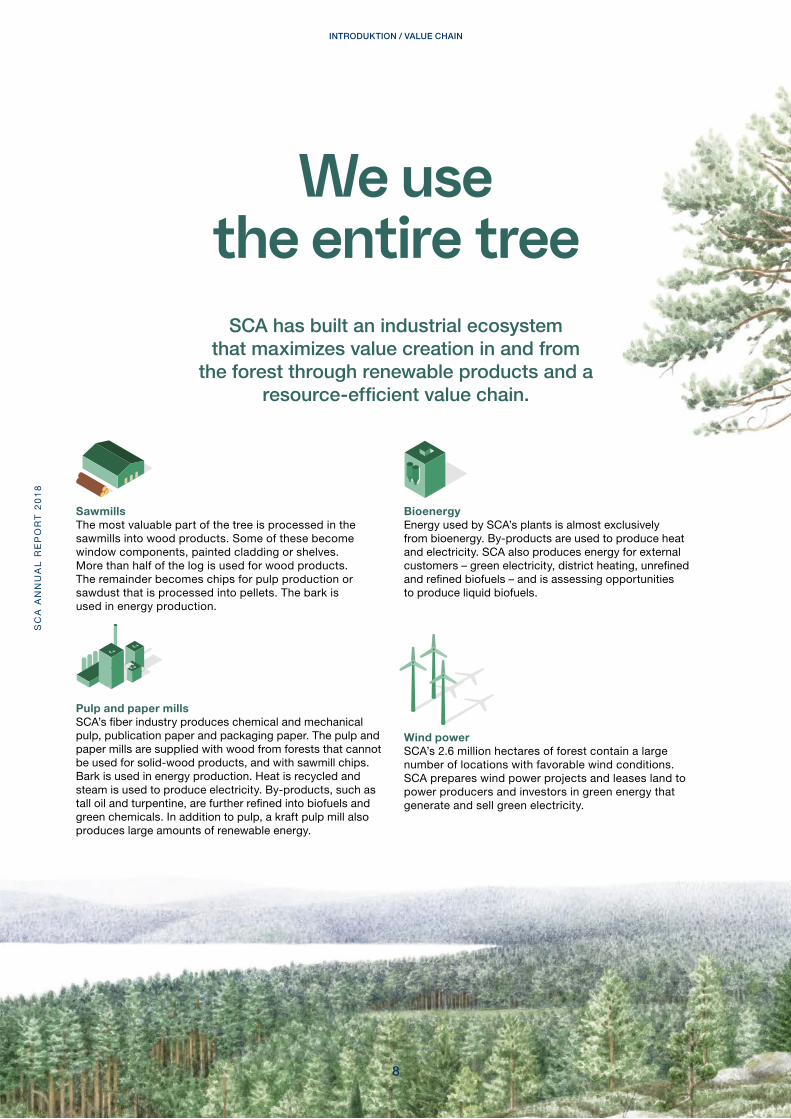
SCA has built an industrial ecosystem that maximizes value creation in and from
the forest through renewable products and a resource-efficient value chain.
SawmillsThe most valuable part of the tree is processed in the sawmills into wood products. Some of these become window components, painted cladding or shelves. More than half of the log is used for wood products. The remainder becomes chips for pulp production or sawdust that is processed into pellets. The bark is used in energy production.
Pulp and paper millsSCA’s fiber industry produces chemical and mechanical pulp, publication paper and packaging paper. The pulp and paper mills are supplied with wood from forests that cannot be used for solid-wood products, and with sawmill chips. Bark is used in energy production. Heat is recycled and steam is used to produce electricity. By-products, such as tall oil and turpentine, are further refined into biofuels and green chemicals. In addition to pulp, a kraft pulp mill also produces large amounts of renewable energy.
Wind powerSCA’s 2.6 million hectares of forest contain a large number of locations with favorable wind conditions. SCA prepares wind power projects and leases land to power producers and investors in green energy that generate and sell green electricity.
BioenergyEnergy used by SCA’s plants is almost exclusively from bioenergy. By-products are used to produce heat and electricity. SCA also produces energy for external customers – green electricity, district heating, unrefined and refined biofuels – and is assessing opportunities to produce liquid biofuels.
We usethe entire tree
SC
A A
NN
UA
L R
EP
OR
T 2
01
8
8
INTRODUKTION / VALUE CHAIN
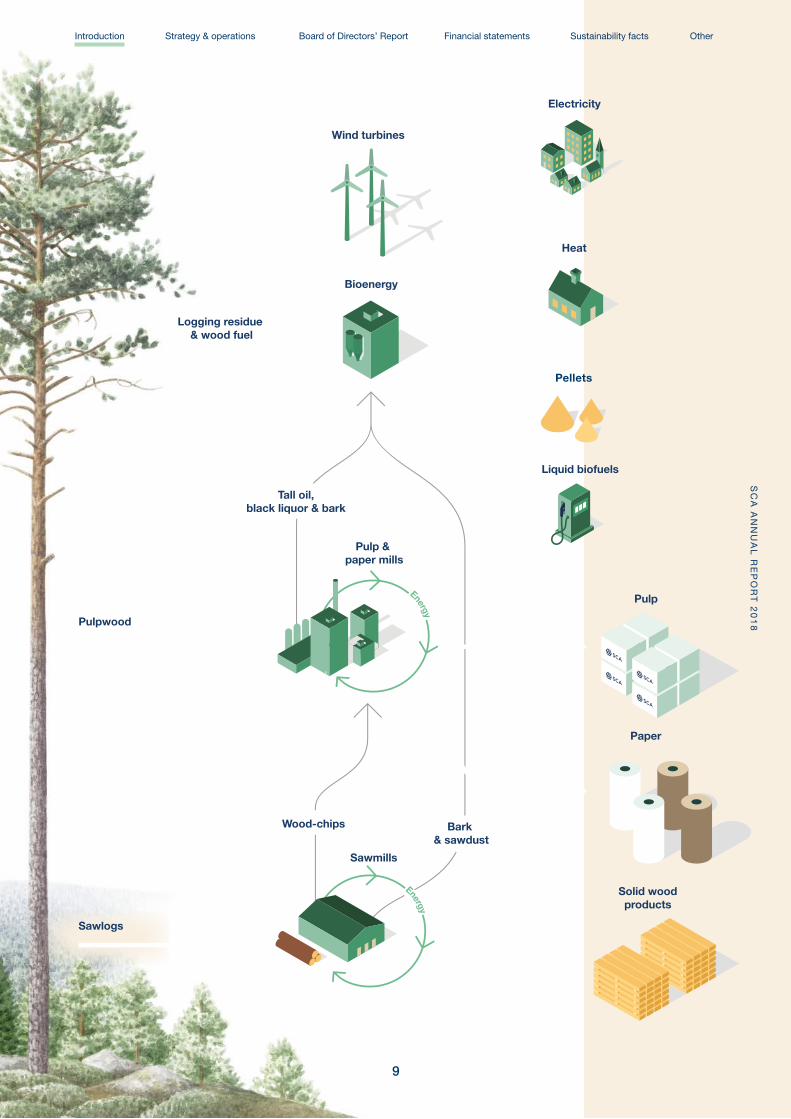
SCA has built an industrial ecosystem that maximizes value creation in and from
the forest through renewable products and a resource-efficient value chain.
Wind turbines
Electricity
Heat
Bioenergy
Logging residue & wood fuel
Pulpwood
Tall oil,black liquor & bark
Pulp & paper mills
Energy
Energy
Wood-chips
Sawmills
Bark & sawdust
Sawlogs
Pulp
Paper
Liquid biofuels
Solid woodproducts
9
SC
A A
NN
UA
L R
EP
OR
T 2
01
8Introduction Strategy & operations Board of Directors’ Report Financial statements Sustainability facts Other

SCA’s contribution toa fossil-free society
Binds, net
4Mt CO2
Growing forests capture and bind CO2 – active forest management increases growth
by focusing on improved seedlings, active silviculture, contorta pine
and fertilization
Fertilization
Contorta pine
Active silviculture
Improvedseedlings
1
SC
A A
NN
UA
L R
EP
OR
T 2
01
8
10
INTRODUCTION / FOREST AND CLIMATE
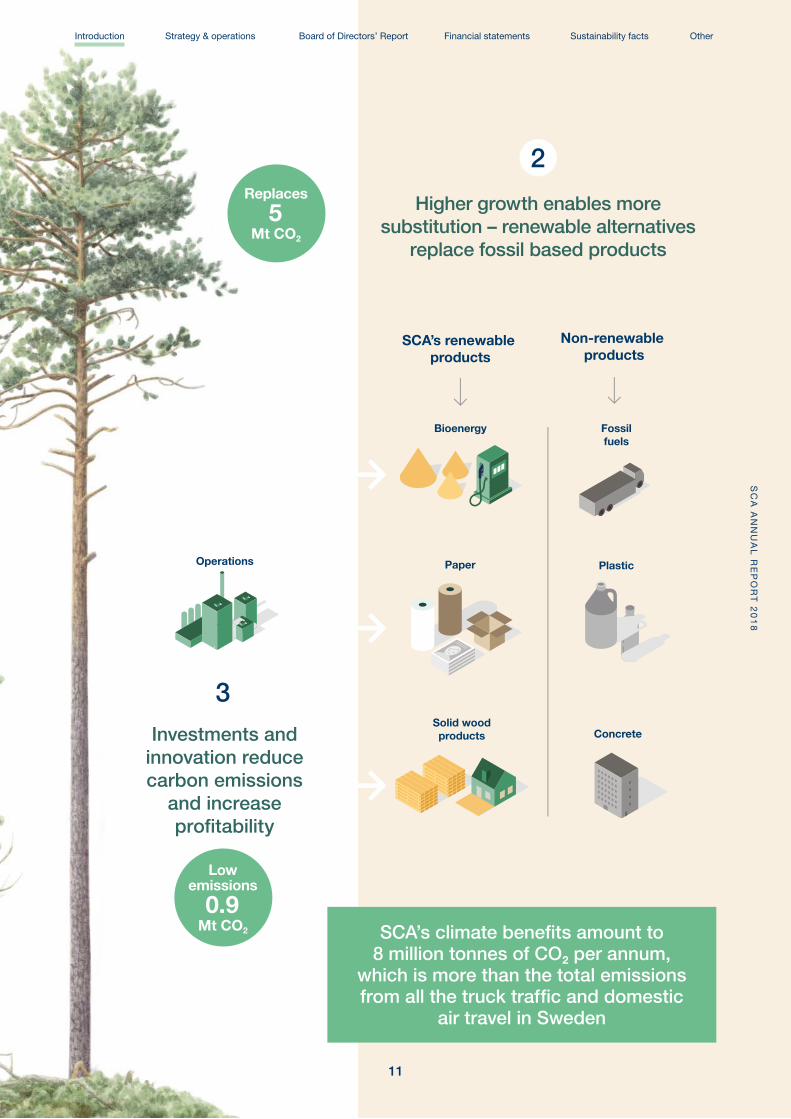
SCA’s renewable products
Non-renewable products
Bioenergy Fossilfuels
Plastic
ConcreteSolid woodproducts
PaperOperations
Higher growth enables more substitution – renewable alternatives
replace fossil based products
Investments andinnovation reducecarbon emissions
and increaseprofitability
SCA’s climate benefits amount to 8 million tonnes of CO2 per annum,
which is more than the total emissions from all the truck traffic and domestic
air travel in Sweden
Lowemissions
0.9Mt CO2
Replaces
5Mt CO2
2
3
11
SC
A A
NN
UA
L R
EP
OR
T 2
01
8Introduction Strategy & operations Board of Directors’ Report Financial statements Sustainability facts Other

Globalization, economic development, a growing population and the realization that we must shift from finite resources to renewable alternatives, all reflect the importance of the forest
as a strategic resource.
Global trends favor renewable materials
SC
A A
NN
UA
L R
EP
OR
T 2
01
8
12
INTRODUCTION / TRENDS

1. Increased awareness of sustainabilityThe UN’s 17 Sustainable Development Goals were adopted by member countries in 2015. At the COP 21 climate confer-ence in Paris the same year, world leaders reached an agreement to limit global warming to below 2 degrees Celsius. Information and increased knowledge is increasing awareness among consumers and more people are interested in finding renewable alternatives.
2. Increased demand for renew-able materials and productsThe transition to a sustainable and carbon-neutral society is driving demand for renewable materials and products manu-factured in a responsible and resource-efficient manner. Population growth and increased consumption require new climate-smart products. The forest industry has a crucial role to play in this transition. Products from the forest are replacing fossil based products – plastic packaging is being replaced by paper packaging, fossil fuels are being replaced by bio-fuels and wood is replacing steel and concrete.
3. More packaged goodsMega trends, such as globalization, urbanization, population growth and a growing middle class, are driving demand for packaging paper. Consumption and thus demand for pack-aging increases as living standards improve for more people. Increasing trade volumes lead to rising demand for transport packaging.
4. E-commerceGrowth in e-commerce is increasing demand for packaging material. A typical corrugated board box may require up to 50% more packaging material in e-commerce compared with tradi-tional retail. At the same time, the market is interested in new, more compact packaging solutions and in more frequent deliver-ies. Distribution directly to customers imposes greater demands on higher packaging quality and printable surfaces. Product returns further increase demand and quality requirements.
5. Growing demandfor fresh fiberGrowing interest in paper-based products and the deterio-rating quality of recovered fiber increases demand for fresh fiber. Fresh fiber provides paper products that are strong and pure. Each time fibers are recycled, the fiber volume and quality deteriorate. The system therefore needs to be continuously replenished with fresh fiber. E-commerce and retail-ready packaging, which can be displayed directly in stores, increase the need for high-quality packaging. Higher food safety standards increase demand for fresh fiber-based products that do not contain chemical residues.
SC
A A
NN
UA
L R
EP
OR
T 2
01
8Introduction Strategy & operations Board of Directors’ Report Financial statements Sustainability facts Other
13

The forest is a renewable resource which grows and forms the core of SCA’s operations. Around the forest SCA has built a well-invested and efficient value chain,
creating growth and maximizing the value of each tree.
Strategy for profitable growth
The forest is a resource that provides stable profit-ability and increase in value. Active and sustainable forestry maximizes growth in the forest. The forest growth rate is about 4%. Today, SCA only harvests
approximately 60% of the growth, which in-creases the standing volume and future
cash flow.
Growing forest asset
Around the growing forest resource, SCA has built a well-invested and efficient value chain that maximizes the value of each tree. SCA’s invest-
ments help to strengthen the integrated value chain and to achieve favorable returns, at the same time as the company maintains
a healthy balance sheet.
Increased value from each tree
SC
A A
NN
UA
L R
EP
OR
T 2
01
8
14
STRATEGY AND OPERATIONS / STRATEGY
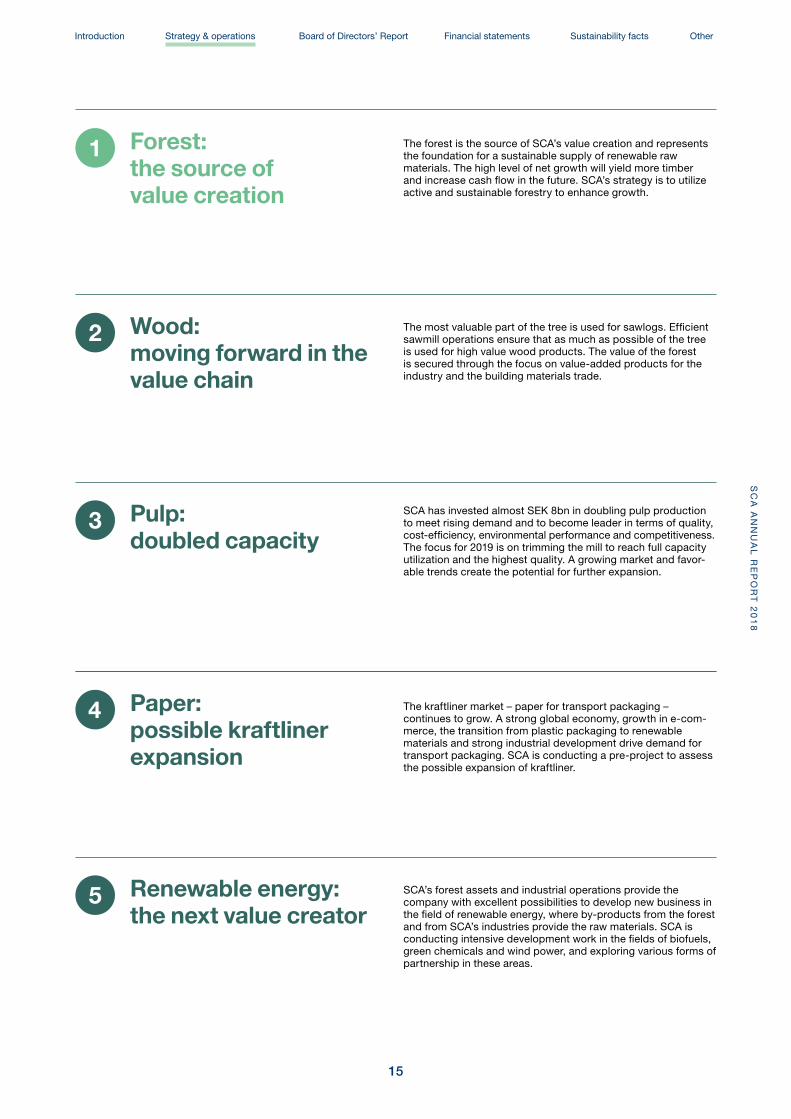
The forest is the source of SCA’s value creation and represents the foundation for a sustainable supply of renewable raw materials. The high level of net growth will yield more timber and increase cash flow in the future. SCA’s strategy is to utilize active and sustainable forestry to enhance growth.
SCA has invested almost SEK 8bn in doubling pulp production to meet rising demand and to become leader in terms of quality, cost-efficiency, environmental performance and competitiveness. The focus for 2019 is on trimming the mill to reach full capacity utilization and the highest quality. A growing market and favor-able trends create the potential for further expansion.
Forest: the source of value creation
1
The kraftliner market – paper for transport packaging – continues to grow. A strong global economy, growth in e-com-merce, the transition from plastic packaging to renewable materials and strong industrial development drive demand for transport packaging. SCA is conducting a pre-project to assess the possible expansion of kraftliner.
Paper:possible kraftliner expansion
4
Pulp:doubled capacity
3
SCA’s forest assets and industrial operations provide the company with excellent possibilities to develop new business in the field of renewable energy, where by-products from the forest and from SCA’s industries provide the raw materials. SCA is conducting intensive development work in the fields of biofuels, green chemicals and wind power, and exploring various forms of partnership in these areas.
Renewable energy: the next value creator
5
The most valuable part of the tree is used for sawlogs. Efficient sawmill operations ensure that as much as possible of the tree is used for high value wood products. The value of the forest is secured through the focus on value-added products for the industry and the building materials trade.
Wood: moving forward in the value chain
2
15
SC
A A
NN
UA
L R
EP
OR
T 2
01
8Board of Directors’ Report Financial statements Sustainability facts OtherIntroduction Strategy & operations

Value
Doubled pulp production
at Östrand
2015 2018
• Investment: SEK 8bn
• Began operating in June 2018
Increase the share of white-top
kraftliner
• Investment: SEK 200m
• Result: +50 kt of white-top kraftliner
• Expected start-up in summer 2019
2018 2019
5.0 TWh wind power on
SCA’s land
• Wind power on SCA land is expected to increase to 6.7 TWh in 2021
• The goal of 5 TWh by 2020 is therefore expected to be achieved
• New long-term goal: 11 TWh
2020
SCA has a development plan for each operation. Investment opportunities are continuously evaluated based on a number of criteria.
Investments must contribute to SCA’s value chain and the continued value creation in and from SCA’s forest re-source. Projects must also provide favorable returns and ensure that the company retains its healthy balance sheet.
Strong project portfolio driving profitable
growth
SC
A A
NN
UA
L R
EP
OR
T 2
01
8
16
STRATEGY AND OPERATIONS / STRATEGY
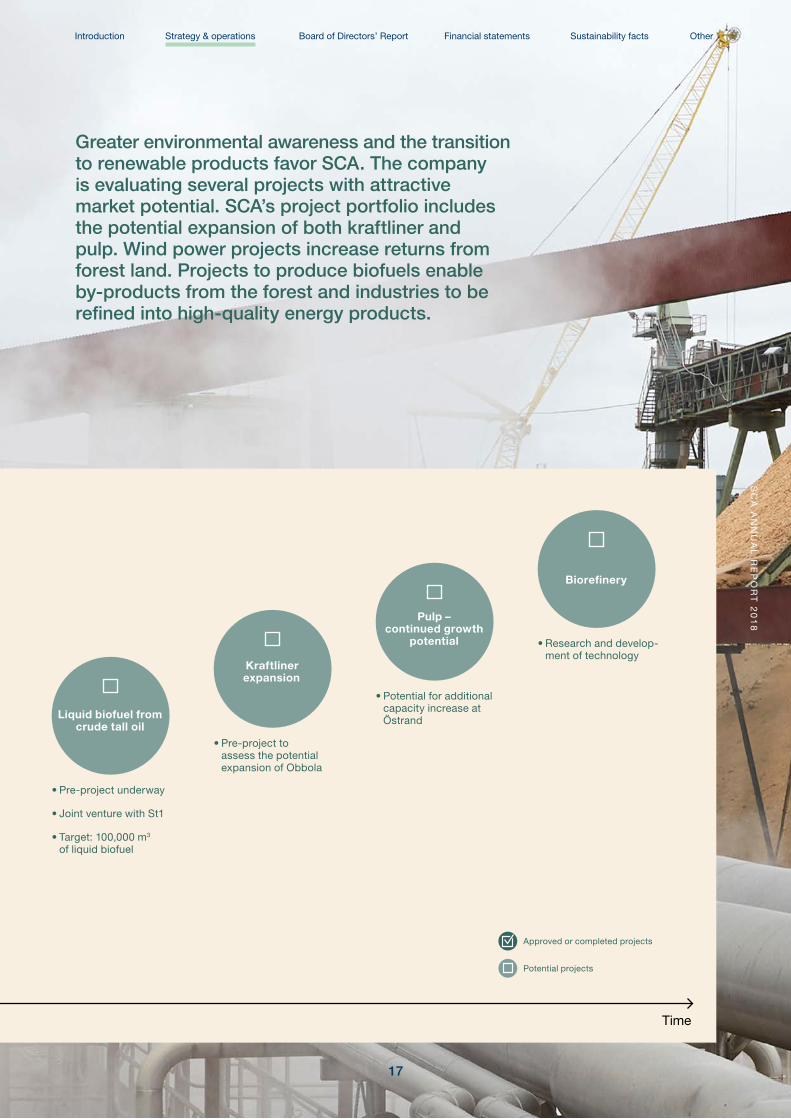
Greater environmental awareness and the transition to renewable products favor SCA. The company is evaluating several projects with attractive market potential. SCA’s project portfolio includes the potential expansion of both kraftliner and pulp. Wind power projects increase returns from forest land. Projects to produce biofuels enable by-products from the forest and industries to be refined into high-quality energy products.
Time
Pulp – continued growth
potential
• Potential for additional capacity increase at Östrand
Biorefinery
• Research and develop-ment of technology
Liquid biofuel from crude tall oil
• Pre-project underway
• Joint venture with St1
• Target: 100,000 m3 of liquid biofuel
Kraftliner expansion
• Pre-project to assess the potential expansion of Obbola
Approved or completed projects
Potential projects
17
Board of Directors’ Report Financial statements Sustainability facts OtherS
CA
AN
NU
AL
RE
PO
RT
20
18
Introduction Strategy & operations

The forest is the source of SCA’s value creation. With a forest holding of 2.6 million hectares, an area almost the size of Belgium, SCA is the
largest private forest owner in Europe. The forest is managed responsibly and sustainably to provide the foundation for a sustainable supply of raw
materials to the company’s industries.
Growing forest asset yields more timber
in the future
FOREST
The forest is at the core of SCA’s operationsThe forest is managed sustainably and creates value in three ways:
• Cash flow. Harvesting provides raw materials to the industries and generates cash flow. The harvesting volume is deter-mined so it never exceeds future growth and is therefore never reduced. This sustainable strategy and improved approach to forest management has enabled an increase in harvesting volume of approximately 120% since 1950.
• The forest is growing. Forest growth exceeds harvesting by 3 million cubic meters per year. Standing volume, which is the volume of the growing trees, has increased by about 60% since 1950. The larger standing volume allows for a higher level of harvesting and an increase in cash flow going forward.
• Increase in the value of forest land. The value of forest land in Sweden has risen by more than 260% in real terms and 6,000% in nominal terms since 1950, according to an estimate by Lantmäteriet.
Improved forest management increases growth
Every tree that is harvested is replaced with at least two new. SCA has the largest tree nursery in the world with a capacity to produce 100 million seedlings per year. Through its use of im-proved forest management methods – site preparation, planting, control of reforestation and pre-commercial thinning – SCA has increased growth in the forest.
• Improved seedlings. By using selective breeding, SCA has developed the next generation of seedlings with 20-25% higher growth rates and better protection against pests.
• Contorta pine is a tree species from northern North Amer-ica with growth and CO2 absorption of around 40% higher compared with Swedish pine trees. Contorta pine is also less affected by damage from grazing and fungus. SCA has planted contorta pine since the early 1970s. The species provides excellent raw materials for pulp production, but also has suit-able characteristics for use as raw material for wood products.
• Fertilizing forest that is nearing harvesting accelerates growth and yields a significant addition in volume of high-quality timber. Among forest management practises, fertilization is the one that has the fastest effect and highest returns.
Young forest yields high growthThrough its ambitious silvicultural practices, SCA has obtained a high proportion of young forest with high growth. As a result of the young average age of the forest, only approximately 60% of growth is harvested. When the younger forests reach harvest-able age in a decade or two, the rate of harvesting can increase. SCA’s forest is growing by an average of 9.5 million forest cubic meters per year. Of this, 5.2 million cubic meters is harvested. 1.3 million cubic meters disappear as natural losses, for exam-ple felled by storms, insect damage or pre-commercial thinning. The remaining net annual growth is 3.0 million cubic meters, which increases the standing volume and harvesting potential in the future.
Growth in SCA’s forest in 2018¹ m3fo %
Opening volume, 2018 232 million
Gross forest growth 9.5 million +4.1%
Natural losses and pre-commercial thinning –1.3 million –0.6%
Available growth 8.2 million +3.5%
Annual harvesting –5.2 million –2.2%
Net forest growth 3.0 million +1.3%
Closing volume, 2018 235 million
1) Estimated timber volume and growth based on the forest survey performed between 2012 and 2013. A new forest survey is expected to be started in 2019.
+3.0 net forest growth in 2018
(million m3fo)
SC
A A
NN
UA
L R
EP
OR
T 2
01
8
18
STRATEGY AND OPERATIONS / FOREST
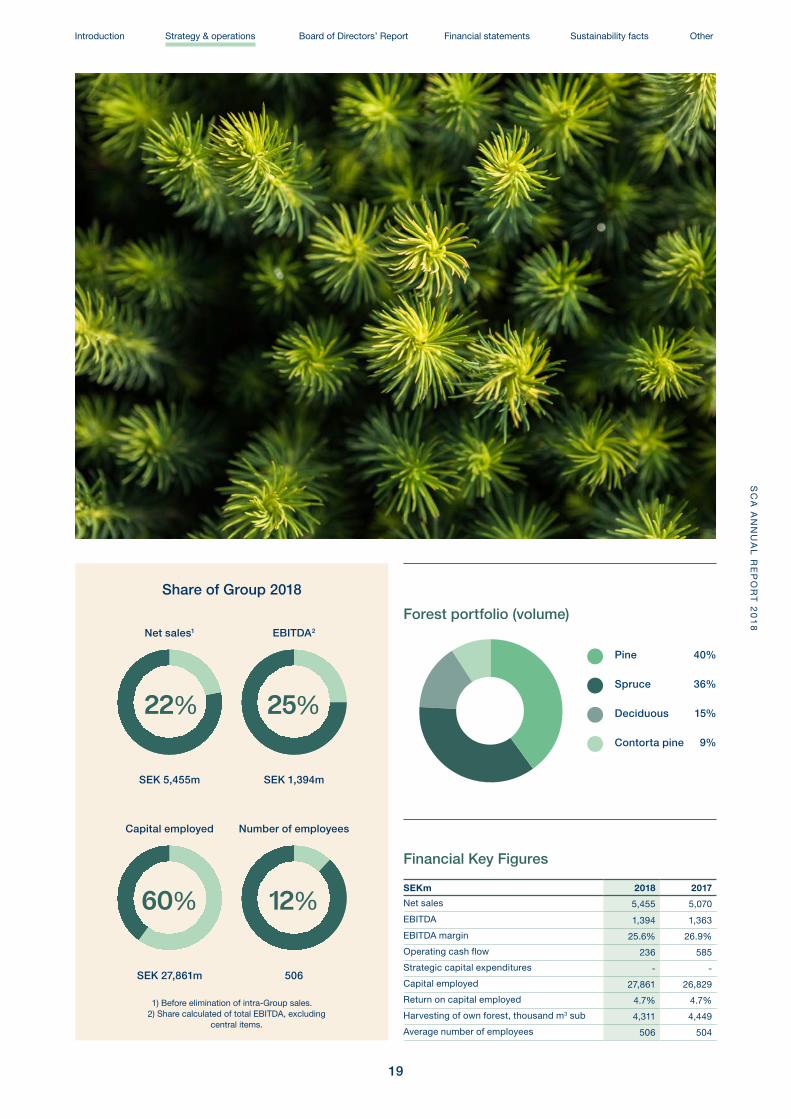
Net sales1
Capital employed
EBITDA2
Number of employees
SEK 5,455m
SEK 27,861m
SEK 1,394m
506
1) Before elimination of intra-Group sales. 2) Share calculated of total EBITDA, excluding
central items.
22%
60%
25%
12%
Share of Group 2018
Financial Key Figures
SEKm 2018 2017
Net sales 5,455 5,070
EBITDA 1,394 1,363
EBITDA margin 25.6% 26.9%
Operating cash flow 236 585
Strategic capital expenditures - -
Capital employed 27,861 26,829
Return on capital employed 4.7% 4.7%
Harvesting of own forest, thousand m3 sub 4,311 4,449
Average number of employees 506 504
Forest portfolio (volume)
Pine 40%
Spruce 36%
Deciduous 15%
Contorta pine 9%
19
SC
A A
NN
UA
L R
EP
OR
T 2
01
8Board of Directors’ Report Financial statements Sustainability facts OtherStrategy & operationsIntroduction

Europe’s largest private forest holding secures raw material supply
SCA owns 2.6 million hectares of forest land, of which 2.0 million hectares are productive forest land.
About 50% of SCA’s raw material needs are provided by wood from the Group’s own forests. The large forest holding provides a reliable supply of raw material, facilitates investments and allows greater flexibility. An abnormally high level of snow fall occurred along the coast of Northern Sweden during the winter of 2018, and thanks to its own forests, SCA could re-deploy harvesting further inland where the depth of snow was at more normal levels. The summer of 2018 was dry, and the risk of fire was high. SCA addressed this by concentrating its harvesting to areas with a lower risk of fire. Because of these measures, SCA could maintain the raw material supply to industry in 2018 without disruptions.
Most of the timber that does not come from SCA’s own forest is purchased from private forest owners in Northern Sweden. With its harvesting and forest management organiza tion that covers the four northernmost counties, SCA is an attractive partner for forest owners seeking access to highly competent people and well-suited machines to manage their own forests. Through its competitive industry, SCA secures demand and value also for other forest owners. Moreover, SCA’s expertise and resources used in its own forests benefit other forest owners.
Timber purchasing from private forest owners is supplemented by purchasing from other forest companies in Sweden and some imports, mainly from the Nordic countries and the Baltic States.
Responsible forestrySCA’s forests are managed sustainably with the aim that they will remain at least as rich in biodiversity, nature experiences and raw material in the future as they are today. Preserving biodiversity, the many species of animals and plants, is one of the most important sustainability targets of SCA’s forestry. Forest areas of high conservation value are set aside from forest management or managed in a way to strengthen the conserva-tion values. Forest is saved in all forestry measures to provide variation and life environments for sensitive animal and plant species.
SCA’s forest has been certified since 1999 in accordance with the requirements of the Forest Stewardship Council® (FSC®) (FSC® C004466) and since 2011 also certified in accordance with the Programme for the Endorsement of Forest Certification (PEFC™). Independent auditors verify that SCA’s forest opera-tions fulfill the certification requirements. Products based on timber from certified forestry can in turn be certified and offered to customers with stringent demands on sustainability. SCA also encourages its suppliers to certify their forest operations.
Growing trees capture and bind carbon dioxide. SCA’s forest has an annual net growth of three million forest cubic meters of timber, which means the forest binds a net of four million tonnes
of CO2. This is four times more than the total CO2 emissions from fossil based sources in all of SCA’s operations, including the forest operations, industrial production and transportation of raw materials and finished products, as well as input goods.
Valuing forest land
Accounting valuationIn accordance with applicable accounting standards (IFRS), forest land must be divided into two components, the actual land and the forest growing on the land.
The land is valued in accordance with IAS 16 (Property, Plant and Equipment) essentially at acquisition cost and is not depreciated. In addition to acquisition cost, there are invest-ments, primarily forest roads, which are depreciated. The value of the forest land and land improvements in SCA amounted to SEK 1,692m at the end of 2018.
The growing forest on the land is valued in accordance with IAS 41 (Biological Assets) at fair value. SCA has, along with other major forest companies in Sweden, opted to value the growing forest at a discounted present value of the estimated sales revenue with deductions for harvesting costs.
Using this model, the recognized value of growing forest at SCA amounted to SEK 32,065m at the end of 2018. This value corresponds to approximately SEK 136 per m3fo standing timber. The value of the forest, including the land (valued in accordance with IAS 16), amounted to SEK 33,757m, corre-sponding to approximately SEK 144 per m3fo standing timber.
Strategy
• Maximize growth and long-term harvesting potential
• Preserve the forest’s biodiversity and contribute to a positive impact on the climate
• Increase the forest holding
SC
A A
NN
UA
L R
EP
OR
T 2
01
8
20
STRATEGY AND OPERATIONS / FOREST
Market valuesNormally, the market for purchasing and divesting forest land consists of land including the value of the standing forest on the land. In other words, the value is the total of that which is referred to in accounting as forest land and biological assets.
SCA’s own transactions provide an indication of the market value of forest land. These transactions, while limited in extent, are conducted on a regular basis. The aim is to improve consoli-dation, meaning the creation of larger connected areas of forest land, and to increase the share of forest land close to SCA’s industries. Prevailing law in Sweden prohibits SCA from the net purchase of forest land from private individuals, which impacts the number of transactions but does not normally impact the market prices.
SCA’s purchase of forest land in the past five years is shown in the table to the right. On average during the period, SCA purchased forest land, including standing timber, for an average price of SEK 266 per m3fo. The divestment of forest land during the same period was conducted for an average price of SEK 305 per m3fo.
Market statistics are also available for forest land transactions. Here, transactions also refer to both forest land and the standing timber on the land. One of the major providers of market statis-tics for forest land is LRF Konsult. According to LRF Konsult, the average price for forest land in SCA’s region, Northern Sweden, was approximately SEK 269 m3fo standing timber in 2018.
Purchase 2014 2015 2016 2017 2018
Volume (thousand m3fo) 1,655 185 123 261 197
Price (SEK/m3fo) 264 273 263 259 286
Divestment 2014 2015 2016 2017 2018
Volume (thousand m3fo) 1,405 270 176 385 192
Price (SEK/m3fo) 322 310 274 270 268
Forest land prices in Northern Sweden 2014 2015 2016 2017 2018
Price (SEK/m3fo) 261 259 252 278 269
Purchases and divestments of forest land
Market statistics according to LRF Konsult
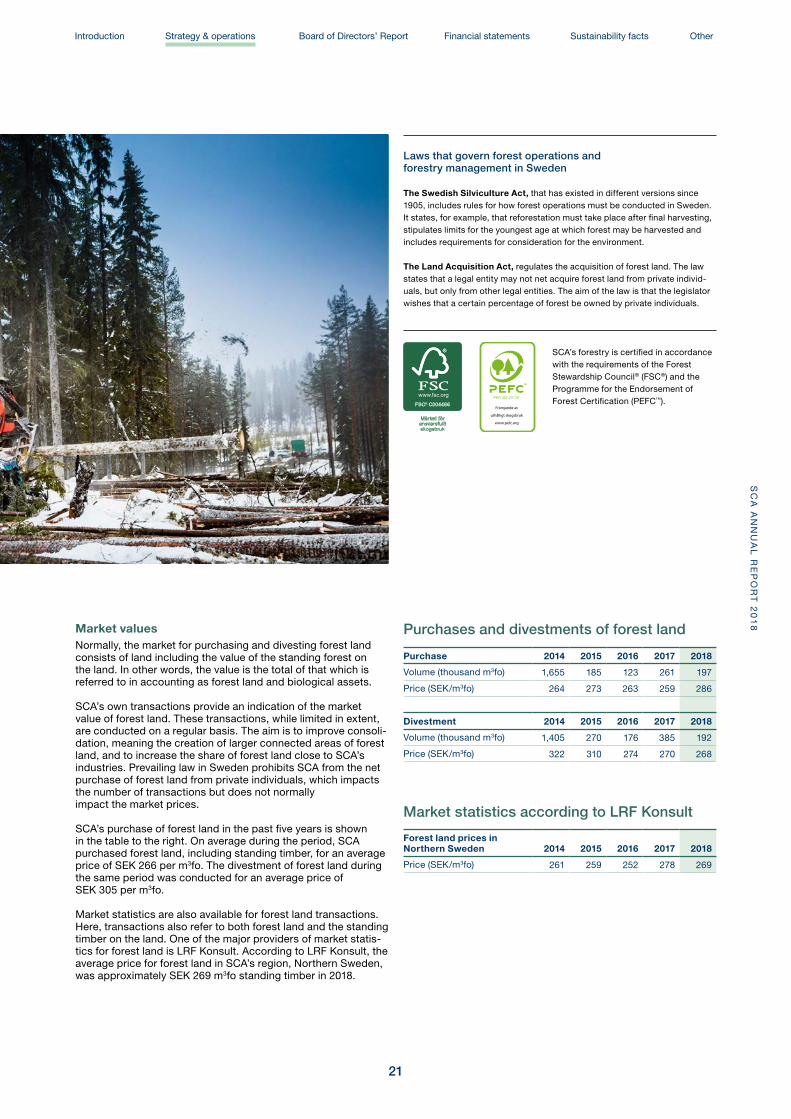
The Swedish Silviculture Act, that has existed in different versions since 1905, includes rules for how forest operations must be conducted in Sweden. It states, for example, that reforestation must take place after final harvesting, stipulates limits for the youngest age at which forest may be harvested and includes requirements for consideration for the environment.
The Land Acquisition Act, regulates the acquisition of forest land. The law states that a legal entity may not net acquire forest land from private individ-uals, but only from other legal entities. The aim of the law is that the legislator wishes that a certain percentage of forest be owned by private individuals.
Laws that govern forest operations and forestry management in Sweden
PEFC/05-23-131
Främjande av
uthålligt skogsbruk
www.pefc.org
SCA’s forestry is certified in accordance with the requirements of the Forest Stewardship Council® (FSC®) and the Programme for the Endorsement of Forest Certification (PEFC™).
21
SC
A A
NN
UA
L R
EP
OR
T 2
01
8Board of Directors’ Report Financial statements Sustainability facts OtherIntroduction Strategy & operations

SCA manufactures processed wood products for the European building materials trade, and for wood industries around the world. The solid wood operations have delivered profitable
growth averaging about 10% per year over the past 20 years.
Efficient sawmill operations with 20 years
of profitable growth
Modern and efficient sawmillsSCA operates five sawmills closely connected to the forest raw material base, as well as processing facilities in Sweden, the UK and France. The sawmills are well-invested and are among the largest in Europe with an annual capacity of 2.2 million m3 solid-wood products. They have a high degree of automation and use x-ray technology to maximize the yield from every log. The technology means the sawmills can sort, select and adjust the log to suit the requirements of the end product.
Profitable growth with a focus on value-added products
The slow-growing wood from Northern Sweden has a high proportion of heartwood and small knots, making it suitable for visible wood applications and for interior use. SCA has chosen to focus on two customer segments that suit these characteris-tics and that offer the best prospects for profitable growth.
• Wood industry. As supplier to the wood processing industry, SCA manufactures customized products and components suit-able for further processing by customers. Customers are mainly manufacturers of furniture, doors, windows, flooring and roofs.
• Building materials trade. For the building materials trade, SCA delivers processed products, ready to be offered to consumers, and advanced distribution solutions. SCA com-bines its own products with purchases from other suppliers in order to offer a complete range of products. Customers mainly include building materials chains in Scandinavia, the UK and France and the products are used by both professionals and by DIY enthusiasts.
This focus has enabled SCA to achieve higher and more stable margins over a business cycle and it has delivered profitable growth of about 10% per year over the past 20 years.
Innovative solutionsThe building materials trade is interested in innovative products that drive sales growth. Thanks to high-quality raw materials, x-ray technology and process control, SCA can offer its custom-ers products such as heart pine decking. This is as resilient as pressure-impregnated timber, but is manufactured without the use of chemicals. Another new product in the building materials industry is SCA’s semi-finished cladding with concealed fittings, which provid a more attractive façade, easier assembly and greater sustainability.
Growing marketGlobal demand is on the increase for renewable materials as is interest in constructing housing in wood. Demand for wood products has noted annual growth of between 2% and 3% in recent years. 2018 was marked by strong demand in all of SCA’s key markets. This growth was fueled by a favorable level of construction activity and an expanding renovation market, resulting in higher prices for SCA’s wood products.
Strategy
• Strengthen SCA’s integrated value chain – sawlogs give the largest revenue from a tree
• Continued profitable growth through:
– Value-added and customized products
– Volume growth in Bollsta and Tunadal
• Production optimization to achieve the highest level of efficiency
WOOD
SC
A A
NN
UA
L R
EP
OR
T 2
01
8
22
STRATEGY AND OPERATIONS / WOOD

Munksund, PiteåCapacity: 420,000 m3/year
Rundvik, Nordmaling Capacity: 330,000 m3/year
Bollsta, Kramfors Capacity: 560,000 m3/year
Tunadal, Sundsvall Capacity: 540,000 m3/year
Gällö (co-owned), Bräcke Capacity: 330,000 m3/year
Wood processing and distributionPlaned products capacity: 600,000 m3/year Window component capacity: 5 million linear meters/year Distribution to building materials trade in Scandinavia, the UK and France.
Sawmills
Net sales1
Capital employed
EBITDA2
Number of employees
SEK 6,618m
SEK 3,216m
SEK 904m
1,294
1) Before elimination of intra-Group sales. 2) Share calculated of total EBITDA, excluding
central items.
27%
7%
17%
31%
Share of Group 2018
Financial key figures
SEKm 2018 2017
Net sales 6,618 5,994
EBITDA 904 670
EBITDA margin 13.7% 11.2%
Operating cash flow 460 399
Strategic capital expenditures 2 28
Capital employed 3,216 2,817
Return on capital employed 22.0% 15.7%
Deliveries, wood products, thousand m3 2,520 2,595
Average number of employees 1,294 1,242
23
SC
A A
NN
UA
L R
EP
OR
T 2
01
8Board of Directors’ Report Financial statements Sustainability facts OtherIntroduction Strategy & operations

Doubled production capacity
Following one of Sweden’s largest industrial investments, the production capacity at the Östrand pulp mill has doubled. The plant has become industry-leading in terms of quality,
cost efficiency and environmental performance.
Investment to double capacity and increase competitiveness
The expanded Östrand mill began operating, as planned, in June 2018. The investment of almost SEK 8bn doubled the annual production capacity of bleached softwood kraft pulp (NBSK) from 430,000 tonnes to about 900,000 tonnes. According to the planned start-up curve, production capacity is expected to gradually increase up to the end of 2019. To date, production at the plant is in line with plan. A good level of production and high quality in terms of purity, brightness and strength was achieved at an early stage.
At full capacity utilization, Östrand’s cash costs are expected to decrease by about SEK 350 per tonne relative to cost before the expansion, mainly due to lower indirect costs. This places Östrand in the top quartile of the cost curve for the world’s bleached softwood kraft pulp producers.
The investment has increased energy efficiency at Östrand. The mill will use its own energy production to cover its entire heating and electricity needs and also sell about 0.5 TWh of green electricity to the grid and 0.18 TWh of heat to the district heating systems in Sundsvall and Timrå.
In addition to the production of bleached softwood kraft pulp for use in tissue and packaging paper, the Östrand plant also produces approximately 100,000 tonnes of chemically pre- treated mechanical pulp (CTMP) for purposes such as hygiene products and packaging.
Sales were focused on Europe in 2018. The future market focus will be enlarged geographically due to the expanded pulp mill, including sales volumes to North America.
Strong demand and expanding marketThe expanded Östrand pulp mill started in a favorable market climate. Demand for bleached softwood kraft pulp has grown by about 2% to 3% per year. This growth is fueled by an expanding global market for tissue and packaging. Demand for tissue has risen in particular in China, with its population growth, urbaniza-tion and growing middle class. China’s pulp consumption is to a large extent based on imports, as the country has a very limited domestic pulp industry. A limited supply of recovered fiber has further increased demand for pulp based on fresh fiber.
Potential for additional capacity increaseThe focus for 2019 is on the continued trimming of the mill to reach full capacity utilization and the highest quality. A strong market and favorable trends create the potential for further expansion, by removing bottlenecks and through minor supple-mentary investments.
Strategy
• Reach full production and quality
• Improve processes and eliminate bottlenecks to further increase capacity
• Take advantage of the potential for green energy offered by the new plant
PULP
SC
A A
NN
UA
L R
EP
OR
T 2
01
8
24
STRATEGY AND OPERATIONS / PULP
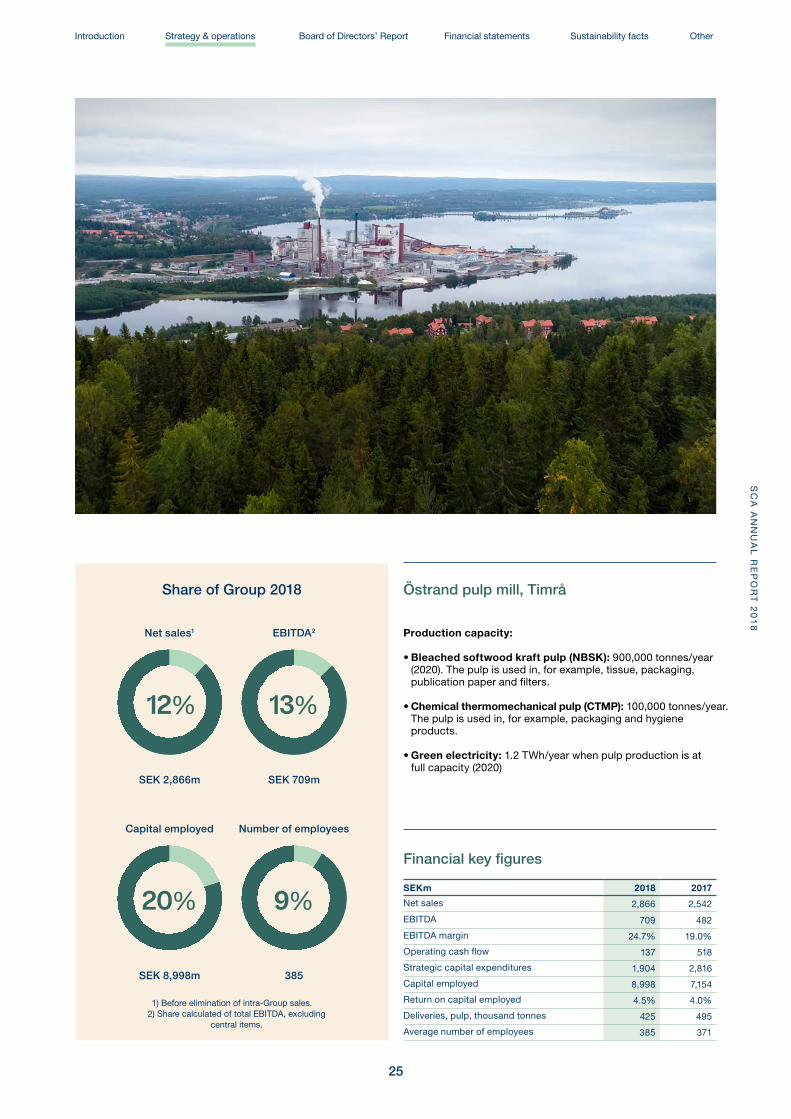
Production capacity:
• Bleached softwood kraft pulp (NBSK): 900,000 tonnes/year (2020). The pulp is used in, for example, tissue, packaging, publication paper and filters.
• Chemical thermomechanical pulp (CTMP): 100,000 tonnes/year. The pulp is used in, for example, packaging and hygiene products.
• Green electricity: 1.2 TWh/year when pulp production is at full capacity (2020)
Östrand pulp mill, Timrå
Net sales1
Capital employed
EBITDA2
Number of employees
SEK 2,866m
SEK 8,998m
SEK 709m
385
1) Before elimination of intra-Group sales. 2) Share calculated of total EBITDA, excluding
central items.
12%
20%
13%
9%
Share of Group 2018
Financial key figures
SEKm 2018 2017
Net sales 2,866 2,542
EBITDA 709 482
EBITDA margin 24.7% 19.0%
Operating cash flow 137 518
Strategic capital expenditures 1,904 2,816
Capital employed 8,998 7,154
Return on capital employed 4.5% 4.0%
Deliveries, pulp, thousand tonnes 425 495
Average number of employees 385 371
25
SC
A A
NN
UA
L R
EP
OR
T 2
01
8Board of Directors’ Report Financial statements Sustainability facts OtherIntroduction Strategy & operations

35
Wood yard
Wood-chip storage
Digester
Recovery boiler
Liquid biofuels
Crudetall oil
District heating
Green
electricity
Recovered chemicals
Black liquor
Bleach plant
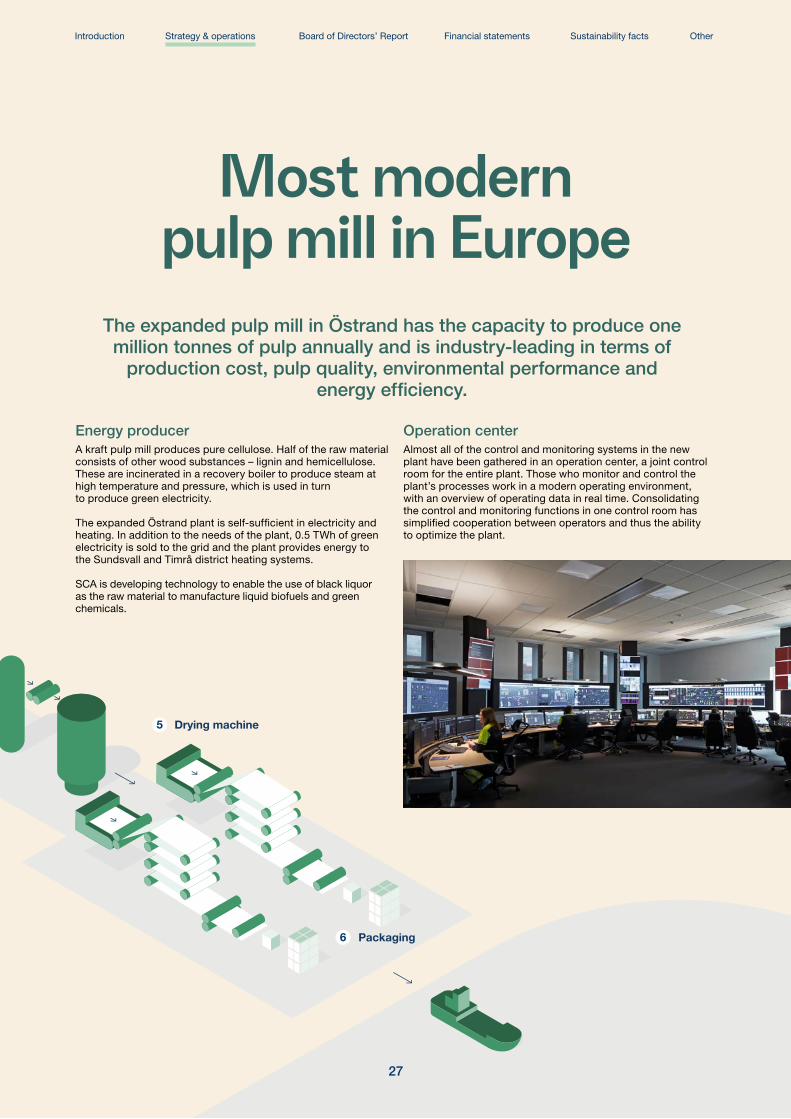
Drying machine
Packaging
1. The raw material, pulpwood, is delivered by rail, road and sea, and as sawmill chips. The wood is debarked and chopped into chips.
2. The chips are stored in stacks for various pulp products.
3. The chips are boiled with chemicals to separate the cellulose – about half of the wood sub stance – from other wood materials, such as lignin and hemicellulose.
4. The process continues with bleaching to clean the pulp from everything that is not cellulose. Other chemicals are used at this stage – oxygen, peroxide and chlorine dioxide.
5. The pulp is dried and cut into sheets.
6. The pulp is packaged for delivery to customers.
7. The black liquor, the wood material that is not cellulose or the cooking chemicals, is transferred to the recovery boiler. The black liquor is incinerated and produces steam and electricity, while the chemicals are recycled.
SC
A A
NN
UA
L R
EP
OR
T 2
01
8
26
35
Wood yard
Wood-chip storage
Digester
Recovery boiler
Liquid biofuels
Crudetall oil
District heating
Green
electricity
Recovered chemicals
Black liquor
Bleach plant
Drying machine
Packaging
Most modern pulp mill in Europe
The expanded pulp mill in Östrand has the capacity to produce one million tonnes of pulp annually and is industry-leading in terms of
production cost, pulp quality, environmental performance and energy efficiency.
Energy producerA kraft pulp mill produces pure cellulose. Half of the raw material consists of other wood substances – lignin and hemicellulose. These are incinerated in a recovery boiler to produce steam at high temperature and pressure, which is used in turn to produce green electricity.
The expanded Östrand plant is self-sufficient in electricity and heating. In addition to the needs of the plant, 0.5 TWh of green electricity is sold to the grid and the plant provides energy to the Sundsvall and Timrå district heating systems.
SCA is developing technology to enable the use of black liquor as the raw material to manufacture liquid biofuels and green chemicals.
Operation centerAlmost all of the control and monitoring systems in the new plant have been gathered in an operation center, a joint control room for the entire plant. Those who monitor and control the plant’s processes work in a modern operating environment, with an overview of operating data in real time. Consolidating the control and monitoring functions in one control room has simplified cooperation between operators and thus the ability to optimize the plant.
27
Board of Directors’ Report Financial statements Sustainability facts OtherIntroduction Strategy & operations
SCA manufactures kraftliner – packaging paper – and publication paper. Kraftliner is a strategic growth area with favorable long-term trends.
The focus for publication paper is on maximizing cash flow through specialization and innovation.
Leading kraftliner producer
PAPER
Kraftliner – strategic growth areaKraftliner is a fresh fiber-based packaging paper that is used to manufacture corrugated board packaging, where kraftliner is used for the outer layer of the corrugated board. SCA produces kraftliner at the Munksund paper mill in Piteå and the Obbola paper mill in Umeå.
Leading kraftliner producerSCA is a leading producer of kraftliner, being the third largest in Europe and the largest independent supplier. The product portfolio includes a range of specialty products, such as kraft-liner with a white printable surface (white-top) and wet-strength kraftliner. Wet-strength kraftliner is used for packaging with particularly high demands, for example packaging for food or heavy goods. The slow-growing wood raw material from Northern Sweden provides strength and is well suited for material-efficient packaging of high quality. The key markets are the Nordic region, Germany and the UK.
SCA has efficient and well-invested production plants. The Obbola paper mill has Europe’s largest machine for manufactu-ring kraftliner and the mill in Munksund the third largest. Invest-ments are taking place at Munksund to increase capacity for the manufacture of white-top kraftliner. The upgraded machine will begin operating in 2019.
Favorable long-term trendsThe kraftliner market continues to grow. The healthy economy and global megatrends are driving world trade and demand for packaging paper. The expanding e-commerce and the transition from plastic packaging to renewable materials is also boost-ing demand for high-quality packaging paper. Demands on food safety standards and retail-ready packaging, which can be displayed directly in stores, are increasing interest in fresh fiber-based packaging without chemicals, with high printability and strength.
This increasing demand, combined with limited growth in supply, has resulted in a positive price development for kraftliner in recent years.
Opportunity for increased capacityThe long-term favorable trends, an expanding market and the high rate of capacity utilization provides an opportunity to
increase production capacity. SCA is conducting a pre-project to assess a production increase in Obbola. The pre-project is expected to be completed in the first quarter of 2019.
Publication paper – maximized cash flow
The world’s fifth largest publication paper millOrtviken is one of the world’s largest and most production-effi-cient publication paper mills. The mill manufactures coated and uncoated printing paper for magazines, catalogs and commer-cial print for media companies in Europe.
Stabilizing market in structural declinePublication paper is a structurally declining market that in recent years has decreased by about 5% per year. In 2018, capacity reductions among publication paper producers have created a better balance between supply and demand. The improved market balance has resulted in price increases during the year for both coated and uncoated printing paper.
Innovation for upgrading the product portfolioSCA’s focus for publication paper is on maximizing cash flow through product quality and production efficiency. With a high pace of innovation, the portfolio is upgraded with high-quality products. Ortviken is focusing on niches with stronger demand and is developing new cost-efficient paper products that com-pete with fine paper. About 35% of sales comprises products launched over the past five years.
Strategy
• Continue to invest in specialty products, such as white-top and wet-strength kraftliner
• Assess a possible investment to increase kraftliner production at Obbola paper mill
• Maximize cash flow in publication paper by optimizing processes and the product and market mix
SC
A A
NN
UA
L R
EP
OR
T 2
01
8
28
STRATEGY AND OPERATIONS / PAPER
Net sales1
Capital employed
EBITDA2
Number of employees
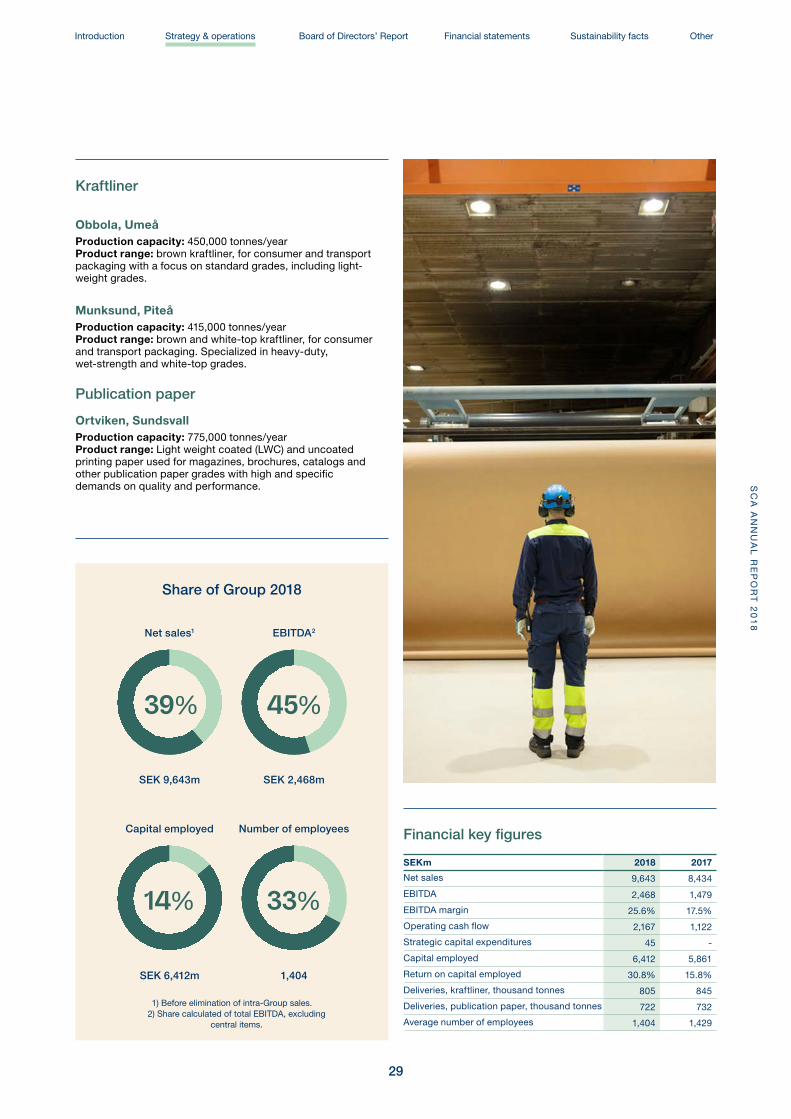
SEK 9,643m
SEK 6,412m
SEK 2,468m
1,404
1) Before elimination of intra-Group sales. 2) Share calculated of total EBITDA, excluding
central items.
39%
14%
45%
33%
Share of Group 2018
Financial key figures
SEKm 2018 2017
Net sales 9,643 8,434
EBITDA 2,468 1,479
EBITDA margin 25.6% 17.5%
Operating cash flow 2,167 1,122
Strategic capital expenditures 45 -
Capital employed 6,412 5,861
Return on capital employed 30.8% 15.8%
Deliveries, kraftliner, thousand tonnes 805 845
Deliveries, publication paper, thousand tonnes 722 732
Average number of employees 1,404 1,429
Obbola, UmeåProduction capacity: 450,000 tonnes/year Product range: brown kraftliner, for consumer and transport packaging with a focus on standard grades, including light-weight grades.
Munksund, PiteåProduction capacity: 415,000 tonnes/year Product range: brown and white-top kraftliner, for consumer and transport packaging. Specialized in heavy-duty, wet-strength and white-top grades.
Publication paper
Ortviken, SundsvallProduction capacity: 775,000 tonnes/year Product range: Light weight coated (LWC) and uncoated printing paper used for magazines, brochures, catalogs and other publication paper grades with high and specific demands on quality and performance.
Kraftliner
29
SC
A A
NN
UA
L R
EP
OR
T 2
01
8Board of Directors’ Report Financial statements Sustainability facts OtherStrategy & operationsIntroduction

SCA’s forest assets and industrial operations provide the company with significant potential to develop new business opportunities in the field of renewable energy. Greater value
creation from by-products from the forest and industry create conditions for profitable and sustainable growth.
Renewable energy – the next value creator
SC
A A
NN
UA
L R
EP
OR
T 2
01
8
30
STRATEGY AND OPERATIONS / RENEWABLE ENERGY

Doubling wind power production on SCA’s land by 2020
As Europe’s largest private forest owner, SCA owns large areas of forest land with favorable wind conditions. SCA prepares and develops wind power projects for players who are interested in investing in green energy. As land owner, SCA receives a ground lease based on revenue from the sale of the green electricity produced.
At the end of 2018, 324 wind turbines were in operation on SCA’s land with an annual capacity of 2.6 TWh. During the year, decisions were taken to build an additional 120 wind turbines and, together with previously agreed projects, production on SCA’s land is expected to increase to 6.7 TWh by 2021. SCA has a long-term goal for wind power production on its own land of 11 TWh, equivalent to the electrification of all passenger cars in Sweden.
Leading supplier of biofuelsAll timber that can be sawn is used for solid-wood products. The wood raw material that cannot be used for wood products is used to produce paper and pulp. The by-products from forest operations and industry that are not suitable for use as fresh fiber are used in energy production. A large proportion of bio energy is used at SCA’s own plants and contributes toward SCA’s very low carbon footprint.
SCA produced 9 TWh of bioenergy in 2018. 7.5 TWh was used in SCA’s own plants and 1.5 TWh was delivered to external customers. Of the external deliveries, 0.5 TWh was unprocessed biofuels and 1 TWh was processed biofuels, meaning wood pellets. SCA’s production capacity at fully or partially owned plants is 300,000 tonnes of pellets per year.
Östrand investment offers new business opportunities
Doubling production capacity at the expanded pulp mill in Östrand increases the production of tall oil, a by-product from pulp production. In 2018, SCA and the Finnish energy company St1, initiated cooperation to assess the investment in a facility to manufacture liquid biofuel, based on tall oil, at St1’s refinery in Gothenburg. The investment could yield annual production of 100,000 m3 of liquid biofuel, equivalent to about 1% of Sweden’s total fuel needs. The evaluation is expected to be completed in the first quarter of 2019.
SCA has begun an environmental assessment of a possible biorefinery at Östrand pulp mill. The company is evaluating the potential to manufacture liquid biofuel from black liquor, a by-product from pulp manufacturing. SCA’s proprietary process is being assessed in a pilot plant at the Obbola paper mill. SCA is also evaluating the potential to produce liquid biofuel from solid biomass, such as sawdust. Both projects can utilize the industrial infrastructure available at the Östrand pulp mill and the residual products generated by SCA’s industrial production.
SCA has a long-term goal to manufacture liquid biofuel from residual forest products of 260,000 m3, a volume corresponding to all fuel used in domestic flights in Sweden.
Strategy
• Maximize wind power on SCA’s land and develop the aftermarket business
• Optimize production, product portfolio and profitability in the biofuel business
• Commercialize business opportunities for liquid biofuels
31
SC
A A
NN
UA
L R
EP
OR
T 2
01
8Board of Directors’ Report Financial statements Sustainability facts OtherIntroduction Strategy & operations
Logistics is a central part of SCA’s operations. Forest raw materials are shipped to industrial facilities and products are
delivered to customers worldwide. SCA’s logistics system is customized based on the needs of the company, thereby
maximizing the benefit to the other operations and the environment.
Efficient logistics to ensure competitiveness
32
SC
A A
NN
UA
L R
EP
OR
T 2
01
8STRATEGY AND OPERATIONS / LOGISTICS
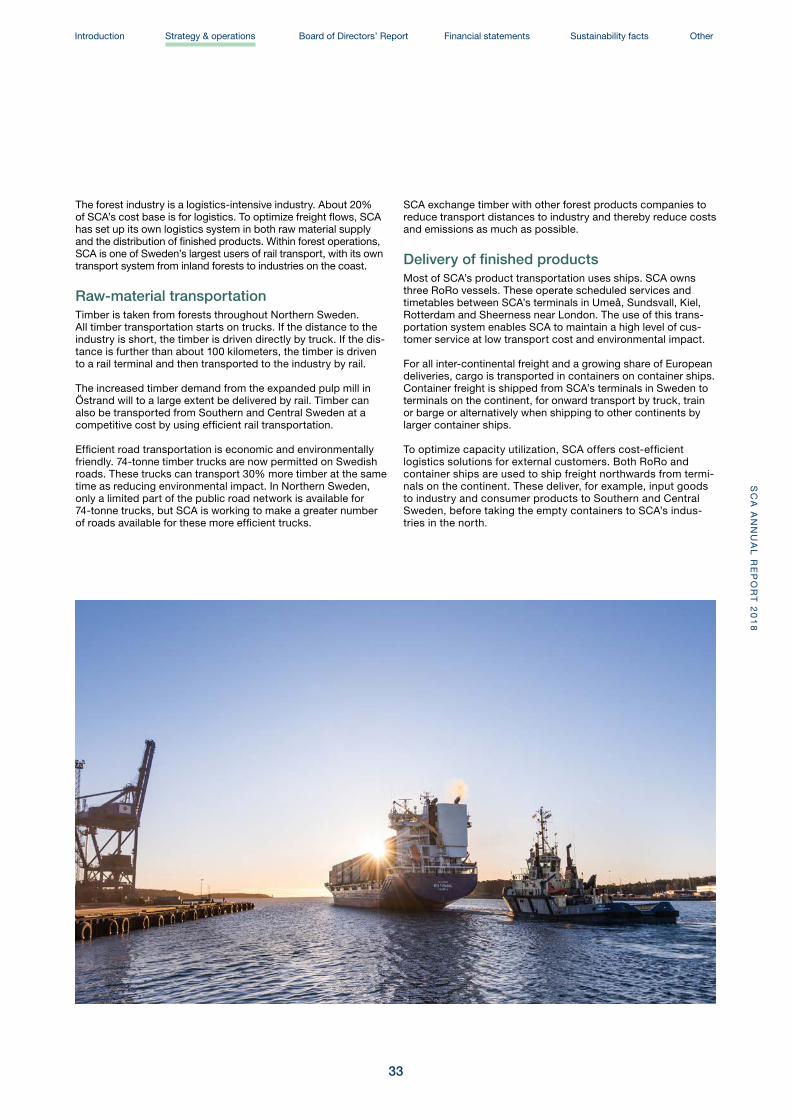
The forest industry is a logistics-intensive industry. About 20% of SCA’s cost base is for logistics. To optimize freight flows, SCA has set up its own logistics system in both raw material supply and the distribution of finished products. Within forest operations, SCA is one of Sweden’s largest users of rail transport, with its own transport system from inland forests to industries on the coast.
Raw-material transportationTimber is taken from forests throughout Northern Sweden. All timber transportation starts on trucks. If the distance to the industry is short, the timber is driven directly by truck. If the dis-tance is further than about 100 kilometers, the timber is driven to a rail terminal and then transported to the industry by rail.
The increased timber demand from the expanded pulp mill in Östrand will to a large extent be delivered by rail. Timber can also be transported from Southern and Central Sweden at a competitive cost by using efficient rail transportation.
Efficient road transportation is economic and environmentally friendly. 74-tonne timber trucks are now permitted on Swedish roads. These trucks can transport 30% more timber at the same time as reducing environmental impact. In Northern Sweden, only a limited part of the public road network is available for 74-tonne trucks, but SCA is working to make a greater number of roads available for these more efficient trucks.
SCA exchange timber with other forest products companies to reduce transport distances to industry and thereby reduce costs and emissions as much as possible.
Delivery of finished productsMost of SCA’s product transportation uses ships. SCA owns three RoRo vessels. These operate scheduled services and timetables between SCA’s terminals in Umeå, Sundsvall, Kiel, Rotterdam and Sheerness near London. The use of this trans-portation system enables SCA to maintain a high level of cus-tomer service at low transport cost and environmental impact.
For all inter-continental freight and a growing share of European deliveries, cargo is transported in containers on container ships. Container freight is shipped from SCA’s terminals in Sweden to terminals on the continent, for onward transport by truck, train or barge or alternatively when shipping to other continents by larger container ships.
To optimize capacity utilization, SCA offers cost-efficient logistics solutions for external customers. Both RoRo and container ships are used to ship freight northwards from termi-nals on the continent. These deliver, for example, input goods to industry and consumer products to Southern and Central Sweden, before taking the empty containers to SCA’s indus-tries in the north.
33
SC
A A
NN
UA
L R
EP
OR
T 2
01
8Board of Directors’ Report Financial statements Sustainability facts OtherIntroduction Strategy & operations

SCA delivers sustain-able development
The sustainability profile covers the entire company’s operations. SCA supports the 2030 Agenda and the UN’s 17 Sustainable Development
Goals and makes a direct or indirect contribution to all of these goals.
Valuable forests
• Biodiversity
• Social values
• Healthy growth
• Reliable timber supply
Efficient use of resources
• High yield from raw materials
• Innovation
• Continuous improvements
Responsibility for people and the community
• Healthy and safe work environment
• Dedicated employees
• Diversity and inclusion
• Viable local communities
Fossil-free world
• Growing forest binds CO2
• Renewable energy
• Forest-based products
• Substitution
ValuesPurposeWith the force of the forest, we contribute to a sustainable future
Core valuesResponsibility, excellence and respect
Profitable growthIncreased value creation for shareholders, cus-tomers, suppliers, employees and the community
SC
A A
NN
UA
L R
EP
OR
T 2
01
8
34
STRATEGY AND OPERATIONS / SUSTAINABLE DEVELOPMENT
of productive forest area set aside for nature conservation
EBITDA development compared with 2017
million tonnes of CO2 /year in climate benefit by reducing greenhouse gases
in the atmosphere
workplace accidents per million working hours
SEK /m3 of added value created from the forest raw material
of SCA employees have received training in the Code of Conduct
Valuable forests
Profitable growth
Fossil-free world
Responsibility for people and the community
Efficient use of resources
Values
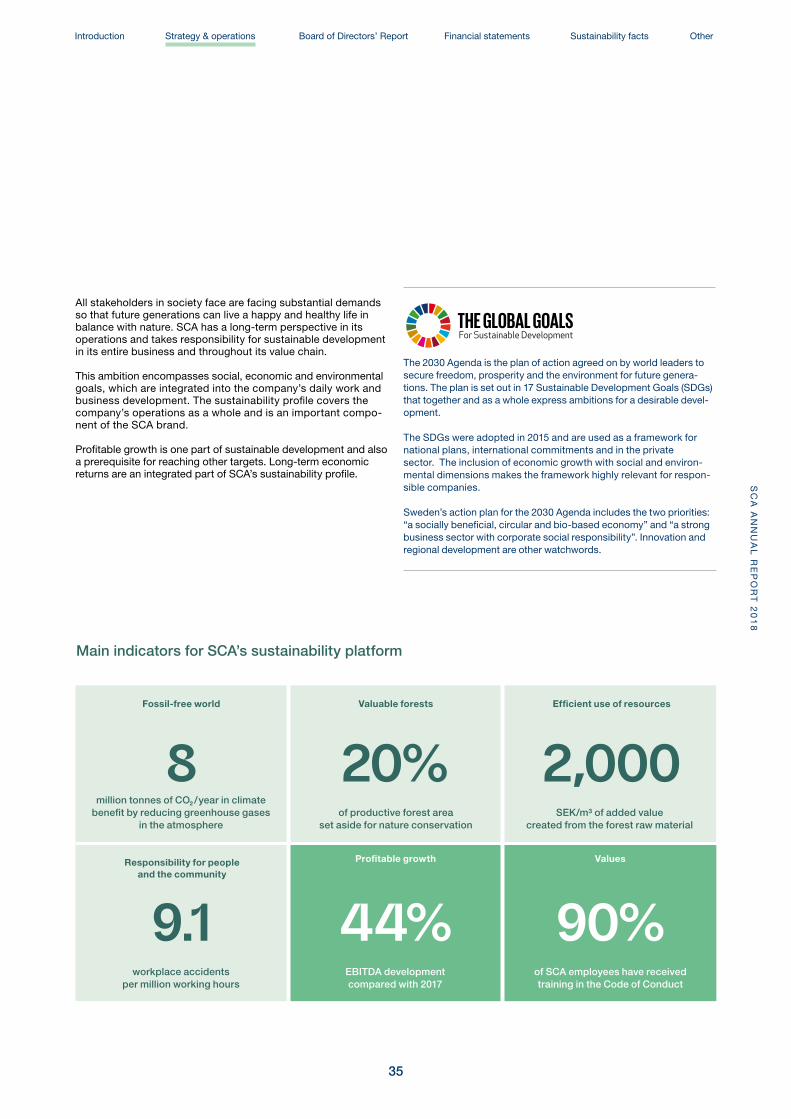
The 2030 Agenda is the plan of action agreed on by world leaders to secure freedom, prosperity and the environment for future genera-tions. The plan is set out in 17 Sustainable Development Goals (SDGs) that together and as a whole express ambitions for a desirable devel-opment.
The SDGs were adopted in 2015 and are used as a framework for national plans, international commitments and in the private sector. The inclusion of economic growth with social and environ-mental dimensions makes the framework highly relevant for respon-sible companies.
Sweden’s action plan for the 2030 Agenda includes the two priorities: “a socially beneficial, circular and bio-based economy” and “a strong business sector with corporate social responsibility”. Innovation and regional development are other watchwords.
All stakeholders in society face are facing substantial demands so that future generations can live a happy and healthy life in balance with nature. SCA has a long-term perspective in its operations and takes responsibility for sustainable development in its entire business and throughout its value chain.
This ambition encompasses social, economic and environmental goals, which are integrated into the company’s daily work and business development. The sustainability profile covers the company’s operations as a whole and is an important compo-nent of the SCA brand.
Profitable growth is one part of sustainable development and also a prerequisite for reaching other targets. Long-term economic returns are an integrated part of SCA’s sustainability profile.
8 20%
44%
2,000
90%9.1
Main indicators for SCA’s sustainability platform
35
SC
A A
NN
UA
L R
EP
OR
T 2
01
8Introduction Strategy & operations Board of Directors’ Report Financial statements Sustainability facts Other

SCA’s operations are climate positive and contribute in several ways towards
important climate solutions and a fossil-free world.
Fossil-free world
Climate-positive operationsThe average world temperature must not increase more than 2°C and should be limited to 1.5°C according to the UN’s climate panel, IPCC. Both a sharp decrease in emissions from fossil sources and a substantial increase in carbon storage are required to achieve this.
The forest has a key role to play in the transition as a growing forest captures and binds CO2 and the renewable, forest-based products can replace alternatives with a greater climate impact, such as plastic and concrete.
SCA contributes toward a better global climate as the company’s own forests become increasingly timber-rich and store about 4 million tonnes of CO2 net per year. The renewable products contribute through substitution by reducing fossil emissions equivalent to approximately 5 million tonnes of CO2 per year. Including fossil emissions generated by the company’s oper-ations, the net positive climate effect is about 8 million tonnes of CO2 per year, corresponding to about one-sixth of Sweden’s fossil emissions and more than the total emissions from all the
truck traffic and domestic flights in Sweden. The climate impact has been calculated as CO2 equivalents but is expressed as CO2 in the text.
Fossil-free value chainThe aim is that SCA’s value chain is to become fossil-free. 95% of SCA’s own industrial processes are fossil-free due to a deliberate transition to biofuels that come mainly from by-products and forest raw materials. In 2018, this share was temporarily lower due to the start-up of the new pulp mill in Östrand. An estimate of greenhouse gas emissions shows that emissions from all being production, transportation and input goods, meaning the climate impact of the entire operations, totals 0.9 million tonnes of CO2 per year. Most of these emis-sions, 77%, are generated outside of the company’s factories. Work in future will focus on logistics optimization, fuel selec-tion, energy efficiency and input goods. Key success factors include access to a reliable railway system with a high cargo capacity, 74-tonne road vehicles, larger and more fuel-efficient ships and access to fossil-free fuels.
Substitution
million tonnes of CO2 per year
Our products replace fossil-based alternatives
5
Value chain
million tonnes of CO2 per year
Manufacturing operations are almost fossil-free. The remaining fossil
emissions are
0.9
Climate benefit
million tonnes of CO2 per year
SCA’s operations are climate positive and reduce greenhouse
gases by
8
The forest
Growing forest with increasing standing
volume binds a net of
million tonnes of CO2 per year
4 + − ≈
SCA’s climate benefit amounts to 8 million tonnes of CO2, more than the total emissions from all the truck traffic and domestic flights in Sweden
SC
A A
NN
UA
L R
EP
OR
T 2
01
8
36
STRATEGY AND OPERATIONS / FOSSIL-FREE WORLD

Substitution to enhance climate benefits SCA’s products are based on renewable raw materials from responsibly managed forests and produced in efficient produc-tion facilities with low climate impact. When these products replace fossil-based alternatives or products with a larger climate footprint, a climate benefit is created equivalent to about 5 million tonnes of CO2 per year. Examples include wood replac-ing steel and concrete, fiber-based products replacing plastic, and bioenergy replacing fossil-based energy. Innovation work is focused on developing new products and application areas for the company’s products. For example, producing liquid biofuels based on the industry’s residual flows.
Climate impact from SCA’s operations
Area Million tonnes of CO2e per year(relates to scope 1, 2 and 3)
Transportation 0.38
Harvesting and industrial operations 0.26
Input goods 0.21
Other 0.03
Total 0.88
SCA’s contribution to the UN Sustainable Development Goals
Renewable energy is produced in large quantities directly from forest raw materials or as part of the industrial processes. A large amount of the biobased energy is used in SCA’s own industries, which are thereby almost fossil-free. District heating is delivered to local towns nearby the company’s industries. The production of green electricity is made possible by wind power installed on SCA’s forest land and by co-generation at the industries.
Growing forests binding CO2, fossil-free industrial processes, renewable energy produc-tion and the substitution of fossil-based products mean that SCA generates a net posi-tive climate effect resulting in 8 million tonnes less CO2 in the atmosphere every year.
SCA’s products are renewable and contribute toward a circular and bio-based society. The more efficient use of resources reduces greenhouse gas emissions throughout the value chain.
Contamination of the seas with fossil-based non-degradable plastic products is counter acted by the increased use of wood-fiber-based products.
37
SC
A A
NN
UA
L R
EP
OR
T 2
01
8Introduction Strategy & operations Board of Directors’ Report Financial statements Sustainability facts Other
SCA creates many diverse values for people and nature through responsible forest management.
Valuableforests
38
SC
A A
NN
UA
L R
EP
OR
T 2
01
8STRATEGY AND OPERATIONS / VALUABLE FORESTS
100%of wood raw material used fulfilled
FSC, PEFC or FSC CW
20%of productive forest land
is set aside for nature conservation
235million m3 of standing timber in
SCA’s growing forests
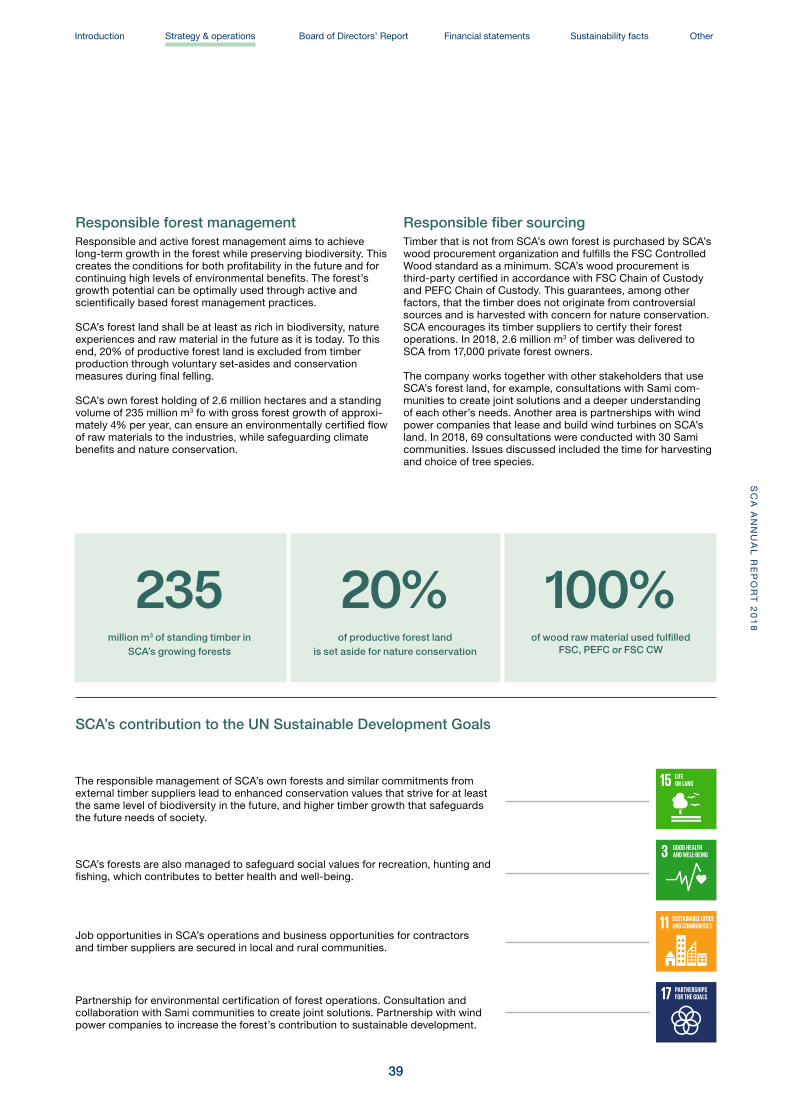
Responsible forest managementResponsible and active forest management aims to achieve long-term growth in the forest while preserving biodiversity. This creates the conditions for both profitability in the future and for continuing high levels of environmental benefits. The forest’s growth potential can be optimally used through active and scientifically based forest management practices.
SCA’s forest land shall be at least as rich in biodiversity, nature experiences and raw material in the future as it is today. To this end, 20% of productive forest land is excluded from timber production through voluntary set-asides and conservation measures during final felling.
SCA’s own forest holding of 2.6 million hectares and a standing volume of 235 million m3 fo with gross forest growth of approxi-mately 4% per year, can ensure an environmentally certified flow of raw materials to the industries, while safeguarding climate benefits and nature conservation.
Responsible fiber sourcingTimber that is not from SCA’s own forest is purchased by SCA’s wood procurement organization and fulfills the FSC Controlled Wood standard as a minimum. SCA’s wood procurement is third-party certified in accordance with FSC Chain of Custody and PEFC Chain of Custody. This guarantees, among other factors, that the timber does not originate from controversial sources and is harvested with concern for nature conservation. SCA encourages its timber suppliers to certify their forest operations. In 2018, 2.6 million m3 of timber was delivered to SCA from 17,000 private forest owners.
The company works together with other stakeholders that use SCA’s forest land, for example, consultations with Sami com-munities to create joint solutions and a deeper understanding of each other’s needs. Another area is partnerships with wind power companies that lease and build wind turbines on SCA’s land. In 2018, 69 consultations were conducted with 30 Sami communities. Issues discussed included the time for harvesting and choice of tree species.
SCA’s contribution to the UN Sustainable Development Goals
The responsible management of SCA’s own forests and similar commitments from external timber suppliers lead to enhanced conservation values that strive for at least the same level of biodiversity in the future, and higher timber growth that safeguards the future needs of society.
SCA’s forests are also managed to safeguard social values for recreation, hunting and fishing, which contributes to better health and well-being.
Job opportunities in SCA’s operations and business opportunities for contractors and timber suppliers are secured in local and rural communities.
Partnership for environmental certification of forest operations. Consultation and collaboration with Sami communities to create joint solutions. Partnership with wind power companies to increase the forest’s contribution to sustainable development.
39
SC
A A
NN
UA
L R
EP
OR
T 2
01
8Introduction Strategy & operations Board of Directors’ Report Financial statements Sustainability facts Other

Optimizing forest raw materials in efficient value chains generate both
sustainability and profitability.
Efficient use of resources
SC
A A
NN
UA
L R
EP
OR
T 2
01
8
40
STRATEGY AND OPERATIONS / RESOURCE CONSUMPTION
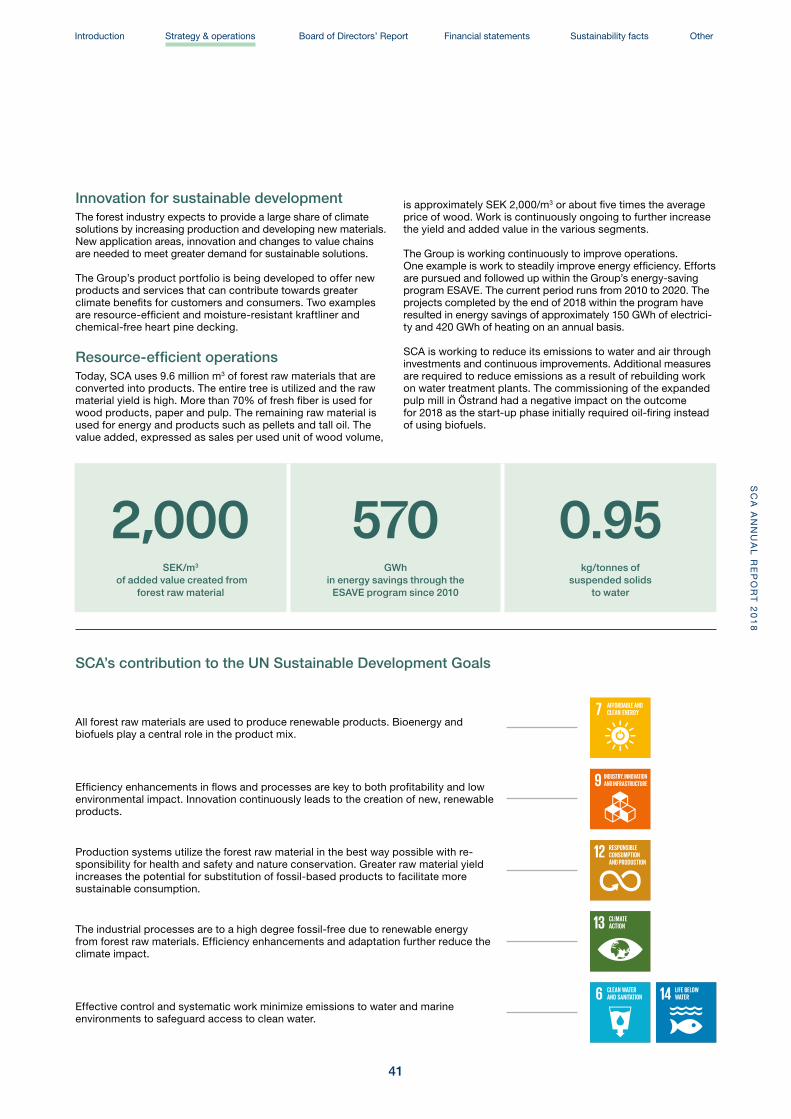
Innovation for sustainable developmentThe forest industry expects to provide a large share of climate solutions by increasing production and developing new materials. New application areas, innovation and changes to value chains are needed to meet greater demand for sustainable solutions.
The Group’s product portfolio is being developed to offer new products and services that can contribute towards greater climate benefits for customers and consumers. Two examples are resource-efficient and moisture-resistant kraftliner and chemical-free heart pine decking.
Resource-efficient operationsToday, SCA uses 9.6 million m3 of forest raw materials that are converted into products. The entire tree is utilized and the raw material yield is high. More than 70% of fresh fiber is used for wood products, paper and pulp. The remaining raw material is used for energy and products such as pellets and tall oil. The value added, expressed as sales per used unit of wood volume,
is approximately SEK 2,000/m3 or about five times the average price of wood. Work is continuously ongoing to further increase the yield and added value in the various segments.
The Group is working continuously to improve operations. One example is work to steadily improve energy efficiency. Efforts are pursued and followed up within the Group’s energy-saving program ESAVE. The current period runs from 2010 to 2020. The projects completed by the end of 2018 within the program have resulted in energy savings of approximately 150 GWh of electrici-ty and 420 GWh of heating on an annual basis.
SCA is working to reduce its emissions to water and air through investments and continuous improvements. Additional measures are required to reduce emissions as a result of rebuilding work on water treatment plants. The commissioning of the expanded pulp mill in Östrand had a negative impact on the outcome for 2018 as the start-up phase initially required oil-firing instead of using biofuels.
0.95kg/tonnes of
suspended solids to water
570GWh
in energy savings through the ESAVE program since 2010
2,000SEK /m3
of added value created from forest raw material
SCA’s contribution to the UN Sustainable Development Goals
All forest raw materials are used to produce renewable products. Bioenergy and biofuels play a central role in the product mix.
Efficiency enhancements in flows and processes are key to both profitability and low environmental impact. Innovation continuously leads to the creation of new, renewable products.
Production systems utilize the forest raw material in the best way possible with re-sponsibility for health and safety and nature conservation. Greater raw material yield increases the potential for substitution of fossil-based products to facilitate more sustainable consumption.
The industrial processes are to a high degree fossil-free due to renewable energy from forest raw materials. Efficiency enhancements and adaptation further reduce the climate impact.
Effective control and systematic work minimize emissions to water and marine environments to safeguard access to clean water.
41
SC
A A
NN
UA
L R
EP
OR
T 2
01
8Introduction Strategy & operations Board of Directors’ Report Financial statements Sustainability facts Other

Success and sustainable development are dependent on dedicated employees and partnerships in local communities.
Responsibility for people and the community
SC
A A
NN
UA
L R
EP
OR
T 2
01
8
42
STRATEGY AND OPERATIONS / INDIVIDUALS AND SOCIETY

The equal value of everyoneSCA is an attractive and inclusive employer where health and safety is given the highest priority and where diversity is part of the culture. Employees are offered an opportunity to develop to their full potential and to work in an atmosphere of respect and trust.
SCA’s core values are responsibility, excellence and respect which form the basis of the sustainability profile and describe how we treat people, conduct operations, do business and contribute to the development of the local community. These relate to fundamental human rights and ethical requirements on operations, such as zero tolerance for corruption and vic-timization. The core values encompass company standards, sustainability across the value chain and justice and equality in the world around us. SCA has chosen to support the UN Global Compact and been a member since 2008.
The Group’s vision of zero workplace accidents means that all employees and other people working at the company’s facilities should return home healthy and unharmed from work. SCA runs the ZERO program to develop our shared health and safety culture through enhancing leadership and changing behavior.
Dedicated employees ensure profitable growth
SCA holds regular employee surveys where all employees can take part. The results are then used to draw up action plans to develop and improve SCA as employer. Participation in 2018 was high, just over 90%, and the survey reflects a high level of engagement.
Diversity in the workplace is a success factor and a develop-ment area for SCA. The company is actively striving to increase diversity by broadening its recruitment base, increasing aware-ness within the Group and knowledge about the industry.
Community involvement for sustainable development
SCA’s operations generate direct and indirect values, such as job opportunities, revenues from timber sales for private forest owners and work opportunities for contractors and sub-suppliers. Moreover, SCA enables income and experiences from hunting, fishing, recreation and associations. SCA thereby makes an active contribution to sustainable local communities and to regional development.
SCA’s contribution to the UN Sustainable Development Goals
19%share of women
in the Group
4,216average number
of employees
78engagement index from the
all employee survey
9.1workplace accidents per
million working hours
Program ZERO for a healthy and safe work environment with no accidents. Work to increase diversity and an inclusive company culture through a wider recruitment base and a living Code of Conduct.
Good working conditions and excellent possibilities for upskilling and skills develop-ment. Participation in external training programs, work experience for young people through work placements and vacation work.
Long-term economically viable operations contribute to sustainable local communities. Dialogue and influence through SCA’s Supplier standard. Sponsorship of local associations.
Partnership with stakeholders in the local community. Member of the UN Global Compact.
43
SC
A A
NN
UA
L R
EP
OR
T 2
01
8Introduction Strategy & operations Board of Directors’ Report Financial statements Sustainability facts Other
1.75SEK
Proposed dividend per share, 2018
5.21SEK
Earnings per share, 2018
SC
A A
NN
UA
L R
EP
OR
T 2
01
8
44
STRATEGY AND OPERATIONS / THE SHARE AND SHAREHOLDERS
The SCA share is quoted and traded on Nasdaq Stockholm. The company’s market capitalization was approximately
SEK 48bn at the end of the year.
The share and shareholders
Share performance 2018In 2018, SCA’s Class B share decreased by 19% to SEK 68.72 at the end of the year. During the corresponding period, the index of the 30 most traded shares, OMX30 Stockholm, fell by 11%. The highest closing price for SCA’s Class B share was SEK 107.75, which was noted on August 30. The lowest closing price was SEK 67.96 on December 27.
Share tradingDuring 2018, trading volume on all marketplaces amounted to approximately 1,883 million SCA shares, which corresponds to 268% of the total number of shares outstanding. The largest share of trading was on Nasdaq Stockholm, where some 728 million SCA shares exchanged hands. Average daily trading for SCA on Nasdaq Stockholm amounted to approximately 2.9 million shares. During the year, trading on CBOE Chi-X amounted to approximately 199 million SCA shares, trading on Turquoise to about 73 million SCA shares and trading on other marketplaces to approximately 883 million SCA shares.
Ownership structureSCA had approximately 100,000 shareholders as of December 31, 2018. Some 55% of the share capital is owned by Swedish investors and 45% by foreign investors. The US, Norway and the UK account for the highest percentage of shareholders regis-tered outside Sweden.
Share structureSCA’s share capital comprises two classes of shares, shares of Class A and of Class B. Each Class A share carries ten votes and each Class B share carries one vote. Class A and Class B shares hold the same right to dividends. Both share classes are listed on Nasdaq Stockholm.
Dividend and dividend policySCA aims to provide long-term stable and rising dividends to its shareholders. When cash flow from current operations exceeds what the company can invest in profitable growth over the long term, and under the condition that the capital structure target is met, the surplus shall be distributed to the shareholders.
The Board of Directors proposes a dividend of SEK 1.75 per share for the 2018 fiscal year. A dividend of SEK 1.50 per share was paid in 2017.
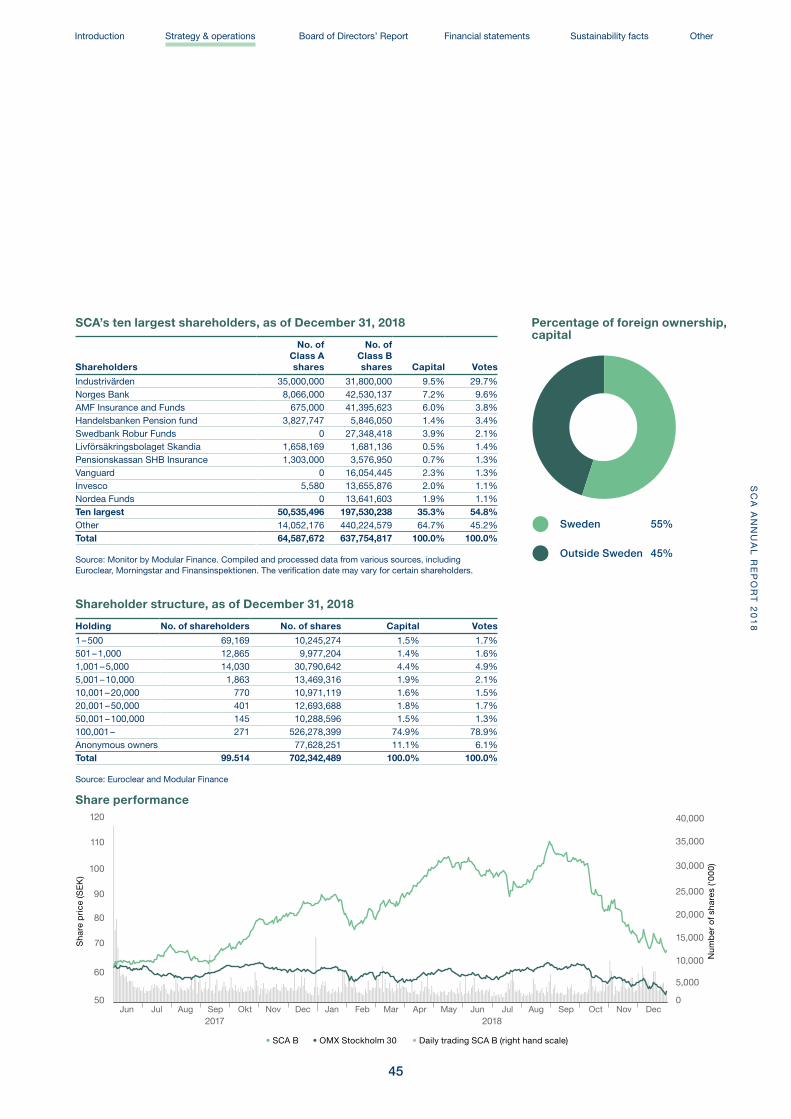
45
SC
A A
NN
UA
L R
EP
OR
T 2
01
8Introduction Strategy & operations Board of Directors’ Report Financial statements Sustainability facts Other
0
5,000
10,000
15,000
20,000
25,000
30,000
35,000
40,000
50
60
70
80
90
100
110
120
2017 2018Jan Feb Mar Apr May Jun Jul Aug Sep Oct Nov DecJun Jul Aug Sep Okt Nov Dec
• Daily trading SCA B (right hand scale)• SCA B • OMX Stockholm 30
SCA’s ten largest shareholders, as of December 31, 2018
Shareholders
No. of Class A shares
No. of Class B shares Capital Votes
Industrivärden 35,000,000 31,800,000 9.5% 29.7%Norges Bank 8,066,000 42,530,137 7.2% 9.6%AMF Insurance and Funds 675,000 41,395,623 6.0% 3.8%Handelsbanken Pension fund 3,827,747 5,846,050 1.4% 3.4%Swedbank Robur Funds 0 27,348,418 3.9% 2.1%Livförsäkringsbolaget Skandia 1,658,169 1,681,136 0.5% 1.4%Pensionskassan SHB Insurance 1,303,000 3,576,950 0.7% 1.3%Vanguard 0 16,054,445 2.3% 1.3%Invesco 5,580 13,655,876 2.0% 1.1%Nordea Funds 0 13,641,603 1.9% 1.1%Ten largest 50,535,496 197,530,238 35.3% 54.8%Other 14,052,176 440,224,579 64.7% 45.2%Total 64,587,672 637,754,817 100.0% 100.0%
Source: Monitor by Modular Finance. Compiled and processed data from various sources, including Euroclear, Morningstar and Finansinspektionen. The verification date may vary for certain shareholders.
Shareholder structure, as of December 31, 2018
Holding No. of shareholders No. of shares Capital Votes
1 – 500 69,169 10,245,274 1.5% 1.7%501 – 1,000 12,865 9,977,204 1.4% 1.6%1,001 – 5,000 14,030 30,790,642 4.4% 4.9%5,001 – 10,000 1,863 13,469,316 1.9% 2.1%10,001 – 20,000 770 10,971,119 1.6% 1.5%20,001 – 50,000 401 12,693,688 1.8% 1.7%50,001 – 100,000 145 10,288,596 1.5% 1.3%100,001 – 271 526,278,399 74.9% 78.9%Anonymous owners 77,628,251 11.1% 6.1%Total 99.514 702,342,489 100.0% 100.0%
Source: Euroclear and Modular Finance
Sha
re p
rice
(SE
K)
Num
ber
of s
hare
s (‘0
00)
Percentage of foreign ownership, capital
Sweden 55%
Outside Sweden 45%
Share performance
SCA is Europe’s largest private forest owner with 2.6 million hectares of forest land in Northern Sweden. The forest is a real asset, which grows each year and forms the core
of SCA’s operations. Around this renewable resource SCA has built a well-invested and efficient value chain, which
maximizes the value of each tree.
Operations and organizational structureThe core of SCA’s operations is the forest, with SCA’s forest being the largest private forest holding in Europe. Around this resource, SCA has built an integrated and well-invested indus-try, which utilizes and maximizes the value of the entire tree. Using the raw materials, SCA develops products for customers all over the world with high demands on quality, delivery reliability, service and sustainability.
The most valuable part of the tree is used for sawlogs and as much as possible of the timber is sawn to become solid-wood products for industry and the building materials trade. Bark is used in energy production. Chips together with tree-tops and smaller trees are used to make pulp and paper for further processing by customers into tissue, packaging and publication paper. Sawdust is used to make pellets for energy production at SCA and externally. Steam and by-products from pulp produc-tion are used to deliver heat to the local district heating system, generate green electricity and in the future also produce liquid biofuels.
The forest land also contains favorable sites for wind power.
Logistics is an important element in SCA’s efficient value chain and the transport solutions created for SCA's own products are also offered to other customers.
Organization and reported segmentsSCA is organized into five business areas and one support unit.
Business areas • The Forest business area has overall responsibility to supply
SCA’s forest industries with wood raw material. This means the Forest business area is responsible for managing SCA’s own forest land in Sweden, for sourcing wood raw material from other forest owners and for transporting the wood raw material to SCA’s industries.
• The Wood business area is responsible for the solid-wood business, which comprises five sawmills in Sweden and wood processing units and distribution and wholesale operations for wood products in Sweden, the UK and France.
• The Pulp business area is responsible for the pulp business, consisting of kraft pulp (NBSK) and chemical thermomechani-cal pulp (CTMP), both produced at the Östrand pulp mill.
• The Paper business area is responsible for the kraftliner busi-ness, with manufacturing of containerboard at the Obbola and Munksund paper mills, and for the publication paper business, with manufacturing of publication paper for magazines, cata-logues and commercial print at the Ortviken paper mill.
• The Renewable Energy business area is developing SCA’s business in the renewable energy segment, which includes the development of wind power projects, pellets manufactur-ing and sales, and the use of biomass and by-products from industry in energy production.
The support unit Sourcing and Logistics includes SCA’s com-mon sourcing functions. The unit is also responsible for SCA’s logistics system for deliveries to customers using specially adapted vessels and terminals both in Sweden and in key foreign markets.
Board of Directors’ Report
SC
A A
NN
UA
L R
EP
OR
T 2
01
8
46
BOARD OF DIRECTORS’ REPORT
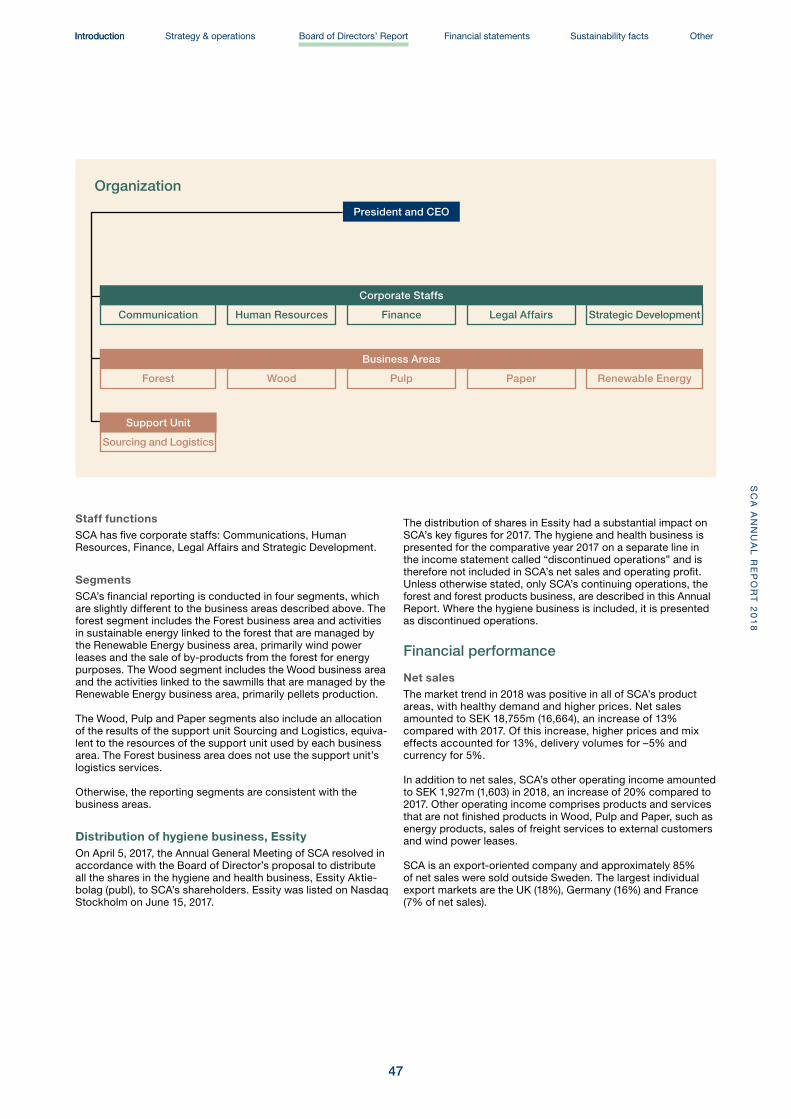
Staff functionsSCA has five corporate staffs: Communications, Human Resources, Finance, Legal Affairs and Strategic Development.
SegmentsSCA’s financial reporting is conducted in four segments, which are slightly different to the business areas described above. The forest segment includes the Forest business area and activities in sustainable energy linked to the forest that are managed by the Renewable Energy business area, primarily wind power leases and the sale of by-products from the forest for energy purposes. The Wood segment includes the Wood business area and the activities linked to the sawmills that are managed by the Renewable Energy business area, primarily pellets production.
The Wood, Pulp and Paper segments also include an allocation of the results of the support unit Sourcing and Logistics, equiva-lent to the resources of the support unit used by each business area. The Forest business area does not use the support unit’s logistics services.
Otherwise, the reporting segments are consistent with the business areas.
Distribution of hygiene business, EssityOn April 5, 2017, the Annual General Meeting of SCA resolved in accordance with the Board of Director’s proposal to distribute all the shares in the hygiene and health business, Essity Aktie-bolag (publ), to SCA’s shareholders. Essity was listed on Nasdaq Stockholm on June 15, 2017.
The distribution of shares in Essity had a substantial impact on SCA’s key figures for 2017. The hygiene and health business is presented for the comparative year 2017 on a separate line in the income statement called “discontinued operations” and is therefore not included in SCA’s net sales and operating profit. Unless otherwise stated, only SCA’s continuing operations, the forest and forest products business, are described in this Annual Report. Where the hygiene business is included, it is presented as discontinued operations.
Financial performance
Net salesThe market trend in 2018 was positive in all of SCA’s product areas, with healthy demand and higher prices. Net sales amounted to SEK 18,755m (16,664), an increase of 13% compared with 2017. Of this increase, higher prices and mix effects accounted for 13%, delivery volumes for –5% and currency for 5%.
In addition to net sales, SCA’s other operating income amounted to SEK 1,927m (1,603) in 2018, an increase of 20% compared to 2017. Other operating income comprises products and services that are not finished products in Wood, Pulp and Paper, such as energy products, sales of freight services to external customers and wind power leases.
SCA is an export-oriented company and approximately 85% of net sales were sold outside Sweden. The largest individual export markets are the UK (18%), Germany (16%) and France (7% of net sales).
Organization
President and CEO
Support Unit
Sourcing and Logistics
Corporate Staffs
Communication Human Resources Finance Legal Affairs Strategic Development
Business Areas
Forest Wood Pulp Paper Renewable Energy
47
SC
A A
NN
UA
L R
EP
OR
T 2
01
8Introduction Strategy & operations Board of Directors’ Report Financial statements Sustainability facts OtherIntroduction
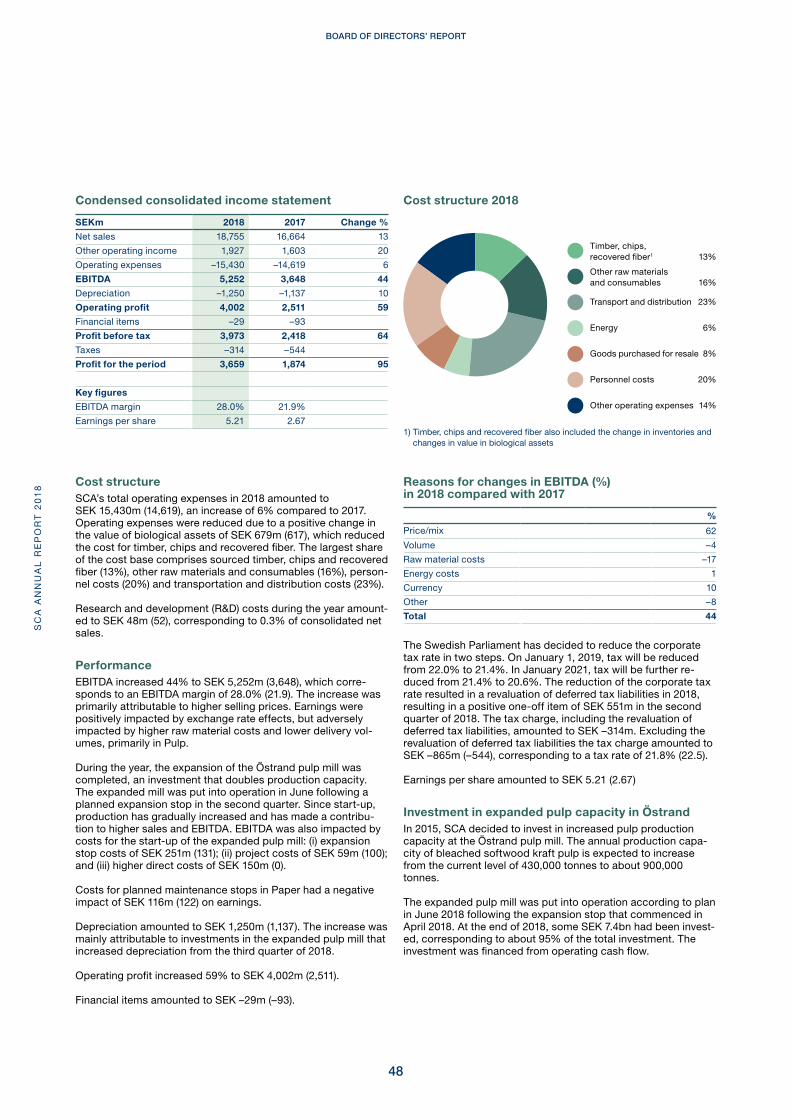
Cost structureSCA’s total operating expenses in 2018 amounted to SEK 15,430m (14,619), an increase of 6% compared to 2017. Operating expenses were reduced due to a positive change in the value of biological assets of SEK 679m (617), which reduced the cost for timber, chips and recovered fiber. The largest share of the cost base comprises sourced timber, chips and recovered fiber (13%), other raw materials and consumables (16%), person-nel costs (20%) and transportation and distribution costs (23%).
Research and development (R&D) costs during the year amount-ed to SEK 48m (52), corresponding to 0.3% of consolidated net sales.
PerformanceEBITDA increased 44% to SEK 5,252m (3,648), which corre-sponds to an EBITDA margin of 28.0% (21.9). The increase was primarily attributable to higher selling prices. Earnings were positively impacted by exchange rate effects, but adversely impacted by higher raw material costs and lower delivery vol-umes, primarily in Pulp.
During the year, the expansion of the Östrand pulp mill was completed, an investment that doubles production capacity. The expanded mill was put into operation in June following a planned expansion stop in the second quarter. Since start-up, production has gradually increased and has made a contribu-tion to higher sales and EBITDA. EBITDA was also impacted by costs for the start-up of the expanded pulp mill: (i) expansion stop costs of SEK 251m (131); (ii) project costs of SEK 59m (100); and (iii) higher direct costs of SEK 150m (0).
Costs for planned maintenance stops in Paper had a negative impact of SEK 116m (122) on earnings.
Depreciation amounted to SEK 1,250m (1,137). The increase was mainly attributable to investments in the expanded pulp mill that increased depreciation from the third quarter of 2018.
Operating profit increased 59% to SEK 4,002m (2,511).
Financial items amounted to SEK –29m (–93).
Condensed consolidated income statement
SEKm 2018 2017 Change %
Net sales 18,755 16,664 13
Other operating income 1,927 1,603 20
Operating expenses –15,430 –14,619 6
EBITDA 5,252 3,648 44
Depreciation –1,250 –1,137 10
Operating profit 4,002 2,511 59
Financial items –29 –93
Profit before tax 3,973 2,418 64
Taxes –314 –544
Profit for the period 3,659 1,874 95
Key figures
EBITDA margin 28.0% 21.9%
Earnings per share 5.21 2.67
Reasons for changes in EBITDA (%) in 2018 compared with 2017
%
Price/mix 62
Volume –4
Raw material costs –17
Energy costs 1
Currency 10
Other –8
Total 44
The Swedish Parliament has decided to reduce the corporate tax rate in two steps. On January 1, 2019, tax will be reduced from 22.0% to 21.4%. In January 2021, tax will be further re-duced from 21.4% to 20.6%. The reduction of the corporate tax rate resulted in a revaluation of deferred tax liabilities in 2018, resulting in a positive one-off item of SEK 551m in the second quarter of 2018. The tax charge, including the revaluation of deferred tax liabilities, amounted to SEK –314m. Excluding the revaluation of deferred tax liabilities the tax charge amounted to SEK –865m (–544), corresponding to a tax rate of 21.8% (22.5).
Earnings per share amounted to SEK 5.21 (2.67)
Investment in expanded pulp capacity in ÖstrandIn 2015, SCA decided to invest in increased pulp production capacity at the Östrand pulp mill. The annual production capa-city of bleached softwood kraft pulp is expected to increase from the current level of 430,000 tonnes to about 900,000 tonnes.
The expanded pulp mill was put into operation according to plan in June 2018 following the expansion stop that commenced in April 2018. At the end of 2018, some SEK 7.4bn had been invest-ed, corresponding to about 95% of the total investment. The investment was financed from operating cash flow.
Cost structure 2018
Timber, chips, recovered fiber1 13%
Other raw materials and consumables 16%
Transport and distribution 23%
Energy 6%
Goods purchased for resale 8%
Personnel costs 20%
Other operating expenses 14%
1) Timber, chips and recovered fiber also included the change in inventories and changes in value in biological assets
SC
A A
NN
UA
L R
EP
OR
T 2
01
8
48
BOARD OF DIRECTORS’ REPORT
Credit structure and available credit facilities
Committedcredit amount, SEKm¹
Maturity years
Dec 31 2018 2019 2020 2021 2022 2023 2024+
Syndicated credit facilities2 8,000 4,500 3,500
Commercial paper 2,550 2,550
Bond issues 2,200 1,000 1,200
Svensk Exportkredit 1,500 500 500 500
European Investment Bank 1,480 160 160 1,160
Total 15,730 2,550 5,500 1,200 4,160 660 1,660
1) Whereof drawn loans amounted to SEK 7,730m2) All credit facilities are unutilized
Cash flowThe operating cash surplus amounted to SEK 4,503m (3,145). The cash flow effect of changes in working capital was SEK –843m (–143). Current capital expenditures, net, totaled SEK 1,002m (638). Operating cash flow was SEK 2,751m (2,273).
Income tax payments totaled SEK 229m (30). The relatively low income tax payments were primarily a result of large taxable deductions for depreciation on SCA’s new investments, includ-ing the Östrand project, and accumulated tax losses carried forward from previous years.
Operating cash flow statement
SEKm 2018 2017
Operating cash surplus 4,503 3,145
Change in working capital –843 –143
Current capital expenditures, net –1,002 –638
Other operating cash flow 93 –91
Operating cash flow 2,751 2,273
Financial items –29 –93
Paid tax –229 –30
Other 2 –41
Cash flow from current operations 2,495 2,109
Strategic capital expenditures in non–current assets –1,967 –2,863
Cash flow before dividend 528 –754
Financial positionSCA’s capital employed totaled SEK 46,082m (42,719) as of December 31, 2018, an increase during the year of SEK 3,363m. The increase was mainly attributable to investments in the Östrand pulp mill and the revaluation of SCA’s forest assets.
SCA’s net debt totaled SEK 7,020m (5,966) as of December 31, 2018, an increase of SEK 1,054m. Net debt totaled 1.3 times EBITDA and the debt/equity ratio was 18%.
At December 31, 2018, gross debt amounted to SEK 8,353m, with an average maturity of 3.8 years and an average fixed-inter-est rate period of 12 months. Unutilized credit facilities amount-ed to SEK 8,000m. Cash and cash equivalents amounted to SEK 648m at the end of the period.
Balance sheet structure
SEKm Dec 31, 2018 Dec 31, 2017
Biological assets 32,065 31,386
Deferred tax liabilities related to growing forest –6,605 –6,905
Biological assets, net 25,460 24,481
Working capital 3,735 2,861
Other capital employed, net 16,887 15,377
Total capital employed 46,082 42,719
Net debt 7,020 5,966
Net debt/EBITDA 1.3x 1.6x
Equity 39,062 36,753
Net debt/Equity 18% 16%
Other Group information
Parent CompanyThe object of the Group’s Parent Company, Svenska Cellulosa Aktiebolaget SCA (publ), is to own and manage shares in a number of subsidiaries and perform Group-wide management and administrative functions. The Parent Company also owns a large share of the company’s forest assets. The company’s corporate registration number is 556012-6293.
In 2018, operating income amounted to SEK 224m (225) and profit after financial items to SEK 857m (–575). For more infor-mation, refer to pages 113-118.
Holdings of treasury sharesSCA holds no treasury shares.
Distribution of sharesIn 2018, 319 Class A shares were converted to Class B shares at the request of shareholders. The total number of shares as per December 31 amounted to 702,342,489, of which 64,587,672 Class A shares and 637,754,817 Class B shares.
49
SC
A A
NN
UA
L R
EP
OR
T 2
01
8Introduction Strategy & operations Board of Directors’ Report Financial statements Sustainability facts OtherIntroduction
Sustainability work is integrated into SCA’s operations, which makes it natural to allow sustainability reporting, in accor-dance with the Swedish Annual Accounts Act Chapter 6, Section 11, to be part of a combined Annual Report and Sustain-ability Report 2018. This report relates to Svenska Cellulosa Aktiebolaget SCA (publ) and its subsidiaries, refer to Note F1 on page 105. The SCA Group, its oper-ations and business model are described overall in the Board of Directors’ Report on page 46. The Sustainability Report was submitted to the auditor at the same time as the Annual Report.
Governance of the sustainability agenda is described in the Corporate Governance Report and in Sustainability facts. SCA’s Code of Conduct is the Group’s fore-most steering document and constitutes, together with the Group’s Sustainability Policy, the basis of SCA’s sustainability
SCA’s sustainability reporting in accordance with the Annual Accounts Act
agenda. Follow-up and evaluation of these policies complies with SCA’s pro-cedures for internal control and audits, as described in the Corporate Governance Report on pages 55, 56, 58 and 59. In addition, SCA’s sustainability targets and priorities are also monitored through the Group’s Sustainability Council.
The management of material risks in the area of sustainability constitutes part of the Group’s general work with identifying and handling risks. This process, identified risks and managing these risks are de-scribed in the Board of Directors’ Report.
The strategic priorities for sustainability work, where SCA’s value chain can be influenced, how the areas are material for SCA’s stakeholders, how they are gov-erned and the most important result indi-cators are described in the sustainability facts, refer to the table on pages 126-127.
The table also shows how social condi-tions, personnel issues, the environment, human rights and anti-corruption are related to SCA’s sustainability agenda.
In addition to the information above, SCA’s sustainability work and the out-come of this work is described on the pages listed below, divided into sustain-ability areas according to the Swedish Annual Accounts Act:
• Social conditions and personnel issues, refer to pages 42-43, 128-129, 131-133 and 139.
• Environment, see pages 36-41, 134-138 and 140-141.
• Human rights and combating corrup-tion, refer to pages 128-129.
• Diversity policy for the Board of Direc-tors, refer to page 58.
DividendThe Board of Directors proposes a dividend of SEK 1.75 per share or SEK 1,229m. The record date for entitlement to receive dividends is proposed as March 22, 2019.
Environmental impact in Sweden In 2018, SCA operated 12 manufacturing sites for which a permit is required in Sweden. The value of deliveries from operations for which permits are required accounted for more than 90% of consolidated net sales in 2018. Four permits relate to the manufacture of pulp and paper. These operations impact the environment through emissions to air and water, solid waste and noise. Seven permits relate to the production of solid-wood and processed wood products, and biofuels and one permit pertains to the manufacture of fuel pellets. These operations impact the environment through emissions to air and water, and noise.
Guidelines for remuneration of senior executives The Board of Directors has decided to propose to the 2019 Annual General Meeting (AGM) the following guidelines for determining salaries and other remuneration for senior execu-tives to apply for the period following the AGM.
“Remuneration of the President and other senior executives will be comprised of a fixed amount, variable remuneration, pension and additional benefits, which, altogether is referred to as total remuneration. The total remuneration is to correspond to market practice and be competitive in the senior executive’s field of profession. Fixed and variable remuneration are to be linked to the manager’s responsibility and authority. For the President and other senior executives, variable remuneration is to be limited and linked to the fixed remuneration, based on earnings results in relation to annual and long-term established targets. The long-term goal is to be linked to the performance of the SCA share. Programs for variable remuneration must be designed
so that the Board has the possibility to limit payment of variable remuneration if such an action is considered reasonable and in compliance with the company’s responsibility to shareholders, employees and other stakeholders. Variable remuneration is not pensionable income. If termination of employment is initiated by the company, the notice period should be up to two years. If termination is initiated by the executive, the notice period is to be no more than one year. There will be no severance pay. Pen-sion benefits shall, to the extent possible, solely contain defined premium pension benefits. The planned retirement age is 65. The Board of Directors shall have the right to depart from the established guidelines if there in an individual case are special grounds to do so. The guidelines are not applicable to existing contracts. Matters of remuneration to senior executives are to be dealt with by a Remuneration Committee and, as regards the President, be resolved by the Board of Directors.”
For information concerning SCA’s guidelines for remuneration of senior executives, the application of the previously approved guidelines and information on the company’s calculated ex-penses for remuneration of senior executives, see Note C3.
Use of non-International Financial Reporting Standards (IFRS) performance measurements In the Board of Directors’ Report and in the Financial Re-ports and Notes in this Annual Report, a number of non-IFRS performance measurements can be found. The performance measurements are used to help investors and management to analyze the company’s development, and several of these are generally accepted financial measures. A description of these performance measurements and their use is found in Note A2.
Events after the end of the yearNo significant events have occurred after the end of the year.S
CA
AN
NU
AL
RE
PO
RT
20
18
50
BOARD OF DIRECTORS’ REPORT
Risks and risk management
SCA is exposed to a number of risks that could impact the company, its development and brand. These risks are generally defined as factors that impact SCA’s ability to be a credible and sustainable company with good profitability over time and to achieve established targets. Through effective risk management as described in this section, SCA attempts to mitigate the nega-tive effects of identified risks.
Many of the risks described could have a positive or negative impact on the Group. From this perspective, risk could also entail opportunities for SCA. Examples include “Demand and market price for SCA’s products” and “Raw material prices”.
Processes for risk managementSCA’s Board determines the Group’s strategic direction based on recommendations from the Executive Management Team. Responsibility for the long-term, overall management of risks corresponds with the company’s delegation scheme, from the Board to the President and from the President to the business area presidents. This implies that most of SCA’s operational
risks are managed by SCA’s business areas at the local level, but that they are coordinated when deemed necessary. The tools for this work primarily comprise continuous reporting by the business areas and the annual strategy process, where identifying, evaluating and managing risks are a part of the process. In this process, identified risks have been classified according to the likelihood of the risk materialising and the impact on SCA’s goal fulfillment. The outcome of this evaluation constitutes a part of the assessment of the risks described in this section.
SCA’s financial risk management is centralized, as is the corporate internal bank for the Group companies’ financial transactions and management of the Group’s energy risks. The financial risks are managed in accordance with the Group’s Financial Policy, which is set by SCA’s Board and, together with SCA’s Instructions for energy trading, comprises a framework for management activities.
SCA has a corporate internal audit function, which ensures that SCA’s organization complies with the set policies and agreed measures to manage identified risks.
Risk Risk management
Operational risks
Demand and market price for SCA’s productsDemand for SCA’s products is influenced by a variety of factors, such as the general GDP devel-opment, and also by more specific trends, such as an increase in e-commerce, a decline in newspaper reading and the resulting changes in the adver-tising market. Other sectors whose development influences demand for SCA’s products include construction activity and DIY. Other products and services can substitute SCA’s products at the same time as SCA’s products can also replace other products and materials.
For most of the product areas where SCA operates, there are a number of com-peting producers and distinct market prices. Supply is determined by the available production capacity at SCA and its competitors. Market price is determined at any time based on demand and supply. Sales contracts for SCA’s products may reflect that SCA’s price is a form of market price, though sometimes with a certain time lag compared with the development of the market, published price indexes, etc. Sales contracts can also state a specific price, which normally is for an open-ended period.Variations in market prices can cause significant fluctuations in profit for SCA.Several methods can be applied to address the risk of a fluctuating market price. Long-term contracts at fixed prices or price hedging only occur in exceptional cases. To reduce the impact of price movements, at least in cases where these are negative and are expected to be long-term, measures can be taken to adapt the cost scenario to the situation, for example, by renegotiating purchasing agreements, implementing personnel or capacity reductions, and reviewing the business structure. A transition to alternative production can also be considered where this is possible.
51
SC
A A
NN
UA
L R
EP
OR
T 2
01
8Introduction Strategy & operations Board of Directors’ Report Financial statements Sustainability facts Other

Risk Risk management
Operational risks, cont.
Raw material prices and other costs for input goods and servicesThe market price fluctuates over time for many of the input goods and services used in the manufac-ture of SCA’s products. This could influence SCA’s profit. 80% of SCA’s cost base of SEK 15,430m is made up of raw materials, energy and other input goods and services, including distribution services. SCA’s cost structure is described in the Board of Directors’ Report.
The risk of price movements related to input goods and services and the impact of this variation on earnings can be managed in several ways. SCA’s integrated value chain ensures that the raw material flows are integrated from forest land to the finished forest products. This integration entails, in itself, risk reduction. In 2018, 56% of SCA’s wood raw material requirements were sourced from its own forests and chips from its own sawmills. Wood fiber is used for SCA’s manufacturing of solid-wood products, pulp, kraftliner and publication paper. Logging residues from SCA’s activities are used to manufacture biofuels and sawdust to manufacture pellets. The energy generated in the production process is used internally or sold. Another method used to manage the price risk is by entering financial hedges and long-term contracts. SCA is an energy-intensive company and can, according to internal rules, hedge the electricity price risk for up to 36 months. Electricity price hedging is effected through financial instruments and fixed pricing in supply agreements. In 2018, SCA’s net purchases of electricity totaled 2.3 TWh (2.3). For 2019, 70% of forecast electricity pur-chases have been hedged, and for 2020, 39%. No hedging has been carried out for 2021.Under normal circumstances, no other price risks in input goods are hedged except for electricity. Other alternatives to manage variations in costs include renegotiating contracts, looking for new suppliers or replacing input goods and services where prices have risen with other products and services that fulfill the same function.
Environmental impactSCA’s operations have an impact on air, water, land and biological processes. These effects could lead to costs for restoring the environment or other kinds of negative effects. Demands for restoring the environment may also include the impact of SCA’s previous, now discontinued operations. SCA’s industrial operations in Sweden require a permit in accordance with the Swedish Environmental Code. Permits granted stipulate limits for the scope of operations and impact on surroundings. Any expansion or changes to operations may require further action. Forest operations are impacted by the Swedish Forestry Act and the Land Acquisition Act. The issue of risks associated with climate change is also growing in significance.
A number of years ago, SCA established a Sustainability Policy, detailing guidelines for the Group’s actions in the areas of environmental and social responsibility. In addition to this, targets for people and nature are an integrated part of SCA’s business strate-gy. Risks are minimized through preventive work in the form of certified environmental management systems, environmental risk inspections in conjunction with acquisitions, and remediation projects in connection with plant closures. SCA’s large forest holding has a significant positive climate impact through the absorption of CO2. The forest also guarantees access to renewable forest raw materials and provides valuable ecosystem services for society. Through its Resource Management System (RMS), SCA monitors how the company utilizes energy, water, transport activities and raw materials. The data is used for internal control and follow-up of established targets. SCA works proactively to decrease its carbon footprint by reducing its energy con-sumption and emissions of greenhouse gases from its own operations and by offering renewable products with low climate impact. Continuous efforts are conducted to increase the proportion of renewable energy and biofuels. SCA also works to reduce the volume of production waste. A description of SCA’s work and governance in this area is provided in the Sustainability facts section.
Business ethicsUnethical behavior or poor management of risk linked to business ethics can damage the compa-ny’s brand and reputation in the market. SCA may also suffer fines and other legal sanctions.
To ensure that SCA’s organization lives up to the company’s core values and is not involved in or tied to unethical business practices, there has been a Code of Conduct established since 2004. This includes general rules for how the company conducts its business and how its employees are to act toward each other and in business re-lationships. The Code is revised each year. The Code includes principles on business ethics, relationships to employees, respect for human rights and the environment. SCA’s Group policies, including its Code of Conduct and Sustainability Policy, apply to all markets and geographies in which SCA conducts operations. Training of all of SCA’s employees regarding the Code of Conduct takes place continu-ously. To ensure that SCA works with business partners that share these values, poten-tial partners are evaluated before cooperation is initiated. The evaluation comprises both business issues and issues concerning existing policies and processes regarding, for example, the work environment and business ethics. Suppliers are expected to comply with SCA’s Code of Conduct, which is regulated as a part of the supplier agreements. SCA uses a number of methods to monitor and safeguard the implementation of the Code of Conduct. These include due diligence in connection with acquisitions, risk evaluation of the company’s own units and suppliers, and regular on-site audits of SCA’s units and of suppliers deemed to have a higher risk level. More detailed informa-tion on operations can be found in the Sustainability facts section.
Risks in the forest land holdingSCA is Europe’s largest private forest owner, with 2.6 million hectares of forest land, of which 2 million hectares is productive forest land. There is a risk that the value of the forest portfolio decreases through infestation by pests and grazing moose, by storms or fire. Value can also change through variations in demand for wood raw material in SCA’s region, which in turn would impact price levels in the region.SCA’s forest management may conflict with the activities of reindeer herding Sami pertaining to land use. This may also be the case for land leased out for wind power projects.
SCA works proactively to improve forestry methods and seedlings to enhance forest growth. Active forest operations combined with an industry that adds value to the forest raw material is essential to secure the value of the forest asset. Since 1950, the sustainable harvesting level has more than doubled at the same time as the standing volume has increased by about 60%. The risk of infestation by pests is managed through diligent site preparation and spe-cial protection against pine weevils. The stock of grazing moose is managed as SCA gives out hunting licenses on its land. SCA’s forest land is spread across large areas of Northern Sweden, which means forest fires and storms can usually only impact a minor part of the forest. The forest is therefore not insured.SCA consults the relevant Sami communities in connection with forestry operations and wind power projects on SCA’s land. The consultation could cover issues including the time for harvesting, fertilization, site preparation and choice of tree species when plant-ing new forest. For wind power projects, consultation may be carried out concerning the size of the wind farm, its impact on reindeer herding and impact on Sami communities.
SC
A A
NN
UA
L R
EP
OR
T 2
01
8
52
BOARD OF DIRECTORS’ REPORT / RISKS AND RISK MANAGEMENT
Risk Risk management
Operational risks, cont.
Risks at production plantsSCA has 18 production facilities, primarily in Sweden but with some manufacturing in the UK and France. SCA also owns facilities for distribution, such as forest roads, timber terminals and port facilities in Sweden and other countries. Some of the facilities conduct continuous production. Fires, machinery breakdowns and other types of harmful incidents could damage the plant in question and also cause delivery problems. Poor health and safety practises at the production facilities may cause a workplace accident with substantial consequences for individu-al employees.
The aim of SCA’s work with these risks is to effectively and cost efficiently protect the employees, local residents, the environment, the company’s assets and the business, and to minimize SCA’s risk management costs. The loss-prevention work is conducted in accordance with established guidelines that include inspections and benchmarking with other plants, within and outside SCA. Other important elements of loss-prevention activities include maintenance of plants, staff training, good orderliness, and documentation. Production facilities work continuously to reduce their risks by using, for example, risk assessments and continuous improve-ments. All wholly owned plants are insured to replacement cost and for the loss of contribution margin. This insurance is effected in cooperation with market-leading insurance companies.SCA has a vision of zero workplace accidents and is actively and systematically running a health and safety program to minimize the risk of personal injury.
Impact of political decisionsSCA’s operations are influenced by political deci-sions and administrative rules, primarily in Sweden where SCA has much of its business, but also at EU level. This influence could be from general regula-tions, such as taxation and financial reporting. SCA is also impacted by more specific regulations, such as the granting of permits in accordance with the En-vironmental Code in Sweden and political decisions concerning transportation and forest operations in Sweden. Political decisions can have an impact on future harvesting levels. One important individual political decision is the UK’s decision to leave the EU (Brexit). The UK is one of SCA’s most important mar-kets and accounts for about 18% of SCA’s net sales.
SCA works to monitor and evaluate changes in its surroundings and amended legislation, and to identify actions that lead to changes that benefit SCA. SCA is also a member of national and international trade associations, which comprise the primary bodies for participation in current public debates. A key area for SCA is global energy and environmental legislation. SCA monitors developments in prioritized areas, such as resource consumption in general and, more specifically, regarding issues relating to waste and emissions to water and air. It is important for SCA to monitor EU emission rights trading, regulations concern-ing waste and circular economy initiatives. As regards Brexit, the UK’s import needs for wood products, pulp and paper will remain even after its exit from the EU. Approximately half of SCA’s net sales in the country are purchased from local suppliers. SCA’s non-current assets in the UK amount to less than 1% of SCA’s total non-current assets. There are no expectations today of any material changes in UK import duties or similar restrictions on SCA’s products. Assuming a strong UK economy and stable exchange rates, SCA expects to maintain a significant volume of sales in the UK.
Customer dependencyIn 2018, SCA’s ten largest customers accounted for about 29% of SCA’s net sales. The risk of too great a dependency on an individual customer is that lost sales from an individual customer could have a nega-tive impact on SCA’s earnings.
SCA works continuously in building relations with new customers in order to reduce the consequences of lost sales from established customers. Generally, customers in the pulp and paper segment are major companies, such as newspaper and mag-azine publishers, tissue manufacturers and corrugated board manufacturers. Within Wood, SCA has developed completely new customer segments over the years. Traditional distributors in Wood are generally wholesalers of solid-wood products. In addition to this, SCA has built up relationships with distributors in the building materials trade, which are more focused on distribution to consumers, including the DIY segment. For this category, SCA often distributes the products directly to each customer’s store. Sales of specialized components often takes place directly to the industry.
SuppliersSCA is dependent on a large number of suppliers. The loss of key suppliers could result in costs for SCA and problems in manufacturing. Suppliers that fail to comply with SCA’s Code of Conduct could also cause problems for SCA.
To reduce this risk, SCA has supply contracts with multiple suppliers. For timber supply in the part that is not sourced from the company’s own forests, SCA has built up a sourcing organization with about 80 timber purchasers, distributed between local offices across the region. Through this organization, SCA has rela-tionships with approximately 17,000 private forest owners in the region. SCA may also sell silvicultural services to these forest owners. About 100 contractors are responsible for most of the harvesting, about 100 for transportation to SCA’s indus-tries and another 110 for forest management. For most important input goods and services, there are a number of suppliers available in the market. This is also often the case for suppliers of maintenance and building services for facilities.A SCA Supplier Standard has been established that for example includes working conditions, health and safety and business ethics. SCA’s suppliers must agree to follow the standard and may be required to undergo an audit.
IT security and IT risksSCA relies on IT systems in its day-to-day opera-tions. Disruptions or faults in critical systems have a direct impact on production and important business processes. Errors in the handling of financial systems can affect the company’s reporting. The risk of un-authorized intrusion into SCA’s systems may result in financial losses and other damage. These risks grow in an increasingly technically complex and interlinked world.
SCA has established a management model for IT that includes governance, standardized IT processes and an organization for IT security. The IT security work includes a continuous risk assessment, the introduction of preventive measures and use of security technology. Standardized processes are in place for the implemen-tation of new systems, changes to existing systems and daily operations. The ma-jority of SCA’s system landscape is based on well-proven products, such as SAP.
53
SC
A A
NN
UA
L R
EP
OR
T 2
01
8Introduction Strategy & operations Board of Directors’ Report Financial statements Sustainability facts OtherBOARD OF DIRECTORS’ REPORT / RISKS AND RISK MANAGEMENT
Risk Risk management
Operational risks, cont.
Employee-related risksSCA must have access to skilled and motivated employees and safeguard the availability of compe-tent managers to achieve established strategic and operational objectives.
SCA works in a structured manner to ensure the health and well-being of its employ-ees through proactive preventative healthcare activities, such as education, exercise, special initiatives, for example to help employees quit smoking, and by offering health checks. SCA also places great importance on safety at all of its units.SCA’s strategic manpower planning secures access to people with the right exper-tise at the right time. Recruitment can take place both externally and internally, and internal recruitment and job rotation are facilitated by a job portal, where available positions are advertised both internally and externally. Salaries and other condi-tions are to be adapted to the market and linked to SCA’s business priorities. An established succession planning program protects the operations. SCA strives to maintain good relationships with union organizations.
Financial risks
CurrencySCA’s focus on exports makes SCA’s operations highly dependent on currency. About 85% of sales are conducted in currencies other than SEK. Most purchasing is conducted in SEK. Only a minor share of purchasing is carried out in other currencies. Fluc-tuations in currency rates have a substantial impact on SCA’s revenue and thereby on earnings.
The table shows the net exposure for the three largest currencies in 2018, and the total of other foreign currencies, measured as sales in each foreign currency less purchases in the same currency. In accordance with SCA’s Financial Policy, this exposure is hedged as follows: All balance-sheet items in foreign currency are hedged, as is exposure in major approved and contracted invest-ments in non-current assets. According to the policy, transaction exposure regarding expected future net flows may also be hedged for up to 18 months. At December 31, 2018, SCA had hedged about 70% of the expected net EUR and USD exposure from sales less purchases in the first six months of 2019, about 50% for the third quarter and approximately 25% for the fourth quarter 2019 at the average EUR/SEK exchange rate of 10.23 and average USD/SEK exchange rate of 8.59.Translation exposure, meaning the risk to which SCA is exposed when translating foreign subsidiaries’ balance sheets and income statements to SEK, is less import-ant to SCA as the total assets in these companies only amount to 3% of SCA’s total assets. Translation exposure in the foreign subsidiaries is not currency-hedged.
Credit riskCredit risk refers to the risk of losses due to a failure to meet payment obligations by SCA’s counterparties in financial agreements or by customers.
Credit exposure in accounts receivable amounted to SEK 2,629m as per Decem-ber 31, 2018. Credit risk in accounts receivable is managed through credit checks of customers using credit rating companies. Credit limits are set and regularly monitored. Accounts receivable are recognized at the amount that is expected to be received based on an individual assessment of each customer. The financial credit exposure, in which the counterparty is a financial actor or a pension fund manager, amounted to SEK 1,725m as per December 31, 2018. This exposure includes credit risk of SEK 648m for cash and cash equivalents and credit exposure in derivative instruments amounting to SEK 401m. The objective is that financial counterparties must have a credit rating of at least A- from at least two credit rating institutes.
Liquidity and refinancing riskLiquidity and refinancing risk is the risk that SCA is unable to meet its payment obligations as a result of insufficient liquidity or difficulty in raising new loans.
As of December 31, 2018, SCA’s gross debt amounted to SEK 8,353m and the average duration, including unutilized credit facilities, to 3.8 years. Unutilized credit facilities amounted to approximately SEK 8,000m at the end of the year, and cash and cash equivalents to SEK 648m. To ensure good access to loan financing, SCA strives to achieve an investment grade rating. On April 7, 2018, the credit rating agency Standard and Poor’s (S&P) assigned SCA the credit rating of “BBB” with a stable outlook. SCA is to maintain financial flexibility in the form of a liquidity reserve consisting of cash and cash equivalents and unutilized credit facilities totaling at least 10% of the Group’s annual sales. SCA limits its refinancing risk by having a good distribution in the maturity profile of its gross debt. The gross debt must have an average maturity in excess of three years, taking into account unutilized credit facilities. Surplus liquidity should primarily be used to amortize external liabilities. As of December 31, 2018, SCA’s financing mainly comprised credit facilities from a group of four banks with high credit ratings, bilateral loans from the Swedish Export Credit Corporation and the European Investment Bank and issued bonds and commercial papers.
Interest rate risksInterest rate risk relates to the risk that movements in the interest rates could have a negative impact on SCA.
SCA’s policy is that the average fixed-rate period shall be within the interval 3-36 months. SCA’s average interest period for the gross debt, including derivatives, was 12 months as of December 31, 2018. The risk is managed using fixed-interest loans or through interest rate derivatives. A sensitivity analysis is presented in Note E7.
Net exposure 2018
EUR EUR 599m
USD USD 368m
GBP GBP 146m
Others (translated to SEK) SEK 643m
Total SEK 11,716m
SC
A A
NN
UA
L R
EP
OR
T 2
01
8
54
BOARD OF DIRECTORS’ REPORT / RISKS AND RISK MANAGEMENT
Corporate governanceCorporate governance aims to ensure SCA’s commitments to all of its stakeholders, including shareholders, customers, suppliers, creditors,
society and employees. In addition, corporate governance supports the company’s long-term strategy, market presence and competitiveness.
Corporate governance shall be reliable, clear, straightforward and business-oriented. This Corporate Governance Report forms part of the Board of Directors’ Report for SCA’s 2018 Annual Report in accordance
with Chapter 6, Section 6 of the Swedish Annual Accounts Act (1995:1554). The report has been reviewed by the company’s auditor.
Corporate governance, including remuneration, pages 55–61. This section describes the rules and regulations and the Group’s corporate governance, including a description of the operational organization. It also details the Board of Directors’ responsibilities and its work during the year. Information regarding remuneration in SCA and internal control in the Group are also included here. SCA applies the Swedish Corporate Governance Code without any exceptions, observing the changes made to the Code on December 1, 2016 (www.corporategovernanceboard.se).
Risks and risk management, page 51–54SCA’s processes to identify and manage risks are part of the Group’s strategy work and are pursued at a local and Group-
Shareholder meeting/Annual General MeetingThe shareholders’ meeting is SCA’s highest decision-making body, where all shareholders are entitled to attend, to have a matter considered and to vote in respect of all shares held by the shareholder. According to its Articles of Association, SCA has two listed classes of shares: Class A and Class B shares. Every Class A share represents 10 votes and every Class B share represents one vote. The Annual General Meeting (AGM) is the name of the annual shareholders’ meeting at which the annual report is presented. Among other matters, the company’s Board of Directors and the Chairman of the Board are elected at the AGM. The AGM also appoints the company’s auditors.
Nomination CommitteeThe Nomination Committee represents the company’s share-holders and is charged with the task of preparing proposals for adoption at the AGM with respect to election and remuneration matters and, in certain cases, proposing procedural motions for the next Nomination Committee.
Board of DirectorsThe Board of Directors has the overall responsibility for the company’s organization and administration through regular monitoring of the business and by ensuring the appropriateness
wide level. The section dealing with risk management describes the most significant risks, and the governing documents and measures that the Group applies to manage these.
Sustainability, pages 34–43 and 119–141SCA’s sustainability work is an integral part of the company’s business model and operations. The sustainability work helps the company reduce risks and costs, strengthen competitive-ness, and attract talent and investors. The President and CEO bears the overall responsibility for the control of SCA’s business in the field of sustainability. SCA has a Group Function in charge of sustainability, led by SCA’s Sustainability Director. The work is coordinated through the Group’s Sustainability Council and a number of cross-disciplinary networks.
of the organization and management team, and also compliance with guidelines and internal control. The Board approves strat-egies and targets, and decides on major investments, acquisi-tions and divestments of operations, among other matters.
At the 2018 AGM, it was resolved that the Board of Directors shall comprise ten members elected by the AGM with no deputies. In addition, the Board shall include three employee representatives and three deputies.
SCA’s Articles of Association contain no provisions regarding appointment or dismissal of Board members or amendments to the Articles.
Chairman of the BoardThe Chairman of the Board leads the work of the Board and is responsible for ensuring that it is effectively organized and that work is efficiently conducted. This includes continuously monitoring the company’s operations in close dialogue with the President and CEO and ensuring that other Board members receive information that will enable high-quality discussion and decisions by the Board. The Chairman leads the assessment of the Board’s and the President’s work. The Chairman also represents the company in ownership matters.
Governance at SCA
55
SC
A A
NN
UA
L R
EP
OR
T 2
01
8Introduction Strategy & operations Board of Directors’ Report Financial statements Sustainability facts OtherIntroduction
Audit CommitteeThe company’s Board has, within itself, established an Audit Committee. The tasks of the Audit Committee include moni-toring financial reporting and the efficiency of the company’s internal control, internal audit and risk management, and it sub-mits recommendations and proposals to ensure the reliability of reporting. The Committee keeps itself informed on the audit, reviews and monitors the impartiality and independence of the auditor and submits recommendations to the Nomination Com-mittee as a basis for the appointment of auditor and the determi-nation of remuneration, and information to the Board concerning the results of the audit in order to fulfill all requirements of the EU Audit Regulation and Directive. The Audit Committee sets guidelines for the procurement of services other than auditing services from the company’s auditors. Lastly, the Audit Com-mittee evaluates the audit quality and informs the Nomination Committee of the results of the evaluation.
Remuneration CommitteeThe company’s Board also has established within itself a Remu-neration Committee. The Remuneration Committee prepares the Board’s motions on issues relating to remuneration principles and remuneration and other terms and conditions of employment for the President and CEO, and is authorized to make decisions in these matters for the company’s other senior executives. The Committee monitors and assesses programs for variable remu-neration, the application of the AGM’s resolution on guidelines for remuneration of senior executives and the applicable remu-neration structure and remuneration levels in the Group.
Internal auditAt SCA, it is the employees’ responsibility to ensure sound internal governance and control in the operation or process for which they are responsible. Internal audit is a separate function with the task of evaluating and improving the efficiency of SCA’s internal gover-nance and control, as well as its risk management. This function reports to the Audit Committee and the Board in relation to inter-nal audit issues. The function examines, among other aspects, SCA’s internal processes for sales, purchases, annual accounts and financial reporting, non-current assets, compensation and benefits, HR issues, information security and IT systems, various types of projects and compliance with SCA’s policies including follow-up on the Code of Conduct and general instructions.
External rules and regulations include
• The Swedish Companies Act
• International Financial Reporting Standards (IFRS)
• Nasdaq Stockholm’s rules for issuers
• Swedish Corporate Governance Code
• Relevant EU regulations
Internal rules and regulations include
• Articles of Association
• Working procedures of the Board of Directors
• Terms of reference issued by the Board to the President and CEO
• Code of Conduct
• Other policy documents estab-lished by the Board and instruc-tions established by the President and CEO.
COMPLIANCE WITH STOCK MARKET REGULATIONS
In 2018, SCA was not sanctioned by the Swedish Financial Supervisory Authority, the stock exchange’s disciplinary board or any other authority or self-regulating body for violations of the rules concern-ing the stock market.
FACT BOX:
Read more about SCA’s Corporate Governance at www.sca.com. This includes:
• SCA’s Articles of Association
• Link to the Swedish Corporate Governance Code
• Information from previous Annual General Meetings since 2015 (notices, minutes, President and CEO’s speeches) and press releases since 2012
• Information from the Nomination Committee since 2006 (composition, proposals and work done)
• Information ahead of the 2019 Annual General Meeting (notice, Nomination Committee proposals including the Audit Com-mittee’s recommendation, Board proposal for principles for remuneration of senior executives, information on routines for notifying attendance to the Meeting, etc.)
• Earlier Corporate Governance Reports, since 2007
President and CEO and Executive ManagementSCA’s President and CEO is responsible for and manages the day-to-day administration of the Group and follows the Board’s guidelines and instructions. The President is supported by the Executive Management Team, the work of which is led by the President. The Executive Management Team comprises the President, the CFO, the Presidents of the Business Areas Forest, Paper, Pulp, Wood and Renewable Energy and the President for the support unit Sourcing and Logistics. Further, the Senior Vice Presidents of the Group functions Human Resources, Legal Affairs, Communications and Strategic Development are also members of the team. The working procedures for the Board of Directors and terms of reference issued by the Board of Direc-tors to the President and CEO detail, for example, the division of work between the Board and President. In consultation with the Chairman of the Board, the President prepares documentation and background information for the Board’s work.
SC
A A
NN
UA
L R
EP
OR
T 2
01
8
56
BOARD OF DIRECTORS’ REPORT / CORPORATE GOVERNANCE REPORT

on one or two additional members from among the next largest shareholders in terms of voting rights, so that the total number of members amounts to not more than seven. In the event that a member steps down from the Nomination Committee before the task is completed and the Nomination Committee decides it would be beneficial for a replacement to be appointed, such a replacement is to be appointed by the same shareholder or, if this shareholder is no longer among the largest shareholders in terms of voting rights, by the largest unrepresented shareholder in terms of voting rights. Changes to the composition of the Nomination Committee are to be disclosed immediately. The composition of the Nomination Committee is to be disclosed not later than six months prior to the AGM. No remuneration is to be paid to the members of the Nomination Committee. Any expenses incurred during the work of the Nomination Committee are to be paid by the company. The mandate period of the Nomination Committee extends until the composition of the next Nomination Committee is disclosed. The Nomination Committee is to submit proposals relating to the Chairman of the General Meeting, the Board of Directors, the Chairman of the Board, Board fees for the Chair-man of the Board and each of the other Board members, includ-ing remuneration for committee work, the company’s auditors and auditors’ fees.
In its work, the Nomination Committee has considered the rules that apply to the independence of Board members, as well as the requirement of diversity and breadth with the endeavor to achieve an even gender distribution and that the selection for those nomi-nated shall be based on expertise and experience relevant to SCA.
When preparing its proposal for the election of auditors and remuneration, the Nomination Committee has also considered the Audit Committee's recommendation.
Composition of the Nomination Committee for the 2019 AGMThe composition of the Nomination Committee for the 2019 AGM is as follows:
• Karl Åberg, AB Industrivärden, Chairman of the NominationCommittee
• Petter Johnsen, Norges Bank Investment Management
• Javiera Ragnartz, AMF Insurance and Funds
• Håkan Sandberg, Handelsbanken Pension Foundation, amongothers
• Pär Boman, Chairman of the Board, SCA
Shareholders have had the opportunity to submit proposals to the Nomination Committee. The Nomination Committee’s proposal for the 2019 AGM is presented in the notice convening the AGM on SCA’s website www.sca.com. The 2019 AGM will be held on March 20.
The Nomination Committee was convened on three occasions up to January 31, 2019. The Chairman of the Board has presented the Board evaluation and provided the Nomination Committee with information regarding Board and committee work during the year.
SCA adheres to the principle of distinct decentralization of responsibility and authority. The business areas are fully responsible for developing their respective operations through established objectives and strategies, a process that is also centrally coordinated. Each business area is responsible for its operating result, capital and cash flow. The position of the business and results are followed up by the entire Executive Management Team on a monthly basis. Each quarter, business review meetings are conducted during which the management of each business area personally meet with the President, the CFO and others. These meetings function as a complement to the daily monitoring of operations.
External auditorsThe company’s auditor, elected at the Annual General Meeting, examine SCA’s accounting, the Group’s annual report and sustainability report, the Board’s and President and CEO’s ad-ministration and the annual reports of subsidiaries, and submits an audit report.
The audit is performed in accordance with the Swedish Compa-nies Act, the Swedish Annual Accounts Act, International Stan-dards on Auditing (ISA) and generally accepted auditing principles in Sweden, which also includes a review of compliance with the Swedish Companies Act and the Swedish Annual Accounts Act.
Activities during the year
Annual General MeetingThe AGM was held on Friday, March 23, 2018 in Sundsvall. A total of 650 shareholders were represented at the Meeting, either personally or by proxy, representing approximately 59.6% of the votes in the company. Eva Hägg, Attorney-at-Law, was elected Chairman of the Meeting.
The Meeting resolved that a dividend of SEK 1.50 per share be paid for the 2017 fiscal year. The AGM decided on the re-election of Board members Pär Boman, Charlotte Bengtsson, Lennart Evrell, Annemarie Gardshol, Ulf Larsson, Martin Lindqvist, Lotta Lyrå and Barbara Milian Thoralfsson. Anders Sundström was newly elected. Pär Boman was re-elected as the Chairman of the Board. Ernst & Young was reelected as auditor for the period until the 2019 AGM. Moreover, guidelines for determining the salary and other remuneration of the President and other senior executives were adopted; see Note C3. The minutes of the Meeting in full and information on the 2018 AGM, including the President’s speech, are available at www.sca.com.
Nomination CommitteeThe 2017 AGM decided that the following procedure for appoint-ing the Nomination Committee is to apply until further notice. The Nomination Committee is to comprise representatives from the four largerst shareholders in terms of voting rights as per the shareholders’ register maintained by the company on the final banking day of August, as well as the Chairman of the Board. The Chairman of the Board is to convene the first meeting of the Nomination Committee. The member representing the largest shareholder in terms of votes is to be appointed as Chairman of the Nomination Committee. If necessary, due to subsequent ownership changes, the Nomination Committee is entitled to call
57
SC
A A
NN
UA
L R
EP
OR
T 2
01
8Introduction Strategy & operations Board of Directors’ Report Financial statements Sustainability facts OtherIntroduction
Diversity policyWhen preparing proposals for the Board for the 2018 AGM, the Nomination Committee has applied Item 4.1 of the Swedish Corporate Governance Code as its diversity policy. The policy aims to ensure that the Board has an, with regards to the com-pany’s operations, stage of development and circumstances in general, an appropriate composition characterized by diversity and breadth as regards the AGM-elected members’ expertise, experience and background with the endeavor to achieve an even gender ratio. The 2018 AGM resolved in accordance with the Nomination Committee’s proposal, which meant ten mem-bers were elected, of which four were women and six men.
When preparing proposals for the Board for the 2019 AGM, the Nomination Committee has worked with and applied the diversity policy in a corresponding manner, which resulted in the proposal for the Board described in the notice convening the AGM.
The Nomination Committee’s proposal entails the appointment of ten Board members, of which four are women and six men.
Board of DirectorsSCA’s Board of Directors comprises ten members elected by the AGM on March 23, 2018. In addition to these members, there are three employee representatives and their three deputies.
The SCA Board of Directors comprises the AGM-elected members Pär Boman (Chairman), Charlotte Bengtsson, Lennart Evrell, Annemarie Gardshol, Ulf Larsson (President and CEO), Martin Lindqvist, Lotta Lyrå, Bert Nordberg, Anders Sundström and Barbara Milian Thoralfsson.
The independence of Board members is presented in the table on page 59. SCA complies with the requirements of the Swedish Code of Corporate Governance that stipulate that not more than one member elected by the AGM shall be a member of compa-ny management, that the majority of the members elected by the AGM shall be independent of the company and company management, and that not fewer than two of these shall also be independent of the company’s major shareholders. All of the AGM-elected Board members have experience of the require-ments incumbent upon a listed company.
The following three employee representatives were appointed to the Board for the period until the 2019 AGM: Roger Boström, Johanna Viklund Lindén and Hans Wentjärv, and their deputies Per Andersson, Maria Jonsson and Stefan Lundkvist. Further information concerning the Board members can be found on pages 62 – 63.
Board activitiesIn 2018, the Board was convened ten times. The Board has established working procedures. The working procedures describe in detail which ordinary agenda items are to be ad-dressed at the various Board meetings of the year. Recurring
agenda items are finances, the market situation, investments and adoption of the financial statements. The Board also establishes and evaluates the company’s overall objectives and strategy and decides on significant internal rules. Another task is to continuously monitor the internal control and compliance of the company and its employees with internal and external rules, and that the company has well-functioning procedures for market disclosures. On a regular basis throughout the year, the Board also deals with reports from the Audit and Remuneration Committees and reports on internal control and financial opera-tions. The company’s auditor regularly presents a report on the audit work and these issues are discussed by the Board.
Board activities in 2018, in addition to standard duties, have involved strategy issues, training and site visits for the Board members to SCA’s business areas.
Evaluation of the Board’s workThe work of the Board, as that of the President, is evaluated an-nually using a systematic and structured process, the purpose of which is to obtain a sound basis for the Board’s own devel-opment work and to provide the Nomination Committee with relevant analysis for its nomination work. In 2018, the evaluation took the form of an anonymous questionnaire and interviews as well as group and individual discussions between the Chairman of the Board and the members. The evaluation covers such areas as the Board’s methods of work, effectiveness, expertise and the year’s work. The Board was provided with feedback after the results were compiled. The Nomination Committee was also informed of the full results of the evaluation.
Audit CommitteeThe Audit Committee comprises Barbara Milian Thoralfsson (Chairman), Pär Boman and Martin Lindqvist. The Audit Commit-tee held six meetings in 2018. In its monitoring of the financial reporting, the Committee dealt with relevant accounting issues, internal auditors’ reviews, auditing work and a review of internal control procedures and the measurement of the Group’s forest assets. The Audit Committee also prepared a recommendation to be used by the Nomination Committee when deciding on its proposal to the AGM regarding the election of auditors and remuneration.
Remuneration CommitteeThe Remuneration Committee comprises Pär Boman (Chair-man), Bert Nordberg and Lennart Evrell. The Remuneration Committee held six meetings in 2018. Activities in 2018 mainly concerned remuneration and other employment terms and conditions for senior executives, and current remuneration structures and remuneration levels in the Group.
Internal auditThe basis of the work with internal audit is a risk-based annual plan. The plan derives from a risk assessment process based on
SC
A A
NN
UA
L R
EP
OR
T 2
01
8
58
BOARD OF DIRECTORS’ REPORT / CORPORATE GOVERNANCE REPORT

Board of Directors and committees
Names Elected DependenceThe Board of
Directors AttendanceAudit
Committee AttendanceRemuneration
Committee Attendance
Pär Boman 2010 Chairman 10 Member 6 Chairman 6
Charlotte Bengtsson 2017 Board member 10
Lennart Evrell 2017 Board member 10 Member 6
Annemarie Gardshol 2015 Board member 10
Ulf Larsson 2017 Board member 10
Martin Lindqvist 2017 Board member 10 Member 6
Lotta Lyrå 2017 Board member 10
Bert Nordberg 2012 Board member 10 Member 6
Anders Sundström 2018 Board member 61
Barbara Milian Thoralfsson 2006 Board member 10 Chairman 6
Number of meetings in 2018
The Board of Directors 10
Audit Committee 6
Remuneration Committee 6
The largest shareholdersAs of December 31, 2018, AB Industrivärden was the company’s largest shareholder, with a holding totaling 35,000,000 Class A shares and 31,800,000 Class B shares, corresponding to 9.5% of the total number of shares and 29.7% of the total number of votes in the company. No other shareholder in the company has a direct or indirect shareholding whose voting rights represent one-tenth or more of the total number of votes in the company.
Dependent in relation to the company’s major shareholder – Industrivärden President of SCA – Dependent in relation to the company and corporate
management Dependent in relation to the company and corporate management – Presi-
dent of Skogforsk
documentation from operations, management and the Board. The annual plan is approved by the Audit Committee. In 2018, 14 internal audit assignments were conducted. Observations from the assessments are reported to the Audit Committee.
During 2018, work included follow-up of the organization’s work concerning the effectiveness of internal controls and monitor-ing regulatory compliance, which primarily consisted of SCA’s control documents, including the Code of Conduct.
External auditorsThe 2018 Annual General Meeting appointed accounting firm Ernst & Young AB as the company’s auditor for a mandate pe-riod of one year. The accounting firm notified the company that Hamish Mabon, Authorized Public Accountant, would be the auditor in charge. Hamish Mabon is also the auditor for Skanska AB, Essity AB and Husqvarna AB. The auditor owns no shares in SCA.
In accordance with its working procedures, the Board met with the auditor at four scheduled Board meetings in 2018. The auditor also attended each meeting of the Audit Committee. At these meetings, the auditor presented and received opinions on the focus and scope of the planned audit and delivered verbal audit and review reports. Further, at the Board’s third scheduled autumn meeting, the auditor delivered a preliminary report on the audit for the year. The working procedures specify a number of mandatory issues that must be covered. These include matters of importance that have been a cause for remark or discussion during the audit, business routines and transactions where differences of opinion may exist regarding the choice of accounting procedures. The auditor shall also provide an account of consultancy work assigned to the audit firm by SCA and the audit firm’s independence in relation to the company and its management. On each occasion, Board members have had an opportunity to ask the auditor questions. Certain parts of the detailed discussion on the accounts take place without representatives of company management being present.
1) Elected 2018.
59
SC
A A
NN
UA
L R
EP
OR
T 2
01
8Introduction Strategy & operations Board of Directors’ Report Financial statements Sustainability facts OtherIntroduction

External financial reportingThe quality of external financial reporting is guaranteed via a number of actions and procedures. The President is responsible for ensuring that all information issued, such as press releases with financial content, presentation material for meetings with the media, owners and financial institutions, is correct and of a high quality. The responsibilities of the company’s auditors include reviewing accounting issues that are critical for the financial reporting and reporting their observations to the Audit Committee and the Board of Directors. In addition to the audit of the annual accounts, a review of the six-month report and of the company’s administration and internal control is carried out.
Risk managementWith regard to financial reporting, the risk that material errors may be made when reporting the company’s financial position and results is considered the primary risk. To minimize this risk, control documents have been established pertaining to accounting, procedures for annual accounts and follow-up of reported annual accounts. There is also a common system for reporting annual accounts. SCA’s Board of Directors and man-agement assess the financial reporting from a risk perspective on an ongoing basis. To provide support for this assessment, the company’s income statement and balance sheet items are compared with earlier reports, budgets and other forecasts.
The Board’s responsibility for internal governance and control is regulated in the Swedish Companies Act, the Annual Accounts Act and the Swedish Corporate Governance Code. The Annual Accounts Act requires that the company, each year, describes its system for internal control and risk management with respect to financial reporting. The Board bears the overall responsibility for financial reporting. Its working procedures regulate the inter-nal division of work between the Board and its committees.
The Audit Committee has an important task of preparing the Board’s work to assure the quality of financial reporting. This preparation work includes issues relating to internal control and regulation compliance, control of recognized values, estima-tions, assessments and other activities that may impact the quality of the financial statements. The Committee has charged the company’s auditor with the task of specifically examining the degree of compliance in the company with the rules for internal control, both general and detailed.
Financial reporting to the BoardThe Board’s formal work plan stipulates which reports and in-formation of a financial nature shall be submitted to the Board at each scheduled meeting. The President ensures that the Board receives the reports required to enable the Board to continuous-ly assess the company’s and Group’s financial position. Detailed instructions specifically outline the types of reports that the Board is to receive at each meeting.
Internal control and financial reporting
Variable remuneration and strategic targetsPrograms for variable remuneration are designed to support the Group’s strategic targets. The short-term program is individu-ally adapted and based mainly on profit, cash flow and capital efficiency. The long-term program is based on the SCA share’s long-term total shareholder return.
Remuneration of the BoardThe total remuneration of the AGM-elected Board members is presented in Note C4.
GuidelinesThe 2018 Annual General Meeting adopted guidelines for remu-neration of senior executives. The total remuneration package comprises a fixed salary, variable salary, other benefits, and a pension. See Note C3.
Remuneration of the President and CEO and other senior executivesRemuneration of the President and other senior executives is presented in Note C3.
Remuneration, Executive Management Team and Board of Directors
SC
A A
NN
UA
L R
EP
OR
T 2
01
8
60
BOARD OF DIRECTORS’ REPORT / CORPORATE GOVERNANCE REPORT
Control activities and follow-upSignificant instructions and guidelines related to financial report-ing are prepared and updated regularly by the Group Finance Function and are accessible on the Group’s intranet. The Group Finance Function is responsible for ensuring compliance with instructions and guidelines. Process owners at various levels within SCA are responsible for carrying out the necessary con-trol measures with respect to financial reporting. An important role is played by the business areas and support units’ finance and controller organizations, which are responsible for ensuring that financial reporting from each unit is correct, complete and delivered in a timely manner. The company’s control activities are supported by the budgets prepared by each unit and updated during the year through regular forecasts.
SCA has introduced a standardized system of control measures involving processes that are significant to the company’s finan-cial reporting, among other matters. The controls are adapted to the operational process and system structure of each unit. Accordingly, each unit prepares a record of the actual con-trols to be carried out in the unit in question. Control of these processes is assessed and updated through self-evaluation followed up by a review through the internal control function. In some cases, SCA has enlisted help to validate these control measures from the internal auditors and external parties.
Financial results are reported and examined regularly within the management teams of the operating units and communicated to SCA’s management at monthly and quarterly meetings. Before reports are issued, results are analyzed to identify and eliminate any mistakes in the process until closing.
The Board follows up to ensure that the internal control and reporting to the Board functions through continuous reporting from the President and CFO and through reporting from the internal audit unit in the scope of the audit plan set annually. Internal audit also continuously reports its observations in this respect to the Audit Committee. Internal audit’s tasks include following up compliance with the company’s policies. The results of this follow-up are reported to the Board through the Audit Committee.
Internal control of other processesThe basis for the internal control is identifying and assessing risks. A review of identified risks is conducted every year with the addition of any new identified risks. At the same time, an evaluation is carried out of the potential impact of the risks on profits and the brand, and the probability that the risk will occur. Risks that threaten business objectives are linked to the company’s processes. For each process and identified risks, the control activities are defined that must be established to man-age risks, and a description of how self-assessments are used to monitor the effectiveness of the control activities.
Control activities to mitigate the identified risks are document-ed, and the effectiveness of each control is tested on an annual basis through self-assessments. The Group’s internal control function summarizes the result of the self-assessments and reports to management and the Board.
Activities in 2018In 2018, SCA has continued to develop the framework for internal control. The scope of the self-assessment of control procedures has been extended to include more processes and units. The results of the self-assessment have been reported to the Board.
61
SC
A A
NN
UA
L R
EP
OR
T 2
01
8Introduction Strategy & operations Board of Directors’ Report Financial statements Sustainability facts OtherIntroduction

Board of Directors and Auditors
Pär Boman (1961) Engineering and Business/ Economics degree
Chairman of the Board since 2015. Chairman of the Board of Svenska Handelsbanken AB and Essity AB, and Deputy Chairman of the Board of AB Industrivärden. Board member of Skanska AB. Former President of Handelsbanken during the period 2006 to 2015.
Elected: 2010Class B shares: 10,000
Independent of the company and corporate management.
Charlotte Bengtsson (1971)MSc Civil Engineering, PhD in Steel and Timber Structures
President of Skogforsk and Adjunct Professor in timber engineering at Linnaeus Univer-sity. Board member of Södra’s Research Foundation, Norrskog’s Research Foundation, the Nils and Dorthi Troedsson’s Research Foundation.
Elected: 2017
Independent of SCA’s major shareholders.
Lennart Evrell (1954)MSc Eng. and Econ.
Board member of Epiroc, the Confederation of Swedish Enter-prise and Industriarbetsgivarna. Former CEO of Boliden, Sapa and Munters.
Elected: 2017Class B shares: 4,000
Independent of the company, corporate management and SCA’s major shareholders.
Annemarie Gardshol (1967)MSc Eng.
President of PostNord Sverige AB. Board member of Essity AB. Former Board member of Etac AB, Bygghemma AB, Ortivus AB and Semcon AB and various manage-ment positions at PostNord and Gambro AB as well as manage-ment consultant at McKinsey & Company.
Elected: 2015Class B shares: 3,300 Independent of the company, corporate management and SCA’s major shareholders.
Ulf Larsson (1962)BSc Forestry
President and CEO of SCA. Board member of The Swedish Forest Industries Federation, Handelsbanken Region Umeå, CEPI, member of the Advisory Council Västernorrland County and deputy board member of Industriarbetsgivarna. Former President of SCA Forest Products AB, 2008-2016, as well as other leading positions at SCA Skog, SCA Timber and Domänverket.
Elected: 2017Employed since: 1992Class B shares: 85,000
Independent of SCA’s major shareholders.
Martin Lindqvist (1962)Engineer and Master of Business Administration
President and CEO of SSAB AB. Chairman of the Board of Jernkontoret, and of Stål och Metall. Deputy chair of Industri- arbetsgivarna and Board member of the Confederation of Swedish Enterprise. Previously held senior positions, including at SSAB and NCC.
Elected: 2017
Independent of the company, corporate management and SCA’s major shareholders.
Lotta Lyrå (1975)MSc Econ.
President and CEO of Clas Ohlson AB. Previously held senior positions within the IKEA Group, including Head of Strategy and also Head of Development in 2009-2017. Experience in the Swedish forest industry as Head of Development at Södra Timber and Sawmill Manager at Södra’s Mönsterås sawmill. Former em-ployee of McKinsey & Company.
Elected: 2017
Independent of the company, corporate management and SCA’s major shareholders.
Bert Nordberg (1956)Engineer
Chairman of TDC A/S, Chairman of the Board of Vestas Wind Systems A/S. Board member of Essity AB, AB Electrolux (until the 2019 AGM) and SAAB AB. Previ-ously held various management positions at Digital Equipment Corp. and Ericsson. President of Sony Ericsson Mobile Communi-cations AB from 2009-2012.
Elected: 2012Class B shares: 16,800
Independent of the company, corporate management and SCA’s major shareholders.
SC
A A
NN
UA
L R
EP
OR
T 2
01
8
62
BOARD OF DIRECTORS’ REPORT / CORPORATE GOVERNANCE REPORT

Employee representatives
Anders Sundström (1952)Bachelor’s degree
Chairman of the board at Kaunis Holding, NMI Group, Hedlunda Industri AB and Ekhaga Utveckling AB as well as Board member of other unlisted companies. Previ-ously Chairman of the Board at Swedbank and CF, among others. Many years of operating experience within both the industry and the fi-nancial sector, including as CEO for Folksam. Several ministerial posts and other political assignments.
Elected: 2018Class B shares: 6,000
Independent of the company, corporate management and SCA’s major shareholders.
Roger Boström (1971)Chairman of the Swedish Paper Workers’ Union dept. 167 at SCA Graphic Sundsvall AB, Östrand pulp millMember of the Swedish Trade Union Confederation (LO). Appointed: 2013Class B shares: 55
Johanna Viklund Lindén (1973)Chairman Unionen, SCA Graphic Sundsvall AB/SCA Sourcing & LogisticsMember of the Council for Negotiation and Cooperation (PTK). Appointed: 2017
Barbara Milian Thoralfsson (1959)MBA, BA
Board member of Essity AB, Hilti AG and G4S Plc. Industry advisor to EQT. President of NetCom ASA 2001-2005 and President of Midelfart & Co AS 1995-2000. Former member of the Boards of AB Electrolux, Telenor ASA Cable & Wireless Plc, Orkla ASA and Tandberg ASA.
Elected: 2006
Independent of the company, corporate management and SCA’s major shareholders.
Hans Wentjärv (1963)Chairman GS trade union, Rundvik Sawmill, SCA TimberMember of the Swedish Trade Union Confederation (LO). Appointed: 2017Class B shares: 420
Employee representatives, deputies
Per Andersson (1955)Swedish Paper Workers Union, dept 29, SCA Obbola ABMember of the Swedish Trade Union Confederation (LO). Appointed 2013.
Maria Jonsson (1966)Chairman Unionen, SCA staff functionsMember of the Council for Negotiation and Cooperation (PTK). Appointed 2017.
Stefan Lundkvist (1977)Chairman of Swedish Paper Workers Union, dept 158, SCA Munksund ABMember of the Swedish Trade Union Confederation (LO). Appointed 2017.
Secretary to the Board
Jan Svedjebrant (1955)Master of LawsSenior Vice President, Legal Affairs Group Function, General Counsel.
Employed since: 2001Class B shares: 9,130
Honorary Chairman
Bo RydinMSc Econ., Hon PhD Econ., Hon PhD Engineering
Auditors
Ernst & Young ABSenior Auditor: Hamish Mabon, Authorized Public Accountant
Information regarding individuals’ own and related parties’ shareholdings pertains to the situation on December 31, 2018.
63
SC
A A
NN
UA
L R
EP
OR
T 2
01
8Introduction Strategy & operations Board of Directors’ Report Financial statements Sustainability facts OtherIntroduction
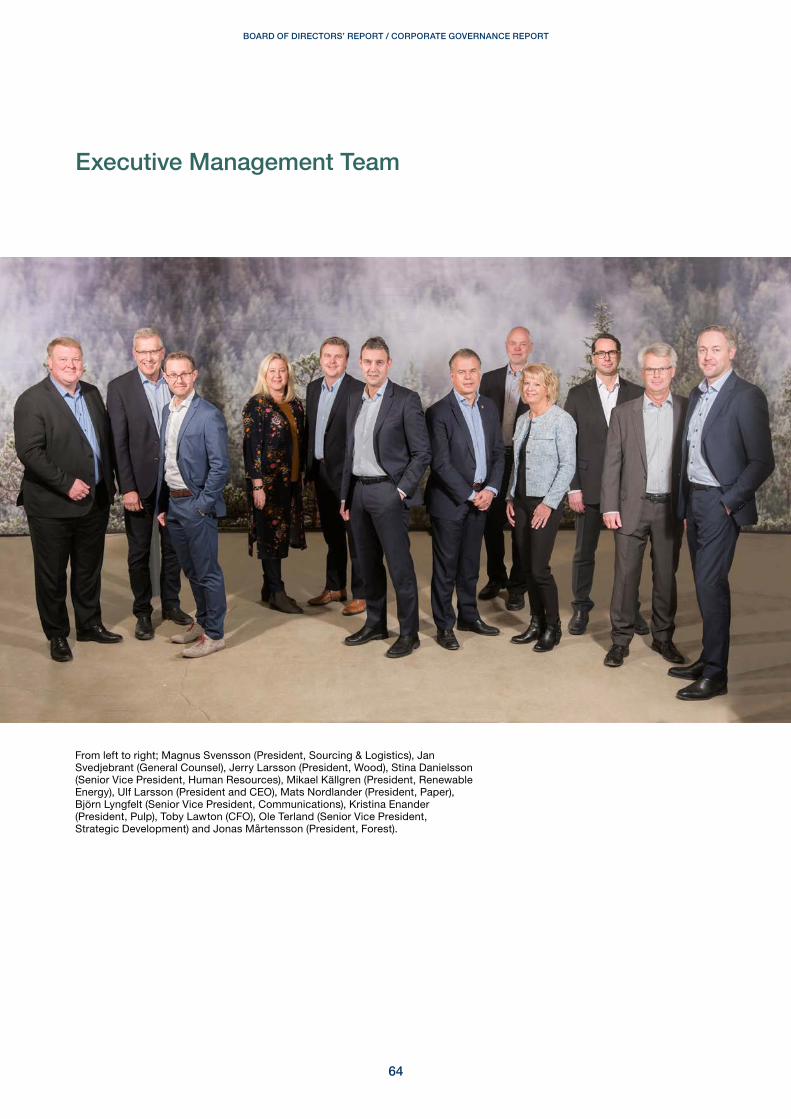
Executive Management Team
From left to right; Magnus Svensson (President, Sourcing & Logistics), Jan Svedjebrant (General Counsel), Jerry Larsson (President, Wood), Stina Danielsson (Senior Vice President, Human Resources), Mikael Källgren (President, Renewable Energy), Ulf Larsson (President and CEO), Mats Nordlander (President, Paper), Björn Lyngfelt (Senior Vice President, Communications), Kristina Enander (President, Pulp), Toby Lawton (CFO), Ole Terland (Senior Vice President, Strategic Development) and Jonas Mårtensson (President, Forest).
64
BOARD OF DIRECTORS’ REPORT / CORPORATE GOVERNANCE REPORT

Mats Nordlander President, PaperDipl. Eng.Employed since: 2015 Class B shares: 7,425
Toby Lawton CFOMA Employed since: 2017 Class B shares: 3,782
Bjorn Lyngfelt Senior Vice President, Communications BSc Forestry Employed since: 1986Class B shares: 9,500
Kristina EnanderPresident, Pulp MSc Eng. chemical engineering in physicsEmployed since: 1993Class B shares: 8,389
Jan Svedjebrant Senior Vice President Legal Affairsand General Counsel Master of LawsEmployed since: 2001Class B shares: 9,130
Jonas MårtenssonPresident, ForestMSc Eng.Employed since: 2005Class B shares: 22,500
Magnus SvenssonPresident, Sourcing & LogisticsMSc Eng.Employed since: 1993Class A shares: 20,700Class B shares: 39,680
Jerry Larsson President, Wood MSc Eng., MBA Employed since: 2003Class B shares: 3,225
Ole TerlandSenior Vice President, Strategic DevelopmentDoctor of TechnologyEmployed since: 2016Class B shares: 41,000
Mikael KällgrenPresident, Renewable EnergyBSc Energy Employed since: 2015Class B shares: 1,135
Ulf LarssonPresident and CEOBSc Forestry Employed since: 1992Class B shares: 85,000
Stina Danielsson Senior Vice President, Human Resources BA Employed since: 2005Class B shares: 2,459
65
SC
A A
NN
UA
L R
EP
OR
T 2
01
8Introduction Strategy & operations Board of Directors’ Report Financial statements Sustainability facts OtherIntroduction
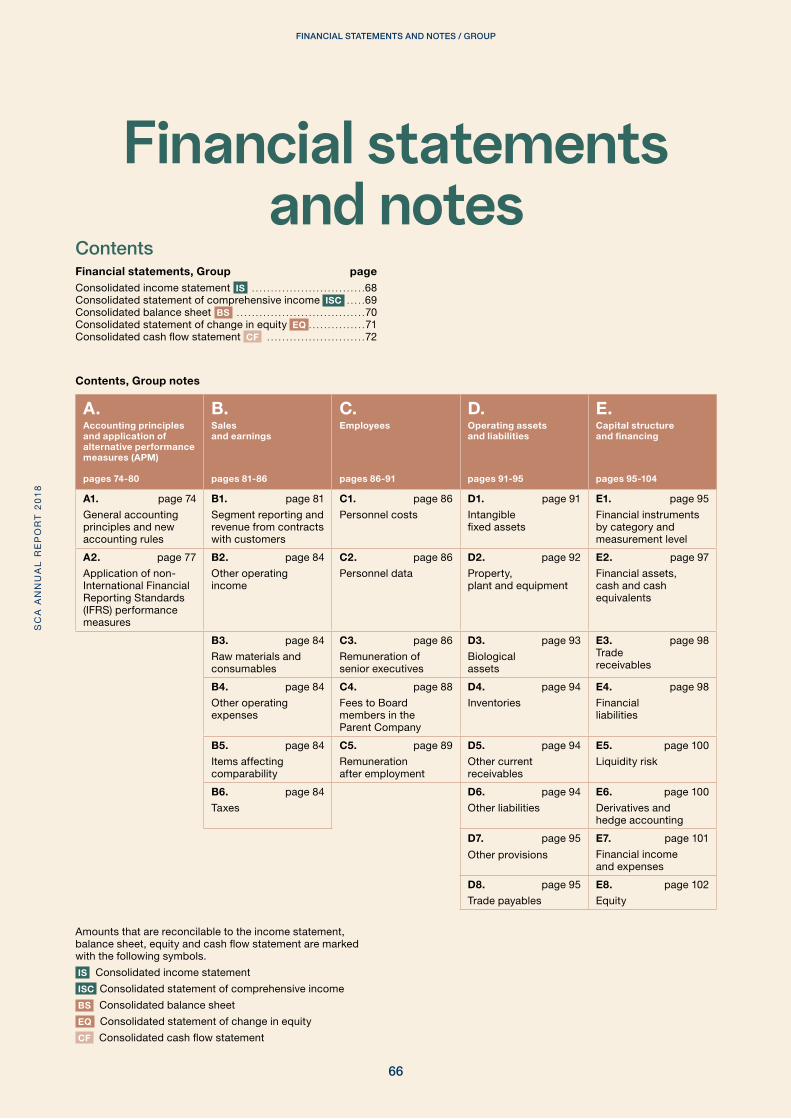
Financial statements and notes
ContentsFinancial statements, Group pageConsolidated income statement IS . . . . . . . . . . . . . . . . . . . . . . . . . . . . . .68Consolidated statement of comprehensive income ISC . . . . .69Consolidated balance sheet BS . . . . . . . . . . . . . . . . . . . . . . . . . . . . . . . . . .70Consolidated statement of change in equity EQ . . . . . . . . . . . . . . .71 Consolidated cash flow statement CF . . . . . . . . . . . . . . . . . . . . . . . . . .72
Amounts that are reconcilable to the income statement, balance sheet, equity and cash flow statement are marked with the following symbols .
IS Consolidated income statement
ISC Consolidated statement of comprehensive income
BS Consolidated balance sheet
EQ Consolidated statement of change in equity
CF Consolidated cash flow statement
Contents, Group notes
A.Accounting principles and application of alternative performance measures (APM)
pages 74-80
B.Salesand earnings
pages 81-86
C.Employees
pages 86-91
D.Operating assetsand liabilities
pages 91-95
E.Capital structureand financing
pages 95-104
A1. page 74
General accounting principles and new accounting rules
B1. page 81
Segment reporting and revenue from contracts with customers
C1. page 86
Personnel costs
D1. page 91
Intangible fixed assets
E1. page 95
Financial instrumentsby category andmeasurement level
A2. page 77
Application of non-International Financial Reporting Standards (IFRS) performance measures
B2. page 84
Other operating income
C2. page 86
Personnel data
D2. page 92
Property, plant and equipment
E2. page 97
Financial assets, cash and cash equivalents
B3. page 84
Raw materials and consumables
C3. page 86
Remuneration ofsenior executives
D3. page 93
Biological assets
E3. page 98Trade receivables
B4. page 84
Other operating expenses
C4. page 88
Fees to Board members in the Parent Company
D4. page 94
Inventories
E4. page 98
Financial liabilities
B5. page 84
Items affecting comparability
C5. page 89
Remuneration after employment
D5. page 94
Other currentreceivables
E5. page 100
Liquidity risk
B6. page 84
Taxes
D6. page 94
Other liabilities
E6. page 100
Derivatives and hedge accounting
D7. page 95
Other provisions
E7. page 101
Financial incomeand expenses
D8. page 95
Trade payables
E8. page 102
Equity
FINANCIAL STATEMENTS AND NOTES / GROUPS
CA
AN
NU
AL
RE
PO
RT
20
18
66

Financial statements, Parent Company pageParent Company income statement PIS . . . . . . . . . . 109Parent company statement of comprehensive income PISC . . . . . . . . . . . . . . . . . . . . . . . . . . . . . . . . . . . . . . . . . . . . 109Parent company balance sheet PBS . . . . . . . . . . . . . . .110Parent Company statement of change in equity PEQ . . . . . . . . . . . . . . . . . . . . . . . . . . . . . . .111Parent Company cash flow statement PCF . . . . . . . .111
Amounts that are reconcilable to the income state-ment, balance sheet, equity and cash flow statement are marked with the following symbols .
PIS Parent company income statement
PISC Parent company statement of comprehensive income
PBS Parent company balance sheet
PEQ Parent company statement of change in equity
PCF Parent company cash flow statement
F.Group structure
pages 105-106
G.Other
pages 107-108
F1. page 105
Subsidiaries
G1. page 107
Non-current assets held for sale and discontinued operations
F2. page 106
Associated companies
G2. page 108
Leasing
F3. page 106
Shares and participations
G3. page 108
Pledged assets and contingent liabilities
F4. page 106
Acquisitions and divestments
G4. page 108
Transactions with related parties
Contents, Parent Company notes
PC.Parent Company notes
pages 113-118
PC1. page 113Operating profit or loss
PC2. page 113Personnel and Board costs
PC3. page 114Appropriations
PC4. page 114Taxes
PC5. page 115Tangible fixed assets
PC6. page 115Participations in Group companies
PC7. page 116Receivables from and liabilities to subsidiaries
PC8. page 116Other current receivables
PC9. page 116Financial instruments
PC10. page 117Other current liabilities
PC11. page 118Share capital
PC12. page 118Pledged assets and contingent liabilities
PC13. page 118Proposed disposition of earnings
FINANCIAL STATEMENTS AND NOTES / GROUPS
CA
AN
NU
AL
RE
PO
RT
20
18
Introduction Strategy & operations Board of Directors’ Report Financial statements Sustainability facts Other
67
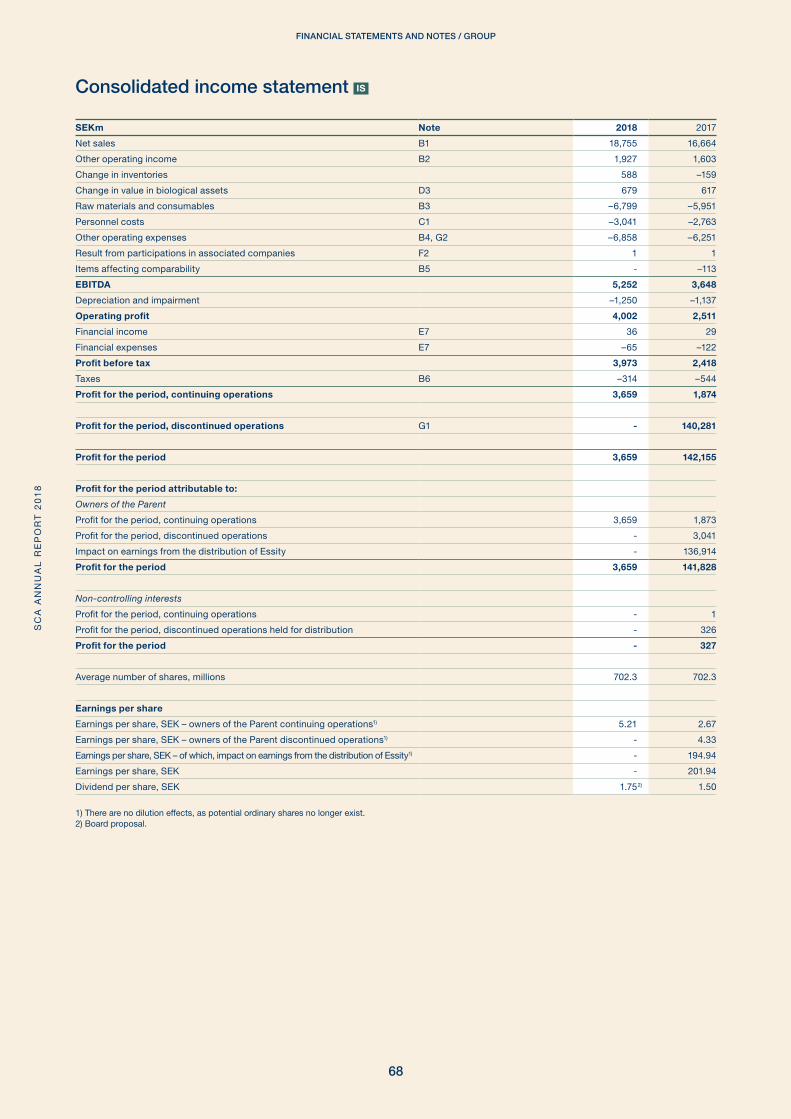
Consolidated income statement IS
SEKm Note 2018 2017
Net sales B1 18,755 16,664
Other operating income B2 1,927 1,603
Change in inventories 588 –159
Change in value in biological assets D3 679 617
Raw materials and consumables B3 –6,799 –5,951
Personnel costs C1 –3,041 –2,763
Other operating expenses B4, G2 –6,858 –6,251
Result from participations in associated companies F2 1 1
Items affecting comparability B5 - –113
EBITDA 5,252 3,648
Depreciation and impairment –1,250 –1,137
Operating profit 4,002 2,511
Financial income E7 36 29
Financial expenses E7 –65 –122
Profit before tax 3,973 2,418
Taxes B6 –314 –544
Profit for the period, continuing operations 3,659 1,874
Profit for the period, discontinued operations G1 - 140,281
Profit for the period 3,659 142,155
Profit for the period attributable to:
Owners of the Parent
Profit for the period, continuing operations 3,659 1,873
Profit for the period, discontinued operations - 3,041
Impact on earnings from the distribution of Essity - 136,914
Profit for the period 3,659 141,828
Non-controlling interests
Profit for the period, continuing operations - 1
Profit for the period, discontinued operations held for distribution - 326
Profit for the period - 327
Average number of shares, millions 702 .3 702 .3
Earnings per share
Earnings per share, SEK – owners of the Parent continuing operations1) 5 .21 2 .67
Earnings per share, SEK – owners of the Parent discontinued operations1) - 4 .33
Earnings per share, SEK – of which, impact on earnings from the distribution of Essity1) - 194 .94
Earnings per share, SEK - 201 .94
Dividend per share, SEK 1 .752) 1 .50
1) There are no dilution effects, as potential ordinary shares no longer exist .2) Board proposal .
FINANCIAL STATEMENTS AND NOTES / GROUPS
CA
AN
NU
AL
RE
PO
RT
20
18
68
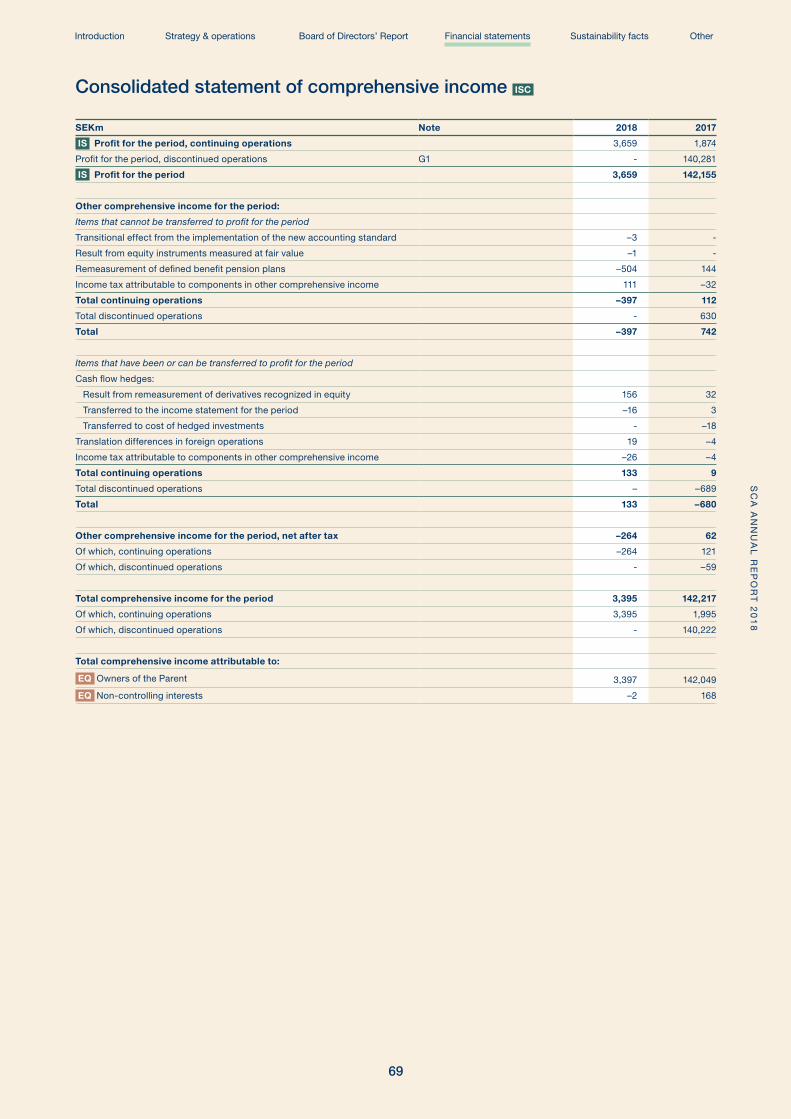
Consolidated statement of comprehensive income ISC
SEKm Note 2018 2017
IS Profit for the period, continuing operations 3,659 1,874
Profit for the period, discontinued operations G1 - 140,281
IS Profit for the period 3,659 142,155
Other comprehensive income for the period:
Items that cannot be transferred to profit for the period
Transitional effect from the implementation of the new accounting standard –3 -
Result from equity instruments measured at fair value –1 -
Remeasurement of defined benefit pension plans –504 144
Income tax attributable to components in other comprehensive income 111 –32
Total continuing operations –397 112
Total discontinued operations - 630
Total –397 742
Items that have been or can be transferred to profit for the period
Cash flow hedges:
Result from remeasurement of derivatives recognized in equity 156 32
Transferred to the income statement for the period –16 3
Transferred to cost of hedged investments - –18
Translation differences in foreign operations 19 –4
Income tax attributable to components in other comprehensive income –26 –4
Total continuing operations 133 9
Total discontinued operations – –689
Total 133 –680
Other comprehensive income for the period, net after tax –264 62
Of which, continuing operations –264 121
Of which, discontinued operations - –59
Total comprehensive income for the period 3,395 142,217
Of which, continuing operations 3,395 1,995
Of which, discontinued operations - 140,222
Total comprehensive income attributable to:
EQ Owners of the Parent 3,397 142,049
EQ Non-controlling interests –2 168
FINANCIAL STATEMENTS AND NOTES / GROUPS
CA
AN
NU
AL
RE
PO
RT
20
18
Introduction Strategy & operations Board of Directors’ Report Financial statements Sustainability facts Other
69
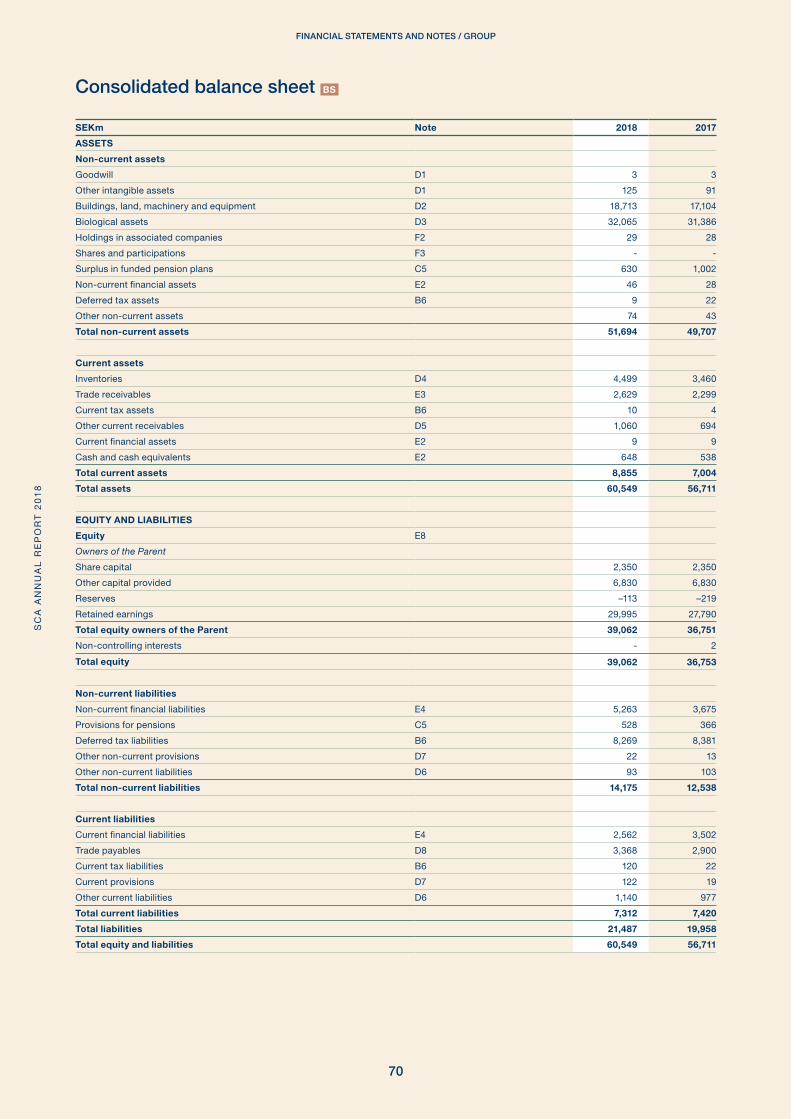
SEKm Note 2018 2017
ASSETS
Non-current assets
Goodwill D1 3 3
Other intangible assets D1 125 91
Buildings, land, machinery and equipment D2 18,713 17,104
Biological assets D3 32,065 31,386
Holdings in associated companies F2 29 28
Shares and participations F3 - -
Surplus in funded pension plans C5 630 1,002
Non-current financial assets E2 46 28
Deferred tax assets B6 9 22
Other non-current assets 74 43
Total non-current assets 51,694 49,707
Current assets
Inventories D4 4,499 3,460
Trade receivables E3 2,629 2,299
Current tax assets B6 10 4
Other current receivables D5 1,060 694
Current financial assets E2 9 9
Cash and cash equivalents E2 648 538
Total current assets 8,855 7,004
Total assets 60,549 56,711
EQUITY AND LIABILITIES
Equity E8
Owners of the Parent
Share capital 2,350 2,350
Other capital provided 6,830 6,830
Reserves –113 –219
Retained earnings 29,995 27,790
Total equity owners of the Parent 39,062 36,751
Non-controlling interests - 2
Total equity 39,062 36,753
Non-current liabilities
Non-current financial liabilities E4 5,263 3,675
Provisions for pensions C5 528 366
Deferred tax liabilities B6 8,269 8,381
Other non-current provisions D7 22 13
Other non-current liabilities D6 93 103
Total non-current liabilities 14,175 12,538
Current liabilities
Current financial liabilities E4 2,562 3,502
Trade payables D8 3,368 2,900
Current tax liabilities B6 120 22
Current provisions D7 122 19
Other current liabilities D6 1,140 977
Total current liabilities 7,312 7,420
Total liabilities 21,487 19,958
Total equity and liabilities 60,549 56,711
Consolidated balance sheet BS
FINANCIAL STATEMENTS AND NOTES / GROUPS
CA
AN
NU
AL
RE
PO
RT
20
18
70
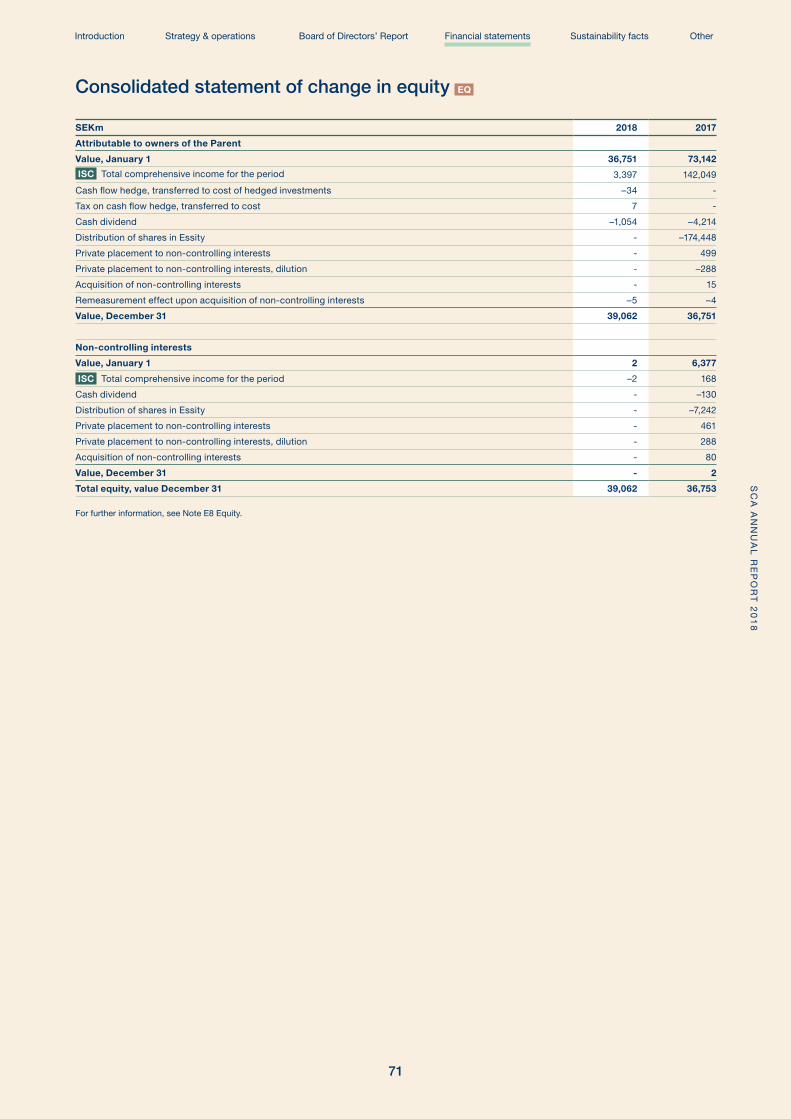
Consolidated statement of change in equity EQ
SEKm 2018 2017
Attributable to owners of the Parent
Value, January 1 36,751 73,142
ISC Total comprehensive income for the period 3,397 142,049
Cash flow hedge, transferred to cost of hedged investments –34 -
Tax on cash flow hedge, transferred to cost 7 -
Cash dividend –1,054 –4,214
Distribution of shares in Essity - –174,448
Private placement to non-controlling interests - 499
Private placement to non-controlling interests, dilution - –288
Acquisition of non-controlling interests - 15
Remeasurement effect upon acquisition of non-controlling interests –5 –4
Value, December 31 39,062 36,751
Non-controlling interests
Value, January 1 2 6,377
ISC Total comprehensive income for the period –2 168
Cash dividend - –130
Distribution of shares in Essity - –7,242
Private placement to non-controlling interests - 461
Private placement to non-controlling interests, dilution - 288
Acquisition of non-controlling interests - 80
Value, December 31 - 2
Total equity, value December 31 39,062 36,753
For further information, see Note E8 Equity .
FINANCIAL STATEMENTS AND NOTES / GROUPS
CA
AN
NU
AL
RE
PO
RT
20
18
Introduction Strategy & operations Board of Directors’ Report Financial statements Sustainability facts Other
71
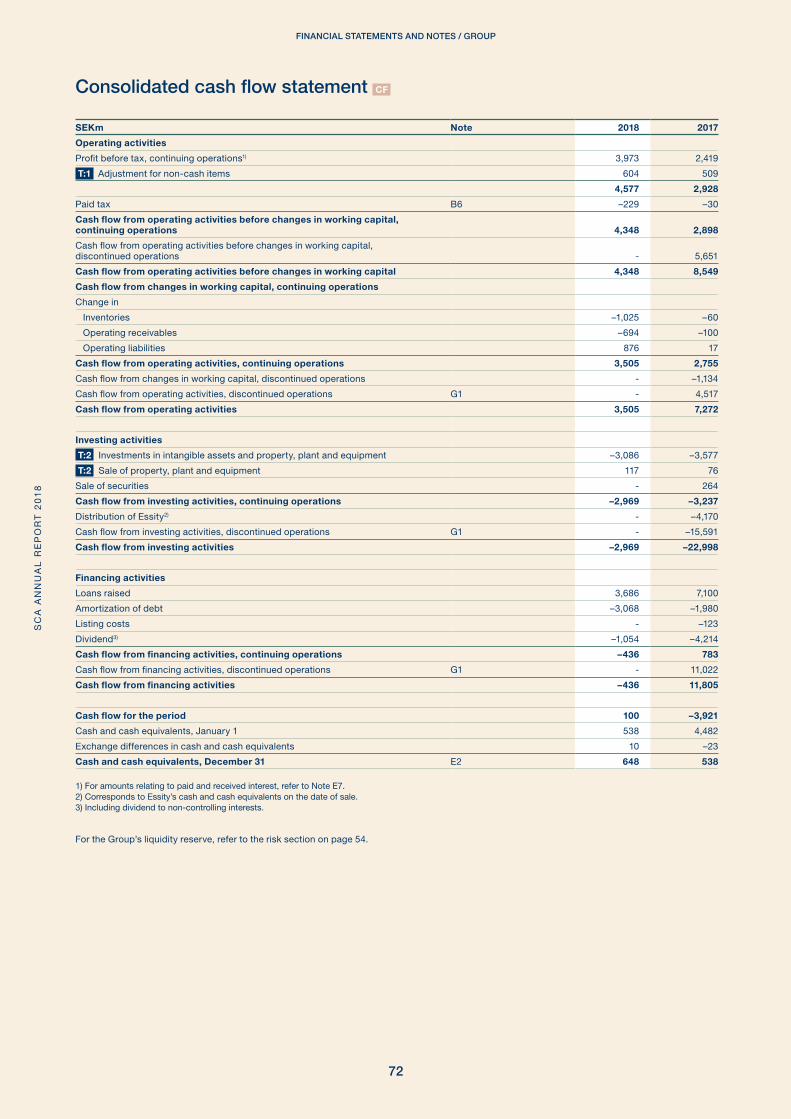
Consolidated cash flow statement CF
SEKm Note 2018 2017
Operating activities
Profit before tax, continuing operations1) 3,973 2,419
T:1 Adjustment for non-cash items 604 509
4,577 2,928
Paid tax B6 –229 –30
Cash flow from operating activities before changes in working capital, continuing operations 4,348 2,898
Cash flow from operating activities before changes in working capital, discontinued operations - 5,651
Cash flow from operating activities before changes in working capital 4,348 8,549
Cash flow from changes in working capital, continuing operations
Change in
Inventories –1,025 –60
Operating receivables –694 –100
Operating liabilities 876 17
Cash flow from operating activities, continuing operations 3,505 2,755
Cash flow from changes in working capital, discontinued operations - –1,134
Cash flow from operating activities, discontinued operations G1 - 4,517
Cash flow from operating activities 3,505 7,272
Investing activities
T:2 Investments in intangible assets and property, plant and equipment –3,086 –3,577
T:2 Sale of property, plant and equipment 117 76
Sale of securities - 264
Cash flow from investing activities, continuing operations –2,969 –3,237
Distribution of Essity2) - –4,170
Cash flow from investing activities, discontinued operations G1 - –15,591
Cash flow from investing activities –2,969 –22,998
Financing activities
Loans raised 3,686 7,100
Amortization of debt –3,068 –1,980
Listing costs - –123
Dividend3) –1,054 –4,214
Cash flow from financing activities, continuing operations –436 783
Cash flow from financing activities, discontinued operations G1 - 11,022
Cash flow from financing activities –436 11,805
Cash flow for the period 100 –3,921
Cash and cash equivalents, January 1 538 4,482
Exchange differences in cash and cash equivalents 10 –23
Cash and cash equivalents, December 31 E2 648 538
1) For amounts relating to paid and received interest, refer to Note E7 .2) Corresponds to Essity’s cash and cash equivalents on the date of sale .3) Including dividend to non-controlling interests .
For the Group’s liquidity reserve, refer to the risk section on page 54 .
FINANCIAL STATEMENTS AND NOTES / GROUPS
CA
AN
NU
AL
RE
PO
RT
20
18
72
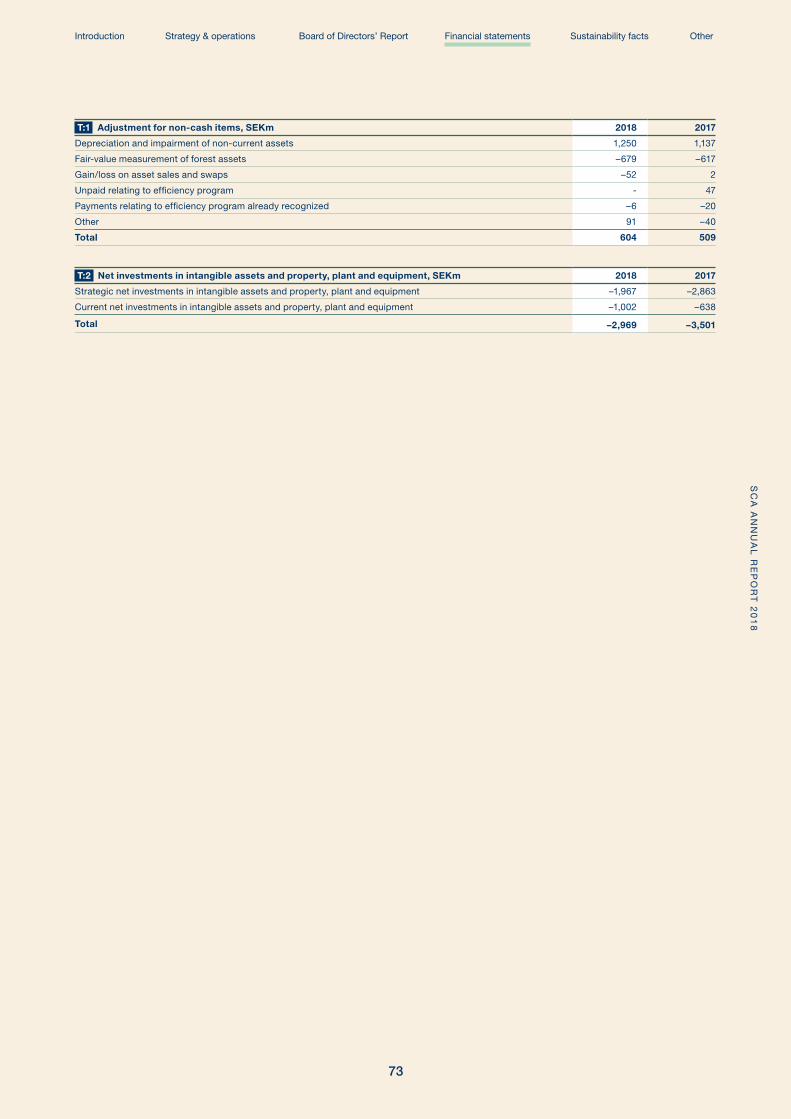
T:1 Adjustment for non-cash items, SEKm 2018 2017
Depreciation and impairment of non-current assets 1,250 1,137
Fair-value measurement of forest assets –679 –617
Gain/loss on asset sales and swaps –52 2
Unpaid relating to efficiency program - 47
Payments relating to efficiency program already recognized –6 –20
Other 91 –40
Total 604 509
T:2 Net investments in intangible assets and property, plant and equipment, SEKm 2018 2017
Strategic net investments in intangible assets and property, plant and equipment –1,967 –2,863
Current net investments in intangible assets and property, plant and equipment –1,002 –638
Total –2,969 –3,501
FINANCIAL STATEMENTS AND NOTES / GROUPS
CA
AN
NU
AL
RE
PO
RT
20
18
Introduction Strategy & operations Board of Directors’ Report Financial statements Sustainability facts Other
73

A1. GENERAL ACCOUNTING PRINCIPLES AND NEW ACCOUNTING RULES
A. ACCOUNTING PRINCIPLES AND APPLICATION OF ALTERNATIVE PERFORMANCE MEASURES (APM)
Reading instructionsGeneral accounting principles AP and new accounting rules are presented below . Other accounting principles considered material by SCA are presented in conjunction with the respec-tive notes . The same principles are usually applied in both the Parent Company and the Group . In some cases, the Parent Company applies principles other than those used by the Group and, in such cases, these principles are specified under the respective note in the section about the Parent Company .
Key assessments and assumptions KAA are presented under the respective notes . The preparation of financial statements in conformity with IFRS (International Financial Reporting Stan-dards) and generally accepted Swedish accounting principles requires assessments and assumptions to be made that affect recognized asset and liability items and income and expense items, respectively, as well as other information disclosed .
These assumptions and estimates are often based on historical experience, but also on other factors, including expectations of future events . With other assumptions and estimates, the result may be different and the actual result will seldom fully concur with the estimated result .
In SCA’s opinion, the areas that are impacted the most by assumptions and estimates are:
Segment reporting and revenue from contracts with customers, Note B1Taxes, Note B6Remuneration after employment, Note C5Biological assets, Note D3
Amounts that are reconcilable to the income statement, balance sheet, equity and cash flow statement and tables in notes are marked with the following symbols .
IS Income statement
ISC Statement of comprehensive income
BS Balance sheet
EQ Equity
CF Cash flow statement
Tx:x Reference to table in note
Basis for preparation
The SCA Group’s financial statements are prepared in accor-dance with the Annual Accounts Act and IFRS as adopted within the EU, and the Swedish Financial Reporting Board, Recommendation RFR 1 Supplementary Accounting Rules for Groups . The Parent Company’s financial statements are prepared in accordance with the Swedish Financial Reporting Board’s recommendation RFR 2, Reporting by Legal Entities, and the Annual Accounts Act . The accounts for both the Group and the Parent Company relate to the fiscal year that ended on December 31, 2018 . SCA applies the historical cost method as basic principle for measurement of assets and liabilities . Biolog-ical assets (standing timber) and financial assets and liabilities, including derivative instruments, are, however, measured at fair value in the income statement . Financial assets in the form of equity instruments not held for trading are measured at fair value in other comprehensive income . In the Parent Company, biological assets are not measured at fair value . As of January 1, 2018, the Parent Company changed its method of measurement of derivatives from historical cost to fair value . The change in method of measurement of derivatives has entailed an adjust-ment of the comparative year . For further information, refer to
Note PC9 . As stipulated in the following section, IFRS 9 and IFRS 15 are applicable from January 1, 2018 . SCA has elected to not restate 2017 . For a detailed description of the accounting principles applied in 2017, refer to the 2017 Annual Report .
Changes to accounting principles IFRS 9 Financial InstrumentsIFRS 9 Financial Instruments has been applicable since January 1, 2018 and has replaced IAS (International Accounting Standards) 39 Financial Instruments: Accounting and measurement . The standard is divided into three areas: Classification and measure-ment of financial assets and liabilities, impairment and hedge accounting .
1) Classification and measurement of financial assets and liabilities SCA has classified and measured financial assets according to the categories stated in IFRS 9 without any significant impact on the balance sheet . A non-current financial asset of SEK 19m that was previously classified as available-for-sale financial assets has been classified in the measurement category of fair value through other comprehensive income . The reclassification had no impact on the recognized amount in the balance sheet . IFRS 9 entails essentially unchanged recognition of financial liabilities .
2) Impairment The standard has introduced a model for impairment of financial assets based on expected losses and not, as previously under IAS 39, when the loss event has already occurred . SCA’s trade receivables are mainly affected and the impairment model for doubtful trade receivables has been adapted . SCA recognized a non-recurring effect of SEK 3m in the first quarter of 2018 due to the changed impairment model for expected credit losses on trade receivables . For a description of the model, refer to Note E3 .
3) Hedge accounting IFRS 9 focuses to a great extent on reflecting the company’s risk management strategies in hedge accounting and allowing more hedging strategies to qualify for hedge accounting . SCA has established that all hedge relationships qualify for hedge accounting . All hedging documentation has been adapted to the rules of IFRS 9 . Cash flow hedges transferred at cost to the hedged investments were previously recognized in other com-prehensive income but are now recognized in the consolidated statement of change in equity, without transfer in the statement of other comprehensive income . The transition to the new hedge accounting rules did not otherwise impact carrying amounts in the balance sheet or income statement .
IFRS 15 Revenue from Contracts with Customers
This standard is applicable from January 1, 2018 and replaced IAS 11 Construction Contracts, IAS 18 Revenue and related interpretations, and applies to all revenue deriving from con-tracts with customers, with a few exceptions .
SCA’s sales mainly comprise sales of goods . Freight services are sometimes included as part of the contract on sale of goods . The scope of these services currently totals insignificant amounts and as a result they are not recognized separately . The new reporting standard has transitioned from a risks and rewards concept to focusing more on when control has been passed to the customer, which has given cargo clauses a more prominent role . SCA applies the Delivered at Place (DAP) terms for approximately 70% of sales revenues, meaning risk is trans-ferred when the goods are made available to the customer at the agreed destination . For other freight terms applied, the risk is
FINANCIAL STATEMENTS AND NOTES / GROUPS
CA
AN
NU
AL
RE
PO
RT
20
18
74

transferred when the goods are loaded on to the vessel or other freight vehicle . SCA also has separate sales of logistics ser-vices . These services typically comprise “freight home,” which means that SCA sells the freight space on a vessel or other freight vehicle for the return journey, after the scheduled freight has reached its end destination . SCA does not have control over the goods delivered through these logistics services, but simply acts as a freight carrier . Performance obligations in connection with logistics services comprise solely the freight itself . The transaction price for these obligations pertains in its entirety to fixed parts . Control of the logistics services is deemed to be passed to the customer over time as the shipment approaches the agreed destination . The progress toward completion for the company’s own means of transportation is measured in terms of shipment time in relation to total transport time and SCA thus recognizes revenue in line with the transport taking place . Reve-nue for these logistics services is recognized as Other operating income in the consolidated income statement .
SCA applied a practical solution for contracts changed prior to January 1, 2018, entailing that the contracts were not ret-rospectively restated . Instead, consideration was given to the aggregated effect of all of the changes that had occurred prior to January 1, 2018 when the satisfied and unsatisfied perfor-mance obligations were determined, the transaction price was determined and the transaction price was allocated to the satis-fied and unsatisfied performance obligations . Applying this practical solution was deemed to have a very minor effect since SCA mostly has short contract periods with few contract modi-fications .
SCA applied the modified retrospective method on all contracts that were not concluded on January 1, 2018 . The new standard did not entail any translation effects when it was introduced and thus there was no need to adjust opening equity .
SCA has decided to recognize additional costs for securing a contract as a cost in profit or loss . SCA has no contracts with customers longer than one year and has elected to apply a practical solution to not present information on remaining performance obligations .
New or amended accounting standards after 2018IFRS 16 Leases has not yet come into effect and has not been applied in advance in preparing the Group’s and the Parent Company’s financial statements . The potential effect of IFRS 16 on these financial statements is described below . SCA esti-mates that other new or amended standards or interpretations will not have any impact on the Group’s or the Parent Compa-ny’s financial statements .
IFRS 16 Leases
The standard is applicable to fiscal years beginning on January 1, 2019 or later and will replace IAS 17 Leases and associated interpretations: the International Financial Reporting Interpreta-tions Committee (IFRIC) 4 Determining Whether an Arrangement Contains a Lease, the Standing Interpretations Committee (SIC) 15 Operating Leases—Incentives and SIC 27 Evaluating the Substance of Transactions Involving the Legal Form of a Lease . The standard requires that all leases are to be recognized in the balance sheet, regardless of whether they were previously recognized as operating or finance, with a few exceptions . This type of recognition is based on the approach that the lessee is entitled to use an asset over a specific period and simultane-ously has an obligation to pay for this entitlement . The standard includes exemptions for short-term leases (leases with a lease term of 12 months or less) and leases where the underlying asset has a low value . The exemption allows a lessee to decide not to recognize leases in the balance sheet . At the commence-ment date of contract, the lessee is to recognize a lease liability in the balance sheet, that represents the present value of future lease payments, and a right-of-use asset that represents the right of use of the underlying asset over the lease term . Lease payments are to be discounted by using the interest rate implicit
in the lease contract, if it can be readily determined . If that rate cannot be readily determined, the lessee shall use their incre-mental borrowing rate . The lessee is to recognize the interest expenses related to the lease liability and amortization of the right-of-use asset in the income statement . IFRS 16 entails the reclassification of cash flow statements . Cash flow from operat-ing activities will change since amortization of the lease liability will be presented in the financing activities . Interest can be recognized in the financing activities or the operating activities .
After the date of initial application, the lessee is to measure the right-of-use asset at cost less accumulated amortization and any accumulated impairment . This measurement is to take into account any remeasurement of the lease liability . The liability will increase by the interest on the lease liability but reduce by paid lease payments . The measurement of the liability is also to reflect changes in lease payments . Remeasurement of the lease liability is normally to be recognized as an adjustment of the right-of-use asset . The lease liability is to be remeasured if, for example, the lease term is changed, if the assessment of a pur-chase option is changed, if the amounts expected to be payable under residual value are changed or if the future lease payments are changed due to changes in an index or interest rate .
Transition to IFRS 16
When the standard becomes effective, SCA will apply the mod-ified retrospective approach, meaning that comparative figures will not be restated . The lease liability has been measured at the present value of the outstanding lease payments . The right-of-use asset for all leases totals an amount corresponding to the lease liability, adjusted for the prepaid lease payments . The tran-sition does not have any impact on equity . SCA has elected to use the available exemption for short-term leases and leases for which the underlying asset has a low value . Examples of leases for which the underlying asset has a low value are photocopiers and coffee machines . SCA has also chosen, on the first date of application, not to remeasure whether a contract is or contains a lease agreement . The modified retrospective approach entails that the lessee’s incremental borrowing rate must be applied on initial measurement of the lease liability . SCA has prepared a method for determining the incremental borrowing rate, which includes the credit rating of the individual company, the eco-nomic environment, contract duration and class of asset . The incremental borrowing rate will be updated continuously . The average incremental borrowing rate on January 1, 2019 was 3 .5% .
In 2018, SCA has worked intensely on studying and evaluating existing lease contracts and analyzed the effects of IFRS 16 . In connection with this, SCA identified components that are not to be classified as lease components according to IFRS 16 . These components mainly comprise service components of leases for rail transportation and accounted for about SEK 1,000m of future minimum lease payments of 2017 . When the standard came into force, a lease liability of SEK 1,211m was recognized and a right-of-use asset of SEK 1,221m . The additional lease liability resulted in an increase of SEK 1,211m in net debt . IFRS 16 will impact SCA’s financial statements in future years . Based on the existing lease portfolio, SCA estimates that EBITDA in 2019 will be positively impacted by approximately SEK 200m and the EBITDA margin in 2019 will improve by about 1% . EBIT in 2019 will be charged with amortization of approximately SEK 180m and net financial items in 2019 will be charged with interest expenses of about SEK 50m . The impact on profit after tax in 2019 is expected to amount to approximately SEK 20m . SCA estimates that net debt in relation to EBITDA in 2019 will increase about 0 .2 times . The Group’s cash flow from operat-ing activities in 2019 will increase by approximately SEK 200m . Cash flows from investing activities will decrease by approxi-mately SEK 1,200m and cash flow from financing activities will decrease by about SEK 50m due to interest . ROCE in 2019 is expected to decrease by approximately 0 .1% .
FINANCIAL STATEMENTS AND NOTES / GROUPS
CA
AN
NU
AL
RE
PO
RT
20
18
Introduction Strategy & operations Board of Directors’ Report Financial statements Sustainability facts Other
75
Principles of consolidationSCA’s financial statements are prepared in accordance with the Group’s accounting principles and include the accounts of the Parent Company and all Group companies in accordance with the definitions below . Group companies are consolidated from the date the Group exercises controlling influence over the company according to the definitions provided below . Divested Group companies are included in the consolidated accounts until the date the Group ceases to exercise controlling influence over the companies . Intra-Group transactions have been elimi-nated .
Subsidiaries
All companies over which the Group has a controlling influence are consolidated as subsidiaries . The definition of controlling influence is that SCA has the ability to control the subsidiary, is entitled to a return and has the power to influence the activities that impact return .
Translation of foreign currencyFunctional currency and translation of foreign Group companies to the presentation currency
SCA’s Parent Company has Swedish kronor (SEK) as its func-tional currency . The functional currency of each SCA Group company is determined on the basis of the primary economic environment in which the respective company is active which, with a few exceptions, is the country in which the individual company operates . The financial statements of Group compa-nies are translated to the Group’s presentation currency, which is SEK in the case of SCA . Assets and liabilities are translated at the closing rate, while income and expenses are translated at the average rate for the respective period . Translation differ-ences on net assets are recognized as translation differences in other comprehensive income, which is a component of equity (translation reserve) .
Exchange rate effects arising from financial instruments used to hedge foreign subsidiaries’ net assets are recognized in the same manner in other comprehensive income, which is a component of equity (translation reserve) . On divestment, the translation difference on the foreign subsidiary and exchange rate effects on the financial instrument used to currency hedge the net assets in the company are recognized as part of the gain or loss on disposal .
Goodwill and surplus value adjustments arising in connection with the acquisition of a foreign subsidiary are to be translated, in a manner corresponding to the net assets in the company, from their functional currency to the presentation currency .
Transactions and balance sheet items in foreign currency
Transactions in foreign currency are translated to a functional currency using the rate prevailing on the transaction date . At accounting year-end, monetary assets and liabilities are trans-lated at the closing day rate and any exchange rate effects are recognized in the income statement . In cases where the
exchange rate effect is related to the operations, the effect is recognized net in operating profit . Exchange rate effects per-taining to borrowing and financial investments are recognized as other financial items . Non-monetary assets and liabilities recognized at historical cost are translated at the exchange rate prevailing on the transaction date .
If hedge accounting has been applied, for example, for cash flow hedges or hedging of net investments, the exchange rate effect is recognized in equity under other comprehensive income .
For financial assets in the form of equity instruments that are not held for trading, the portion of the value change pertaining to currency is recognized in the income statement . Any other unrealized change is recognized in equity under other compre-hensive income .
Revenue recognitionSales revenue, which is synonymous with net sales, includes the consideration for goods and services sold within the Group’s main business . This consists entirely of revenue from contracts with customers and is recognized in accordance with IFRS 15 . Other operating income includes compensation for sales that are not included in the Group’s main business, for instance, logistics income from SCA’s transport activities, income from sales of by-products from the production of the Group’s main products, income from sales of forest seedlings and gravel, lease income from hunting and fishing rights and for wind power, and capital gains from the sale of fixed assets . The translation differences on trade receivables are also recognized as other operating income as of 2018 . Most other operating income consists of revenue from contracts with customers and is recognized in accordance with IFRS 15 . For more information about revenue from contracts with customers, refer to Note B1 . Income from the sale of self-produced energy, electricity certificates and emission allowances is recognized as reduced energy costs . Interest income is recognized in accordance with the effective interest method, meaning the estimated change in value (effective interest) is recognized as interest income or interest expense in the income statement . Dividends received are recognized when the right to receive a dividend has been established .
Government grantsGovernment grants are recognized at fair value when there is reasonable assurance the grants will be received and that the Group will comply with the conditions attached to them . Gov-ernment grants related to acquisition of assets are recognized in the balance sheet by the grant reducing the carrying amount of the asset . Government grants received as compensation for costs are accrued and recognized in the income statement during the same period as the costs . If the government grant or assistance is neither related to the acquisition of assets nor to compensation for costs, the grant is recognized as other income . For more information about Government grants, refer to Notes B2 and B4 .
FINANCIAL STATEMENTS AND NOTES / GROUPS
CA
AN
NU
AL
RE
PO
RT
20
18
76

A2. APPLICATION OF NON-INTERNATIONAL FINANCIAL REPORTING STANDARDS (IFRS) PERFORMANCE MEASURES
The Annual Report refers to a number non-IFRS performance measures used to assist investors and company management to analyze the company’s operations . A description of the various
non-IFRS performance measures used as a complement to the financial information reported according to IFRS is presented below .
Calculation of financial measures not included in IFRS
PERFORMANCE MEASURES Various types of performance measures and margin measures expressed as a percentage of sales
Key figure Description Application of the measure
EBITDA Profit before depreciation, amortization and impairment, financial items and taxes .
This measure is a complement to operating profit, as it shows the cash surplus from operations . Management uses the measure to control the company’s business areas .
Adjusted EBITDA Profit before depreciation, amortization and impairment, financial items and taxes excluding items affecting compa-rability .
This measure is a complement to operating profit, as it shows the cash surplus from operations adjusted for the impact of items affecting comparability .
EBITDA margin Profit before depreciation, amortization and impairment, financial items and taxes as a percentage of net sales for the year .
This measure is a complement to operating margin, as it shows the cash surplus in relation to net sales . Management uses the measure to control the company’s business units .
Adjusted EBITDA margin
Adjusted EBITDA as a percentage of net sales for the year . This measure is a complement to operating margin, as it shows the cash surplus in relation to net sales adjusted for the impact of items affecting comparability .
Items affecting compa-rability
Under items affecting comparability, SCA includes costs in connection with acquisitions, divestments, restructuring and other specific events, refer to Note B5 .
Separate reporting of items affecting comparability between periods provides a better understanding of the company’s operating activities .
Restructuring costs Costs for impairment together with personnel costs in connection with structural changes to the company’s oper-ations .
This measure shows the specific costs that have arisen in connection with structural changes of an operation, which contributes to an understanding of the underlying cost level in the continuing operations .
Operating margin Operating profit as a percentage of net sales during the period .
Operating margin describes operating profit in relation to net sales .
Adjusted operating margin
Operating profit as a percentage of net sales during the period excluding items affecting comparability .
Adjusted operating margin describes how large a share of net sales remains as operating profit excluding items affect-ing comparability .
Adjusted operating profit
Operating profit excluding items affecting comparability . Adjusted operating profit is a key ratio for control of the Group’s profit centers and provides an understanding of earnings performance of the operations excluding items affecting comparability .
Net margin Profit for the period as a percentage of net sales for the period .
Net margin describes how large a share of net sales remains after costs and tax have been deducted .
CAPITAL MEASURES Show how capital is utilized and the company’s financial strength
Key figure Description Application of the measure
Equity/assets ratio Equity excluding non-controlling interests expressed as a percentage of total assets .
A traditional measure for showing financial risk . Expresses the percentage of total assets that is financed by the owners of the Parent .
Capital employed Calculated as the balance sheet’s total assets excluding financial assets and pension assets, less any non-inter-est-bearing liabilities .
The management follows this measure to reduce the capital used in operations that is financed by owners and creditors .
FINANCIAL STATEMENTS AND NOTES / GROUPS
CA
AN
NU
AL
RE
PO
RT
20
18
Introduction Strategy & operations Board of Directors’ Report Financial statements Sustainability facts Other
77

SEKm 2018 2017
CAPITAL EMPLOYED
Total assets 60,549 56,711
Financial assets and pension assets –1,333 –1,577
Non-current, non-interest-bearing liabilities –8,384 –8,497
Current, non-interest-bearing liabilities –4,750 –3,918
Capital employed 46,082 42,719
CAPITAL EMPLOYED PER SEGMENT
Forest 27,861 26,829
Wood 3,216 2,817
Pulp 8,998 7,154
Paper 6,412 5,861
Other –405 58
Capital employed 46,082 42,719
Key figure Description Application of the measure
Working capital Working capital is calculated as current operating receiv-ables (inventories, trade receivables and other non-inter-est-bearing current receivables) less current operating liabilities (trade payables and other non-interest-bearing current liabilities) .
The management monitors this measure to reduce capital tied up in the balance sheet from the company’s operations .
Working capital as a percentage of net sales
Calculated as an average of working capital for 13 months as a percentage of 12-month rolling net sales .
The management monitors this measure to reduce capital tied up in the balance sheet from the company’s operations .
SEKm 2018 2017
WORKING CAPITAL
Inventories 4,499 3,460
Trade receivables 2,629 2,299
Other current receivables 1,060 694
Trade payables –3,368 –2,900
Other current liabilities –1,140 –977
Adjustments1) 55 285
Working capital 3,735 2,861
1) Adjustment of non-operating-related items: receivables from electricity certificates, trade payables from strategic investments and liabilities from emission allowances .
Key figure Description Application of the measure
Net debt Calculated as current and non-current financial liabilities and provisions for pensions with deductions for financial assets (surplus in funded pension plans, financial assets and cash and cash equivalents) .
Net debt describes the company’s total debt financing and is monitored by the management .
FINANCIAL STATEMENTS AND NOTES / GROUPS
CA
AN
NU
AL
RE
PO
RT
20
18
78
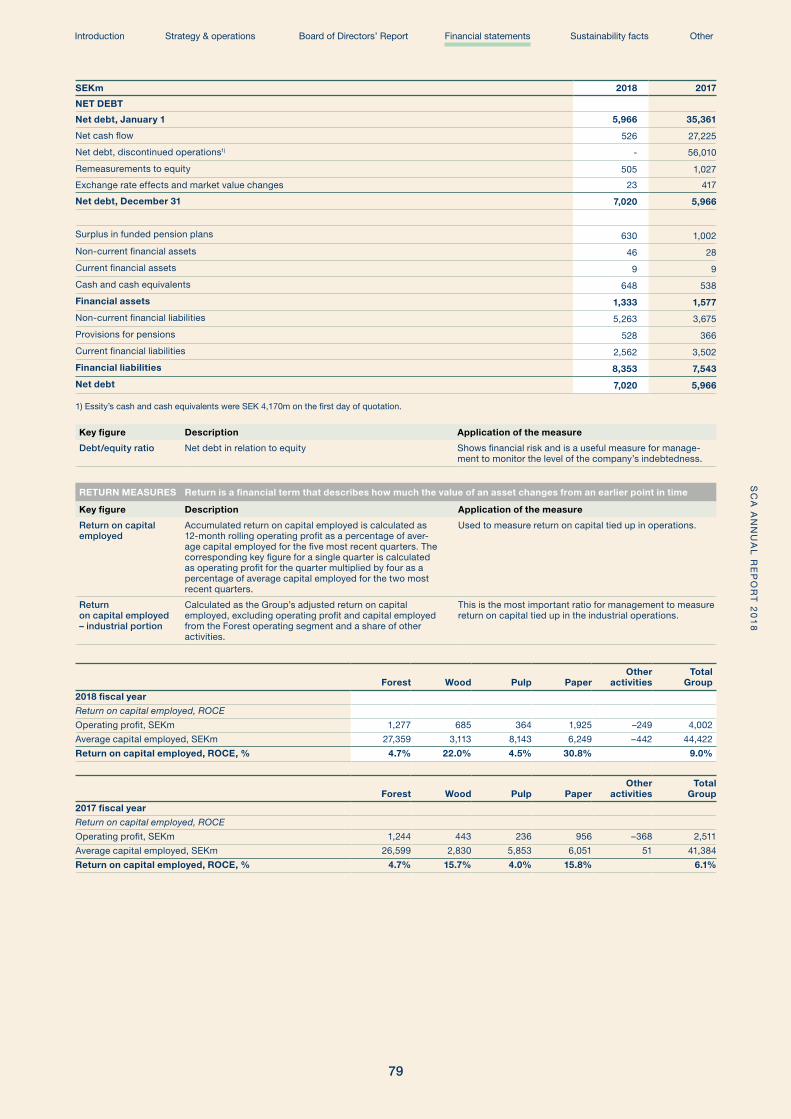
SEKm 2018 2017
NET DEBT
Net debt, January 1 5,966 35,361
Net cash flow 526 27,225
Net debt, discontinued operations1) - 56,010
Remeasurements to equity 505 1,027
Exchange rate effects and market value changes 23 417
Net debt, December 31 7,020 5,966
Surplus in funded pension plans 630 1,002
Non-current financial assets 46 28
Current financial assets 9 9
Cash and cash equivalents 648 538
Financial assets 1,333 1,577
Non-current financial liabilities 5,263 3,675
Provisions for pensions 528 366
Current financial liabilities 2,562 3,502
Financial liabilities 8,353 7,543
Net debt 7,020 5,966
1) Essity’s cash and cash equivalents were SEK 4,170m on the first day of quotation .
Key figure Description Application of the measure
Debt/equity ratio Net debt in relation to equity Shows financial risk and is a useful measure for manage-ment to monitor the level of the company’s indebtedness .
RETURN MEASURES Return is a financial term that describes how much the value of an asset changes from an earlier point in time
Key figure Description Application of the measure
Return on capital employed
Accumulated return on capital employed is calculated as 12-month rolling operating profit as a percentage of aver-age capital employed for the five most recent quarters . The corresponding key figure for a single quarter is calculated as operating profit for the quarter multiplied by four as a percentage of average capital employed for the two most recent quarters .
Used to measure return on capital tied up in operations .
Return on capital employed – industrial portion
Calculated as the Group’s adjusted return on capital employed, excluding operating profit and capital employed from the Forest operating segment and a share of other activities .
This is the most important ratio for management to measure return on capital tied up in the industrial operations .
Forest Wood Pulp PaperOther
activitiesTotal
Group
2018 fiscal year
Return on capital employed, ROCE
Operating profit, SEKm 1,277 685 364 1,925 –249 4,002
Average capital employed, SEKm 27,359 3,113 8,143 6,249 –442 44,422
Return on capital employed, ROCE, % 4.7% 22.0% 4.5% 30.8% 9.0%
Forest Wood Pulp PaperOther
activitiesTotal
Group
2017 fiscal year
Return on capital employed, ROCE
Operating profit, SEKm 1,244 443 236 956 –368 2,511
Average capital employed, SEKm 26,599 2,830 5,853 6,051 51 41,384
Return on capital employed, ROCE, % 4.7% 15.7% 4.0% 15.8% 6.1%
FINANCIAL STATEMENTS AND NOTES / GROUPS
CA
AN
NU
AL
RE
PO
RT
20
18
Introduction Strategy & operations Board of Directors’ Report Financial statements Sustainability facts Other
79
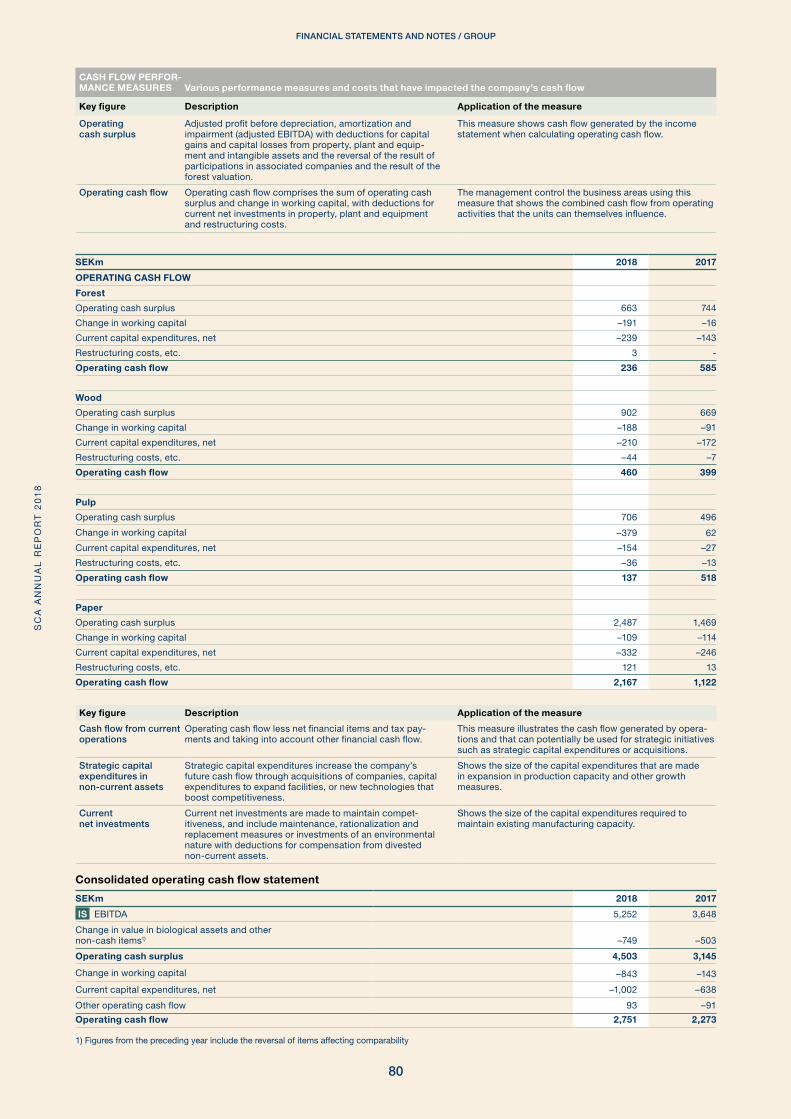
Consolidated operating cash flow statement
SEKm 2018 2017
IS EBITDA 5,252 3,648
Change in value in biological assets and other non-cash items1) –749 –503
Operating cash surplus 4,503 3,145
Change in working capital –843 –143
Current capital expenditures, net –1,002 –638
Other operating cash flow 93 –91
Operating cash flow 2,751 2,273
1) Figures from the preceding year include the reversal of items affecting comparability
CASH FLOW PERFOR-MANCE MEASURES Various performance measures and costs that have impacted the company’s cash flow
Key figure Description Application of the measure
Operating cash surplus
Adjusted profit before depreciation, amortization and impairment (adjusted EBITDA) with deductions for capital gains and capital losses from property, plant and equip-ment and intangible assets and the reversal of the result of participations in associated companies and the result of the forest valuation .
This measure shows cash flow generated by the income statement when calculating operating cash flow .
Operating cash flow Operating cash flow comprises the sum of operating cash surplus and change in working capital, with deductions for current net investments in property, plant and equipment and restructuring costs .
The management control the business areas using this measure that shows the combined cash flow from operating activities that the units can themselves influence .
SEKm 2018 2017
OPERATING CASH FLOW
Forest
Operating cash surplus 663 744
Change in working capital –191 –16
Current capital expenditures, net –239 –143
Restructuring costs, etc . 3 -
Operating cash flow 236 585
Wood
Operating cash surplus 902 669
Change in working capital –188 –91
Current capital expenditures, net –210 –172
Restructuring costs, etc . –44 –7
Operating cash flow 460 399
Pulp
Operating cash surplus 706 496
Change in working capital –379 62
Current capital expenditures, net –154 –27
Restructuring costs, etc . –36 –13
Operating cash flow 137 518
Paper
Operating cash surplus 2,487 1,469
Change in working capital –109 –114
Current capital expenditures, net –332 –246
Restructuring costs, etc . 121 13
Operating cash flow 2,167 1,122
Key figure Description Application of the measure
Cash flow from current operations
Operating cash flow less net financial items and tax pay-ments and taking into account other financial cash flow .
This measure illustrates the cash flow generated by opera-tions and that can potentially be used for strategic initiatives such as strategic capital expenditures or acquisitions .
Strategic capital expenditures in non-current assets
Strategic capital expenditures increase the company’s future cash flow through acquisitions of companies, capital expenditures to expand facilities, or new technologies that boost competitiveness .
Shows the size of the capital expenditures that are made in expansion in production capacity and other growth measures .
Current net investments
Current net investments are made to maintain compet-itiveness, and include maintenance, rationalization and replacement measures or investments of an environmental nature with deductions for compensation from divested non-current assets .
Shows the size of the capital expenditures required to maintain existing manufacturing capacity .
FINANCIAL STATEMENTS AND NOTES / GROUPS
CA
AN
NU
AL
RE
PO
RT
20
18
80
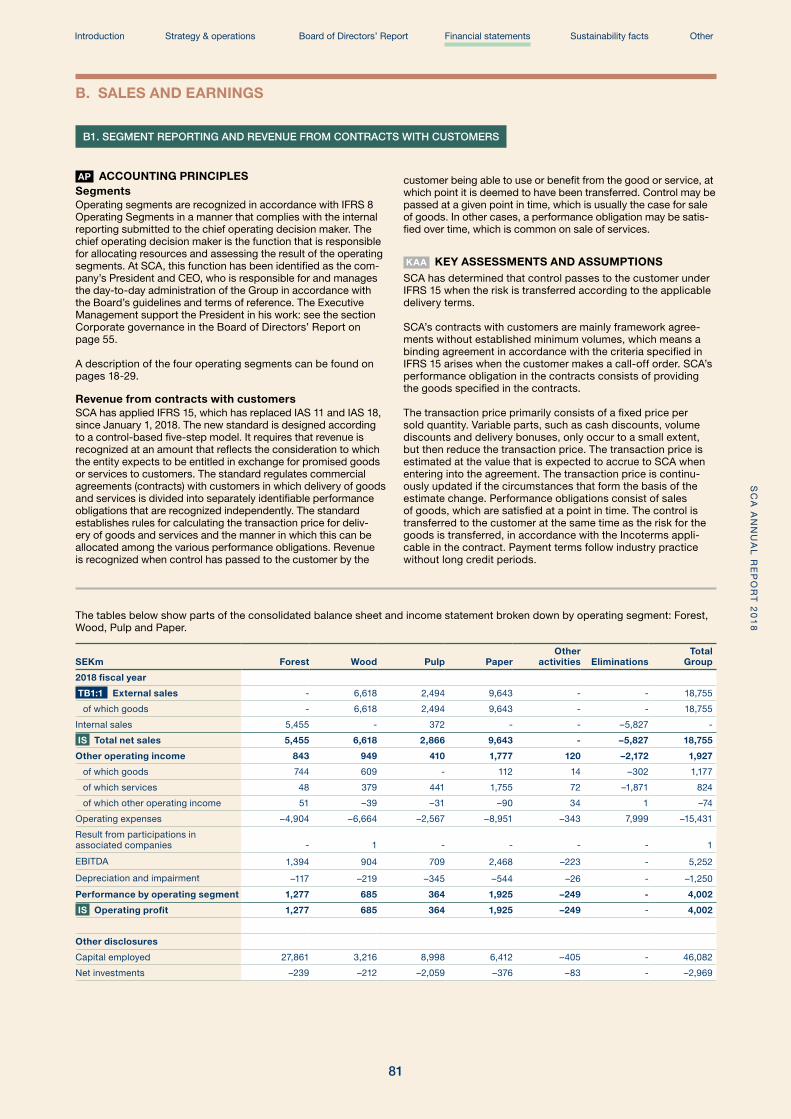
B1. SEGMENT REPORTING AND REVENUE FROM CONTRACTS WITH CUSTOMERS
AP ACCOUNTING PRINCIPLESSegmentsOperating segments are recognized in accordance with IFRS 8 Operating Segments in a manner that complies with the internal reporting submitted to the chief operating decision maker . The chief operating decision maker is the function that is responsible for allocating resources and assessing the result of the operating segments . At SCA, this function has been identified as the com-pany’s President and CEO, who is responsible for and manages the day-to-day administration of the Group in accordance with the Board’s guidelines and terms of reference . The Executive Management support the President in his work: see the section Corporate governance in the Board of Directors’ Report on page 55 .
A description of the four operating segments can be found on pages 18-29 .
Revenue from contracts with customersSCA has applied IFRS 15, which has replaced IAS 11 and IAS 18, since January 1, 2018 . The new standard is designed according to a control-based five-step model . It requires that revenue is recognized at an amount that reflects the consideration to which the entity expects to be entitled in exchange for promised goods or services to customers . The standard regulates commercial agreements (contracts) with customers in which delivery of goods and services is divided into separately identifiable performance obligations that are recognized independently . The standard establishes rules for calculating the transaction price for deliv-ery of goods and services and the manner in which this can be allocated among the various performance obligations . Revenue is recognized when control has passed to the customer by the
customer being able to use or benefit from the good or service, at which point it is deemed to have been transferred . Control may be passed at a given point in time, which is usually the case for sale of goods . In other cases, a performance obligation may be satis-fied over time, which is common on sale of services .
KAA KEY ASSESSMENTS AND ASSUMPTIONSSCA has determined that control passes to the customer under IFRS 15 when the risk is transferred according to the applicable delivery terms .
SCA’s contracts with customers are mainly framework agree-ments without established minimum volumes, which means a binding agreement in accordance with the criteria specified in IFRS 15 arises when the customer makes a call-off order . SCA’s performance obligation in the contracts consists of providing the goods specified in the contracts .
The transaction price primarily consists of a fixed price per sold quantity . Variable parts, such as cash discounts, volume discounts and delivery bonuses, only occur to a small extent, but then reduce the transaction price . The transaction price is estimated at the value that is expected to accrue to SCA when entering into the agreement . The transaction price is continu-ously updated if the circumstances that form the basis of the estimate change . Performance obligations consist of sales of goods, which are satisfied at a point in time . The control is transferred to the customer at the same time as the risk for the goods is transferred, in accordance with the Incoterms appli-cable in the contract . Payment terms follow industry practice without long credit periods .
The tables below show parts of the consolidated balance sheet and income statement broken down by operating segment: Forest, Wood, Pulp and Paper .
SEKm Forest Wood Pulp PaperOther
activities EliminationsTotal
Group
2018 fiscal year
TB1:1 External sales - 6,618 2,494 9,643 - - 18,755
of which goods - 6,618 2,494 9,643 - - 18,755
Internal sales 5,455 - 372 - - –5,827 -
IS Total net sales 5,455 6,618 2,866 9,643 - –5,827 18,755
Other operating income 843 949 410 1,777 120 –2,172 1,927
of which goods 744 609 - 112 14 –302 1,177
of which services 48 379 441 1,755 72 –1,871 824
of which other operating income 51 –39 –31 –90 34 1 –74
Operating expenses –4,904 –6,664 –2,567 –8,951 –343 7,999 –15,431
Result from participations in associated companies - 1 - - - - 1
EBITDA 1,394 904 709 2,468 –223 - 5,252
Depreciation and impairment –117 –219 –345 –544 –26 - –1,250
Performance by operating segment 1,277 685 364 1,925 –249 - 4,002
IS Operating profit 1,277 685 364 1,925 –249 - 4,002
Other disclosures
Capital employed 27,861 3,216 8,998 6,412 –405 - 46,082
Net investments –239 –212 –2,059 –376 –83 - –2,969
B. SALES AND EARNINGS
FINANCIAL STATEMENTS AND NOTES / GROUPS
CA
AN
NU
AL
RE
PO
RT
20
18
Introduction Strategy & operations Board of Directors’ Report Financial statements Sustainability facts Other
81

SEKm Forest Wood Pulp PaperOther
activities EliminationsTotal
Group
2017 fiscal year
TB1:1 External sales - 5,994 2,236 8,434 - - 16,664
of which goods - 5,994 2,236 8,434 - - 16,664
Internal sales 5,070 - 306 - - –5,376 -
IS Total net sales 5,070 5,994 2,542 8,434 - –5,376 16,664
Other operating income 679 796 285 1,736 49 –1,942 1,603
of which goods 649 469 - 100 - - 1,218
of which services 30 327 285 1,636 49 –1,942 385
Operating expenses –4,385 –6,122 –2,344 –8,691 –396 7,318 –14,620
Result from participations in associated companies - 1 - - - - 1
EBITDA1) 1,364 669 483 1,479 –347 - 3,648
Depreciation and impairment –120 –226 –247 –523 –21 - –1,137
Performance by operating segment 1,244 443 236 956 –368 - 2,511
IS Operating profit 1,244 443 236 956 –368 - 2,511
Other disclosures
Capital employed 26,829 2,817 7,154 5,861 58 - 42,719
Net investments –143 –199 –2,843 –246 –70 - –3,501
1) Items affecting comparability are included in EBITDA . These relate to other activities and concern personnel and other operating expenses .
Operating segmentsSCA recognizes four operating segments in accordance with IFRS 8:
The Forest segment manages 2 .6 million hectares of forest land, of which 2 million is productive, and supplies timber to SCA’s forest industry operations (Wood, Pulp and Paper) . SCA har-vests roughly the same volume of timber from its own forests as it purchases from other forest owners . By-products are used in energy production .
The Wood segment comprises five sawmills in Sweden, wood processing units with planing mills in Sweden, the UK and France, and a distribution and wholesale business . By-products are used in energy production .
The Pulp segment comprises kraft pulp and chemical ther-momechanical pulp (CTMP) . The pulp is produced in Östrand,
where a major investment project to expand the production capacity is also ongoing .
The Paper segment comprises packaging paper (kraftliner) manufactured in Obbola and Munksund, and publication paper manufactured in Ortviken, and used for magazines, catalogues and commercial print .
Intra-group deliveriesRevenues, expenses and results for the various operating seg-ments were affected by intra-Group deliveries . Internal prices are market-based . Intra-Group deliveries are eliminated when preparing the consolidated financial statements .
CustomersSCA’s ten largest customers account for 29% (29) of the compa-ny’s sales .
Revenue from contracts with customers
SEKm Forest Wood Pulp PaperOther
activities EliminationsTotal
Group
2018 fiscal year¹)
Net sales 5,455 6,618 2,866 9,643 - –5,827 18,755
of which revenue from contracts with customers, goods 5,455 6,618 2,866 9,643 - –5,827 18,755
Other operating income 843 949 410 1,777 120 –2,172 1,927
of which revenue from contracts with customers, goods 744 590 0 112 26 –302 1,170
of which revenue from contracts with customers, services 48 347 377 1,688 0 –1,679 781
of which other operating income 51 12 33 –23 94 –191 –24
1) SCA applied the modified retrospective method and has reported no values for 2017 .
FINANCIAL STATEMENTS AND NOTES / GROUPS
CA
AN
NU
AL
RE
PO
RT
20
18
82

TB1:1 Group by country
Net sales – sold to1) Net sales – sold by1)
2018 2017 2018 2017
SEKm % SEKm % SEKm % SEKm %
Sweden 2,717 15 2,396 14 16,080 86 14,111 85
EU excl. Sweden
UK 3,363 18 2,823 17 1,547 8 1,360 8
Germany 2,897 16 2,617 16 - - - -
France 1,385 7 1,248 7 392 2 332 2
Netherlands 720 4 645 4 - - - -
Denmark 655 3 520 3 - - - -
Belgium 437 2 425 3 - - - -
Poland 518 3 421 3 - - - -
Spain 523 3 355 2 - - - -
Italy 428 2 413 2 - - - -
Finland 350 2 316 2 - - - -
Rest of EU 740 4 648 4 - - - -
Total EU excl. Sweden 12,016 64 10,431 63 1,939 10 1,693 10
Rest of Europe
Norway 794 4 652 4 - - - -
Switzerland 173 1 146 1 - - - -
Other 112 - 116 - - - - -
Total, rest of Europe 1,079 5 914 5 - - - -
Rest of world
Japan 631 3 778 5 130 1 216 1
China 688 4 614 3 - - - -
US 346 2 270 2 - - - -
Morocco 347 2 296 2 - - - -
India 78 - 161 1 - - - -
Egypt 127 1 158 1 - - - -
Hong Kong 6 - 22 - 606 3 644 4
Other 720 4 624 4 - - - -
Total, rest of world 2,943 16 2,923 18 736 4 860 5
Total Group 18,755 100 16,664 100 18,755 100 16,664 100
1) Net sales have been recognized from two perspectives . The first column “Net sales – sold to” is based on sales to the countries where SCA has its customers . The second column “Net sales – sold by”, meaning revenue from external customers where the company is domiciled and in other countries from which the company receives revenues . Items Net sales - sold by Sweden and Rest of EU 2017 have been adjusted compared to Annual Report 2017 .
Group by country
Average number of employees Non-current assets1)
2018Of whom
men, %Of whom
women, % 2017Of whom
men, %Of whom
women, %SEKm
2018SEKm
2017
Sweden 3,677 80 20 3,592 82 18 50,453 48,149
EU excl. Sweden
Germany 46 43 57 45 46 54 1 1
UK 306 88 12 305 88 12 151 165
France 84 82 18 85 78 22 56 42
Netherlands 79 90 10 77 89 11 243 225
Belgium 2 100 - 2 100 - 1 1
Portugal - - - 1 - 100 - -
Rest of EU 11 71 29 11 68 32 1 1
Total EU excl. Sweden 528 83 17 526 83 17 453 435
Rest of world
Japan 3 30 70 4 27 73 - -
Hong Kong 8 38 62 5 52 48 - -
Total, rest of world 11 35 65 9 42 58 - -
Total Group 4,216 81 19 4,127 82 18 50,906 48,584
1) Non-current assets comprise goodwill, other intangible assets, buildings, land, machinery and equipment, and biological assets .
FINANCIAL STATEMENTS AND NOTES / GROUPS
CA
AN
NU
AL
RE
PO
RT
20
18
Introduction Strategy & operations Board of Directors’ Report Financial statements Sustainability facts Other
83

B2. OTHER OPERATING INCOME
Specification of other operating income
SEKm 2018 2017
Revenues from energy 931 776
Revenues from transportation 756 675
Other 240 152
IS Total 1,927 1,603
Other disclosuresGovernment grants received increased other operating income by SEK 10m (8) .
B3. RAW MATERIALS AND CONSUMABLES
Specification of raw materials and consumables
SEKm 2018 2017
Timber and chips –3,221 –2,863
Other raw materials and consumables –2,405 –2,032
Purchase of goods for resale –1,173 –1,056
IS Total –6,799 –5,951
B4. OTHER OPERATING EXPENSES
Specification of other operating expenses
SEKm 2018 2017
Transportation –3,522 –3,330
Energy1) –958 –950
Repairs and maintenance –816 –750
IT, telephony and lease of premises –369 –308
Other –1,193 –913
IS Total –6,858 –6,251
1) After deduction for revenues for energy in the amount of SEK 336m (158) . Other disclosuresGovernment grants received reduced operating expenses by SEK 38m (44) . Costs for research and development amounted to SEK –48m (–52) during the period .
Specification of auditing expenses
SEKm 2018 20171)
EY
Audit assignments –9 –8
Auditing activities other than the audit assign-ment –1 –3
Total EY –10 –11
Other auditors
Audit assignments 0 –1
Tax consultancy services - –1
Other assignments - –1
Total other auditors 0 –3
Total –10 –14
1) Additional costs include advisory services related to auditing in conjunction with the distribution of Essity of SEK 9m from EY and SEK 28m from other auditors . These costs are not included in operating expenses but are recog-nized against equity .
B5. ITEMS AFFECTING COMPARABILITY
AP ACCOUNTING PRINCIPLESProfit/loss items of a non-recurring nature (items affecting com-parability) with a significant impact on profit are reported sepa-rately to facilitate the understanding of the underlying develop-ment of the business . Such items include costs in connection with acquisitions, divestments, restructuring, impairment and other specific events . No items affecting comparability were recognized for 2018 .
Items affecting comparability by type of cost
SEKm 2018 2017
Personnel costs - –51
Impairment of property, plant and equipment - 4
Other operating expenses - –66
IS Total - –113
Items affecting comparability by activity
SEKm 2018 2017
Costs of split of SCA Group into two listed companies - –118
Reversal of impairment warehouse - 4
Other - 1
IS Total - –113
B6. TAXES
AP ACCOUNTING PRINCIPLESThe Group’s tax expense comprises current tax and deferred tax .
Current tax is calculated on the taxable profit for the period based on the tax rules prevailing in the countries where the Group operates . Since taxable profit excludes costs that are not tax deductible and income that is not taxable, this is differ-entiated from profit before tax in the income statement . Current tax also includes adjustments relating to recognized current tax from prior periods . Interest attributable to income tax is also recognized as income tax .
Deferred tax is calculated based on temporary differences between the carrying amounts and the taxable values of assets and liabilities and for tax loss carryforwards in so far as it is probable that these can be utilized against future taxable profits . Deferred taxes are measured at their nominal amount and based on the tax rates enacted on the balance sheet date . Deferred tax is not calculated on the initial recognition of goodwill or when an asset or liability is recognized for the first time, provided that the asset or liability is not attributable to an acquisition . SCA does not recognize tax that may arise on future dividends of the retained earnings of foreign subsidiaries . Any such future effects (withholding tax deducted at source and other deferred tax on profit-taking within the Group) are recognized when SCA can no longer control the reversal of such differences or when, for other reasons, it is probable that a reversal can take place in the foreseeable future .
The recognition of tax effects is determined by the manner in which the underlying transaction is recognized . For items in the income statement, the tax effect is recognized in the income statement . For transactions in equity and in other comprehen-sive income, the tax effect is recognized in equity and in other comprehensive income, respectively .
Tax liabilities and tax assets are recognized net when SCA has a legal right to offset .
FINANCIAL STATEMENTS AND NOTES / GROUPS
CA
AN
NU
AL
RE
PO
RT
20
18
84
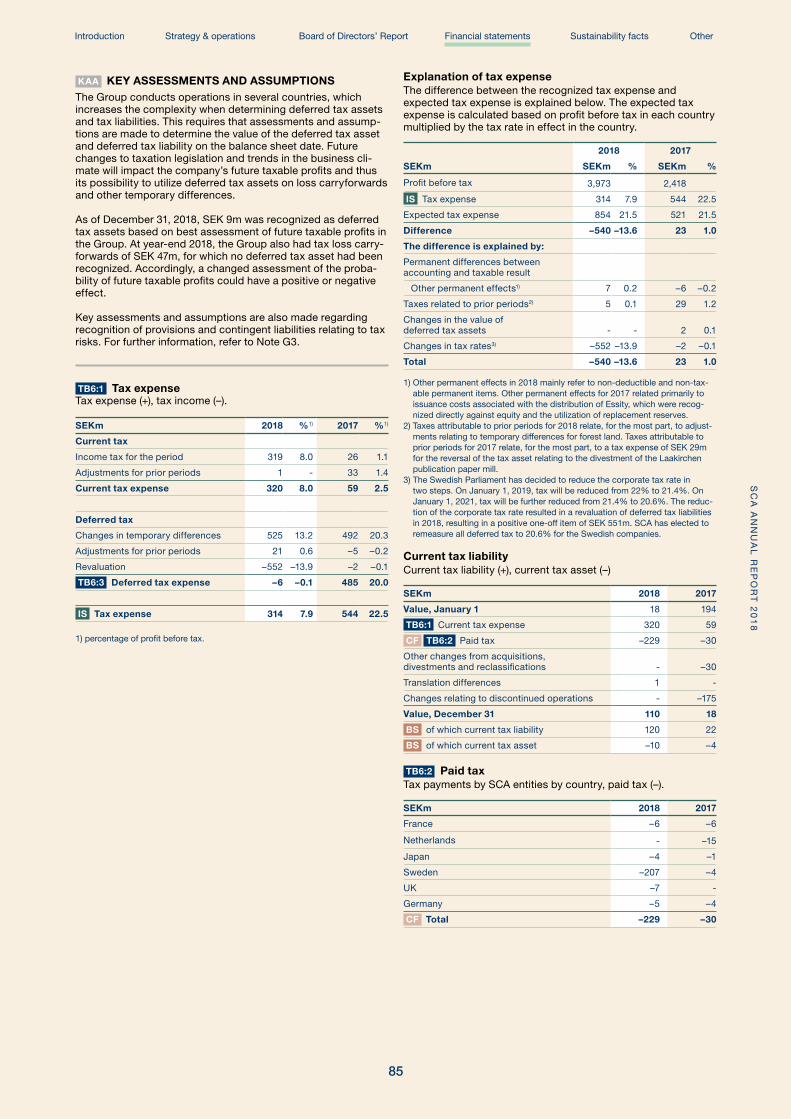
KAA KEY ASSESSMENTS AND ASSUMPTIONSThe Group conducts operations in several countries, which increases the complexity when determining deferred tax assets and tax liabilities . This requires that assessments and assump-tions are made to determine the value of the deferred tax asset and deferred tax liability on the balance sheet date . Future changes to taxation legislation and trends in the business cli-mate will impact the company’s future taxable profits and thus its possibility to utilize deferred tax assets on loss carryforwards and other temporary differences .
As of December 31, 2018, SEK 9m was recognized as deferred tax assets based on best assessment of future taxable profits in the Group . At year-end 2018, the Group also had tax loss carry-forwards of SEK 47m, for which no deferred tax asset had been recognized . Accordingly, a changed assessment of the proba-bility of future taxable profits could have a positive or negative effect .
Key assessments and assumptions are also made regarding recognition of provisions and contingent liabilities relating to tax risks . For further information, refer to Note G3 .
TB6:1 Tax expenseTax expense (+), tax income (–) .
SEKm 2018 % 1) 2017 % 1)
Current tax
Income tax for the period 319 8 .0 26 1 .1
Adjustments for prior periods 1 - 33 1 .4
Current tax expense 320 8.0 59 2.5
Deferred tax
Changes in temporary differences 525 13 .2 492 20 .3
Adjustments for prior periods 21 0 .6 –5 –0 .2
Revaluation –552 –13 .9 –2 –0 .1
TB6:3 Deferred tax expense –6 –0.1 485 20.0
IS Tax expense 314 7.9 544 22.5
1) percentage of profit before tax .
Explanation of tax expenseThe difference between the recognized tax expense and expected tax expense is explained below . The expected tax expense is calculated based on profit before tax in each country multiplied by the tax rate in effect in the country .
SEKm
2018 2017
SEKm % SEKm %
Profit before tax 3,973 2,418
IS Tax expense 314 7 .9 544 22 .5
Expected tax expense 854 21 .5 521 21 .5
Difference –540 –13.6 23 1.0
The difference is explained by:
Permanent differences between accounting and taxable result
Other permanent effects1) 7 0 .2 –6 –0 .2
Taxes related to prior periods2) 5 0 .1 29 1 .2
Changes in the value of deferred tax assets - - 2 0 .1
Changes in tax rates3) –552 –13 .9 –2 –0 .1
Total –540 –13.6 23 1.0
1) Other permanent effects in 2018 mainly refer to non-deductible and non-tax-able permanent items . Other permanent effects for 2017 related primarily to issuance costs associated with the distribution of Essity, which were recog-nized directly against equity and the utilization of replacement reserves .
2) Taxes attributable to prior periods for 2018 relate, for the most part, to adjust-ments relating to temporary differences for forest land . Taxes attributable to prior periods for 2017 relate, for the most part, to a tax expense of SEK 29m for the reversal of the tax asset relating to the divestment of the Laakirchen publication paper mill .
3) The Swedish Parliament has decided to reduce the corporate tax rate in two steps . On January 1, 2019, tax will be reduced from 22% to 21 .4% . On January 1, 2021, tax will be further reduced from 21 .4% to 20 .6% . The reduc-tion of the corporate tax rate resulted in a revaluation of deferred tax liabilities in 2018, resulting in a positive one-off item of SEK 551m . SCA has elected to remeasure all deferred tax to 20 .6% for the Swedish companies .
Current tax liabilityCurrent tax liability (+), current tax asset (–)
SEKm 2018 2017
Value, January 1 18 194
TB6:1 Current tax expense 320 59
CF TB6:2 Paid tax –229 –30
Other changes from acquisitions, divestments and reclassifications - –30
Translation differences 1 -
Changes relating to discontinued operations - –175
Value, December 31 110 18
BS of which current tax liability 120 22
BS of which current tax asset –10 –4
TB6:2 Paid taxTax payments by SCA entities by country, paid tax (–) .
SEKm 2018 2017
France –6 –6
Netherlands - –15
Japan –4 –1
Sweden –207 –4
UK –7 -
Germany –5 –4
CF Total –229 –30
FINANCIAL STATEMENTS AND NOTES / GROUPS
CA
AN
NU
AL
RE
PO
RT
20
18
Introduction Strategy & operations Board of Directors’ Report Financial statements Sustainability facts Other
85
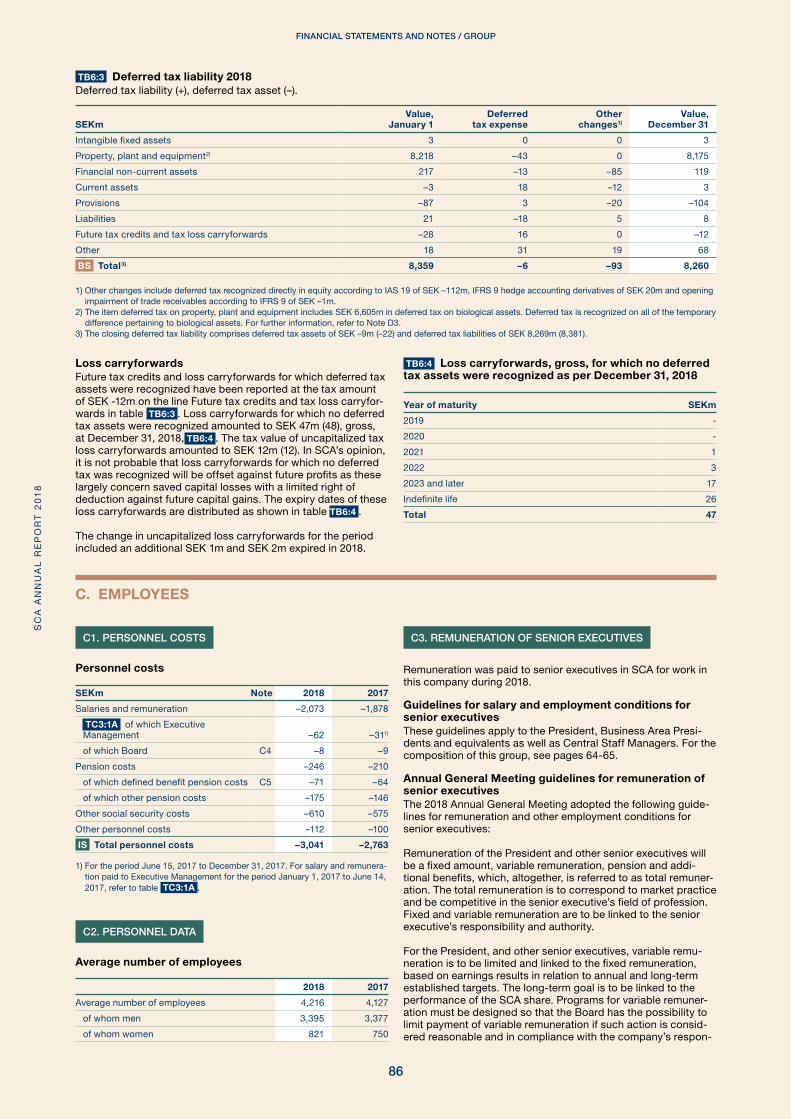
TB6:3 Deferred tax liability 2018Deferred tax liability (+), deferred tax asset (–) .
SEKmValue,
January 1Deferred
tax expenseOther
changes1)Value,
December 31
Intangible fixed assets 3 0 0 3
Property, plant and equipment2) 8,218 –43 0 8,175
Financial non-current assets 217 –13 –85 119
Current assets –3 18 –12 3
Provisions –87 3 –20 –104
Liabilities 21 –18 5 8
Future tax credits and tax loss carryforwards –28 16 0 –12
Other 18 31 19 68
BS Total3) 8,359 –6 –93 8,260
1) Other changes include deferred tax recognized directly in equity according to IAS 19 of SEK –112m, IFRS 9 hedge accounting derivatives of SEK 20m and opening impairment of trade receivables according to IFRS 9 of SEK –1m .
2) The item deferred tax on property, plant and equipment includes SEK 6,605m in deferred tax on biological assets . Deferred tax is recognized on all of the temporary difference pertaining to biological assets . For further information, refer to Note D3 .
3) The closing deferred tax liability comprises deferred tax assets of SEK –9m (–22) and deferred tax liabilities of SEK 8,269m (8,381) .
Loss carryforwardsFuture tax credits and loss carryforwards for which deferred tax assets were recognized have been reported at the tax amount of SEK -12m on the line Future tax credits and tax loss carryfor-wards in table TB6:3 . Loss carryforwards for which no deferred tax assets were recognized amounted to SEK 47m (48), gross, at December 31, 2018, TB6:4 . The tax value of uncapitalized tax loss carryforwards amounted to SEK 12m (12) . In SCA’s opinion, it is not probable that loss carryforwards for which no deferred tax was recognized will be offset against future profits as these largely concern saved capital losses with a limited right of deduction against future capital gains . The expiry dates of these loss carryforwards are distributed as shown in table TB6:4 .
The change in uncapitalized loss carryforwards for the period included an additional SEK 1m and SEK 2m expired in 2018 .
TB6:4 Loss carryforwards, gross, for which no deferred tax assets were recognized as per December 31, 2018
Year of maturity SEKm
2019 -
2020 -
2021 1
2022 3
2023 and later 17
Indefinite life 26
Total 47
C1. PERSONNEL COSTS
Personnel costs
SEKm Note 2018 2017
Salaries and remuneration –2,073 –1,878
TC3:1A of which Executive Management –62 –311)
of which Board C4 –8 –9
Pension costs –246 –210
of which defined benefit pension costs C5 –71 –64
of which other pension costs –175 –146
Other social security costs –610 –575
Other personnel costs –112 –100
IS Total personnel costs –3,041 –2,763
1) For the period June 15, 2017 to December 31, 2017 . For salary and remunera-tion paid to Executive Management for the period January 1, 2017 to June 14, 2017, refer to table TC3:1A .
C2. PERSONNEL DATA
Average number of employees
2018 2017
Average number of employees 4,216 4,127
of whom men 3,395 3,377
of whom women 821 750
C3. REMUNERATION OF SENIOR EXECUTIVES
Remuneration was paid to senior executives in SCA for work in this company during 2018 .
Guidelines for salary and employment conditions for senior executives These guidelines apply to the President, Business Area Presi-dents and equivalents as well as Central Staff Managers . For the composition of this group, see pages 64-65 . Annual General Meeting guidelines for remuneration of senior executivesThe 2018 Annual General Meeting adopted the following guide-lines for remuneration and other employment conditions for senior executives:
Remuneration of the President and other senior executives will be a fixed amount, variable remuneration, pension and addi-tional benefits, which, altogether, is referred to as total remuner-ation . The total remuneration is to correspond to market practice and be competitive in the senior executive’s field of profession . Fixed and variable remuneration are to be linked to the senior executive’s responsibility and authority .
For the President, and other senior executives, variable remu-neration is to be limited and linked to the fixed remuneration, based on earnings results in relation to annual and long-term established targets . The long-term goal is to be linked to the performance of the SCA share . Programs for variable remuner-ation must be designed so that the Board has the possibility to limit payment of variable remuneration if such action is consid-ered reasonable and in compliance with the company’s respon-
C. EMPLOYEES
FINANCIAL STATEMENTS AND NOTES / GROUPS
CA
AN
NU
AL
RE
PO
RT
20
18
86
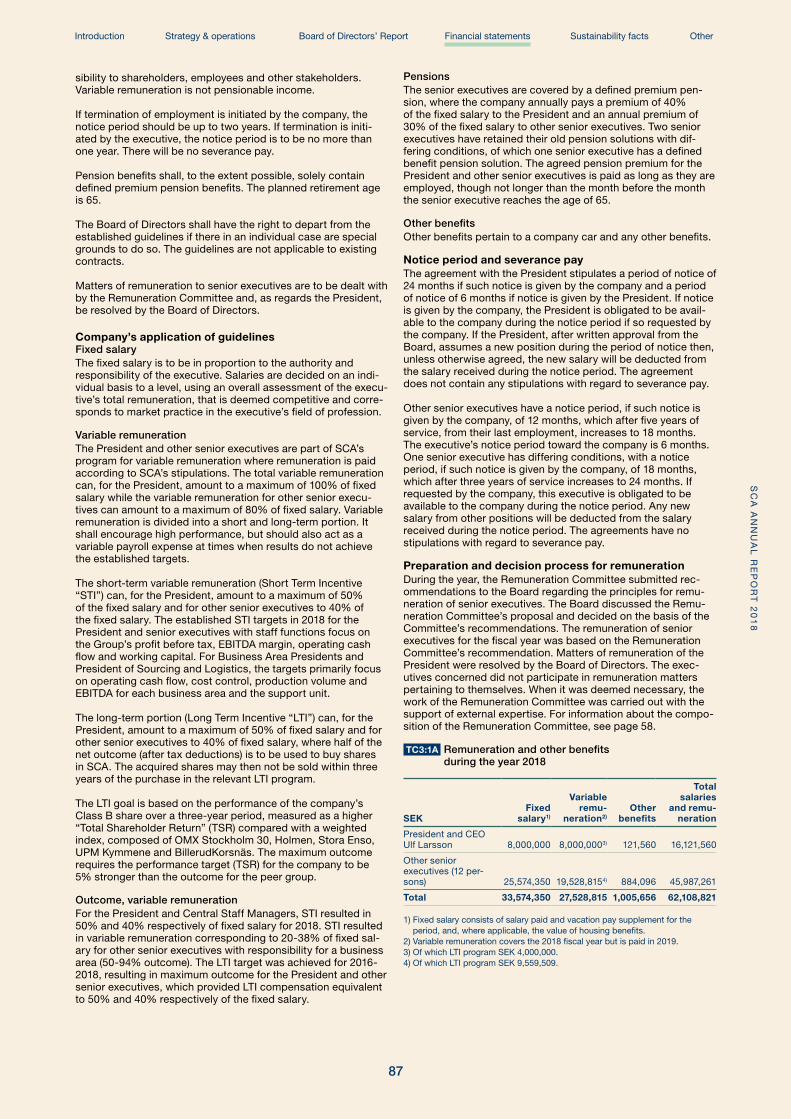
sibility to shareholders, employees and other stakeholders . Variable remuneration is not pensionable income .
If termination of employment is initiated by the company, the notice period should be up to two years . If termination is initi-ated by the executive, the notice period is to be no more than one year . There will be no severance pay .
Pension benefits shall, to the extent possible, solely contain defined premium pension benefits . The planned retirement age is 65 .
The Board of Directors shall have the right to depart from the established guidelines if there in an individual case are special grounds to do so . The guidelines are not applicable to existing contracts .
Matters of remuneration to senior executives are to be dealt with by the Remuneration Committee and, as regards the President, be resolved by the Board of Directors .
Company’s application of guidelinesFixed salaryThe fixed salary is to be in proportion to the authority and responsibility of the executive . Salaries are decided on an indi-vidual basis to a level, using an overall assessment of the execu-tive’s total remuneration, that is deemed competitive and corre-sponds to market practice in the executive’s field of profession .
Variable remunerationThe President and other senior executives are part of SCA’s program for variable remuneration where remuneration is paid according to SCA’s stipulations . The total variable remuneration can, for the President, amount to a maximum of 100% of fixed salary while the variable remuneration for other senior execu-tives can amount to a maximum of 80% of fixed salary . Variable remuneration is divided into a short and long-term portion . It shall encourage high performance, but should also act as a variable payroll expense at times when results do not achieve the established targets .
The short-term variable remuneration (Short Term Incentive “STI”) can, for the President, amount to a maximum of 50% of the fixed salary and for other senior executives to 40% of the fixed salary . The established STI targets in 2018 for the President and senior executives with staff functions focus on the Group’s profit before tax, EBITDA margin, operating cash flow and working capital . For Business Area Presidents and President of Sourcing and Logistics, the targets primarily focus on operating cash flow, cost control, production volume and EBITDA for each business area and the support unit .
The long-term portion (Long Term Incentive “LTI”) can, for the President, amount to a maximum of 50% of fixed salary and for other senior executives to 40% of fixed salary, where half of the net outcome (after tax deductions) is to be used to buy shares in SCA . The acquired shares may then not be sold within three years of the purchase in the relevant LTI program .
The LTI goal is based on the performance of the company’s Class B share over a three-year period, measured as a higher “Total Shareholder Return” (TSR) compared with a weighted index, composed of OMX Stockholm 30, Holmen, Stora Enso, UPM Kymmene and BillerudKorsnäs . The maximum outcome requires the performance target (TSR) for the company to be 5% stronger than the outcome for the peer group .
Outcome, variable remunerationFor the President and Central Staff Managers, STI resulted in 50% and 40% respectively of fixed salary for 2018 . STI resulted in variable remuneration corresponding to 20-38% of fixed sal-ary for other senior executives with responsibility for a business area (50-94% outcome) . The LTI target was achieved for 2016-2018, resulting in maximum outcome for the President and other senior executives, which provided LTI compensation equivalent to 50% and 40% respectively of the fixed salary .
PensionsThe senior executives are covered by a defined premium pen-sion, where the company annually pays a premium of 40% of the fixed salary to the President and an annual premium of 30% of the fixed salary to other senior executives . Two senior executives have retained their old pension solutions with dif-fering conditions, of which one senior executive has a defined benefit pension solution . The agreed pension premium for the President and other senior executives is paid as long as they are employed, though not longer than the month before the month the senior executive reaches the age of 65 .
Other benefitsOther benefits pertain to a company car and any other benefits .
Notice period and severance payThe agreement with the President stipulates a period of notice of 24 months if such notice is given by the company and a period of notice of 6 months if notice is given by the President . If notice is given by the company, the President is obligated to be avail-able to the company during the notice period if so requested by the company . If the President, after written approval from the Board, assumes a new position during the period of notice then, unless otherwise agreed, the new salary will be deducted from the salary received during the notice period . The agreement does not contain any stipulations with regard to severance pay . Other senior executives have a notice period, if such notice is given by the company, of 12 months, which after five years of service, from their last employment, increases to 18 months . The executive’s notice period toward the company is 6 months . One senior executive has differing conditions, with a notice period, if such notice is given by the company, of 18 months, which after three years of service increases to 24 months . If requested by the company, this executive is obligated to be available to the company during the notice period . Any new salary from other positions will be deducted from the salary received during the notice period . The agreements have no stipulations with regard to severance pay .
Preparation and decision process for remuneration During the year, the Remuneration Committee submitted rec-ommendations to the Board regarding the principles for remu-neration of senior executives . The Board discussed the Remu-neration Committee’s proposal and decided on the basis of the Committee’s recommendations . The remuneration of senior executives for the fiscal year was based on the Remuneration Committee’s recommendation . Matters of remuneration of the President were resolved by the Board of Directors . The exec-utives concerned did not participate in remuneration matters pertaining to themselves . When it was deemed necessary, the work of the Remuneration Committee was carried out with the support of external expertise . For information about the compo-sition of the Remuneration Committee, see page 58 .
TC3:1A Remuneration and other benefits during the year 2018
SEKFixed
salary1)
Variable remu-
neration2)Other
benefits
Total salaries
and remu-neration
President and CEO Ulf Larsson 8,000,000 8,000,0003) 121,560 16,121,560
Other senior executives (12 per-sons) 25,574,350 19,528,8154) 884,096 45,987,261
Total 33,574,350 27,528,815 1,005,656 62,108,821
1) Fixed salary consists of salary paid and vacation pay supplement for the period, and, where applicable, the value of housing benefits .
2) Variable remuneration covers the 2018 fiscal year but is paid in 2019 .3) Of which LTI program SEK 4,000,000 .4) Of which LTI program SEK 9,559,509 .
FINANCIAL STATEMENTS AND NOTES / GROUPS
CA
AN
NU
AL
RE
PO
RT
20
18
Introduction Strategy & operations Board of Directors’ Report Financial statements Sustainability facts Other
87

Remuneration and other benefits in 2017 (until June 14)
SEKFixed
salary
Variable remu-
nerationOther
benefits
Total salaries
and remu-neration
President and CEO Magnus Groth 5,466,667 4,624,800 41,062 10,132,529
Other senior execu-tives (14 persons) 27,971,918 22,922,376 1,250,440 52,144,734
Total 33,438,585 27,547,176 1,291,502 62,277,263
Remuneration and other benefits in 2017 (from June 15)
SEKFixed
salary1)
Variable remu-
neration2)Other
benefits
Total salaries
and remu-neration
President and CEO Ulf Larsson 3,536,383 3,536,3833) 63,916 7,136,682
Other senior execu-tives (12 persons) 13,746,642 9,861,5334) 434,565 24,042,740
Total 17,283,025 13,397,916 498,481 31,179,422
1) Fixed salary consists of salary paid and vacation pay supplement for the period, and, where applicable, the value of housing benefits .
2) Variable remuneration is calculated on fixed salary and covers the 2017 fiscal year (June 15, 2017 to December 31, 2017) and was paid in 2018 .
3) Of which LTI program SEK 1,768,192 .4) Of which LTI program SEK 5,119,457 .
TC3:1B Pension costs 20181)
SEK
President and CEO Ulf Larsson2) 3,322,479
Other senior executives (12 persons)2) 8,771,984
Total 12,094,463
1) The pension costs pertain to the costs that affected profit for 2018, excluding special payroll tax .
2) Outstanding pension obligations to all senior executives, including the Presi-dent and CEO, amounted to SEK 36,841,000 (value as of December 31, 2018) . These primarily consist of defined benefit pension plans, including ITP .
Pension costs for 2017 (until June 14)1)
SEK
President and CEO Magnus Groth2) 2,294,178
Other senior executives (14 persons)3) 8,577,791
Total 10,871,969
1) The pension costs pertain to the costs that affected profit for 2017, excluding special payroll tax .
2) Outstanding pension obligations (value as of December 31, 2017) amounted to SEK 18,858,000 .
3) Outstanding pension obligations (value as of December 31, 2017) amounted to SEK 106,453,265 .
Pension costs for 2017 (from June 15)1)
SEK
President and CEO Ulf Larsson2) 1,485,927
Other senior executives (12 persons)2) 4,836,181
Total 6,322,108
1) The pension costs pertain to the costs that affected profit for 2017, excluding special payroll tax .
2) Outstanding pension obligations to all senior executives, including the Presi-dent and CEO, amounted to SEK 37,082,000 (value as of December 31, 2017) . These primarily consist of defined benefit pension plans, including ITP .
SEK
Board feeAudit
Committee feeRemuneration Committee fee
Remuneration SCA
Forest Products Extra
remuneration1) Total
2018 2017 2018 2017 2018 2017 2018 2017 2018 2017 2018 2017
Pär Boman 1 800,000 1 800,000 250,000 250,000 135,000 135,000 - - - 57,534 2,185,000 2,242,534
Charlotte Bengtsson 600,000 600,000 - - - - - 250,000 - - 600,000 850,000
Lennart Evrell 600,000 600,000 - - 105,000 105,000 - 250,000 - - 705,000 955,000
Annemarie Gardshol 600,000 600,000 - - - - - - - 19,178 600,000 619,178
Martin Lindqvist 600,000 600,000 250,000 250,000 - - - 250,000 - - 850,000 1 100,000
Lotta Lyrå 600,000 600,000 - - - - - - - - 600,000 600,000
Bert Nordberg 600,000 600,000 - 47,945 105,000 105,000 - - - 19,178 705,000 772,123
Anders Sundström 600,000 - - - - - - - - - 600,000 -
Barbara Milian Thoralfsson 600,000 600,000 330,000 330,000 - - - - - 19,178 930,000 949,178
Louise Svanberg - - - - - 26,250 - - - 175,000 - 201,250
Maija-Liisa Friman - - - - - - - - - 175,000 - 175,000
Lars Rebien Sörensen - - - - - - - - - 175,000 - 175,000
Johan Malmquist - - - - - - - - - 175,000 - 175,000
Ewa Björling - - - - - - - - - 175,000 - 175,000
Total 6,600,000 6,000,000 830,000 877,945 345,000 371,250 - 750,000 - 990,068 7,775,000 8,989,263
1) For the period April 5, 2017 to June 14, 2017 (70 days) .
SCA’s Board consists of 4 women and 6 men . The senior executives category above includes 12 persons, of which 10 are men and 2 are women .
Remuneration to non-executive Board members refers to the established fees approved at the AGM (Annual General Meeting) on March 20, for the period until the next AGM in March 2019 . No remuneration is paid to the President and CEO and other employees .
C4. FEES TO BOARD MEMBERS IN THE PARENT COMPANY
FINANCIAL STATEMENTS AND NOTES / GROUPS
CA
AN
NU
AL
RE
PO
RT
20
18
88
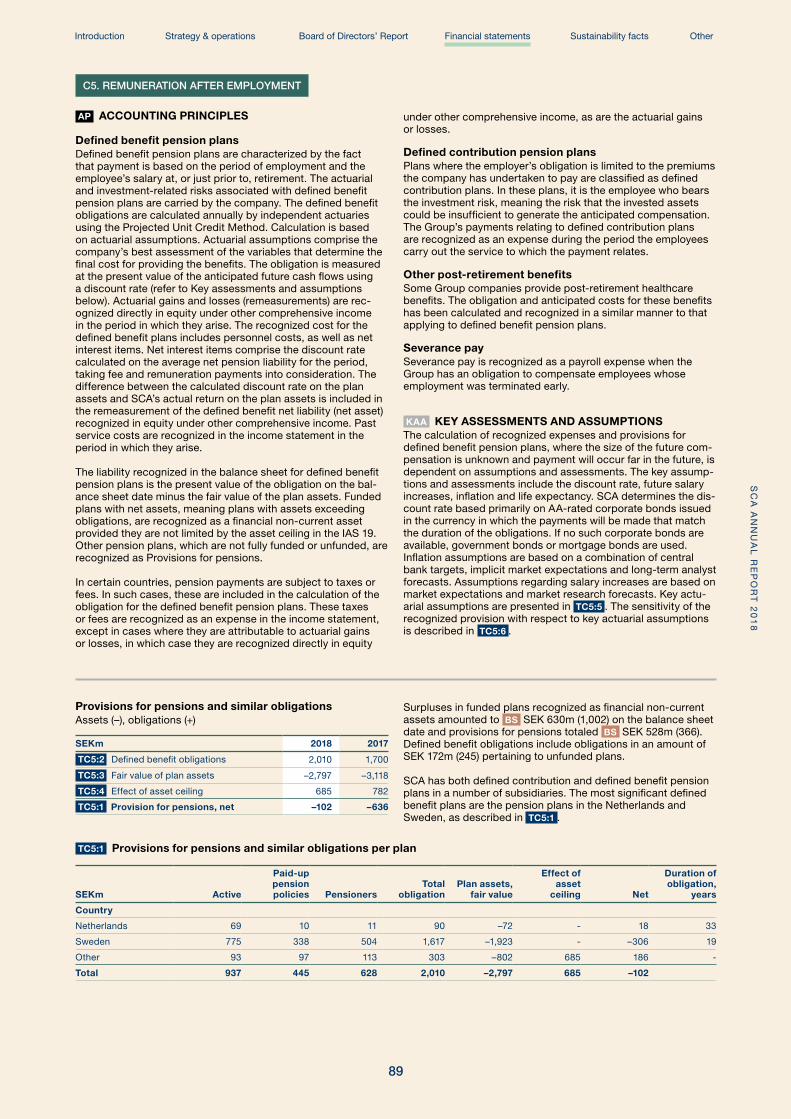
C5. REMUNERATION AFTER EMPLOYMENT
AP ACCOUNTING PRINCIPLES
Defined benefit pension plansDefined benefit pension plans are characterized by the fact that payment is based on the period of employment and the employee’s salary at, or just prior to, retirement . The actuarial and investment-related risks associated with defined benefit pension plans are carried by the company . The defined benefit obligations are calculated annually by independent actuaries using the Projected Unit Credit Method . Calculation is based on actuarial assumptions . Actuarial assumptions comprise the company’s best assessment of the variables that determine the final cost for providing the benefits . The obligation is measured at the present value of the anticipated future cash flows using a discount rate (refer to Key assessments and assumptions below) . Actuarial gains and losses (remeasurements) are rec-ognized directly in equity under other comprehensive income in the period in which they arise . The recognized cost for the defined benefit plans includes personnel costs, as well as net interest items . Net interest items comprise the discount rate calculated on the average net pension liability for the period, taking fee and remuneration payments into consideration . The difference between the calculated discount rate on the plan assets and SCA’s actual return on the plan assets is included in the remeasurement of the defined benefit net liability (net asset) recognized in equity under other comprehensive income . Past service costs are recognized in the income statement in the period in which they arise .
The liability recognized in the balance sheet for defined benefit pension plans is the present value of the obligation on the bal-ance sheet date minus the fair value of the plan assets . Funded plans with net assets, meaning plans with assets exceeding obligations, are recognized as a financial non-current asset provided they are not limited by the asset ceiling in the IAS 19 . Other pension plans, which are not fully funded or unfunded, are recognized as Provisions for pensions .
In certain countries, pension payments are subject to taxes or fees . In such cases, these are included in the calculation of the obligation for the defined benefit pension plans . These taxes or fees are recognized as an expense in the income statement, except in cases where they are attributable to actuarial gains or losses, in which case they are recognized directly in equity
under other comprehensive income, as are the actuarial gains or losses .
Defined contribution pension plans Plans where the employer’s obligation is limited to the premiums the company has undertaken to pay are classified as defined contribution plans . In these plans, it is the employee who bears the investment risk, meaning the risk that the invested assets could be insufficient to generate the anticipated compensation . The Group’s payments relating to defined contribution plans are recognized as an expense during the period the employees carry out the service to which the payment relates .
Other post-retirement benefitsSome Group companies provide post-retirement healthcare benefits . The obligation and anticipated costs for these benefits has been calculated and recognized in a similar manner to that applying to defined benefit pension plans . Severance paySeverance pay is recognized as a payroll expense when the Group has an obligation to compensate employees whose employment was terminated early .
KAA KEY ASSESSMENTS AND ASSUMPTIONSThe calculation of recognized expenses and provisions for defined benefit pension plans, where the size of the future com-pensation is unknown and payment will occur far in the future, is dependent on assumptions and assessments . The key assump-tions and assessments include the discount rate, future salary increases, inflation and life expectancy . SCA determines the dis-count rate based primarily on AA-rated corporate bonds issued in the currency in which the payments will be made that match the duration of the obligations . If no such corporate bonds are available, government bonds or mortgage bonds are used . Inflation assumptions are based on a combination of central bank targets, implicit market expectations and long-term analyst forecasts . Assumptions regarding salary increases are based on market expectations and market research forecasts . Key actu-arial assumptions are presented in TC5:5 . The sensitivity of the recognized provision with respect to key actuarial assumptions is described in TC5:6 .
Provisions for pensions and similar obligationsAssets (–), obligations (+)
SEKm 2018 2017
TC5:2 Defined benefit obligations 2,010 1,700
TC5:3 Fair value of plan assets –2,797 –3,118
TC5:4 Effect of asset ceiling 685 782
TC5:1 Provision for pensions, net –102 –636
Surpluses in funded plans recognized as financial non-current assets amounted to BS SEK 630m (1,002) on the balance sheet date and provisions for pensions totaled BS SEK 528m (366) . Defined benefit obligations include obligations in an amount of SEK 172m (245) pertaining to unfunded plans .
SCA has both defined contribution and defined benefit pension plans in a number of subsidiaries . The most significant defined benefit plans are the pension plans in the Netherlands and Sweden, as described in TC5:1 .
TC5:1 Provisions for pensions and similar obligations per plan
SEKm Active
Paid-up pension policies Pensioners
Total obligation
Plan assets, fair value
Effect of asset
ceiling Net
Duration of obligation,
years
Country
Netherlands 69 10 11 90 –72 - 18 33
Sweden 775 338 504 1,617 –1,923 - –306 19
Other 93 97 113 303 –802 685 186 -
Total 937 445 628 2,010 –2,797 685 –102
FINANCIAL STATEMENTS AND NOTES / GROUPS
CA
AN
NU
AL
RE
PO
RT
20
18
Introduction Strategy & operations Board of Directors’ Report Financial statements Sustainability facts Other
89
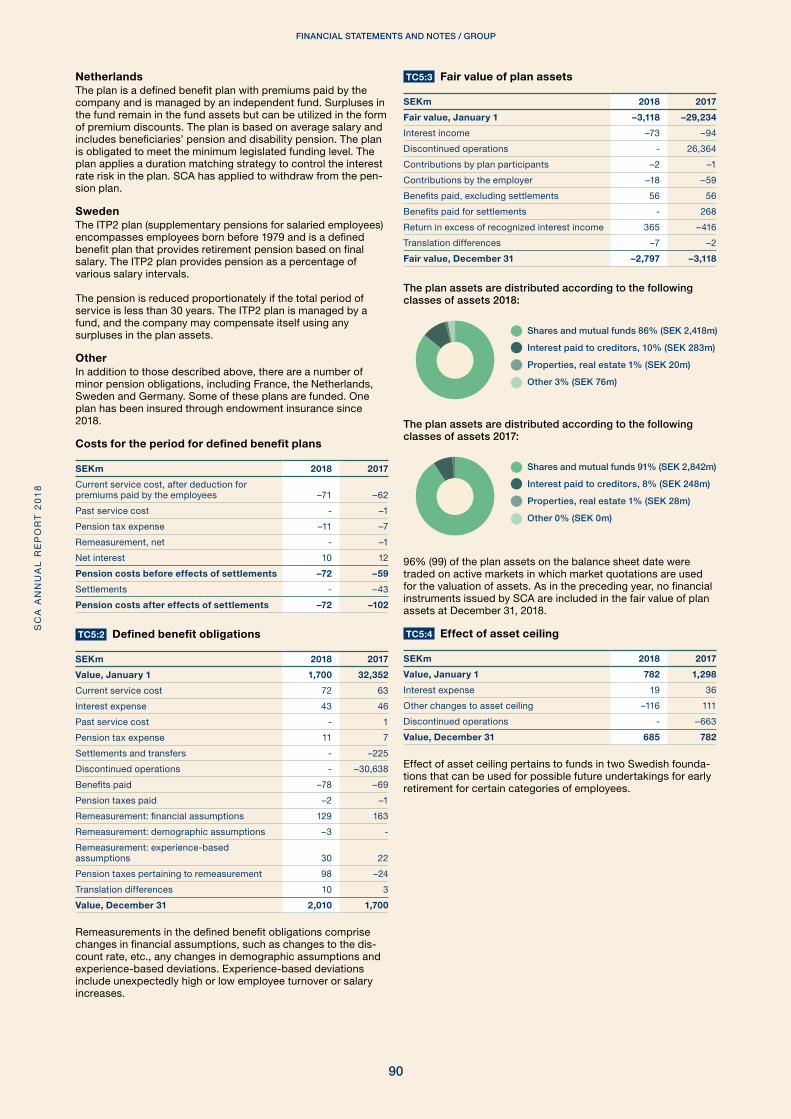
NetherlandsThe plan is a defined benefit plan with premiums paid by the company and is managed by an independent fund . Surpluses in the fund remain in the fund assets but can be utilized in the form of premium discounts . The plan is based on average salary and includes beneficiaries’ pension and disability pension . The plan is obligated to meet the minimum legislated funding level . The plan applies a duration matching strategy to control the interest rate risk in the plan . SCA has applied to withdraw from the pen-sion plan .
SwedenThe ITP2 plan (supplementary pensions for salaried employees) encompasses employees born before 1979 and is a defined benefit plan that provides retirement pension based on final salary . The ITP2 plan provides pension as a percentage of various salary intervals .
The pension is reduced proportionately if the total period of service is less than 30 years . The ITP2 plan is managed by a fund, and the company may compensate itself using any surpluses in the plan assets .
OtherIn addition to those described above, there are a number of minor pension obligations, including France, the Netherlands, Sweden and Germany . Some of these plans are funded . One plan has been insured through endowment insurance since 2018 .
Costs for the period for defined benefit plans
SEKm 2018 2017
Current service cost, after deduction for premiums paid by the employees –71 –62
Past service cost - –1
Pension tax expense –11 –7
Remeasurement, net - –1
Net interest 10 12
Pension costs before effects of settlements –72 –59
Settlements - –43
Pension costs after effects of settlements –72 –102
TC5:2 Defined benefit obligations
SEKm 2018 2017
Value, January 1 1,700 32,352
Current service cost 72 63
Interest expense 43 46
Past service cost - 1
Pension tax expense 11 7
Settlements and transfers - –225
Discontinued operations - –30,638
Benefits paid –78 –69
Pension taxes paid –2 –1
Remeasurement: financial assumptions 129 163
Remeasurement: demographic assumptions –3 -
Remeasurement: experience-based assumptions 30 22
Pension taxes pertaining to remeasurement 98 –24
Translation differences 10 3
Value, December 31 2,010 1,700
Remeasurements in the defined benefit obligations comprise changes in financial assumptions, such as changes to the dis-count rate, etc ., any changes in demographic assumptions and experience-based deviations . Experience-based deviations include unexpectedly high or low employee turnover or salary increases .
TC5:3 Fair value of plan assets
SEKm 2018 2017
Fair value, January 1 –3,118 –29,234
Interest income –73 –94
Discontinued operations - 26,364
Contributions by plan participants –2 –1
Contributions by the employer –18 –59
Benefits paid, excluding settlements 56 56
Benefits paid for settlements - 268
Return in excess of recognized interest income 365 –416
Translation differences –7 –2
Fair value, December 31 –2,797 –3,118
The plan assets are distributed according to the following classes of assets 2018:
Shares and mutual funds 86% (SEK 2,418m)
Interest paid to creditors, 10% (SEK 283m)
Properties, real estate 1% (SEK 20m)
Other 3% (SEK 76m)
The plan assets are distributed according to the following classes of assets 2017:
Shares and mutual funds 91% (SEK 2,842m)
Interest paid to creditors, 8% (SEK 248m)
Properties, real estate 1% (SEK 28m)
Other 0% (SEK 0m)
96% (99) of the plan assets on the balance sheet date were traded on active markets in which market quotations are used for the valuation of assets . As in the preceding year, no financial instruments issued by SCA are included in the fair value of plan assets at December 31, 2018 .
TC5:4 Effect of asset ceiling
SEKm 2018 2017
Value, January 1 782 1,298
Interest expense 19 36
Other changes to asset ceiling –116 111
Discontinued operations - –663
Value, December 31 685 782
Effect of asset ceiling pertains to funds in two Swedish founda-tions that can be used for possible future undertakings for early retirement for certain categories of employees .
FINANCIAL STATEMENTS AND NOTES / GROUPS
CA
AN
NU
AL
RE
PO
RT
20
18
90

TC5:5 Principal actuarial assumptions
Sweden Eurozone
2018
Discount rate 2 .23 1 .60
Expected salary increase rate 3 .32 3 .00
Expected inflation 2 .07 1 .75
Life expectancy, men1) 22 21
Life expectancy, women1) 25 24
2017
Discount rate 2 .60 1 .30
Expected salary increase rate 3 .25 2 .85
Expected inflation 2 .00 1 .60
Life expectancy, men1) 22 22
Life expectancy, women1) 25 24
1) Life expectancy, expressed in years, for an individual currently aged 65 .
TC5:6 Change of obligation, increased obligation (–)
SEKm
Discount rate +0 .25% 91
Price inflation, incl . salary inflation +0 .25% –90
Longevity +1 year –67
The above sensitivity analysis is calculated by changing one assumption while the others remain constant .
Other disclosuresMultiemployer plansSCA has obligations for disability and family pensions for salaried employees in Sweden, secured through insurance with the insurance company Alecta . These benefits are reported as defined contribution plans since there is no basis for allocating the obligations, plan assets and costs to the individual compa-nies covered by the plan .
Budgeted contributionsThe budgeted contributions for the company’s defined benefit pension plans for 2019 were calculated at SEK 59m . Contributions for multiemployer plans for 2019 were calculated at SEK 7m .
D1. INTANGIBLE FIXED ASSETS
AP ACCOUNTING PRINCIPLES
GoodwillGoodwill arises in connection with business combinations where the consideration transferred exceeds the fair value of the acquired net assets . Goodwill is recognized at cost less accu-mulated impairment and is an intangible asset with an indefinite useful life . This means that goodwill is not amortized, but rather is tested annually for impairment . All goodwill is allocated to the cash-generating units that to benefit from the synergies from the business combination . In connection with the sale of Group companies, goodwill attributable to the divested unit is included in the capital gain . Goodwill that arises in acquisitions of associated companies or joint ventures is included in the carrying amount of the respective associate or joint venture . The cash-generating units correspond to the operating segments in accordance with Note B1 .
Other intangible fixed assets Intangible assets also include patents, licenses and other similar rights . Acquired assets of this type are recognized at cost and are amortized on a straight-line basis during their anticipated useful life, which varies between 3 and 20 years .
Customer relations are measured at fair value at the time of the acquisition . The value of these customer relations is amortized over their useful life, which is considered to be between 3 and 15 years .
Research expenditure is recognized as an expense as incurred . Identifiable expenditure for development of new products and processes is capitalized to the extent it is expected to provide future economic benefits . In cases in which it is difficult to sepa-rate the research phase from the development phase in a project, the entire project is treated as research and expensed immedi-ately . Capitalized expenditure is amortized on a straight-line basis from the date when the asset is in a location and in the condition required to use it in the manner intended by management .
Impairment testing Goodwill is tested annually for impairment . When testing for impairment, the assets are grouped in cash-generating units in accordance with SCA’s operating segments in Note B1 . The test compares the carrying amounts of the cash-generating units with the recoverable amounts . The recoverable amount of each
cash-generating unit is determined by discounting future cash flows in order to determine their value in use . The calculation of future cash flows is based on the strategic plans adopted by Executive Management for the next three years . The carrying amount for the cash-generating unit includes goodwill with indefinite useful lives and assets with definite useful lives, such as non-current assets and working capital .
The value of depreciated assets is tested for impairment when-ever there are indications that the carrying amount might not be recoverable . In cases in which the carrying amount of an asset exceeds its estimated recoverable amount, an impairment loss is recognized on the asset down to the recoverable amount .
An impairment loss recognized earlier is reversed, if the reasons for the impairment no longer exist . The carrying amount after the reversal is limited to what it would have been prior to impairment loss . Impairment losses on goodwill are never reversed .
Emission allowances and costs for carbon dioxide emissionsSCA participates in the European system for emission allow-ances and receives a permit for each facility in which operations requiring a permit are conducted, to emit a specific volume of carbon dioxide during a calendar year . Emission allowances relating to carbon dioxide emissions are recognized as an intangible asset and as deferred income (liability) when they are received . Allowances are received free of charge and measured and recognized at market value as of the date to which the allo-cation pertains . During the period, the initial liability for emission allowances received is dissolved over the income statement as income in pace with actual carbon dioxide emissions . If the emission allowances received do not cover actual emissions, SCA makes a provision for the deficit valued at the market value on the balance sheet date . Sales of surplus emission allowances are recognized as income on the delivery date .
If the market price of emission allowances on the balance sheet date is less than recognized cost, any surplus emission allowances that are not required to cover emissions made are impaired to the market price . In conjunction with this, the remaining part of the deferred income is recognized as income by a corresponding amount and therefore no net effect occurs in the income statement . The emission allowances are used as payment in the settlement with the Swedish state regarding liabilities for actual emissions .
D. OPERATING ASSETS AND LIABILITIES
FINANCIAL STATEMENTS AND NOTES / GROUPS
CA
AN
NU
AL
RE
PO
RT
20
18
Introduction Strategy & operations Board of Directors’ Report Financial statements Sustainability facts Other
91

Intangible assets SEKm
GoodwillOther intangi-
ble assets
2018 2017 2018 2017
Accumulated costs 46 46 362 340
Accumulated amortization - - –228 –225
Accumulated impairment –43 –43 –33 –33
Total 3 3 101 82
Value, January 1 3 19,257 82 7,665
Investments - - 36 19
Company acquisitions - –2 - 2
Reclassifications - - - 1
Amortization - - –17 –16
Discontinued operations - –19,252 - –7,589
Value, December 31 3 3 101 82
TD1:1 Emission allowances, net value - - 24 9
BS Value, December 31 including emission allowances 3 3 125 91
Impairment testingAnnual testing for impairment of goodwill is carried out in the fourth quarter . Impairment testing for 2018 did not indicate any impairment requirement . Sensitivity analyses show that reason-able changes to key parameters do not give rise to any impair-ment requirement .
In addition to annual impairment testing of the cash-generating units, individual assets are tested to determine whether any impairment is needed . The discount rate before tax used in the impairment testing of goodwill is 5 .73% (5 .30) . No impairment was carried out during the year .
TD1:1 Emission allowances
SEKm 2018 2017
Accumulated costs 24 10
Accumulated revaluation of surplus - –1
Total 24 9
Value, January 1 9 85
Emission allowances received 41 33
Sales –19 –27
Settlement with the government –7 –7
Revaluation of surplus - –1
Discontinued operations - –74
Value, December 31 24 9
D2. PROPERTY, PLANT AND EQUIPMENT
AP ACCOUNTING PRINCIPLES
Property, plant and equipmentProperty, plant and equipment is recognized at cost less accu-mulated depreciation and any impairment . In cases where an investment in foreign currency has been recognized using hedge accounting, the gain/loss from the hedge is recognized as part of the acquisition cost . The cost of properties and production facilities included in major projects includes costs for running-in and start-up . The sale of products of sufficient quality from the running-in period is recognized as net sales . Borrowing costs are included in the cost of investments exceeding SEK 250m that take more than 12 months to complete . Expenditure for repairs and maintenance is expensed directly in the income statement .
Forest landSCA’s forest land is valued at historical cost and is not subject to depreciation . The cost of forest roads is recognized as land improvements .
Depreciation and impairmentLand is not subject to depreciation . Buildings, land improve-ments, machinery and equipment are depreciated on a straight-line basis over the useful lives of the assets . If, at accounting year-end, there is an indication that property, plant and equip-ment has declined in value, impairment testing is carried out .
Assessed useful lives
Number of years
Pulp and paper mills, sawmills 10–25
Other machinery 7–18
Tools 3–10
Vehicles 4–5
Buildings 15–50
Energy plants 15–30
Computers 3–5
Office equipment 5–10
Harbors and railways 20–30
Land improvements 10–20
FINANCIAL STATEMENTS AND NOTES / GROUPS
CA
AN
NU
AL
RE
PO
RT
20
18
92

Carrying amounts
SEKm
BuildingsLand and land
improvements1) 2)Machinery and
equipment3)Construction in progress3)4)
Total property, plant and equipment
2018 2017 2018 2017 2018 2017 2018 2017 2018 2017
Accumulated costs 6,010 4,918 4,284 4,028 30,539 25,749 572 5,506 41,405 40,201
Accumulated depreciation –2,778 –2,730 –1,715 –1,625 –16,932 –17,370 - - –21,425 –21,725
Accumulated impairment –147 –148 –4 –4 –1,109 –1,210 –7 –10 –1,267 –1,372
Total 3,085 2,040 2,565 2,399 12,498 7,169 565 5,496 18,713 17,104
Value, January 1 2,040 13,770 2,399 5,627 7,169 35,724 5,496 7,063 17,104 62,184
Investments 46 27 232 108 317 254 2,289 3,155 2,884 3,544
Sales and disposals –4 1 –2 –1 –15 –6 - - –21 –6
Company divestments - - - - - - –5 - –5 -
Reclassifications 1,132 175 53 107 6,000 576 –7,185 –859 - –1
Depreciation –137 –117 –118 –117 –978 –879 - - –1,233 –1,113
Impairments5) - 4 - - - - - –7 - –3
Translation differences 8 5 1 - 5 2 –30 –15 –16 –8
Discontinued operations - –11,825 - –3,325 - –28,502 - –3,841 - –47,493
BS Value, December 31 3,085 2,040 2,565 2,399 12,498 7,169 565 5,496 18,713 17,104
1) Land and land improvements includes forest land and forest roads valued at SEK 1,692m (1,664) . 2) For land improvements linked to forest land, investments amounted to SEK 103m (98) and depreciation to SEK 77m (73) .3) During the period, interest was capitalized in machinery and equipment in an amount of SEK 28m (0) and in construction in progress in an amount of SEK 0m (22) .
The average interest rate used was 1% (1) . 4) Of the outgoing value of construction in progress, SEK 0m (5,079) pertains to the pulp mill in Östrand .5) Reversal of impairment of buildings from previous years amounting to SEK 0m (4) is recognized in the income statement as an item affecting comparability, refer to
Note B5 .
D3. BIOLOGICAL ASSETS
AP ACCOUNTING PRINCIPLESThe Group’s standing timber is defined and recognized as bio-logical assets at fair value in accordance with IAS 41 Agricul-ture . Forest assets are divided up and recognized as biological assets and land assets in accordance with IAS 16 Property, plant and equipment . Forest land and forest roads are classi-fied as land and land improvements . The biological assets are measured and recognized at fair value . The fair value of the Group’s standing timber is calculated as the present value of anticipated future cash flows from the assets before tax . The calculation is based on existing, sustainable felling plans and assessments regarding growth, timber prices, felling costs and silviculture costs, that is, using input data that is not observable in the market . Environmental restrictions and other limitations are taken into account and the calculation is performed for a production cycle that SCA estimates at an average of 100 years . The change in value is recognized in the income statement under Change in value in biological assets . KAA KEY ASSESSMENTS AND ASSUMPTIONS Since a market price or other comparable value does not exist for assets of the scope owned by SCA, biological assets are measured at the present value of anticipated future cash flows . Key assessments and assumptions pertain to discount rates, future timber prices, felling costs and felling volumes . As of 2014, expected future felling volume and growth are based on the forest survey conducted between 2012 and 2013 . A new forest survey is performed every eight years . The calculation of future income and expenses is based on the trends of these items over the most recent five-year period . The discount rate used was 5 .90% (5 .25) .
TD3:1 describes the sensitivity of the carrying amount with respect to key assumptions .
Biological assets
SEKm 2018 2017
Value, January 1 31,386 30,770
Purchases and forest swaps 45 70
Sales –46 –71
Other changes in fair value 1,708 1,479
Change due to felling –1,028 –862
BS Value, December 31 32,065 31,386
Deferred tax related to standing forest 6,605 6,905
The change in fair value and change due to felling are recog-nized as a net value in the income statement under the heading Change in value in biological assets . The change totaled SEK 679m (617) . The unrealized change in value recognized during the year for assets held on the reporting date is estimated at SEK 1,708m (1,479) .
For the year’s valuation of standing timber, the same valuation model was used as in the past . For the 2018 valuation, a change was made to the discount rate, which amounted to 5 .90% .
Assessed income and expenses are adjusted upward by an annual inflation rate of 2% . Assumptions regarding future price and cost levels have, as in the valuation in 2017, been based on the outcome for the five preceding years . The 2018 valuation used an average wood price of SEK 449 (432) per solid cubic meter under bark (m³sub) . Annual harvesting is expected to rise over the calculated future production cycle and amount to 4 .3 million m³sub for 2018, ending at 5 .9 million m³sub by 2114 .
On average, 85% of felling comprises final harvesting and 15% thinning . 56% is expected to comprise sawlogs and 44% pulp-wood .
SCA’s forest holdings comprise approximately 2 .6 million hectares of forest land primarily in northern Sweden, of which approximately 2 .0 million is productive forest land . The forest portfolio’s timber volume amounts to 235 million m³fo . Growth amounts to approximately 9 .5 million m³fo per year, gross, on
FINANCIAL STATEMENTS AND NOTES / GROUPS
CA
AN
NU
AL
RE
PO
RT
20
18
Introduction Strategy & operations Board of Directors’ Report Financial statements Sustainability facts Other
93
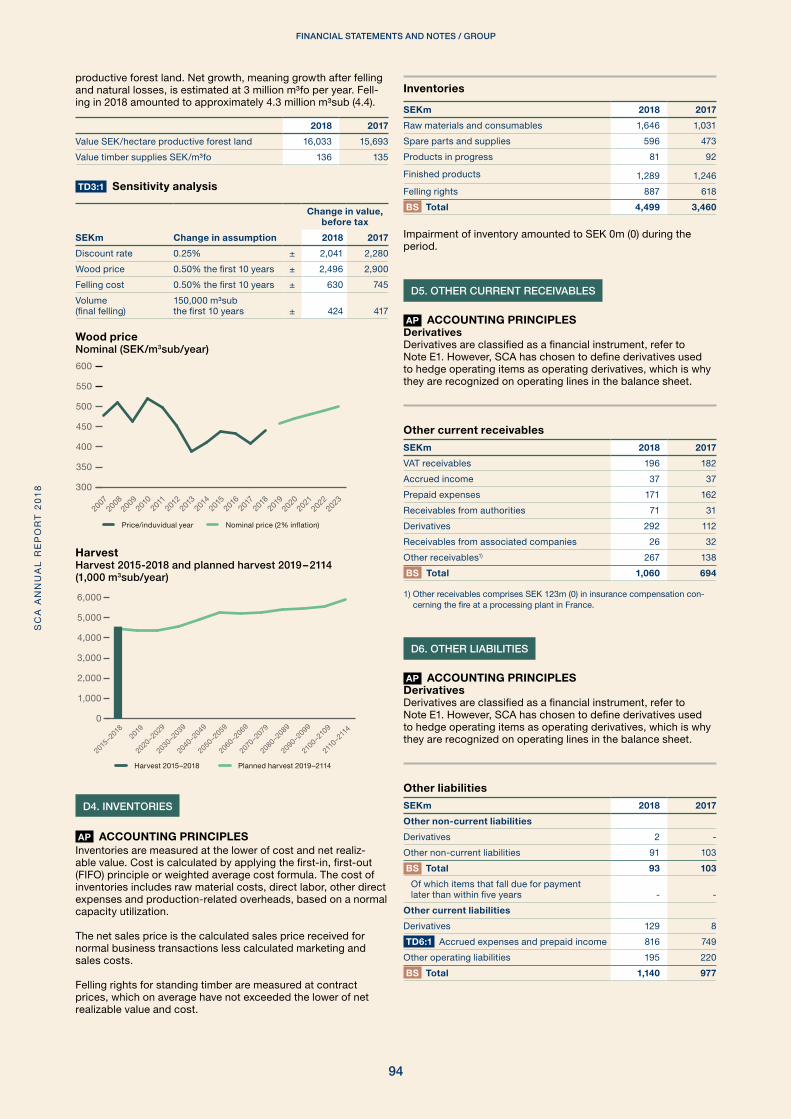
productive forest land . Net growth, meaning growth after felling and natural losses, is estimated at 3 million m³fo per year . Fell-ing in 2018 amounted to approximately 4 .3 million m³sub (4 .4) .
2018 2017
Value SEK/hectare productive forest land 16,033 15,693
Value timber supplies SEK/m³fo 136 135
TD3:1 Sensitivity analysis
SEKm Change in assumption
Change in value, before tax
2018 2017
Discount rate 0 .25% ± 2,041 2,280
Wood price 0 .50% the first 10 years ± 2,496 2,900
Felling cost 0 .50% the first 10 years ± 630 745
Volume (final felling)
150,000 m³sub the first 10 years ± 424 417
Wood priceNominal (SEK/m3sub/year)
300
350
400
450
500
550
600
Nominal price (2 % inflation)Price/induvidual year
2007
2008
2009
2010
2011
2012
2013
2014
2015
2016
2017
2018
2019
2020
2021
2022
2023
HarvestHarvest 2015-2018 and planned harvest 2019 – 2114 (1,000 m3sub/year)
0
1,000
2,000
3,000
4,000
5,000
6,000
2015
–201
820
19
2020
–202
9
2030
–203
9
2040
–204
9
2050
–205
9
2060
–2069
2070
–207
9
2080
–208
9
2090–2
099
2100–2
109
2110
–2114
Planned harvest 2019–2114 Harvest 2015–2018
D4. INVENTORIES
AP ACCOUNTING PRINCIPLESInventories are measured at the lower of cost and net realiz-able value . Cost is calculated by applying the first-in, first-out (FIFO) principle or weighted average cost formula . The cost of inventories includes raw material costs, direct labor, other direct expenses and production-related overheads, based on a normal capacity utilization .
The net sales price is the calculated sales price received for normal business transactions less calculated marketing and sales costs .
Felling rights for standing timber are measured at contract prices, which on average have not exceeded the lower of net realizable value and cost .
Inventories
SEKm 2018 2017
Raw materials and consumables 1,646 1,031
Spare parts and supplies 596 473
Products in progress 81 92
Finished products 1,289 1,246
Felling rights 887 618
BS Total 4,499 3,460
Impairment of inventory amounted to SEK 0m (0) during the period .
D5. OTHER CURRENT RECEIVABLES
AP ACCOUNTING PRINCIPLESDerivativesDerivatives are classified as a financial instrument, refer to Note E1 . However, SCA has chosen to define derivatives used to hedge operating items as operating derivatives, which is why they are recognized on operating lines in the balance sheet .
Other current receivables
SEKm 2018 2017
VAT receivables 196 182
Accrued income 37 37
Prepaid expenses 171 162
Receivables from authorities 71 31
Derivatives 292 112
Receivables from associated companies 26 32
Other receivables1) 267 138
BS Total 1,060 694
1) Other receivables comprises SEK 123m (0) in insurance compensation con-cerning the fire at a processing plant in France .
D6. OTHER LIABILITIES
AP ACCOUNTING PRINCIPLESDerivativesDerivatives are classified as a financial instrument, refer to Note E1 . However, SCA has chosen to define derivatives used to hedge operating items as operating derivatives, which is why they are recognized on operating lines in the balance sheet .
Other liabilities
SEKm 2018 2017
Other non-current liabilities
Derivatives 2 -
Other non-current liabilities 91 103
BS Total 93 103
Of which items that fall due for payment later than within five years - -
Other current liabilities
Derivatives 129 8
TD6:1 Accrued expenses and prepaid income 816 749
Other operating liabilities 195 220
BS Total 1,140 977
FINANCIAL STATEMENTS AND NOTES / GROUPS
CA
AN
NU
AL
RE
PO
RT
20
18
94
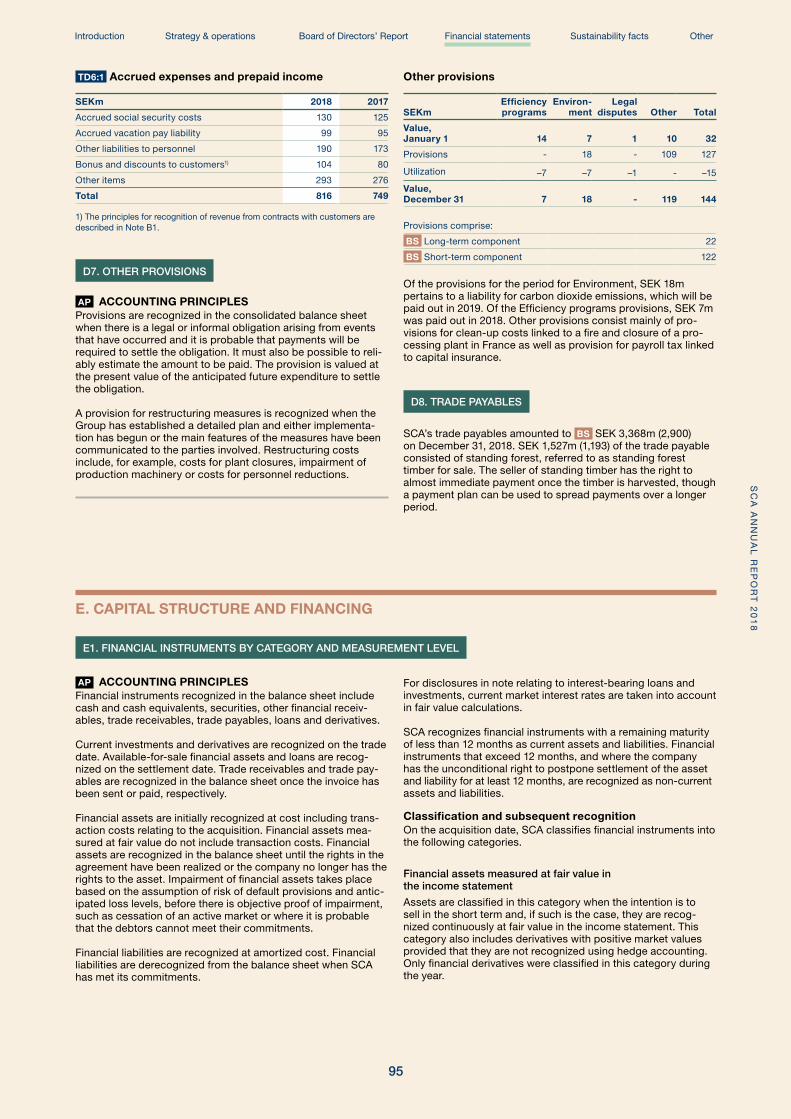
TD6:1 Accrued expenses and prepaid income
SEKm 2018 2017
Accrued social security costs 130 125
Accrued vacation pay liability 99 95
Other liabilities to personnel 190 173
Bonus and discounts to customers1) 104 80
Other items 293 276
Total 816 749
1) The principles for recognition of revenue from contracts with customers are described in Note B1 .
D7. OTHER PROVISIONS
AP ACCOUNTING PRINCIPLESProvisions are recognized in the consolidated balance sheet when there is a legal or informal obligation arising from events that have occurred and it is probable that payments will be required to settle the obligation . It must also be possible to reli-ably estimate the amount to be paid . The provision is valued at the present value of the anticipated future expenditure to settle the obligation .
A provision for restructuring measures is recognized when the Group has established a detailed plan and either implementa-tion has begun or the main features of the measures have been communicated to the parties involved . Restructuring costs include, for example, costs for plant closures, impairment of production machinery or costs for personnel reductions .
Other provisions
SEKmEfficiency programs
Environ-ment
Legal disputes Other Total
Value, January 1 14 7 1 10 32
Provisions - 18 - 109 127
Utilization –7 –7 –1 - –15
Value, December 31 7 18 - 119 144
Provisions comprise:
BS Long-term component 22
BS Short-term component 122
Of the provisions for the period for Environment, SEK 18m pertains to a liability for carbon dioxide emissions, which will be paid out in 2019 . Of the Efficiency programs provisions, SEK 7m was paid out in 2018 . Other provisions consist mainly of pro-visions for clean-up costs linked to a fire and closure of a pro-cessing plant in France as well as provision for payroll tax linked to capital insurance .
D8. TRADE PAYABLES
SCA’s trade payables amounted to BS SEK 3,368m (2,900) on December 31, 2018 . SEK 1,527m (1,193) of the trade payable consisted of standing forest, referred to as standing forest timber for sale . The seller of standing timber has the right to almost immediate payment once the timber is harvested, though a payment plan can be used to spread payments over a longer period .
E1. FINANCIAL INSTRUMENTS BY CATEGORY AND MEASUREMENT LEVEL
AP ACCOUNTING PRINCIPLESFinancial instruments recognized in the balance sheet include cash and cash equivalents, securities, other financial receiv-ables, trade receivables, trade payables, loans and derivatives . Current investments and derivatives are recognized on the trade date . Available-for-sale financial assets and loans are recog-nized on the settlement date . Trade receivables and trade pay-ables are recognized in the balance sheet once the invoice has been sent or paid, respectively . Financial assets are initially recognized at cost including trans-action costs relating to the acquisition . Financial assets mea-sured at fair value do not include transaction costs . Financial assets are recognized in the balance sheet until the rights in the agreement have been realized or the company no longer has the rights to the asset . Impairment of financial assets takes place based on the assumption of risk of default provisions and antic-ipated loss levels, before there is objective proof of impairment, such as cessation of an active market or where it is probable that the debtors cannot meet their commitments .
Financial liabilities are recognized at amortized cost . Financial liabilities are derecognized from the balance sheet when SCA has met its commitments .
For disclosures in note relating to interest-bearing loans and investments, current market interest rates are taken into account in fair value calculations .
SCA recognizes financial instruments with a remaining maturity of less than 12 months as current assets and liabilities . Financial instruments that exceed 12 months, and where the company has the unconditional right to postpone settlement of the asset and liability for at least 12 months, are recognized as non-current assets and liabilities . Classification and subsequent recognition On the acquisition date, SCA classifies financial instruments into the following categories .
Financial assets measured at fair value in the income statement
Assets are classified in this category when the intention is to sell in the short term and, if such is the case, they are recog-nized continuously at fair value in the income statement . This category also includes derivatives with positive market values provided that they are not recognized using hedge accounting . Only financial derivatives were classified in this category during the year .
E. CAPITAL STRUCTURE AND FINANCING
FINANCIAL STATEMENTS AND NOTES / GROUPS
CA
AN
NU
AL
RE
PO
RT
20
18
Introduction Strategy & operations Board of Directors’ Report Financial statements Sustainability facts Other
95
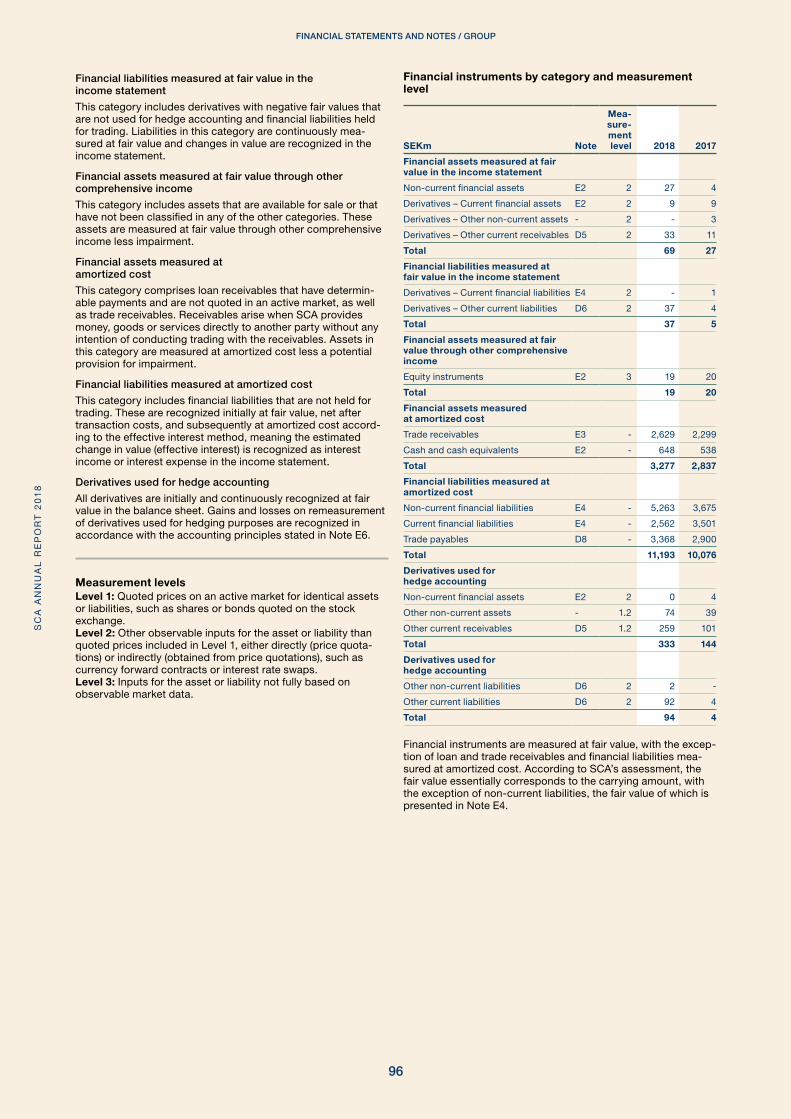
Financial liabilities measured at fair value in the income statement
This category includes derivatives with negative fair values that are not used for hedge accounting and financial liabilities held for trading . Liabilities in this category are continuously mea-sured at fair value and changes in value are recognized in the income statement .
Financial assets measured at fair value through other comprehensive income
This category includes assets that are available for sale or that have not been classified in any of the other categories . These assets are measured at fair value through other comprehensive income less impairment .
Financial assets measured at amortized cost
This category comprises loan receivables that have determin-able payments and are not quoted in an active market, as well as trade receivables . Receivables arise when SCA provides money, goods or services directly to another party without any intention of conducting trading with the receivables . Assets in this category are measured at amortized cost less a potential provision for impairment .
Financial liabilities measured at amortized cost
This category includes financial liabilities that are not held for trading . These are recognized initially at fair value, net after transaction costs, and subsequently at amortized cost accord-ing to the effective interest method, meaning the estimated change in value (effective interest) is recognized as interest income or interest expense in the income statement .
Derivatives used for hedge accounting
All derivatives are initially and continuously recognized at fair value in the balance sheet . Gains and losses on remeasurement of derivatives used for hedging purposes are recognized in accordance with the accounting principles stated in Note E6 .
Measurement levelsLevel 1: Quoted prices on an active market for identical assets or liabilities, such as shares or bonds quoted on the stock exchange .Level 2: Other observable inputs for the asset or liability than quoted prices included in Level 1, either directly (price quota-tions) or indirectly (obtained from price quotations), such as currency forward contracts or interest rate swaps .Level 3: Inputs for the asset or liability not fully based on observable market data .
Financial instruments by category and measurement level
SEKm Note
Mea-sure-ment level 2018 2017
Financial assets measured at fair value in the income statement
Non-current financial assets E2 2 27 4
Derivatives – Current financial assets E2 2 9 9
Derivatives – Other non-current assets - 2 - 3
Derivatives – Other current receivables D5 2 33 11
Total 69 27
Financial liabilities measured at fair value in the income statement
Derivatives – Current financial liabilities E4 2 - 1
Derivatives – Other current liabilities D6 2 37 4
Total 37 5
Financial assets measured at fair value through other comprehensive income
Equity instruments E2 3 19 20
Total 19 20
Financial assets measured at amortized cost
Trade receivables E3 - 2,629 2,299
Cash and cash equivalents E2 - 648 538
Total 3,277 2,837
Financial liabilities measured at amortized cost
Non-current financial liabilities E4 - 5,263 3,675
Current financial liabilities E4 - 2,562 3,501
Trade payables D8 - 3,368 2,900
Total 11,193 10,076
Derivatives used for hedge accounting
Non-current financial assets E2 2 0 4
Other non-current assets - 1 .2 74 39
Other current receivables D5 1 .2 259 101
Total 333 144
Derivatives used for hedge accounting
Other non-current liabilities D6 2 2 -
Other current liabilities D6 2 92 4
Total 94 4
Financial instruments are measured at fair value, with the excep-tion of loan and trade receivables and financial liabilities mea-sured at amortized cost . According to SCA’s assessment, the fair value essentially corresponds to the carrying amount, with the exception of non-current liabilities, the fair value of which is presented in Note E4 .
FINANCIAL STATEMENTS AND NOTES / GROUPS
CA
AN
NU
AL
RE
PO
RT
20
18
96
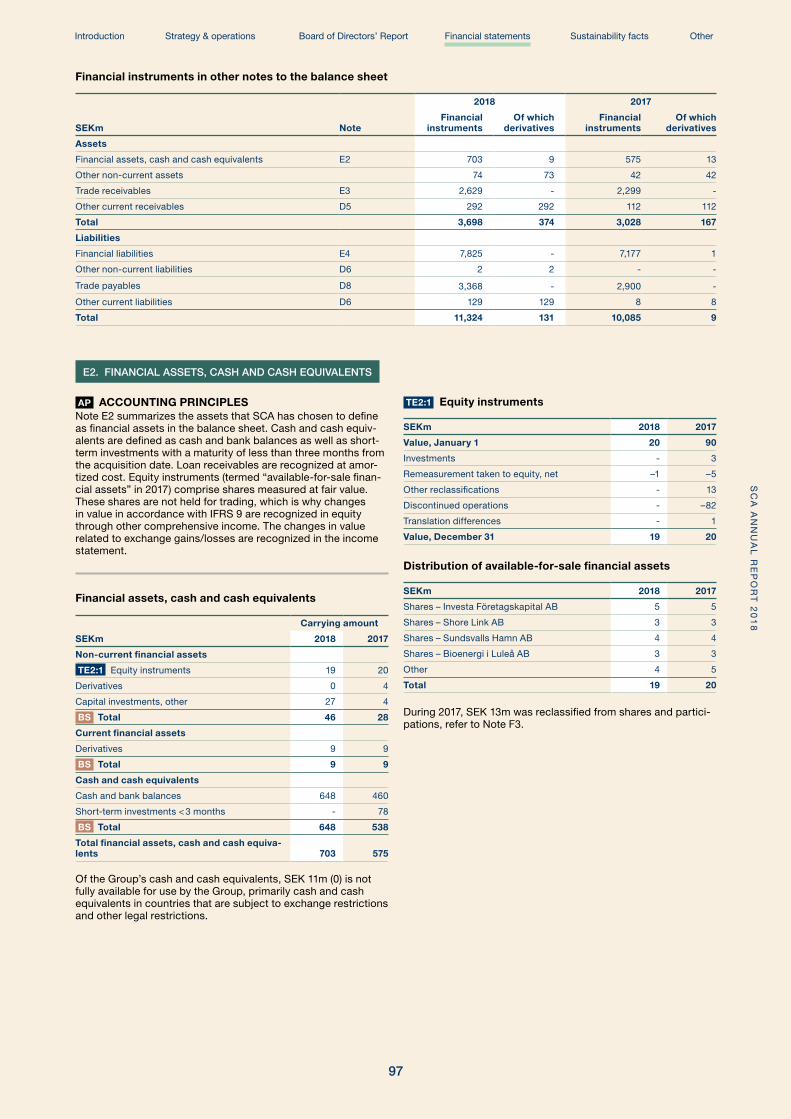
Financial instruments in other notes to the balance sheet
SEKm Note
2018 2017
Financial instruments
Of which derivatives
Financial instruments
Of which derivatives
Assets
Financial assets, cash and cash equivalents E2 703 9 575 13
Other non-current assets 74 73 42 42
Trade receivables E3 2,629 - 2,299 -
Other current receivables D5 292 292 112 112
Total 3,698 374 3,028 167
Liabilities
Financial liabilities E4 7,825 - 7,177 1
Other non-current liabilities D6 2 2 - -
Trade payables D8 3,368 - 2,900 -
Other current liabilities D6 129 129 8 8
Total 11,324 131 10,085 9
E2. FINANCIAL ASSETS, CASH AND CASH EQUIVALENTS
AP ACCOUNTING PRINCIPLESNote E2 summarizes the assets that SCA has chosen to define as financial assets in the balance sheet . Cash and cash equiv-alents are defined as cash and bank balances as well as short-term investments with a maturity of less than three months from the acquisition date . Loan receivables are recognized at amor-tized cost . Equity instruments (termed “available-for-sale finan-cial assets” in 2017) comprise shares measured at fair value . These shares are not held for trading, which is why changes in value in accordance with IFRS 9 are recognized in equity through other comprehensive income . The changes in value related to exchange gains/losses are recognized in the income statement .
Financial assets, cash and cash equivalents
SEKm
Carrying amount
2018 2017
Non-current financial assets
TE2:1 Equity instruments 19 20
Derivatives 0 4
Capital investments, other 27 4
BS Total 46 28
Current financial assets
Derivatives 9 9
BS Total 9 9
Cash and cash equivalents
Cash and bank balances 648 460
Short-term investments < 3 months - 78
BS Total 648 538
Total financial assets, cash and cash equiva-lents 703 575
Of the Group’s cash and cash equivalents, SEK 11m (0) is not fully available for use by the Group, primarily cash and cash equivalents in countries that are subject to exchange restrictions and other legal restrictions .
TE2:1 Equity instruments
SEKm 2018 2017
Value, January 1 20 90
Investments - 3
Remeasurement taken to equity, net –1 –5
Other reclassifications - 13
Discontinued operations - –82
Translation differences - 1
Value, December 31 19 20
Distribution of available-for-sale financial assets
SEKm 2018 2017
Shares – Investa Företagskapital AB 5 5
Shares – Shore Link AB 3 3
Shares – Sundsvalls Hamn AB 4 4
Shares – Bioenergi i Luleå AB 3 3
Other 4 5
Total 19 20
During 2017, SEK 13m was reclassified from shares and partici-pations, refer to Note F3 .
FINANCIAL STATEMENTS AND NOTES / GROUPS
CA
AN
NU
AL
RE
PO
RT
20
18
Introduction Strategy & operations Board of Directors’ Report Financial statements Sustainability facts Other
97
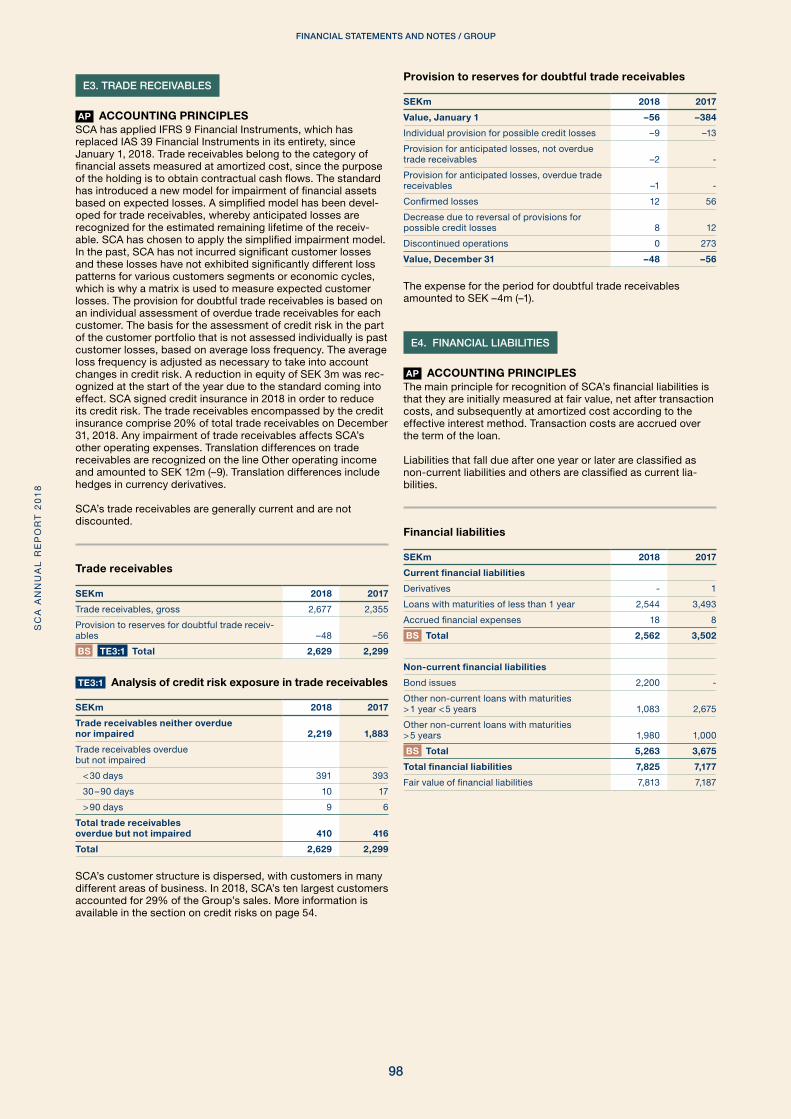
E3. TRADE RECEIVABLES
AP ACCOUNTING PRINCIPLESSCA has applied IFRS 9 Financial Instruments, which has replaced IAS 39 Financial Instruments in its entirety, since January 1, 2018 . Trade receivables belong to the category of financial assets measured at amortized cost, since the purpose of the holding is to obtain contractual cash flows . The standard has introduced a new model for impairment of financial assets based on expected losses . A simplified model has been devel-oped for trade receivables, whereby anticipated losses are recognized for the estimated remaining lifetime of the receiv-able . SCA has chosen to apply the simplified impairment model . In the past, SCA has not incurred significant customer losses and these losses have not exhibited significantly different loss patterns for various customers segments or economic cycles, which is why a matrix is used to measure expected customer losses . The provision for doubtful trade receivables is based on an individual assessment of overdue trade receivables for each customer . The basis for the assessment of credit risk in the part of the customer portfolio that is not assessed individually is past customer losses, based on average loss frequency . The average loss frequency is adjusted as necessary to take into account changes in credit risk . A reduction in equity of SEK 3m was rec-ognized at the start of the year due to the standard coming into effect . SCA signed credit insurance in 2018 in order to reduce its credit risk . The trade receivables encompassed by the credit insurance comprise 20% of total trade receivables on December 31, 2018 . Any impairment of trade receivables affects SCA’s other operating expenses . Translation differences on trade receivables are recognized on the line Other operating income and amounted to SEK 12m (–9) . Translation differences include hedges in currency derivatives .
SCA’s trade receivables are generally current and are not discounted .
Trade receivables
SEKm 2018 2017
Trade receivables, gross 2,677 2,355
Provision to reserves for doubtful trade receiv-ables –48 –56
BS TE3:1 Total 2,629 2,299
TE3:1 Analysis of credit risk exposure in trade receivables
SEKm 2018 2017
Trade receivables neither overdue nor impaired 2,219 1,883
Trade receivables overdue but not impaired
< 30 days 391 393
30 – 90 days 10 17
> 90 days 9 6
Total trade receivables overdue but not impaired 410 416
Total 2,629 2,299
SCA’s customer structure is dispersed, with customers in many different areas of business . In 2018, SCA’s ten largest customers accounted for 29% of the Group’s sales . More information is available in the section on credit risks on page 54 .
Provision to reserves for doubtful trade receivables
SEKm 2018 2017
Value, January 1 –56 –384
Individual provision for possible credit losses –9 –13
Provision for anticipated losses, not overdue trade receivables –2 -
Provision for anticipated losses, overdue trade receivables –1 -
Confirmed losses 12 56
Decrease due to reversal of provisions for possible credit losses 8 12
Discontinued operations 0 273
Value, December 31 –48 –56
The expense for the period for doubtful trade receivables amounted to SEK –4m (–1) .
E4. FINANCIAL LIABILITIES
AP ACCOUNTING PRINCIPLESThe main principle for recognition of SCA’s financial liabilities is that they are initially measured at fair value, net after transaction costs, and subsequently at amortized cost according to the effective interest method . Transaction costs are accrued over the term of the loan .
Liabilities that fall due after one year or later are classified as non-current liabilities and others are classified as current lia-bilities .
Financial liabilities
SEKm 2018 2017
Current financial liabilities
Derivatives - 1
Loans with maturities of less than 1 year 2,544 3,493
Accrued financial expenses 18 8
BS Total 2,562 3,502
Non-current financial liabilities
Bond issues 2,200 -
Other non-current loans with maturities > 1 year < 5 years 1,083 2,675
Other non-current loans with maturities > 5 years 1,980 1,000
BS Total 5,263 3,675
Total financial liabilities 7,825 7,177
Fair value of financial liabilities 7,813 7,187
FINANCIAL STATEMENTS AND NOTES / GROUPS
CA
AN
NU
AL
RE
PO
RT
20
18
98
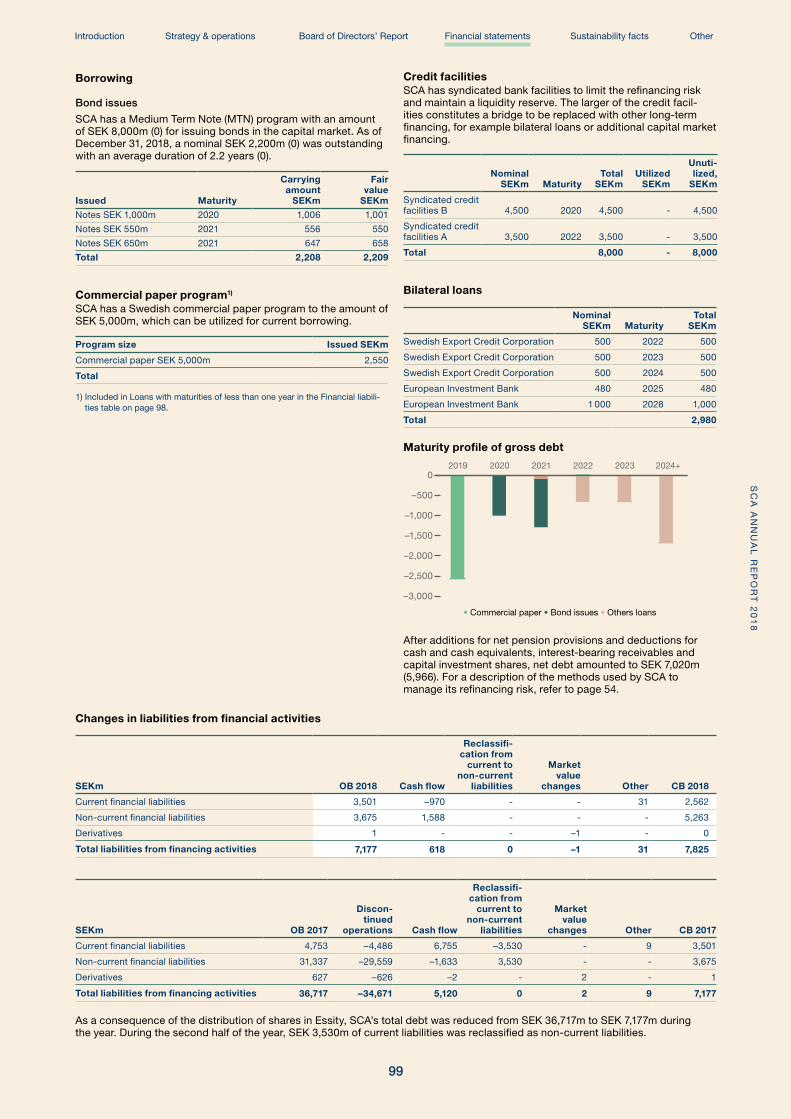
Borrowing
Bond issues
SCA has a Medium Term Note (MTN) program with an amount of SEK 8,000m (0) for issuing bonds in the capital market . As of December 31, 2018, a nominal SEK 2,200m (0) was outstanding with an average duration of 2 .2 years (0) .
Issued Maturity
Carrying amount
SEKm
Fair value
SEKm
Notes SEK 1,000m 2020 1,006 1,001
Notes SEK 550m 2021 556 550
Notes SEK 650m 2021 647 658
Total 2,208 2,209
Commercial paper program1)
SCA has a Swedish commercial paper program to the amount of SEK 5,000m, which can be utilized for current borrowing .
Program size Issued SEKm
Commercial paper SEK 5,000m 2,550
Total
1) Included in Loans with maturities of less than one year in the Financial liabili-ties table on page 98 .
Credit facilitiesSCA has syndicated bank facilities to limit the refinancing risk and maintain a liquidity reserve . The larger of the credit facil-ities constitutes a bridge to be replaced with other long-term financing, for example bilateral loans or additional capital market financing .
Nominal SEKm Maturity
Total SEKm
Utilized SEKm
Unuti-lized,
SEKm
Syndicated credit facilities B 4,500 2020 4,500 - 4,500
Syndicated credit facilities A 3,500 2022 3,500 - 3,500
Total 8,000 - 8,000
Bilateral loans
Nominal SEKm Maturity
Total SEKm
Swedish Export Credit Corporation 500 2022 500
Swedish Export Credit Corporation 500 2023 500
Swedish Export Credit Corporation 500 2024 500
European Investment Bank 480 2025 480
European Investment Bank 1 000 2028 1,000
Total 2,980
Maturity profile of gross debt
–3,000
–2,500
–2,000
–1,500
–1,000
–500
02019 20222020 2021 2023 2024+
• Commercial paper • Bond issues • Others loans
After additions for net pension provisions and deductions for cash and cash equivalents, interest-bearing receivables and capital investment shares, net debt amounted to SEK 7,020m (5,966) . For a description of the methods used by SCA to manage its refinancing risk, refer to page 54 .
Changes in liabilities from financial activities
SEKm OB 2018 Cash flow
Reclassifi-cation from
current to non-current
liabilities
Market value
changes Other CB 2018
Current financial liabilities 3,501 –970 - - 31 2,562
Non-current financial liabilities 3,675 1,588 - - - 5,263
Derivatives 1 - - –1 - 0
Total liabilities from financing activities 7,177 618 0 –1 31 7,825
SEKm OB 2017
Discon- tinued
operations Cash flow
Reclassifi-cation from
current to non-current
liabilities
Market value
changes Other CB 2017
Current financial liabilities 4,753 –4,486 6,755 –3,530 - 9 3,501
Non-current financial liabilities 31,337 –29,559 –1,633 3,530 - - 3,675
Derivatives 627 –626 –2 - 2 - 1
Total liabilities from financing activities 36,717 –34,671 5,120 0 2 9 7,177
As a consequence of the distribution of shares in Essity, SCA’s total debt was reduced from SEK 36,717m to SEK 7,177m duringthe year . During the second half of the year, SEK 3,530m of current liabilities was reclassified as non-current liabilities .
FINANCIAL STATEMENTS AND NOTES / GROUPS
CA
AN
NU
AL
RE
PO
RT
20
18
Introduction Strategy & operations Board of Directors’ Report Financial statements Sustainability facts Other
99
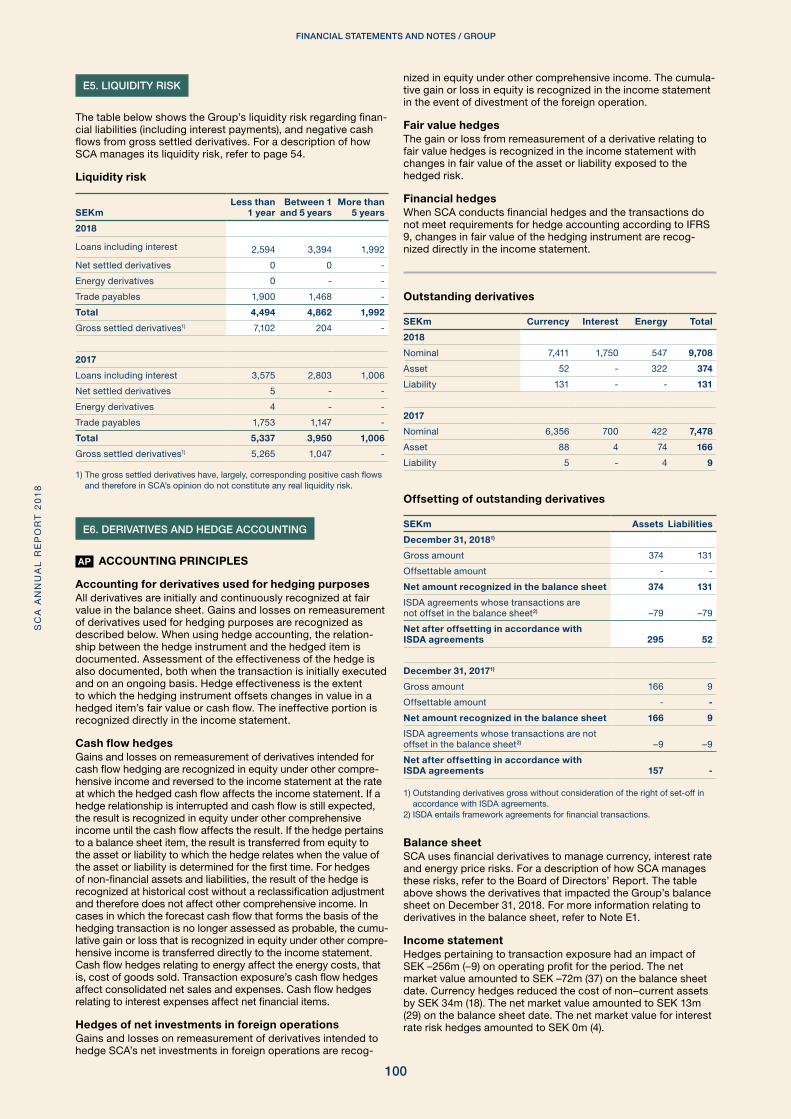
E5. LIQUIDITY RISK
The table below shows the Group’s liquidity risk regarding finan-cial liabilities (including interest payments), and negative cash flows from gross settled derivatives . For a description of how SCA manages its liquidity risk, refer to page 54 .
Liquidity risk
SEKmLess than
1 yearBetween 1
and 5 yearsMore than
5 years
2018
Loans including interest 2,594 3,394 1,992
Net settled derivatives 0 0 -
Energy derivatives 0 - -
Trade payables 1,900 1,468 -
Total 4,494 4,862 1,992
Gross settled derivatives1) 7,102 204 -
2017
Loans including interest 3,575 2,803 1,006
Net settled derivatives 5 - -
Energy derivatives 4 - -
Trade payables 1,753 1,147 -
Total 5,337 3,950 1,006
Gross settled derivatives1) 5,265 1,047 -
1) The gross settled derivatives have, largely, corresponding positive cash flows and therefore in SCA’s opinion do not constitute any real liquidity risk .
E6. DERIVATIVES AND HEDGE ACCOUNTING
AP ACCOUNTING PRINCIPLES
Accounting for derivatives used for hedging purposes All derivatives are initially and continuously recognized at fair value in the balance sheet . Gains and losses on remeasurement of derivatives used for hedging purposes are recognized as described below . When using hedge accounting, the relation-ship between the hedge instrument and the hedged item is documented . Assessment of the effectiveness of the hedge is also documented, both when the transaction is initially executed and on an ongoing basis . Hedge effectiveness is the extent to which the hedging instrument offsets changes in value in a hedged item’s fair value or cash flow . The ineffective portion is recognized directly in the income statement .
Cash flow hedgesGains and losses on remeasurement of derivatives intended for cash flow hedging are recognized in equity under other compre-hensive income and reversed to the income statement at the rate at which the hedged cash flow affects the income statement . If a hedge relationship is interrupted and cash flow is still expected, the result is recognized in equity under other comprehensive income until the cash flow affects the result . If the hedge pertains to a balance sheet item, the result is transferred from equity to the asset or liability to which the hedge relates when the value of the asset or liability is determined for the first time . For hedges of non-financial assets and liabilities, the result of the hedge is recognized at historical cost without a reclassification adjustment and therefore does not affect other comprehensive income . In cases in which the forecast cash flow that forms the basis of the hedging transaction is no longer assessed as probable, the cumu-lative gain or loss that is recognized in equity under other compre-hensive income is transferred directly to the income statement . Cash flow hedges relating to energy affect the energy costs, that is, cost of goods sold . Transaction exposure’s cash flow hedges affect consolidated net sales and expenses . Cash flow hedges relating to interest expenses affect net financial items . Hedges of net investments in foreign operationsGains and losses on remeasurement of derivatives intended to hedge SCA’s net investments in foreign operations are recog-
nized in equity under other comprehensive income . The cumula-tive gain or loss in equity is recognized in the income statement in the event of divestment of the foreign operation . Fair value hedgesThe gain or loss from remeasurement of a derivative relating to fair value hedges is recognized in the income statement with changes in fair value of the asset or liability exposed to the hedged risk .
Financial hedgesWhen SCA conducts financial hedges and the transactions do not meet requirements for hedge accounting according to IFRS 9, changes in fair value of the hedging instrument are recog-nized directly in the income statement .
Outstanding derivatives
SEKm Currency Interest Energy Total
2018
Nominal 7,411 1,750 547 9,708
Asset 52 - 322 374
Liability 131 - - 131
2017
Nominal 6,356 700 422 7,478
Asset 88 4 74 166
Liability 5 - 4 9
Offsetting of outstanding derivatives
SEKm Assets Liabilities
December 31, 20181)
Gross amount 374 131
Offsettable amount - -
Net amount recognized in the balance sheet 374 131
ISDA agreements whose transactions are not offset in the balance sheet2) –79 –79
Net after offsetting in accordance with ISDA agreements 295 52
December 31, 20171)
Gross amount 166 9
Offsettable amount - -
Net amount recognized in the balance sheet 166 9
ISDA agreements whose transactions are not offset in the balance sheet2) –9 –9
Net after offsetting in accordance with ISDA agreements 157 -
1) Outstanding derivatives gross without consideration of the right of set-off in accordance with ISDA agreements .
2) ISDA entails framework agreements for financial transactions .
Balance sheetSCA uses financial derivatives to manage currency, interest rate and energy price risks . For a description of how SCA manages these risks, refer to the Board of Directors’ Report . The table above shows the derivatives that impacted the Group’s balance sheet on December 31, 2018 . For more information relating to derivatives in the balance sheet, refer to Note E1 .
Income statementHedges pertaining to transaction exposure had an impact of SEK –256m (–9) on operating profit for the period . The net market value amounted to SEK –72m (37) on the balance sheet date . Currency hedges reduced the cost of non–current assets by SEK 34m (18) . The net market value amounted to SEK 13m (29) on the balance sheet date . The net market value for interest rate risk hedges amounted to SEK 0m (4) .
FINANCIAL STATEMENTS AND NOTES / GROUPS
CA
AN
NU
AL
RE
PO
RT
20
18
100

Energy derivatives had an impact of SEK 228m (49) on operat-ing profit for the period . Energy derivatives had an outstanding market value of SEK 322m (70) at year-end . Interest rate deriva-tives impacted net interest items in an amount of SEK –1m (–2) . For further information relating to net financial items, refer to Note E7 .
Sensitivity analysisSCA has performed sensitivity analysis calculations on the finan-cial instruments’ risk at December 31, 2018 using assumptions on market movements that are regarded as reasonably possible in one year’s time . If the Swedish krona had unilaterally weak-ened/strengthened by 5% against all currencies, outstanding financial hedges, trade payables and trade receivables would have decreased/increased profit for the period before tax by
SEK 278m (137) . Financial hedges with maturities of more than one year would have increased/decreased equity by SEK 10m (46) .
If the Swedish krona had unilaterally weakened/strengthened by 5%, currency hedges relating to the cost of non-current assets would have increased/decreased equity by SEK 10m (33) .
If energy prices had increased/decreased by 20%, outstanding financial hedges relating to electricity, all other things being equal, would have decreased/increased energy costs for the period by SEK 108m (56) . In addition to the earnings impact, equity would have increased/decreased by SEK 56m (36) . However, the total energy cost for the Group would have been affected differently if the price risk related to supply contracts was taken into account .
Outstanding derivatives with hedge accounting1)
SEKm Assets Liabilities Net TaxHedge reserve
after tax
2018
Derivatives with hedge accounting in hedge reserve
Cash flow hedges:
Energy risk 298 - 298 –61 237
Currency risk 35 –94 –59 12 –47
Interest rate risk 0 - - - -
Total 333 –94 239 –49 190
2017
Derivatives with hedge accounting in hedge reserve
Cash flow hedges:
Energy risk 68 –4 64 –14 50
Currency risk 66 - 66 –15 51
Interest rate risk 4 - 4 –1 3
Total 138 –4 134 –30 104
1) Outstanding derivatives with hedge accounting are included in the table Outstanding derivatives on page 100 .
The results from fair value hedges are recognized directly in the income statement .
Hedge reserve in equityCurrency derivatives relating to hedging of transaction exposure mature mainly in 2019 and during the first quarter of 2020 . With unchanged exchange rates, profit after tax will be affected in an amount of SEK –57m (32) . Currency derivatives relating to hedg-
E7. FINANCIAL INCOME AND EXPENSES
Financial income and expenses1)
SEKm 2018 2017
Results from shares and participations in other companies
Dividend 1 1
Interest income and similar profit items
Interest income, investments 9 10
Other financial income 26 18
IS Total financial income 36 29
Interest expenses and similar loss items
Interest expenses, borrowing2) 4 –72
Interest expenses, derivatives –28 –2
Other financial expenses –41 –48
IS Total financial expenses –65 –122
Total –29 –93
1) Other financial income and expenses include an exchange difference of SEK 1m (3) .
2) Interest expenses, borrowing includes capitalized borrowing costs of SEK 28m (22) .
ing of the cost of non-current assets have a maturity spread until June 2019 . With unchanged exchange rates, the cost of non-current assets will decrease by SEK 10m (19) after tax .
The derivatives intended to hedge energy costs in the Group mature during 2019 and 2020 . With unchanged prices, the Group’s profit after tax will be affected positively in an amount of SEK 179m in 2019 and SEK 58m in 2020 .
Sensitivity analysisIf interest rate levels had been 1 percentage point higher, with unchanged fixed-interest terms and volumes in the net debt, interest expenses for the period would have been SEK 47m (47) higher . A sensitivity analysis has been performed on the risk to which SCA was exposed at December 31, 2018 using assump-tions on market movements that are regarded as reasonably in one year’s time . For a description of how SCA manages its interest rate risk, refer to page 54 .
FINANCIAL STATEMENTS AND NOTES / GROUPS
CA
AN
NU
AL
RE
PO
RT
20
18
Introduction Strategy & operations Board of Directors’ Report Financial statements Sustainability facts Other
101

E8. EQUITY
AP ACCOUNTING PRINCIPLESTransaction costs directly relating to the issue of new shares or options are recognized, net after tax, in equity as a reduction in the issue proceeds . Expenditure for the purchase of SCA’s treasury shares reduces retained earnings in equity in the
Equity totaled SEK 39,062m (36,753) at December 31, 2018 . The following tables show the distribution and profit for the period .
SEKmShare
capital
Other capital
provided Reserves1)Retained earnings
Equity attribut-
able to SCA’s
share-holders
Non-con-trolling
interestsTotal
equity
Value, January 1, 2018 2,350 6,830 –219 27,790 36,751 2 36,753
IS Profit for the period recognized in the income statement - - - 3,659 3,659 - 3,659
Other comprehensive income for the period
Items that cannot be transferred to profit for the period
Transitional effect from implementation of new accounting standard - - - –3 –3 - –3
Result from equity instruments measured at fair value - - - –1 –1 - –1
Remeasurement of defined benefit pension plans2) - - - –504 –504 - –504
Income tax attributable to components in other comprehensive income - - - 111 111 - 111
Items that have been or can be transferred to profit for the period
Cash flow hedges:
Result from remeasurement of derivatives recognized in equity - - 156 - 156 - 156
Transferred to the income statement for the period - - –16 - –16 - –16
Translation differences in foreign operations - - 19 - 19 - 19
Minority holding that after acquisition is subsidiary - - - 2 2 –2 0
Tax on items recognized directly in/transferred from equity3) - - –26 - –26 - –26
Other comprehensive income for the period, net after tax - - 133 –395 –262 –2 –264
ISC Comprehensive income for the period - - 133 3,264 3,397 –2 3,395
Cash flow hedge, transferred to cost of hedged investments - - –34 - –34 - –34
Tax on cash flow hedge, transferred to cost - - 7 - 7 - 7
Remeasurement effect upon acquisition of non-controlling interests - - - –5 –5 - –5
Dividend, SEK 1 .50 per share4) - - - –1,054 –1,054 - –1,054
BS Value, December 31, 2018 2,350 6,830 –113 29,995 39,062 – 39,062
1) Revaluation reserve, Hedge reserve, Available-for-sale assets and Translation reserve are included in the Provisions line in the balance sheet, see specification on page 104 .
2) Including payroll tax .3) For a specification of income tax attributable to components in other comprehensive income, see page 104 .4) Dividend SEK 1 .50 (6 .00) per share pertains to owners of the Parent . For the 2018 fiscal year, the Board has decided to propose a dividend of SEK 1 .75 per share to
the Annual General Meeting .
For further information regarding equity, see Parent Company Note PC11 .
Parent Company and the portion of consolidated equity that pertains to owners of the Parent . When treasury shares are sold, the sales proceeds are included in retained earnings in the equity pertaining to owners of the Parent .
FINANCIAL STATEMENTS AND NOTES / GROUPS
CA
AN
NU
AL
RE
PO
RT
20
18
102

SEKmShare
capital
Other capital
provided Reserves1)Retained earnings
Equity attribut-
able to SCA’s
share-holders
Non-con-trolling
interests
Total equity
Value, January 1, 2017 2,350 6,830 400 63,562 73,142 6,377 79,519
IS Profit for the period recognized in the income statement - - - 141,828 141,828 327 142,155
Other comprehensive income for the period
Items that cannot be transferred to profit for the period
Remeasurement of defined benefit pension plans2) - - - 1,025 1,025 - 1,025
Income tax attributable to components in other comprehensive income - - - –283 –283 - –283
Items that have been or can be transferred to profit for the period
Available-for-sale financial assets:
Result from measurement at fair value recognized in equity - - 1 - 1 - 1
Cash flow hedges:
Result from remeasurement of derivatives recognized in equity - - –100 - –100 - –100
Transferred to the income statement for the period - - –48 - –48 - –48
Transferred to cost of hedged investments - - –27 - –27 - –27
Translation differences in foreign operations - - 772 - 772 –159 613
Result from hedges of net investments in foreign operations - - –958 - –958 - –958
Other comprehensive income from associated companies - - - –1 –1 - –1
Tax on items recognized directly in/transferred from equity3) - - 260 - 260 - 260
Discontinued operations - - –420 - –420 - –420
Other comprehensive income for the period, net after tax - - –520 741 221 –159 62
ISC Comprehensive income for the period - - –520 142,569 142,049 168 142,217
Private placement to non-controlling interests - - - 499 499 462 961
Private placement to non-controlling interests, dilution - - - –287 –287 287 -
Acquisition of non-controlling interests - - - 15 15 80 95
Remeasurement effect upon acquisition of non-controlling interests - - - –5 –5 - –5
Dividend, SEK 6 .00 per share - - - –4,214 –4,214 –130 –4,344
Discontinued operations - - –99 99 - - -
Distribution of shares in Essity - - - –174,448 –174,448 –7,242 –181,690
BS Value, December 31, 2017 2,350 6,830 –219 27,790 36,751 2 36,753
1) Revaluation reserve, Hedge reserve, Available-for-sale assets and Translation reserve are included in the Provisions line in the balance sheet, see specification on page 104 .2) Including payroll tax .3) For a specification of income tax attributable to components in other comprehensive income, see page 104 .
For further information regarding equity, see Parent Company Note PC11 .
FINANCIAL STATEMENTS AND NOTES / GROUPS
CA
AN
NU
AL
RE
PO
RT
20
18
Introduction Strategy & operations Board of Directors’ Report Financial statements Sustainability facts Other
103

Equity, specification of reserves
SEKm
Revaluation reserve1) Hedge reserve2)Translation
reserve
2018 2017 2018 2017 2018 2017
Value, January 1 - 107 103 255 –322 32
Cash flow hedges:
Result from remeasurement of derivatives recognized in equity - - 156 –100 - -
Transferred to the income statement for the period - - –16 –48 - -
Transferred to cost of hedged investments - - - –27 - -
Translation differences in foreign operations3) - - - - 19 772
Result from hedges of net investments in foreign operations - - - - - –958
Tax on items recognized directly in/transferred from equity - - –27 49 1 211
Discontinued operations - –107 - –26 - –379
Other comprehensive income for the period, net after tax - –107 113 –152 20 –354
Cash flow hedge, transferred to cost of hedged investments - - –34 - - -
Tax on cash flow hedge, transferred to cost - - 7 - - -
Value, December 31 - 0 189 103 –302 –322
1) Revaluation reserve includes effect on equity of step acquisitions .2) See also Note E6 for details of when profit or loss is expected to be recognized .3) Transfer of realized exchange gains to divested companies to the income statement is included in the amount of SEK 0m (0) .
Specification of income tax attributable to other comprehensive income for the period
SEKm
2018 2017
Before tax Tax effect After tax Before tax
Tax effect After tax
Remeasurement of defined benefit pension plans –504 111 –393 1,025 –283 742
Available-for-sale financial assets - - - 1 - 1
Cash flow hedges 140 –26 114 –175 49 –126
Translation differences in foreign operations 19 - 19 613 - 613
Other comprehensive income from associated companies - - - –1 - –1
Transitional effect from implementation of new accounting stan-dard –3 - –3 - - -
Result from equity instruments measured at fair value –1 - –1 - - -
Result from hedges of net investments in foreign operations - - - –958 211 –747
Discontinued operations - - - –407 –13 –420
Other comprehensive income for the period –349 85 –264 98 –36 62
At December 31, 2018, the debt/equity ratio amounted to 18% . Change in liabilities and equity is described on page 49 under Finan-cial position . SCA aims to establish an effective capital structure, while at the same time ensuring long-term access to loan financ-ing . Cash flow in relation to net debt shall take into account the target to maintain a credit rating corresponding to investment grade rating . SCA has a credit rating for long-term debt of BBB from Standard & Poor’s . SCA’s financial risk management is described in the Risk and risk management section on page 54 .
FINANCIAL STATEMENTS AND NOTES / GROUPS
CA
AN
NU
AL
RE
PO
RT
20
18
104

F1. SUBSIDIARIES
AP ACCOUNTING PRINCIPLES
SubsidiariesThe companies over which the SCA Group has a controlling influence are consolidated as subsidiaries . Controlling influence means that SCA has sufficient influence to control the activities of the subsidiary, has the right to its returns and has control over its exposure, and is able to impact the return of the com-pany through its influence . Most of the Group’s subsidiaries are wholly owned .
Gällö Timber AB and its wholly owned subsidiary Gällö Skog AB is 50% owned by SCA and 50% owned by AB Persson Invest . SCA is considered to have a controlling influence over the Gällö companies, despite the fact that SCA does not hold a majority of shares in the companies . SCA is deemed to have a controlling influence since it has control over the activities with significant impact on the Gällö companies’ return . Gällö Timber AB sells solid-wood products and sales totaled SEK 630m (582) . SEK 30m (20) was paid in dividends by the company . Gällö Skog AB buys and sells solid-wood products and sales total SEK 203m (255) . The company has not paid a dividend . The SCA Group has consolidated 100% of Gällö Timber AB and Gällö Skog AB .
Non-controlling interestsNon-controlling interests are recognized as a separate item in the Group’s equity . Profit or loss and every component of other comprehensive income are attributable to the owners of the Parent and to non-controlling interests . Losses attributable to non-controlling interests are recognized even if this results in a negative balance for the interest . In connection with acquisitions of less than 100%, non-controlling interests are determined either as a proportional share of the fair value of identifiable net assets excluding goodwill or at fair value . Subsequent acquisitions up to 100% and divestments of participations in a subsidiary that do not lead to a loss of controlling influence are recognized as an equity transaction .
Impairment testing Testing means the carrying amount of shares in subsidiaries is compared with consolidated equity . The annual impairment testing of the carrying amount of shares in subsidiaries resulted in an impairment loss of SEK –7m (–12) .
List of major subsidiariesThe following selection of wholly owned subsidiaries and sub-sidiaries with significant non-controlling interests includes com-
panies with external sales in excess of SEK 100m in 2018 .
Company name Corp. Reg. No. Domicile
Share of equity at
December 31, 2018
Share of equity at
December 31, 2017
SCA Graphic Sundsvall AB 556093-6733 Sundsvall, Sweden 100 100
SCA Munksund AB 556237-4859 Piteå, Sweden 100 100
SCA Obbola AB 556147-1003 Umeå, Sweden 100 100
SCA Wood AB 556047-8512 Sundsvall, Sweden 100 100
SCA Wood France S .A .S . 440341527 La Rochelle, France 100 100
SCA Wood Hong Kong Ltd 1134245 Hong Kong, China 100 100
SCA Wood UK Ltd 2541468 Stoke-on-Trent, UK 100 100
SCA Wood Scandinavia AB 556302-0667 Sundsvall, Sweden 100 100
SCA Japan K .K . 0104-01-109101 Tokyo, Japan 100 90
Gällö Timber AB 556801-1786 Bräcke, Sweden 50 50
F. GROUP STRUCTURE
FINANCIAL STATEMENTS AND NOTES / GROUPS
CA
AN
NU
AL
RE
PO
RT
20
18
Introduction Strategy & operations Board of Directors’ Report Financial statements Sustainability facts Other
105

F2. ASSOCIATED COMPANIES
AP ACCOUNTING PRINCIPLES
Associated companiesAssociated companies are companies in which the Group exer-cises a significant influence without the partly owned company being a subsidiary . Normally, this means that the Group owns between 20% and 50% of the votes . Accounting for associated companies is carried out according to the equity method and they are initially measured at cost . Valuation of acquired assets and liabilities is performed in the same manner as for subsidiar-ies and the carrying amount for associated companies includes any goodwill and other Group adjustments .
The Group’s share of profit after tax arising in the associated companies after the acquisition is recognized on the line Result from participations in associated companies in the consolidated income statement . Share in profits is calculated on the basis of SCA’s share of equity in the respective associated company .
Holding in associated companies amounted to BS SEK 29m (28) .
F3. SHARES AND PARTICIPATIONS
SEKm 2018 2017
Value, January 1 - 46
Other reclassifications - –13
Translation differences - –1
Discontinued operations - –32
BS Value, December 31 - -
Shares and participations pertain to holdings in other com-panies that are not classified as subsidiaries or associated companies . The holdings that have been reclassified as avail-able-for-sale financial assets in 2017, refer to Note E2 . The reclassification had no material impact on the financial state-ments .
F4. ACQUISITIONS AND DIVESTMENTS
AP ACCOUNTING PRINCIPLES
Acquisition of subsidiariesSCA applies IFRS 3 Business Combinations in connection with acquisitions . In business combinations, acquired assets and assumed liabilities are identified and classified at fair value on the date of acquisition (also known as an acquisition analysis) . The acquisition analysis also includes an assessment of whether there are any assets that are intangible in nature, such as trade-marks, patents, customer contracts or similar assets that were not recognized in the acquired unit . If the cost is higher than the net value of the acquired assets, assumed liabilities and identi-fied intangible assets, the difference is recognized as goodwill . Any surplus value on property, plant and equipment is depre-ciated over the estimated useful life of the asset . Goodwill and strong trademarks with indefinite useful lives are not amortized; instead, they are subjected to annual impairment testing . Some trademarks and customer contracts are amortized over their estimated useful lives .
If the transferred consideration is contingent on future events, it is measured at fair value . Any change in value is recognized in profit for the period .
Transaction costs in conjunction with acquisitions are not included in cost, but rather expensed directly .
Companies acquired during the period are included in the consolidated financial statements as of the acquisition date . Divested companies are included in the consolidated financial statements until the divestment date .
Non-controlling interestsAcquisitions of non-controlling interests are measured on an acquisition-by-acquisition basis, either as a proportional share of the fair value of identifiable net assets excluding goodwill (partial goodwill) or at fair value . This means that goodwill is also recognized on non-controlling interests (full goodwill) .
In step acquisitions in which a controlling influence is achieved, any net assets acquired earlier in the acquired units are remea-sured at fair value and the result of the remeasurement is recog-nized in the income statement . If the controlling influence is lost upon the divestment of an operation, the result is recognized in the income statement . The portion of the divested operation that remains in the Group is measured at fair value on the divestment date, with the remeasurement effect recognized in the income statement .
Acquisitions in which a controlling influence is achieved are recognized as an equity transaction, meaning a transfer between equity to owners of the Parent and non-controlling interests . The same applies for divestments that take place without the loss of a controlling influence .
Acquisitions and divestmentsNo significant acquisitions have taken place in the continuing operations in 2017 or 2018 . In the discontinued operation, BSN Medical was acquired in 2017 .
FINANCIAL STATEMENTS AND NOTES / GROUPS
CA
AN
NU
AL
RE
PO
RT
20
18
106

G1. NON-CURRENT ASSETS HELD FOR SALE AND DISCONTINUED OPERATIONS
AP ACCOUNTING PRINCIPLES
Non-current assets held for sale and discontinued operationsAssets are classified as held for sale if their value, within one year, will be recovered through a sale and not through con-tinued use in the operations . On the reclassification date, the assets and liabilities are measured at the lower of fair value minus selling costs and the carrying amount . The assets are no longer depreciated after reclassification . The gain is limited to the amount equivalent to previously made impairment charges . Gains and losses recognized on remeasurement and divest-ment are recognized in the income statement for the period . No non-current assets held for sale were recognized in 2018 .
When an independent business segment or a significant opera-tion within a geographic area is divested, it is classified as a dis-continued operation . The divestment date, or the point in time when the operation fulfills the criteria for classification as held for sale, determines when the operation should be classified as a discontinued operation .
Profit or loss after tax for the period from discontinued opera-tions is recognized on a separate line in the income statement . The income statement is adjusted for the comparative period as though the discontinued operation had already been disposed of at the start of the comparative period . The structure of the balance sheet for the current and previous year is not adjusted in the same manner .
Shares in the discontinued operation Essity (the hygiene busi-ness) were distributed to SCA’s shareholders in the second quarter of 2017 . Discontinued operations are recognized as discontinued operations in accordance with IFRS 5 and IFRIC 17 . Essity’s profit until the date of distribution and the capital gain generated by the distribution of Essity was recognized on a separate line – Profit for the period, discontinued operations . Essity has been excluded in comparative years to notes relating to the income statement .
Discontinued operationsEssityShares in Essity were distributed to SCA’s shareholders in a fixed ratio of 1:1, whereby shareholders received one Class A share in Essity for every Class A share in SCA, and one Class B share in Essity for every Class B share in SCA . Essity’s first day of trading on Nasdaq Stockholm was June 15, 2017 and the closing price was SEK 247 .20 for the Class A share and SEK 248 .50 for the Class B share . This represents a market capitalization of about SEK 174,448m for Essity .
Earnings from discontinued operations consist of Essity’s profit for the period between January 1, and June 13, 2017 and the difference between the market value of liabilities at the date of distribution and the net assets distributed through Essity and resulted in an earnings effect of SEK 136,914m in the second quarter of 2017 . No impairment was carried out in conjunction with the distribution of the hygiene business .
Income statement
SEKm 2018
2017 Jan–
June 13
Net sales - 47,854
Operating profit - 4,965
Financial items - –487
Profit before tax - 4,478
Taxes - –1,111
Profit for the period, discontinued operations - 3,367
Impact on earnings from the distribution of Essity - 136,914
ISC Profit for the period, discontinued operations - 140,281
Earnings per share, (SEK) - 199.27
Cash flow
SEKm 2018
2017 Jan–
June 13
Cash flow for the period, discontinued operations
CF Cash flow from operating activities - 4,517
CF Investing activities - –15,591
CF Financing activities - 11,022
Cash flow for the period, discontinued operations - –52
Cash flow from financing activities cannot be recognized sepa-rately from discontinued operations since the financing was not recognized separately on that date .
G. OTHER
FINANCIAL STATEMENTS AND NOTES / GROUPS
CA
AN
NU
AL
RE
PO
RT
20
18
Introduction Strategy & operations Board of Directors’ Report Financial statements Sustainability facts Other
107

G2. LEASING
AP ACCOUNTING PRINCIPLES
Lease agreements are classified and recognized as either operating or finance leases .
In cases where a lease agreement essentially entails that the risks and rewards normally associated with ownership have been transferred to SCA, the lease agreement is classified as a finance lease . The leased asset is recognized as a non-current asset with a corresponding interest-bearing liability . The initial value of both these items comprises the lower of the fair value of the assets or the present value of the minimum lease payments . Future lease fees are divided between amortization and interest, so that each reporting period is charged with an interest amount that corresponds to a fixed interest rate on the recognized lia-bility for the respective period . The leased asset is depreciated according to the same principles that apply to other assets of the same nature . If it is uncertain whether the asset will be taken over at the end of the leasing period, the asset is depreciated over the lease term if this is shorter than the useful life that applies to other assets of the same nature . Lease agreements in which the risks and rewards normally associated with ownership are essentially carried by the lessor are classified as operating leases, and the lease payments are expensed on a straight-line basis over the lease term .
Leasing expenses
SEKm 2018 2017
Operating leases –289 –279
Finance leases, depreciation/amortization - –1
Finance leases, interest expense - -
Total –289 –280
Operating leases, future minimum lease payments
SEKm 2018 2017
Within 1 year 212 346
Between 2 and 5 years 566 856
Later than 5 years 851 895
Total 1,629 2,097
Operating lease objects comprise a large number of items, including warehouses, terminals, offices, other buildings, machinery and equipment, IT equipment, office equipment and various transport vehicles . The assessment for a number of the objects is that, in reality, it is possible to terminate contracts in advance .
Other disclosuresSCA did not recognize any finance leases in 2018 .
G3. PLEDGED ASSETS AND CONTINGENT LIABILITIES
AP ACCOUNTING PRINCIPLES
A contingent liability is recognized when there is a potential or actual obligation arising from events that have occurred that is not recognized as a liability or provision, either because it is improbable that an outflow of resources will be required to settle the obligation or because the amount cannot be calculated in a reliable manner .
Contingent liabilities
SEKm 2018 2017
Guarantees for:
associated companies 5 5
customers and others 39 27
Other contingent liabilities 23 283
Total 67 315
In 2007, SCA entered into a sale and leaseback transaction with a European bank relating to the soda recovery boiler at the kraftliner plant in Obbola, Sweden . The term of the contract is 25 years and SCA has a right to terminate the transaction in 2023 without any financial consequences . The present value of SCA’s future rental amounts was SEK 671m . A corresponding amount was invested in a security with an A rating issued by the counterparty and deposited in a Swedish bank assigned to han-dle rental payments during the term of the contract . Should the counterparty’s rating fall below BBB–, SCA is entitled, without incurring any financial consequences, to terminate the transac-tion in advance . Should SCA, as a result of extraordinary events (of a force majeure nature), elect not to fulfill, or cannot fulfill the contract, SCA is liable to compensate the counterparty for any economic loss that may be incurred as a result . Compensation varies during the term and can amount to a maximum of 11% of the transaction amount . SCA has the use of the facility without operational restrictions . The lease and depositary arrangement have been recognized net in SCA’s balance sheet since 2007 .
SCA signed a ten-year fixed-price agreement with a Norwegian electricity supplier comprising electricity deliveries correspond-ing to approximately 25% of SCA Graphic Sundsvall AB’s esti-mated consumption . The agreement became effective in 2009 .
Pledged assets
SEKm 2018 2017
Chattel mortgages 20 20
Total 20 20
Liabilities for which some of these assets were pledged amounted to SEK 0m (0) .
G4. TRANSACTIONS WITH RELATED PARTIES
To the extent that transactions with related parties took place, these were based on generally accepted commercial terms and conditions and pricing in the industry and were entered into on standard commercial conditions .
For information regarding salaries and other remuneration, costs and obligations for pensions and similar benefits for the Board, President and CEO and other senior executives, refer to Notes C3 and C4 .
Otherwise, no transactions took place between SCA and related parties .
FINANCIAL STATEMENTS AND NOTES / GROUPS
CA
AN
NU
AL
RE
PO
RT
20
18
108
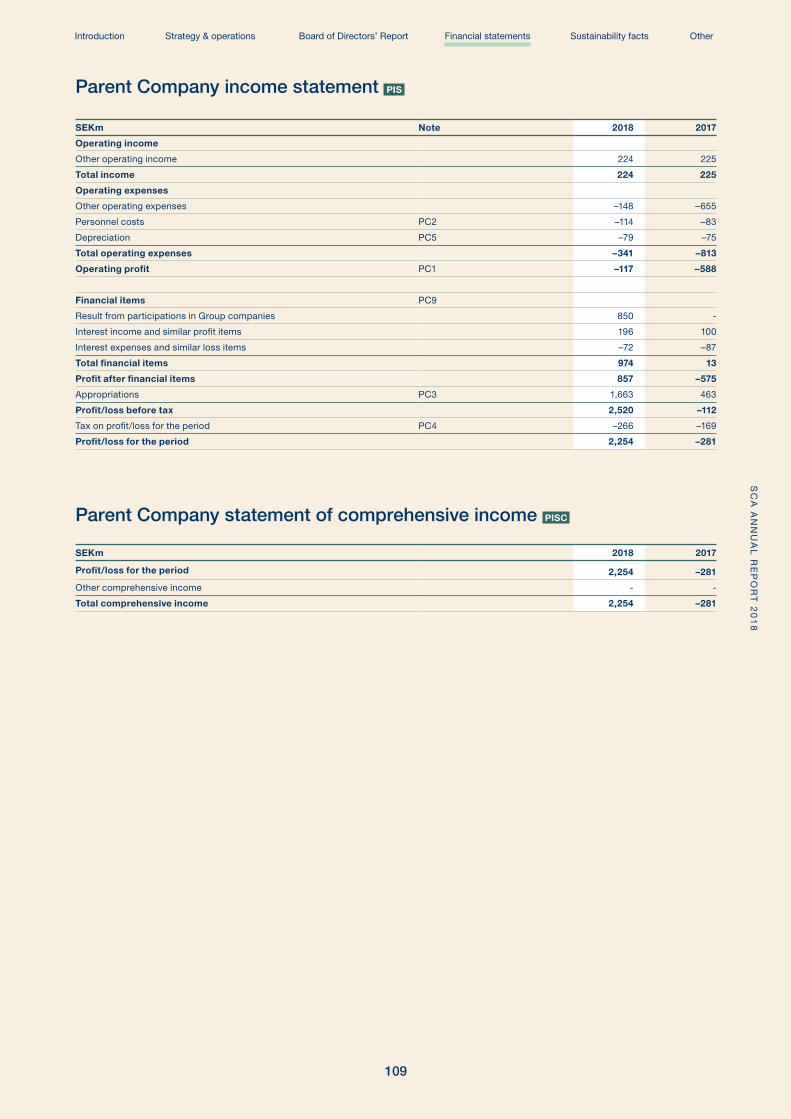
Parent Company income statement PIS
Parent Company statement of comprehensive income PISC
SEKm Note 2018 2017
Operating income
Other operating income 224 225
Total income 224 225
Operating expenses
Other operating expenses –148 –655
Personnel costs PC2 –114 –83
Depreciation PC5 –79 –75
Total operating expenses –341 –813
Operating profit PC1 –117 –588
Financial items PC9
Result from participations in Group companies 850 -
Interest income and similar profit items 196 100
Interest expenses and similar loss items –72 –87
Total financial items 974 13
Profit after financial items 857 –575
Appropriations PC3 1,663 463
Profit/loss before tax 2,520 –112
Tax on profit/loss for the period PC4 –266 –169
Profit/loss for the period 2,254 –281
SEKm 2018 2017
Profit/loss for the period 2,254 –281
Other comprehensive income - -
Total comprehensive income 2,254 –281
FINANCIAL STATEMENTS AND NOTES / PARENT COMPANYS
CA
AN
NU
AL
RE
PO
RT
20
18
Introduction Strategy & operations Board of Directors’ Report Financial statements Sustainability facts Other
109

SEKm Note 2018 2017
ASSETS
Non-current assets
Land and buildings PC5 8,489 8,365
Tangible fixed assets 8,489 8,365
Participations in Group companies PC6 4,758 4,758
Other long-term receivables 80 183
Financial fixed assets 4,838 4,941
Total fixed assets 13,327 13,306
Current assets
Receivables from subsidiaries PC7 17,145 15,420
Current tax assets PC4 - 37
Other current receivables PC8 328 134
Cash and bank balances PC9 226 83
Total current assets 17,699 15,674
Total assets 31,026 28,980
EQUITY, PROVISIONS AND LIABILITIES
Equity
Share capital PC11 2,350 2,350
Revaluation reserve 1,740 1,740
Statutory reserve 7,283 7,283
Total restricted equity 11,373 11,373
Retained earnings 6,127 7,462
Profit for the period 2,254 –281
Total non-restricted equity 8,381 7,181
Total equity 19,754 18,554
Untaxed reserves PC3 - -
Provisions
Provisions for pensions PC2 29 28
Provisions for taxes PC4 1,546 1,579
Total provisions 1,575 1,607
Non-current liabilities
Non-current interest-bearing liabilities PC9 5,180 3,600
Other non-current liabilities 75 42
Total non-current liabilities 5,255 3,642
Current liabilities
Current interest-bearing liabilities PC9 2,551 3,472
Liabilities to subsidiaries PC7 1,627 1,378
Trade payables 1 5
Current tax liabilities PC4 56 -
Other current liabilities PC10 207 322
Total current liabilities 4,442 5,177
Total equity, provisions and liabilities 31,026 28,980
Parent Company balance sheet PBS
FINANCIAL STATEMENTS AND NOTES / PARENT COMPANYS
CA
AN
NU
AL
RE
PO
RT
20
18
110
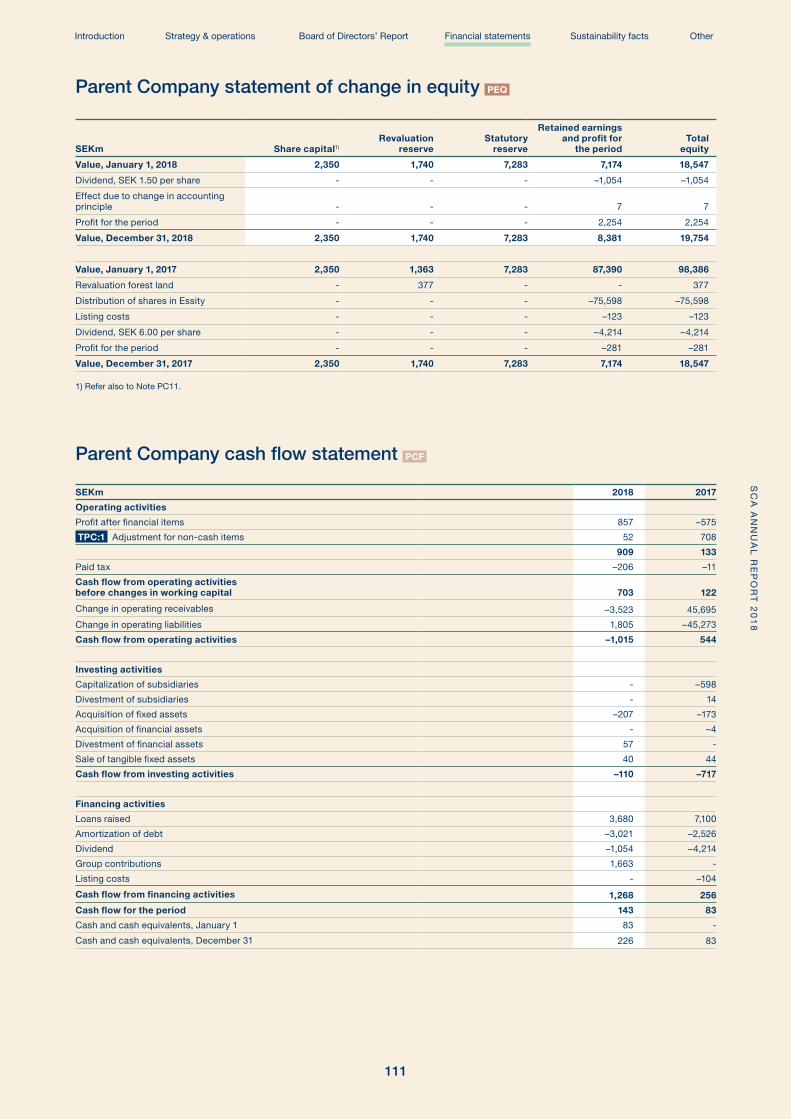
Parent Company statement of change in equity PEQ
SEKm Share capital1)Revaluation
reserveStatutory
reserve
Retained earnings and profit for
the periodTotal
equity
Value, January 1, 2018 2,350 1,740 7,283 7,174 18,547
Dividend, SEK 1.50 per share - - - –1,054 –1,054
Effect due to change in accounting principle - - - 7 7
Profit for the period - - - 2,254 2,254
Value, December 31, 2018 2,350 1,740 7,283 8,381 19,754
Value, January 1, 2017 2,350 1,363 7,283 87,390 98,386
Revaluation forest land - 377 - - 377
Distribution of shares in Essity - - - –75,598 –75,598
Listing costs - - - –123 –123
Dividend, SEK 6.00 per share - - - –4,214 –4,214
Profit for the period - - - –281 –281
Value, December 31, 2017 2,350 1,740 7,283 7,174 18,547
1) Refer also to Note PC11.
Parent Company cash flow statement PCF
SEKm 2018 2017
Operating activities
Profit after financial items 857 –575
TPC:1 Adjustment for non-cash items 52 708
909 133
Paid tax –206 –11
Cash flow from operating activities before changes in working capital 703 122
Change in operating receivables –3,523 45,695
Change in operating liabilities 1,805 –45,273
Cash flow from operating activities –1,015 544
Investing activities
Capitalization of subsidiaries - –598
Divestment of subsidiaries - 14
Acquisition of fixed assets –207 –173
Acquisition of financial assets - –4
Divestment of financial assets 57 -
Sale of tangible fixed assets 40 44
Cash flow from investing activities –110 –717
Financing activities
Loans raised 3,680 7,100
Amortization of debt –3,021 –2,526
Dividend –1,054 –4,214
Group contributions 1,663 -
Listing costs - –104
Cash flow from financing activities 1,268 256
Cash flow for the period 143 83
Cash and cash equivalents, January 1 83 -
Cash and cash equivalents, December 31 226 83
FINANCIAL STATEMENTS AND NOTES / PARENT COMPANYS
CA
AN
NU
AL
RE
PO
RT
20
18
Introduction Strategy & operations Board of Directors’ Report Financial statements Sustainability facts Other
111
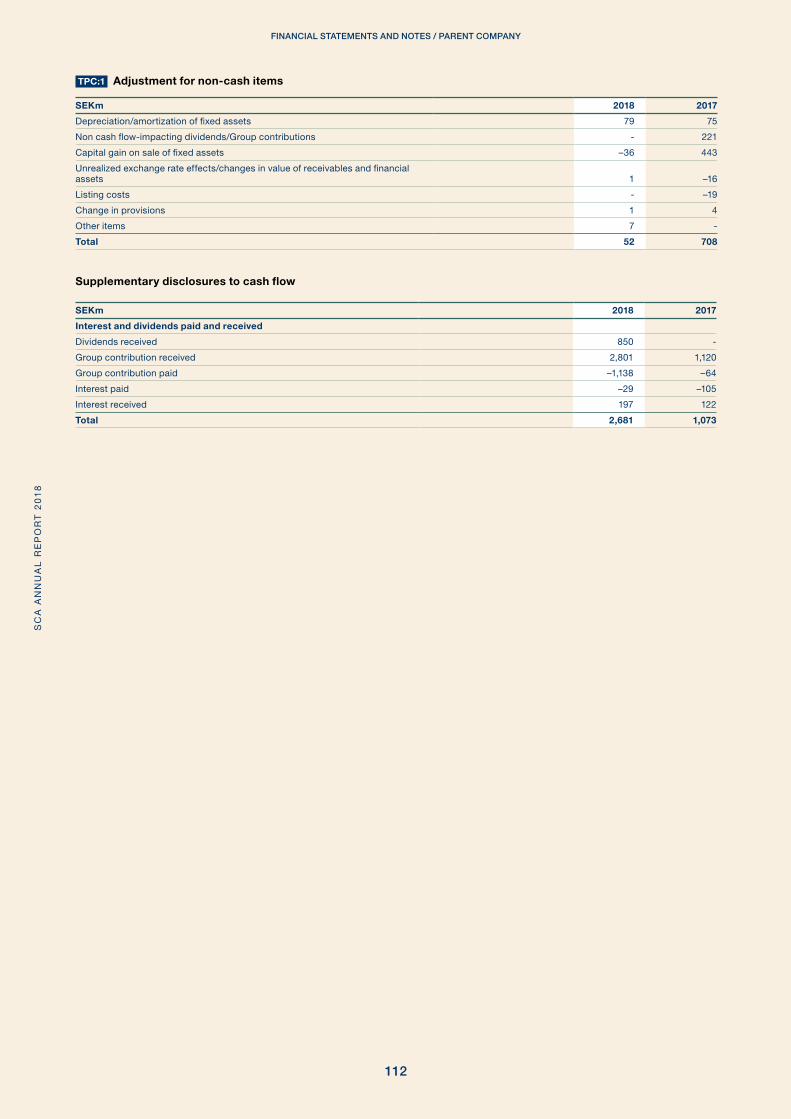
TPC:1 Adjustment for non-cash items
SEKm 2018 2017
Depreciation/amortization of fixed assets 79 75
Non cash flow-impacting dividends/Group contributions - 221
Capital gain on sale of fixed assets –36 443
Unrealized exchange rate effects/changes in value of receivables and financial assets 1 –16
Listing costs - –19
Change in provisions 1 4
Other items 7 -
Total 52 708
Supplementary disclosures to cash flow
SEKm 2018 2017
Interest and dividends paid and received
Dividends received 850 -
Group contribution received 2,801 1,120
Group contribution paid –1,138 –64
Interest paid –29 –105
Interest received 197 122
Total 2,681 1,073
FINANCIAL STATEMENTS AND NOTES / PARENT COMPANYS
CA
AN
NU
AL
RE
PO
RT
20
18
112

PC1. OPERATING PROFIT OR LOSS
Operating profit/loss by type of cost
SEKm Note 2018 2017
Other operating income 224 225
Other external costs –41 –526
Personnel and Board costs –114 –83
Depreciation of tangible fixed assets PC5 –79 –75
Other operating expenses excluding depreciation –107 –129
PIS Total –117 –588
The item Other external costs for 2018 includes a capital loss of SEK 0m (–483). The capital loss from 2017 was attributable to intra-Group transfers of forest land. The item Other external costs also includes consultancy fees, travel expenses, leasing expenses, management costs, and so forth.
Auditing expenses
SEKm 2018 20171)
EY
Audit assignments –4 –4
Auditing activities other than the audit assignment - –1
Other assignments - -
Total –4 –5
Other
Other assignments - –1
Total - –1
1) Additional costs in 2017 include advisory services related to auditing in con-junction with the distribution of Essity of SEK 9m from EY and SEK 28m from other auditors. These costs are not included in operating expenses but are recognized against equity.
PC2. PERSONNEL AND BOARD COSTS
Remuneration to the Board, the President and other senior executives is included for 2018. Remuneration to the Board and the President is included for 2017. Remuneration to other senior executives is included as of June 15, 2017. Essity AB (publ) paid remuneration to senior executives for the period until June 14, 2017.
Salaries and remuneration
SEKm 2018 2017
Board of Directors 1), President and CEO and other senior executives 12 (12) –69 –56
of which variable remuneration –27 –16
Total –69 –56
1) Salaries and remuneration include Board fees of SEK –8m (–9). For further information, refer to Note C4.
Social security costs
SEKm 2018 2017
Total social security costs –42 –26
of which pension costs 1) –21 –10
1) Of the Parent Company’s pension costs, SEK –21m (–10) pertain to the Board, President and CEO, and senior executives.
The company’s outstanding pension obligations as per the balance sheet on December 31, 2018 relate to the President.
Pension costs
SEKm 2018 2017
Self-administered pension plans
Costs excluding interest expense - –3
Retirement through insurance
Insurance premiums –12 –5
–12 –8
Special payroll tax on pension costs –9(1) –2
Pension costs for the period –21 –10
1) Of which SEK – 6m relates to a provision due to reassessment.
Average number of employees
2018 2017
Average number of employees 13 8
of whom men 11 7
of whom women 2 1
Provisions for pensions
AP ACCOUNTING PRINCIPLESThe Parent Company applies the regulations in the Pension Obligations Vesting Act (Tryggandelagen). The main difference compared with IAS 19 is that Swedish practice disregards future increases in salaries and pensions when calculating the present value of the pension obligation. Both defined contribution and defined benefit plans exist in the Parent Company.
Other pension obligationsThe Group’s Note C3 describes the other pension plans of the Parent Company. The table below shows the change between the years.
Capital value of pension obligations relating to self-administered pension plans
SEKm 2018 2017
Value, January 1 28 24
Costs excluding interest expense 1 4
PBS Value, December 31 29 28
External actuaries have carried out capital value calculations pursuant to the provisions of the Pension Obligations Vesting Act (Tryggandelagen). The discount rate is 0.6% (0.7). The defined benefit obligations are based on salary levels on the respective balance sheet dates. Part of the pension obligations are covered by capital insurance policies. The capital insurance policies are reported as Other long-term receivables in the balance sheet.
PC. PARENT COMPANY NOTES
FINANCIAL STATEMENTS AND NOTES / PARENT COMPANYS
CA
AN
NU
AL
RE
PO
RT
20
18
Introduction Strategy & operations Board of Directors’ Report Financial statements Sustainability facts Other
113
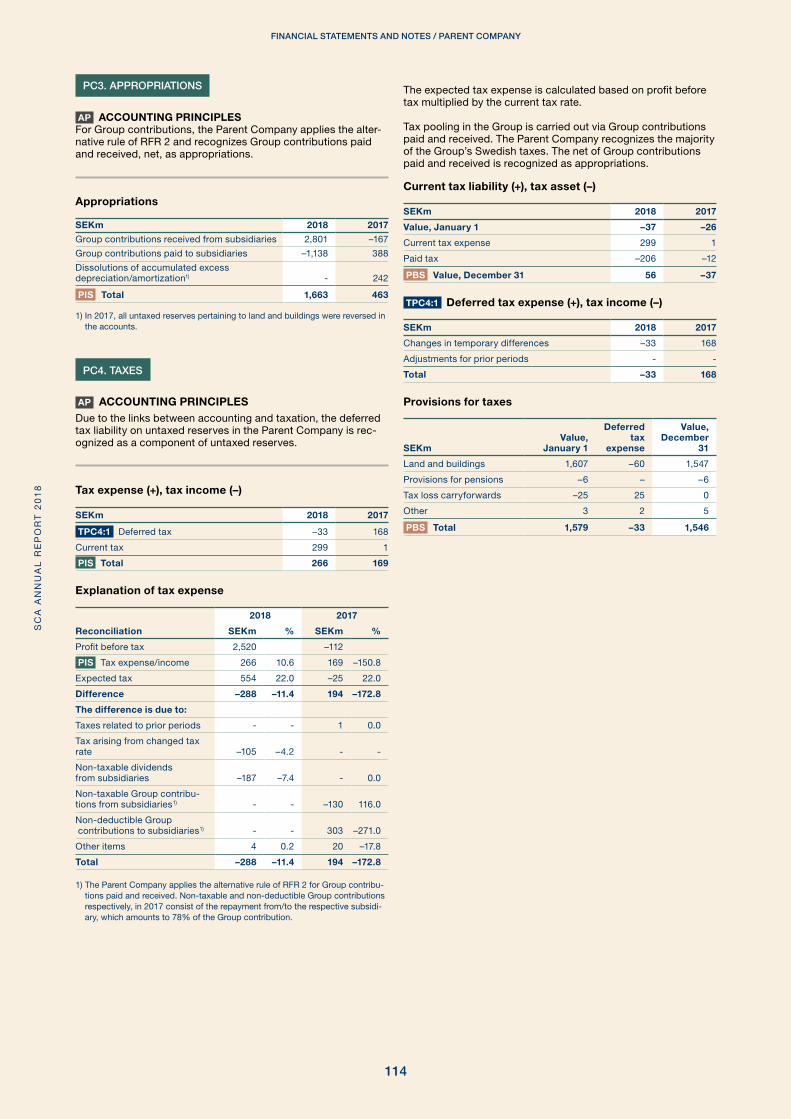
PC3. APPROPRIATIONS
AP ACCOUNTING PRINCIPLESFor Group contributions, the Parent Company applies the alter-native rule of RFR 2 and recognizes Group contributions paid and received, net, as appropriations.
Appropriations
SEKm 2018 2017
Group contributions received from subsidiaries 2,801 –167
Group contributions paid to subsidiaries –1,138 388
Dissolutions of accumulated excess depreciation/amortization1) - 242
PIS Total 1,663 463
1) In 2017, all untaxed reserves pertaining to land and buildings were reversed in the accounts.
PC4. TAXES
AP ACCOUNTING PRINCIPLESDue to the links between accounting and taxation, the deferred tax liability on untaxed reserves in the Parent Company is rec-ognized as a component of untaxed reserves.
Tax expense (+), tax income (–)
SEKm 2018 2017
TPC4:1 Deferred tax –33 168
Current tax 299 1
PIS Total 266 169
Explanation of tax expense
Reconciliation
2018 2017
SEKm % SEKm %
Profit before tax 2,520 –112
PIS Tax expense/income 266 10.6 169 –150.8
Expected tax 554 22.0 –25 22.0
Difference –288 –11.4 194 –172.8
The difference is due to:
Taxes related to prior periods - - 1 0.0
Tax arising from changed tax rate –105 –4.2 - -
Non-taxable dividends from subsidiaries –187 –7.4 - 0.0
Non-taxable Group contribu-tions from subsidiaries 1) - - –130 116.0
Non-deductible Group contributions to subsidiaries 1) - - 303 –271.0
Other items 4 0.2 20 –17.8
Total –288 –11.4 194 –172.8
1) The Parent Company applies the alternative rule of RFR 2 for Group contribu-tions paid and received. Non-taxable and non-deductible Group contributions respectively, in 2017 consist of the repayment from/to the respective subsidi-ary, which amounts to 78% of the Group contribution.
The expected tax expense is calculated based on profit before tax multiplied by the current tax rate.
Tax pooling in the Group is carried out via Group contributions paid and received. The Parent Company recognizes the majority of the Group’s Swedish taxes. The net of Group contributions paid and received is recognized as appropriations.
Current tax liability (+), tax asset (–)
SEKm 2018 2017
Value, January 1 –37 –26
Current tax expense 299 1
Paid tax –206 –12
PBS Value, December 31 56 –37
TPC4:1 Deferred tax expense (+), tax income (–)
SEKm 2018 2017
Changes in temporary differences –33 168
Adjustments for prior periods - -
Total –33 168
Provisions for taxes
SEKmValue,
January 1
Deferred tax
expense
Value, December
31
Land and buildings 1,607 –60 1,547
Provisions for pensions –6 – –6
Tax loss carryforwards –25 25 0
Other 3 2 5
PBS Total 1,579 –33 1,546
FINANCIAL STATEMENTS AND NOTES / PARENT COMPANYS
CA
AN
NU
AL
RE
PO
RT
20
18
114
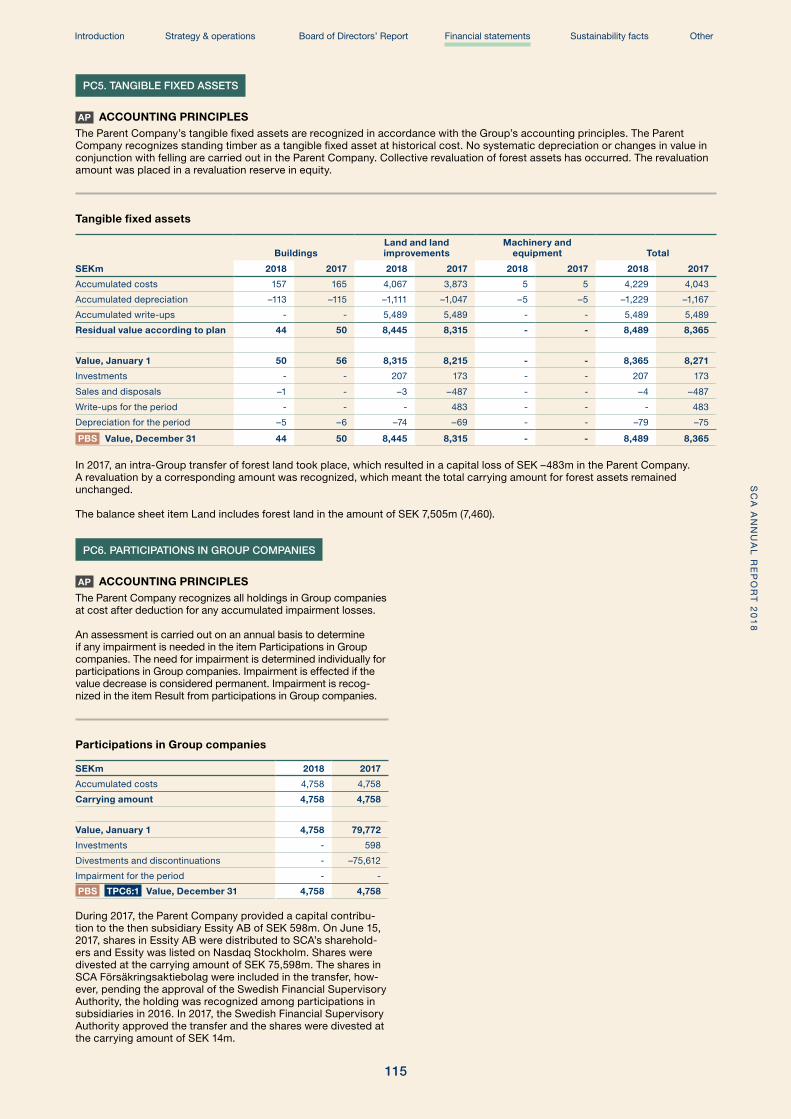
PC5. TANGIBLE FIXED ASSETS
AP ACCOUNTING PRINCIPLESThe Parent Company’s tangible fixed assets are recognized in accordance with the Group’s accounting principles. The Parent Company recognizes standing timber as a tangible fixed asset at historical cost. No systematic depreciation or changes in value in conjunction with felling are carried out in the Parent Company. Collective revaluation of forest assets has occurred. The revaluation amount was placed in a revaluation reserve in equity.
Tangible fixed assets
SEKm
BuildingsLand and land improvements
Machinery and equipment Total
2018 2017 2018 2017 2018 2017 2018 2017
Accumulated costs 157 165 4,067 3,873 5 5 4,229 4,043
Accumulated depreciation –113 –115 –1,111 –1,047 –5 –5 –1,229 –1,167
Accumulated write-ups - - 5,489 5,489 - - 5,489 5,489
Residual value according to plan 44 50 8,445 8,315 - - 8,489 8,365
Value, January 1 50 56 8,315 8,215 - - 8,365 8,271
Investments - - 207 173 - - 207 173
Sales and disposals –1 - –3 –487 - - –4 –487
Write-ups for the period - - - 483 - - - 483
Depreciation for the period –5 –6 –74 –69 - - –79 –75
PBS Value, December 31 44 50 8,445 8,315 - - 8,489 8,365
In 2017, an intra-Group transfer of forest land took place, which resulted in a capital loss of SEK –483m in the Parent Company. A revaluation by a corresponding amount was recognized, which meant the total carrying amount for forest assets remained unchanged.
The balance sheet item Land includes forest land in the amount of SEK 7,505m (7,460).
PC6. PARTICIPATIONS IN GROUP COMPANIES
AP ACCOUNTING PRINCIPLESThe Parent Company recognizes all holdings in Group companies at cost after deduction for any accumulated impairment losses.
An assessment is carried out on an annual basis to determine if any impairment is needed in the item Participations in Group companies. The need for impairment is determined individually for participations in Group companies. Impairment is effected if the value decrease is considered permanent. Impairment is recog-nized in the item Result from participations in Group companies.
Participations in Group companies
SEKm 2018 2017
Accumulated costs 4,758 4,758
Carrying amount 4,758 4,758
Value, January 1 4,758 79,772
Investments - 598
Divestments and discontinuations - –75,612
Impairment for the period - -
PBS TPC6:1 Value, December 31 4,758 4,758
During 2017, the Parent Company provided a capital contribu-tion to the then subsidiary Essity AB of SEK 598m. On June 15, 2017, shares in Essity AB were distributed to SCA’s sharehold-ers and Essity was listed on Nasdaq Stockholm. Shares were divested at the carrying amount of SEK 75,598m. The shares in SCA Försäkringsaktiebolag were included in the transfer, how-ever, pending the approval of the Swedish Financial Supervisory Authority, the holding was recognized among participations in subsidiaries in 2016. In 2017, the Swedish Financial Supervisory Authority approved the transfer and the shares were divested at the carrying amount of SEK 14m.
FINANCIAL STATEMENTS AND NOTES / PARENT COMPANYS
CA
AN
NU
AL
RE
PO
RT
20
18
Introduction Strategy & operations Board of Directors’ Report Financial statements Sustainability facts Other
115

TPC6:1 Parent Company’s holdings of shares in subsidiaries, December 31, 2018
Company name Corp. Reg. No. DomicileNo. of
sharesShare of
equity, %Carrying
amount, SEKm
Swedish subsidiaries:
SCA Graphic Holding AB 556479-2058 Sundsvall, Sweden 1,000 100 4,758
SCA Skogsfastigheter AB 556207-6256 Sundsvall, Sweden 1,000 100 0
SCA Kraftfastigheter AB 556449-7237 Sundsvall, Sweden 1,000 100 0
Total carrying amount of subsidiaries 4,758
PC7. RECEIVABLES FROM AND LIABILITIES TO SUBSIDIARIES
Receivables from and liabilities to subsidiaries
SEKm 2018 2017
Current assets
Interest-bearing receivables 14,184 15,028
Other receivables 2,961 392
PBS Total 17,145 15,420
Current liabilities
Interest-bearing liabilities 97 1,116
Other liabilities 1,530 262
PBS Total 1,627 1,378
PC8. OTHER CURRENT RECEIVABLES
Other current receivables
SEKm 2018 2017
TPC8:1 Prepaid expenses and accrued income 20 3
Other receivables 308 131
PBS Total 328 134
TPC8:1 Prepaid expenses and accrued income
SEKm 2018 2017
Other items 20 3
Total 20 3
PC9. FINANCIAL INSTRUMENTS
Financial items
SEKm 2018 2017
Result from participations in Group companies
Dividends from subsidiaries 850 -
Interest income and similar profit items
Interest income, subsidiaries 196 100
Interest expenses and similar loss items
Interest expenses, external –24 –53
Interest expenses, subsidiaries –2 –1
Other financial expenses1) –46 –33
PIS Total 974 13
1) The item includes exchange rate differences amounting net to SEK –4m (–4).
Interest-bearing liabilitiesNon-current interest-bearing liabilities
SEKm
Carrying amount Fair value
2018 2017 2018 2017
Maturity > 1 year < 5 years 3,200 2,600 3,203 2,604
Maturity > 5 years 1,980 1,000 1,983 1,003
PBS Total 5,180 3,600 5,186 3,607
Current interest-bearing liabilities
SEKm
Carrying amount Fair value
2018 2017 2018 2017
Maturity < 1 year 2,551 3,472 2,549 3,475
PBS Total 2,551 3,472 2,549 3,475
For further information about borrowing activities during the year, refer to Note E4.
Financial instruments by category
AP ACCOUNTING PRINCIPLESFinancial assets and liabilities are recognized at amortized cost, except for derivatives, which are measured at fair value. As an adaption to IFRS 9, the Parent Company has changed its method of measurement of financial derivatives from amortized cost to fair value, as of January 1, 2018. The impact of this change on profit or loss at December 31, 2018, is an increase in financial items of SEK 9m. Effects on the balance sheet at December 31, 2018 were an increase in financial fixed assets of SEK 75m, in current assets of SEK 430m, in non-current liabilities of SEK 75m, in other current liabilities of SEK 421m and in equity of SEK 7m. The total increase is net of the change in profit or loss at December 31, 2018 and an adjustment of the opening balance from the previous fiscal year.
FINANCIAL STATEMENTS AND NOTES / PARENT COMPANYS
CA
AN
NU
AL
RE
PO
RT
20
18
116

The change in method of measurement of financial derivatives from amortized cost to fair value has entailed an adjustment of the comparative year.
The change had no material impact on profit or loss at December, 31, 2017. In the balance sheet at December 31, 2017, financial fixed assets increased by SEK 46m, current assets by SEK 129m, non-current liabilities by SEK 42m, current liabilities by SEK 124m, provisions by SEK 1m and equity by SEK 7m, corre-sponding to the change in profit or loss at December 31, 2017.
For information about classification and measurement level, refer to Note E1.
Financial assets measured at amortized cost
SEKm 2018 2017
Assets
Financial fixed assets
Interest-bearing receivables 4 137
Current assets
Receivables from subsidiaries 14,184 15,031
Other current receivables 1 2
PBS Cash and bank balances 226 83
Total 14,415 15,253
Financial liabilities measured at amortized cost
SEKm 2018 2017
Liabilities
Non-current liabilities
Interest-bearing liabilities 5,180 3,600
Current liabilities
Interest-bearing liabilities 2,551 3,472
Liabilities to subsidiaries 99 1,211
Trade payables 1 5
Other current liabilities 2 3
Total 7,833 8,291
Financial assets measured at fair value in the income statement
SEKm 2018 2017
Non-current financial assets - 4
Derivatives – Current financial assets 9 8
Derivatives – Other long-term receivables 75 42
Derivatives – Other current receivables 421 120
Total 505 174
Financial liabilities measured at fair value in the income statement
SEKm 2018 2017
Derivatives – Current financial liabilities - 4
Derivatives – Other non-current liabilities 75 42
Derivatives – Other current liabilities 421 120
Total 496 166
PC10. OTHER CURRENT LIABILITIES
Other current liabilities
SEKm 2018 2017
TPC10:1 Accrued expenses and prepaid income 71 65
Other operating liabilities 136 257
PBS Total 207 322
TPC10:1 Accrued expenses and prepaid income
SEKm 2018 2017
Accrued interest expenses 3 3
Accrued social security costs 11 9
Accrued vacation pay liability 1 1
Other liabilities to personnel 27 24
Other items 29 28
Total 71 65
FINANCIAL STATEMENTS AND NOTES / PARENT COMPANYS
CA
AN
NU
AL
RE
PO
RT
20
18
Introduction Strategy & operations Board of Directors’ Report Financial statements Sustainability facts Other
117

PC12. PLEDGED ASSETS AND CONTINGENT LIABILITIES
Contingent liabilities
SEKm 2018 2017
Guarantees for subsidiaries 704 564
Other contingent liabilities 231 238
Total 935 802
Pledged assets
SEKm 2018 2017
Chattel mortgages 20 20
Total 20 20
PC13. PROPOSED DISPOSITION OF EARNINGS
Annual accounts 2018Disposition of earnings, Parent Company (SEK)
Non-restricted equity in the Parent Company:
Retained earnings 6,127,207,571
Net profit for the year 2,254,349,305
Total 8,381,556,876
The Board of Directors and the President propose:
– to be distributed to shareholders, a dividend of SEK 1.75 per share 1,229,099,356
– to be carried forward 7,152,457,520
Total 8,381,556,876
The annual accounts are subject to adoption by SCA’s Annual General Meeting and will be presented for approval at the Annual General Meeting on March 20, 2019.
PC11. SHARE CAPITAL
The change in equity is shown in the financial report relating to Equity presented under Financial statements, Parent Company. The share capital and number of shares have changed since 1993 on account of new issues, conversions, splits, and the cancellation of treasury shares as set out below:
Year Event No. of sharesIncrease in
share capitalCash payment,
SEKm
1993 Number of shares, January 1, 1993 172,303,839
1993 Conversion of debentures and new subscription through Series 1 warrants 4,030,286 40.3 119.1
New issue 1:10, issue price SEK 80 17,633,412 176.3 1,410.7
1994 Conversion of debentures 16,285 0.2 -
1995 Conversion of debentures 3,416,113 34.2 -
1999 New issue 1:6, issue price SEK 140 32,899,989 329.0 4,579.0
2000 Conversion of debentures 101,631 1.0 15.0
2001 New issue, private placement 1,800,000 18.0 18.0
2002 New subscription through IIB warrants 513 - 0.1
2003 Conversion of debentures 1,127,792 11.3 288.4
New subscription through IIB warrants 1,697,683 17.0 434.5
2004 Conversion of debentures 9,155 0.1 1.1
2007 Split 3:1 470,073,396 - -
2017 Cancellation of treasury shares –2,767,605 - -
2018 Number of shares, December 31, 2018 702,342,489
SCA’s share capital, December 31, 2018
No. of votes No. of sharesShare capital,
SEKm
Class A shares 10 64,587,672 216
Class B shares 1 637,754,817 2,134
Total 702,342,489 2,350
The quotient value of the Parent Company’s shares amounts to SEK 3.35.
FINANCIAL STATEMENTS AND NOTES / PARENT COMPANYS
CA
AN
NU
AL
RE
PO
RT
20
18
118
Sustainability facts
119
SC
A A
NN
UA
L R
EP
OR
T 2
01
8SUSTAINABILITY FACTS

SCA’s sustainability work is integrated into the Group’s operations and business decisions. SCA’s 2018 Sustainability Report is an integrated part of the combined Annual Report. The following
pages present supplementary sustainability information, such as the Group’s work in various areas of sustainability, information about the report, stakeholder dialogues, materiality analysis,
material topics, sustainability targets, calculation methods and multi-year summary of the Group’s sustainability data.
Value creationThrough its operations, SCA helps to create value for a large number of stakeholders. These values include:
• Climate benefits from growing forests that capture and bind CO2 and products that replace fossil-based alternatives
• Shareholder value for the company’s shareholders• The value of forest land through a stable supply to SCA’s
industries• Enabler of a circular society by providing access to renewable
products and renewable energy• Job opportunities in the company’s operations and at
contractors• Business opportunities for suppliers of goods and services• Recreation and outdoor activities in the company’s forests• Sustainable local communities and regional development
through the company’s presence and operations
SCA sustainability profileSCA’s sustainability ambition encompasses social, economic and environmental goals, which are integrated into the company’s work and business development. SCA’s sustainability profile rep-resents the company’s operations as a whole and is an important component of the SCA brand. Profitable growth is the foundation of the company’s strategy and part of sustainable growth. Long-term economic returns are an integrated part of SCA’s sustain-ability profile together with the other components: Fossil-free world, Valuable forests, Efficient use of resources, Responsibility for people and the community, and its set of Values.
Sustainability targetsThe Group’s sustainability targets are presented in the table “Strategic priorities and sustainability targets”. The targets encompass three dimensions: social, economic and environ-mental sustainability. The Group-wide targets are supplemented with targets at unit level based on local needs. These are based on the unit’s analysis that may include an evaluation of environ-mental aspects, recruitment needs and other improvement or development needs.
61.1% Payments to suppliers including other forest owners: SEK 13,059m (2017: SEK 12,474m)
14.2% Salaries, social security costs and pension provisions to SCA’s employees: SEK 3,041m (SEK 2,763m)
5.8% Dividend to shareholders, in accordance with Board’s proposal: SEK 1,229m (SEK 1,054m)
0.1% Interest paid to creditors: SEK 29m (SEK 93m)
1.5% Income tax to society: SEK 314m (SEK 544m)
17.3% Remaining in SCA: SEK 3,691m (SEK 1,957m)
The area of the circle represents SCA’s reve-nue, including changes in value to biological assets, totaling SEK 21,362m (2017: SEK 18,885m)
A large portion of payments to suppliers were made to suppliers in SCA’s local area in Northern Sweden. This is particularly the case for purchasing wood raw material and contractors’ services. For payments to employees, SEK 2,712m (89%) pertain to employees in Sweden, mainly in Northern Sweden. A significant share of this figure was received by municipalities and the state in Sweden, through the pay-ment of social security costs, payment by employees of municipal and state income taxes, and through the consumption of products and ser-vices. 95% of the reported income tax amount pertains to Sweden. The major part, SEK 319m, consists of current tax expense and the remain-ing SEK 5m of deferred tax income. The amount “Remaining in SCA” comprises profit for the period excluding depreciation/amortization and deductions for the dividend for 2018 in accordance with the Board’s proposal. Further information about the cost structure is available in the Board of Directors’ Report and regarding income taxes in Note B6.
Economic value creation
SC
A A
NN
UA
L R
EP
OR
T 2
01
8SUSTAINABILITY FACTS
120

SUSTAINABILITY FACTSS
CA
AN
NU
AL
RE
PO
RT
20
18
Introduction Strategy & operations Board of Directors’ Report Financial statements Sustainability facts Other
121

Governance and materiality
Sustainability governanceSCA’s President has the overall responsibility for the gover-nance of SCA’s business in the field of sustainability. The main purpose of all governance at SCA is to guarantee the Group’s commitments to its stakeholders. A description of governance within the SCA Group, including sustainability, can be found in the Corporate Governance Report. The sustainability agenda is based on SCA’s set of values and regulated through the Group’s policies, where the Code of Conduct and Sustainability Policy form the basis of sustainability work.
The sustainability agenda is headed by the Group’s Sustaina-bility Director via SCA’s Sustainability Council and a number of cross-functional networks, such as the Environmental Network and the Occupational Health and Safety Network. The Group’s sustainability targets are formulated based on the materiality analysis and on strategic priorities. These are supplemented at local level with unit-specific targets. Risks linked to the field of sustainability are included in the Group’s total risk manage-ment. A description of the most significant risks and an account of how these risks are managed can be found in the Board of Directors’ Report. In product and process development, the precautionary approach is used.
Follow-up of sustainability workFollow-up and evaluation of sustainability work complies with SCA’s procedures for self-assessment, internal control and audits, as described under internal audits in the Corporate Gov-ernance Report. Follow-up is conducted at unit level together with other monitoring of targets and aggregated at Group level. The outcome of the Group-wide targets is monitored by the Group’s cross-functional network and by SCA’s Sustainability Council. Any discrepancies are reported using the Group-wide discrepancy procedures and corrective measures are identified and implemented.
External initiatives and membership in organizations and certificationsSCA monitors and wants to contribute in various ways toward global initiatives aimed at achieving a better world. SCA is a member of the UN Global Compact, an initiative aimed at convincing companies to take responsibility for the UN’s ten principles in the areas of human rights, working conditions, the environment and anti-corruption. SCA is also active in a number of international, national and regional trade organizations.
SCA is committed to active and responsible forest management, and supports the two international certification systems for forests and forest raw materials, the Forest Stewardship Council (FSC) and the Programme for the Endorsement of Forest Certification (PEFC). SCA is represented at both international and national levels. Furthermore, SCA works to raise awareness of how active forest management and increasing the use of forest products can help to combat climate change. SCA’s operations are certified in accordance with ISO 14001, 50001, 9001 and OHSAS 18001, as detailed on sca.com.
SCA wants to contribute to the transformation to a fossil-free society and is a member of the Fossil Free Sweden initiative. SCA participates in the WWF Environmental Paper Company Index, and is a member of the WWF Global Forest & Trade Network (GFTN).
Stakeholder dialoguesSCA engages in continuous dialogue with various stakeholders in order to identify areas that should be prioritized and to continu-ously improve the company’s value creation. SCA identifies its pri-mary stakeholders based on their interests and potential influence on the Group, and their material impact on the Group’s business.
The business areas maintain a close dialogue with their cus-tomers and follow up customer satisfaction through surveys, face-to-face meetings and third-party assessments. SCA regularly meets investors and analysts. The Group performs All Employee Surveys and annual target and performance manage-ment reviews for its employees. Moreover, SCA communicates with other groups and individuals in matters that have a major impact on society in general and local communities in particular,
SC
A A
NN
UA
L R
EP
OR
T 2
01
8SUSTAINABILITY FACTS
122

Stakeholder groups
How we conduct dialogues Main topics How we address the issues
Customers and consumers
Customer visits, inter-views, participation in customer events and seminars, trade fairs, mailings, website, social media
Environmental impact, ecola-belling, fiber sourcing, forestry, human rights, health and safety, customer focus, resource efficiency, innovation, product safety
• Customer surveys• Visits by customers to show our company’s value chain• Dialogue and onsite visits to demonstrate responsible
forest management• Education/training in the Code of Conduct and anti-
corruption, SCA’s Supplier Standard, climate footprint, FSC and PEFC certification, product safety
• Life cycle management of products• Development of new products together with customers• Visit to customers by technical experts• Customers who perform audits of our operations• Participation at trade fairs at national and international
levels
Employees Performance reviews, workplace meetings, work councils, online surveys, intranet, inter-nal courses, manage-ment meetings
Workplace culture, health and safety, skills development, recruitment and succession planning, compensation and benefits, gender equality, busi-ness ethics, working conditions, resource efficiency, environmen-tal impact, product development
• Training in the Code of Conduct, introductory course for new employees, skill-enhancement activities, gender equality training. Early career program
• Program ZERO for developing a health and safety culture, OHSAS 18001 certification
• All Employee Survey, equal opportunity plans, change management training
• Trade union interaction, such as business council meetings, collaboration meetings and safety committee meetings
Investors and owners
Investor meetings in conjunction with, for example, interim reports, capital market days, the AGM, inter-views, website
Dividends targets, financial targets, areas of growth, forest valuation, risk management, health and safety, ethics, human rights, climate impact, resource efficiency
• AGM March 23, 2018• Investor and analyst meetings, Capital Market Day,
May 22, 2018• Roadshows in conjunction with quarterly accounts• Risk management as part of the Board of Directors’
Report in the Annual report
Suppliers Follow-up meetings, request for tenders and procurements, interviews, website
Supplier audits, business ethics, human rights, health and safety, energy consumption, resource efficiency, climate impact
• Reviewing SCA’s Supplier Standard• Supplier assessments and follow-up meetings• Processes for risk assessment
Private forest owners
Forest owner meetings, face-to-face meetings, customer magazine, website, social media
Management methods, forestry plans, ownership rights, forest certification, nature conserva-tion
• Business contacts on an ongoing basis during the year• Customer satisfaction interviews with private forest
owners• A number of forest owner meetings held • Further development of SkogsvingeTM for better land-
owner functionality• Collaboration with Skogscertifiering Prosilva AB
concerning a group certificate for forest owners
NGOs Meetings concerning specific issues, inter-views, websites
Forest management, biodiversi-ty, climate and environmental is-sues, resource efficiency, green energy, human rights, hunting, reindeer herding
• Stakeholder dialogue, memberships and involvement in organizations such as the Swedish Forest Industries Federation, the Confederation of European Paper Industries (CEPI), FSC and PEFC
• Involvement in the revision of the Swedish FSC standard• Onsite visits to the company’s forests
Society Dialogue meetings, local events, public consultation, inter-views, websites
Occupational health and safety, environmental issues, local issues, renewable energy, reindeer herding, labor market, education, community engage-ment, diversity issues, human rights
• Public affairs, dialogues with regulators, government au-thorities, lobbyists, and local communities, consultation concerning investments, permits, and other local issues
• Participation in the Chamber of Commerce and “Skogen i skolan”.
• Board representation in Mid Sweden University and Sundsvall Timrå Airport
• Consultation meetings with local Sami communities• Roundtable discussions on various topics
Stakeholder dialogues
SUSTAINABILITY FACTSS
CA
AN
NU
AL
RE
PO
RT
20
18
Introduction Strategy & operations Board of Directors’ Report Financial statements Sustainability facts Other
123
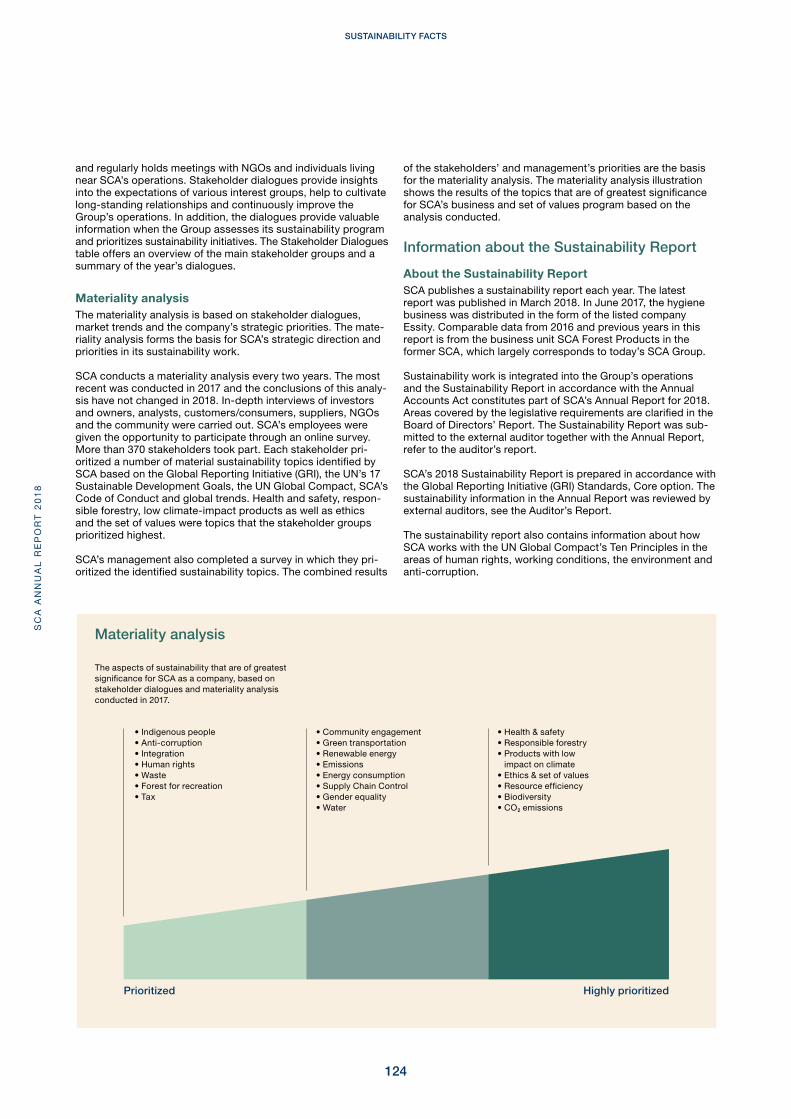
and regularly holds meetings with NGOs and individuals living near SCA’s operations. Stakeholder dialogues provide insights into the expectations of various interest groups, help to cultivate long-standing relationships and continuously improve the Group’s operations. In addition, the dialogues provide valuable information when the Group assesses its sustainability program and prioritizes sustainability initiatives. The Stakeholder Dialogues table offers an overview of the main stakeholder groups and a summary of the year’s dialogues.
Materiality analysisThe materiality analysis is based on stakeholder dialogues, market trends and the company’s strategic priorities. The mate-riality analysis forms the basis for SCA’s strategic direction and priorities in its sustainability work.
SCA conducts a materiality analysis every two years. The most recent was conducted in 2017 and the conclusions of this analy-sis have not changed in 2018. In-depth interviews of investors and owners, analysts, customers/consumers, suppliers, NGOs and the community were carried out. SCA’s employees were given the opportunity to participate through an online survey. More than 370 stakeholders took part. Each stakeholder pri-oritized a number of material sustainability topics identified by SCA based on the Global Reporting Initiative (GRI), the UN’s 17 Sustainable Development Goals, the UN Global Compact, SCA’s Code of Conduct and global trends. Health and safety, respon-sible forestry, low climate-impact products as well as ethics and the set of values were topics that the stakeholder groups prioritized highest.
SCA’s management also completed a survey in which they pri-oritized the identified sustainability topics. The combined results
of the stakeholders’ and management’s priorities are the basis for the materiality analysis. The materiality analysis illustration shows the results of the topics that are of greatest significance for SCA’s business and set of values program based on the analysis conducted.
Information about the Sustainability Report
About the Sustainability ReportSCA publishes a sustainability report each year. The latest report was published in March 2018. In June 2017, the hygiene business was distributed in the form of the listed company Essity. Comparable data from 2016 and previous years in this report is from the business unit SCA Forest Products in the former SCA, which largely corresponds to today’s SCA Group.
Sustainability work is integrated into the Group’s operations and the Sustainability Report in accordance with the Annual Accounts Act constitutes part of SCA’s Annual Report for 2018. Areas covered by the legislative requirements are clarified in the Board of Directors’ Report. The Sustainability Report was sub-mitted to the external auditor together with the Annual Report, refer to the auditor’s report.
SCA’s 2018 Sustainability Report is prepared in accordance with the Global Reporting Initiative (GRI) Standards, Core option. The sustainability information in the Annual Report was reviewed by external auditors, see the Auditor’s Report.
The sustainability report also contains information about how SCA works with the UN Global Compact’s Ten Principles in the areas of human rights, working conditions, the environment and anti-corruption.
The aspects of sustainability that are of greatest significance for SCA as a company, based on stakeholder dialogues and materiality analysis conducted in 2017.
• Indigenous people• Anti-corruption• Integration• Human rights• Waste• Forest for recreation• Tax
• Community engagement• Green transportation• Renewable energy• Emissions• Energy consumption• Supply Chain Control• Gender equality• Water
• Health & safety• Responsible forestry• Products with low
impact on climate• Ethics & set of values• Resource efficiency• Biodiversity• CO2 emissions
Materiality analysis
Highly prioritizedPrioritized
SC
A A
NN
UA
L R
EP
OR
T 2
01
8SUSTAINABILITY FACTS
124

Boundary of the reportThe Sustainability Report covers the SCA Group, including wholly owned subsidiaries and subsidiaries in which SCA owns at least 50% of the company, see Note F1 under Financial notes. If SCA owns 50% or more of a company, the entire company is included in the report.
Environmental data and resource use is stipulated for the man-ufacturing units, meaning for pulp and paper mills and for saw-mills, building materials and pellets manufacturing. Social data is stipulated for the entire Group and pertains to own employees unless otherwise stated.
As the report is prepared in accordance with the GRI Standards, the materiality principle has had great significance. This means that the report’s content is determined by the issues that are most relevant to SCA and its stakeholders, and that the content provides a complete view of the operations. The material areas have been matched with the relevant GRI disclosure numbers, see the Materiality analysis section.
Data collectionData provided in the Report is compiled through various systems, primarily the Group’s accounting system, Resource Management System (RMS), forest planning systems, SCA’s HR system and Afa’s Occupational health and safety information systems (the IA systems). Since assumptions and conversion factors may be required for certain calculations, this entails a source of uncer-tainty. SCA strives to obtain data that is as reliable as possible.
The RMS system describes how the company uses energy, water, transport and raw materials and generates waste and emissions. RMS data is used for internal control, monitoring and analysis, life cycle assessments and external benchmarking. RMS data is reported at unit level using direct measurements and inventories.
Energy consumption is calculated in various ways, such as through direct measurements of consumption or by calculating based on fuel consumption. The conversion factors used are obtained from suppliers or from literature.
For most CO2 emission calculations, SCA applies the global standard Greenhouse Gas Protocol to measure, manage and report CO2 emissions. For other environment data, SCA applies recognized measurement and calculation standards, including the Swedish Standards Institute, the Swedish Environmental Protection Agency and the International Energy Agency’s fac-tors. The climate impact is stated in the Annual Report as CO2 and refers to CO2e unless otherwise specified.
Emissions from transportation are calculated based on total transport performed per mode of transport for finished prod-ucts, raw materials and input goods. Emissions are calculated by multiplying transportation per transport mode (expressed as tonne kilometers) by typical emission factors for the different modes of transportation. The emission factors used are based on data from the Network for Transportation Measures (NTM) (www.transportmeasures.org). For transportation with SCA’s RoRo vessels and container-feeders, the actual fuel consump-tion and load utilization is used.
Personnel-related data is mainly provided by SCA’s HR system. Supporting qualitative data is gathered in SCA’s database for sustainability data. The IA system is used for reporting and fol-lowing-up work-related injuries and incidents at every unit within the Group. Reporting also encompasses contractors who con-duct work on SCA’s sites. The system is also used for preventive reporting of risk observations. The statistics are aggregated to Group level.
When adjustments have been made compared with earlier years, a note is made directly beside the chart or table.
SUSTAINABILITY FACTSS
CA
AN
NU
AL
RE
PO
RT
20
18
Introduction Strategy & operations Board of Directors’ Report Financial statements Sustainability facts Other
125

Strategic priorities and sustainability targets
Strategic priorities Why material
Impact on value chain Governance
Material risks1)
SCA’s materiality analysis
GRI disclosure number
Sustainability area2) Sustainability targets KPI 2018 Outcome 2018
Profitable growth
Long-term profitability requires sustained and profitable growth that creates value for customers, owners, employees and the com-munities in which the company operates.
Shareholders, society, employ-ees, suppliers
• Financial control
• Financial Policy
• Business develop-ment plans
• Financial risks
• Demand and market price
• In accordance with the company’s strategy
201-1 • Sustainable development through responsible, long-term and suc-cessful business practices
• EBITDA margin
• EBITDA development
• Industrial return on capital employed
28.0%
44% relative to 2017
16.4%
Fossil-free world
SCA produces and sells renewable products that can replace fossil-based alternatives and thereby contribute to reducing global warming. SCA also contributes to climate benefits through the net growth of the com-pany’s forests, which absorb CO2 from the atmosphere, and by continuously striving to reduce greenhouse gas emissions from its own value chain.
Growth in the forest, SCA’s op-erations, suppli-ers, transports, customers
• Sustainability Policy
• SCA’s Environ-mental Network
• Business develop-ment plans
• Political deci-sions
• Products that have low climate impact
• CO2 emissions
• Renewable energy
305-5 Environment • Fossil-free value chain
• SCA's forests are to counteract cli-mate change as growing trees bind CO2, and its products by replacing fossil-based alternatives
• Increase wind power production on SCA’s land to 5 TWh by 2020
• Total climate benefit
• Net forest growth
• Substitution effect (contri-bution from products)
• Emissions of CO2e in line with scope 1, 2 and 3.
• Production of wind power on SCA land
8 million tonnes CO2
3 million m3fo
5 million tonnes CO2
0.9 million tonnes CO2
2.6 TWh
Valuable forests
Forest is an important part of the earth’s ecosystem. SCA conducts responsible forest management to benefit biodiversity while the use of forest raw material creates value for our customers and the Group, and ensures future access to forest raw material.
SCA forests, private forest owners, commu-nity, customers
• Forest manage-ment manual
• Quality man-uals for forest operations, road construction and transport activities
• Risks in the forest land holding
• Responsible forestry
• Biodiversity
• Supplier audits
304-3 Environment • SCA's forests are to be at least as rich in biodiversity, nature ex-periences and raw material in the future as they are today
• All wood raw material in our prod-ucts is to be certified according to FSC or PEFC or fulfill the FSC’s standard for controlled wood, FSC CW
• Standing volume in own forest
• Area excluded from timber production for nature conservation3)
• Wood raw material in SCA’s products that complies with FSC, PEFC or FSC CW
235 million m3fo
20% of productive forest land (see page 134)
100%
Efficient use of resources
SCA continuously strives to improve its re-source efficiency, which contributes to better profitability while also being economical with the planet's resources and reducing the impact on the environment.
Own operations, optimizing the value chain, customers
• Sustainability Policy
• SCA’s Environ-mental Network
• ESAVE program
• SCA’s Innovation Network
• Environmental impact
• Products that have low climate impact
• Resource efficiency
• Emissions
302-1 Environment • Maximize the use of raw materials and value creation from the wood raw material
• Decrease the specific energy con-sumption by 20% between 2010 and 2020
• Decrease the specific emissions of suspended solids and phosphorus to water by 10% between 2014 and 2020
• Added value (sales relative to utilized volume of raw material)
• Energy saving
• Emissions to water of suspended solids and phosphorous
SEK 2,000/m3 wood raw material
10% lower specific energy consumption compared with 2010. Changes to product portfolio and investment projects impact the outcome
Emissions of suspended solids have decreased 12% and phosphorous has de-creased by 21% compared with the base year
Responsibility for people and the com-munity
The employees is the company’s most important resource. SCA secures the future need of expertise by being an inclusive and attractive employer that puts health and safety first. Through the business, jobs are generated, both directly and indirectly, and SCA develops together with the communities in which the company operates.
Employees (existing and potential), local communities
• Sustainability Policy
• Health and Safety Policy
• HR Policy
• Steering commit-tee ZERO
• SCA’s Occupa-tional Health and Safety Network
• Employee-re-lated risks
• Risks at pro-duction plants
• Health and safety
• Diversity
• Community engage-ment
403-9 405-1
Social conditions and employeesLabor
• Zero workplace accidents
• Attractive and inclusive employer where diversity is a part of the culture
• Workplace accidents, LTA frequency rate
• Engagement index from the All Employee Survey
• Share of women in the Group
• Number of employees
9.1 accidents resulting in absence, per million hours worked
Index = 78
19%
4,216 (average number during the year)
Our set of values
To be a credible and transparent company, SCA’s business is based on a shared set of values that are described in the Code of Conduct, which all employees are to comply with and to be guided by in the company’s business relationships and interaction with stakeholders. SCA aims to establish a sustainable supply chain with suppliers that share the company’s values.
Employees, suppliers, customers, society
• Code of Conduct
• SCA’s Supplier Standard
• SCA’s Compliance Council
• Business ethics
• Suppliers
• Ethics and set of values
• Human rights
• Supplier audits
206-1 Human rightsAnti-corruption
• Compliance with SCA’s Code of Conduct and all employees to receive regular training in the Code
• Purchases from suppliers that fulfill SCA’s Supplier Standard
• Percentage of employees who have received training in the Code of Conduct
• Percentage of contract suppliers that have approved SCA’s Supplier Standard
90%
94%
1) See section Risks and risk management.2) According to the Swedish Annual Accounts Act (ÅRL) and UN Global Compact3) Total voluntary set-asides and conservation measures during final felling
SC
A A
NN
UA
L R
EP
OR
T 2
01
8SUSTAINABILITY FACTS
126
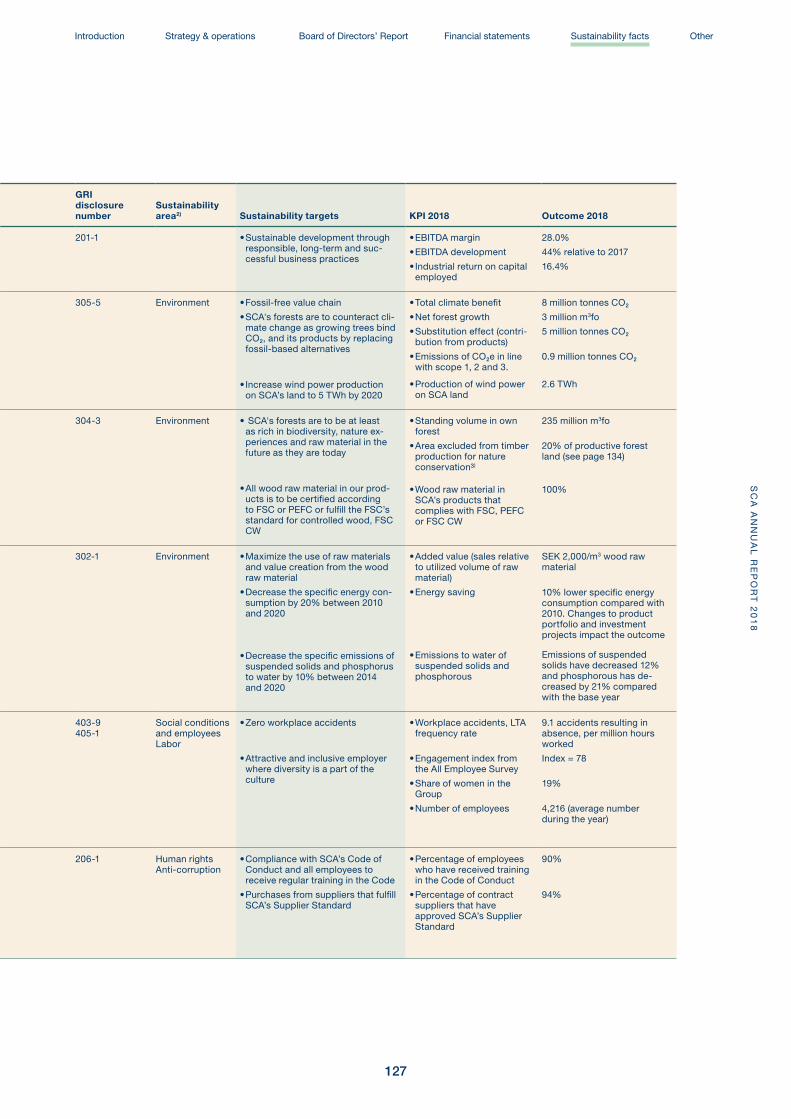
Strategic priorities and sustainability targets
Strategic priorities Why material
Impact on value chain Governance
Material risks1)
SCA’s materiality analysis
GRI disclosure number
Sustainability area2) Sustainability targets KPI 2018 Outcome 2018
Profitable growth
Long-term profitability requires sustained and profitable growth that creates value for customers, owners, employees and the com-munities in which the company operates.
Shareholders, society, employ-ees, suppliers
• Financial control
• Financial Policy
• Business develop-ment plans
• Financial risks
• Demand and market price
• In accordance with the company’s strategy
201-1 • Sustainable development through responsible, long-term and suc-cessful business practices
• EBITDA margin
• EBITDA development
• Industrial return on capital employed
28.0%
44% relative to 2017
16.4%
Fossil-free world
SCA produces and sells renewable products that can replace fossil-based alternatives and thereby contribute to reducing global warming. SCA also contributes to climate benefits through the net growth of the com-pany’s forests, which absorb CO2 from the atmosphere, and by continuously striving to reduce greenhouse gas emissions from its own value chain.
Growth in the forest, SCA’s op-erations, suppli-ers, transports, customers
• Sustainability Policy
• SCA’s Environ-mental Network
• Business develop-ment plans
• Political deci-sions
• Products that have low climate impact
• CO2 emissions
• Renewable energy
305-5 Environment • Fossil-free value chain
• SCA's forests are to counteract cli-mate change as growing trees bind CO2, and its products by replacing fossil-based alternatives
• Increase wind power production on SCA’s land to 5 TWh by 2020
• Total climate benefit
• Net forest growth
• Substitution effect (contri-bution from products)
• Emissions of CO2e in line with scope 1, 2 and 3.
• Production of wind power on SCA land
8 million tonnes CO2
3 million m3fo
5 million tonnes CO2
0.9 million tonnes CO2
2.6 TWh
Valuable forests
Forest is an important part of the earth’s ecosystem. SCA conducts responsible forest management to benefit biodiversity while the use of forest raw material creates value for our customers and the Group, and ensures future access to forest raw material.
SCA forests, private forest owners, commu-nity, customers
• Forest manage-ment manual
• Quality man-uals for forest operations, road construction and transport activities
• Risks in the forest land holding
• Responsible forestry
• Biodiversity
• Supplier audits
304-3 Environment • SCA's forests are to be at least as rich in biodiversity, nature ex-periences and raw material in the future as they are today
• All wood raw material in our prod-ucts is to be certified according to FSC or PEFC or fulfill the FSC’s standard for controlled wood, FSC CW
• Standing volume in own forest
• Area excluded from timber production for nature conservation3)
• Wood raw material in SCA’s products that complies with FSC, PEFC or FSC CW
235 million m3fo
20% of productive forest land (see page 134)
100%
Efficient use of resources
SCA continuously strives to improve its re-source efficiency, which contributes to better profitability while also being economical with the planet's resources and reducing the impact on the environment.
Own operations, optimizing the value chain, customers
• Sustainability Policy
• SCA’s Environ-mental Network
• ESAVE program
• SCA’s Innovation Network
• Environmental impact
• Products that have low climate impact
• Resource efficiency
• Emissions
302-1 Environment • Maximize the use of raw materials and value creation from the wood raw material
• Decrease the specific energy con-sumption by 20% between 2010 and 2020
• Decrease the specific emissions of suspended solids and phosphorus to water by 10% between 2014 and 2020
• Added value (sales relative to utilized volume of raw material)
• Energy saving
• Emissions to water of suspended solids and phosphorous
SEK 2,000/m3 wood raw material
10% lower specific energy consumption compared with 2010. Changes to product portfolio and investment projects impact the outcome
Emissions of suspended solids have decreased 12% and phosphorous has de-creased by 21% compared with the base year
Responsibility for people and the com-munity
The employees is the company’s most important resource. SCA secures the future need of expertise by being an inclusive and attractive employer that puts health and safety first. Through the business, jobs are generated, both directly and indirectly, and SCA develops together with the communities in which the company operates.
Employees (existing and potential), local communities
• Sustainability Policy
• Health and Safety Policy
• HR Policy
• Steering commit-tee ZERO
• SCA’s Occupa-tional Health and Safety Network
• Employee-re-lated risks
• Risks at pro-duction plants
• Health and safety
• Diversity
• Community engage-ment
403-9 405-1
Social conditions and employeesLabor
• Zero workplace accidents
• Attractive and inclusive employer where diversity is a part of the culture
• Workplace accidents, LTA frequency rate
• Engagement index from the All Employee Survey
• Share of women in the Group
• Number of employees
9.1 accidents resulting in absence, per million hours worked
Index = 78
19%
4,216 (average number during the year)
Our set of values
To be a credible and transparent company, SCA’s business is based on a shared set of values that are described in the Code of Conduct, which all employees are to comply with and to be guided by in the company’s business relationships and interaction with stakeholders. SCA aims to establish a sustainable supply chain with suppliers that share the company’s values.
Employees, suppliers, customers, society
• Code of Conduct
• SCA’s Supplier Standard
• SCA’s Compliance Council
• Business ethics
• Suppliers
• Ethics and set of values
• Human rights
• Supplier audits
206-1 Human rightsAnti-corruption
• Compliance with SCA’s Code of Conduct and all employees to receive regular training in the Code
• Purchases from suppliers that fulfill SCA’s Supplier Standard
• Percentage of employees who have received training in the Code of Conduct
• Percentage of contract suppliers that have approved SCA’s Supplier Standard
90%
94%
1) See section Risks and risk management.2) According to the Swedish Annual Accounts Act (ÅRL) and UN Global Compact3) Total voluntary set-asides and conservation measures during final felling
SUSTAINABILITY FACTSS
CA
AN
NU
AL
RE
PO
RT
20
18
Introduction Strategy & operations Board of Directors’ Report Financial statements Sustainability facts Other
127
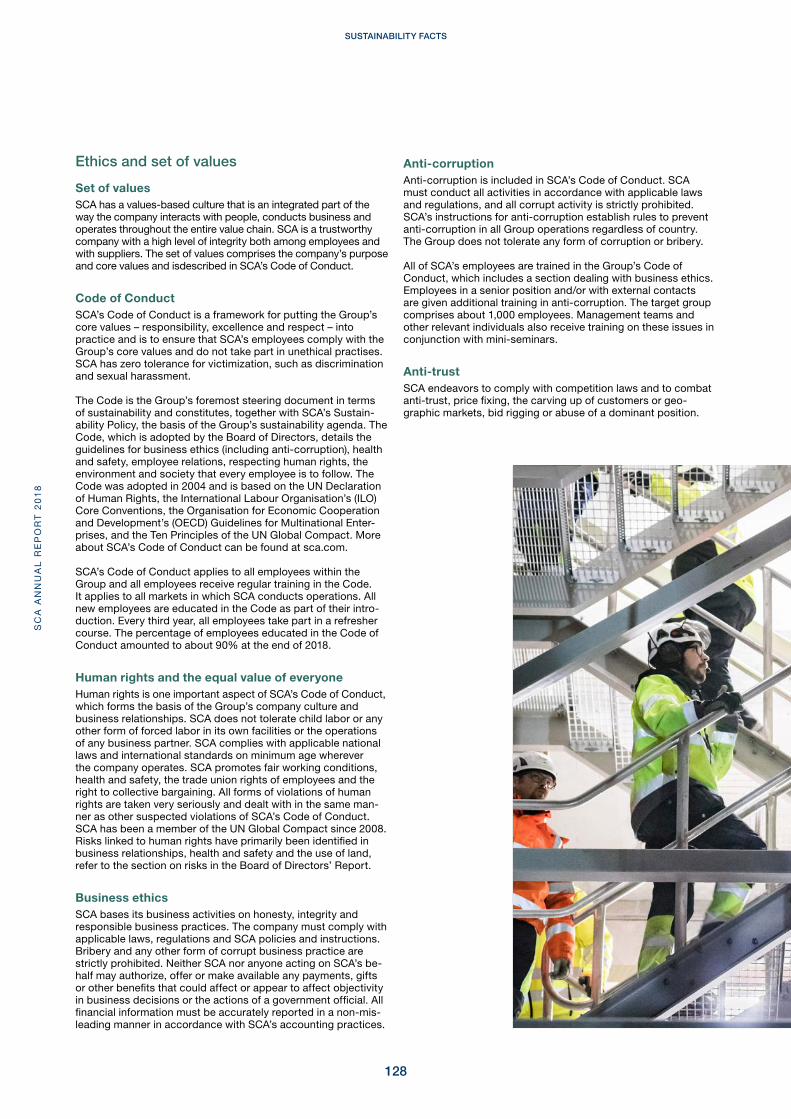
Ethics and set of values
Set of valuesSCA has a values-based culture that is an integrated part of the way the company interacts with people, conducts business and operates throughout the entire value chain. SCA is a trustworthy company with a high level of integrity both among employees and with suppliers. The set of values comprises the company’s purpose and core values and isdescribed in SCA’s Code of Conduct.
Code of ConductSCA’s Code of Conduct is a framework for putting the Group’s core values – responsibility, excellence and respect – into practice and is to ensure that SCA’s employees comply with the Group’s core values and do not take part in unethical practises. SCA has zero tolerance for victimization, such as discrimination and sexual harassment.
The Code is the Group’s foremost steering document in terms of sustainability and constitutes, together with SCA’s Sustain-ability Policy, the basis of the Group’s sustainability agenda. The Code, which is adopted by the Board of Directors, details the guidelines for business ethics (including anti-corruption), health and safety, employee relations, respecting human rights, the environment and society that every employee is to follow. The Code was adopted in 2004 and is based on the UN Declaration of Human Rights, the International Labour Organisation’s (ILO) Core Conventions, the Organisation for Economic Cooperation and Development’s (OECD) Guidelines for Multinational Enter-prises, and the Ten Principles of the UN Global Compact. More about SCA’s Code of Conduct can be found at sca.com.
SCA’s Code of Conduct applies to all employees within the Group and all employees receive regular training in the Code. It applies to all markets in which SCA conducts operations. All new employees are educated in the Code as part of their intro-duction. Every third year, all employees take part in a refresher course. The percentage of employees educated in the Code of Conduct amounted to about 90% at the end of 2018.
Human rights and the equal value of everyoneHuman rights is one important aspect of SCA’s Code of Conduct, which forms the basis of the Group’s company culture and business relationships. SCA does not tolerate child labor or any other form of forced labor in its own facilities or the operations of any business partner. SCA complies with applicable national laws and international standards on minimum age wherever the company operates. SCA promotes fair working conditions, health and safety, the trade union rights of employees and the right to collective bargaining. All forms of violations of human rights are taken very seriously and dealt with in the same man-ner as other suspected violations of SCA’s Code of Conduct. SCA has been a member of the UN Global Compact since 2008. Risks linked to human rights have primarily been identified in business relationships, health and safety and the use of land, refer to the section on risks in the Board of Directors’ Report.
Business ethicsSCA bases its business activities on honesty, integrity and responsible business practices. The company must comply with applicable laws, regulations and SCA policies and instructions. Bribery and any other form of corrupt business practice are strictly prohibited. Neither SCA nor anyone acting on SCA’s be-half may authorize, offer or make available any payments, gifts or other benefits that could affect or appear to affect objectivity in business decisions or the actions of a government official. All financial information must be accurately reported in a non-mis-leading manner in accordance with SCA’s accounting practices.
Anti-corruptionAnti-corruption is included in SCA’s Code of Conduct. SCA must conduct all activities in accordance with applicable laws and regulations, and all corrupt activity is strictly prohibited. SCA’s instructions for anti-corruption establish rules to prevent anti-corruption in all Group operations regardless of country. The Group does not tolerate any form of corruption or bribery.
All of SCA’s employees are trained in the Group’s Code of Conduct, which includes a section dealing with business ethics. Employees in a senior position and/or with external contacts are given additional training in anti-corruption. The target group comprises about 1,000 employees. Management teams and other relevant individuals also receive training on these issues in conjunction with mini-seminars.
Anti-trustSCA endeavors to comply with competition laws and to combat anti-trust, price fixing, the carving up of customers or geo-graphic markets, bid rigging or abuse of a dominant position.
SC
A A
NN
UA
L R
EP
OR
T 2
01
8SUSTAINABILITY FACTS
128

SCA has established programs to increase knowledge among employees of competition law. The target group for the program is employees with market-related contact with competitors and includes about 270 employees. Moreover, seminars are held on a continuous basis with this target group that includes anti-cor-ruption updates. In 2018, about 120 people took part in training seminars.
Whistleblower systemEvery employee can report suspected violations of the Code of Conduct. The violation can be reported to a line manager, human resources manager, legal counsel or union representa-tive. There is also a whistleblower function available at sca.com which is also open to individuals who do not work at SCA. The complaints, which may be submitted anonymously, are inves-tigated confidentially, promptly and professionally by specially appointed investigators taking into account current personal data legislation. Complaints covered by the whistleblower system and other cases of suspected violation of the Code of Conduct are managed in accordance with SCA’s procedures.
Even if an allegation cannot be substantiated, preventive actions may be implemented. The scope, outcome and actions taken concerning reported cases are followed up by SCA’s Compliance Council, which is headed by the Group’s Sustainability Director.
Compliance with the Code of Conduct and legislation (reported cases within SCA in 2018)SCA uses a number of methods to safeguard compliance with prevailing law and the company’s Code of Conduct. These include due diligence in connection with acquisitions, risk evaluation, on-site audits of SCA’s units and activities within the company’s internal control.
Code of ConductIn 2018, 8 (9) cases of potential breaches of the Code of Conduct were reported and investigated, and concerned suspicions of theft/fraud, shortcomings in health and safety, and incidents connected with behavior and attitudes. No inquiries were on-going at the end of the year.
During the year, 0 (0) breaches of anti-corruption or competition law were reported. There are no ongoing cases from previous years.
Health and safetySerious workplace accidents and health and safety incidents are reported to the relevant authority in accordance with current regulatory requirements. In those cases when the authority considers that an error was made, a case may be submitted to the public prosecutor for review. In 2018, 0 (0) incidents resulted in the public prosecutor initiating legal proceedings or issuing a punishment order. From previous years, one incident resulted in the issue of a punishment order and corporate fine in 2018.
All employees are encouraged and have the opportunity to report incidents and risk observations that could result in work environment risks. The reports are incorporated in efforts to achieve continuous improvements.
Environmental views from local residents and authoritiesIt is important to engage in active dialogue with communities that can be affected by SCA’s operations. This is part of the Group’s stakeholder dialogues and encompasses the entire Group’s operations, refer to the Stakeholder dialogues section. Dialogue may, for example, be conducted as public meetings or be based on opinions received. All environmental remarks are investigated in accordance to SCA’s procedures and measures are taken where possible. In 2018, 124 (150) remarks were registered. These remarks most often concern noise, odors, emissions to sur-rounding areas or our forest operations. Employees also have the opportunity to report incidents that could impact the environment. The reports are incorporated in efforts to achieve continuous improvements.
SCA’s operations have been granted permits by the authorities. These permits are associated with a number of environmen-tal conditions that must be complied with. The authorities are informed in the event of exceedances. Corrective action is taken both urgently and in the longer term to reduce environmental impact. During 2018, 27 (13) environmental matters were dealt with by the authorities, of which most are related to the expan-sion of the Östrand pulp mill. None of these matters resulted in penalties in 2018.
SUSTAINABILITY FACTSS
CA
AN
NU
AL
RE
PO
RT
20
18
Introduction Strategy & operations Board of Directors’ Report Financial statements Sustainability facts Other
129
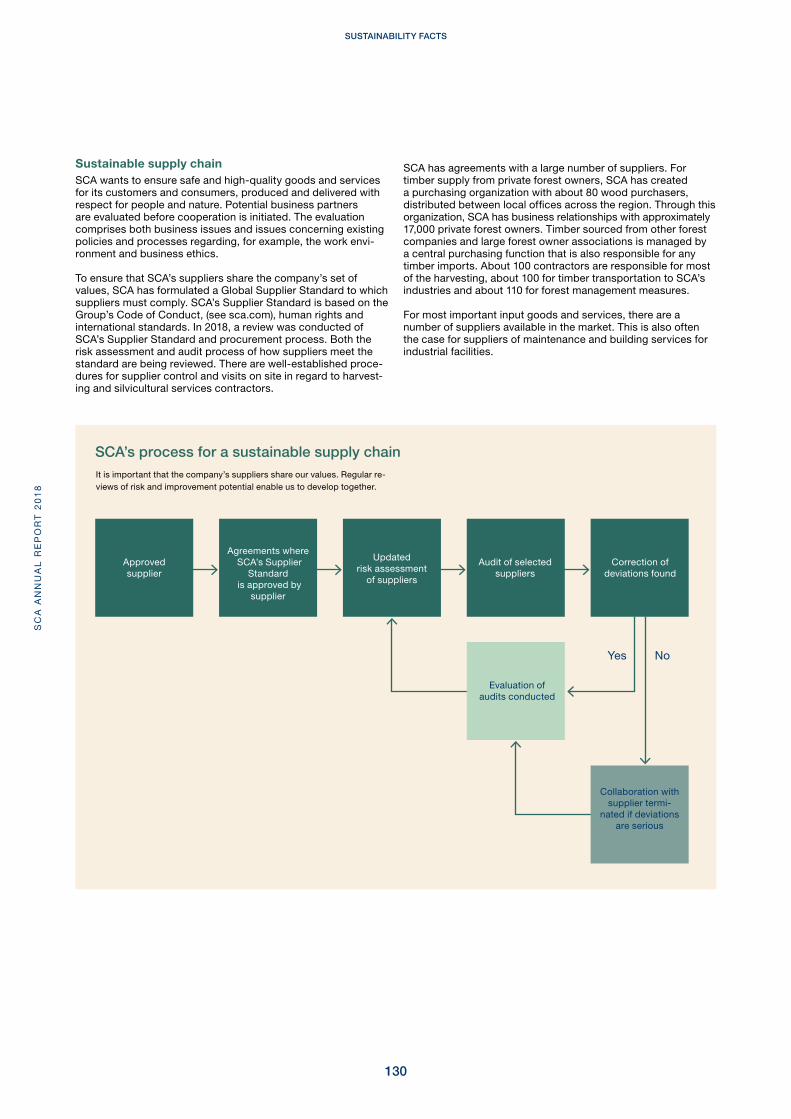
SCA’s process for a sustainable supply chain
Collaboration with supplier termi-
nated if deviations are serious
Evaluation of audits conducted
No
Correction of deviations found
Audit of selected suppliers
Updatedrisk assessment
of suppliers
Agreements where SCA’s Supplier
Standard is approved by
supplier
Approved supplier
Sustainable supply chainSCA wants to ensure safe and high-quality goods and services for its customers and consumers, produced and delivered with respect for people and nature. Potential business partners are evaluated before cooperation is initiated. The evaluation comprises both business issues and issues concerning existing policies and processes regarding, for example, the work envi-ronment and business ethics.
To ensure that SCA’s suppliers share the company’s set of values, SCA has formulated a Global Supplier Standard to which suppliers must comply. SCA’s Supplier Standard is based on the Group’s Code of Conduct, (see sca.com), human rights and international standards. In 2018, a review was conducted of SCA’s Supplier Standard and procurement process. Both the risk assessment and audit process of how suppliers meet the standard are being reviewed. There are well-established proce-dures for supplier control and visits on site in regard to harvest-ing and silvicultural services contractors.
SCA has agreements with a large number of suppliers. For timber supply from private forest owners, SCA has created a purchasing organization with about 80 wood purchasers, distributed between local offices across the region. Through this organization, SCA has business relationships with approximately 17,000 private forest owners. Timber sourced from other forest companies and large forest owner associations is managed by a central purchasing function that is also responsible for any timber imports. About 100 contractors are responsible for most of the harvesting, about 100 for timber transportation to SCA’s industries and about 110 for forest management measures.
For most important input goods and services, there are a number of suppliers available in the market. This is also often the case for suppliers of maintenance and building services for industrial facilities.
It is important that the company’s suppliers share our values. Regular re-views of risk and improvement potential enable us to develop together.
Yes
SC
A A
NN
UA
L R
EP
OR
T 2
01
8SUSTAINABILITY FACTS
130
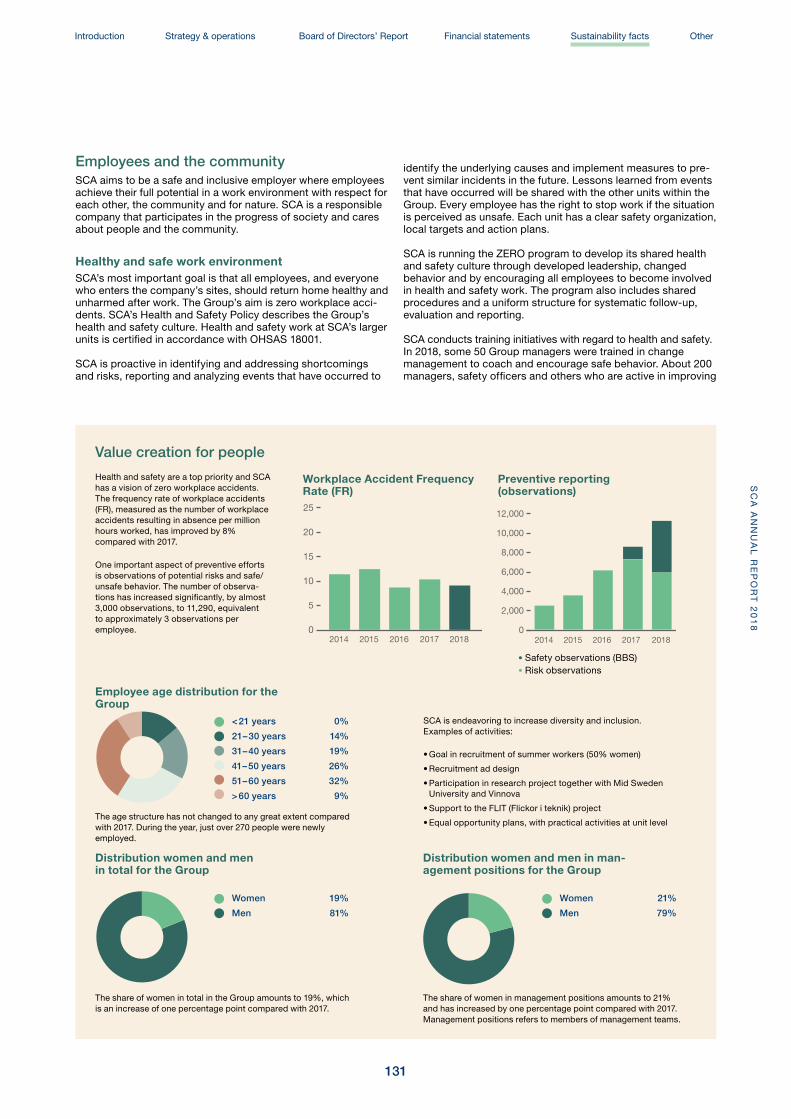
Value creation for people
Workplace Accident Frequency Rate (FR)
Preventive reporting (observations)
2014 2015 2016 2017 20180
5
10
15
20
25
0
2,000
4,000
6,000
8,000
10,000
12,000
2014 2015 2016 2017 2018
Employee age distribution for the Group
< 21 years 0%
21 – 30 years 14%
31 – 40 years 19%
41 – 50 years 26%
51 – 60 years 32%
> 60 years 9%
Distribution women and men in total for the Group
Women 19%
Men 81%
Distribution women and men in man-agement positions for the Group
Women 21%
Men 79%
Health and safety are a top priority and SCA has a vision of zero workplace accidents. The frequency rate of workplace accidents (FR), measured as the number of workplace accidents resulting in absence per million hours worked, has improved by 8% compared with 2017.
One important aspect of preventive efforts is observations of potential risks and safe/unsafe behavior. The number of observa-tions has increased significantly, by almost 3,000 observations, to 11,290, equivalent to approximately 3 observations per employee.
The age structure has not changed to any great extent compared with 2017. During the year, just over 270 people were newly employed.
The share of women in total in the Group amounts to 19%, which is an increase of one percentage point compared with 2017.
The share of women in management positions amounts to 21% and has increased by one percentage point compared with 2017. Management positions refers to members of management teams.
SCA is endeavoring to increase diversity and inclusion. Examples of activities:
• Goal in recruitment of summer workers (50% women)
• Recruitment ad design
• Participation in research project together with Mid Sweden University and Vinnova
• Support to the FLIT (Flickor i teknik) project
• Equal opportunity plans, with practical activities at unit level
Employees and the communitySCA aims to be a safe and inclusive employer where employees achieve their full potential in a work environment with respect for each other, the community and for nature. SCA is a responsible company that participates in the progress of society and cares about people and the community.
Healthy and safe work environmentSCA’s most important goal is that all employees, and everyone who enters the company’s sites, should return home healthy and unharmed after work. The Group’s aim is zero workplace acci-dents. SCA’s Health and Safety Policy describes the Group’s health and safety culture. Health and safety work at SCA’s larger units is certified in accordance with OHSAS 18001.
SCA is proactive in identifying and addressing shortcomings and risks, reporting and analyzing events that have occurred to
identify the underlying causes and implement measures to pre-vent similar incidents in the future. Lessons learned from events that have occurred will be shared with the other units within the Group. Every employee has the right to stop work if the situation is perceived as unsafe. Each unit has a clear safety organization, local targets and action plans.
SCA is running the ZERO program to develop its shared health and safety culture through developed leadership, changed behavior and by encouraging all employees to become involved in health and safety work. The program also includes shared procedures and a uniform structure for systematic follow-up, evaluation and reporting.
SCA conducts training initiatives with regard to health and safety. In 2018, some 50 Group managers were trained in change management to coach and encourage safe behavior. About 200 managers, safety officers and others who are active in improving
• Risk observations• Safety observations (BBS)
SUSTAINABILITY FACTSS
CA
AN
NU
AL
RE
PO
RT
20
18
Introduction Strategy & operations Board of Directors’ Report Financial statements Sustainability facts Other
131

Examples of SCA’s community engagement
Community engagement
the work environment received training to create a better work environment (BAM) and almost 400 employees received training in behavior-based safety, a methodical and simple approach to alert each other to work safely. There are also local initiatives that promote healthy living and a safe work environment.
All SCA employees have access to occupational health services that provide work-related health services and proactive work in health and well-being. The occupational health service provider works on a strictly confidential basis and also conducts random drug tests. SCA’s occupational health services have held a number of preventive stress management courses with the aim of providing participants greater knowledge of stress management, sleep, self-esteem, diet and exercise as well as work-life balance.
In 2018, 60 (65) workplace accidents took place resulting in ab-sence, which is a reduction of 8% compared with last year. The most common causes of accidents, which also resulted in the longest absence, were crushing, tripping and falling accidents.
The number of days of absence due to workplace accidents has risen from 10 to 17 days per accident in 2018. A small number of accidents resulted in longer absence but most accidents resulted in less than one week of absence. The number of risk observations has more than doubled since the ZERO program began. In 2018, 11,290 risk and behavior-based safety observations were reported.
Employee relationsEmployees have representatives on the Board and in various networking groups to work together with the company to im-prove and develop operations. In the event of major changes, an impact assessment is performed.
All Employee Surveys, where employees can take part, are held regularly. Action plans are drawn up based on the results of these surveys to develop SCA. More than 90% of employees responded in this year’s survey. The results indicated good team work and commitment as well as positive progress for leader-ship and work environment.
All employees in Sweden, with the exception of the Executive Management Team, are covered by collective agreements. The percentage for the Group as a whole is 89%.
Employeeship and leadershipSCA strives to offer every employee an opportunity to develop to their full potential and to work in an atmosphere of respect and trust. All employees are given annual target and perfor-mance management reviews to follow up performance and job satisfaction, define areas for improvement and personal targets. All new employees are given introductory training and have a personalized introductory plan.
All managers take part in a one-day introduction to SCA’s leadership platform that also encompasses SCA’s strategy and the company’s expectations for its leaders. 37 new managers completed the course in 2018. In addition, a number of manage-ment training courses are held, including basic leadership and change management.
Diversity and inclusive cultureSCA stands up for the equal value of every person and respect for each other. It fosters cooperation and allows us to develop, as people and as a company. The principles for the company’s work in the field are detailed in SCA’s HR Policy and procedures for victimization.
The equal opportunity plans, which include practical activities at unit level, are prepared and followed up on an annual basis. To
increase diversity, the company works, for example, to broaden its recruitment base by changing the style of its recruitment ads, a Group-wide recruitment function and through interaction with the educational system. In 2018, the Forest business area conducted a major gender equality initiative that encompassed management and employee training and meetings with students in higher education specializing in forestry. Sawmills targeted to recruit an equal number of women as men as summer temps, which some units achieved.
Competence supply and educationThe need for training is identified based on the needs of the unit and the individual to meet future challenges in the best way possible. SCA offers continuing training according to the 70-20-10 model, meaning respectively practical training in the work situation, coaching and formal education. The training courses are conducted, for example, in leadership, work environ-ment, business ethics and in specific competencies. SCA also takes part in the development of training courses in professions with a shortage of labor, such as machine operators. Further-more, SCA offers practical workplace experience and summer jobs in offices, industrial plants, nurseries and in forest opera-tions. This provides a good and important base for SCA’s supply of skilled employees, at the same time as young people are offered important work experience. In 2018, 406 young people had summer jobs at SCA.
SCA collaborates with schools in order to secure the industry’s attractiveness and the long-term supply of competent employ-ees. SCA participates in the Skogen i Skolan program, which aims to increase knowledge and awareness of the forest and forest industry among students and teachers, “Tekniksprånget,” a nationwide placement program for senior high school students who studied natural sciences and technology programs to increase interest in pursuing the engineering profession and “Jobbsprånget” to help newly arrived academics to enter the labor market.
• Coaching of forest contractors to establish and run their own companies, often in rural areas
• Supporting innovative capacity and entrepreneurship through involvement in initiatives including BizMaker in Sundsvall, Junior Achievement Sweden and other regional development centers
• Tekniksprånget and Teknikcollege, to strengthen interest in science and engineering educations among young people. The projects; FLIT (Flickor i Teknik) and Geek Girls to stimulate an interest in technology among girls
• Supporting associations and local community engage-ment in sport, culture and other areas
• Participation at national, regional and local levels in Skogen i skolan (The forest in school) to spread awareness of, and interest in, career prospects offered by the forest industry.
• SCA’s conservation parks. Large sections of the landscape managed in a way that promotes nature conservation and cultural values
SC
A A
NN
UA
L R
EP
OR
T 2
01
8SUSTAINABILITY FACTS
132
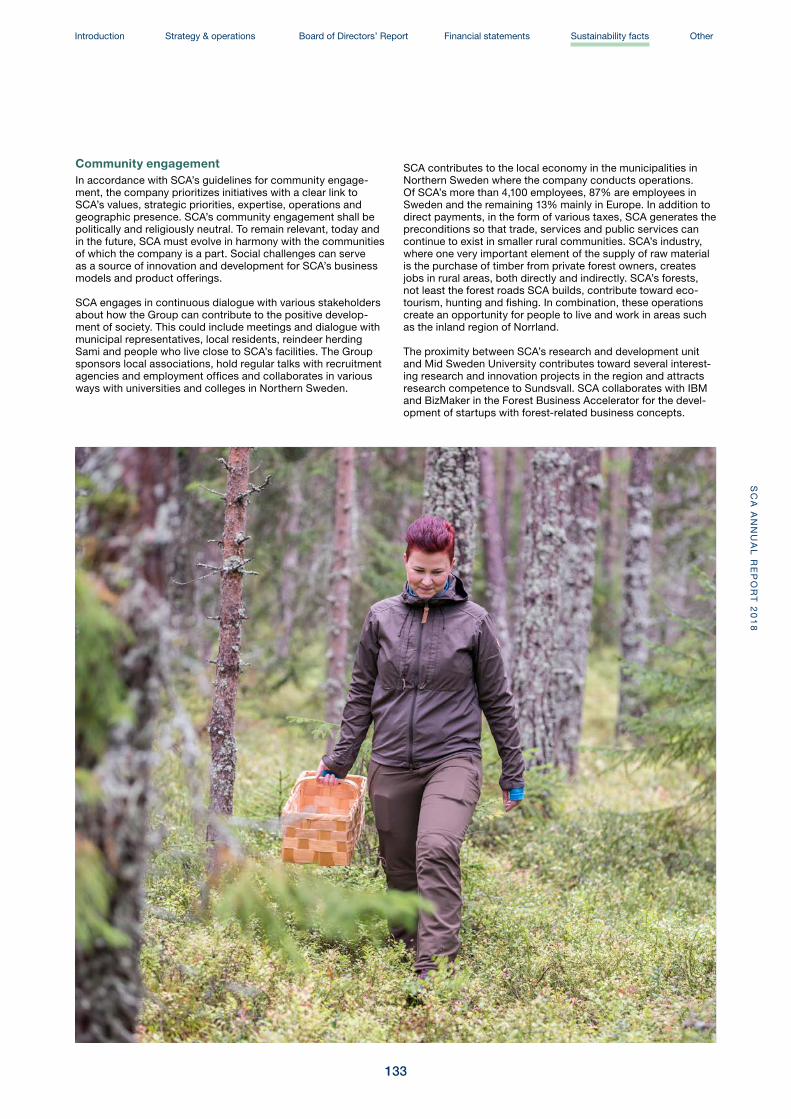
Community engagementIn accordance with SCA’s guidelines for community engage-ment, the company prioritizes initiatives with a clear link to SCA’s values, strategic priorities, expertise, operations and geographic presence. SCA’s community engagement shall be politically and religiously neutral. To remain relevant, today and in the future, SCA must evolve in harmony with the communities of which the company is a part. Social challenges can serve as a source of innovation and development for SCA’s business models and product offerings.
SCA engages in continuous dialogue with various stakeholders about how the Group can contribute to the positive develop-ment of society. This could include meetings and dialogue with municipal representatives, local residents, reindeer herding Sami and people who live close to SCA’s facilities. The Group sponsors local associations, hold regular talks with recruitment agencies and employment offices and collaborates in various ways with universities and colleges in Northern Sweden.
SCA contributes to the local economy in the municipalities in Northern Sweden where the company conducts operations. Of SCA’s more than 4,100 employees, 87% are employees in Sweden and the remaining 13% mainly in Europe. In addition to direct payments, in the form of various taxes, SCA generates the preconditions so that trade, services and public services can continue to exist in smaller rural communities. SCA’s industry, where one very important element of the supply of raw material is the purchase of timber from private forest owners, creates jobs in rural areas, both directly and indirectly. SCA’s forests, not least the forest roads SCA builds, contribute toward eco-tourism, hunting and fishing. In combination, these operations create an opportunity for people to live and work in areas such as the inland region of Norrland.
The proximity between SCA’s research and development unit and Mid Sweden University contributes toward several interest-ing research and innovation projects in the region and attracts research competence to Sundsvall. SCA collaborates with IBM and BizMaker in the Forest Business Accelerator for the devel-opment of startups with forest-related business concepts.
SUSTAINABILITY FACTSS
CA
AN
NU
AL
RE
PO
RT
20
18
Introduction Strategy & operations Board of Directors’ Report Financial statements Sustainability facts Other
133
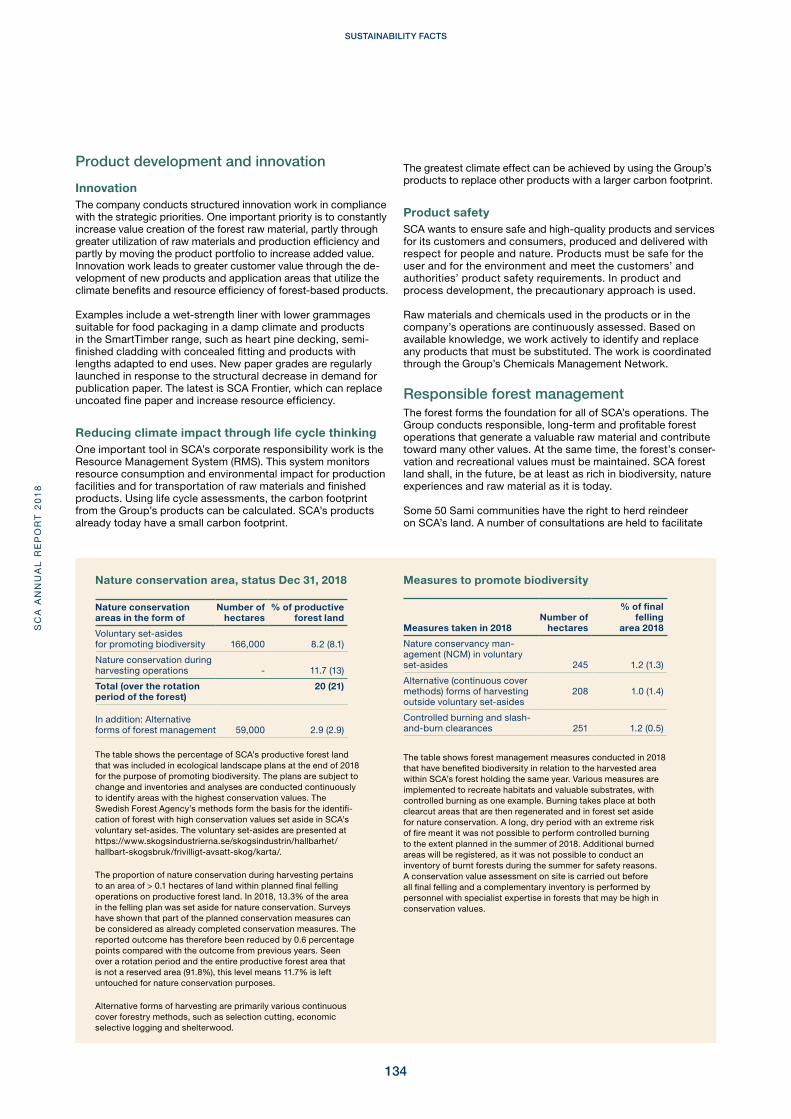
Product development and innovation
InnovationThe company conducts structured innovation work in compliance with the strategic priorities. One important priority is to constantly increase value creation of the forest raw material, partly through greater utilization of raw materials and production efficiency and partly by moving the product portfolio to increase added value. Innovation work leads to greater customer value through the de-velopment of new products and application areas that utilize the climate benefits and resource efficiency of forest-based products.
Examples include a wet-strength liner with lower grammages suitable for food packaging in a damp climate and products in the SmartTimber range, such as heart pine decking, semi- finished cladding with concealed fitting and products with lengths adapted to end uses. New paper grades are regularly launched in response to the structural decrease in demand for publication paper. The latest is SCA Frontier, which can replace uncoated fine paper and increase resource efficiency.
Reducing climate impact through life cycle thinking One important tool in SCA’s corporate responsibility work is the Resource Management System (RMS). This system monitors resource consumption and environmental impact for production facilities and for transportation of raw materials and finished products. Using life cycle assessments, the carbon footprint from the Group’s products can be calculated. SCA’s products already today have a small carbon footprint.
The greatest climate effect can be achieved by using the Group’s products to replace other products with a larger carbon footprint.
Product safetySCA wants to ensure safe and high-quality products and services for its customers and consumers, produced and delivered with respect for people and nature. Products must be safe for the user and for the environment and meet the customers’ and authorities’ product safety requirements. In product and process development, the precautionary approach is used.
Raw materials and chemicals used in the products or in the company’s operations are continuously assessed. Based on available knowledge, we work actively to identify and replace any products that must be substituted. The work is coordinated through the Group’s Chemicals Management Network.
Responsible forest managementThe forest forms the foundation for all of SCA’s operations. The Group conducts responsible, long-term and profitable forest operations that generate a valuable raw material and contribute toward many other values. At the same time, the forest’s conser-vation and recreational values must be maintained. SCA forest land shall, in the future, be at least as rich in biodiversity, nature experiences and raw material as it is today.
Some 50 Sami communities have the right to herd reindeer on SCA’s land. A number of consultations are held to facilitate
Nature conservation area, status Dec 31, 2018
Nature conservation areas in the form of
Number of hectares
% of productive forest land
Voluntary set-asidesfor promoting biodiversity 166,000 8.2 (8.1)
Nature conservation during harvesting operations - 11.7 (13)
Total (over the rotation period of the forest)
20 (21)
In addition: Alternative forms of forest management 59,000 2.9 (2.9)
The table shows the percentage of SCA’s productive forest land that was included in ecological landscape plans at the end of 2018 for the purpose of promoting biodiversity. The plans are subject to change and inventories and analyses are conducted continuously to identify areas with the highest conservation values. The Swedish Forest Agency’s methods form the basis for the identifi-cation of forest with high conservation values set aside in SCA’s voluntary set-asides. The voluntary set-asides are presented at https://www.skogsindustrierna.se/skogsindustrin/hallbarhet/hallbart-skogsbruk/frivilligt-avsatt-skog/karta/.
The proportion of nature conservation during harvesting pertains to an area of > 0.1 hectares of land within planned final felling operations on productive forest land. In 2018, 13.3% of the area in the felling plan was set aside for nature conservation. Surveys have shown that part of the planned conservation measures can be considered as already completed conservation measures. The reported outcome has therefore been reduced by 0.6 percentage points compared with the outcome from previous years. Seen over a rotation period and the entire productive forest area that is not a reserved area (91.8%), this level means 11.7% is left untouched for nature conservation purposes.
Alternative forms of harvesting are primarily various continuous cover forestry methods, such as selection cutting, economic selective logging and shelterwood.
Measures to promote biodiversity
Measures taken in 2018Number of
hectares
% of final felling
area 2018
Nature conservancy man-agement (NCM) in voluntary set-asides 245 1.2 (1.3)
Alternative (continuous cover methods) forms of harvesting outside voluntary set-asides
208 1.0 (1.4)
Controlled burning and slash-and-burn clearances 251 1.2 (0.5)
The table shows forest management measures conducted in 2018 that have benefited biodiversity in relation to the harvested area within SCA’s forest holding the same year. Various measures are implemented to recreate habitats and valuable substrates, with controlled burning as one example. Burning takes place at both clearcut areas that are then regenerated and in forest set aside for nature conservation. A long, dry period with an extreme risk of fire meant it was not possible to perform controlled burning to the extent planned in the summer of 2018. Additional burned areas will be registered, as it was not possible to conduct an inventory of burnt forests during the summer for safety reasons. A conservation value assessment on site is carried out before all final felling and a complementary inventory is performed by personnel with specialist expertise in forests that may be high in conservation values.
SC
A A
NN
UA
L R
EP
OR
T 2
01
8SUSTAINABILITY FACTS
134

SCA’s timber unit is responsible for sourcing all wood raw material to our wood, pulp and paper products. This raw material sourcing is third-party certified according to PEFC and FSC CoC. The largest amount of raw material is derived from certified forest operations. All raw material from the company’s own forests is included in this share. The remaining volumes are from raw material that fulfills FSC CW, of which one quarter is from felling where the proportion of for-est set aside for nature conservation is higher than that required by Swedish law. SCA encourages its external suppliers to certify their forest operations to increase access to certified raw materials.
SCA’s production facilities used 9.6 million cubic meters of wood raw material in 2018. Almost all of the raw material flow (more than 93%) was from Sweden. The remaining raw material was from Finland, Norway and the Baltic States (6%), and from Poland, Scotland and Spain (1%).
cooperation and understanding of each other's needs, and cover issues such as the time for harvesting, site preparation, fertilization and choice of tree species when planting new forest. In 2018, 69 consultation meetings took place with 30 Sami communities and approximately 6,100 forest compartments were discussed.
Forest processes are long. It takes almost a century for a planted tree to become mature enough for harvesting and many natural processes take even longer. SCA’s forest management planning therefore extends across more than 100 years and for each tree harvested, at least two new trees are planted. During the year, SCA’s nurseries delivered about 82 million seedlings, of which 36 million were planted in SCA’s own forests. The forest contrib-utes to biodiversity while also providing a source for nature experiences and recreation. Hunting is also an important measure, for example in reducing grazing damage to trees caused by moose. Read more about how SCA conducts responsible forestry at sca.com.
BiodiversityThe preservation of biodiversity in the Group’s forests is the most important environmental target in the management of SCA’s forests. Areas that provide vital habitats for sensitive flora and fauna are excluded from forest management through volun-tary set-asides or using alternative forms of forest management that promote biodiversity. SCA also takes extensive conser-vation measures in managing forest areas that do not contain any particular conservation value. Productive forest land is therefore set aside from harvesting in our ecological landscape plans, which SCA has developed for its entire forest holding. In 2018, this voluntary allocation amounted to 8% of productive forest land. In 2018, an additional 12% of productive forest land planned for harvesting was set aside.
SCA also carries out targeted preservation measures for threatened species. For example, SCA has planted pasque-flowers, restored wetlands and creted butterfly parks to protect the two endangered species Baptria tibiale and Lycaena helle.
Responsible fiber acquisition
Certified forest management 61%
FSC CW 29%
Greater conservation 10% consideration than required by Swedish law
60 %of growth is harvested. Harvesting is lower than
forest growth
4 MtCO2 is captured net every
year in SCA's forest, equiva-lent to about 8% of Sweden’s
fossil emissions
36×106seedlings planted in our own forest. For every tree that is
harvested, more than two new trees are planted
17,000private forest owners
have business relationships with SCA
The company has also established five conservation parks that encompass more than 10,000 hectares of forest land, where at least half of the land is earmarked or managed in a manner that promotes nature and cultural heritage. SCA uses the knowledge it gains in these parks in its other forest operations.
SUSTAINABILITY FACTS Introduction Strategy & operations Board of Directors’ Report Financial statements Sustainability facts Other
135
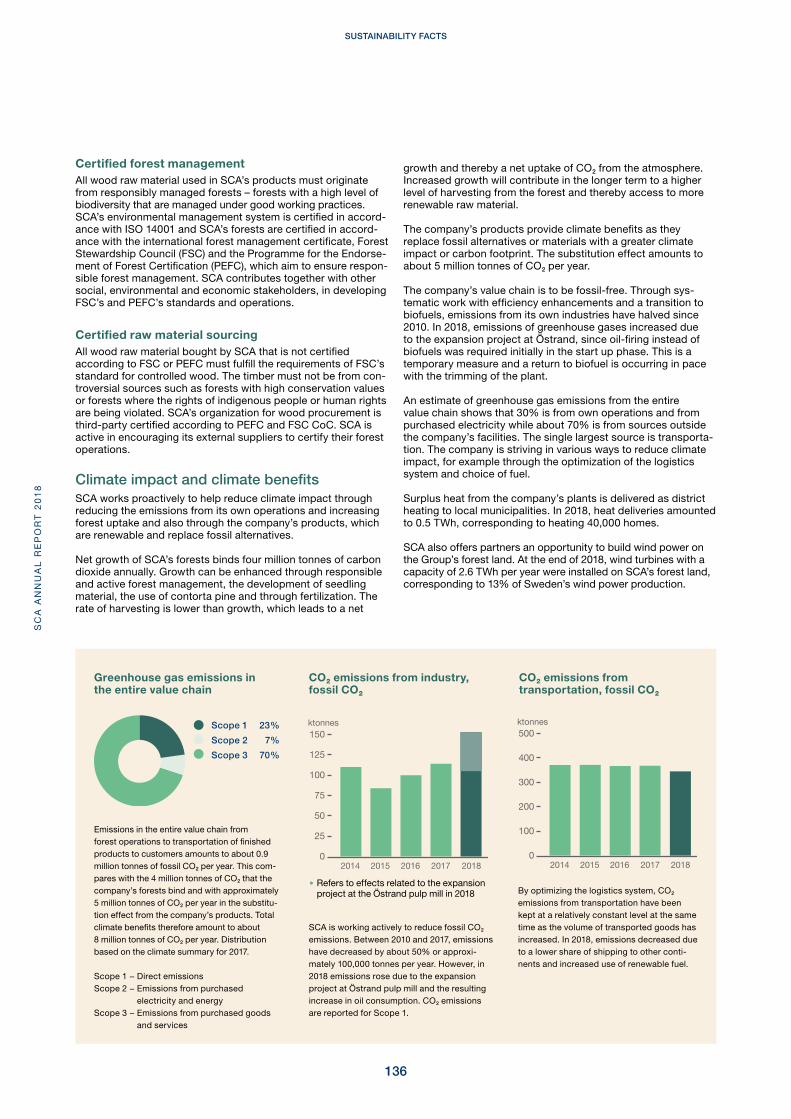
Certified forest managementAll wood raw material used in SCA’s products must originate from responsibly managed forests – forests with a high level of biodiversity that are managed under good working practices. SCA’s environmental management system is certified in accordance with ISO 14001 and SCA’s forests are certified in accordance with the international forest management certificate, Forest Stewardship Council (FSC) and the Programme for the Endorsement of Forest Certification (PEFC), which aim to ensure responsible forest management. SCA contributes together with other social, environmental and economic stakeholders, in developing FSC’s and PEFC’s standards and operations.
Certified raw material sourcingAll wood raw material bought by SCA that is not certified according to FSC or PEFC must fulfill the requirements of FSC’s standard for controlled wood. The timber must not be from controversial sources such as forests with high conservation values or forests where the rights of indigenous people or human rights are being violated. SCA’s organization for wood procurement is thirdparty certified according to PEFC and FSC CoC. SCA is active in encouraging its external suppliers to certify their forest operations.
Climate impact and climate benefitsSCA works proactively to help reduce climate impact through reducing the emissions from its own operations and increasing forest uptake and also through the company’s products, which are renewable and replace fossil alternatives.
Net growth of SCA’s forests binds four million tonnes of carbon dioxide annually. Growth can be enhanced through responsible and active forest management, the development of seedling material, the use of contorta pine and through fertilization. The rate of harvesting is lower than growth, which leads to a net
growth and thereby a net uptake of CO2 from the atmosphere. Increased growth will contribute in the longer term to a higher level of harvesting from the forest and thereby access to more renewable raw material.
The company’s products provide climate benefits as they replace fossil alternatives or materials with a greater climate impact or carbon footprint. The substitution effect amounts to about 5 million tonnes of CO2 per year.
The company’s value chain is to be fossilfree. Through systematic work with efficiency enhancements and a transition to biofuels, emissions from its own industries have halved since 2010. In 2018, emissions of greenhouse gases increased due to the expansion project at Östrand, since oilfiring instead of biofuels was required initially in the start up phase. This is a temporary measure and a return to biofuel is occurring in pace with the trimming of the plant.
An estimate of greenhouse gas emissions from the entire value chain shows that 30% is from own operations and from purchased electricity while about 70% is from sources outside the company’s facilities. The single largest source is transportation. The company is striving in various ways to reduce climate impact, for example through the optimization of the logistics system and choice of fuel.
Surplus heat from the company’s plants is delivered as district heating to local municipalities. In 2018, heat deliveries amounted to 0.5 TWh, corresponding to heating 40,000 homes.
SCA also offers partners an opportunity to build wind power on the Group’s forest land. At the end of 2018, wind turbines with a capacity of 2.6 TWh per year were installed on SCA’s forest land, corresponding to 13% of Sweden’s wind power production.
CO2 emissions from industry, fossil CO2
2014 2015 2016 2017 20180
25
50
75
100
125
150ktonnes
2014 2015 2016 2017 20180
100
200
300
400
500ktonnes
SCA is working actively to reduce fossil CO2 emissions. Between 2010 and 2017, emissions have decreased by about 50% or approximately 100,000 tonnes per year. However, in 2018 emissions rose due to the expansion project at Östrand pulp mill and the resulting increase in oil consumption. CO2 emissions are reported for Scope 1.
CO2 emissions from transportation, fossil CO2
By optimizing the logistics system, CO2 emissions from transportation have been kept at a relatively constant level at the same time as the volume of transported goods has increased. In 2018, emissions decreased due to a lower share of shipping to other continents and increased use of renewable fuel.
Greenhouse gas emissions in the entire value chain
Emissions in the entire value chain from forest operations to transportation of finished products to customers amounts to about 0.9 million tonnes of fossil CO2 per year. This compares with the 4 million tonnes of CO2 that the company’s forests bind and with approximately 5 million tonnes of CO2 per year in the substitution effect from the company’s products. Total climate benefits therefore amount to about 8 million tonnes of CO2 per year. Distribution based on the climate summary for 2017.
Scope 1 − Direct emissions Scope 2 − Emissions from purchased
electricity and energyScope 3 − Emissions from purchased goods
and services
Scope 1 23 %
Scope 2 7%
Scope 3 70 %
• Refers to effects related to the expansion project at the Östrand pulp mill in 2018
SC
A A
NN
UA
L R
EP
OR
T 2
01
8SUSTAINABILITY FACTS
136
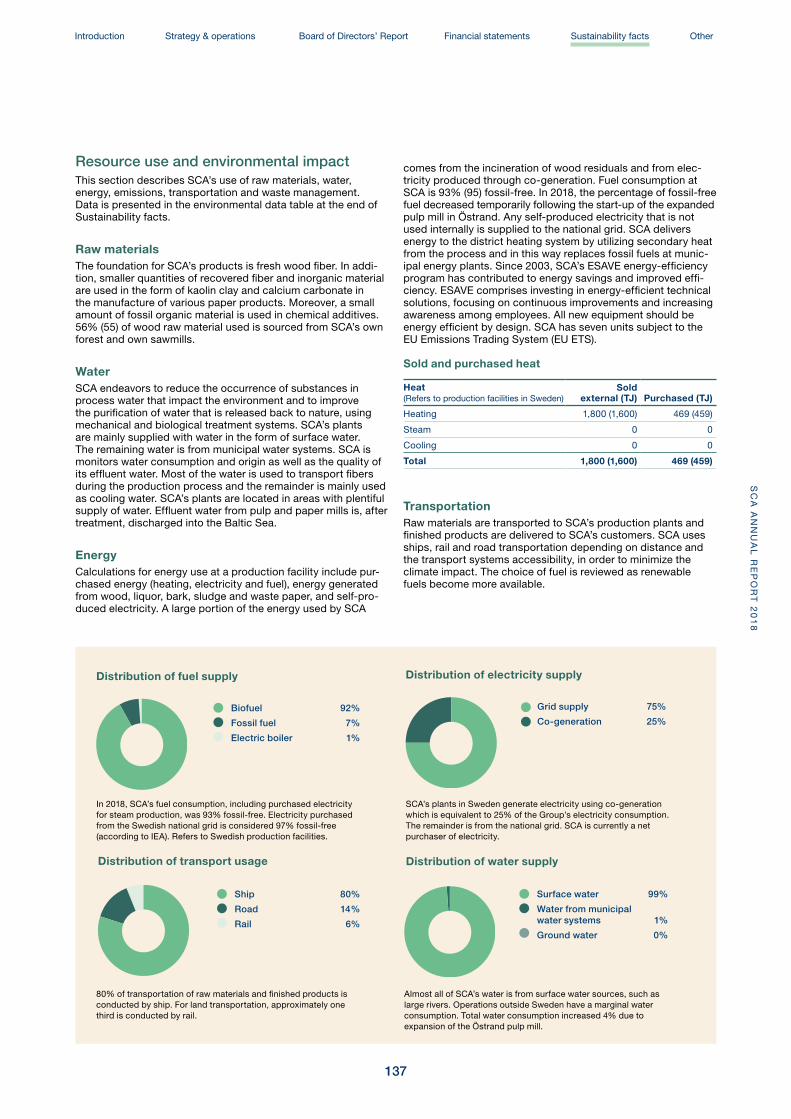
Distribution of transport usage
Ship 80%
Road 14 %
Rail 6%
80% of transportation of raw materials and finished products is conducted by ship. For land transportation, approximately one third is conducted by rail.
Distribution of fuel supply
Biofuel 92%
Fossil fuel 7%
Electric boiler 1%
In 2018, SCA’s fuel consumption, including purchased electricity for steam production, was 93% fossil-free. Electricity purchased from the Swedish national grid is considered 97% fossil-free (according to IEA). Refers to Swedish production facilities.
Distribution of water supply
Surface water 99%
Water from municipal water systems 1%
Ground water 0%
Almost all of SCA’s water is from surface water sources, such as large rivers. Operations outside Sweden have a marginal water consumption. Total water consumption increased 4% due to expansion of the Östrand pulp mill.
Distribution of electricity supply
Grid supply 75%
Co-generation 25%
SCA’s plants in Sweden generate electricity using co-generation which is equivalent to 25% of the Group’s electricity consumption. The remainder is from the national grid. SCA is currently a net purchaser of electricity.
Resource use and environmental impactThis section describes SCA’s use of raw materials, water, energy, emissions, transportation and waste management. Data is presented in the environmental data table at the end of Sustainability facts.
Raw materialsThe foundation for SCA’s products is fresh wood fiber. In addi-tion, smaller quantities of recovered fiber and inorganic material are used in the form of kaolin clay and calcium carbonate in the manufacture of various paper products. Moreover, a small amount of fossil organic material is used in chemical additives. 56% (55) of wood raw material used is sourced from SCA’s own forest and own sawmills.
WaterSCA endeavors to reduce the occurrence of substances in process water that impact the environment and to improve the purification of water that is released back to nature, using mechanical and biological treatment systems. SCA’s plants are mainly supplied with water in the form of surface water. The remaining water is from municipal water systems. SCA is monitors water consumption and origin as well as the quality of its effluent water. Most of the water is used to transport fibers during the production process and the remainder is mainly used as cooling water. SCA’s plants are located in areas with plentiful supply of water. Effluent water from pulp and paper mills is, after treatment, discharged into the Baltic Sea.
EnergyCalculations for energy use at a production facility include pur-chased energy (heating, electricity and fuel), energy generated from wood, liquor, bark, sludge and waste paper, and self-pro-duced electricity. A large portion of the energy used by SCA
comes from the incineration of wood residuals and from elec-tricity produced through co-generation. Fuel consumption at SCA is 93% (95) fossil-free. In 2018, the percentage of fossil-free fuel decreased temporarily following the start-up of the expanded pulp mill in Östrand. Any self-produced electricity that is not used internally is supplied to the national grid. SCA delivers energy to the district heating system by utilizing secondary heat from the process and in this way replaces fossil fuels at munic-ipal energy plants. Since 2003, SCA’s ESAVE energy-efficiency program has contributed to energy savings and improved effi-ciency. ESAVE comprises investing in energy-efficient technical solutions, focusing on continuous improvements and increasing awareness among employees. All new equipment should be energy efficient by design. SCA has seven units subject to the EU Emissions Trading System (EU ETS).
Sold and purchased heat
Heat(Refers to production facilities in Sweden)
Sold external (TJ) Purchased (TJ)
Heating 1,800 (1,600) 469 (459)
Steam 0 0
Cooling 0 0
Total 1,800 (1,600) 469 (459)
TransportationRaw materials are transported to SCA’s production plants and finished products are delivered to SCA’s customers. SCA uses ships, rail and road transportation depending on distance and the transport systems accessibility, in order to minimize the climate impact. The choice of fuel is reviewed as renewable fuels become more available.
SUSTAINABILITY FACTSS
CA
AN
NU
AL
RE
PO
RT
20
18
Introduction Strategy & operations Board of Directors’ Report Financial statements Sustainability facts Other
137
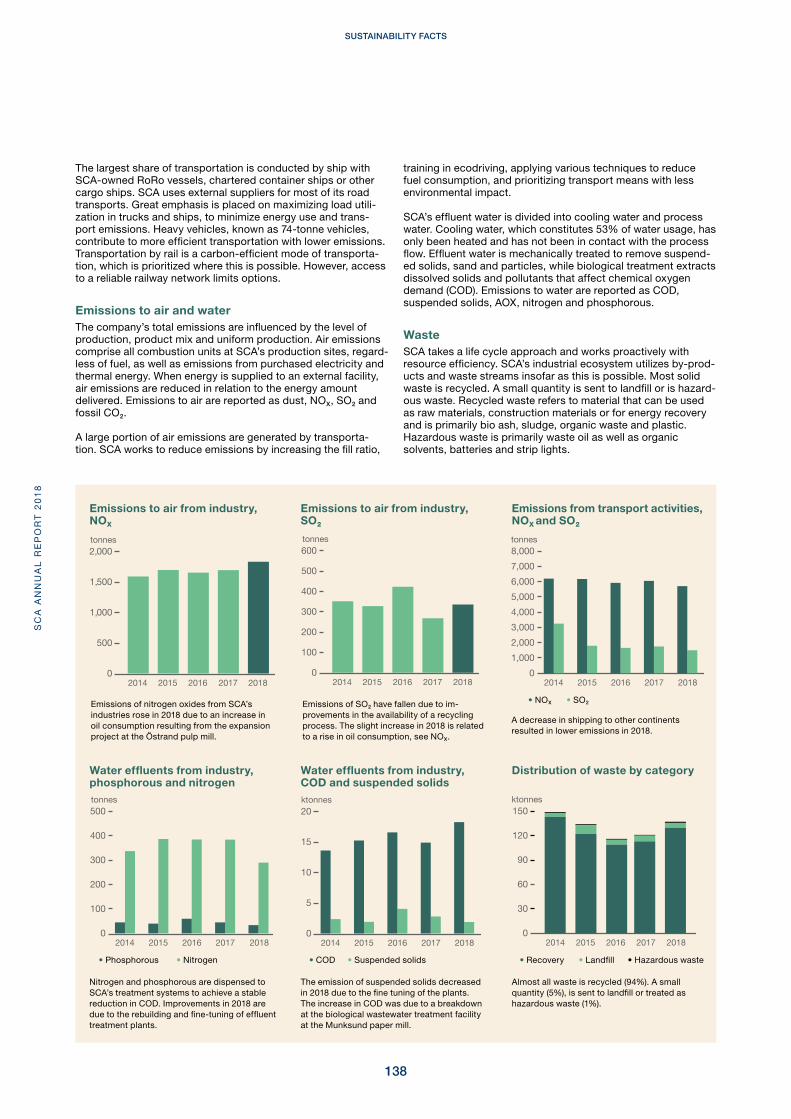
Water effluents from industry, phosphorous and nitrogen
2014 2015 2016 2017 20180
100
200
300
400
500tonnes
Nitrogen and phosphorous are dispensed to SCA’s treatment systems to achieve a stable reduction in COD. Improvements in 2018 are due to the rebuilding and fine-tuning of effluent treatment plants.
Water effluents from industry, COD and suspended solids
2014 2015 2016 2017 20180
5
10
15
20ktonnes
The emission of suspended solids decreased in 2018 due to the fine tuning of the plants. The increase in COD was due to a breakdown at the biological wastewater treatment facility at the Munksund paper mill.
Emissions to air from industry, NOX
2014 2015 2016 2017 20180
500
1,000
1,500
2,000tonnes
Emissions of nitrogen oxides from SCA’s industries rose in 2018 due to an increase in oil consumption resulting from the expansion project at the Östrand pulp mill.
Emissions to air from industry, SO2
2014 2015 2016 2017 20180
100
200
300
400
500
600tonnes
Emissions of SO2 have fallen due to im-provements in the availability of a recycling process. The slight increase in 2018 is related to a rise in oil consumption, see NOX.
Emissions from transport activities, NOX and SO2
2014 2015 2016 2017 20180
1,0002,0003,0004,0005,0006,0007,0008,000tonnes
A decrease in shipping to other continents resulted in lower emissions in 2018.
Distribution of waste by category
ktonnes
2014 2015 2016 2017 20180
30
60
90
120
150
Almost all waste is recycled (94%). A small quantity (5%), is sent to landfill or treated as hazardous waste (1%).
• Landfill
• SO2
• Recovery• Phosphorous • COD
• NOX
• Hazardous waste• Nitrogen • Suspended solids
The largest share of transportation is conducted by ship with SCA-owned RoRo vessels, chartered container ships or other cargo ships. SCA uses external suppliers for most of its road transports. Great emphasis is placed on maximizing load utili-zation in trucks and ships, to minimize energy use and trans-port emissions. Heavy vehicles, known as 74-tonne vehicles, contribute to more efficient transportation with lower emissions. Transportation by rail is a carbon-efficient mode of transporta-tion, which is prioritized where this is possible. However, access to a reliable railway network limits options.
Emissions to air and waterThe company’s total emissions are influenced by the level of production, product mix and uniform production. Air emissions comprise all combustion units at SCA’s production sites, regard-less of fuel, as well as emissions from purchased electricity and thermal energy. When energy is supplied to an external facility, air emissions are reduced in relation to the energy amount delivered. Emissions to air are reported as dust, NOX, SO2 and fossil CO2. A large portion of air emissions are generated by transporta-tion. SCA works to reduce emissions by increasing the fill ratio,
training in ecodriving, applying various techniques to reduce fuel consumption, and prioritizing transport means with less environmental impact.
SCA’s effluent water is divided into cooling water and process water. Cooling water, which constitutes 53% of water usage, has only been heated and has not been in contact with the process flow. Effluent water is mechanically treated to remove suspend-ed solids, sand and particles, while biological treatment extracts dissolved solids and pollutants that affect chemical oxygen demand (COD). Emissions to water are reported as COD, suspended solids, AOX, nitrogen and phosphorous.
WasteSCA takes a life cycle approach and works proactively with resource efficiency. SCA’s industrial ecosystem utilizes by-prod-ucts and waste streams insofar as this is possible. Most solid waste is recycled. A small quantity is sent to landfill or is hazard-ous waste. Recycled waste refers to material that can be used as raw materials, construction materials or for energy recovery and is primarily bio ash, sludge, organic waste and plastic. Hazardous waste is primarily waste oil as well as organic solvents, batteries and strip lights.
SC
A A
NN
UA
L R
EP
OR
T 2
01
8SUSTAINABILITY FACTS
138

2018 2017 2016
Average number of employees 4,216 4,127 4,022
Number of employees1) 4,121 4,031 3,912
of whom men 3,358 3,318 3,231
of whom women 763 713 681
Number of temporary employees1) 410 330 329
of whom men 306 262 251
of whom women 104 68 78
Number of part-time employees1) 93 87 85
of whom men 57 56 52
of whom women 36 31 33
Age distribution
< 21 years old 0% 0% 0 %
21 – 30 14% 13% 10%
31 – 40 19% 19% 18%
41 – 50 26% 28% 29%
51 – 60 32% 32% 33%
61+ 9 % 8% 11%
Employee turnover2) 8 % 8% 10%
of which retirement and restructuring 2 % 2 % 4 %
of which other 6% 6% 6 %
Gender equality
Share of women on the Board of Directors3) 40% 44% N/A
Share of women on the Board of Directors4) 38% 42% N/A
Share of women in the Executive Management Team 17% 15% N/A
Share of women, in management positions5) 21% 20% 18%
Share of women, all employees 19% 18% 17%
Share of women, white collar 32% 32% 31%
Share of women, blue collar 10% 9 % 9 %
Health and Safety
Absence due to illness total 3.5% 3.8 % 4.0%
Number of workplace accidents resulting in absence, LTA (of which non-Swedish units) 60 (10) 65 (11) 58 (9)
Number of workplace accidents among contractors, CLTA6)(of which fatal accidents) 33 (2) 37 (1) 38 (0)
Number of working days lost due to workplace accidents, DLA7) 1,044 647 903
Workplace Accident Severity Rate, ASR, measured as days of absence/LTA 17.4 9.9 15.6
Workplace accident Frequency Rate, FR, (LTA/1,000,000 WH) 9.1 10.4 8.7
Fatal accidents 0 0 0
Total Recordable Incidents, TRI8) 171 161 150
Number of hours worked, million hours 6.60 6.28 6.69
1) Refers to employees on December 31, 20182) Refers to permanent staff3) Excluding members appointed by employees4) Including members appointed by employees5) Members of management teams6) Refers to contractors who perform work at SCA’s facilities, in forestry operations or conduct transport activities7) Absence from day 1 after the accident8) Total of LTA, medical treatment, alternative work duties and fatal accidents.
Social dataThe table shows social data for the SCA Group. Due to the distribution of the hygiene business in 2017, comparison data for all areas cannot be reported. Data for 2017 and 2018 refers to the entire Group. Data for 2016 refers to the SCA Forest Products business unit in the former SCA Group.
SUSTAINABILITY FACTSS
CA
AN
NU
AL
RE
PO
RT
20
18
Introduction Strategy & operations Board of Directors’ Report Financial statements Sustainability facts Other
139
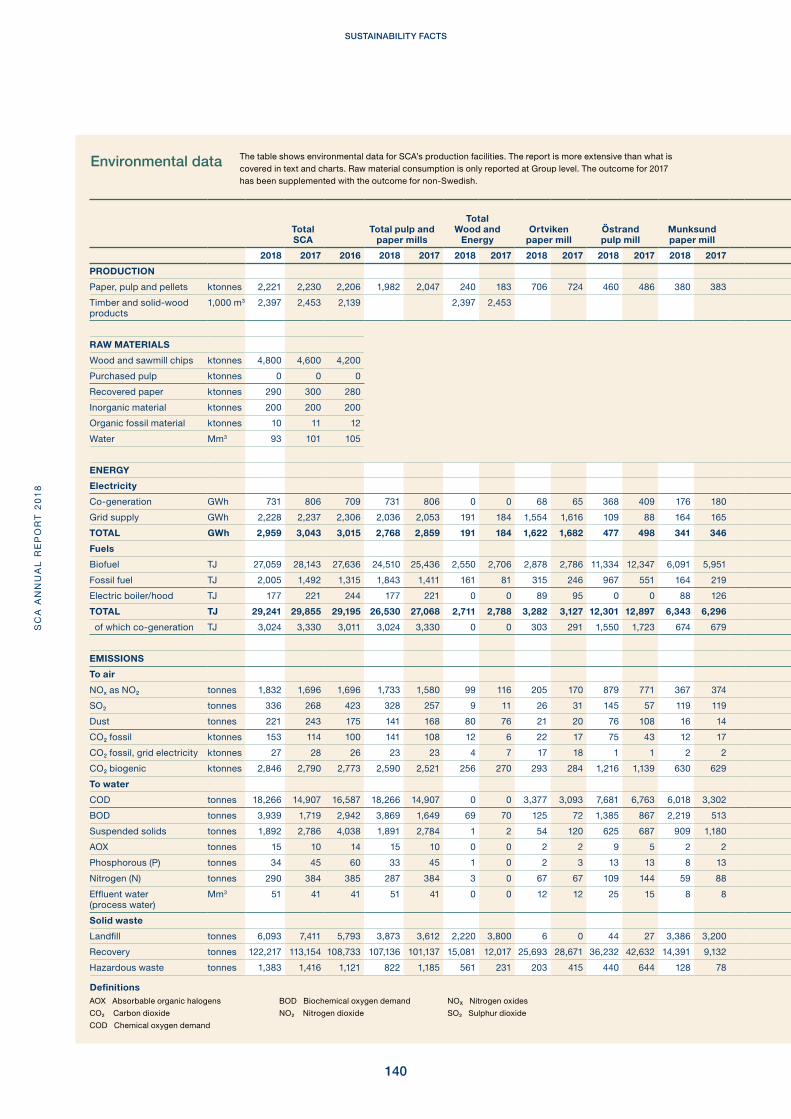
Total SCA
Total pulp and paper mills
Total Wood and
EnergyOrtviken
paper millÖstrand pulp mill
Munksund paper mill
Obbola paper mill
BioNorrHärnösand
Building materials Stugun
Building
materials Tunadal
Building materials
UKand France
Bollsta sawmill
Gällö sawmill
Munksund sawmill
Rundvik sawmill
Tunadal sawmill
2018 2017 2016 2018 2017 2018 2017 2018 2017 2018 2017 2018 2017 2018 2017 2018 2017 2018 2017 2018 2017 2018 2017 2018 2017 2018 2017 2018 2017 2018 2017 2018 2017
PRODUCTION
Paper, pulp and pellets ktonnes 2,221 2,230 2,206 1,982 2,047 240 183 706 724 460 486 380 383 436 454 176 166 43 17
Timber and solid-wood products
1,000 m3 2,397 2,453 2,139 2,397 2,453 76 91 64 76 206 199 543 541 328 335 386 397 296 307 518 507
RAW MATERIALS
Wood and sawmill chips ktonnes 4,800 4,600 4,200
Purchased pulp ktonnes 0 0 0
Recovered paper ktonnes 290 300 280
Inorganic material ktonnes 200 200 200
Organic fossil material ktonnes 10 11 12
Water Mm3 93 101 105
ENERGY
Electricity
Co-generation GWh 731 806 709 731 806 0 0 68 65 368 409 176 180 118 151 0 0 0 0 0 0 0 0 0 0 0 0 0 0 0 0 0 0
Grid supply GWh 2,228 2,237 2,306 2,036 2,053 191 184 1,554 1,616 109 88 164 165 210 183 32 32 8 2 3 3 8 9 41 41 17 15 26 26 20 21 36 35
TOTAL GWh 2,959 3,043 3,015 2,768 2,859 191 184 1,622 1,682 477 498 341 346 328 334 32 32 8 2 3 3 8 9 41 41 17 15 26 26 20 21 36 35
Fuels 0 0
Biofuel TJ 27,059 28,143 27,636 24,510 25,436 2,550 2,706 2,878 2,786 11,334 12,347 6,091 5,951 4,207 4,352 571 568 27 73 2 3 0 0 634 655 251 226 460 495 204 228 401 458
Fossil fuel TJ 2,005 1,492 1,315 1,843 1,411 161 81 315 246 967 551 164 219 398 395 2 2 1 1 0 0 10 10 60 48 0 0 15 16 8 4 65 0
Electric boiler/hood TJ 177 221 244 177 221 0 0 89 95 0 0 88 126 0 0 0 0 0 0 0 0 0 0 0 0 0 0 0 0 0 0 0 0
TOTAL TJ 29,241 29,855 29,195 26,530 27,068 2,711 2,788 3,282 3,127 12,301 12,897 6,343 6,296 4,604 4,747 573 570 27 74 2 3 10 10 694 703 251 226 475 511 212 232 466 459
of which co-generation TJ 3,024 3,330 3,011 3,024 3,330 0 0 303 291 1,550 1,723 674 679 497 636 0 0 0 0 0 0 0 0 0 0 0 0 0 0 0 0 0 0
EMISSIONS
To air
NOx as NO2 tonnes 1,832 1,696 1,696 1,733 1,580 99 116 205 170 879 771 367 374 282 265 0 0 3 6 0 0 1 0 49 58 19 24 7 8 12 13 7 7
SO2 tonnes 336 268 423 328 257 9 11 26 31 145 57 119 119 37 50 0 0 0 0 0 0 0 0 1 1 0 0 1 9 0 0 6 0
Dust tonnes 221 243 175 141 168 80 76 21 20 76 108 16 14 29 25 49 52 4 7 0 0 0 0 9 1 2 5 0 0 16 10 0 0
CO2 fossil ktonnes 153 114 100 141 108 12 6 22 17 75 43 12 17 31 31 0 0 0 0 0 0 1 1 4 4 0 0 1 1 1 0 5 0
CO2 fossil, grid electricity ktonnes 27 28 26 23 23 4 7 17 18 1 1 2 2 2 2 0 0 0 0 0 0 2 3 0 0 0 0 0 0 0 0 0 0
CO2 biogenic ktonnes 2,846 2,790 2,773 2,590 2,521 256 270 293 284 1,216 1,139 630 629 452 469 55 54 2 7 0 0 0 0 61 63 24 22 44 48 31 32 38 44
To water
COD tonnes 18,266 14,907 16,587 18,266 14,907 0 0 3,377 3,093 7,681 6,763 6,018 3,302 1,190 1,749 0 0 0 0 0 0 0 0 0 0 0 0 0 0 0 0 0 0
BOD tonnes 3,939 1,719 2,942 3,869 1,649 69 70 125 72 1,385 867 2,219 513 140 197 0 0 0 0 0 0 0 0 69 70 0 0 0 0 0 0 0 0
Suspended solids tonnes 1,892 2,786 4,038 1,891 2,784 1 2 54 120 625 687 909 1,180 303 798 1 2 0 0 0 0 0 0 0 0 0 0 0 0 0 0 0 0
AOX tonnes 15 10 14 15 10 0 0 2 2 9 5 2 2 1 2 0 0 0 0 0 0 0 0 0 0 0 0 0 0 0 0 0 0
Phosphorous (P) tonnes 34 45 60 33 45 1 0 2 3 13 13 8 13 9 16 0 0 0 0 0 0 0 0 1 0 0 0 0 0 0 0 0 0
Nitrogen (N) tonnes 290 384 385 287 384 3 0 67 67 109 144 59 88 53 85 0 0 0 0 0 0 0 0 3 0 0 0 0 0 0 0 0 0
Effluent water (process water)
Mm3 51 41 41 51 41 0 0 12 12 25 15 8 8 6 6 0 0 0 0 0 0 0 0 0 0 0 0 0 0 0 0 0 0
Solid waste
Landfill tonnes 6,093 7,411 5,793 3,873 3,612 2,220 3,800 6 0 44 27 3,386 3,200 437 384 1,912 3,422 2 0 0 0 180 236 0 0 34 60 90 82 0 0 2 0
Recovery tonnes 122,217 113,154 108,733 107,136 101,137 15,081 12,017 25,693 28,671 36,232 42,632 14,391 9,132 30,820 20,702 31 20 94 133 158 71 34 55 3,473 3,197 514 362 9 9 10,495 8,057 272 113
Hazardous waste tonnes 1,383 1,416 1,121 822 1,185 561 231 203 415 440 644 128 78 50 48 352 1 0 10 38 3 26 32 53 66 7 3 10 29 42 57 33 30
Environmental data
AOX Absorbable organic halogens
CO2 Carbon dioxide
COD Chemical oxygen demand
BOD Biochemical oxygen demand
NO2 Nitrogen dioxide
NOX Nitrogen oxides
SO2 Sulphur dioxide
The table shows environmental data for SCA’s production facilities. The report is more extensive than what is covered in text and charts. Raw material consumption is only reported at Group level. The outcome for 2017 has been supplemented with the outcome for non-Swedish.
Definitions
SC
A A
NN
UA
L R
EP
OR
T 2
01
8SUSTAINABILITY FACTS
140
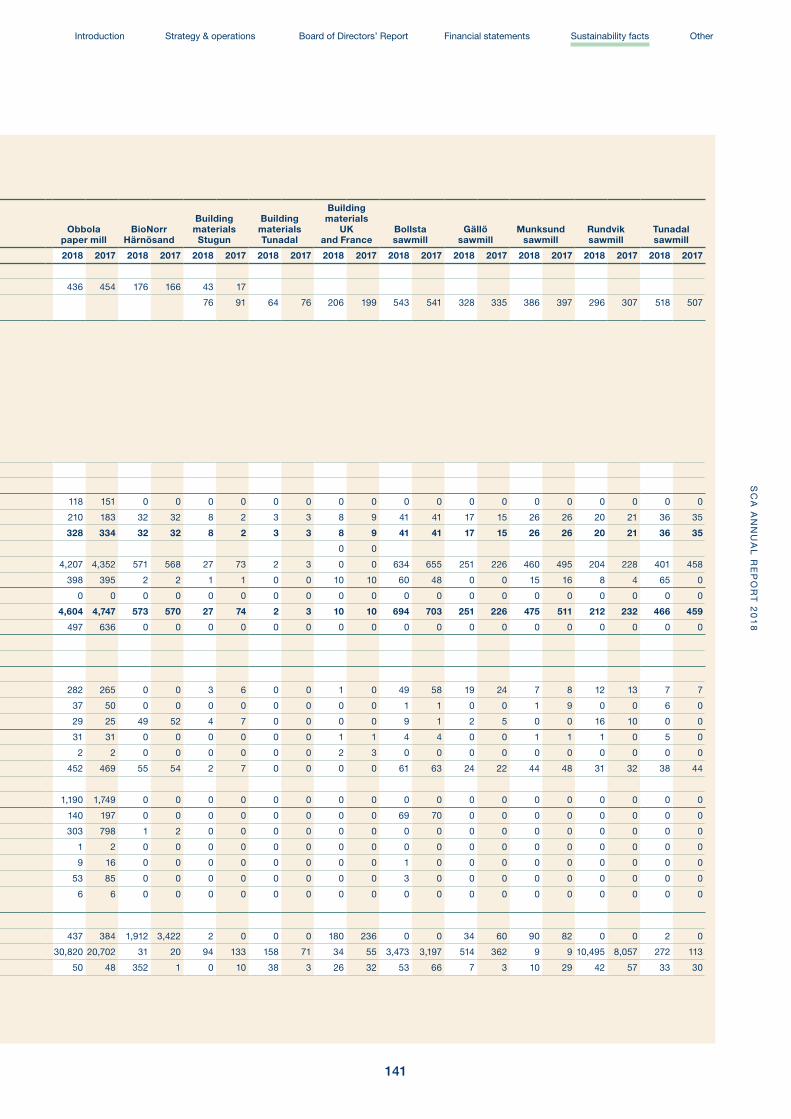
Total SCA
Total pulp and paper mills
Total Wood and
EnergyOrtviken
paper millÖstrand pulp mill
Munksund paper mill
Obbola paper mill
BioNorrHärnösand
Building materials Stugun
Building
materials Tunadal
Building materials
UKand France
Bollsta sawmill
Gällö sawmill
Munksund sawmill
Rundvik sawmill
Tunadal sawmill
2018 2017 2016 2018 2017 2018 2017 2018 2017 2018 2017 2018 2017 2018 2017 2018 2017 2018 2017 2018 2017 2018 2017 2018 2017 2018 2017 2018 2017 2018 2017 2018 2017
PRODUCTION
Paper, pulp and pellets ktonnes 2,221 2,230 2,206 1,982 2,047 240 183 706 724 460 486 380 383 436 454 176 166 43 17
Timber and solid-wood products
1,000 m3 2,397 2,453 2,139 2,397 2,453 76 91 64 76 206 199 543 541 328 335 386 397 296 307 518 507
RAW MATERIALS
Wood and sawmill chips ktonnes 4,800 4,600 4,200
Purchased pulp ktonnes 0 0 0
Recovered paper ktonnes 290 300 280
Inorganic material ktonnes 200 200 200
Organic fossil material ktonnes 10 11 12
Water Mm3 93 101 105
ENERGY
Electricity
Co-generation GWh 731 806 709 731 806 0 0 68 65 368 409 176 180 118 151 0 0 0 0 0 0 0 0 0 0 0 0 0 0 0 0 0 0
Grid supply GWh 2,228 2,237 2,306 2,036 2,053 191 184 1,554 1,616 109 88 164 165 210 183 32 32 8 2 3 3 8 9 41 41 17 15 26 26 20 21 36 35
TOTAL GWh 2,959 3,043 3,015 2,768 2,859 191 184 1,622 1,682 477 498 341 346 328 334 32 32 8 2 3 3 8 9 41 41 17 15 26 26 20 21 36 35
Fuels 0 0
Biofuel TJ 27,059 28,143 27,636 24,510 25,436 2,550 2,706 2,878 2,786 11,334 12,347 6,091 5,951 4,207 4,352 571 568 27 73 2 3 0 0 634 655 251 226 460 495 204 228 401 458
Fossil fuel TJ 2,005 1,492 1,315 1,843 1,411 161 81 315 246 967 551 164 219 398 395 2 2 1 1 0 0 10 10 60 48 0 0 15 16 8 4 65 0
Electric boiler/hood TJ 177 221 244 177 221 0 0 89 95 0 0 88 126 0 0 0 0 0 0 0 0 0 0 0 0 0 0 0 0 0 0 0 0
TOTAL TJ 29,241 29,855 29,195 26,530 27,068 2,711 2,788 3,282 3,127 12,301 12,897 6,343 6,296 4,604 4,747 573 570 27 74 2 3 10 10 694 703 251 226 475 511 212 232 466 459
of which co-generation TJ 3,024 3,330 3,011 3,024 3,330 0 0 303 291 1,550 1,723 674 679 497 636 0 0 0 0 0 0 0 0 0 0 0 0 0 0 0 0 0 0
EMISSIONS
To air
NOx as NO2 tonnes 1,832 1,696 1,696 1,733 1,580 99 116 205 170 879 771 367 374 282 265 0 0 3 6 0 0 1 0 49 58 19 24 7 8 12 13 7 7
SO2 tonnes 336 268 423 328 257 9 11 26 31 145 57 119 119 37 50 0 0 0 0 0 0 0 0 1 1 0 0 1 9 0 0 6 0
Dust tonnes 221 243 175 141 168 80 76 21 20 76 108 16 14 29 25 49 52 4 7 0 0 0 0 9 1 2 5 0 0 16 10 0 0
CO2 fossil ktonnes 153 114 100 141 108 12 6 22 17 75 43 12 17 31 31 0 0 0 0 0 0 1 1 4 4 0 0 1 1 1 0 5 0
CO2 fossil, grid electricity ktonnes 27 28 26 23 23 4 7 17 18 1 1 2 2 2 2 0 0 0 0 0 0 2 3 0 0 0 0 0 0 0 0 0 0
CO2 biogenic ktonnes 2,846 2,790 2,773 2,590 2,521 256 270 293 284 1,216 1,139 630 629 452 469 55 54 2 7 0 0 0 0 61 63 24 22 44 48 31 32 38 44
To water
COD tonnes 18,266 14,907 16,587 18,266 14,907 0 0 3,377 3,093 7,681 6,763 6,018 3,302 1,190 1,749 0 0 0 0 0 0 0 0 0 0 0 0 0 0 0 0 0 0
BOD tonnes 3,939 1,719 2,942 3,869 1,649 69 70 125 72 1,385 867 2,219 513 140 197 0 0 0 0 0 0 0 0 69 70 0 0 0 0 0 0 0 0
Suspended solids tonnes 1,892 2,786 4,038 1,891 2,784 1 2 54 120 625 687 909 1,180 303 798 1 2 0 0 0 0 0 0 0 0 0 0 0 0 0 0 0 0
AOX tonnes 15 10 14 15 10 0 0 2 2 9 5 2 2 1 2 0 0 0 0 0 0 0 0 0 0 0 0 0 0 0 0 0 0
Phosphorous (P) tonnes 34 45 60 33 45 1 0 2 3 13 13 8 13 9 16 0 0 0 0 0 0 0 0 1 0 0 0 0 0 0 0 0 0
Nitrogen (N) tonnes 290 384 385 287 384 3 0 67 67 109 144 59 88 53 85 0 0 0 0 0 0 0 0 3 0 0 0 0 0 0 0 0 0
Effluent water (process water)
Mm3 51 41 41 51 41 0 0 12 12 25 15 8 8 6 6 0 0 0 0 0 0 0 0 0 0 0 0 0 0 0 0 0 0
Solid waste
Landfill tonnes 6,093 7,411 5,793 3,873 3,612 2,220 3,800 6 0 44 27 3,386 3,200 437 384 1,912 3,422 2 0 0 0 180 236 0 0 34 60 90 82 0 0 2 0
Recovery tonnes 122,217 113,154 108,733 107,136 101,137 15,081 12,017 25,693 28,671 36,232 42,632 14,391 9,132 30,820 20,702 31 20 94 133 158 71 34 55 3,473 3,197 514 362 9 9 10,495 8,057 272 113
Hazardous waste tonnes 1,383 1,416 1,121 822 1,185 561 231 203 415 440 644 128 78 50 48 352 1 0 10 38 3 26 32 53 66 7 3 10 29 42 57 33 30
SUSTAINABILITY FACTSS
CA
AN
NU
AL
RE
PO
RT
20
18
Introduction Strategy & operations Board of Directors’ Report Financial statements Sustainability facts Other
141

SC
A A
NN
UA
L R
EP
OR
T 2
01
8
142
Adoption of the annual accounts
The Board’s assessment is that the dividend to shareholders in the proposed amount, in accordance with Note PC13, see page 118, is justifiable taking into account the requirements, on both the company and the Group, the nature of the business, its scope and risks place on the size of equity and also considering consolidation requirements, liquidity and other status. The finan-cial position remains strong after the proposed dividend and is considered sufficient to ensure that the company can fulfill its short- or long-term obligations, and has the opportunity to make any necessary investments.
The Annual and Sustainability Report and the consolidated financial statements have been approved for publication by the Board of Directors on February 19, 2019. The Group’s income statement and balance sheet and the Parent Company’s income statement and balance sheet will be presented for approval at the Annual General Meeting on March 20, 2019.
The Board of Directors and President declare that the consoli-dated financial statements have been prepared in accordance with the International Financial Reporting Standards adopted by the EU and that disclosures herein give a true and fair view of the Group’s financial position and results of operations. The Parent Company’s financial statements have been prepared in accordance with generally accepted accounting principles in Sweden and give a true and fair view of the Parent Company’s financial position and results of operations. The statutory Board of Directors’ Report provides a fair review of the Parent Com-pany’s and Group’s operations, financial position and results of operations and describes material risks and uncertainties facing the Parent Company and the companies included in the Group.
The Annual Report also contains the Group’s and Parent Com-pany’s sustainability reporting in accordance with the Swedish Annual Accounts Act, Chapter 6, Section 11, see page 50, and the Sustainability Report in accordance with the Global Report-ing Initiative, GRI, see the GRI index on pages 147 – 148.
Pär Boman Charlotte Bengtsson Roger Boström Lennart Evrell
Chairman of the Board
Board member Board member, Employee representative
Board member
Anders Sundström Barbara Milian Thoralfsson Hans Wentjärv Johanna Viklund Lindén
Board member Board member Board member, Employee representative
Board member, Employee representative
Ulf Larsson
President and CEO,Board member
Annemarie Gardshol Martin Lindqvist Lotta Lyrå Bert Nordberg
Board member Board member Board member Board member
Sundsvall, February 19, 2019

143
SC
A A
NN
UA
L R
EP
OR
T 2
01
8Introduction Strategy & operations Board of Directors’ Report Financial statements Sustainability facts Other
Auditor’s report
of the group as of 31 December 2018 and their financial performance and cash flow for the year then ended in accor-dance with International Financial Report-ing Standards (IFRS), as adopted by the EU, and the Annual Accounts Act. Our opinions do not cover the corporate gov-ernance statement on pages 55 – 65. The statutory administration report is con-sistent with the other parts of the annual accounts and consolidated accounts.
We therefore recommend that the general meeting of shareholders adopts the income statement and balance sheet for the parent company and the group.
Our opinions in this report on the annual accounts and consolidated accounts are consistent with the content of the additional report that has been submitted to the parent company’s audit committee in accordance with the Audit Regulation (537/2014) Article 11.
Basis for OpinionsWe conducted our audit in accordance with International Standards on Auditing (ISA) and generally accepted auditing standards in Sweden. Our responsibil-ities under those standards are further described in the Auditor’s Responsibilities section. We are independent of the parent company and the group in accordance with professional ethics for accountants in Sweden and have otherwise fulfilled our ethical responsibilities in accordance with these requirements. This includes that, based on the best of our knowledge and belief, no prohibited services referred to in the Audit Regulation (537/2014) Arti-cle 5.1 have been provided to the audited company or, where applicable, its parent company or its controlled companies within the EU.
We believe that the audit evidence we have obtained is sufficient and appropri-ate to provide a basis for our opinions.
OpinionsWe have audited the annual accounts and consolidated accounts of Svenska Cellulosa Aktiebolaget SCA (publ) for the year 2018 except for the corporate gover-nance statement on pages 55-65 and the sustainability report defined on page 50. The annual accounts and consolidated accounts of the company are included on pages 46 – 118 and page 142 in this document.
In our opinion, the annual accounts have been prepared in accordance with the Annual Accounts Act and present fairly, in all material respects, the financial position of the parent company as of 31 Decem-ber 2018 and its financial performance and cash flow for the year then ended in accordance with the Annual Accounts Act. The consolidated accounts have been prepared in accordance with the Annual Accounts Act and present fairly, in all material respects, the financial position
To the general meeting of the shareholders of Svenska Cellulosa Aktiebolaget SCA (publ), corporate identity number 556012-6293.
Report on the annual accounts and consolidated accounts
Description How our audit addressed this key audit matter
The group’s forest assets are accounted for as biological assets valued at fair value in accordance with IAS 41 Agriculture and by application of IFRS 13 Fair Value Measurement. As of 31 December 2018 the forest is accounted for at 32.1 billion SEK. The fair value of the group’s forest assets is calculated as the present value of future cash flows before tax and is classified as Level 3 valuation as defined in IFRS 13. The valuation process is complex since a quoted price in an active market does not exist for these assets. As a result biological assets are valued based on the present value of future cash flows. Key assumptions are future forest prices, felling costs, volume assumptions and discount rate which all include a high degree of assumptions from the company. We therefore consider the valuation of the group’s forest assets to be a Key Audit Matter.
In our audit we have evaluated and reviewed key assumptions, application of common valuation practice, discount rate (“WACC”) and other source data that the company has used by i.e. comparing to external data sources, such as forecasted inflation, forest prices and felling costs or assumptions of future felling volumes and by eval-uating the sensitivity in the company’s valuation model. We have as appropriate included valuation specialists in the team performing our review. We have specifically focused on the sensitivity in the calcu-lations. Furthermore we have evaluated the company’s historical capa-bility to forecast. Finally we have evaluated if disclosures provided in note D3 (“Biological Assets”) in the company’s notes are appropriate, specifically with regards to disclosure of which of the stated assump-tions that are most sensitive in calculating the fair value.
Key Audit MattersKey audit matters of the audit are those matters that, in our professional judg-ment, were of most significance in our audit of the annual accounts and con-solidated accounts of the current period. These matters were addressed in the context of our audit of, and in forming our opinion thereon, the annual accounts and consolidated accounts as a whole, but
we do not provide a separate opinion on these matters. For each matter below, our description of how our audit addressed the matter is provided in that context.
We have fulfilled the responsibilities described in the Auditor’s responsibilities for the audit of the financial statements section of our report, including in relation to these matters. Accordingly, our audit
included the performance of procedures designed to respond to our assessment of the risks of material misstatement of the financial statements. The results of our audit procedures, including the procedures performed to address the matters below, provide the basis for our audit opinion on the accompanying financial statement.
Forest Valuation

SC
A A
NN
UA
L R
EP
OR
T 2
01
8
144
The Audit Committee shall, without prej-udice to the Board of Director’s responsi-bilities and tasks in general, among other things oversee the company’s financial reporting process.
Auditor’s responsibilityOur objectives are to obtain reasonable assurance about whether the annual accounts and consolidated accounts as a whole are free from material misstate-ment, whether due to fraud or error, and to issue an auditor’s report that includes our opinions. Reasonable assurance is a high level of assurance, but is not a guarantee that an audit conducted in accordance with ISA’s and generally accepted auditing standards in Sweden will always detect a material misstate-ment when it exists. Misstatements can arise from fraud or error and are considered material if, individually or in the aggregate, they could reasonably be expected to influence the economic decisions of users taken on the basis of these annual accounts and consolidated accounts.
As part of an audit in accordance with ISA, we exercise professional judgment and maintain professional skepticism throughout the audit. We also:
• Identify and assess the risks of material misstatement of the annual accounts and consolidated accounts, wheth-er due to fraud or error, design and perform audit procedures responsive to those risks, and obtain audit evidence that is sufficient and appropriate to pro-vide a basis for our opinions. The risk of not detecting a material misstatement resulting from fraud is higher than for one resulting from error, as fraud may involve collusion, forgery, intentional omissions, misrepresentations, or the override of internal control.
• Obtain an understanding of the compa-ny’s internal control relevant to our audit in order to design audit procedures that are appropriate in the circumstances, but not for the purpose of expressing an opinion on the effectiveness of the company’s internal control.
• Evaluate the appropriateness of ac-counting policies used and the reason-ableness of accounting estimates and related disclosures made by the Board of Directors and the Managing Director.
• Conclude on the appropriateness of the Board of Directors’ and the Managing Director’s use of the going concern ba-sis of accounting in preparing the annu-al accounts and consolidated accounts.
We also draw a conclusion, based on the audit evidence obtained, as to whether any material uncertainty exists related to events or conditions that may cast significant doubt on the company’s and the group’s ability to continue as a going concern. If we conclude that a material uncertainty exists, we are required to draw attention in our audi-tor’s report to the related disclosures in the annual accounts and consolidated accounts or, if such disclosures are inadequate, to modify our opinion about the annual accounts and consolidated accounts. Our conclusions are based on the audit evidence obtained up to the date of our auditor’s report. How-ever, future events or conditions may cause a company and a group to cease to continue as a going concern.
• Evaluate the overall presentation, struc-ture and content of the annual accounts and consolidated accounts, including the disclosures, and whether the annual accounts and consolidated accounts represent the underlying transactions and events in a manner that achieves fair presentation.
• Obtain sufficient and appropriate audit evidence regarding the financial information of the entities or business activities within the group to express an opinion on the consolidated accounts. We are responsible for the direction, su-pervision and performance of the group audit. We remain solely responsible for our opinions.
We must inform the Board of Directors of, among other matters, the planned scope and timing of the audit. We must also inform of significant audit findings during our audit, including any significant deficiencies in internal control that we have identified.
We must also provide the Board of Directors with a statement that we have complied with relevant ethical require-ments regarding independence, and to communicate with them all relationships and other matters that may reasonably be thought to bear on our independence, and where applicable, related safeguards.
From the matters communicated with the Board of Directors, we determine those matters that were of most signifi-cance in the audit of the annual accounts and consolidated accounts, including the most important assessed risks for material misstatement, and are therefore the key audit matters. We describe these matters in the auditor’s report unless law or regulation precludes disclosure about the matter.
Other Information than the annual accounts and consolidated accountsThis document also contains other information than the annual accounts and consolidated accounts and is found on pages 1-45, 119-141 and 146-154. The Board of Directors and the Managing Director are responsible for this other information.
Our opinion on the annual accounts and consolidated accounts does not cover this other information and we do not ex-press any form of assurance conclusion regarding this other information.
In connection with our audit of the annual accounts and consolidated accounts, our responsibility is to read the information identified above and consider whether the information is materially inconsistent with the annual accounts and consolidated accounts. In this procedure we also take into account our knowledge otherwise obtained in the audit and assess whether the information otherwise appears to be materially misstated.
If we, based on the work performed concerning this information, conclude that there is a material misstatement of this other information, we are required to report that fact. We have nothing to report in this regard.
Responsibilities of the Board of Directors and the Managing DirectorThe Board of Directors and the Man-aging Director are responsible for the preparation of the annual accounts and consolidated accounts and that they give a fair presentation in accordance with the Annual Accounts Act and, concerning the consolidated accounts, in accordance with IFRS as adopted by the EU. The Board of Directors and the Managing Director are also responsible for such internal control as they determine is necessary to enable the preparation of annual accounts and consolidated accounts that are free from material mis-statement, whether due to fraud or error.
In preparing the annual accounts and consolidated accounts, The Board of Directors and the Managing Director are responsible for the assessment of the company’s and the group’s ability to continue as a going concern. They disclose, as applicable, matters related to going concern and using the going concern basis of accounting. The going concern basis of accounting is however not applied if the Board of Directors and the Managing Director intends to liquidate the company, to cease operations, or has no realistic alternative but to do so.
145
SC
A A
NN
UA
L R
EP
OR
T 2
01
8Introduction Strategy & operations Board of Directors’ Report Financial statements Sustainability facts Other
Report on other legal and regulatory requirements
OpinionsIn addition to our audit of the annual accounts and consolidated accounts, we have also audited the administration of the Board of Directors and the Managing Director of Svenska Cellulosa Aktiebo-laget SCA (publ) for the year 2018 and the proposed appropriations of the compa-ny’s profit or loss.
We recommend to the general meeting of shareholders that the profit be appro-priated in accordance with the proposal in the statutory administration report and that the members of the Board of Directors and the Managing Director be discharged from liability for the financial year.
Basis for opinionsWe conducted the audit in accordance with generally accepted auditing stan-dards in Sweden. Our responsibilities un-der those standards are further described in the Auditor’s Responsibilities section. We are independent of the parent com-pany and the group in accordance with professional ethics for accountants in Sweden and have otherwise fulfilled our ethical responsibilities in accordance with these requirements.
We believe that the audit evidence we have obtained is sufficient and appropri-ate to provide a basis for our opinions.
Responsibilities of the Board of Directors and the Managing DirectorThe Board of Directors is responsible for the proposal for appropriations of the company’s profit or loss. At the proposal of a dividend, this includes an assess-ment of whether the dividend is justifiable considering the requirements which the company’s and the group’s type of oper-ations, size and risks place on the size of the parent company’s and the group’s equity, consolidation requirements, liquidity and position in general.
The Board of Directors is responsible for the company’s organization and the administration of the company’s affairs. This includes among other things con-tinuous assessment of the company’s and the group’s financial situation and ensuring that the company’s organization is designed so that the accounting, man-agement of assets and the company’s financial affairs otherwise are controlled in a reassuring manner. The Manag-ing Director shall manage the ongoing administration according to the Board of Directors’ guidelines and instructions and among other matters take measures that are necessary to fulfill the company’s accounting in accordance with law and handle the management of assets in a reassuring manner.
Auditor’s responsibilityOur objective concerning the audit of the administration, and thereby our opin-ion about discharge from liability, is to obtain audit evidence to assess with a reasonable degree of assurance whether any member of the Board of Directors or the Managing Director in any material respect:
• has undertaken any action or been guilty of any omission which can give rise to liability to the company, or
• in any other way has acted in con-travention of the Companies Act, the Annual Accounts Act or the Articles of Association.
Our objective concerning the audit of the proposed appropriations of the company’s profit or loss, and thereby our opinion about this, is to assess with reasonable degree of assurance whether the proposal is in accordance with the Companies Act.
Reasonable assurance is a high level of assurance, but is not a guarantee that an audit conducted in accordance with generally accepted auditing standards in Sweden will always detect actions or omissions that can give rise to liability to the company, or that the proposed appro-priations of the company’s profit or loss are not in accordance with the Compa-nies Act.
As part of an audit in accordance with generally accepted auditing standards in Sweden, we exercise professional judgment and maintain professional skepticism throughout the audit. The examination of the administration and the proposed appropriations of the compa-ny’s profit or loss is based primarily on the audit of the accounts. Additional audit procedures performed are based on our professional judgment with starting point in risk and materiality. This means that we focus the examination on such actions, areas and relationships that are material for the operations and where deviations and violations would have particular im-portance for the company’s situation. We examine and test decisions undertaken, support for decisions, actions taken and other circumstances that are relevant to our opinion concerning discharge from liability. As a basis for our opinion on the Board of Directors’ proposed appropri-ations of the company’s profit or loss we examined the Board of Directors’ reasoned statement and a selection of supporting evidence in order to be able to assess whether the proposal is in accor-dance with the Companies Act.
The auditor’s examination of the corporate governance statementThe Board of Directors is responsible for that the corporate governance statement on pages 55-65 has been prepared in accordance with the Annual Accounts Act.
Our examination of the corporate gover-nance statement is conducted in ac-cordance with FAR´s auditing standard RevU 16 The auditor´s examination of the corporate governance statement. This means that our examination of the corpo-rate governance statement is different and substantially less in scope than an audit conducted in accordance with International Standards on Auditing and generally ac-cepted auditing standards in Sweden. We believe that the examination has provided us with sufficient basis for our opinions.
A corporate governance statement has been prepared. Disclosures in accordance with chapter 6 section 6 the second para-graph points 2-6 of the Annual Accounts Act and chapter 7 section 31 the second paragraph the same law are consistent with the other parts of the annual accounts and consolidated accounts and are in accor-dance with the Annual Accounts Act.
The auditor´s opinion regarding the statutory sustainability reportThe Board of Directors is responsible for the statutory sustainability report on page 50 with references, and that it is prepared in accordance with the Annual Accounts Act.
Our examination has been conducted in accordance with FAR’s auditing standard RevR 12 The auditor´s opinion regarding the statutory sustainability report. This means that our examination of the statu-tory sustainability report is different and substantially less in scope than an audit conducted in accordance with International Standards on Auditing and generally ac-cepted auditing standards in Sweden. We believe that the examination has provided us with sufficient basis for our opinion.
A statutory sustainability report has been prepared.
Ernst & Young AB with Hamish Mabon as auditor in charge, Box 7850, 103 99 Stockholm, was appointed auditor of Svenska Cellulosa Aktiebolaget SCA (publ) by the general meeting of the shareholders on the 23 March 2018 and has been the company’s auditor since the 14 April 2016.
Stockholm 19 February 2019
Ernst & Young AB
Hamish Mabon Authorized Public Accountant
SC
A A
NN
UA
L R
EP
OR
T 2
01
8
146
Auditor’s Limited Assurance Report on SCA’s Sustainability
ReportTo Svenska Cellulosa Aktiebolaget SCA, corporate identity number
556012-6293
engagement consists of making inquiries, primarily of persons responsible for the preparation of the Sustainability Report, and applying analytical and other limited assurance procedures. The procedures performed in a limited assurance engagement vary in nature from, and are less in scope than for, a reasonable assurance engagement conducted in accordance with IAASB’s Standards on Auditing and other generally accepted auditing standards.
The firm applies ISQC 1 (International Standard on Quality Control) and accordingly maintains a comprehensive system of quality control including documented policies and procedures regarding compliance with ethical requirements, professional standards and applicable legal and regulatory requirements.
We are independent of Svenska Cellulosa Aktiebolaget SCA in accordance with professional ethics for accountants in Sweden and have otherwise fulfilled our ethical responsibilities in accordance with these requirements.
The procedures performed, consequently, do not enable us to obtain assurance that we would become aware of all significant matters that might be identified in a reasonable assurance engagement. Accordingly, we do not express a reasonable assurance conclusion.
Our procedures are based on the criteria defined by the Board of Directors and the Executive Management as described above. We consider these criteria suitable for the preparation of the Sustainability Report. We believe that the evidence we have obtained is sufficient and appropriate to provide a basis for our conclusion below.
ConclusionBased on the limited assurance procedures we have performed, nothing has come to our attention that causes us to believe that the Sustainability Report is not prepared, in all material respects, in accordance with the criteria defined by the Board of Directors and Executive Management.
IntroductionWe have been engaged by the Board of Directors of Svenska Cellulosa Aktiebolaget SCA to undertake a limited assurance engagement of Svenska Cellulosa Aktiebolaget SCA’s Sustainability Report for the year 2018. The company has defined the scope of the Sustainability Report to the areas referred to in the GRI Index on pages 147148.
Responsibilities of the Board of Directors and the Executive Manage-ment for the Sustainability ReportThe Board of Directors and the Executive Management are responsible for the preparation of the Sustainability Report in accordance with the applicable criteria, as explained on the pages 124125, and are the parts of the Sustainability Reporting Guidelines published by GRI (Global Reporting Initiative) that are applicable to the Sustainability Report, as well as the accounting and calculation principles that the Company has developed. This responsibility also includes the internal control relevant to the preparation of a Sustainability Report that is free from material misstatements, whether due to fraud or error.
Responsibilities of the Auditor Our responsibility is to express a conclusion on the Sustainability Report based on the limited assurance procedures we have performed.
We conducted our limited assurance engagement in accordance with ISAE 3000 Assurance engagements other than audits or reviews of historical financial information. A limited assurance
Stockholm, 19 February 2019
Ernst & Young AB
Hamish Mabon Charlotte Söderlund Authorized Public Accountant Authorized Public Accountant

147
SC
A A
NN
UA
L R
EP
OR
T 2
01
8Introduction Strategy & operations Board of Directors’ Report Financial statements Sustainability facts Other
GRI index 2018
GRI 102: General disclosures
Disclosure number Description Page Comment/Omission
Organizational profile
102-1 Name of the organization 151
102-2 Activities, brands, products and services 3, sca.com
102-3 Location of headquarters 151
102-4 Location of operations 83 (TB1:1)
102-5 Ownership and legal form 44 -45
102-6 Markets served 5, 83 (TB1:1)
102-7 Scale of the organization 4-5, 81-83 (Note B1)
102-8 Information on employees and other workers 125, 139, 83 Apart from SCA’s own employees, the main group that is not employed by SCA comprises contractors conducting forest services, some 900 people.
102-9 Supply chain 130
102-10 Significant changes to the organization and its supply chain 57 No major changes have taken place in 2018.
102-11 Precautionary Principle or approach 122
102-12 External initiatives 122
102-13 Membership of associations 122
Strategy
102-14 Statement from senior decision-maker 6
Ethics and integrity
102-16 Values, principles, standards and norms of behavior 43, 128-129
Governance
102-18 Governance structure 55 - 56, 122
Stakeholder engagement
102-40 List of stakeholder groups 123
102-41 Collective bargaining agreements 132
102-42 Identifying and selecting stakeholders 122-123
102-43 Approach to stakeholder engagement 122-123
102-44 Key topics and concerns raised 123-124
Reporting practice
102-45 Entities included in the consolidated financial statements 105 (Note F1), 124-125
102-46 Defining report content and topic Boundaries 124-125
102-47 List of material topics 124
102-48 Restatements of information 124
102-49 Changes in reporting 124
102-50 Reporting period 124
102-51 Date of most recent report 124
102-52 Reporting cycle 124
102-53 Contact point for questions regarding the report 151
102-54 Claims of reporting in accordance with the GRI Standards 124
102-55 GRI content index 147- 148
102-56 External assurance 142, 146
SCA prepares its report in accordance with GRI Standards, Core option. All indicators are from 2016 except GRI 403-9 which refers to 2018.

SC
A A
NN
UA
L R
EP
OR
T 2
01
8
148
GRI 103: Management approach
Area Disclosure number 103-1 Explanation of the material topic and its Boundary
103-2 The management approach and its compo-nents, page
GRI 103-3 Evaluation of the management approach
Economic performance
GRI 201: Economic performance 201-1 124-125 122, 126-127 122
Anti-corruption
GRI 206: Anti-competitive Behavior 206-1 124-125 122, 126-127 122
Energy
GRI 302: Energy 302-1 124-125, 137 122, 126-127 122
Biodiversity
GRI 304: Biodiversity 304-3 124-125 122, 126-127 122
Emissions
GRI 305: Emissions 305-5 124-125 122, 126-127 122
Occupational Health and Safety
GRI 403: Occupational Health and Safety 403-9 124-125 122, 126-127, 131 122
Diversity and Equal Opportunity
GRI 405: Diversity and Equal Opportunity 405-1 124-125 122, 126-127 122
GRI 403: Occupational Health and Safety
403-1 Occupa-tional health and safety manage-ment system
403-2 Hazard identification, risk assessment, and incident investigation
403-3 Occu-pational health services
403-4 Worker participation, consultation, and communication on occupational health and safety
403-5 Worker training on occu-pational health and safety
403-6 Promotion of worker health
403-7 Prevention and mitigation of occupational health and safety impacts directly linked by business relation-ships
Occupational Health and Safety
403-9 131 122, 125, 129, 131
132 123, 125, 131-132
132 132 134
Material Sustainability Topics
Area Disclosure number Description Page Comment/Omission
Economic performance
GRI 201: Economic perfor-mance
201-1 Direct economic value generat-ed and distributed
120
Anti-corruption
GRI 206: Anti-competitive Behavior
206-1 Legal actions for anti-compet-itive behavior, anti-trust, and monopoly practices
128-129
Energy
GRI 302: Energy 302-1 Energy consumption within the organization
137, 140-141
Biodiversity
GRI 304: Biodiversity 304-3 Habitats protected or restored 39, 134-136
Emissions
GRI 305: Emissions 305-5 Reduction of GHG emissions 136, 138, 140-141
On account of the expansion project at Östrand pulp mill, the outcome for 2018 is not representative of the opration. The reduction in greenhouse gases is therefore reported for the 2010-2017 period.
Occupational Health and Safety
GRI 403: Occupational Health and Safety
403-9 Work-related injuries 125, 129, 131-132, 139
Reporting for contractors who performed work at SCA’s facilities, in forestry opera-tions or conducted transport activities, only used for CLTA and fatal accidents.
Diversity and Equal Oppor-tunity
GRI 405: Diversity and Equal Opportunity
405-1 Diversity of governance bodies and employees
62-63, 83, 131, 139
Departure for information on minori-ty groups in accordance with Swedish law. Age distribution is reported for all employees at SCA, since a breakdown by employment category currently lacks system support.

149
SC
A A
NN
UA
L R
EP
OR
T 2
01
8Introduction Strategy & operations Board of Directors’ Report Financial statements Sustainability facts Other
Multi-year summaryContinuing operations (SEKm) 2018 2017 20161) 20151) 20141)
INCOME STATEMENT
Net sales 18,755 16,664 15,373 16,152 15,412
Adjusted EBITDA 5,252 3,761 3,269 3,741 3,683
Items affecting comparability 0 –113 116 40 –383
EBITDA 5,252 3,648 3,385 3,781 3,300
Forest 1,394 1,363 1,238 1,213 1,240
Wood 904 670 531 484 607
Pulp 709 482 530 970 768
Paper 2,468 1,479 1,246 1,317 855
Other –223 –346 –160 –203 –170
Depreciation/amortization –1,250 –1,137 –1,114 –1,197 –1,209
Items affecting comparability impairment 0 0 0 –1,320 –9
Operating profit 4,002 2,511 2,271 1,264 2,082
Financial items –29 –93 –84 –128 –221
Profit before tax 3,973 2,418 2,187 1,136 1,861
Taxes –314 –544 –417 –262 –482
Profit for the period 3,659 1,874 1,770 874 1,379
BALANCE SHEET
Biological assets 32,065 31,386 30,770 30,119 29,685
Deferred tax liabilities related to biological assets –6,605 –6,905 –6,769 –6,626 –6,531
Working capital 3,735 2,861 2,740 3,002 3,118
Other capital employed 16,887 15,377 13,386 11,341 12,556
Capital employed 46,082 42,719 40,127 37,836 38,828
Equity 39,062 36,753 35,1272) - -
Net debt 7,020 5,966 5,000 2) - -
Capital employed 46,082 42,719 40,127 37,836 38,828
CASH FLOW STATEMENT
Operating cash flow 2,751 2,273 1,917 2,481 1,469
Cash flow before dividend 528 –754 –350 1,673 1,050
Current capital expenditures, net –1,002 –638 –959 –869 –876
Strategic capital expenditures in non-current assets –1,967 –2,863 –2,231 –946 –184
KEY FIGURES
EBITDA margin 28.0% 21.9% 22.0% 23.4% 21.4%
Adjusted EBITDA margin 28.0% 22.6% 21.3% 23.2% 23.9%
Operating margin 21.3% 15.1% 14.8% 7.8% 13.5%
Industrial return on capital employed 16.4% 9.7% 9.8% 2.2% 8.1%
Return on capital employed 9.0% 6.1% 5.8% 3.3% 5.4%
Working capital as a percentage of sales 17.5% 17.7% 17.8% 18.6% 20.2%
Net debt/EBITDA 1.3× 1.6× 1.5×2) - -
Net debt/Equity 18% 16% 14 %2) - -
Data per share
Earnings per share, SEK 5.21 2.67 2.52 1.24 1.96
Dividend per share, SEK 1.753) 1.50 - - -
Operating cash flow per share, SEK 3.92 3.24 2.73 3.53 2.09
1) Restated financial information. 2) Pro forma. Pro forma net debt after reallocation to SEK 5,000m on December 31, 2016. Pro forma equity calculated as capital employed less pro forma net debt.
Pro forma value of net debt and equity used in relation to EBITDA (not pro forma).3) Board of Directors’ proposal.

SC
A A
NN
UA
L R
EP
OR
T 2
01
8
150
Definitions and glossaryFinancial terms
Performance measuresEBITDAProfit before depreciation, amortization and impairment, financial items and taxes.
EBITDA marginProfit before depreciation, amortization and impairment, financial items and taxes as a percentage of net sales for the year.
Adjusted EBITDAProfit before depreciation, amortization and impairment, financial items and taxes excluding items affecting comparability.
Items affecting comparabilityProfit/loss items of a non-recurring nature with a significant impact on profit which are important in understanding the underlying development of the business. See Note B5.
Capital definitionsCapital employed Calculated as the balance sheet’s total assets excluding financial assets and pension assets, less any trade payables and other current non-interest-bearing liabilities.
Working capital Working capital is calculated as short-term operating receivables (inventories, accounts receivable and other non-inter-est-bearing current receivables) less cur-rent operating liabilities (trade payables and other non-interest-bearing current liabilities).
Net debt Calculated as financial liabilities and provisions for pensions with deductions for financial assets (surplus in funded pension plans, financial assets and cash and cash equivalents).
Profitability ratiosReturn on capital employedAccumulated return on capital employed is calculated as 12-month rolling oper-ating profit as a percentage of average capital employed for the five most recent quarters. The corresponding key figure for a single quarter is calculated as oper-ating profit for the quarter multiplied by four as a percentage of capital employed on average for the two most recent quarters.
Cash flow performance measuresOperating cash surplus EBITDA with deductions for capital gains and capital losses from property, plant and equipment and intangible assets and the reversal of the share of profits of associates and the result of the forest revaluation.
Operating cash flow Operating cash flow comprises the sum of operating cash surplus and change in working capital, with deductions for current capital expenditure and restruc-turing costs.
Cash flow from current operations Operating cash flow less net financial items and tax payments and taking into account other financial cash flow.
Strategic capital expenditures in non-current assets Strategic capital expenditures increase the company’s future cash flow through acquisitions of companies, capital expenditures to expand facilities, or new technologies that boost competitiveness.
Current capital expenditures, netCurrent net investments consist of invest-ments made to maintain competitiveness, and include maintenance, rationalization and replacement measures or invest-ments of an environmental nature, with deductions for compensation from divested non-current assets, aimed at preserving the value of assets.
Glossary
CTMP (Chemical thermo mechanical pulp) A high-yield pulp produced through heating and mechanical defibration in a refiner of preheated, chemically pre-treat-ed softwood.
FSC (Forest Stewardship Council) An international organization working to ensure responsible forest management. The FSC has developed principles for responsible forestry that can be applied for certifying forest management and that facilitate FSC labeling of wood products from FSC-certified forests.
Kraftliner The surface layer of corrugat-ed board based on fresh wood fiber.
LWC paper (Light Weight Coated) LWC paper is a coated paper with a high mechanical pulp content. Used for high-quality magazines and advertising materials with demanding color-printing requirements.
m3sub Solid cubic meter under bark. Specifies the volume of timber excluding bark and tops. Used in harvesting and the timber trade. 1 m3sub equals about 1.22 m3fo.
m3fo Forest cubic meter. Volume of tim-ber including tops and bark, but exclud-ing branches. Used to describe the forest portfolio of standing timber. Growth is also specified in forest cubic meters. 1 m3fo equals about 0.82 m3sub.
PEFC – Programme for the Endorse-ment of Forest Certification An interna-tional forest certification system.
Productive forest land Land with a pro-ductive capacity that exceeds an average of one cubic meter of forest per hectare annually.
NBSK bleached softwood kraft pulp manufactured by boiling wood fiber with chemicals.
Solid-wood products Wood sawn into various sizes for use in, for example, furniture manufacturing and the joinery industry or as construction timber.
Wood raw material relates to fresh wood fiber used in solid-wood products, pulp and paper products.
151
SC
A A
NN
UA
L R
EP
OR
T 2
01
8Introduction Strategy & operations Board of Directors’ Report Financial statements Sustainability facts Other
About the Annual General Meeting
The Annual General Meeting of Svenska Cellulosa Aktiebolaget SCA will be held on Wednesday, March 20, 2019 at 1:00 p.m. at Hotel Södra Berget, Södra Stadsberget 1, Sundsvall, Sweden.
Registration for the Annual General Meeting will start at 11:30 a.m.
Notification of attendanceShareholders who wish to attend the Annual General Meeting must be listed in the shareholders’ register maintained by Euroclear Sweden AB on Thursday, March 14, 2019, and, give notice of their intention to attend the meeting no later than Thursday, March 14, 2019.
Notification may be given in any of the following manners: – by telephone at +46 60 19 33 00, week
days between 8:00 a.m. and 5:00 p.m – on the company’s website www.sca.com
– by mail to Svenska Cellulosa Aktiebolaget SCA, Group Function Legal Affairs, “Annual General Meeting” SE851 88, Sundsvall, Sweden
The following applies to shareholders who have their shares registered through a bank or other nominee in order to be entitled to attend the meeting. In addition to giving notification, shareholders must request that their shares be registered under their own names. Such registration in the shareholders’ register must be completed at Euroclear Sweden AB by Thursday, March 14, 2019 at the latest. In such cases, the shareholders in question should instruct the bank or nominee of this well in advance of Thursday, March 14, 2019. Such registration may be temporary.
Name, personal identity number/corporate registration number, address and telephone number, and telephone number of assistants, if any, should be stated
when notification is given. Shareholders represented by proxy must issue a power of attorney for their representative. Proxy forms are available in Swedish and English upon request from the company and are also available on the company’s website www.sca.com. A power of attorney is valid for one year from its issue or the longer period of validity stipulated in the power of attorney, though not more than five years. Anyone representing a legal entity must present a copy of the registration certificate, not older than one year, or equivalent authorization documents, listing the authorized signatories. To facilitate entry into the Meeting, the power of attorney in the original, the registration certificate and other authorization documents should be sent to the company at the above address, well in advance of the Meeting.
The Notice convening the Annual General Meeting can be found on the company website www.sca.com.
Production: SCA in collaboration with Narva and Bold. Translation: The Bugli Company.Photos: Torbjörn Bergqvist, Michael Engman, Mattias Andersson, Dennis Ersöz, Erika Edmark, PerAnders Sjöquist, Linda Snell, Jan Lindblad, Isak Berglund MattsonMårn, Juliana Yondt and Olle Hedvall.Illustrations: Fellow Designers/Agent Bauer and Nadia Nörbom
Paper: Insert – GraphoSilk FSC 90 g from SCA. Cover – Invercote G, 280 g.SCA’s Annual Report is produced with the greatest possible environmental consideration. Our paper, GraphoSilk 90 g/m2, is manufactured using raw material from responsibly managed forests in Northern Sweden at Ortviken paper mill, a mill with exceptionally low emissions of CO2 from fossil sources.
Printing: Stibo Complete, Katrineholm, 2019
NO
RDIC
SWAN ECOLABE
L
Printed matter5041 0004
PEFC/09-31-017
HeadquartersSvenska Cellulosa Aktiebolaget SCA (publ)
Corp. Reg. No.: 5560126293Postal address: SE851 88 Sundsvall, SwedenStreet address: Skepparplatsen 1
For details about contact persons, refer to sca.com
Telephone: +46 60 19 30 00Email: [email protected]: www.sca.com
Addresses

152
SC
A A
NN
UA
L R
EP
OR
T 2
01
8
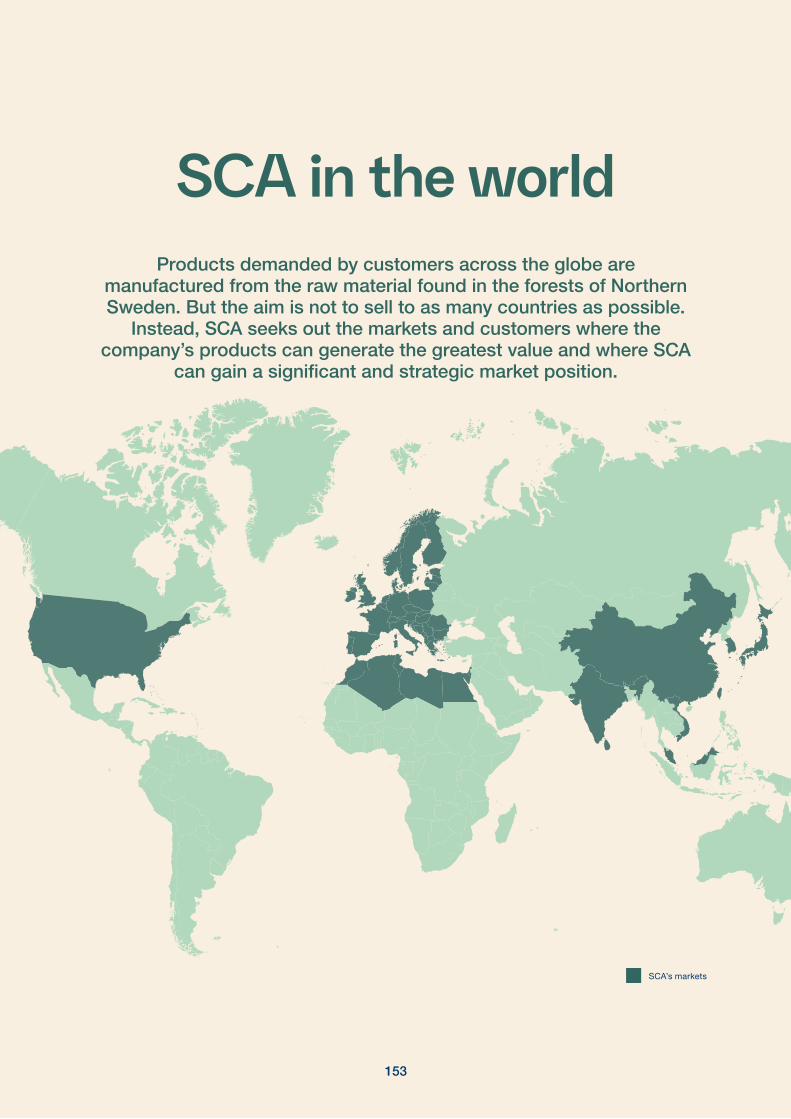
153
Introduction Strategy & operations Board of Directors’ Report Financial statements Sustainability facts Other
SCA’s markets
SCA in the worldProducts demanded by customers across the globe are
manufactured from the raw material found in the forests of Northern Sweden. But the aim is not to sell to as many countries as possible.
Instead, SCA seeks out the markets and customers where the company’s products can generate the greatest value and where SCA
can gain a significant and strategic market position.
153
SC
A A
NN
UA
L R
EP
OR
T 2
01
8
154sca.com
A year has passed.Our forest continues to grow in diversity, in size and in value.
And from it, a new and sustainable society is growing.
SC
A A
NN
UA
L R
EP
OR
T 2
01
8


