Page 1
SCADA Intrusion Detection System Test Framework
By: Henrik Waagsnes
Supervisor: Nils Ulltveit-Moe, Associate Professor Ph.D
IKT 590 - Master’s thesis Spring 2017
Department of Information and Communication Technology
Faculty of Engineering and Science
University of Agder
Grimstad, 21 May 2017
Page 2
Henrik Waagsnes SCADA Intrusion Detection System Test Framework
2
Abstract
Supervisory control and data acquisition (SCADA) systems play an important role in our
critical infrastructure (CI). Several of the protocols used in SCADA communication are old
and lack of security mechanisms. This master thesis presents a SCADA Intrusion
Detection System Test Framework that can be used to simulate SCADA traffic and detect
malicious network activity. The framework uses a signature-based approach and utilize
two different IDS engines, Suricata and Snort. The IDS engines include rule-sets for the
IEC 60870-5-104, DNP3 and Modbus protocols. The IDS engines ships detected events
to a distributed cluster and visualize them using a web interface.
The experiments carried out in this project show that there generally is little difference
between Suricata and Snort's ability to detect malicious traffic. Suricata is compatible with
signatures written in snort lightweight rules description language. I did however, discover
some compatibility issues.
The purposed framework applies additional latency to the analysis of IDS events. The
perceived latency was generally higher for Snort events than for Suricata events. The
reason for this is probably the additional processing time applied by the implemented log
conversion tool.
Keywords: SCADA, IDS, SIEM
Page 3
Henrik Waagsnes SCADA Intrusion Detection System Test Framework
3
Preface
This report is the result of the master thesis IKT 590 (30 ECTS) which is part of my fourth
semester MSc study at the Faculty of Engineering and Science, University of Agder (UiA)
in Grimstad, Norway. The work on this project started from 1 January 2017 and ended on
21 May 2017. In this project, I have designed, implemented and demonstrate a "SCADA
Intrusion Detection System Test Framework".
I would like to express my gratitude to my supervisor Nils Ulltveit-Moe for making this
Master Thesis possible and giving me guidance and feedback throughout this project.
I would also like to thank NC-Spectrum AS for good support and for inviting me to a
conference in Kviteseid themed securing SCADA systems. This conference helped me
kick start my master thesis and gave me many new ideas.
Grimstad May 2017 Henrik Waagsnes
Page 4
Henrik Waagsnes SCADA Intrusion Detection System Test Framework
4
List of figures
Figure 1: Defense-in-depth security layers [3] ................................................................ 12
Figure 2: Activity framework for Design Science Research [5] ....................................... 14
Figure 3: Relationships between kernel theory, mid-range-theory and design theory, and
the design process [5] .................................................................................................... 14
Figure 4: Reasoning in the Design Research Cycle [5] .................................................. 15
Figure 5: Hierarchy of the five levels of distribution automation (DA)[1] ......................... 16
Figure 6: DA level interconnection [1] ............................................................................. 17
Figure 7: First generation SCADA Architecture [6] ......................................................... 18
Figure 8: Second generation SCADA Architecture [6] .................................................... 19
Figure 9: Third generation SCADA Architecture [6] ........................................................ 19
Figure 10: Fourth generation SCADA Architecture [8] .................................................... 20
Figure 11: IEC 60870-5-104 APDU [11] ......................................................................... 21
Figure 12: Control Field Information Type Structure [10] ................................................ 21
Figure 13: Code Type Groups [10] ................................................................................. 21
Figure 14: DNP3 master/slave architecture [10] ............................................................. 22
Figure 15: DNP3 Data Link Frame [10] ......................................................................... 22
Figure 16: Modbus Client/Server communication model [13] ......................................... 23
Figure 17: Modbus TCP/IP communication architecture [13] ......................................... 24
Figure 18: General Modbus frame [13] ........................................................................... 24
Figure 19: Modbus TCP/IP frame [13] ............................................................................ 24
Figure 20:Interrelations between the IEC TC57 standards and the IEC 62351 security
standards [20] ................................................................................................................. 27
Figure 21: Stuxnet first three stages[21] ......................................................................... 28
Figure 22: Stuxnet last three stages[21] ......................................................................... 28
Figure 23: Multilayer SCADA cyber-security framework with IDS [31] ............................ 34
Figure 24: SCADA-IDS security management system [31] ............................................ 34
Figure 25: Hybrid SCADA-IDS process [31] ................................................................... 35
Figure 26: OCSVM classification [35] ............................................................................. 38
Figure 27: Alert-ontology [40] ......................................................................................... 40
Figure 28: Architecture overview [41] ............................................................................. 42
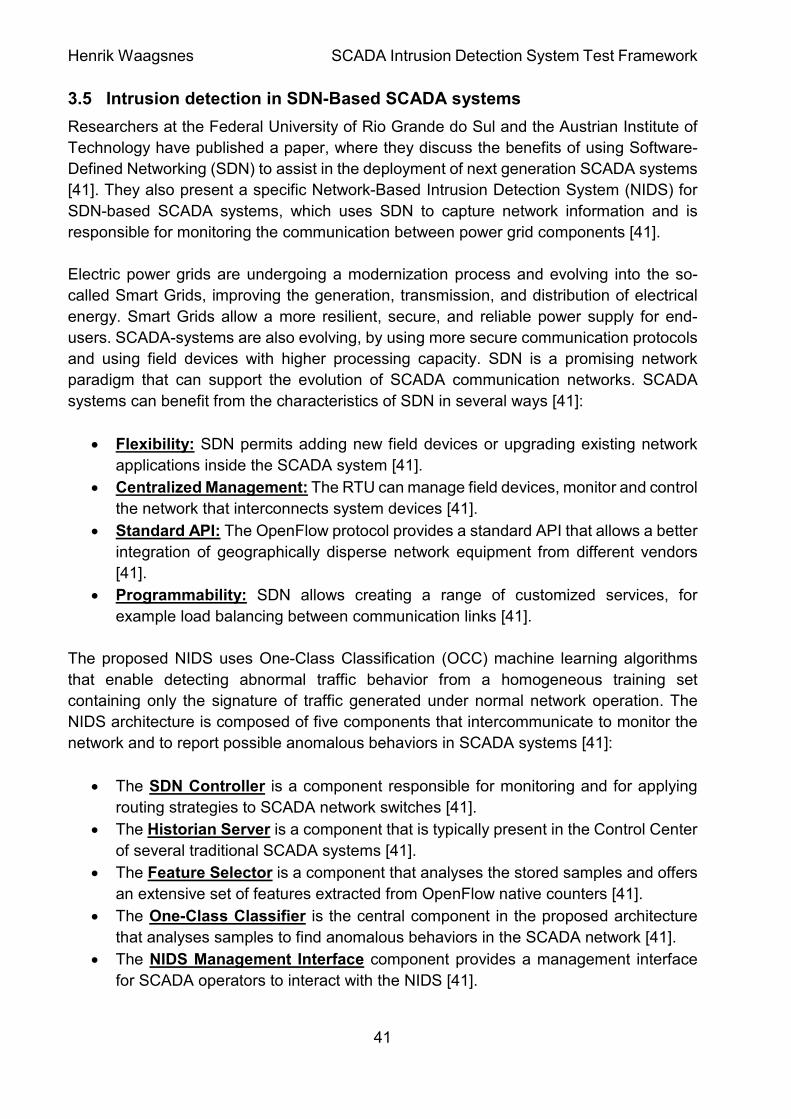
Figure 29: SCADA network topology [41] ....................................................................... 43
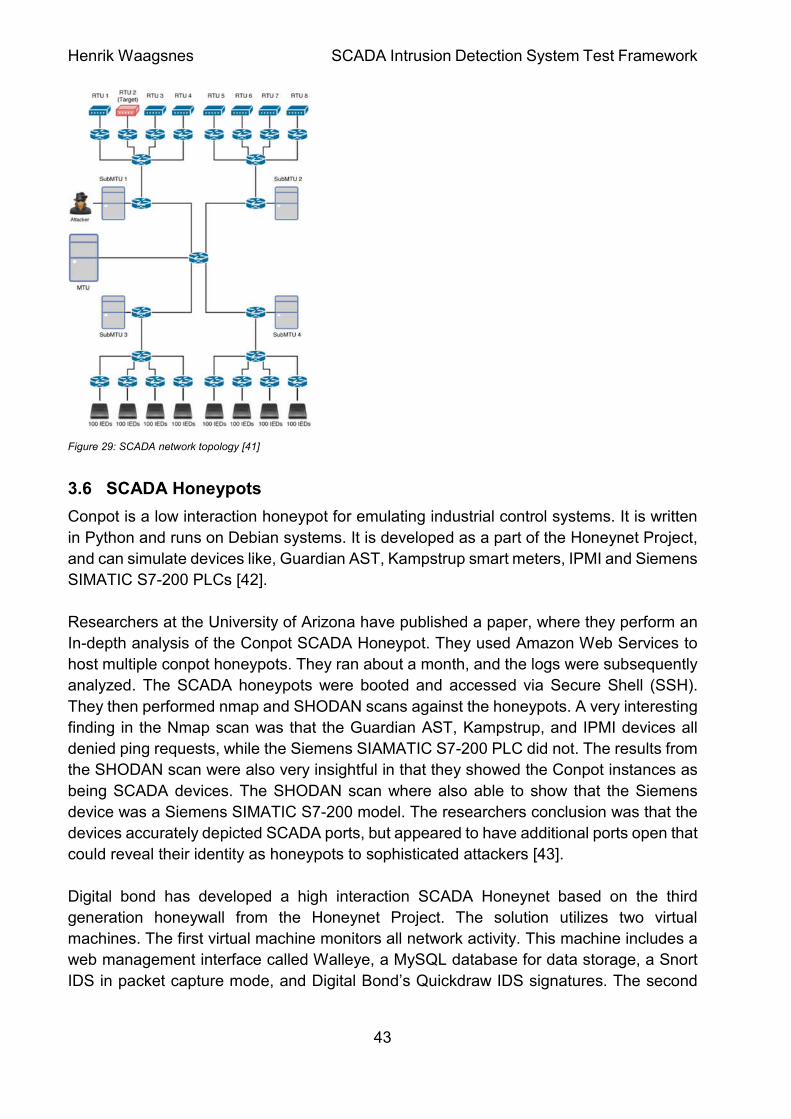
Figure 30: SCADA Honeynet architecture [44] ............................................................... 44
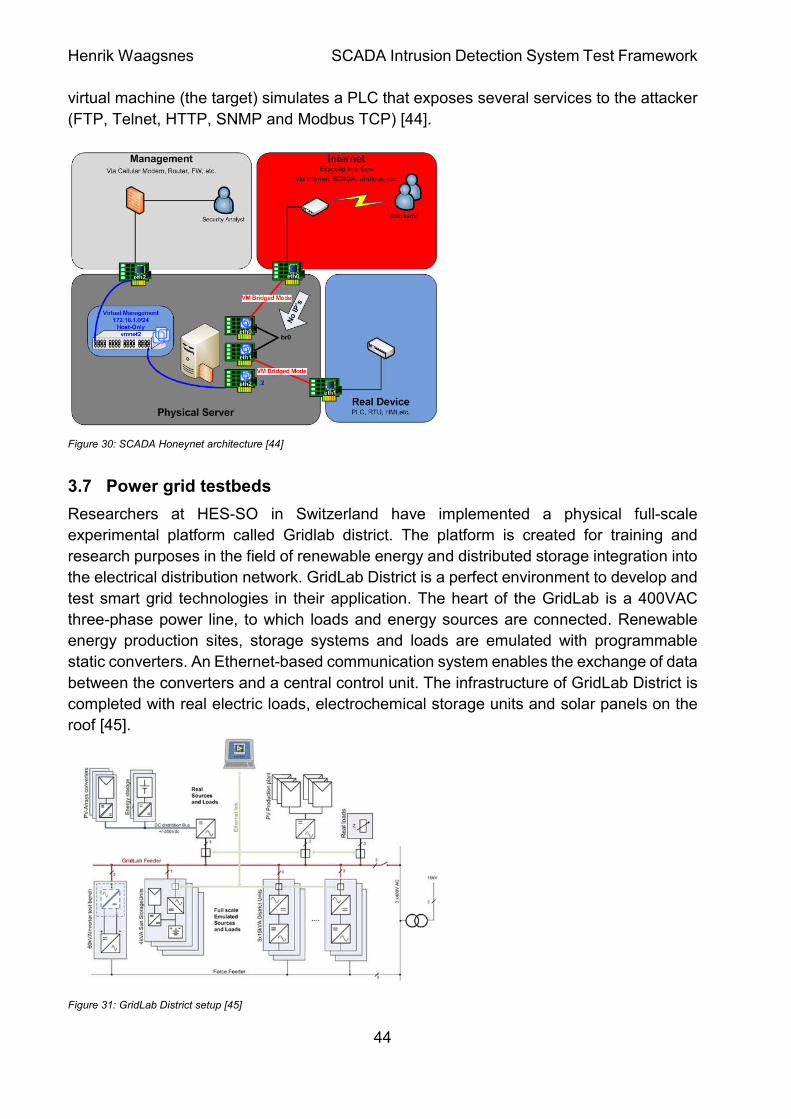
Figure 31: GridLab District setup [45] ............................................................................. 44
Figure 32: Implementation overview of SoftGrid testbed [46] ......................................... 45
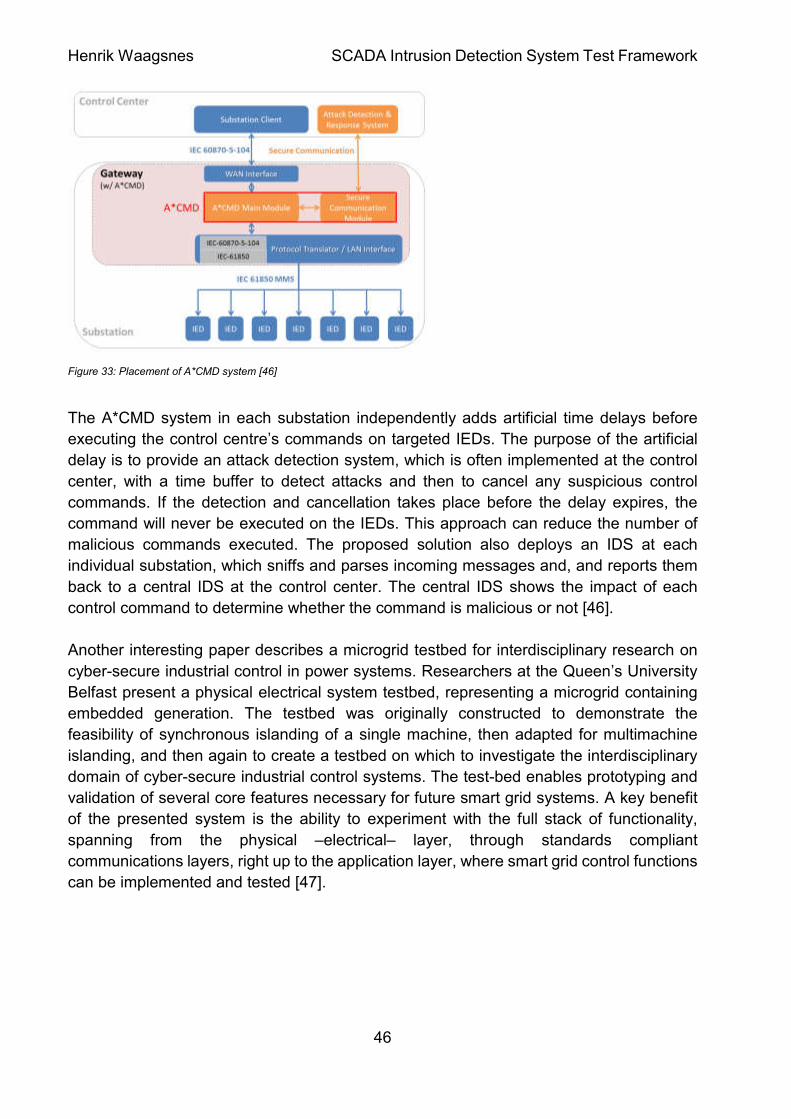
Figure 33: Placement of A*CMD system [46] ................................................................. 46
Figure 34: Framework Architecture ................................................................................ 49
Figure 35: IEC Server panels ......................................................................................... 51
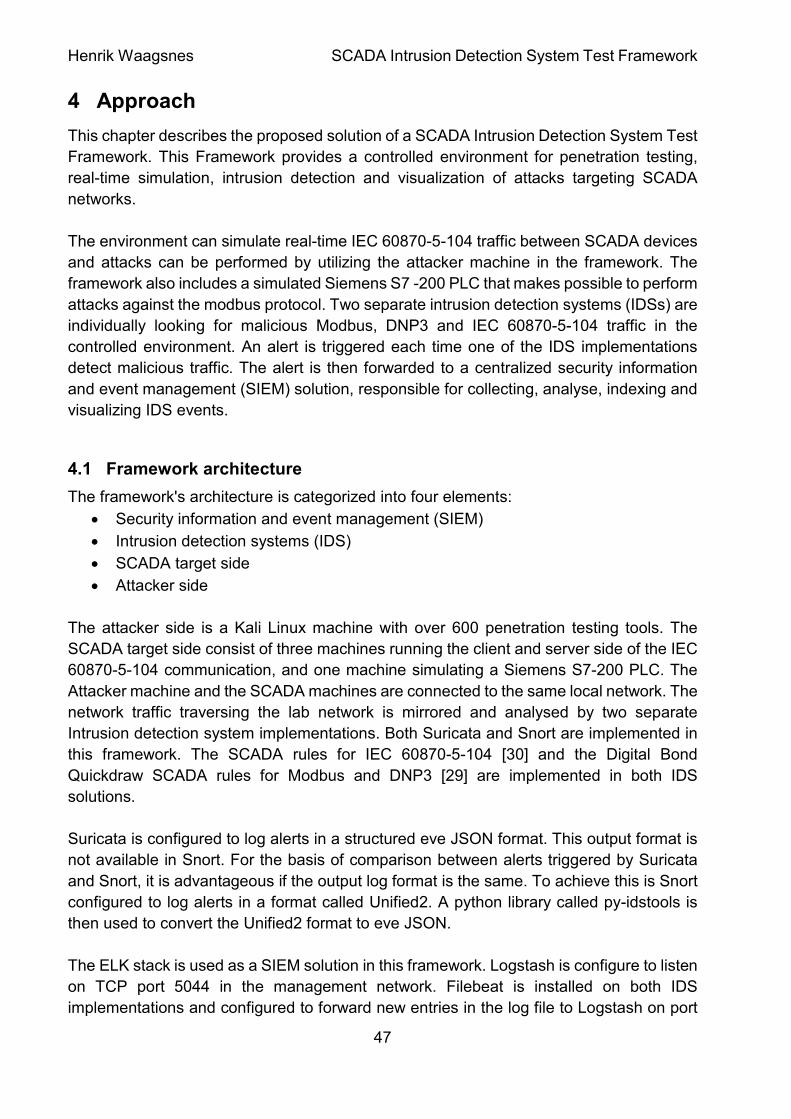
Figure 36: qtester104.ini configuration file ...................................................................... 52
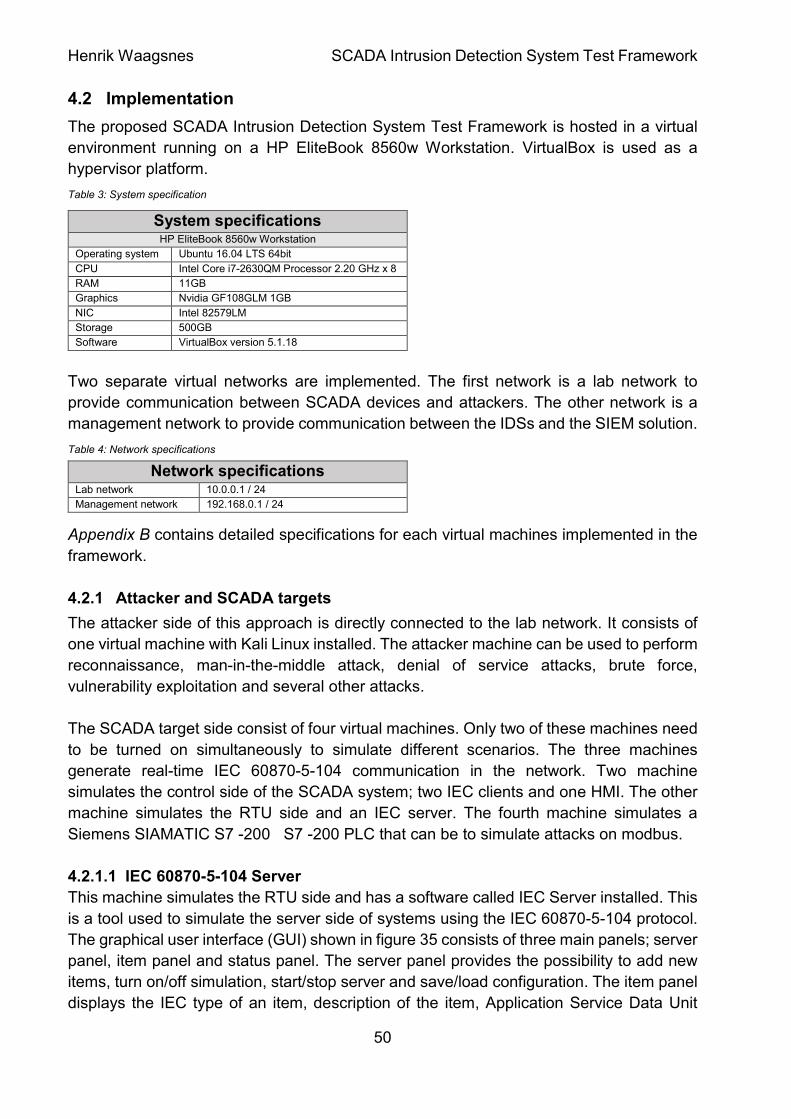
Figure 37: QTester104 GUI connected to IEC Server .................................................... 52
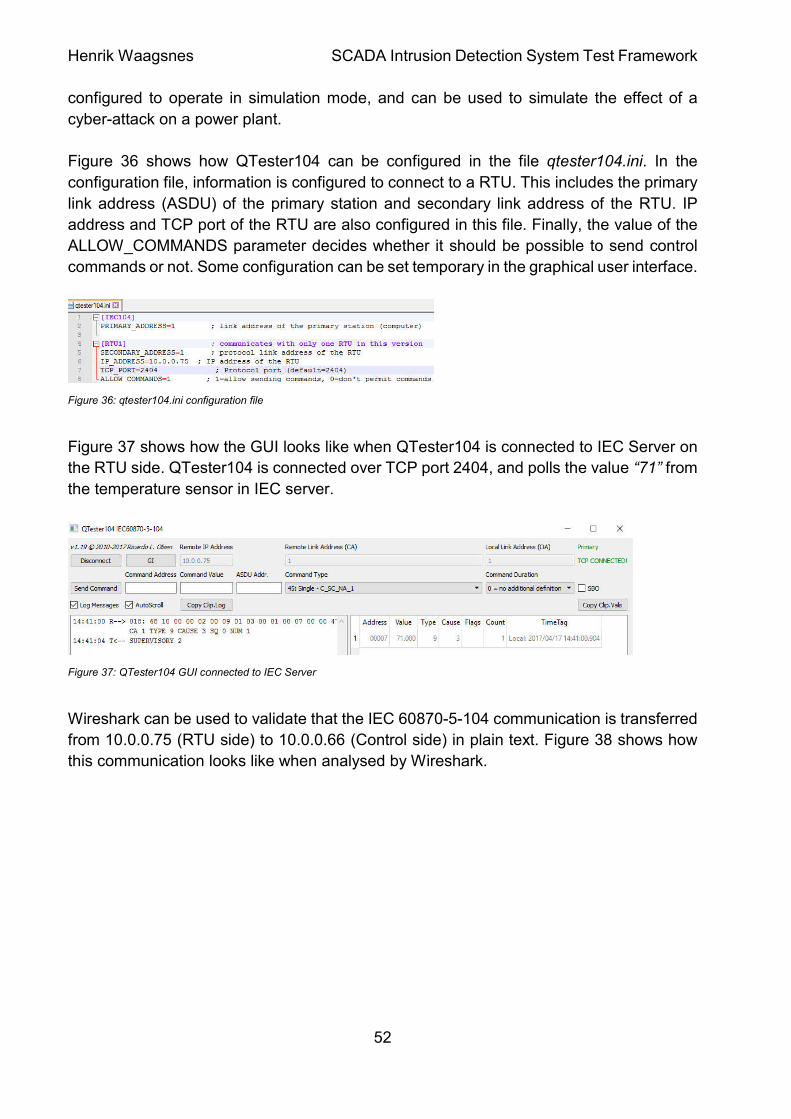
Figure 38: Wireshark analysis of IEC 60870-5-104 communication ............................... 53
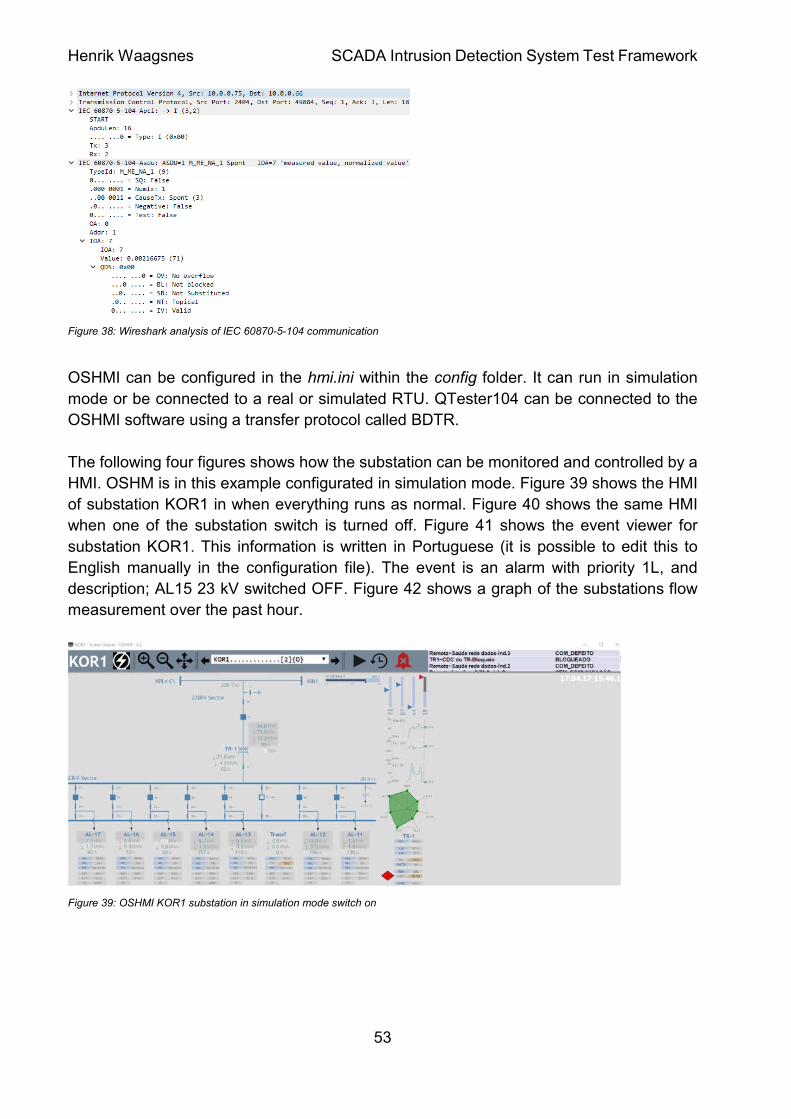
Figure 39: OSHMI KOR1 substation in simulation mode switch on ................................ 53
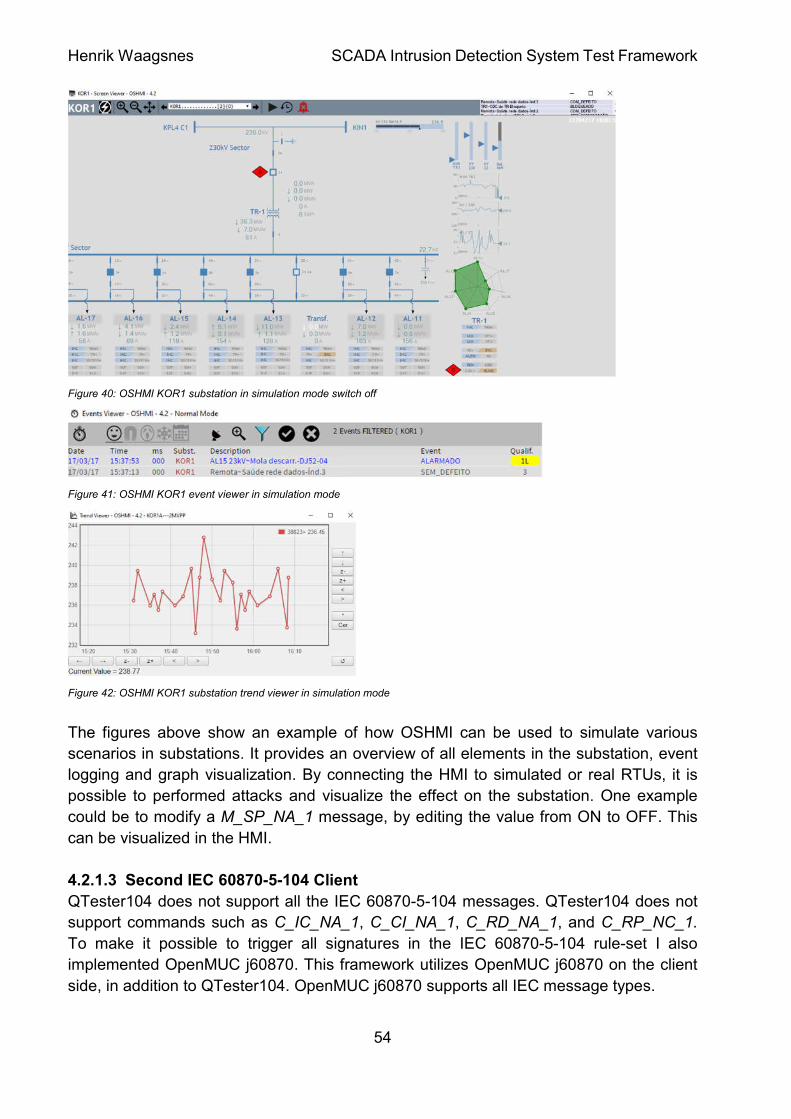
Figure 40: OSHMI KOR1 substation in simulation mode switch off ................................ 54
Page 5
Henrik Waagsnes SCADA Intrusion Detection System Test Framework
5
Figure 41: OSHMI KOR1 event viewer in simulation mode ............................................ 54
Figure 42: OSHMI KOR1 substation trend viewer in simulation mode ........................... 54
Figure 43: OpenMUC j60870 Client Console default ...................................................... 55
Figure 44: Adding new commands and acionkeys ......................................................... 55
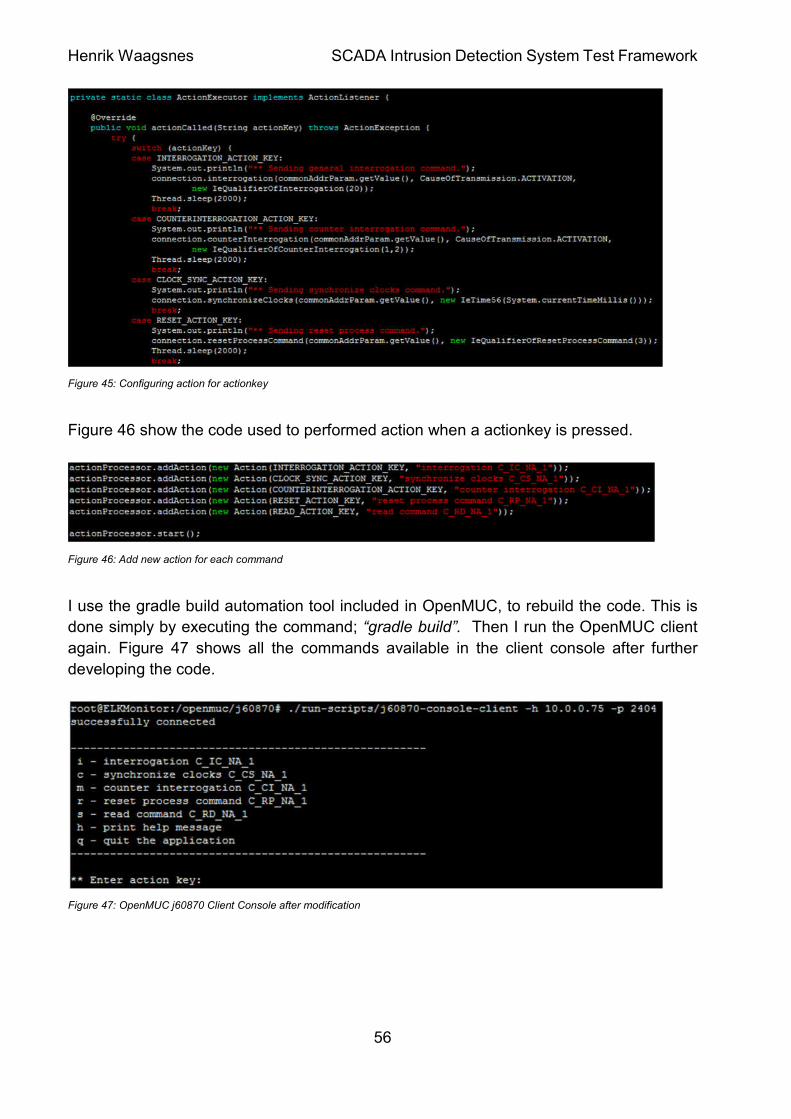
Figure 45: Configuring action for actionkey .................................................................... 56
Figure 46: Add new action for each command ............................................................... 56
Figure 47: OpenMUC j60870 Client Console after modification ..................................... 56
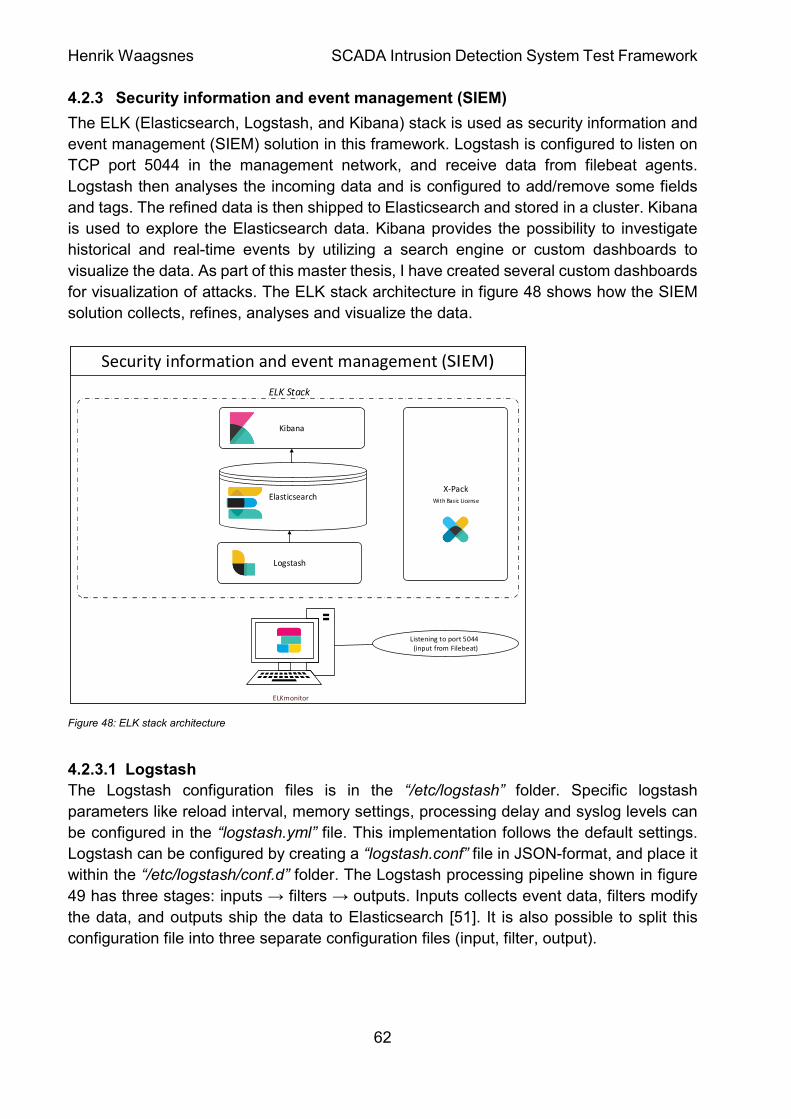
Figure 48: ELK stack architecture................................................................................... 62
Figure 49: Logstash configuration [51] ........................................................................... 63
Figure 50: Three-node cluster ........................................................................................ 64
Figure 51:ELK stack successfully configured ................................................................. 65
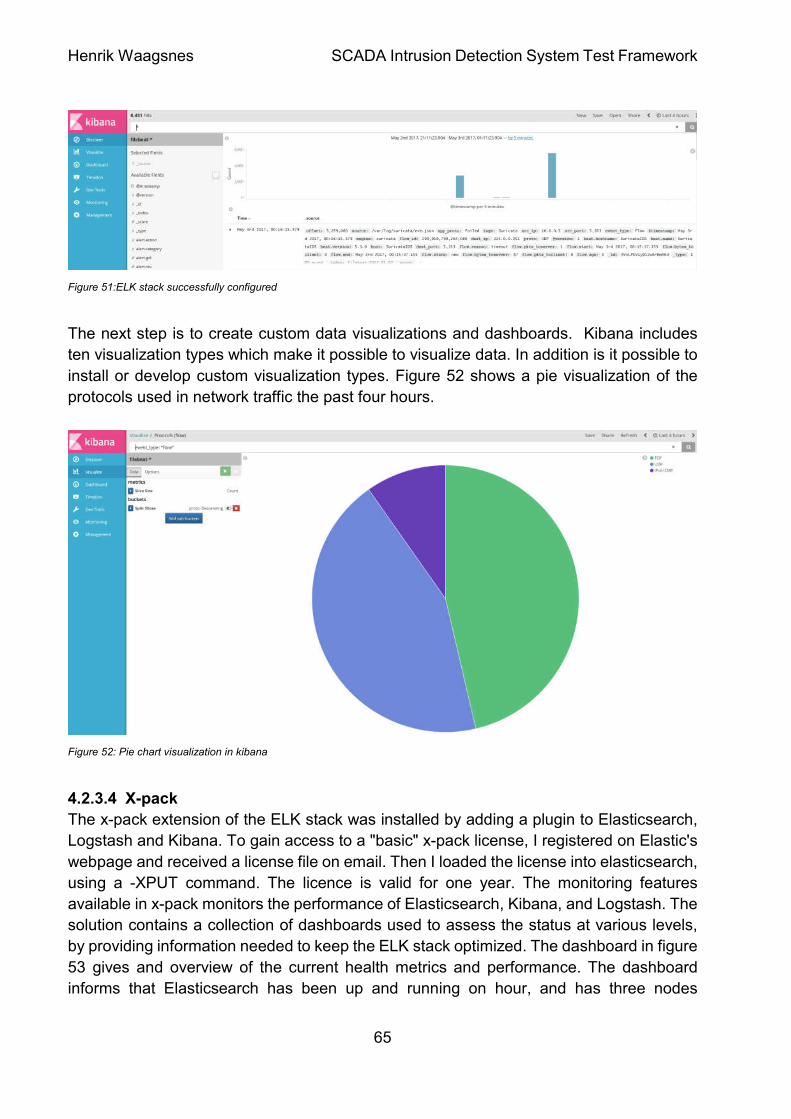
Figure 52: Pie chart visualization in kibana .................................................................... 65
Figure 53: Monitoring dashboard provided by x-pack ..................................................... 66
Figure 54: Elasticsearch monitoring using x-pack .......................................................... 66
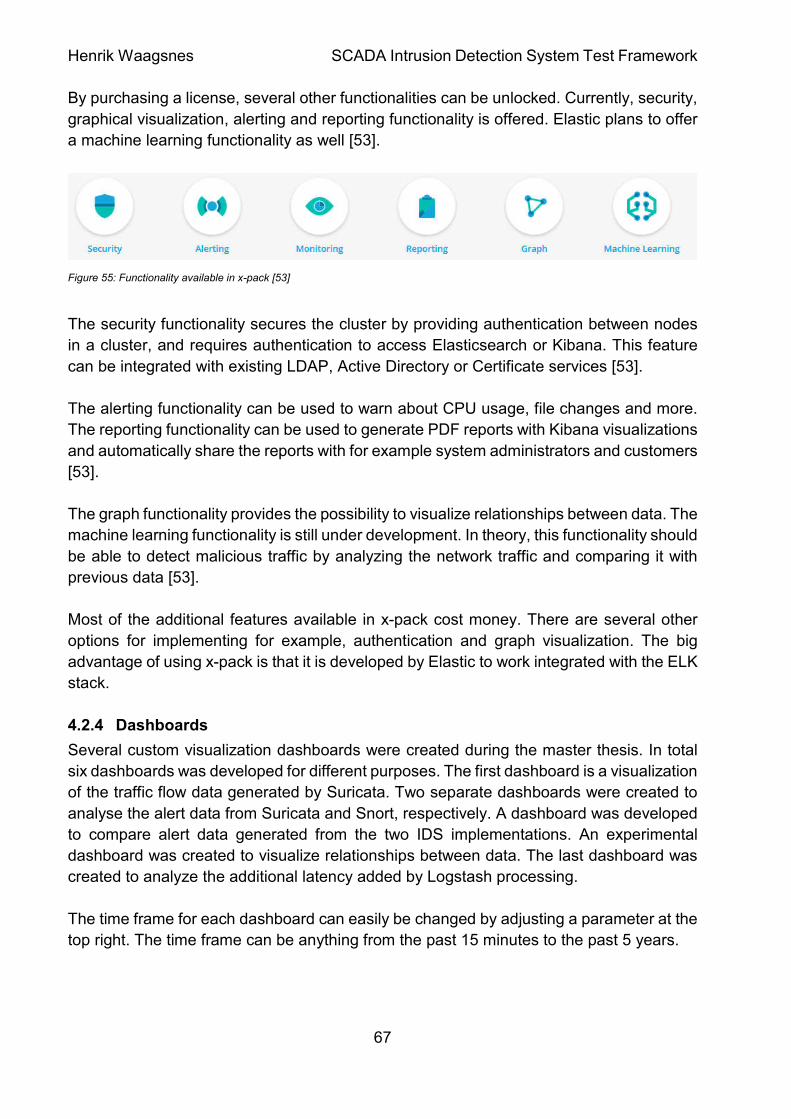
Figure 55: Functionality available in x-pack [53] ............................................................. 67
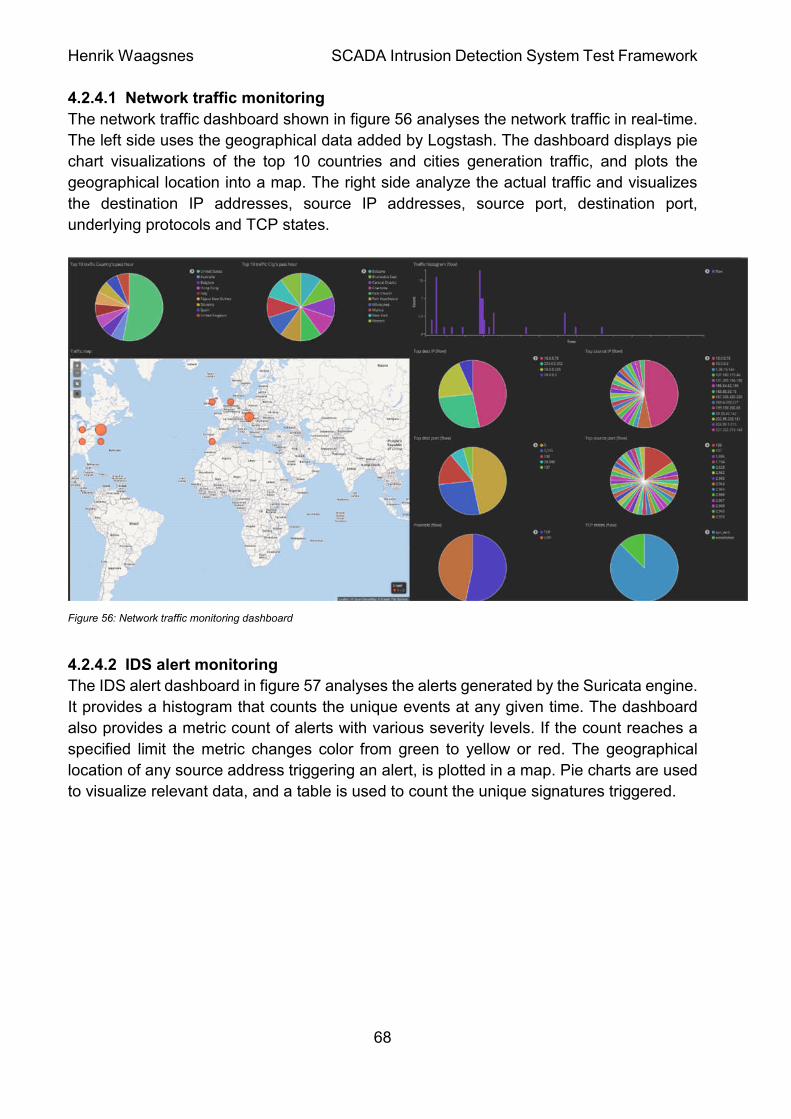
Figure 56: Network traffic monitoring dashboard ............................................................ 68
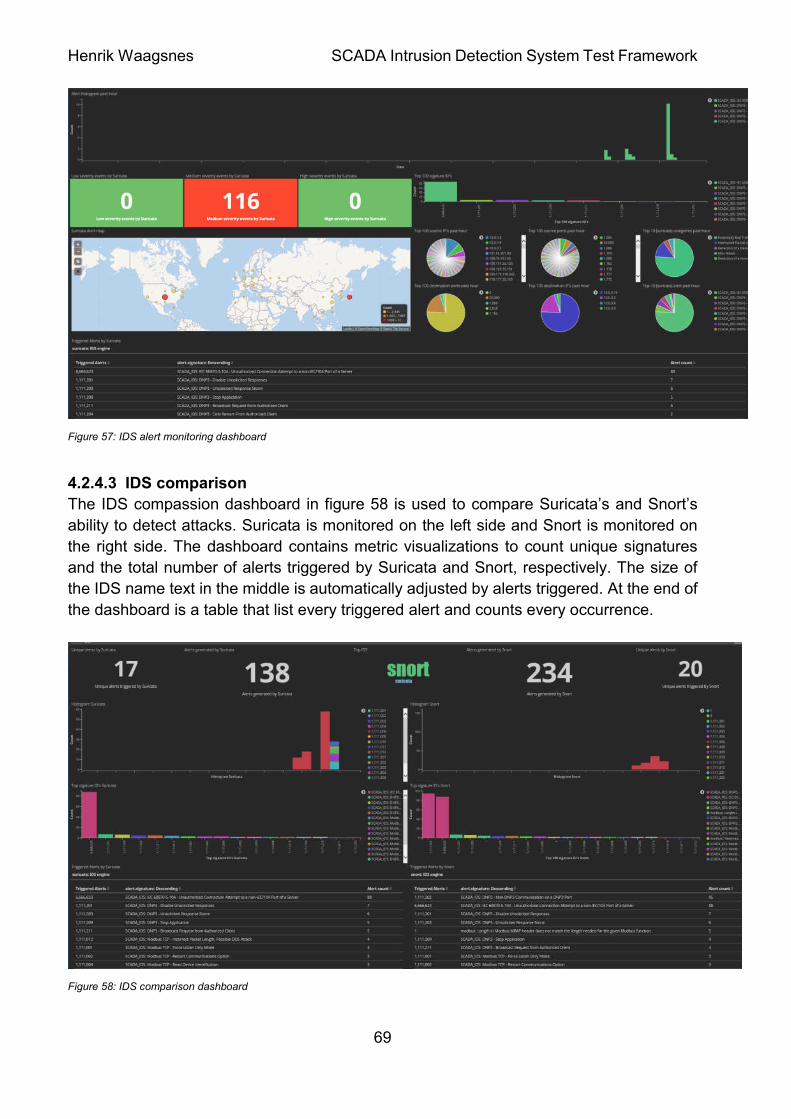
Figure 57: IDS alert monitoring dashboard ..................................................................... 69
Figure 58: IDS comparison dashboard ........................................................................... 69
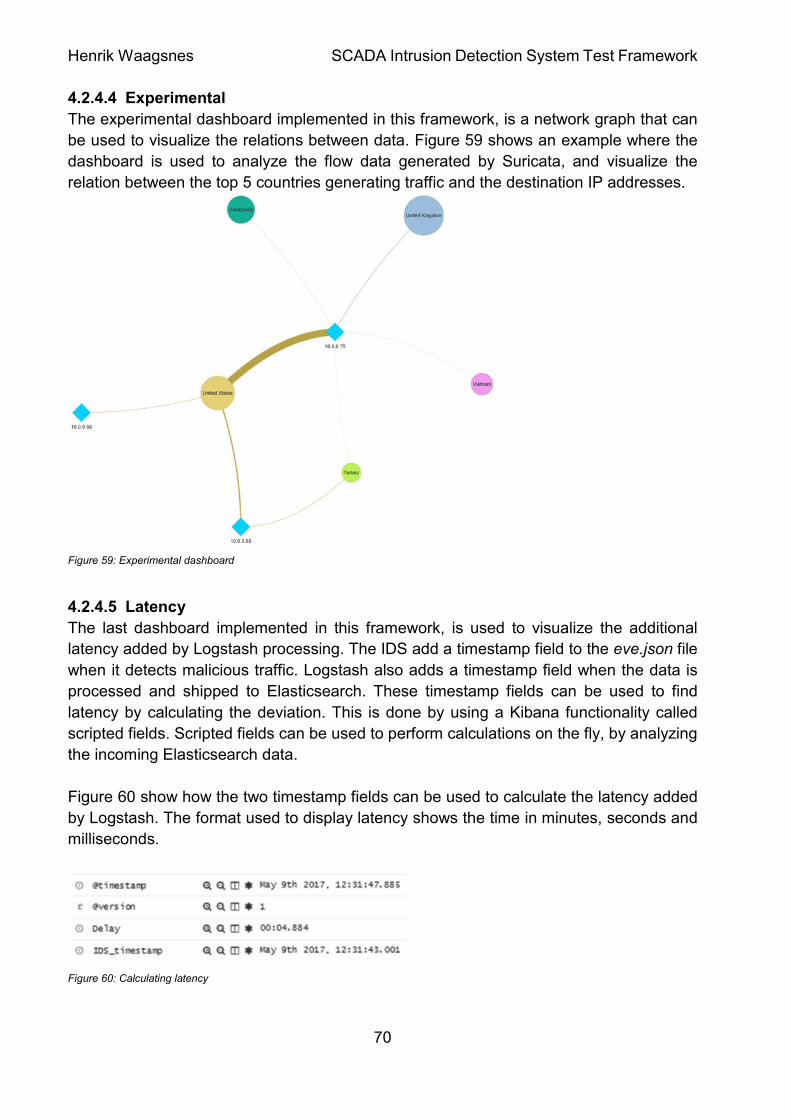
Figure 59: Experimental dashboard ................................................................................ 70
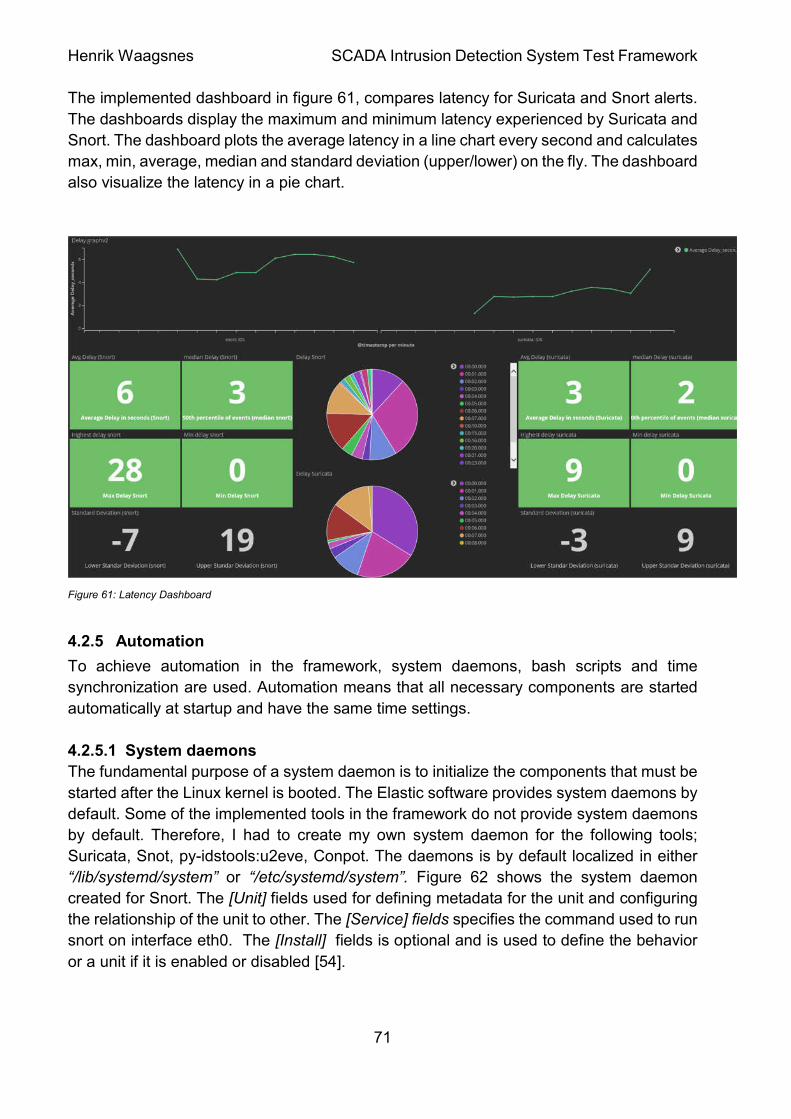
Figure 60: Calculating latency ........................................................................................ 70
Figure 61: Latency Dashboard ....................................................................................... 71
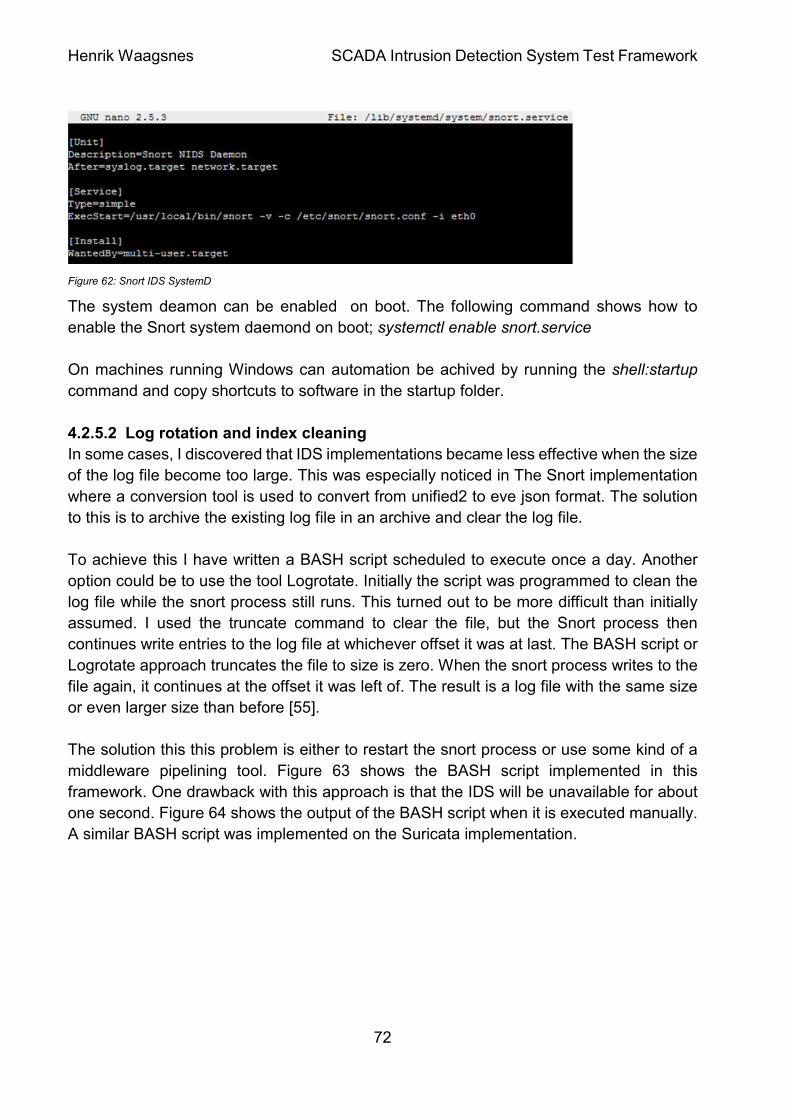
Figure 62: Snort IDS SystemD ....................................................................................... 72
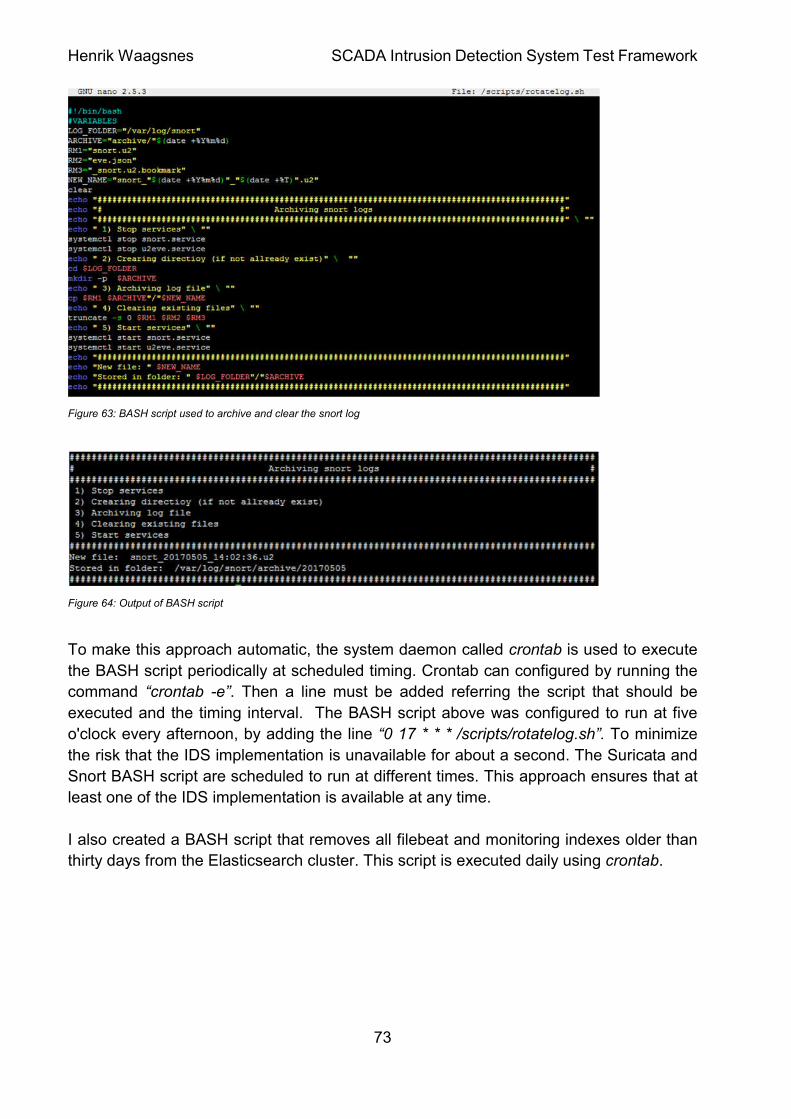
Figure 63: BASH script used to archive and clear the snort log ..................................... 73
Figure 64: Output of BASH script ................................................................................... 73
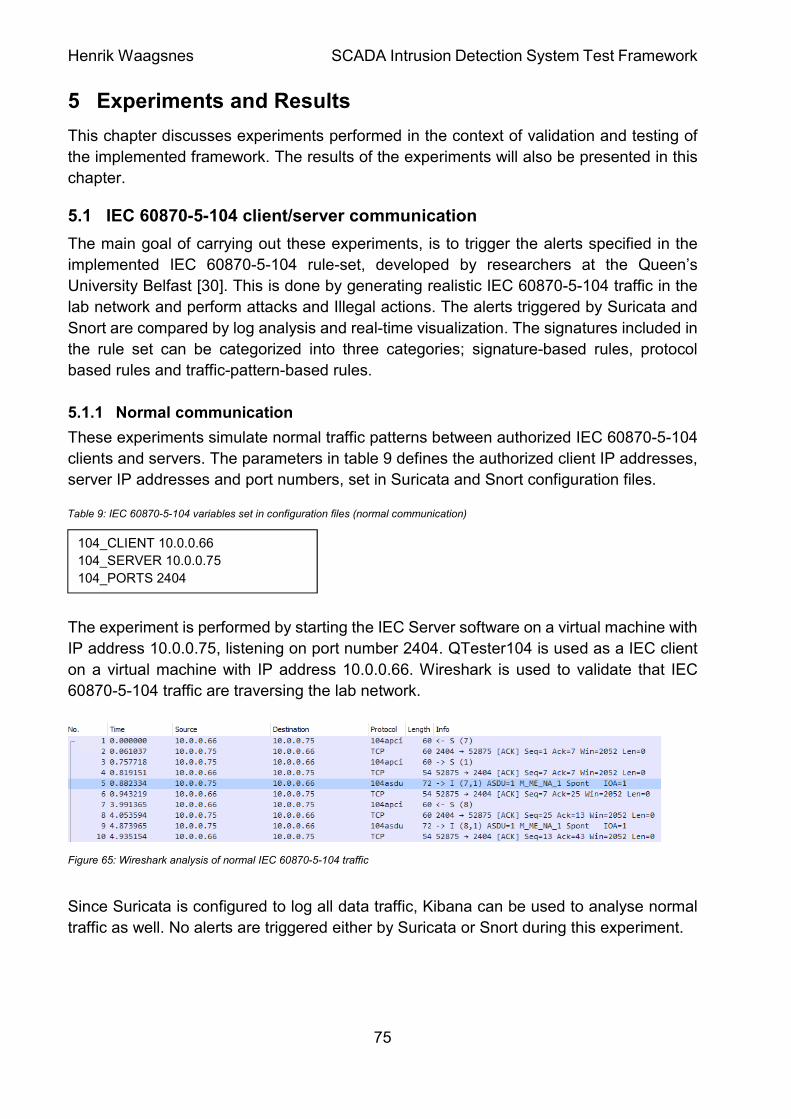
Figure 65: Wireshark analysis of normal IEC 60870-5-104 traffic .................................. 75
Figure 66: Packet Sender client side .............................................................................. 76
Figure 67: Packet Sender server side ............................................................................ 76
Figure 68: Configured IEC Server to send single point information (M_SP_NA_1)
messages every second ................................................................................................. 77
Figure 69: Sending read command (C_RD_NA_1) message from OpenMUC j60870 client
....................................................................................................................................... 77
Figure 70: Sending interrogation command (C_IC_NA_1) message from OpenMUC
j60870 client ................................................................................................................... 77
Figure 71: Sending counter interrogation command (C_CI_NA_1) message from
OpenMUC j60870 client ................................................................................................. 78
Figure 72: Sending a single command (C_SC_NA_1) message from an unauthorized client
....................................................................................................................................... 78
Figure 73: Sending a “set point command, normalized value” (C_SE_NA_1) message from
an unauthorized client .................................................................................................... 78
Figure 74: Sending reset process command (C_RP_NA_1) message from OpenMUC
j60870 client ................................................................................................................... 79
Figure 75: Broadcast request from an unauthorized client ............................................. 79
Figure 76: Snort ARP Spoof Preprocessor ..................................................................... 81
Figure 77: Using xARP to detect ARP spoofing ............................................................. 81
Page 6
Henrik Waagsnes SCADA Intrusion Detection System Test Framework
6
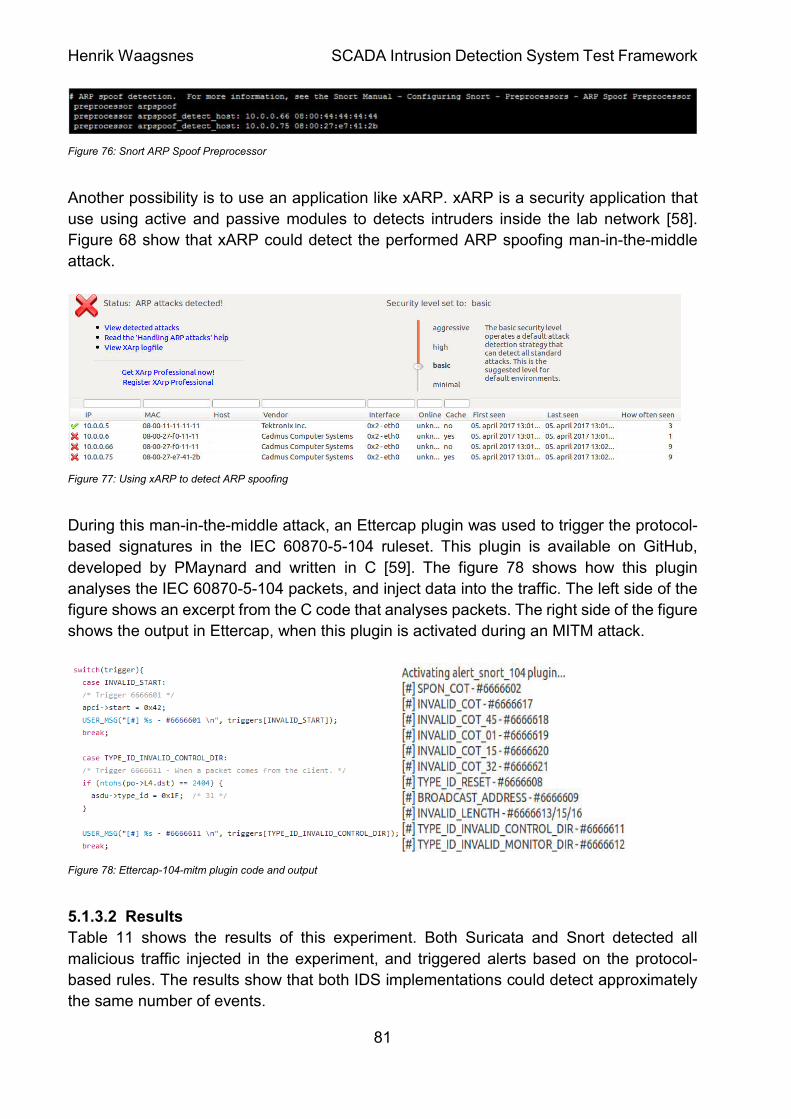
Figure 78: Ettercap-104-mitm plugin code and output .................................................... 81
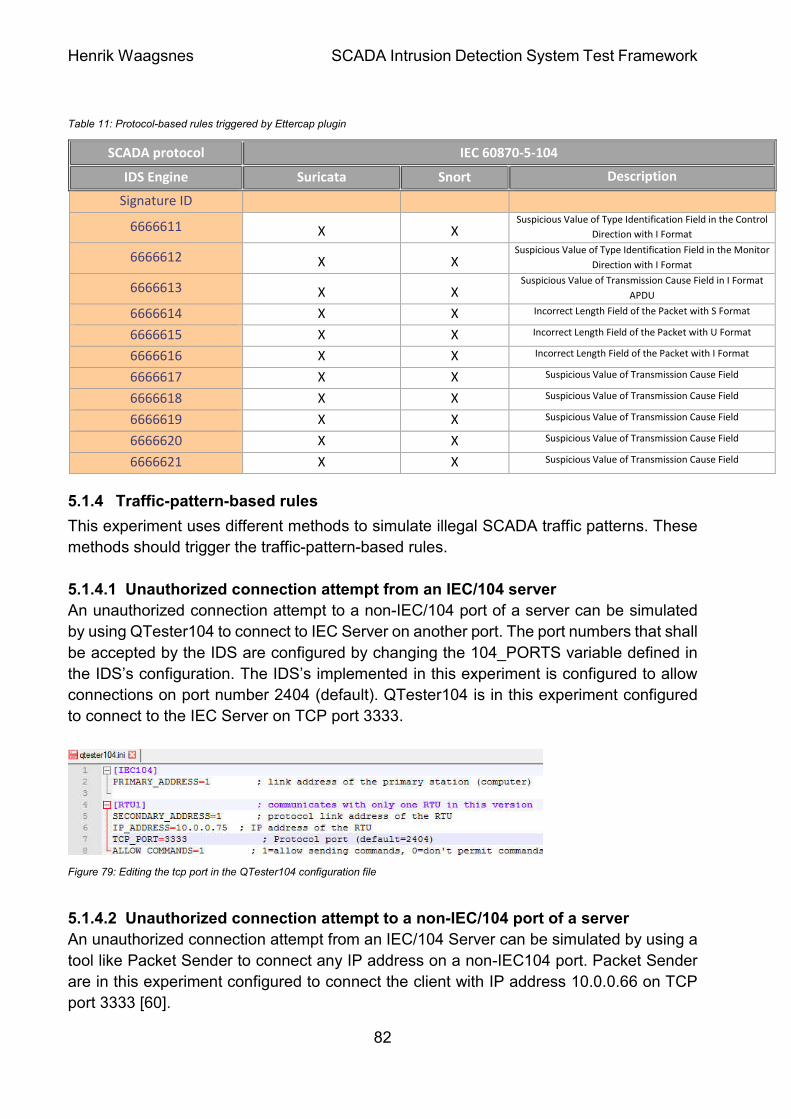
Figure 79: Editing the tcp port in the QTester104 configuration file ................................ 82
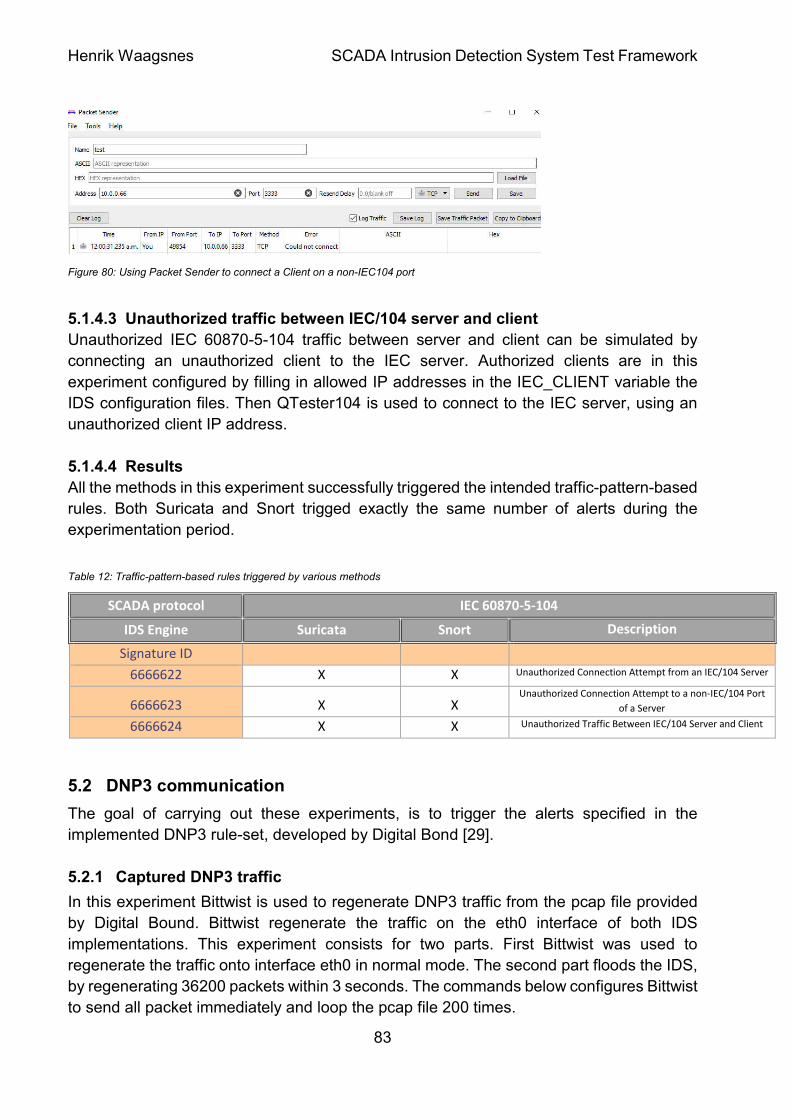
Figure 80: Using Packet Sender to connect a Client on a non-IEC104 port ................... 83
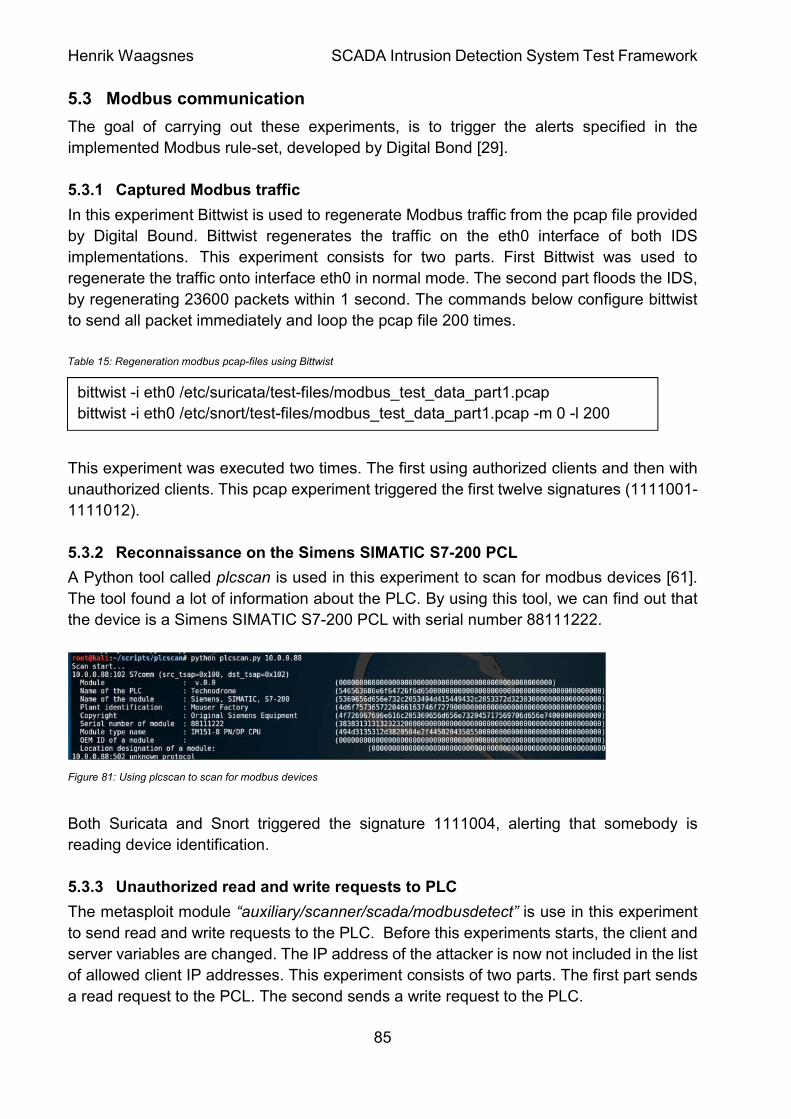
Figure 81: Using plcscan to scan for modbus devices .................................................... 85
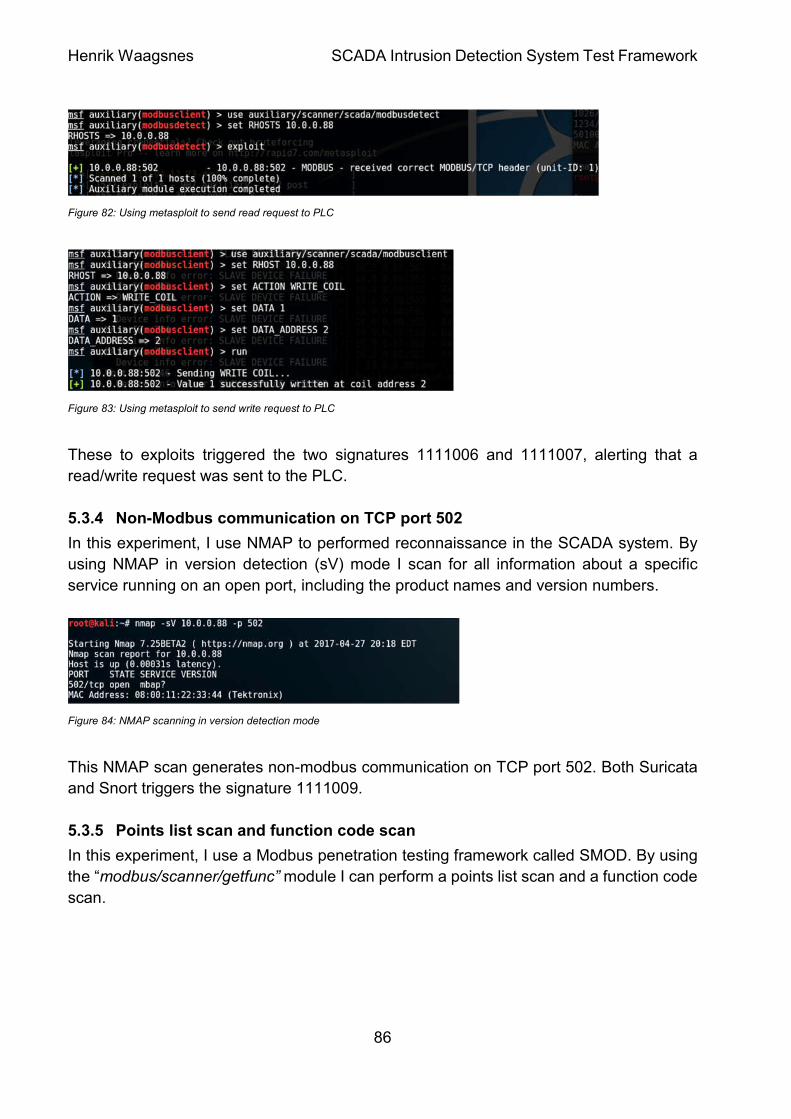
Figure 82: Using metasploit to send read request to PLC .............................................. 86
Figure 83: Using metasploit to send write request to PLC .............................................. 86
Figure 84: NMAP scanning in version detection mode ................................................... 86
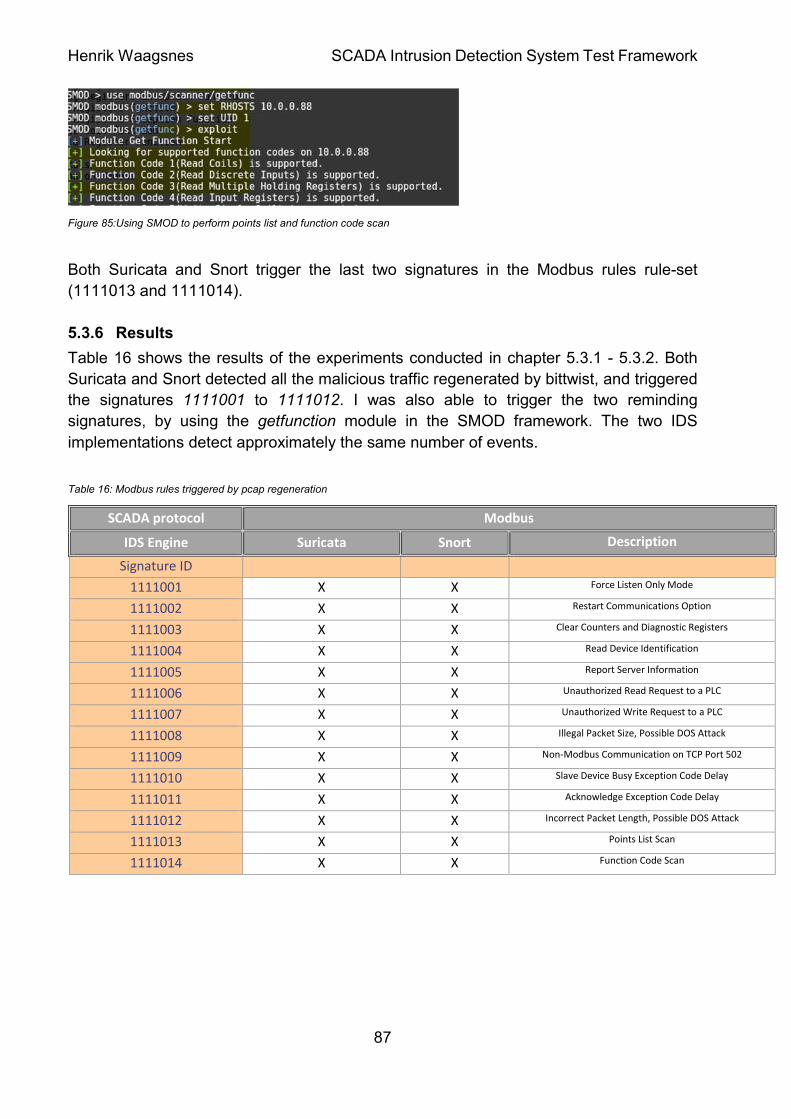
Figure 85:Using SMOD to perform points list and function code scan............................ 87
Figure 86: Using PuTTy to connect via Telnet ................................................................ 88
Figure 87: Using dsniff to sniff username and password used in Telnet connection ...... 88
Figure 88: Using ncrack to brute force telnet passwords ................................................ 88
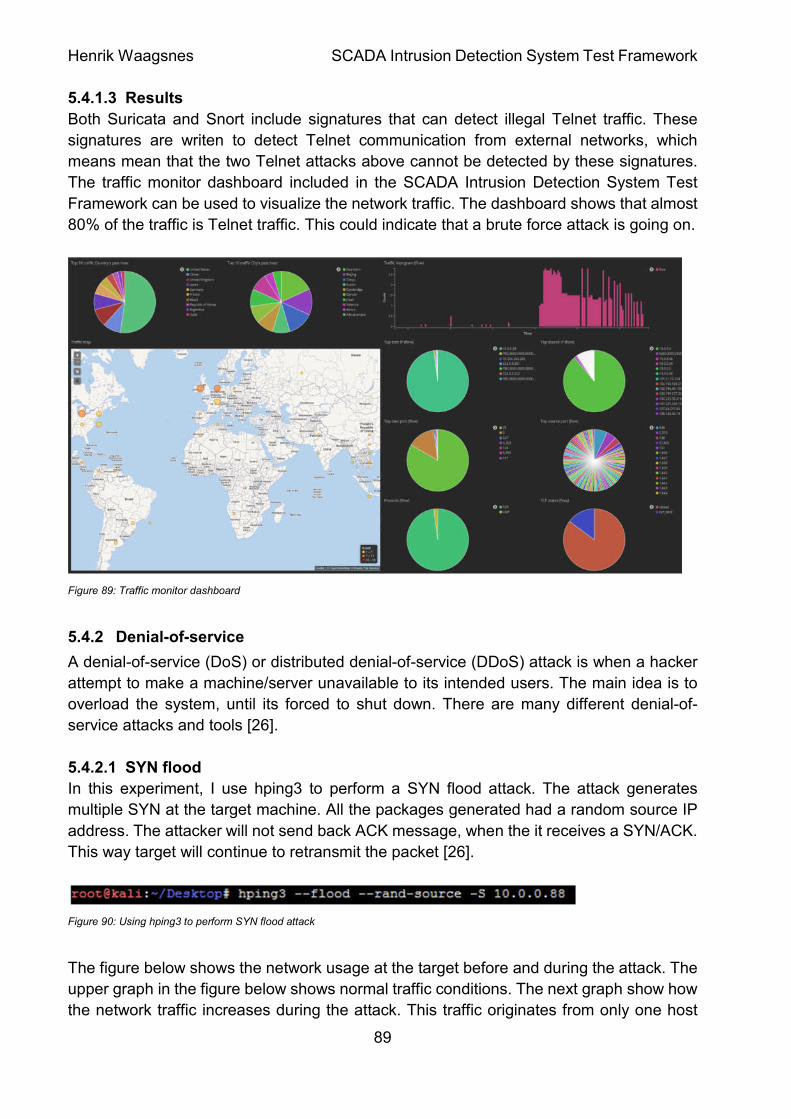
Figure 89: Traffic monitor dashboard .............................................................................. 89
Figure 90: Using hping3 to perform SYN flood attack ..................................................... 89
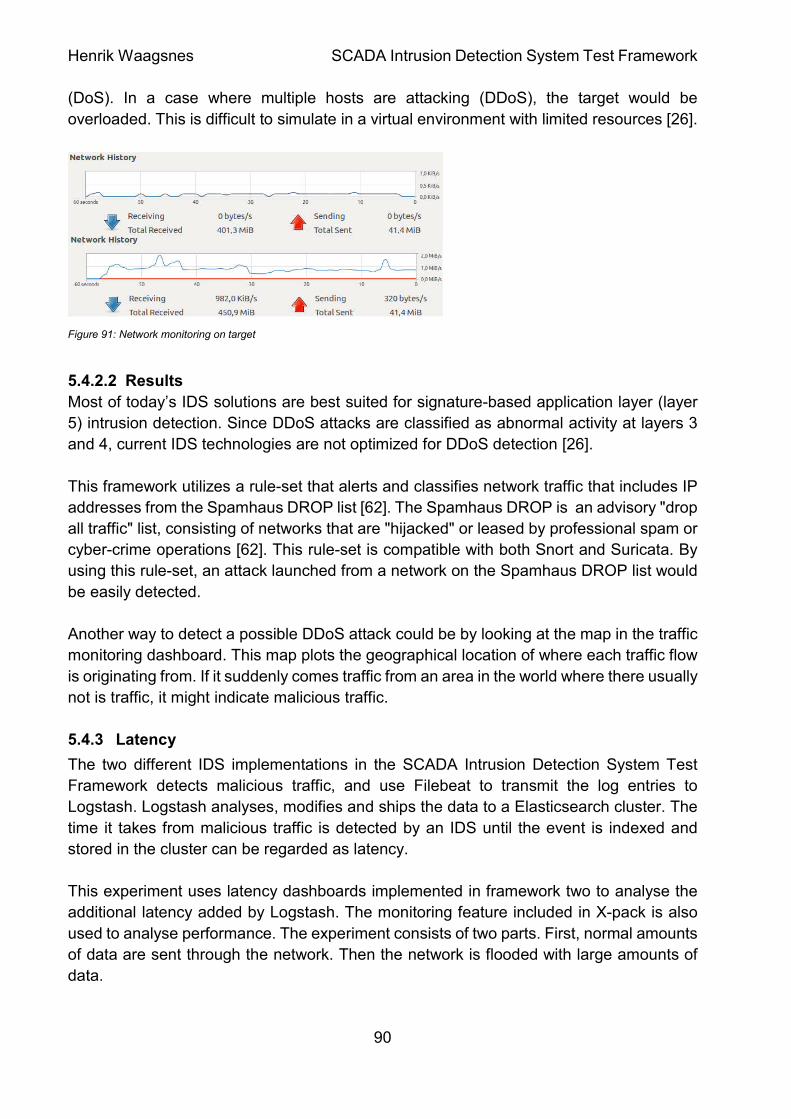
Figure 91: Network monitoring on target ........................................................................ 90
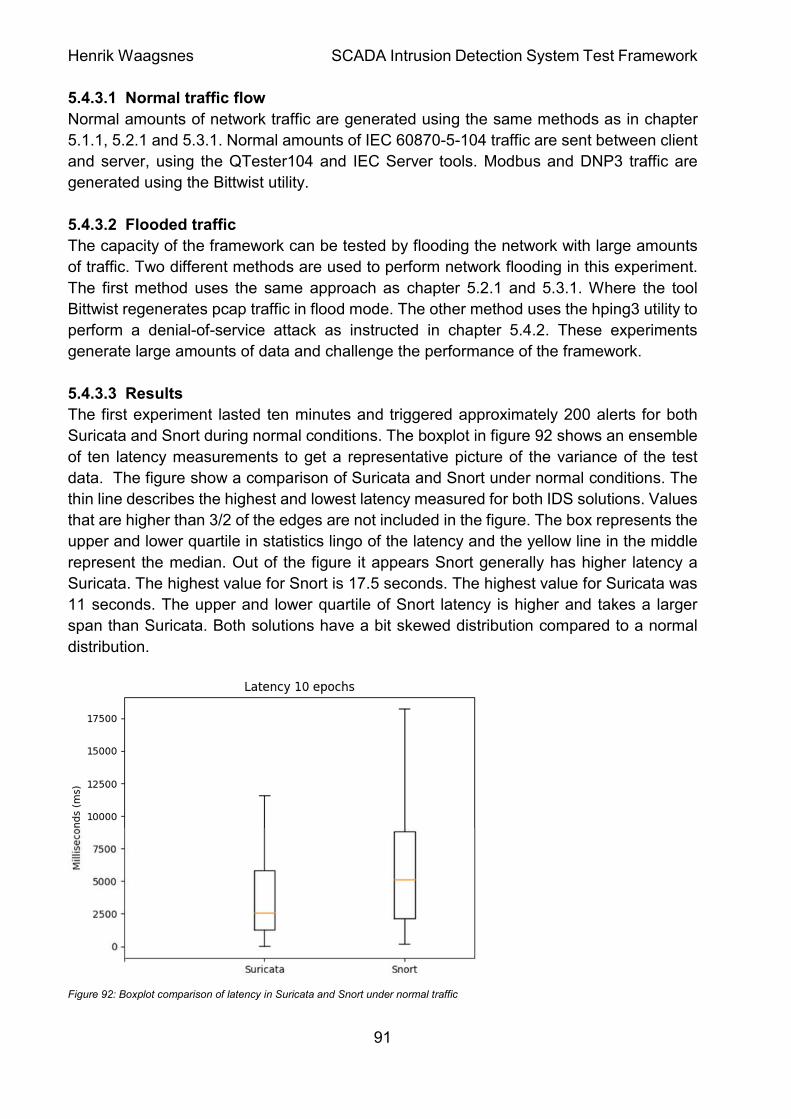
Figure 92: Boxplot comparison of latency in Suricata and Snort under normal traffic .... 91
Page 7
Henrik Waagsnes SCADA Intrusion Detection System Test Framework
7
List of tables
Table 1: Modbus Public function types [13] .................................................................... 25
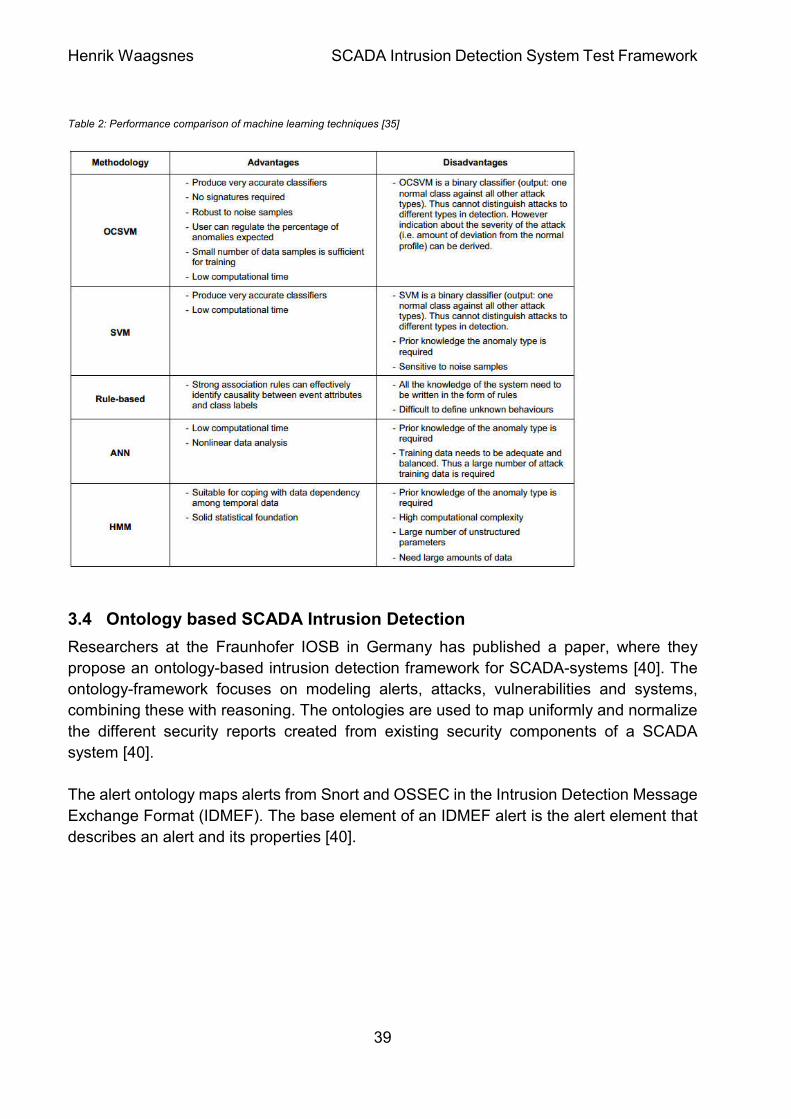
Table 2: Performance comparison of machine learning techniques [35] ........................ 39
Table 3: System specification ......................................................................................... 50
Table 4: Network specifications ...................................................................................... 50
Table 5: IEC 60870-5-104 message types supported by IEC Server [48] ...................... 51
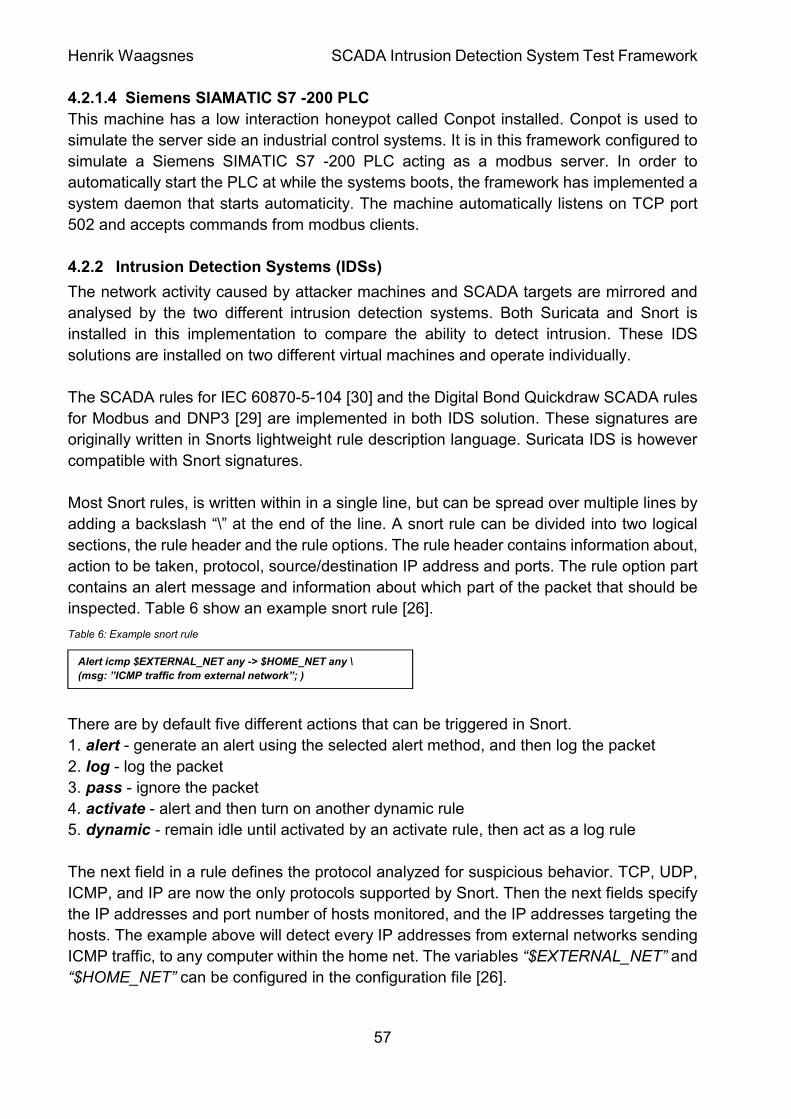
Table 6: Example snort rule ............................................................................................ 57
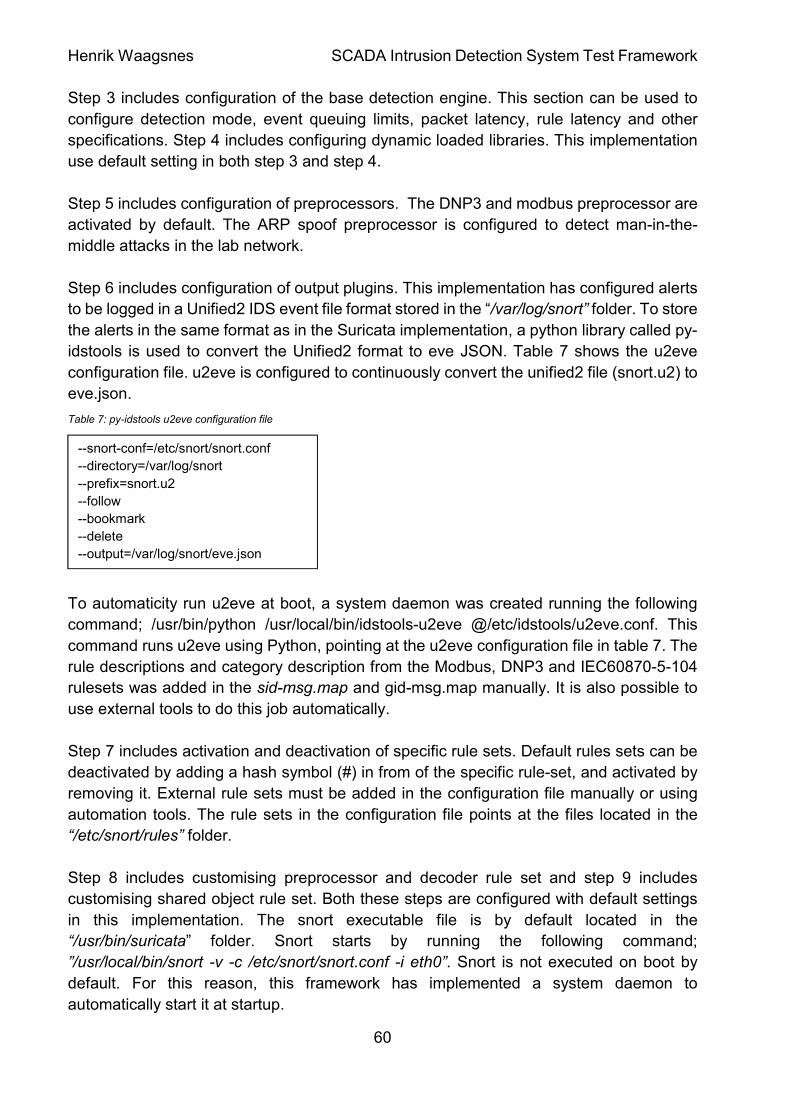
Table 7: py-idstools u2eve configuration file ................................................................... 60
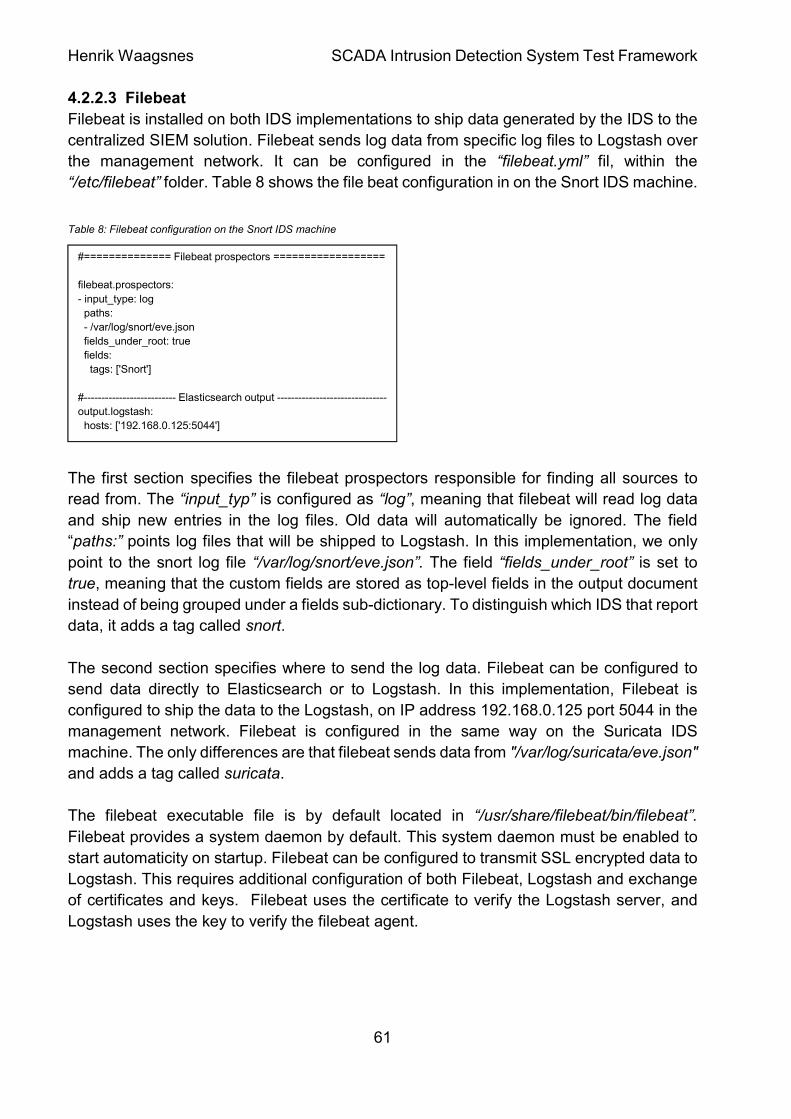
Table 8: Filebeat configuration on the Snort IDS machine ............................................. 61
Table 9: IEC 60870-5-104 variables set in configuration files (normal communication) . 75
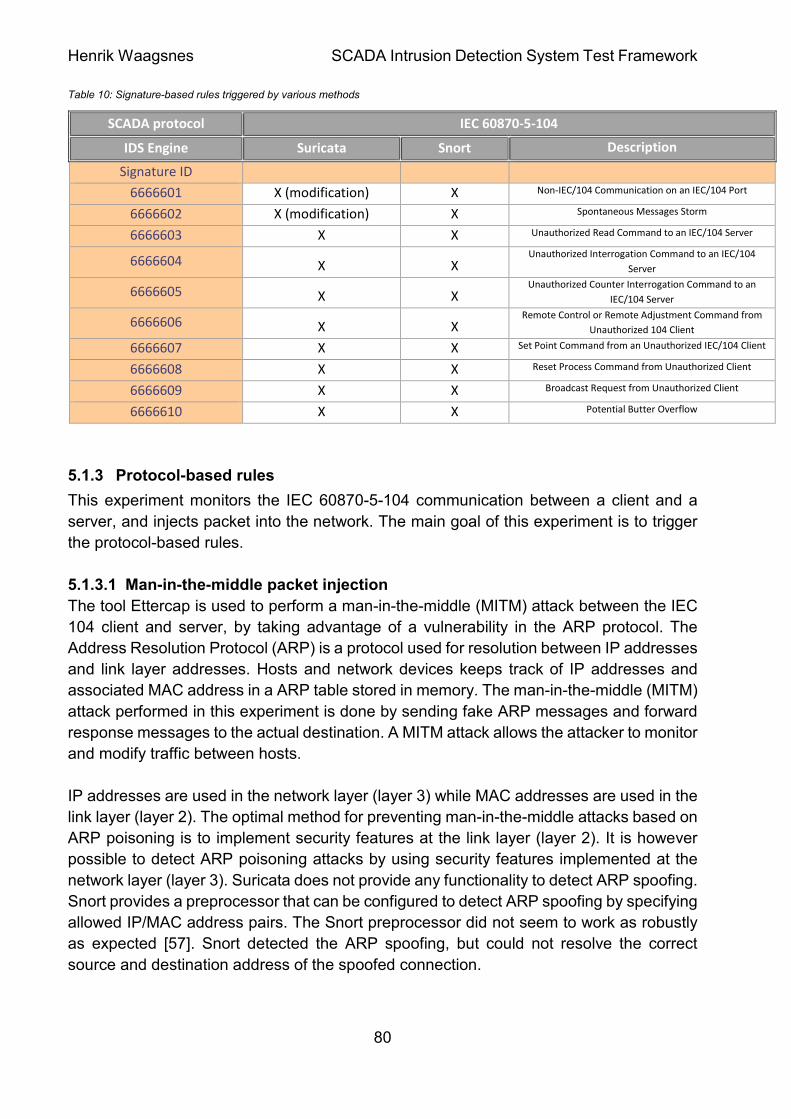
Table 10: Signature-based rules triggered by various methods ..................................... 80
Table 11: Protocol-based rules triggered by Ettercap plugin .......................................... 82
Table 12: Traffic-pattern-based rules triggered by various methods .............................. 83
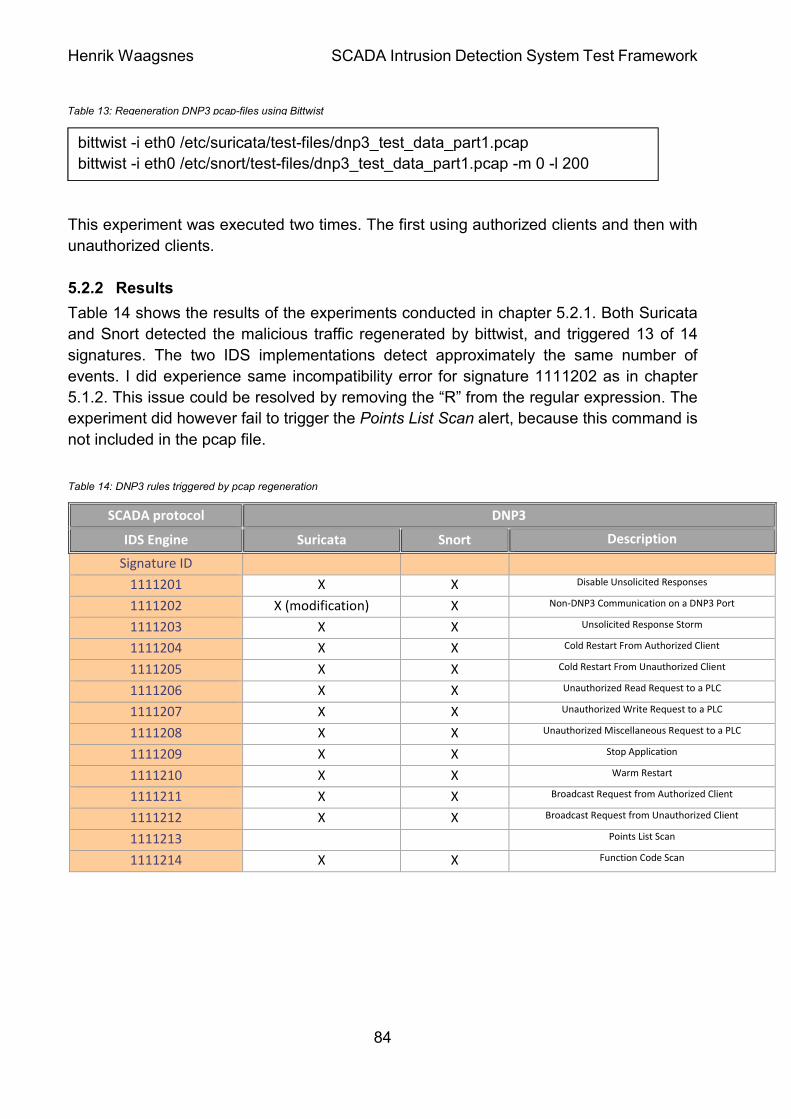
Table 13: Regeneration DNP3 pcap-files using Bittwist ................................................. 84
Table 14: DNP3 rules triggered by pcap regeneration .................................................... 84
Table 15: Regeneration modbus pcap-files using Bittwist .............................................. 85
Table 16: Modbus rules triggered by pcap regeneration ................................................ 87
Page 8
Henrik Waagsnes SCADA Intrusion Detection System Test Framework
8
List of acronyms
AMR – Automatic meter reading
ANN – Artificial Neural Networks
API – Application Programming Interface
CVE – Common Vulnerability Enumeration
DDoS – Distributed Denial-of-Service
DPI – Deep Packet Inspection
DSO – Distribution System Operator
ELK – Elasticsearch, Logstash and Kibana
HIDS – Host-Based Intrusion Detection System
HMI – human-machine interface
HMM – Hidden Markov Model
ICS – Industrial Control Systems
ICT – Information and Communication System
IDMEF – The Intrusion Detection Message Exchange Format
IDS – Intrusion Detection System
IEC – International Electrotechnical Commission
IED – Intelligent Electronic Device
IoT – Internet of things
IP – Internet Protocol
JSON – JavaScript Object Notation
LAN – Local Area Network
MAC – Medium Access Control
NCC – Network Control Center
NIDS – Network-Based Intrusion Detection System
NVE – The Norwegian Water Resources and Energy Directorate
OCC – One-Class Classification
OCSVM – One Class Support Vector Machines
PDF – Portable Document Format
PLC – Programmable Logic Controller
RTU – Remote Terminal Unit
SCADA – Supervisory control and data acquisition
SDN – Software-Defined Networking
SIEM – Security Information and Event Management
SSH – Secure Shell
SVDD – Support Vector Data Description
SVM – Support Vector Machines
TDoS – Telephone Denial-of-Service
UPS – Uninterruptible Power Supply
USB – Universal Serial Bus
VPN – Virtual Private Network
WAN – Wide Area Network
Page 9
Henrik Waagsnes SCADA Intrusion Detection System Test Framework
9
Table of Contents Abstract ...................................................................................................................... 2
Preface ....................................................................................................................... 3
List of figures .............................................................................................................. 4
List of tables ............................................................................................................... 7
List of acronyms ......................................................................................................... 8
1 Introduction ...................................................................................................... 12
1.1 Problem statement ....................................................................................... 13
1.2 Limitations and Assumptions ....................................................................... 13
1.3 Research Method......................................................................................... 13
1.4 Report outline .............................................................................................. 15
2 Theory .............................................................................................................. 16
2.1 Technology used in power grids .................................................................. 16
2.2 SCADA Architecture .................................................................................... 18
2.2.1 First generation – Monolithic SCADA Systems ................................... 18
2.2.2 Second generation – Distributed SCADA Systems ............................. 18
2.2.3 Third generation – Networked SCADA Systems ................................. 19
2.2.4 Fourth generation – “Internet of things (IoT)” SCADA Systems ........... 19
2.3 SCADA communication protocols ................................................................ 20
2.3.1 IEC 60870-5-104 ................................................................................. 20
2.3.2 DNP3 ................................................................................................... 22
2.3.3 Modbus ................................................................................................ 23
2.4 Security issues ............................................................................................. 25
2.4.1 IEC 60870-5-104 ................................................................................ 26
2.4.2 DNP3 ................................................................................................... 26
2.4.3 Modbus TCP ....................................................................................... 26
2.4.4 IEC 62351 ........................................................................................... 27
2.5 Cyber-attacks on SCADA systems .............................................................. 27
2.5.1 Attack on Iran’s nuclear program ......................................................... 27
2.5.2 Attack on the Ukrainian Power Grid .................................................... 29
2.6 Intrusion Detection ....................................................................................... 30
2.7 Honeypots .................................................................................................... 31
3 Prior Research ................................................................................................. 33
3.1 Signature and preprocessor based SCADA Intrusion Detection .................. 33
3.2 Big Data based SCADA Intrusion Detection ................................................ 35
3.3 Machine Learning based SCADA Intrusion detection .................................. 36
3.4 Ontology based SCADA Intrusion Detection ................................................ 39
3.5 Intrusion detection in SDN-Based SCADA systems..................................... 41
3.6 SCADA Honeypots ...................................................................................... 43
3.7 Power grid testbeds ..................................................................................... 44
4 Approach .......................................................................................................... 47
4.1 Framework architecture ............................................................................... 47
4.2 Implementation ............................................................................................ 50
4.2.1 Attacker and SCADA targets ............................................................... 50
Page 10
Henrik Waagsnes SCADA Intrusion Detection System Test Framework
10
4.2.1.1 IEC 60870-5-104 Server ............................................................. 50
4.2.1.2 IEC 60870-5-104 Client ............................................................... 51
4.2.1.3 Second IEC 60870-5-104 Client ................................................. 54
4.2.1.4 Siemens SIAMATIC S7 -200 PLC ............................................... 57
4.2.2 Intrusion Detection Systems (IDSs) ..................................................... 57
4.2.2.1 Suricata IDS ................................................................................ 58
4.2.2.2 Snort IDS .................................................................................... 59
4.2.2.3 Filebeat ....................................................................................... 61
4.2.3 Security information and event management (SIEM) .......................... 62
4.2.3.1 Logstash ..................................................................................... 62
4.2.3.2 Elasticsearch ............................................................................... 64
4.2.3.3 Kibana ......................................................................................... 64
4.2.3.4 X-pack ......................................................................................... 65
4.2.4 Dashboards ......................................................................................... 67
4.2.4.1 Network traffic monitoring ........................................................... 68
4.2.4.2 IDS alert monitoring .................................................................... 68
4.2.4.3 IDS comparison .......................................................................... 69
4.2.4.4 Experimental ............................................................................... 70
4.2.4.5 Latency ....................................................................................... 70
4.2.5 Automation .......................................................................................... 71
4.2.5.1 System daemons ........................................................................ 71
4.2.5.2 Log rotation and index cleaning .................................................. 72
4.2.5.3 Time synchronization .................................................................. 74
5 Experiments and Results ................................................................................. 75
5.1 IEC 60870-5-104 client/server communication ............................................ 75
5.1.1 Normal communication ........................................................................ 75
5.1.2 Signature-based rules ......................................................................... 76
5.1.2.1 Non-IEC/104 communication on an IEC/104 port ....................... 76
5.1.2.2 Spontaneous messages storm .................................................... 76
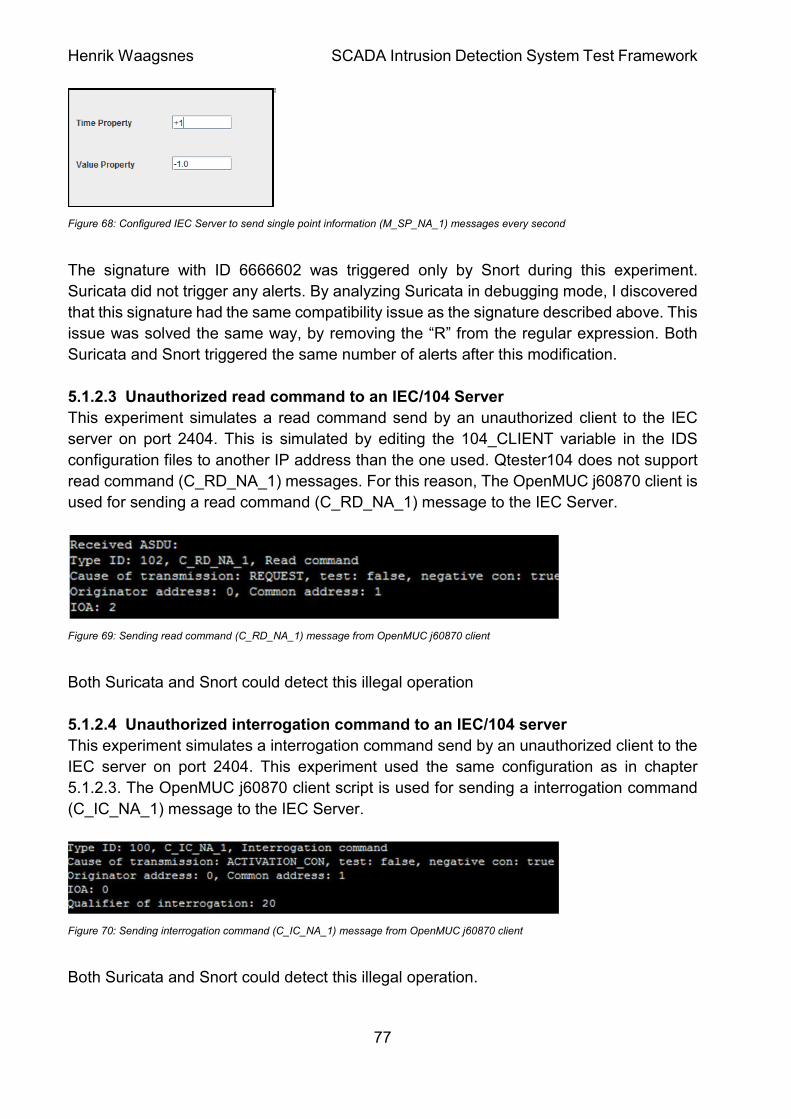
5.1.2.3 Unauthorized read command to an IEC/104 Server ................... 77
5.1.2.4 Unauthorized interrogation command to an IEC/104 server ....... 77
5.1.2.5 Unauthorized counter interrogation command to an IEC/104 Server
78
5.1.2.6 Remote command from unauthorized 104 client ......................... 78
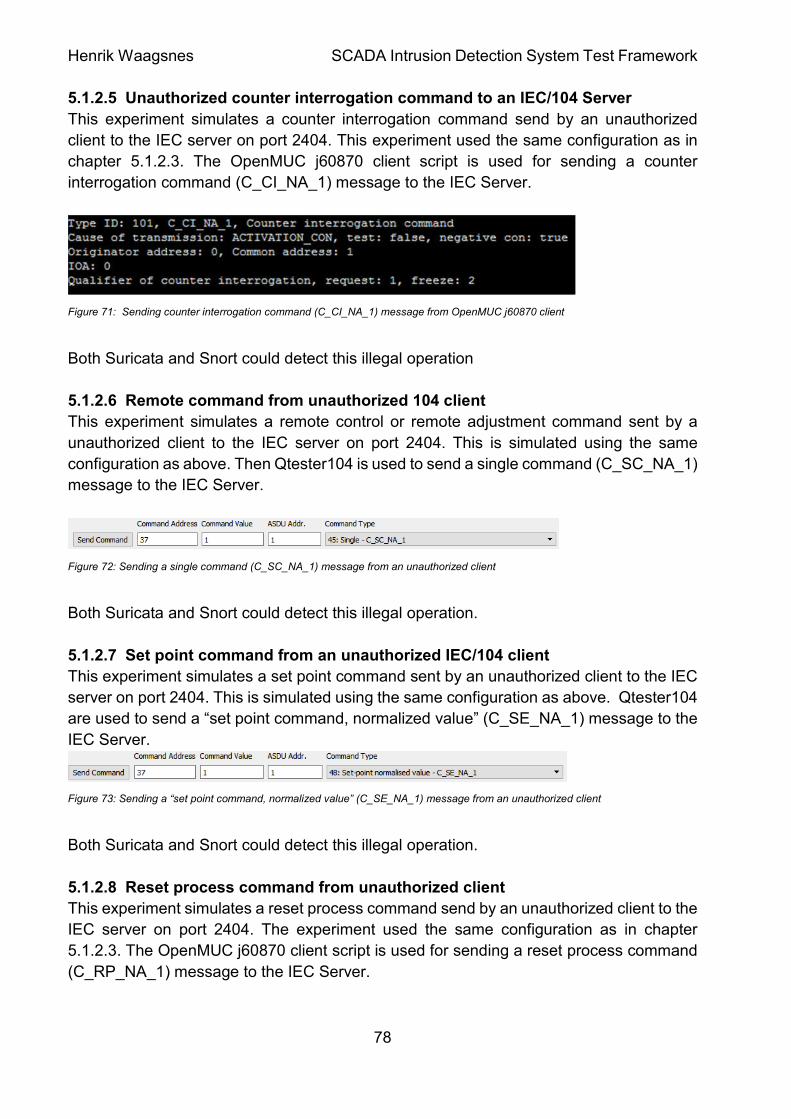
5.1.2.7 Set point command from an unauthorized IEC/104 client ........... 78
5.1.2.8 Reset process command from unauthorized client ..................... 78
5.1.2.9 Broadcast request from unauthorized client ................................ 79
5.1.2.10 Potential Butter Overflow ............................................................ 79
5.1.2.11 Results ........................................................................................ 79
5.1.3 Protocol-based rules............................................................................ 80
5.1.3.1 Man-in-the-middle packet injection ............................................. 80
5.1.3.2 Results ........................................................................................ 81
5.1.4 Traffic-pattern-based rules .................................................................. 82
5.1.4.1 Unauthorized connection attempt from an IEC/104 server.......... 82
Page 11
Henrik Waagsnes SCADA Intrusion Detection System Test Framework
11
5.1.4.2 Unauthorized connection attempt to a non-IEC/104 port of a server
82
5.1.4.3 Unauthorized traffic between IEC/104 server and client ............. 83
5.1.4.4 Results ........................................................................................ 83
5.2 DNP3 communication .................................................................................. 83
5.2.1 Captured DNP3 traffic ......................................................................... 83
5.2.2 Results ................................................................................................ 84
5.3 Modbus communication ............................................................................... 85
5.3.1 Captured Modbus traffic ...................................................................... 85
5.3.2 Reconnaissance on the Simens SIMATIC S7-200 PCL ...................... 85
5.3.3 Unauthorized read and write requests to PLC ..................................... 85
5.3.4 Non-Modbus communication on TCP port 502 .................................... 86
5.3.5 Points list scan and function code scan ............................................... 86
5.3.6 Results ................................................................................................ 87
5.4 Other experiments ....................................................................................... 88
5.4.1 Remote access to RTU ....................................................................... 88
5.4.1.1 Man-in-the-middle sniffing ........................................................... 88
5.4.1.2 Brute force .................................................................................. 88
5.4.1.3 Results ........................................................................................ 89
5.4.2 Denial-of-service ................................................................................. 89
5.4.2.1 SYN flood .................................................................................... 89
5.4.2.2 Results ........................................................................................ 90
5.4.3 Latency ................................................................................................ 90
5.4.3.1 Normal traffic flow ....................................................................... 91
5.4.3.2 Flooded traffic ............................................................................. 91
5.4.3.3 Results ........................................................................................ 91
6 Discussion ........................................................................................................ 93
7 Conclusion ....................................................................................................... 97
8 Future Work ..................................................................................................... 99
9 References ..................................................................................................... 100
10 Appendices .................................................................................................... 104
Page 12
Henrik Waagsnes SCADA Intrusion Detection System Test Framework
12
1 Introduction
A Supervisory control and data acquisition (SCADA) system is an industrial control system
(ICS), implemented between industrial processes and management systems. SCADA
systems play an important role in our critical infrastructure (CI), and is used for example to
control power plants and water supplies. The main functions of a SCADA system is event
data management, management of network switch state, remote controlling, configuration,
measuring and reporting [1].
Cyber-attacks have not been considered as a likely threat to SCADA systems in the past.
Several of the most commonly used protocols in SCADA system today have therefore a
lack of security, and make the systems vulnerable to cyber-attacks. An attack against
SCADA systems may jeopardize the system operation, safety and stability. In the worst
case, an attack could cause huge economic and human losses. Nation-states, criminals
and hacktivists are specifically targeting critical infrastructure as a part of their
cyberwarfare, to achieve economic and political benefits.
The defense-in-depth principle is an idea that layered security mechanisms will increase
security of the whole system. If an attack causes one security mechanism to fail, other
mechanisms may still provide the necessary security to protect the system [2]. This
principle should be followed to improve the overall security level of SCADA systems.
Several layers of security are illustrated in figure 1.
Figure 1: Defense-in-depth security layers [3]
Intrusion detections systems (IDS) and intrusion prevention systems (IPS) is a layer of
security often implemented behind a firewall. An IDS/IPS is a software or hardware device
that monitors the system, and looks for malicious activity. IDS allow administrators to
detect cyber-attacks, stop the attack and design the system to be secure.
Page 13
Henrik Waagsnes SCADA Intrusion Detection System Test Framework
13
1.1 Problem statement
This master thesis aims at implementing and demonstrating an integrated intrusion
detection system test framework for supervisory control and data acquisition (SCADA)
networks in the electrical energy sector.
The main goal is to perform and study attacks on simulated SCADA networks, and
demonstrate how an intrusion detection framework can detect the attacks.
1.2 Limitations and Assumptions
The lab environment implemented in this master thesis contains simulated SCADA
systems. I assume that these are realistic simulations of SCADA protocols and hardware.
This thesis focuses on network based intrusion detection systems (NIDS). NIDS solutions
do not cause any performance penalty, when running in promiscuous mode. Host based
intrusion detection systems (HIDS) could be an efficient way to detect malicious activities
and modifications in SCADA systems. HIDS solutions however causes a significant
performance penalty on the system, 4% to 50% depending on the workload [4]. For this
reason, HIDS is not part of the implemented test framework. Both signature and anomaly
based IDS solutions are discussed in this report. Signature based detection is however the
focus in the implemented framework. The IEC 60870-5-104 protocol is the major focus in
this master thesis. Nevertheless, other protocols like DNP3 and Modbus will also be
discussed.
1.3 Research Method
Several research methodologies such as scrum, waterfall, spiral, Design Science
Research in Information Systems (DSRIS) and Prince2 were considered as possible
methodologies for this project. After examining all the research methodologies, the DSRIS
was considered as a suited method for this project. The research in this master thesis
follow the DSRIS methodology. The idea behind this methodology is to learn through the
act of building. The aim of using DSRIS is to create a design theory through the process
of developing and testing an information system artifact inextricably bound to the testing
and refinement of its kernel theory. The relationship between DSRIS and theory is a
frequently debated topic in research communities. I build my understanding of DSRIS on
well-known research on the anatomy of research projects [5]. Figure 2 shows the overall
activity framework utilized in this metrology. The activities are interconnected and ensures
continuous development. The activities in the model applies to the following tasks in this
project; Problem diagnostics involves detecting vulnerabilities and possible attacks on
SCADA systems. Technology evaluation involves performing and simulate attacks. Theory
Building involves developing theories of how the attacks can be performed and detected.
Technology Invention/design involves implementing and design new elements (e.g. IDS
rules, new target protocols, attack modules and analysis tools) in the framework [5].
Page 14
Henrik Waagsnes SCADA Intrusion Detection System Test Framework
14
Figure 2: Activity framework for Design Science Research [5]
Figure 3 describes the relationship between theory development and the design process.
Kernel theories provide theoretical grounding for the artifact. Design theory is considered
as practical knowledge used to support design activities. An example kernel theory could
describe that, using Telnet might lead to unauthorized access. The design theory could be
designing a sniffing attack to get access to the plain text password. Using this password
to gain unauthorized access might be evidence to confirm the initial kernel-theory [5].
Figure 3: Relationships between kernel theory, mid-range-theory and design theory, and the design process [5]
Page 15
Henrik Waagsnes SCADA Intrusion Detection System Test Framework
15
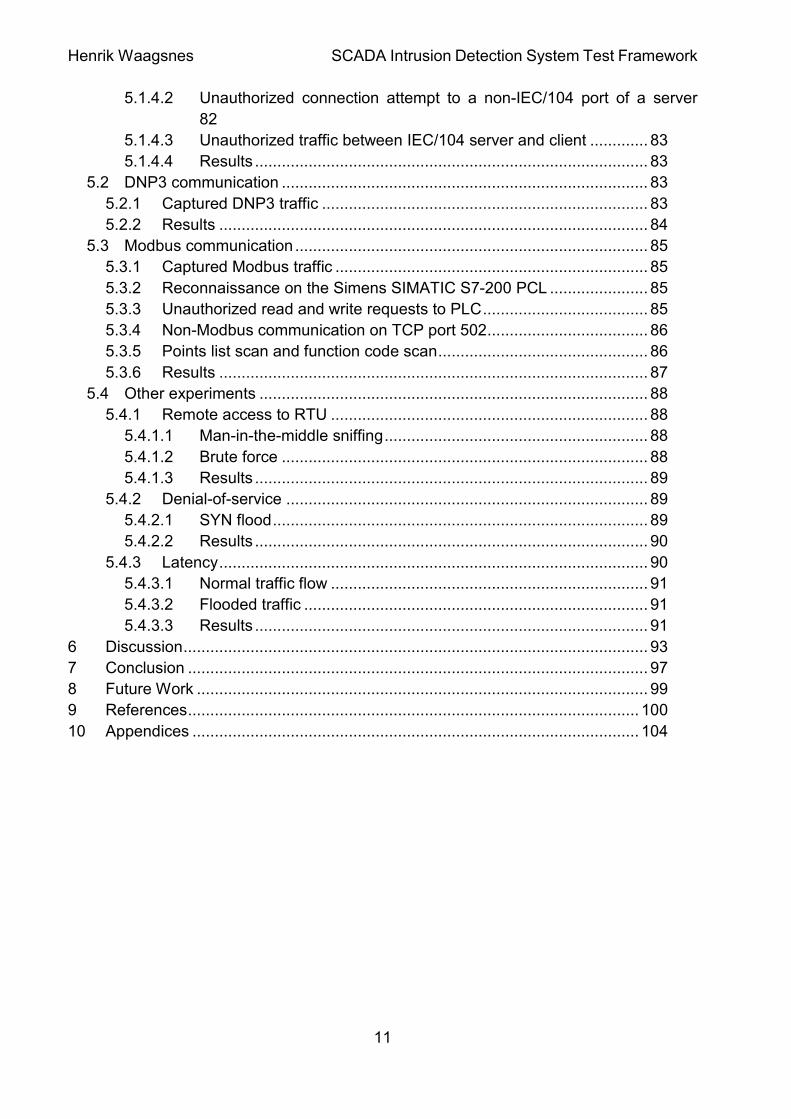
Figure 4 provides a more granular and directive description of the project phases, than
figure 2. All research phases are potential opportunities for developing and refine kernel
theories, mid-range theories and design theories [5].
Figure 4: Reasoning in the Design Research Cycle [5]
1.4 Report outline
Introduction: The first chapter contains, background, problem statement,
limitations and assumptions for this project. As well as a research methodology
used to perform experiments and design an approach.
Theory: The second chapter contains, a discussion of theory relevant for project.
Including technology, security issues and past events.
Prior Research: The third chapter contains, a discussion of prior research related
to this project.
Approach: The fourth chapter contains, a discussion about the architecture and
implementation of the chosen approach.
Experiments and Results: The fifth chapter contains, performed experiments and
a discussion around the results.
Discussion: The sixth chapter contains, a discussion of the whole project,
evaluation of results, and other thoughts about the conducted research.
Conclusion: The seventh chapter contains, a conclusion of the presented
approach and achieved results.
Future Work: The eighth chapter contains, a discussion around possible future
work to improve performance.
Page 16
Henrik Waagsnes SCADA Intrusion Detection System Test Framework
16
2 Theory
This chapter discusses theory related to research conducted in this project.
2.1 Technology used in power grids
The electric distribution system main functionality is to transfer and distribute the generated
electric power to customers. The power grid can be separated into different levels. The
high-level network, is the national distribution network, connected to distribution networks
in other countries. This distribution network consists of high-voltage lines connected to
regional networks. The regional networks is again connected to local networks, operated
by multiple Distribution System Operators (DSOs) [1].
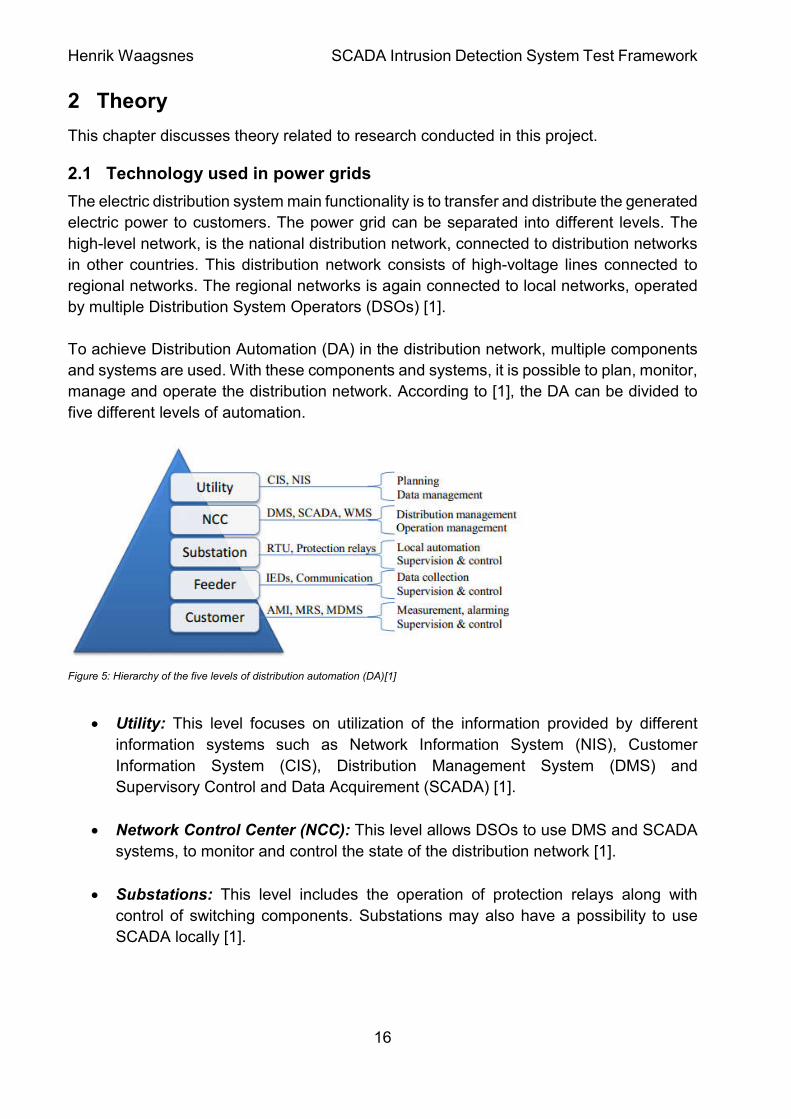
To achieve Distribution Automation (DA) in the distribution network, multiple components
and systems are used. With these components and systems, it is possible to plan, monitor,
manage and operate the distribution network. According to [1], the DA can be divided to
five different levels of automation.
Figure 5: Hierarchy of the five levels of distribution automation (DA)[1]
Utility: This level focuses on utilization of the information provided by different
information systems such as Network Information System (NIS), Customer
Information System (CIS), Distribution Management System (DMS) and
Supervisory Control and Data Acquirement (SCADA) [1].
Network Control Center (NCC): This level allows DSOs to use DMS and SCADA
systems, to monitor and control the state of the distribution network [1].
Substations: This level includes the operation of protection relays along with
control of switching components. Substations may also have a possibility to use
SCADA locally [1].
Page 17
Henrik Waagsnes SCADA Intrusion Detection System Test Framework
17
Feeder: This level covers the operation of remote controlled disconnectors, the
voltage and current measurements that exist in the network. Also the operation and
data transmission of fault indicators [1].
Customer: This level enables DSOs to read customer’s energy meter remotely and
in real-time, via Automatic meter reading (AMR) [1].
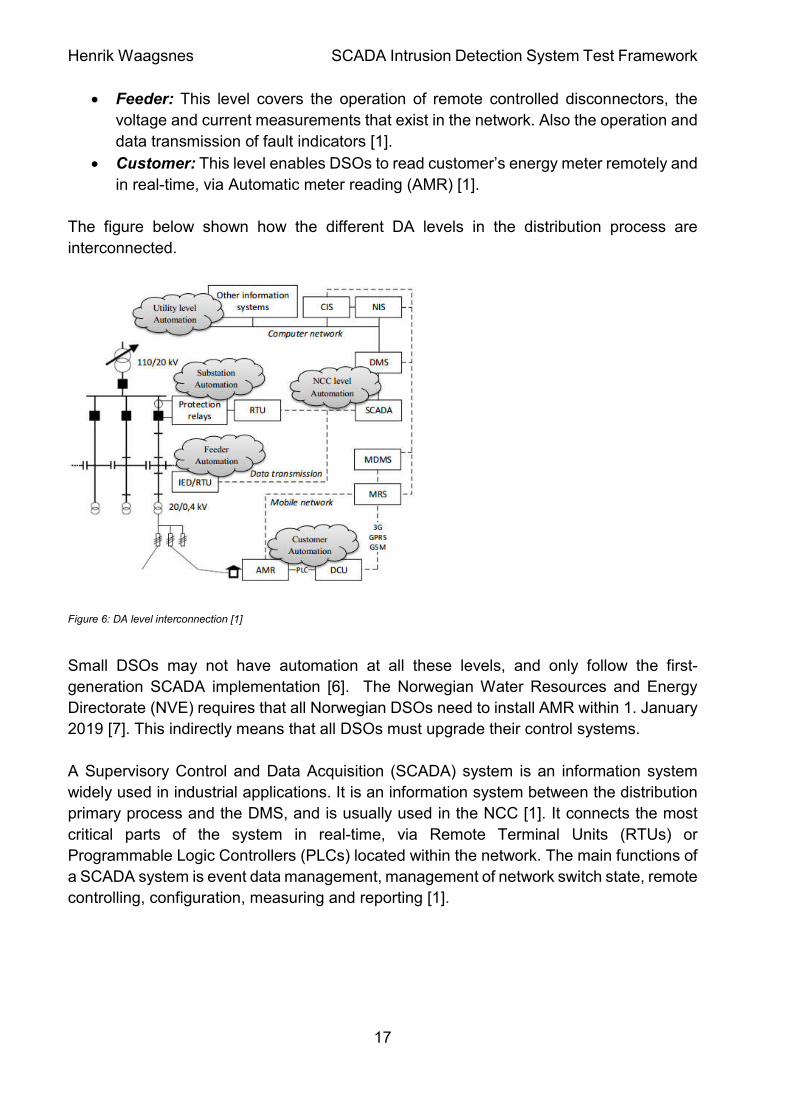
The figure below shown how the different DA levels in the distribution process are
interconnected.
Figure 6: DA level interconnection [1]
Small DSOs may not have automation at all these levels, and only follow the first-
generation SCADA implementation [6]. The Norwegian Water Resources and Energy
Directorate (NVE) requires that all Norwegian DSOs need to install AMR within 1. January
2019 [7]. This indirectly means that all DSOs must upgrade their control systems.
A Supervisory Control and Data Acquisition (SCADA) system is an information system
widely used in industrial applications. It is an information system between the distribution
primary process and the DMS, and is usually used in the NCC [1]. It connects the most
critical parts of the system in real-time, via Remote Terminal Units (RTUs) or
Programmable Logic Controllers (PLCs) located within the network. The main functions of
a SCADA system is event data management, management of network switch state, remote
controlling, configuration, measuring and reporting [1].
Page 18
Henrik Waagsnes SCADA Intrusion Detection System Test Framework
18
2.2 SCADA Architecture
The first SCADA systems where deployd in the 1960s, they have later evolved over the
past decades. SCADA architectures can be divided into four generations [6].
2.2.1 First generation – Monolithic SCADA Systems
When SCADA systems first was developed, it was designed as a standalone system. The
system was designed to communicate with RTU, via Wide Area Networks (WANs).
Communication protocols used in SCADA networks were developed by vendors of RTU
equipment and were often proprietary. Connectivity to the SCADA master were done at
the bus level via a proprietary adapter [6].
Figure 7: First generation SCADA Architecture [6]
2.2.2 Second generation – Distributed SCADA Systems
The second generation of SCADA system was designed to distribute the processing
across multiple systems, connected though a Local Area Network (LAN).
These distributed stations had different tasks. Some served as communication processors
between field devices such as RTUs. Others served as an operator interface, providing
the human-machine interface (HMI) for the system operators. There is even some stations
performing calculations and database services.
Distribution of system functionality increased the processing power, improved the
redundancy and reliability of the system. The system communicates with RTUs, via Wide
Area Networks (WANs) like in the first generation [6].
Page 19
Henrik Waagsnes SCADA Intrusion Detection System Test Framework
19
Figure 8: Second generation SCADA Architecture [6]
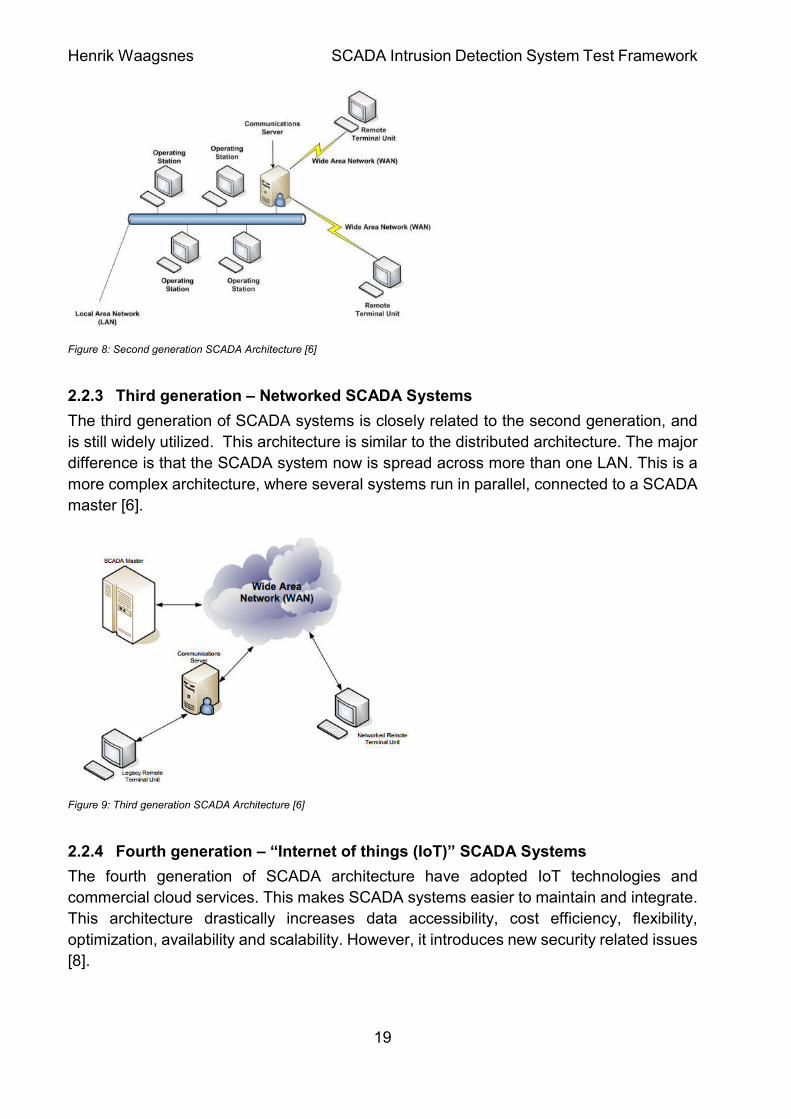
2.2.3 Third generation – Networked SCADA Systems
The third generation of SCADA systems is closely related to the second generation, and
is still widely utilized. This architecture is similar to the distributed architecture. The major
difference is that the SCADA system now is spread across more than one LAN. This is a
more complex architecture, where several systems run in parallel, connected to a SCADA
master [6].
Figure 9: Third generation SCADA Architecture [6]
2.2.4 Fourth generation – “Internet of things (IoT)” SCADA Systems
The fourth generation of SCADA architecture have adopted IoT technologies and
commercial cloud services. This makes SCADA systems easier to maintain and integrate.
This architecture drastically increases data accessibility, cost efficiency, flexibility,
optimization, availability and scalability. However, it introduces new security related issues
[8].
Page 20
Henrik Waagsnes SCADA Intrusion Detection System Test Framework
20
Figure 10: Fourth generation SCADA Architecture [8]
2.3 SCADA communication protocols
SCADA systems used in the energy sector encompasses the collecting of the information
via RTUs, transferring it back to the central site, carrying out necessary analysis and
control, and then displaying that information in a HMI. A SCADA communication protocol
is a standard for data representation and data transfer over a communication channel on
a master/slave basis. IEC60870-5-104 and DNP3 are two of the most frequently used
SCADA communication protocols in the energy industry [9]. IEC 60870-5 is widely used in
Europe, while DNP3 is widely used in North America. Another widely used SCADA protocol
is Modbus. Modbus is widely used in many industries, for example in water and sewage
processing plants.
These protocols are implemented at the application layer, layer 5 in the TCP/IP model.
2.3.1 IEC 60870-5-104
IEC 60870 is a collection of open standards created by the International Electrotechnical
Commission (IEC) for the transmission of SCADA telemetry control and data. IEC 60870
when discussed in context of SCADA normally referees to IEC 60870-5-101. This is a
standard for power system monitoring, control and associated communications. When IEC
60870-5-101 was launched in 1995, the protocol was designed for serial communication.
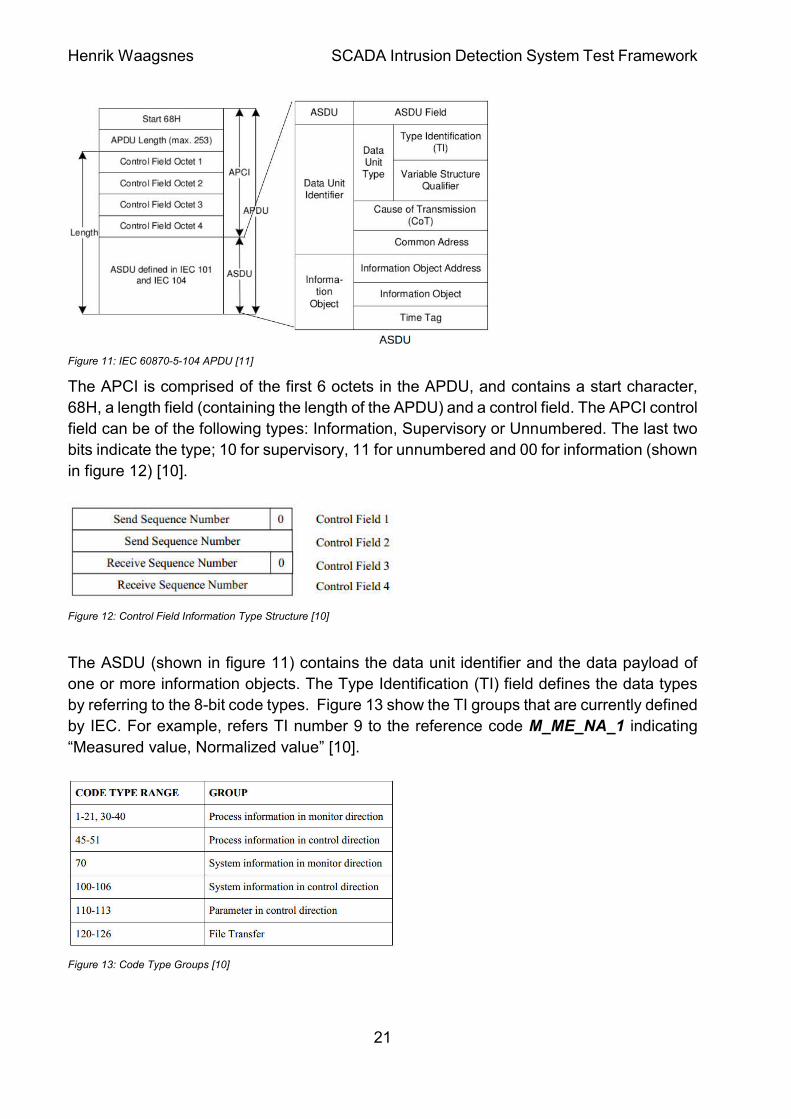
IEC 60870-5-104 is an extension of IEC 60870-5-101, that was released in 2004. It allows
the serial frames to be transmitted over TCP/IP. Figure 11 shows the protocol frame
structure, often referred to as Application Protocol Data Unit (APDU). The APDU consists
of two parts, the Application Protocol Control Information (APCI) and Application Service
Data Unit (ASDU) [10].
Page 21
Henrik Waagsnes SCADA Intrusion Detection System Test Framework
21
Figure 11: IEC 60870-5-104 APDU [11]
The APCI is comprised of the first 6 octets in the APDU, and contains a start character,
68H, a length field (containing the length of the APDU) and a control field. The APCI control
field can be of the following types: Information, Supervisory or Unnumbered. The last two
bits indicate the type; 10 for supervisory, 11 for unnumbered and 00 for information (shown
in figure 12) [10].
Figure 12: Control Field Information Type Structure [10]
The ASDU (shown in figure 11) contains the data unit identifier and the data payload of
one or more information objects. The Type Identification (TI) field defines the data types
by referring to the 8-bit code types. Figure 13 show the TI groups that are currently defined
by IEC. For example, refers TI number 9 to the reference code M_ME_NA_1 indicating
“Measured value, Normalized value” [10].
Figure 13: Code Type Groups [10]
Page 22
Henrik Waagsnes SCADA Intrusion Detection System Test Framework
22
The Variable Structure Qualifier indicates whether the payload contains multiple
information objects or not (max 127). The field Cause of Transmission (CoT) indicates the
cause of transmission. The CoT value “1” would indicate a periodic transmission, while the
value “3” would indicate a spontaneous transmission. The common address is associated
with all objects in an ASDU. All stations of a specific system broadcast address to the
common address. The information object address is used as destination address in control
direction and as source address in monitor direction. IEC 60870-5-104 is by default
assigned the TCP port number 2404 [10] [12].
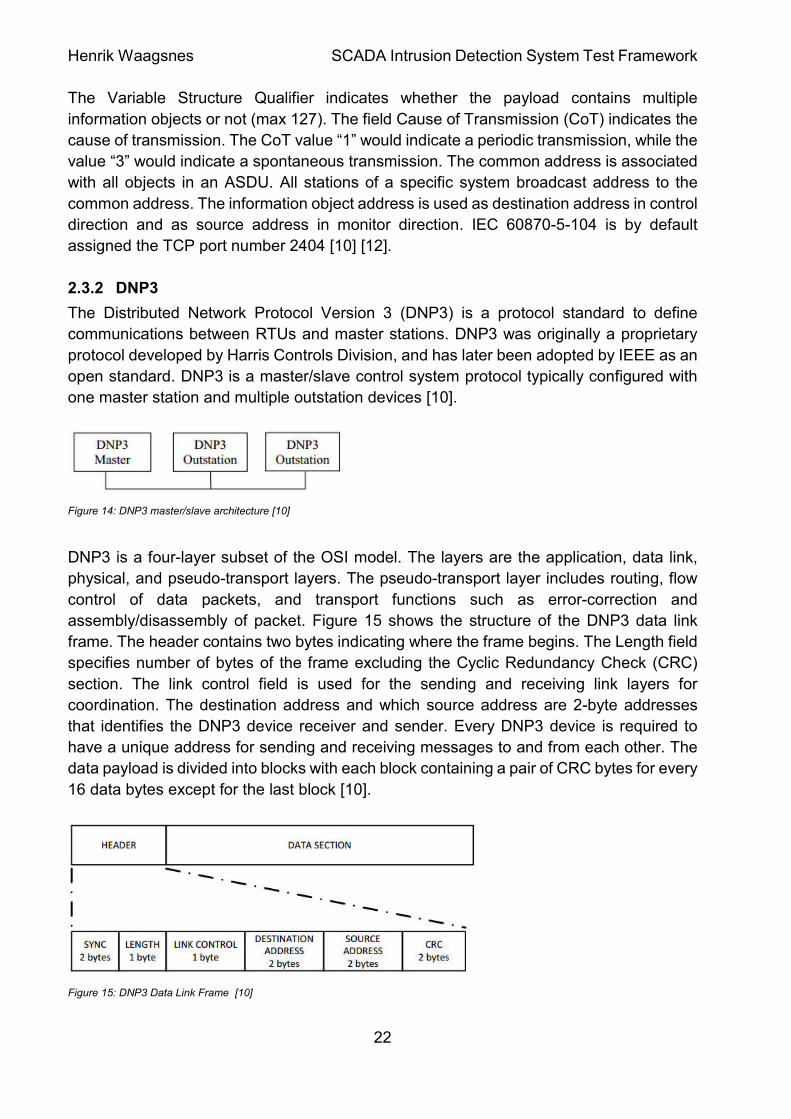
2.3.2 DNP3
The Distributed Network Protocol Version 3 (DNP3) is a protocol standard to define
communications between RTUs and master stations. DNP3 was originally a proprietary
protocol developed by Harris Controls Division, and has later been adopted by IEEE as an
open standard. DNP3 is a master/slave control system protocol typically configured with
one master station and multiple outstation devices [10].
Figure 14: DNP3 master/slave architecture [10]
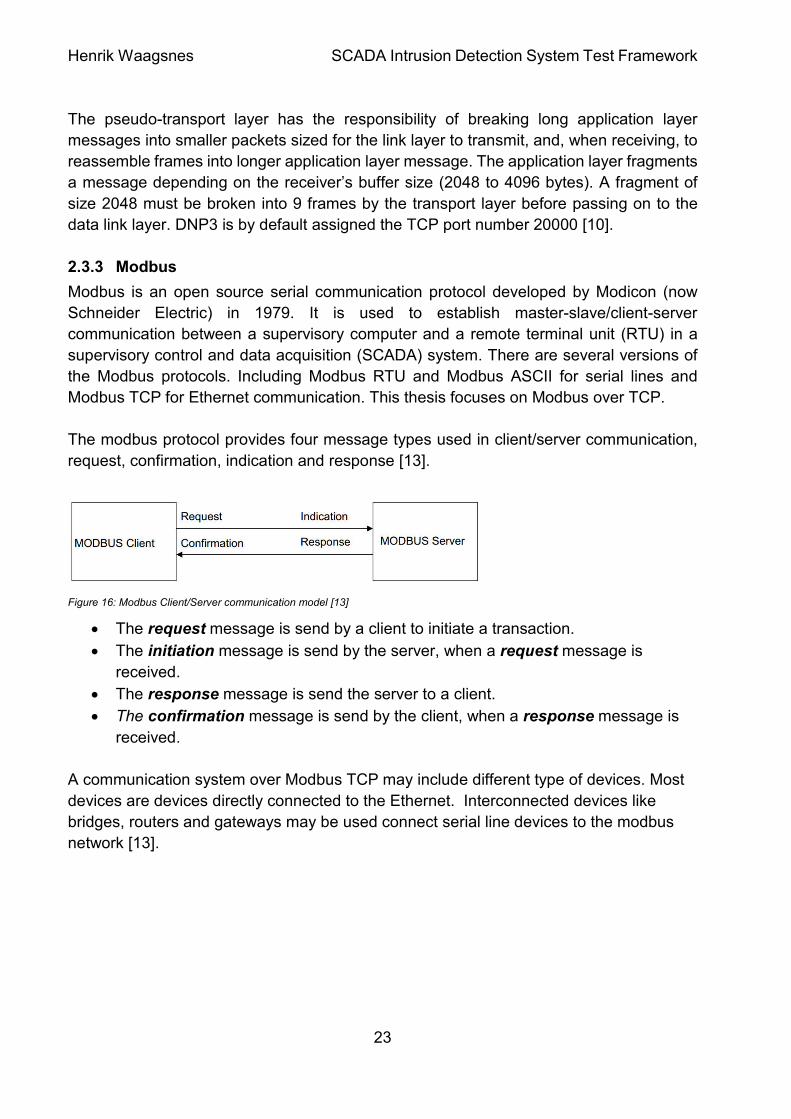
DNP3 is a four-layer subset of the OSI model. The layers are the application, data link,
physical, and pseudo-transport layers. The pseudo-transport layer includes routing, flow
control of data packets, and transport functions such as error-correction and
assembly/disassembly of packet. Figure 15 shows the structure of the DNP3 data link
frame. The header contains two bytes indicating where the frame begins. The Length field
specifies number of bytes of the frame excluding the Cyclic Redundancy Check (CRC)
section. The link control field is used for the sending and receiving link layers for
coordination. The destination address and which source address are 2-byte addresses
that identifies the DNP3 device receiver and sender. Every DNP3 device is required to
have a unique address for sending and receiving messages to and from each other. The
data payload is divided into blocks with each block containing a pair of CRC bytes for every
16 data bytes except for the last block [10].
Figure 15: DNP3 Data Link Frame [10]
Page 23
Henrik Waagsnes SCADA Intrusion Detection System Test Framework
23
The pseudo-transport layer has the responsibility of breaking long application layer
messages into smaller packets sized for the link layer to transmit, and, when receiving, to
reassemble frames into longer application layer message. The application layer fragments
a message depending on the receiver’s buffer size (2048 to 4096 bytes). A fragment of
size 2048 must be broken into 9 frames by the transport layer before passing on to the
data link layer. DNP3 is by default assigned the TCP port number 20000 [10].
2.3.3 Modbus
Modbus is an open source serial communication protocol developed by Modicon (now
Schneider Electric) in 1979. It is used to establish master-slave/client-server
communication between a supervisory computer and a remote terminal unit (RTU) in a
supervisory control and data acquisition (SCADA) system. There are several versions of
the Modbus protocols. Including Modbus RTU and Modbus ASCII for serial lines and
Modbus TCP for Ethernet communication. This thesis focuses on Modbus over TCP.
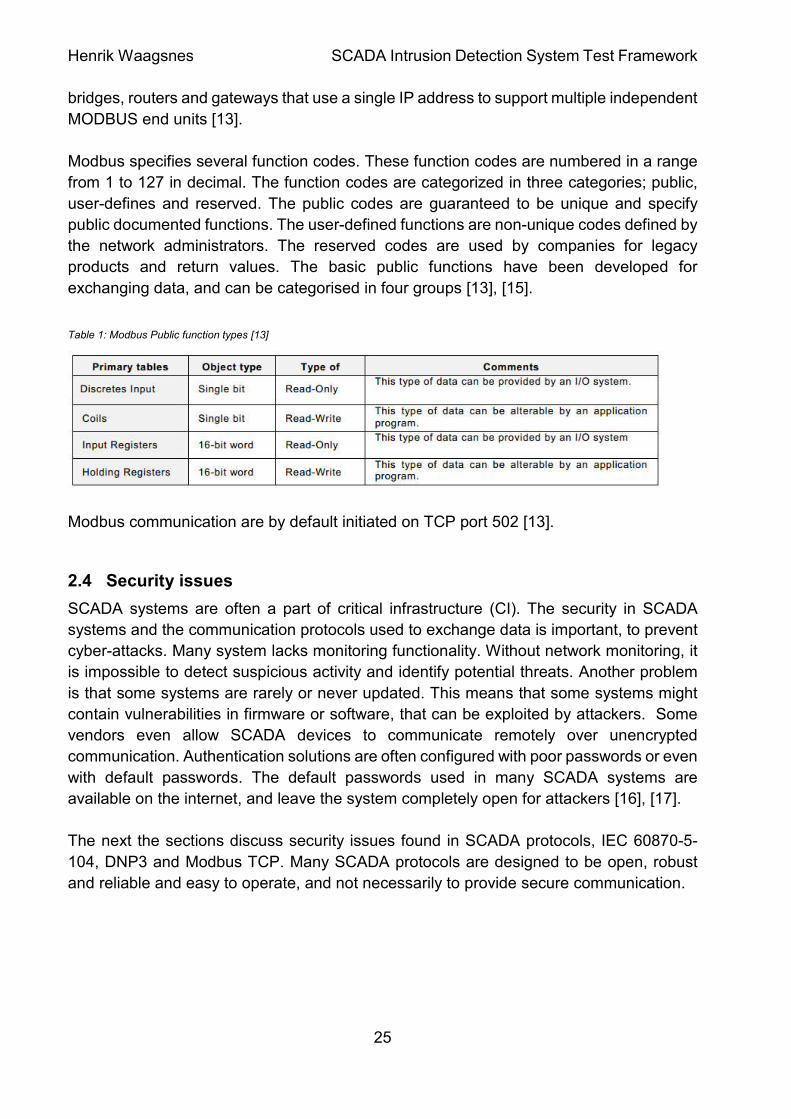
The modbus protocol provides four message types used in client/server communication,
request, confirmation, indication and response [13].
Figure 16: Modbus Client/Server communication model [13]
The request message is send by a client to initiate a transaction.
The initiation message is send by the server, when a request message is
received.
The response message is send the server to a client.
The confirmation message is send by the client, when a response message is
received.
A communication system over Modbus TCP may include different type of devices. Most
devices are devices directly connected to the Ethernet. Interconnected devices like
bridges, routers and gateways may be used connect serial line devices to the modbus
network [13].
Page 24
Henrik Waagsnes SCADA Intrusion Detection System Test Framework
24
Figure 17: Modbus TCP/IP communication architecture [13]
The Modbus frame is composed of an Application Data Unit (ADU), which encloses a
Protocol Data Unit (PDU). The ADU includes an address field, the PDU and an error check
mechanism. The PDU includes a function code field and a data field. The function code
indicates what kind of action to perform [13].
Figure 18: General Modbus frame [13]
The Modbus frame used in Modbus TCP is different from the general frame. The main
difference is that a new 7-byte header called MBAP header (Modbus Application Header)
is added at the start of the message. The CRC (cyclic redundancy check) for error checking
is removed from the message. Error checking is now performed by the TCP protocol at the
transport layer (layer 4) [13], [14] .
Figure 19: Modbus TCP/IP frame [13]
The Transaction Identifier field in the MBAP header is 2 bytes set by the client to uniquely
identify each request. The protocol Identifier field is 2 bytes set by the client to identify the
protocol, always 00 00 for Modbus. The length field is 2 bytes used to identify the number
of bytes in the Modbus message. The SlaveID field is removed and replaced with a unit
identifier. The unit Identifier field is 1 byte used to communicate via devices such as
Page 25
Henrik Waagsnes SCADA Intrusion Detection System Test Framework
25
bridges, routers and gateways that use a single IP address to support multiple independent
MODBUS end units [13].
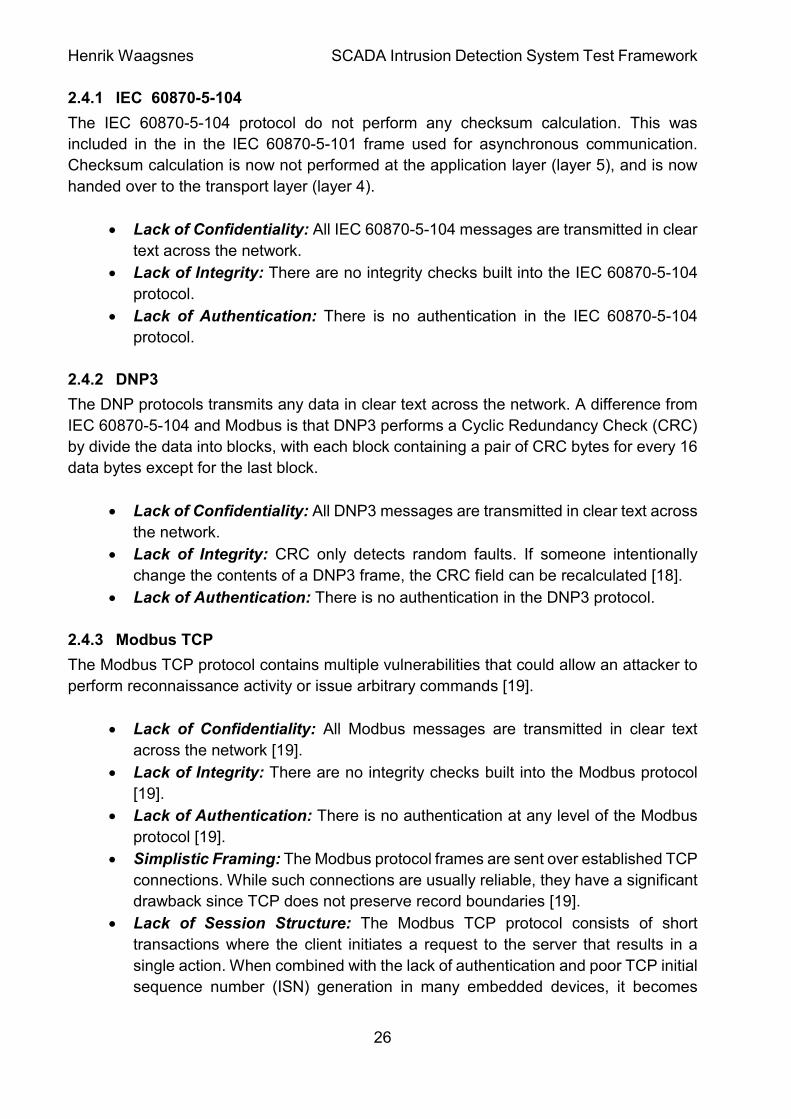
Modbus specifies several function codes. These function codes are numbered in a range
from 1 to 127 in decimal. The function codes are categorized in three categories; public,
user-defines and reserved. The public codes are guaranteed to be unique and specify
public documented functions. The user-defined functions are non-unique codes defined by
the network administrators. The reserved codes are used by companies for legacy
products and return values. The basic public functions have been developed for
exchanging data, and can be categorised in four groups [13], [15].
Table 1: Modbus Public function types [13]
Modbus communication are by default initiated on TCP port 502 [13].
2.4 Security issues
SCADA systems are often a part of critical infrastructure (CI). The security in SCADA
systems and the communication protocols used to exchange data is important, to prevent
cyber-attacks. Many system lacks monitoring functionality. Without network monitoring, it
is impossible to detect suspicious activity and identify potential threats. Another problem
is that some systems are rarely or never updated. This means that some systems might
contain vulnerabilities in firmware or software, that can be exploited by attackers. Some
vendors even allow SCADA devices to communicate remotely over unencrypted
communication. Authentication solutions are often configured with poor passwords or even
with default passwords. The default passwords used in many SCADA systems are
available on the internet, and leave the system completely open for attackers [16], [17].
The next the sections discuss security issues found in SCADA protocols, IEC 60870-5-
104, DNP3 and Modbus TCP. Many SCADA protocols are designed to be open, robust
and reliable and easy to operate, and not necessarily to provide secure communication.
Page 26
Henrik Waagsnes SCADA Intrusion Detection System Test Framework
26
2.4.1 IEC 60870-5-104
The IEC 60870-5-104 protocol do not perform any checksum calculation. This was
included in the in the IEC 60870-5-101 frame used for asynchronous communication.
Checksum calculation is now not performed at the application layer (layer 5), and is now
handed over to the transport layer (layer 4).
Lack of Confidentiality: All IEC 60870-5-104 messages are transmitted in clear
text across the network.
Lack of Integrity: There are no integrity checks built into the IEC 60870-5-104
protocol.
Lack of Authentication: There is no authentication in the IEC 60870-5-104
protocol.
2.4.2 DNP3
The DNP protocols transmits any data in clear text across the network. A difference from
IEC 60870-5-104 and Modbus is that DNP3 performs a Cyclic Redundancy Check (CRC)
by divide the data into blocks, with each block containing a pair of CRC bytes for every 16
data bytes except for the last block.
Lack of Confidentiality: All DNP3 messages are transmitted in clear text across
the network.
Lack of Integrity: CRC only detects random faults. If someone intentionally
change the contents of a DNP3 frame, the CRC field can be recalculated [18].
Lack of Authentication: There is no authentication in the DNP3 protocol.
2.4.3 Modbus TCP
The Modbus TCP protocol contains multiple vulnerabilities that could allow an attacker to
perform reconnaissance activity or issue arbitrary commands [19].
Lack of Confidentiality: All Modbus messages are transmitted in clear text
across the network [19].
Lack of Integrity: There are no integrity checks built into the Modbus protocol
[19].
Lack of Authentication: There is no authentication at any level of the Modbus
protocol [19].
Simplistic Framing: The Modbus protocol frames are sent over established TCP
connections. While such connections are usually reliable, they have a significant
drawback since TCP does not preserve record boundaries [19].
Lack of Session Structure: The Modbus TCP protocol consists of short
transactions where the client initiates a request to the server that results in a
single action. When combined with the lack of authentication and poor TCP initial
sequence number (ISN) generation in many embedded devices, it becomes
Page 27
Henrik Waagsnes SCADA Intrusion Detection System Test Framework
27
possible for attackers to inject commands with no knowledge of the existing
session [19].
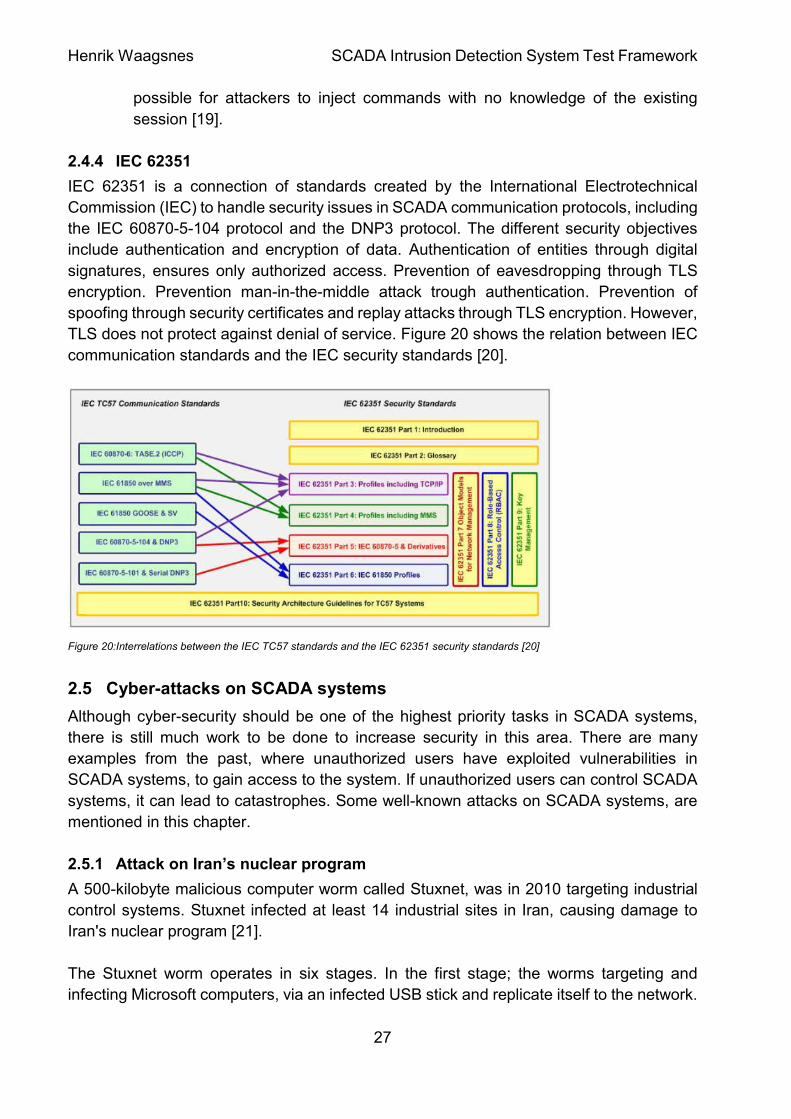
2.4.4 IEC 62351
IEC 62351 is a connection of standards created by the International Electrotechnical
Commission (IEC) to handle security issues in SCADA communication protocols, including
the IEC 60870-5-104 protocol and the DNP3 protocol. The different security objectives
include authentication and encryption of data. Authentication of entities through digital
signatures, ensures only authorized access. Prevention of eavesdropping through TLS
encryption. Prevention man-in-the-middle attack trough authentication. Prevention of
spoofing through security certificates and replay attacks through TLS encryption. However,
TLS does not protect against denial of service. Figure 20 shows the relation between IEC
communication standards and the IEC security standards [20].
Figure 20:Interrelations between the IEC TC57 standards and the IEC 62351 security standards [20]
2.5 Cyber-attacks on SCADA systems
Although cyber-security should be one of the highest priority tasks in SCADA systems,
there is still much work to be done to increase security in this area. There are many
examples from the past, where unauthorized users have exploited vulnerabilities in
SCADA systems, to gain access to the system. If unauthorized users can control SCADA
systems, it can lead to catastrophes. Some well-known attacks on SCADA systems, are
mentioned in this chapter.
2.5.1 Attack on Iran’s nuclear program
A 500-kilobyte malicious computer worm called Stuxnet, was in 2010 targeting industrial
control systems. Stuxnet infected at least 14 industrial sites in Iran, causing damage to
Iran's nuclear program [21].
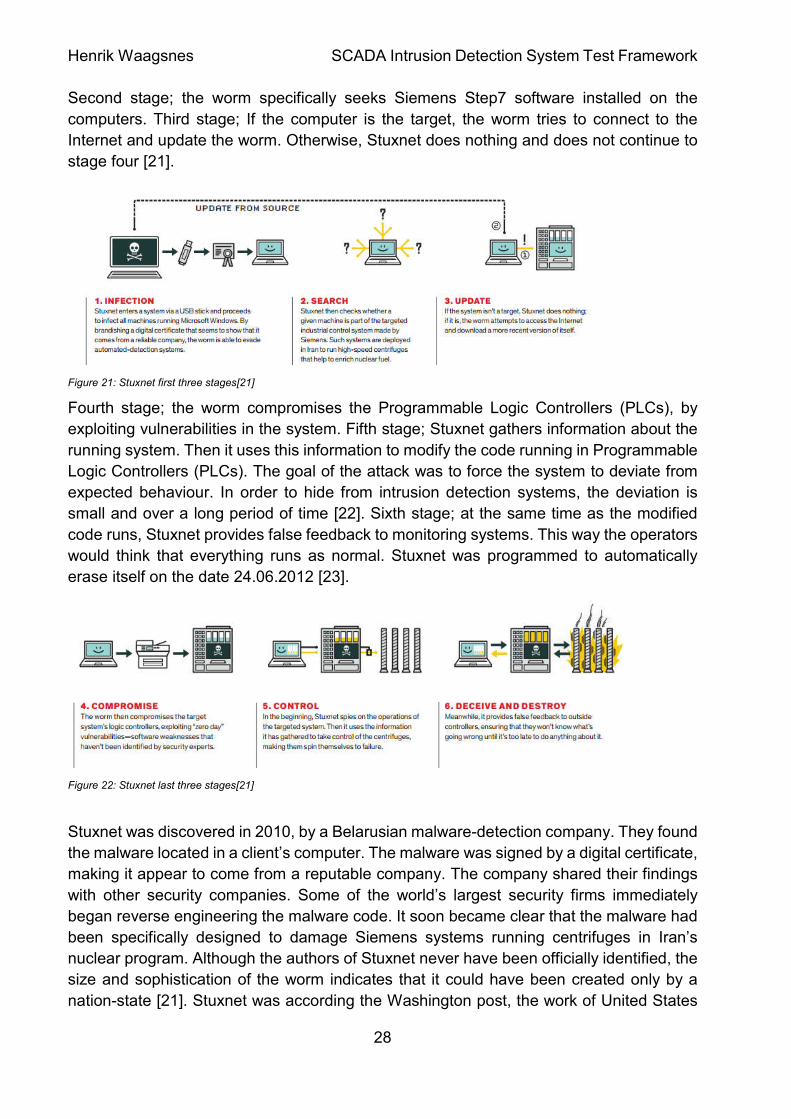
The Stuxnet worm operates in six stages. In the first stage; the worms targeting and
infecting Microsoft computers, via an infected USB stick and replicate itself to the network.
Page 28
Henrik Waagsnes SCADA Intrusion Detection System Test Framework
28
Second stage; the worm specifically seeks Siemens Step7 software installed on the
computers. Third stage; If the computer is the target, the worm tries to connect to the
Internet and update the worm. Otherwise, Stuxnet does nothing and does not continue to
stage four [21].
Figure 21: Stuxnet first three stages[21]
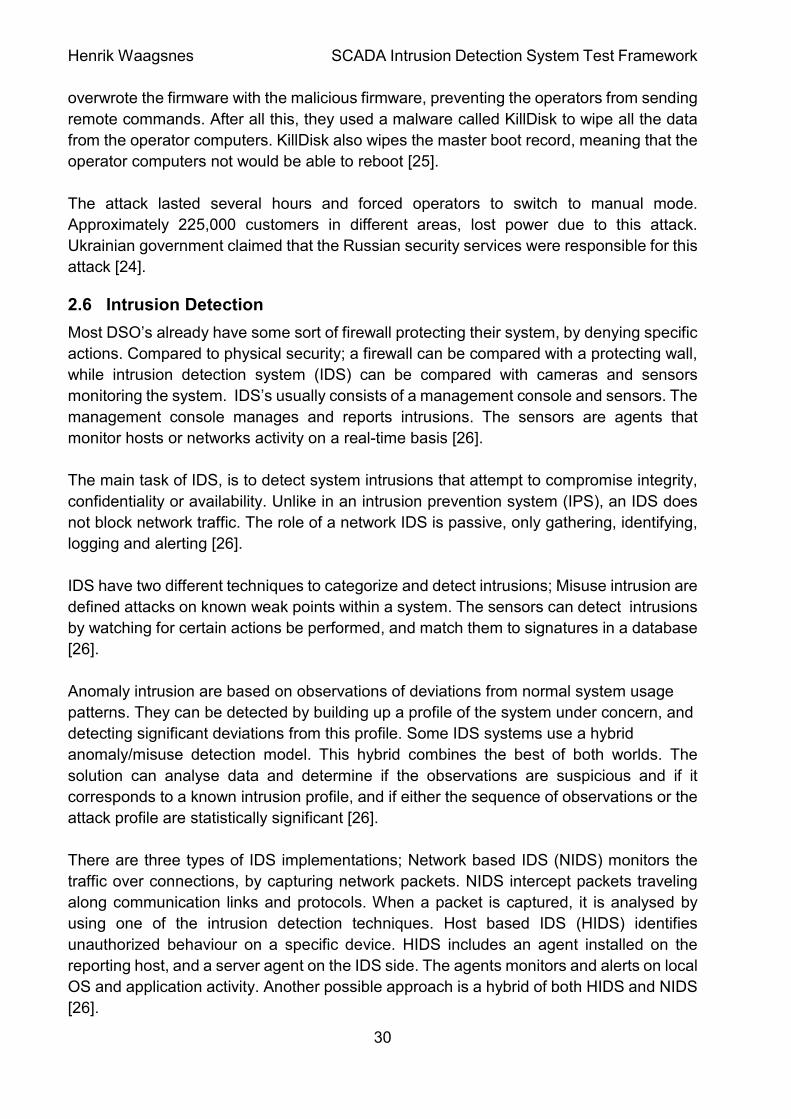
Fourth stage; the worm compromises the Programmable Logic Controllers (PLCs), by
exploiting vulnerabilities in the system. Fifth stage; Stuxnet gathers information about the
running system. Then it uses this information to modify the code running in Programmable
Logic Controllers (PLCs). The goal of the attack was to force the system to deviate from
expected behaviour. In order to hide from intrusion detection systems, the deviation is
small and over a long period of time [22]. Sixth stage; at the same time as the modified
code runs, Stuxnet provides false feedback to monitoring systems. This way the operators
would think that everything runs as normal. Stuxnet was programmed to automatically
erase itself on the date 24.06.2012 [23].
Figure 22: Stuxnet last three stages[21]
Stuxnet was discovered in 2010, by a Belarusian malware-detection company. They found
the malware located in a client’s computer. The malware was signed by a digital certificate,
making it appear to come from a reputable company. The company shared their findings
with other security companies. Some of the world’s largest security firms immediately
began reverse engineering the malware code. It soon became clear that the malware had
been specifically designed to damage Siemens systems running centrifuges in Iran’s
nuclear program. Although the authors of Stuxnet never have been officially identified, the
size and sophistication of the worm indicates that it could have been created only by a
nation-state [21]. Stuxnet was according the Washington post, the work of United States
Page 29
Henrik Waagsnes SCADA Intrusion Detection System Test Framework
29
and Israeli intelligence agencies. The goal was to delay Iran’s apparent progress toward
building an atomic bomb [23].
Large quantities of uranium are needed to build an atomic bomb. The Iranian nuclear
program had at that time nearly 6,000 centrifuges. Centrifuges are fast-spinning machines
that extract uranium. The Stuxnet attack destroyed nearly 1,000 of Iran’s 6,000 centrifuges
[23].
Multiple malicious worms related to the Stuxnet worm has been detected over the past
years. Hungarian researchers found in 2011, a malware called Duqu. This malware had
been designed to steal information about industrial control systems. In 2012 Kaspersky
Lab detected a malware called Flame. This malware had supposedly destroyed files from
oil-company computers in Iran. They realized that Flame was a precursor of Stuxnet, that
somehow had gone undetected. The same year Kaspersky Lab found a worm called
Gauss. The Gauss worm infected computers via USB sticks. The Gauss worm would for
unknown reasons steal files and gather passwords, targeting Lebanese bank credentials
[21].
2.5.2 Attack on the Ukrainian Power Grid
In 2015, three regional electricity distribution companies in Ukraine, experience power
outages due coordinated cyber-attacks. These cyber-attacks are the first publicly
acknowledged incidents to result in power outages [24].
The attacks began with a spear-phishing campaign, targeting IT staff and system
administrators. The campaign sent an email to workers of the companies with a malicious
Word document attached. When they opened the attached document, a popup window
appears asking them to enable macros for the document. If the clicked “enable”, a malware
called BlackEnergy3 would infect the computer and open a backdoor. Now the attackers
have access to the corporate network. Over many months, the attackers conducted
reconnaissance in the network. They managed to get access to the Windows Domain
Controllers and harvested the worker’s credentials: Some of these credentials were used
to get VPN access, and remotely log in to the SCADA network. The first thing they did,
was to reconfigure the uninterruptible power supply (UPS) procedures. They managed to
do this in two of the three companies systems. Each of the three companies were running
different management systems. In each case, the attackers wrote malicious firmware for
the specific system, replacing the legitimate firmware [25].
In December 2015 the attackers launched the attack by accessing a hijacked VPN and
disabled the UPS. A worker from one of these companies, explains that the cursor on his
computer suddenly moved across the screen of its own accord. The worker watched while
the attackers took the substations offline, without being able to stop their action. The
attackers logged him out of the control panel. When he tried to log back in, they had
changed his password. At the same time, they launched a telephone denial-of-service
(TDoS) attack, to prevent customers from calling in to report the outage. They also
Page 30
Henrik Waagsnes SCADA Intrusion Detection System Test Framework
30
overwrote the firmware with the malicious firmware, preventing the operators from sending
remote commands. After all this, they used a malware called KillDisk to wipe all the data
from the operator computers. KillDisk also wipes the master boot record, meaning that the
operator computers not would be able to reboot [25].
The attack lasted several hours and forced operators to switch to manual mode.
Approximately 225,000 customers in different areas, lost power due to this attack.
Ukrainian government claimed that the Russian security services were responsible for this
attack [24].
2.6 Intrusion Detection
Most DSO’s already have some sort of firewall protecting their system, by denying specific
actions. Compared to physical security; a firewall can be compared with a protecting wall,
while intrusion detection system (IDS) can be compared with cameras and sensors
monitoring the system. IDS’s usually consists of a management console and sensors. The
management console manages and reports intrusions. The sensors are agents that
monitor hosts or networks activity on a real-time basis [26].
The main task of IDS, is to detect system intrusions that attempt to compromise integrity,
confidentiality or availability. Unlike in an intrusion prevention system (IPS), an IDS does
not block network traffic. The role of a network IDS is passive, only gathering, identifying,
logging and alerting [26].
IDS have two different techniques to categorize and detect intrusions; Misuse intrusion are
defined attacks on known weak points within a system. The sensors can detect intrusions
by watching for certain actions be performed, and match them to signatures in a database
[26].
Anomaly intrusion are based on observations of deviations from normal system usage
patterns. They can be detected by building up a profile of the system under concern, and
detecting significant deviations from this profile. Some IDS systems use a hybrid
anomaly/misuse detection model. This hybrid combines the best of both worlds. The
solution can analyse data and determine if the observations are suspicious and if it
corresponds to a known intrusion profile, and if either the sequence of observations or the
attack profile are statistically significant [26].
There are three types of IDS implementations; Network based IDS (NIDS) monitors the
traffic over connections, by capturing network packets. NIDS intercept packets traveling
along communication links and protocols. When a packet is captured, it is analysed by
using one of the intrusion detection techniques. Host based IDS (HIDS) identifies
unauthorized behaviour on a specific device. HIDS includes an agent installed on the
reporting host, and a server agent on the IDS side. The agents monitors and alerts on local
OS and application activity. Another possible approach is a hybrid of both HIDS and NIDS
[26].
Page 31
Henrik Waagsnes SCADA Intrusion Detection System Test Framework
31
There are some well-known issues with today’s IDS solutions. An IDS might incorrectly
identify intrusions. A false positive occurs when the IDS classifies an event as a possible
intrusion when it actually is legitimate. A false negative occurs when an actual intrusion
happens but the IDS allows it to pass. A subversion error can happen when an intruder is
able edit the intrusion detector procedures, to force false negatives to occur. False
positives will then, be classified as legitimate events by the administrators of the system
[26].
2.7 Honeypots
A honeypot is a security resource whose value lies in being probed, attacked, or
compromised. Unlike firewalls and IDS technologies, honeypots are something we want
the attackers to interact with. Honeypots can provide additional information about attacks
directed towards specific systems, by collecting information about the attacker. The
honeypots can be divided into two categories, low-interaction and high-interaction
honeypots [27].
Low-interaction honeypots have limited interaction. They normally work by emulating
services and operating systems. Attacker activity is limited to the level of emulation by the
honeypot. The low-interaction honeypot’s main task is to identify hostile activity, generate
an alert and capture a minimum of data. Normally these honeypots take a minimum
amount of work. The main disadvantages with low interaction honeypots is that they log
only limited information and are designed to capture known activity [27].
High-interaction honeypots are totally different. They are usually complex solutions as they
involve real operating systems and applications. Nothing is emulated and attackers are
presented to a real environment. The main advantages with high-interaction honeypots is
that they can capture extensive amounts of information. By giving attackers real systems
to interact with, we are able to learn the full extent of the attacker’s behaviour [27].
A Honeynet is a special kind of high-interaction honeypot, containing entire networks of
computers designed to be attacked. The purpose is building a highly contained network,
where all inbound and outbound traffic is both controlled and captured. Intended victims,
containing computers running real applications are placed within the network. Honeynets
can be divided into three generations [27]:
The first generation (Gen I) honeynet was implemented in an isolated network. A firewall
and a router were used as access control devices. Data Control was implemented at the
routing firewall. Gen I Honeynet has high risk of intruders exploiting its data control
mechanism, and take advantage of initiate a stream of attacks on other systems [27].
The second generation (Gen II) honeynet consist of more advanced technologies,
designed to ensure that compromised nodes of the Honeynet not can be used to attack
Page 32
Henrik Waagsnes SCADA Intrusion Detection System Test Framework
32
machines outside the Honeynet. It is a layer two bridge that can count connections, and
block/modify outbound attacks. The honeynet is placed in the production network and
separated from it by means of a gateway device. Since all the traffic passes through the
gateway, the sensor can capture data traveling in and out of the Honeynet. Advanced data
capture techniques like key loggers can be implemented. The third generation (Gen III)
have the same architecture as the second generation (Gen II). The only difference is
improvements in deployment and management [27].
Honeypots can also be categorized by their purposes; production and research honeypots.
Production honeypots are placed within an organization’s production network with the
purpose of detection. They extend the capabilities of intrusion detection systems.
Research honeypots are deployed by researchers in an isolated environment, with the
purpose of studying the attacker’s tactics and discover new zero day exploits, worms,
trojans and viruses [28].
Page 33
Henrik Waagsnes SCADA Intrusion Detection System Test Framework
33
3 Prior Research
Intrusion detection systems for SCADA networks is a relatively new concept. This chapter,
will discuss prior research on topics related to SCADA intrusion detection. The research
topics is divided into subchapters, although some research fits in several categories.
3.1 Signature and preprocessor based SCADA Intrusion Detection
Digital Bond has performed research on SCADA Security for the US Department of
Homeland Security, US Department of Energy, UK, Japanese and other governments. The
Digital Bond project Quickdraw has released SCADA IDS signature rules and
preprocessor plugins for DNP3, EtherNet/IP and Modbus TCP protocols. These rules and
plugins can be used to identify unauthorized requests, malformed protocol requests and
responses, rarely used and dangerous commands, and other situations that are likely or
possible attacks. The signature rules and preprocessor plugins are written to support Snort
IDS. The signatures can easily be converted to other IDS formats. However, it is not easy
to convert preprocessors to support other IDS formats [29].
Researchers at the Queen’s University Belfast has published a paper, presenting a rule-
based intrusion detection system for IEC 60870-5-104 SCADA networks [30]. They used
a Deep Packet Inspection (DPI) method, which included signature-based and model-
based approaches. The paper presents a set of Snort IDS signatures. These signatures
can not only detect several known malicious attacks and suspicious threats, but also
identify the sources of the attacks and therefore potentially prevent future intrusions. A
specific anomaly based approach, known as model-based is proposed as a complement
to the signature-based approach. By monitoring the behaviors of devices using the
IEC/104 protocol, unknown zeroday attacks may be detected. The researchers conclude
that the latency introduced by the IDS not will compromise the normal operations in the
SCADA system [30].
The same researchers published a paper, presenting a next-generation multi-attribute
SCADA-specific IDS [31]. The paper claims that current security countermeasures in
SCADA systems mainly focus on external threats, and ignores interior detection within a
substation network. An engineer can for instance enter a substation and connect his laptop
to the LAN. This laptop may be infected by malware, providing attackers unauthorized
access to the substation. In a worst-case scenario, this could lead to an attack on the
substation, causing power outages. In order, to address this issue, they proposed a
SCADA cyber-security framework based on IDS [31].
Page 34
Henrik Waagsnes SCADA Intrusion Detection System Test Framework
34
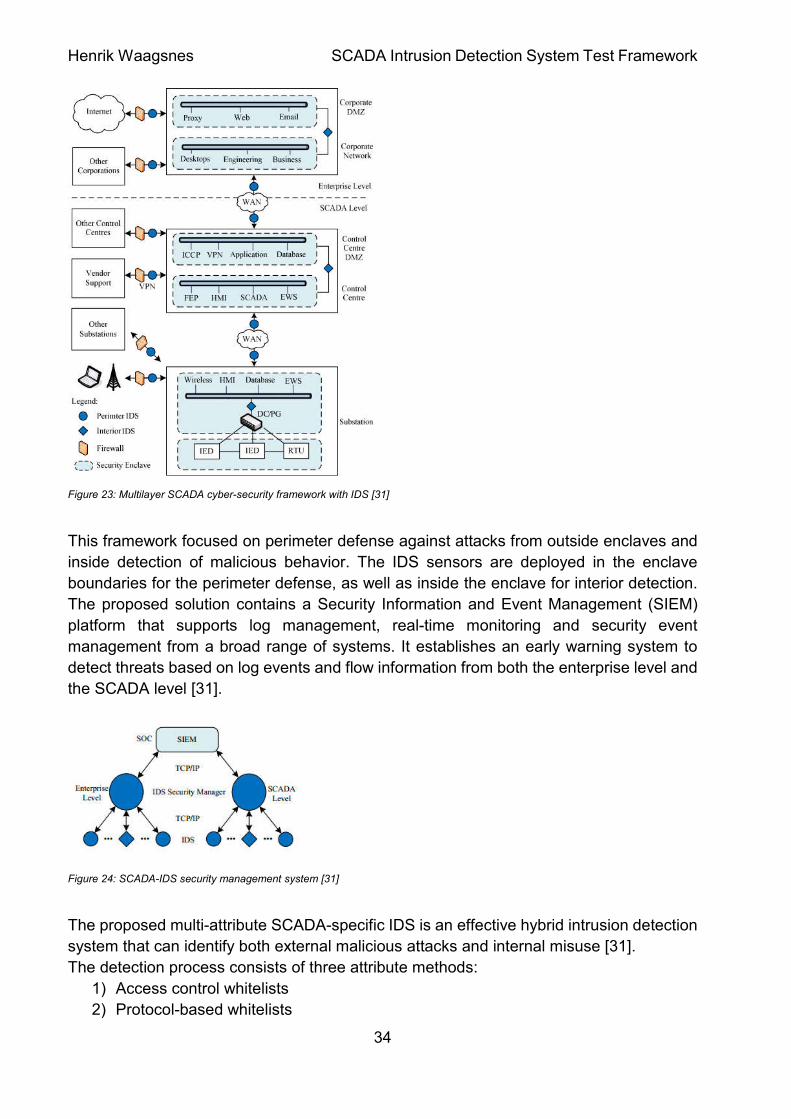
Figure 23: Multilayer SCADA cyber-security framework with IDS [31]
This framework focused on perimeter defense against attacks from outside enclaves and
inside detection of malicious behavior. The IDS sensors are deployed in the enclave
boundaries for the perimeter defense, as well as inside the enclave for interior detection.
The proposed solution contains a Security Information and Event Management (SIEM)
platform that supports log management, real-time monitoring and security event
management from a broad range of systems. It establishes an early warning system to
detect threats based on log events and flow information from both the enterprise level and
the SCADA level [31].
Figure 24: SCADA-IDS security management system [31]
The proposed multi-attribute SCADA-specific IDS is an effective hybrid intrusion detection
system that can identify both external malicious attacks and internal misuse [31].
The detection process consists of three attribute methods:
1) Access control whitelists
2) Protocol-based whitelists
Page 35
Henrik Waagsnes SCADA Intrusion Detection System Test Framework
35
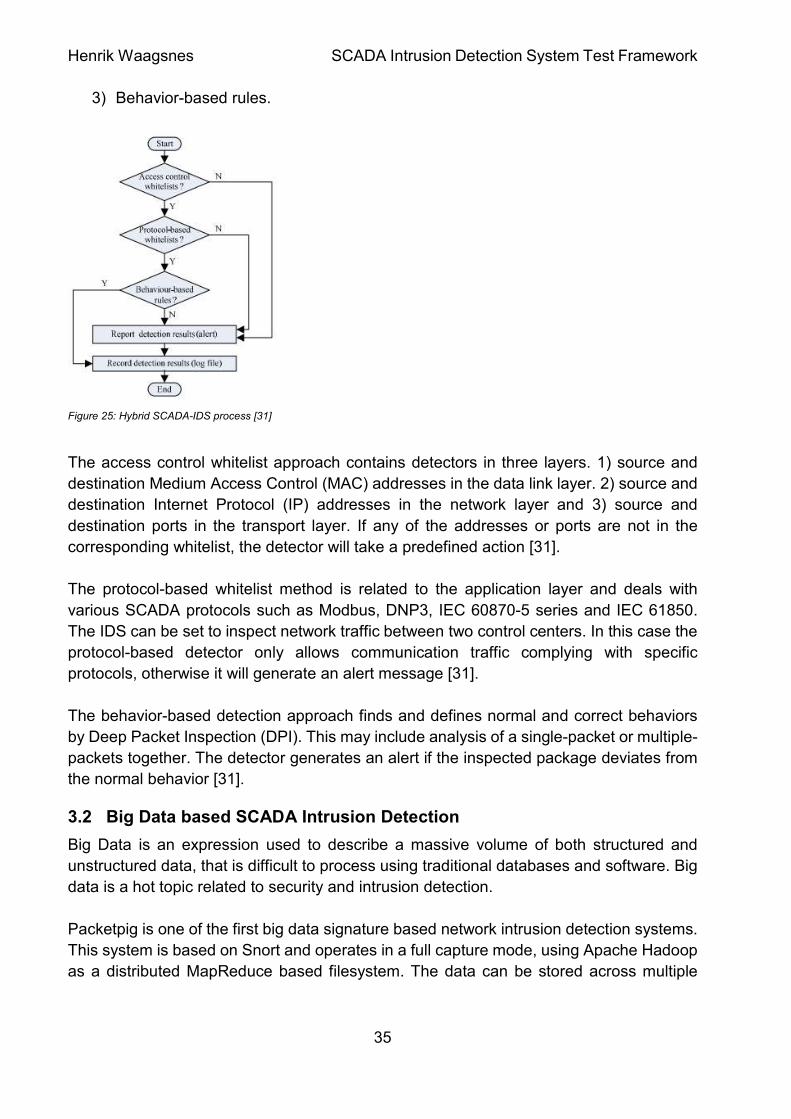
3) Behavior-based rules.
Figure 25: Hybrid SCADA-IDS process [31]
The access control whitelist approach contains detectors in three layers. 1) source and
destination Medium Access Control (MAC) addresses in the data link layer. 2) source and
destination Internet Protocol (IP) addresses in the network layer and 3) source and
destination ports in the transport layer. If any of the addresses or ports are not in the
corresponding whitelist, the detector will take a predefined action [31].
The protocol-based whitelist method is related to the application layer and deals with
various SCADA protocols such as Modbus, DNP3, IEC 60870-5 series and IEC 61850.
The IDS can be set to inspect network traffic between two control centers. In this case the
protocol-based detector only allows communication traffic complying with specific
protocols, otherwise it will generate an alert message [31].
The behavior-based detection approach finds and defines normal and correct behaviors
by Deep Packet Inspection (DPI). This may include analysis of a single-packet or multiple-
packets together. The detector generates an alert if the inspected package deviates from
the normal behavior [31].
3.2 Big Data based SCADA Intrusion Detection
Big Data is an expression used to describe a massive volume of both structured and
unstructured data, that is difficult to process using traditional databases and software. Big
data is a hot topic related to security and intrusion detection.
Packetpig is one of the first big data signature based network intrusion detection systems.
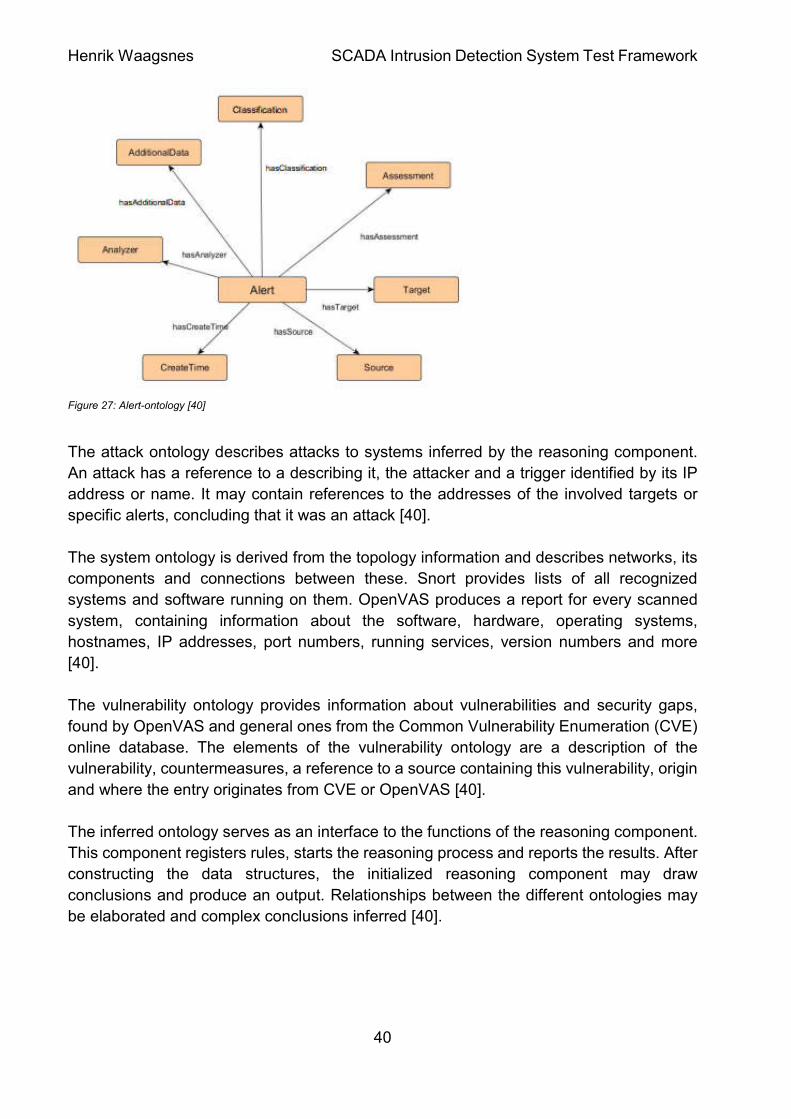
This system is based on Snort and operates in a full capture mode, using Apache Hadoop
as a distributed MapReduce based filesystem. The data can be stored across multiple
Page 36
Henrik Waagsnes SCADA Intrusion Detection System Test Framework
36
nodes, allowing distributed parallel processing. This provides powerful analysis of
terabytes of network packet data, running queries [32].
Researchers at the Austrian Institute of Technology has published a paper, they presents
a big data anomaly based network intrusion detection system used in Smart Grid ICT
networks [33]. This approach heavily relies on statistical analysis of system behavior
reflected in system log files to detect anomalies [34]. Almost every modern ICT component
and service produces logging data to report events, internal state changes, and committed
actions. The data is a valuable source to establish situational awareness about the current
state of ICT networks and is utilized by this approach. The approach uses the Graylog2
software to collect distributed log files and maintain the temporal order of log messages.
The solution use a self-learning approach that continuously creates hypotheses about
correlated events and test them at run-time. It operates in a learning phase (to capture a
stable system model) and an operational phase (to trigger alerts in case of deviations from
the system model). Both phases are executed in parallel, which means the system
continuously learns and can adapt to changing situations [33].
3.3 Machine Learning based SCADA Intrusion detection
Researchers at the University of Surrey has published a paper, presenting how machine
learning methods can be utilized in intrusion detection systems protecting SCADA systems
[35]. This subchapter sums up the methods discussed in this paper.
Intrusion detection is the process of observing and analyzing the events taking place in an
information system to discover signs of security related issues. Intrusion detection systems
(IDS) are traditionally analyzed by human security analysts. When the amount of data
increases, this process will be time consuming and expensive. Machine learning has the
capability to gather new data and make predictions based on the previous data. Machine
learning methods in intrusion detection systems could detect more attacks, reduce the
number of false positives and analyze more efficient than humans [35].
Rule-based Approach
This approach uses rules that describe the correlation between attribute conditions and
class labels. When applied to intrusion detection, the rules becomes descriptive normal
profiles of users, programs and other resources. The intrusion detection mechanism
identifies a potential attack if users or programs act inconsistently with the established
rules. The rules can be written in the form of if-then. If there are too many rules, the system
can become difficult to maintain and can suffer from poor performance [35] , [36].
Artificial Neural Networks
This approach uses an artificial neural network (ANN), which involves a network of simple
processing neurons, which make up the layers of “hidden” units, and can predict complex
behavior, determined by the connections between the processing elements and element
parameters. When applied to intrusion detection systems, an ANN could provide the
capability of analyzing the data even if it is incomplete. Due this capability an ANN can
Page 37
Henrik Waagsnes SCADA Intrusion Detection System Test Framework
37
learn abnormal behaviors and identify potential attacks, even if the attacks are similar to
prior attacks but do not match the previous malicious behaviors exactly. ANN provides fast
speed and nonlinear data analysis. The main difficulty of an ANN is that it needs a large
amount of training data to ensure accurate predictions [35].
Hidden Markov Model (HMM)
This approachs use the Hidden Markov Model (HMM), where the observed examples, �� ,
� ∈ {1, … , �}, have an unobserved state �� at time t. Each node in HMM represent a
random variable with hidden state �� and observed value �� at time t. In HMM it is assumed
that state �� has a probability distribution over the observed samples �� and that the
sequence of observed samples embeds information about the sequence of states.
Statistically, HMM is based on the Markov property that the current true state �� is
conditioned only on the value of the hidden variable �� 1 but is independent of the past
and future states. Similarly, the observation �� only depends on the hidden state ��. The
famous solution to HMM is the Baum-Welch algorithm, which derives the maximum
likelihood estimate of the parameters of the output given the data set of output sequences.
When applied to intrusion detection systems, HMMs can effectively model variations in
system behavior. To apply HMM for anomaly intrusion detection, we need a set of normal
activity states � = {��, … . , ��} and a set of normal observations � = {��, … . , ��} [35] ,
[37].
Given an observation sequence � = {��, … . , ��}, the HMM searches for a normal state
sequence of � = {��, … . , ��} which has a predicted observation sequence most similar to
Y with a probability for examination. If this probability is less than a predefined threshold,
we declare that this observation indicates an anomaly state [35].
Support Vector Machines (SVM)
This approach use Support Vector Machines (SVM), which are one of the leading machine
learning tools, mostly used as a classifier. SVM is a family of learning algorithms for
classification of data into two classes. It uses a function to map data into a space where it
is linearly separable. The space where the data is mapped may be of higher dimension
than the initial space. The SVM allows finding a hyperplane which optimally separates the
classes of data: the hyper-plane is such that its distance to the nearest training data points
is maximal [35].
The SVM has shown superior performance in the classification problem and has been
used successfully in many real-world problems. However, the weakness of SVM is that it
needs prior labelled data and is very sensitive to noise [35] , [38].
When applied to intrusion detection systems, patterns in the data that are normal or
abnormal may not be obvious to operators and all above techniques rely on this prior
information. Although these techniques proved to be a powerful classification tool, it is
difficult without labelled data for tuning the algorithm [35].
Page 38
Henrik Waagsnes SCADA Intrusion Detection System Test Framework
38
One Case SVM (OCSVM): CockpitCI Approach
This approach aims to overcome the issue described above. The OCSVM separates attack
data from the normal data, and can be considered as a regular two-class SVM where all
the data lies in the first class and the origin is the only member of the second class. The
basic idea of the OCSVM is to map the input data into a high dimensional space and
construct an optimal separating hyper plane, which is defined as the one with the maximum
spreading between the two classes. This optimal hyper-plane can be solved easily using
a dual formulation. The solution is sparse and only support vectors are used to specify the
separating hyper-plane. The number of support vectors can be very small compared to the
size of the training set and only support vectors are important for prediction of future points.
A function can be used to compute the separating hyper-plane without explicitly carrying
out the mapping operations into the feature space and all necessary computations are
performed directly in the input space [35] , [39].
Figure 26: OCSVM classification [35]
When applied to intrusion detection systems,OCSVM is used to train the offline data and
generate a detection model. This model is used for intrusion detection. If the decision
model returns a negative value, it implies an abnormal event. Unlike other classification
methods, OCSVM does not need any labelled data (no signatures required) for training or
any information about the kind of intrusion [35].
The researchers also provide a performance comparison of the described machine
learning techniques, show in table 2.
Page 39
Henrik Waagsnes SCADA Intrusion Detection System Test Framework
39
Table 2: Performance comparison of machine learning techniques [35]
3.4 Ontology based SCADA Intrusion Detection
Researchers at the Fraunhofer IOSB in Germany has published a paper, where they
propose an ontology-based intrusion detection framework for SCADA-systems [40]. The
ontology-framework focuses on modeling alerts, attacks, vulnerabilities and systems,
combining these with reasoning. The ontologies are used to map uniformly and normalize
the different security reports created from existing security components of a SCADA
system [40].
The alert ontology maps alerts from Snort and OSSEC in the Intrusion Detection Message
Exchange Format (IDMEF). The base element of an IDMEF alert is the alert element that
describes an alert and its properties [40].
Page 40
Henrik Waagsnes SCADA Intrusion Detection System Test Framework
40
Figure 27: Alert-ontology [40]
The attack ontology describes attacks to systems inferred by the reasoning component.
An attack has a reference to a describing it, the attacker and a trigger identified by its IP
address or name. It may contain references to the addresses of the involved targets or
specific alerts, concluding that it was an attack [40].
The system ontology is derived from the topology information and describes networks, its
components and connections between these. Snort provides lists of all recognized
systems and software running on them. OpenVAS produces a report for every scanned
system, containing information about the software, hardware, operating systems,
hostnames, IP addresses, port numbers, running services, version numbers and more
[40].
The vulnerability ontology provides information about vulnerabilities and security gaps,
found by OpenVAS and general ones from the Common Vulnerability Enumeration (CVE)
online database. The elements of the vulnerability ontology are a description of the
vulnerability, countermeasures, a reference to a source containing this vulnerability, origin
and where the entry originates from CVE or OpenVAS [40].
The inferred ontology serves as an interface to the functions of the reasoning component.
This component registers rules, starts the reasoning process and reports the results. After
constructing the data structures, the initialized reasoning component may draw
conclusions and produce an output. Relationships between the different ontologies may
be elaborated and complex conclusions inferred [40].
Page 41
Henrik Waagsnes SCADA Intrusion Detection System Test Framework
41
3.5 Intrusion detection in SDN-Based SCADA systems
Researchers at the Federal University of Rio Grande do Sul and the Austrian Institute of
Technology have published a paper, where they discuss the benefits of using Software-
Defined Networking (SDN) to assist in the deployment of next generation SCADA systems
[41]. They also present a specific Network-Based Intrusion Detection System (NIDS) for
SDN-based SCADA systems, which uses SDN to capture network information and is
responsible for monitoring the communication between power grid components [41].
Electric power grids are undergoing a modernization process and evolving into the so-
called Smart Grids, improving the generation, transmission, and distribution of electrical
energy. Smart Grids allow a more resilient, secure, and reliable power supply for end-
users. SCADA-systems are also evolving, by using more secure communication protocols
and using field devices with higher processing capacity. SDN is a promising network
paradigm that can support the evolution of SCADA communication networks. SCADA
systems can benefit from the characteristics of SDN in several ways [41]:
Flexibility: SDN permits adding new field devices or upgrading existing network
applications inside the SCADA system [41].
Centralized Management: The RTU can manage field devices, monitor and control
the network that interconnects system devices [41].
Standard API: The OpenFlow protocol provides a standard API that allows a better
integration of geographically disperse network equipment from different vendors
[41].
Programmability: SDN allows creating a range of customized services, for
example load balancing between communication links [41].
The proposed NIDS uses One-Class Classification (OCC) machine learning algorithms
that enable detecting abnormal traffic behavior from a homogeneous training set
containing only the signature of traffic generated under normal network operation. The
NIDS architecture is composed of five components that intercommunicate to monitor the
network and to report possible anomalous behaviors in SCADA systems [41]:
The SDN Controller is a component responsible for monitoring and for applying
routing strategies to SCADA network switches [41].
The Historian Server is a component that is typically present in the Control Center
of several traditional SCADA systems [41].
The Feature Selector is a component that analyses the stored samples and offers
an extensive set of features extracted from OpenFlow native counters [41].
The One-Class Classifier is the central component in the proposed architecture
that analyses samples to find anomalous behaviors in the SCADA network [41].
The NIDS Management Interface component provides a management interface
for SCADA operators to interact with the NIDS [41].
Page 42
Henrik Waagsnes SCADA Intrusion Detection System Test Framework
42
Figure 28: Architecture overview [41]
To demonstrate the benefits and accuracy of the proposed NIDS, they present an analysis
comparing the two OCC machine learning algorithms used in their approach, One-Class
Support Vector Machine (OCSVM) and Support Vector Data Description (SVDD). This
comparison shows the efficiency of the approach to detect cyber-attacks targeted at a
power grid. The experiments are performed by simulating a proof-of-concept SDN-based
SCADA system using a large-scale topology, with one main control center, four
intermediate control centers, eight distribution substations, and hundreds of field devices.
The results of the experiments indicate that OCSVM presents slightly better accuracy than
SVDD and that the OCC algorithms achieve an approximate accuracy of 98%. This shows
that the proposed NIDS effectively can be used to detect cyber-attacks targeted against
SCADA systems [41].
Page 43
Henrik Waagsnes SCADA Intrusion Detection System Test Framework
43
Figure 29: SCADA network topology [41]
3.6 SCADA Honeypots
Conpot is a low interaction honeypot for emulating industrial control systems. It is written
in Python and runs on Debian systems. It is developed as a part of the Honeynet Project,
and can simulate devices like, Guardian AST, Kampstrup smart meters, IPMI and Siemens
SIMATIC S7-200 PLCs [42].
Researchers at the University of Arizona have published a paper, where they perform an
In-depth analysis of the Conpot SCADA Honeypot. They used Amazon Web Services to
host multiple conpot honeypots. They ran about a month, and the logs were subsequently
analyzed. The SCADA honeypots were booted and accessed via Secure Shell (SSH).
They then performed nmap and SHODAN scans against the honeypots. A very interesting
finding in the Nmap scan was that the Guardian AST, Kampstrup, and IPMI devices all
denied ping requests, while the Siemens SIAMATIC S7-200 PLC did not. The results from
the SHODAN scan were also very insightful in that they showed the Conpot instances as
being SCADA devices. The SHODAN scan where also able to show that the Siemens
device was a Siemens SIMATIC S7-200 model. The researchers conclusion was that the
devices accurately depicted SCADA ports, but appeared to have additional ports open that
could reveal their identity as honeypots to sophisticated attackers [43].
Digital bond has developed a high interaction SCADA Honeynet based on the third
generation honeywall from the Honeynet Project. The solution utilizes two virtual
machines. The first virtual machine monitors all network activity. This machine includes a
web management interface called Walleye, a MySQL database for data storage, a Snort
IDS in packet capture mode, and Digital Bond’s Quickdraw IDS signatures. The second
Page 44
Henrik Waagsnes SCADA Intrusion Detection System Test Framework
44
virtual machine (the target) simulates a PLC that exposes several services to the attacker
(FTP, Telnet, HTTP, SNMP and Modbus TCP) [44].
Figure 30: SCADA Honeynet architecture [44]
3.7 Power grid testbeds
Researchers at HES-SO in Switzerland have implemented a physical full-scale
experimental platform called Gridlab district. The platform is created for training and
research purposes in the field of renewable energy and distributed storage integration into
the electrical distribution network. GridLab District is a perfect environment to develop and
test smart grid technologies in their application. The heart of the GridLab is a 400VAC
three-phase power line, to which loads and energy sources are connected. Renewable
energy production sites, storage systems and loads are emulated with programmable
static converters. An Ethernet-based communication system enables the exchange of data
between the converters and a central control unit. The infrastructure of GridLab District is
completed with real electric loads, electrochemical storage units and solar panels on the
roof [45].
Figure 31: GridLab District setup [45]
Page 45
Henrik Waagsnes SCADA Intrusion Detection System Test Framework
45
It would be interesting to see the effect of a cyber-attack on a full-scale platform like this.
This would however, introduce high running costs and lack of flexibility and scalability.
Researchers at the Advanced Digital Sciences Center have published a paper, where they
proposed an open-source software-based smart grid testbed called SoftGrid. The purpose
of SoftGrid is to evaluate the effectiveness, performance, and interoperability of various
security solutions implemented to protect the RTUs of substations. The implemented
approach relies both open-source and proprietary software. It utilizes OpenMUC to support
IEC 60870-5-104 and IEC 61850 protocols, for control centers and IEDs. PowerWorld is a
proprietary software utilized in SoftGrid, to configure scalable power grid simulations.
PowerWold COM API is used for real-time interaction with the simulated power grid.
SoftGrid provides logging and monitoring of the power grid status and transient stability.
The solution supports testbeds with power grids up to 2000-bus systems [46].
Figure 32: Implementation overview of SoftGrid testbed [46]
They have also implemented an active command mediation (A*CMD) system, to
demonstrate how the SoftGrid testbed can evaluate the power grid. An A*CMD system
aims to offer an additional layer of security that can mitigate the impact of cyber-attacks
on power grids. The A*CMD system must be able to implement non-bypassable mediation
of remote control commands and is responsible for inspecting and processing them. A
modern electrical substation has a system component called gateway. The gateway is
responsible for protocol translation between substation remote control and intra-substation
communication. The gateway needs to mediate all remote-control commands, making it
an ideal place for deployment of the A*CMD system. An A*CMD system can host a variety
of security mechanisms, such as rule-based/context-based command filtering, and
command rescheduling or rewriting [46].
Page 46
Henrik Waagsnes SCADA Intrusion Detection System Test Framework
46
Figure 33: Placement of A*CMD system [46]
The A*CMD system in each substation independently adds artificial time delays before
executing the control centre’s commands on targeted IEDs. The purpose of the artificial
delay is to provide an attack detection system, which is often implemented at the control
center, with a time buffer to detect attacks and then to cancel any suspicious control
commands. If the detection and cancellation takes place before the delay expires, the
command will never be executed on the IEDs. This approach can reduce the number of
malicious commands executed. The proposed solution also deploys an IDS at each
individual substation, which sniffs and parses incoming messages and, and reports them
back to a central IDS at the control center. The central IDS shows the impact of each
control command to determine whether the command is malicious or not [46].
Another interesting paper describes a microgrid testbed for interdisciplinary research on
cyber-secure industrial control in power systems. Researchers at the Queen’s University
Belfast present a physical electrical system testbed, representing a microgrid containing
embedded generation. The testbed was originally constructed to demonstrate the
feasibility of synchronous islanding of a single machine, then adapted for multimachine
islanding, and then again to create a testbed on which to investigate the interdisciplinary
domain of cyber-secure industrial control systems. The test-bed enables prototyping and
validation of several core features necessary for future smart grid systems. A key benefit
of the presented system is the ability to experiment with the full stack of functionality,
spanning from the physical –electrical– layer, through standards compliant
communications layers, right up to the application layer, where smart grid control functions
can be implemented and tested [47].
Page 47
Henrik Waagsnes SCADA Intrusion Detection System Test Framework
47
4 Approach
This chapter describes the proposed solution of a SCADA Intrusion Detection System Test
Framework. This Framework provides a controlled environment for penetration testing,
real-time simulation, intrusion detection and visualization of attacks targeting SCADA
networks.
The environment can simulate real-time IEC 60870-5-104 traffic between SCADA devices
and attacks can be performed by utilizing the attacker machine in the framework. The
framework also includes a simulated Siemens S7 -200 PLC that makes possible to perform
attacks against the modbus protocol. Two separate intrusion detection systems (IDSs) are
individually looking for malicious Modbus, DNP3 and IEC 60870-5-104 traffic in the
controlled environment. An alert is triggered each time one of the IDS implementations
detect malicious traffic. The alert is then forwarded to a centralized security information
and event management (SIEM) solution, responsible for collecting, analyse, indexing and
visualizing IDS events.
4.1 Framework architecture
The framework's architecture is categorized into four elements:
Security information and event management (SIEM)
Intrusion detection systems (IDS)
SCADA target side
Attacker side
The attacker side is a Kali Linux machine with over 600 penetration testing tools. The
SCADA target side consist of three machines running the client and server side of the IEC
60870-5-104 communication, and one machine simulating a Siemens S7-200 PLC. The
Attacker machine and the SCADA machines are connected to the same local network. The
network traffic traversing the lab network is mirrored and analysed by two separate
Intrusion detection system implementations. Both Suricata and Snort are implemented in
this framework. The SCADA rules for IEC 60870-5-104 [30] and the Digital Bond
Quickdraw SCADA rules for Modbus and DNP3 [29] are implemented in both IDS
solutions.
Suricata is configured to log alerts in a structured eve JSON format. This output format is
not available in Snort. For the basis of comparison between alerts triggered by Suricata
and Snort, it is advantageous if the output log format is the same. To achieve this is Snort
configured to log alerts in a format called Unified2. A python library called py-idstools is
then used to convert the Unified2 format to eve JSON.
The ELK stack is used as a SIEM solution in this framework. Logstash is configure to listen
on TCP port 5044 in the management network. Filebeat is installed on both IDS
implementations and configured to forward new entries in the log file to Logstash on port
Page 48
Henrik Waagsnes SCADA Intrusion Detection System Test Framework
48
5044. Logstash then analyses the incoming data and is configured to add/remove some
fields and tags. The refined data is then shipped to Elasticsearch and stored in a cluster.
Kibana is used to explore the Elasticsearch data. Kibana provide the possibility to
investigate historical and real-time events by utilizing a search engine or custom
dashboards to visualize the data.
X-pack is implemented on top of the ELK stack. This framework use a basic license which
only includes a monitoring feature. This monitoring feature provide real-time monitoring of
the performance of the Elasticsearch cluster and the Kibana work load. The X-pack license
can be upgraded and multiple other features can be unlocked.
The figure on the next page gives an overview of how the framework is interconnected.
Appendix A contains detailed about the tools implemented in the SCADA Intrusion
Detection System Test Framework.
Page 49
Henrik Waagsnes SCADA Intrusion Detection System Test Framework
49
Security information and event management (Security information and event management (
Intrusion detection systems (IDSs)Intrusion detection systems (IDSs)
ELK Stack
Kali Linux
Lab network
Suricata IDS Snort IDS
Mirrored
ELKmonitor
Logstash
ElasticsearchNode-1
Kibana
Beats (filebeat)Beats (filebeat)
Suricata IDS Snort IDS
eve.jsonSuricata.yamlRules Unified2 logsnort.confRules
Py-idstools:u2eveeve.json
Management network
IEC Server(IEC 60870-5-104 Server)
OSHMIQTester104 (IEC 60870-5-104 protocol tester)
X-PackWith Basic License
Conpot version 0.5.1Telnet server
PuTTY (Telnet Client)
ElasticsearchNode-2
ElasticsearchNode-3
Distributed
OpenMUC j60870
Figure 34: Framework Architecture
Page 50
Henrik Waagsnes SCADA Intrusion Detection System Test Framework
50
4.2 Implementation
The proposed SCADA Intrusion Detection System Test Framework is hosted in a virtual
environment running on a HP EliteBook 8560w Workstation. VirtualBox is used as a
hypervisor platform.
Table 3: System specification
System specifications HP EliteBook 8560w Workstation
Operating system Ubuntu 16.04 LTS 64bit
CPU Intel Core i7-2630QM Processor 2.20 GHz x 8
RAM 11GB
Graphics Nvidia GF108GLM 1GB
NIC Intel 82579LM
Storage 500GB
Software VirtualBox version 5.1.18
Two separate virtual networks are implemented. The first network is a lab network to
provide communication between SCADA devices and attackers. The other network is a
management network to provide communication between the IDSs and the SIEM solution.
Table 4: Network specifications
Appendix B contains detailed specifications for each virtual machines implemented in the
framework.
4.2.1 Attacker and SCADA targets
The attacker side of this approach is directly connected to the lab network. It consists of
one virtual machine with Kali Linux installed. The attacker machine can be used to perform
reconnaissance, man-in-the-middle attack, denial of service attacks, brute force,
vulnerability exploitation and several other attacks.
The SCADA target side consist of four virtual machines. Only two of these machines need
to be turned on simultaneously to simulate different scenarios. The three machines
generate real-time IEC 60870-5-104 communication in the network. Two machine
simulates the control side of the SCADA system; two IEC clients and one HMI. The other
machine simulates the RTU side and an IEC server. The fourth machine simulates a
Siemens SIAMATIC S7 -200 S7 -200 PLC that can be to simulate attacks on modbus.
4.2.1.1 IEC 60870-5-104 Server
This machine simulates the RTU side and has a software called IEC Server installed. This
is a tool used to simulate the server side of systems using the IEC 60870-5-104 protocol.
The graphical user interface (GUI) shown in figure 35 consists of three main panels; server
panel, item panel and status panel. The server panel provides the possibility to add new
items, turn on/off simulation, start/stop server and save/load configuration. The item panel
displays the IEC type of an item, description of the item, Application Service Data Unit
Network specifications Lab network 10.0.0.1 / 24
Management network 192.168.0.1 / 24
Page 51
Henrik Waagsnes SCADA Intrusion Detection System Test Framework
51
(ASDU) field, Cause of transmission (COT) field, information object address (IOB) field
and value field. In addition, the panel includes the ability to turn on automatic simulation or
manually send item information. The status panel displays connected clients and a real-
time log of data transmission between server and client.
Figure 35: IEC Server panels
The IEC server software supports twelve IEC 60870-5-104 message types in monitoring
direction and eight in control direction. Table 5 provides a list of all IEC types implemented
in the software. IEC Server can be configured to automatically simulate feedback when it
receives a control message from a client.
Table 5: IEC 60870-5-104 message types supported by IEC Server [48]
Implemented IEC 60870-5-104 message types Monitoring direction Control direction
M_SP_NA
Single point information C_IC_NA (General) Interrogation command
M_SP_TB Single point long time tag C_CI_NA Counter interrogation command M_DP_NA Double point information C_CS_NA Clock synchronization command M_DP_TB Double point long time tag C_SC_NA Single command M_ME_NA Measured value, norm C_DC_NA Double command M_ME_TB Measured value, norm. long time C_SE_NA Set point command norm. value M_ME_NB Measured value, scaled C_SE_NB Set point command scaled value M_ME_TD Measured value, scaled long
time
C_SE_NC Set point command float
M_ME_NC Measured value, float M_ME_TF Measured value, float. long time M_IT_NA Integrated totals M_IT_TB Integrated totals long time
4.2.1.2 IEC 60870-5-104 Client
This machine simulates the control side and has QTester104 installed. The software can
be used to simulate the client side of IEC 60870-5-104 communication. QTester104 can
be used to poll and view data from RTUs and send command messages. In addition to the
Open Substation human-machine interface (OSHMI) installed. OSHMI us used as a HMI
to control and monitor substation. OSHMI can be connected to QTester104, and be used
to poll data from real RTUs. This is not implemented in this framework. OSHMI is
Page 52
Henrik Waagsnes SCADA Intrusion Detection System Test Framework
52
configured to operate in simulation mode, and can be used to simulate the effect of a
cyber-attack on a power plant.
Figure 36 shows how QTester104 can be configured in the file qtester104.ini. In the
configuration file, information is configured to connect to a RTU. This includes the primary
link address (ASDU) of the primary station and secondary link address of the RTU. IP
address and TCP port of the RTU are also configured in this file. Finally, the value of the
ALLOW_COMMANDS parameter decides whether it should be possible to send control
commands or not. Some configuration can be set temporary in the graphical user interface.
Figure 36: qtester104.ini configuration file
Figure 37 shows how the GUI looks like when QTester104 is connected to IEC Server on
the RTU side. QTester104 is connected over TCP port 2404, and polls the value “71” from
the temperature sensor in IEC server.
Figure 37: QTester104 GUI connected to IEC Server
Wireshark can be used to validate that the IEC 60870-5-104 communication is transferred
from 10.0.0.75 (RTU side) to 10.0.0.66 (Control side) in plain text. Figure 38 shows how
this communication looks like when analysed by Wireshark.
Page 53
Henrik Waagsnes SCADA Intrusion Detection System Test Framework
53
Figure 38: Wireshark analysis of IEC 60870-5-104 communication
OSHMI can be configured in the hmi.ini within the config folder. It can run in simulation
mode or be connected to a real or simulated RTU. QTester104 can be connected to the
OSHMI software using a transfer protocol called BDTR.
The following four figures shows how the substation can be monitored and controlled by a
HMI. OSHM is in this example configurated in simulation mode. Figure 39 shows the HMI
of substation KOR1 in when everything runs as normal. Figure 40 shows the same HMI
when one of the substation switch is turned off. Figure 41 shows the event viewer for
substation KOR1. This information is written in Portuguese (it is possible to edit this to
English manually in the configuration file). The event is an alarm with priority 1L, and
description; AL15 23 kV switched OFF. Figure 42 shows a graph of the substations flow
measurement over the past hour.
Figure 39: OSHMI KOR1 substation in simulation mode switch on
Page 54
Henrik Waagsnes SCADA Intrusion Detection System Test Framework
54
Figure 40: OSHMI KOR1 substation in simulation mode switch off
Figure 41: OSHMI KOR1 event viewer in simulation mode
Figure 42: OSHMI KOR1 substation trend viewer in simulation mode
The figures above show an example of how OSHMI can be used to simulate various
scenarios in substations. It provides an overview of all elements in the substation, event
logging and graph visualization. By connecting the HMI to simulated or real RTUs, it is
possible to performed attacks and visualize the effect on the substation. One example
could be to modify a M_SP_NA_1 message, by editing the value from ON to OFF. This
can be visualized in the HMI.
4.2.1.3 Second IEC 60870-5-104 Client
QTester104 does not support all the IEC 60870-5-104 messages. QTester104 does not
support commands such as C_IC_NA_1, C_CI_NA_1, C_RD_NA_1, and C_RP_NC_1.
To make it possible to trigger all signatures in the IEC 60870-5-104 rule-set I also
implemented OpenMUC j60870. This framework utilizes OpenMUC j60870 on the client
side, in addition to QTester104. OpenMUC j60870 supports all IEC message types.
Page 55
Henrik Waagsnes SCADA Intrusion Detection System Test Framework
55
The big difference between the OpenMUC j60870 and QTester104 is that the Open MUC
j60870 must be programmed using Java. While, QTester104 can be configured by using
a simple GUI.
I stored OpenMUC in the forder “/openmuc/j60870”. The OpenMUC client can be
executed by the following command; “./run-scripts/j60870-console-client -h 10.0.0.75 -p
2404”. This command includes parameters that defines the server IP and port. Figure 43
show the commands available by default in OpenMUC.
Figure 43: OpenMUC j60870 Client Console default
To send more, I had to make changes to the OpenMUC code. The code is located within
the “/src/main/java/org/openmuc/j60870/app/”. This folder contains code for the client and
server side. I opened the “ConsoleClient.java” file in a text editor and further developed
the code. I used the developers' Javadoc page to find out how to further develop the code
[49]. The first thing I did was to import the necessary classes. Figure 44 show how added
some med commands to the ConsoleClient class.
Figure 44: Adding new commands and acionkeys
Figure 45 show the code added to initiate communication, for each command.
Page 56
Henrik Waagsnes SCADA Intrusion Detection System Test Framework
56
Figure 45: Configuring action for actionkey
Figure 46 show the code used to performed action when a actionkey is pressed.
Figure 46: Add new action for each command
I use the gradle build automation tool included in OpenMUC, to rebuild the code. This is
done simply by executing the command; “gradle build”. Then I run the OpenMUC client
again. Figure 47 shows all the commands available in the client console after further
developing the code.
Figure 47: OpenMUC j60870 Client Console after modification
Page 57
Henrik Waagsnes SCADA Intrusion Detection System Test Framework
57
4.2.1.4 Siemens SIAMATIC S7 -200 PLC
This machine has a low interaction honeypot called Conpot installed. Conpot is used to
simulate the server side an industrial control systems. It is in this framework configured to
simulate a Siemens SIMATIC S7 -200 PLC acting as a modbus server. In order to
automatically start the PLC at while the systems boots, the framework has implemented a
system daemon that starts automaticity. The machine automatically listens on TCP port
502 and accepts commands from modbus clients.
4.2.2 Intrusion Detection Systems (IDSs)
The network activity caused by attacker machines and SCADA targets are mirrored and
analysed by the two different intrusion detection systems. Both Suricata and Snort is
installed in this implementation to compare the ability to detect intrusion. These IDS
solutions are installed on two different virtual machines and operate individually.
The SCADA rules for IEC 60870-5-104 [30] and the Digital Bond Quickdraw SCADA rules
for Modbus and DNP3 [29] are implemented in both IDS solution. These signatures are
originally written in Snorts lightweight rule description language. Suricata IDS is however
compatible with Snort signatures.
Most Snort rules, is written within in a single line, but can be spread over multiple lines by
adding a backslash “\” at the end of the line. A snort rule can be divided into two logical
sections, the rule header and the rule options. The rule header contains information about,
action to be taken, protocol, source/destination IP address and ports. The rule option part
contains an alert message and information about which part of the packet that should be
inspected. Table 6 show an example snort rule [26].
Table 6: Example snort rule
There are by default five different actions that can be triggered in Snort.
1. alert - generate an alert using the selected alert method, and then log the packet
2. log - log the packet
3. pass - ignore the packet
4. activate - alert and then turn on another dynamic rule
5. dynamic - remain idle until activated by an activate rule, then act as a log rule
The next field in a rule defines the protocol analyzed for suspicious behavior. TCP, UDP,
ICMP, and IP are now the only protocols supported by Snort. Then the next fields specify
the IP addresses and port number of hosts monitored, and the IP addresses targeting the
hosts. The example above will detect every IP addresses from external networks sending
ICMP traffic, to any computer within the home net. The variables “$EXTERNAL_NET” and
“$HOME_NET” can be configured in the configuration file [26].
Alert icmp $EXTERNAL_NET any -> $HOME_NET any \
(msg: ”ICMP traffic from external network”; )
Page 58
Henrik Waagsnes SCADA Intrusion Detection System Test Framework
58
The direction operator indicates the direction of a traffic rule. There are two direction
options “->” and “<>”, directional and bidirectional. The msg field contains a text string,
explaining the detected intrusion. The administrator uses the keyword content, to specify
what information the IDS should be looking for. It is also possible use a reference field, to
include references (like a URL) to external identification systems. An id field specifies a
generator id (gid), used to identify what part of Snort that generates the event. Snort
recommends gid values starting at 1,000,000 for local rules, to avoid potential conflicts
with predefined generator id. The sid field is used to uniquely identify Snort rules. The rev
field is used to uniquely identify revisions of snort rules. Sid are along with rev, allow
signatures and descriptions to be refined and replaced with updated information. Sid
numbers higher or equal to 1,000,000 is reserved for local rules. Other fields like classtype
and priority, lets the administrator classify and priorities the rules security level [26].
4.2.2.1 Suricata IDS
Suricata is by default installed in the “/etc/suricata” folder. The Modbus, DNP3 and IEC
60870-5-104 rules are placed within the “/etc/suricata/rules” folder.
The suricata configuration file is structured in YAML format and located within the default
folder. YAML is a human-readable data serialization language. The YAML-file is divided
into five configuration steps.
Step 1: Inform Suricata about your network
Step 2: Select the rules to enable or disable
Step 3: Select outputs to enable
Step 4: Configure common capture settings
Step 5: App Layer Protocol Configuration
Step 1 includes configuring network parameters. The parameter HOME_NET will in this
case be the 10.0.0.1/24 network and the parameter EXTERNAL_NET will be every IP
address not defined in the HOME_NET parameter. Allowed IP addresses and port
numbers for servers and clients used in Modbus, DNP3 and IEC 60870-5-104
communication can also be configured in this step. These parameters are used in the rule
sets implemented. It is important that these parameters are configured correctly, otherwise
the suricata engine won’t work properly. Misconfiguration could lead to false positives and
false negatives.
Step 2 includes activation and deactivation of specific rule sets. Default rules sets can be
deactivated by adding a hash symbol (#) in front of the specific rule-set, and activated by
removing it. External rule sets must be added in the configuration file manually or using
automation tools. The rule sets in the configuration file points at the files located in the
“/etc/suricata/rules” folder.
Step 3 includes Selection suricata log output. The Extensible Event Format (EVE) option
is selected in this implementation. The EVE format logs in JSON format and provides
Page 59
Henrik Waagsnes SCADA Intrusion Detection System Test Framework
59
several types of logging. The alert and flow option is enabled. The log output generated by
the Suricata engine is by default located in the ”/var/log/suricata” folder.
In this implementation the default settings in step 4 and step 5 are used. This includes
packet analysis on eth0 (monitoring interface). It is also possible to separate these steps
in separate files and include the in the main file. The suricata executable file is by default
located in “/usr/bin/suricata”. Suricata starts in IDS mode by running the following
command; ”/usr/bin/suricata -c /etc/suricata/suricata.yaml -i eth0”. Suricata is not executed
on boot by default. For this reason, the framework has implemented a system daemon to
automatically start it at startup.
4.2.2.2 Snort IDS
Snort is by default installed in the “/etc/snort” folder. The Modbus, DNP3 and IEC 60870-
5-104 rules are placed within the “/etc/snort/rules” folder. Snort can be configured by
editing the snort.conf file within the default folder. The configuration file is divided into nine
configuration steps.
Step 1: Set the network variables.
Step 2: Configure the decoder
Step 3: Configure the base detection engine
Step 4: Configure dynamic loaded libraries
Step 5: Configure preprocessors
Step 6: Configure output plugins
Step 7: Customize your rule set
Step 8: Customize preprocessor and decoder rule set
Step 9: Customize shared object rule set
Step 1 include configuring network parameters. The parameter HOME_NET will in this
case be the 10.0.0.1/24 network and the parameter EXTERNAL_NET will be every IP
address not defined in the HOME_NET parameter. Allowed IP addresses and port
numbers for servers and clients used in Modbus, DNP3 and IEC 60870-5-104
communication can also be configured in this step. These parameters are used in the rule
sets implemented. It is important that these parameters are configured correctly, otherwise
the Snort engine will not work properly. Misconfiguration could lead to false positives and
false negatives.
Step 2 includes configuration of the Snort decoder. Decoding is one of the first processes
a packet goes through in Snort. The decoder determines which underlying protocols are
used in the packet and saves the data along with the location of the payload/application
data in the packet and the size of this payload for use by the preprocessor and detection
engines [50]. This implementation uses default settings in this section.
Page 60
Henrik Waagsnes SCADA Intrusion Detection System Test Framework
60
Step 3 includes configuration of the base detection engine. This section can be used to
configure detection mode, event queuing limits, packet latency, rule latency and other
specifications. Step 4 includes configuring dynamic loaded libraries. This implementation
use default setting in both step 3 and step 4.
Step 5 includes configuration of preprocessors. The DNP3 and modbus preprocessor are
activated by default. The ARP spoof preprocessor is configured to detect man-in-the-
middle attacks in the lab network.
Step 6 includes configuration of output plugins. This implementation has configured alerts
to be logged in a Unified2 IDS event file format stored in the “/var/log/snort” folder. To store
the alerts in the same format as in the Suricata implementation, a python library called py-
idstools is used to convert the Unified2 format to eve JSON. Table 7 shows the u2eve
configuration file. u2eve is configured to continuously convert the unified2 file (snort.u2) to
eve.json.
Table 7: py-idstools u2eve configuration file
To automaticity run u2eve at boot, a system daemon was created running the following
command; /usr/bin/python /usr/local/bin/idstools-u2eve @/etc/idstools/u2eve.conf. This
command runs u2eve using Python, pointing at the u2eve configuration file in table 7. The
rule descriptions and category description from the Modbus, DNP3 and IEC60870-5-104
rulesets was added in the sid-msg.map and gid-msg.map manually. It is also possible to
use external tools to do this job automatically.
Step 7 includes activation and deactivation of specific rule sets. Default rules sets can be
deactivated by adding a hash symbol (#) in from of the specific rule-set, and activated by
removing it. External rule sets must be added in the configuration file manually or using
automation tools. The rule sets in the configuration file points at the files located in the
“/etc/snort/rules” folder.
Step 8 includes customising preprocessor and decoder rule set and step 9 includes
customising shared object rule set. Both these steps are configured with default settings
in this implementation. The snort executable file is by default located in the
“/usr/bin/suricata” folder. Snort starts by running the following command;
”/usr/local/bin/snort -v -c /etc/snort/snort.conf -i eth0”. Snort is not executed on boot by
default. For this reason, this framework has implemented a system daemon to
automatically start it at startup.
--snort-conf=/etc/snort/snort.conf
--directory=/var/log/snort
--prefix=snort.u2
--follow
--bookmark
--delete
--output=/var/log/snort/eve.json
Page 61
Henrik Waagsnes SCADA Intrusion Detection System Test Framework
61
4.2.2.3 Filebeat
Filebeat is installed on both IDS implementations to ship data generated by the IDS to the
centralized SIEM solution. Filebeat sends log data from specific log files to Logstash over
the management network. It can be configured in the “filebeat.yml” fil, within the
“/etc/filebeat” folder. Table 8 shows the file beat configuration in on the Snort IDS machine.
Table 8: Filebeat configuration on the Snort IDS machine
The first section specifies the filebeat prospectors responsible for finding all sources to
read from. The “input_typ” is configured as “log”, meaning that filebeat will read log data
and ship new entries in the log files. Old data will automatically be ignored. The field
“paths:” points log files that will be shipped to Logstash. In this implementation, we only
point to the snort log file “/var/log/snort/eve.json”. The field “fields_under_root” is set to
true, meaning that the custom fields are stored as top-level fields in the output document
instead of being grouped under a fields sub-dictionary. To distinguish which IDS that report
data, it adds a tag called snort.
The second section specifies where to send the log data. Filebeat can be configured to
send data directly to Elasticsearch or to Logstash. In this implementation, Filebeat is
configured to ship the data to the Logstash, on IP address 192.168.0.125 port 5044 in the
management network. Filebeat is configured in the same way on the Suricata IDS
machine. The only differences are that filebeat sends data from "/var/log/suricata/eve.json"
and adds a tag called suricata.
The filebeat executable file is by default located in “/usr/share/filebeat/bin/filebeat”.
Filebeat provides a system daemon by default. This system daemon must be enabled to
start automaticity on startup. Filebeat can be configured to transmit SSL encrypted data to
Logstash. This requires additional configuration of both Filebeat, Logstash and exchange
of certificates and keys. Filebeat uses the certificate to verify the Logstash server, and
Logstash uses the key to verify the filebeat agent.
#============== Filebeat prospectors ==================
filebeat.prospectors:
- input_type: log
paths:
- /var/log/snort/eve.json
fields_under_root: true
fields:
tags: ['Snort']
#-------------------------- Elasticsearch output -------------------------------
output.logstash:
hosts: ['192.168.0.125:5044']
Page 62
Henrik Waagsnes SCADA Intrusion Detection System Test Framework
62
4.2.3 Security information and event management (SIEM)
The ELK (Elasticsearch, Logstash, and Kibana) stack is used as security information and
event management (SIEM) solution in this framework. Logstash is configured to listen on
TCP port 5044 in the management network, and receive data from filebeat agents.
Logstash then analyses the incoming data and is configured to add/remove some fields
and tags. The refined data is then shipped to Elasticsearch and stored in a cluster. Kibana
is used to explore the Elasticsearch data. Kibana provides the possibility to investigate
historical and real-time events by utilizing a search engine or custom dashboards to
visualize the data. As part of this master thesis, I have created several custom dashboards
for visualization of attacks. The ELK stack architecture in figure 48 shows how the SIEM
solution collects, refines, analyses and visualize the data.
Security information and event management (Security information and event management (
ELK Stack
ELKmonitor
Logstash
Elasticsearch
Kibana
X-PackWith Basic License
Listening to port 5044 (input from Filebeat)
Figure 48: ELK stack architecture
4.2.3.1 Logstash
The Logstash configuration files is in the “/etc/logstash” folder. Specific logstash
parameters like reload interval, memory settings, processing delay and syslog levels can
be configured in the “logstash.yml” file. This implementation follows the default settings.
Logstash can be configured by creating a “logstash.conf” file in JSON-format, and place it
within the “/etc/logstash/conf.d” folder. The Logstash processing pipeline shown in figure
49 has three stages: inputs → filters → outputs. Inputs collects event data, filters modify
the data, and outputs ship the data to Elasticsearch [51]. It is also possible to split this
configuration file into three separate configuration files (input, filter, output).
Page 63
Henrik Waagsnes SCADA Intrusion Detection System Test Framework
63
Figure 49: Logstash configuration [51]
Input:
This Beats input plugin enables Logstash to receive events from Beats, in this case
Filebeat. Logstash is configured to listen on port 5044 for incoming Beats connection. The
codec input plugin decodes the data before it enters the input. The default codec is “plain”.
This implementation use the “json” codec.
Filter:
The mutate filter provides the possibility to rename, remove, replace, and modify fields in
the event data. This implementation is configured to add a new field that specifies the IDS
engine used to generate the event. This is done by analysing the tags added in Filebeat.
If the value “Suricata” is added in tags, Logstash adds an engine field with the value
“Suricata”. Else if the value “Snort” is added in tags, logstash adds the engine field value
“Snort”. Else if the value “Bro” is added in tags, logstash adds the engine field value “Bro”.
Else logstash adds the engine value “unknown”. In addition, logstash is configured to
remove some unnecessary default fields.
The GeoIP filter is configured to analyze source/destination IP addresses and add
information about the geographical location, based on data from the GeoLite2-City
Database. The GeoLite2-City database is stored locally in the logstash executable files
folder. At the end of the filter plugin Logstash is configured to analyze the severity
information provided by the IDSs, and categorize the alerts into four severity categories
(High, Medium, Low and Unknown).
Output:
This output plugin is configured to transmit the data to Elasticsearch. The host and port
addresses configured in the ”elasticsearch.yml” configuration file, is specified in the output
filter. Logstash sends the data to 192.168.0.125 on port 9200. The output filter is also
configured to store the data with the index filebeat- and the current date. Finally, Logstash
is configured to use a custom template. This is just a modification of the Logstash template,
where the name is changed to “filebeat-*”.
The configuration can be validated by running the following command;
/usr/share/logstash/bin/logstash -t -f /etc/logstash/conf.d/
Logstash returns the following message if everything is correct;
Config Validation Result: OK
The entire configuration file implemented in this framework is included in Appendix C.
Page 64
Henrik Waagsnes SCADA Intrusion Detection System Test Framework
64
4.2.3.2 Elasticsearch
The Elasticsearch configuration file “elasticsearsh.yml” is in the “/etc/elasticsearch” folder.
This implementation runs a three-node cluster (three elasticsearch servers). However, due
to limited resources is node-2 and node-3 disable during experiments. The
elasticsearsh.yml file is used to set the cluster name, node name and bind Elasticsearch
to an IP address and port. In order for Elasticsearch to discover other nodes, the IP
address of other elasticsearch servers is specified.
A node is a running instance of Elasticsearch which belongs to a cluster. A cluster consists
of one or more nodes which share the same cluster name. Each cluster has a single master
node which is chosen automatically by the cluster and which can be replaced if the current
master node fails [52]. Figure 50 shows the monitoring of the three nodes implemented in
the framework. The node with the name node-3 is selected as the master.
Figure 50: Three-node cluster
Logstash is configured to send event data as a document to Elasticsearch. A document is
a JSON document which is stored in elasticsearch. It is like a row in a table in a relational
database. Each document is stored in an index and has a type and an id. The type value
is configured in the logstash configuration with value “IDS-event”. The id field a unique
string generated for each event. An index is like a table in a relational database. It has a
mapping which defines the fields in the index [52].
A shard is a single Lucene instance, managed automatically by Elasticsearch. An index is
a logical namespace which points to primary and replica shards. Each document is stored
in a single primary shard. When a document is being indexed, it is indexed first on the
primary shard, then on all replicas of the primary shard. A replica is a copy of the primary
shard, used to increase failover and performance [52].
4.2.3.3 Kibana
The Kibana configuration file “kibana.yml” is in the “/etc/kibana” folder. This configuration
file specifies the IP address and port that should host the Kibana service, by default 5601.
The server name of the Kibana server can be manually configured. Kibana is configured
to send all queries to the Elasticsearch server. Kibana use the index “.kibana” by default
to store saved searches, visualizations and dashboards in Elasticsearch. Now kibana is
available through a web interface. The next step is to verify that it is connected to
Elasticsearch and configure “filebeat-*” to be the default index. Figure 51 shows that the
ELK stack is successfully configured, and that kibana can analyse the elasticsearch data.
Page 65
Henrik Waagsnes SCADA Intrusion Detection System Test Framework
65
Figure 51:ELK stack successfully configured
The next step is to create custom data visualizations and dashboards. Kibana includes
ten visualization types which make it possible to visualize data. In addition is it possible to
install or develop custom visualization types. Figure 52 shows a pie visualization of the
protocols used in network traffic the past four hours.
Figure 52: Pie chart visualization in kibana
4.2.3.4 X-pack
The x-pack extension of the ELK stack was installed by adding a plugin to Elasticsearch,
Logstash and Kibana. To gain access to a "basic" x-pack license, I registered on Elastic's
webpage and received a license file on email. Then I loaded the license into elasticsearch,
using a -XPUT command. The licence is valid for one year. The monitoring features
available in x-pack monitors the performance of Elasticsearch, Kibana, and Logstash. The
solution contains a collection of dashboards used to assess the status at various levels,
by providing information needed to keep the ELK stack optimized. The dashboard in figure
53 gives and overview of the current health metrics and performance. The dashboard
informs that Elasticsearch has been up and running on hour, and has three nodes
Page 66
Henrik Waagsnes SCADA Intrusion Detection System Test Framework
66
connected to the cluster. The dashboard also provides information of how many request
Kibana receives and the amount of data received and sent by logstash.
Figure 53: Monitoring dashboard provided by x-pack
Figure 54 shows a more advanced monitoring dashboard. This dashboard monitors the
performance of the latest elasticsearch instance. It includes graphs that monitor the
performance in real time and with a historical perspective. This dashboard contains
information about indexing, search rate, documents and much more. It also gives an
overview of what is stored on the Elasticsearch nodes. The figure below shows that all
primary share is stored in node-1, while all replica share is stored in node-2.
Figure 54: Elasticsearch monitoring using x-pack
Page 67
Henrik Waagsnes SCADA Intrusion Detection System Test Framework
67
By purchasing a license, several other functionalities can be unlocked. Currently, security,
graphical visualization, alerting and reporting functionality is offered. Elastic plans to offer
a machine learning functionality as well [53].
Figure 55: Functionality available in x-pack [53]
The security functionality secures the cluster by providing authentication between nodes
in a cluster, and requires authentication to access Elasticsearch or Kibana. This feature
can be integrated with existing LDAP, Active Directory or Certificate services [53].
The alerting functionality can be used to warn about CPU usage, file changes and more.
The reporting functionality can be used to generate PDF reports with Kibana visualizations
and automatically share the reports with for example system administrators and customers
[53].
The graph functionality provides the possibility to visualize relationships between data. The
machine learning functionality is still under development. In theory, this functionality should
be able to detect malicious traffic by analyzing the network traffic and comparing it with
previous data [53].
Most of the additional features available in x-pack cost money. There are several other
options for implementing for example, authentication and graph visualization. The big
advantage of using x-pack is that it is developed by Elastic to work integrated with the ELK
stack.
4.2.4 Dashboards
Several custom visualization dashboards were created during the master thesis. In total
six dashboards was developed for different purposes. The first dashboard is a visualization
of the traffic flow data generated by Suricata. Two separate dashboards were created to
analyse the alert data from Suricata and Snort, respectively. A dashboard was developed
to compare alert data generated from the two IDS implementations. An experimental
dashboard was created to visualize relationships between data. The last dashboard was
created to analyze the additional latency added by Logstash processing.
The time frame for each dashboard can easily be changed by adjusting a parameter at the
top right. The time frame can be anything from the past 15 minutes to the past 5 years.
Page 68
Henrik Waagsnes SCADA Intrusion Detection System Test Framework
68
4.2.4.1 Network traffic monitoring
The network traffic dashboard shown in figure 56 analyses the network traffic in real-time.
The left side uses the geographical data added by Logstash. The dashboard displays pie
chart visualizations of the top 10 countries and cities generation traffic, and plots the
geographical location into a map. The right side analyze the actual traffic and visualizes
the destination IP addresses, source IP addresses, source port, destination port,
underlying protocols and TCP states.
Figure 56: Network traffic monitoring dashboard
4.2.4.2 IDS alert monitoring
The IDS alert dashboard in figure 57 analyses the alerts generated by the Suricata engine.
It provides a histogram that counts the unique events at any given time. The dashboard
also provides a metric count of alerts with various severity levels. If the count reaches a
specified limit the metric changes color from green to yellow or red. The geographical
location of any source address triggering an alert, is plotted in a map. Pie charts are used
to visualize relevant data, and a table is used to count the unique signatures triggered.
Page 69
Henrik Waagsnes SCADA Intrusion Detection System Test Framework
69
Figure 57: IDS alert monitoring dashboard
4.2.4.3 IDS comparison
The IDS compassion dashboard in figure 58 is used to compare Suricata’s and Snort’s
ability to detect attacks. Suricata is monitored on the left side and Snort is monitored on
the right side. The dashboard contains metric visualizations to count unique signatures
and the total number of alerts triggered by Suricata and Snort, respectively. The size of
the IDS name text in the middle is automatically adjusted by alerts triggered. At the end of
the dashboard is a table that list every triggered alert and counts every occurrence.
Figure 58: IDS comparison dashboard
Page 70
Henrik Waagsnes SCADA Intrusion Detection System Test Framework
70
4.2.4.4 Experimental
The experimental dashboard implemented in this framework, is a network graph that can
be used to visualize the relations between data. Figure 59 shows an example where the
dashboard is used to analyze the flow data generated by Suricata, and visualize the
relation between the top 5 countries generating traffic and the destination IP addresses.
Figure 59: Experimental dashboard
4.2.4.5 Latency
The last dashboard implemented in this framework, is used to visualize the additional
latency added by Logstash processing. The IDS add a timestamp field to the eve.json file
when it detects malicious traffic. Logstash also adds a timestamp field when the data is
processed and shipped to Elasticsearch. These timestamp fields can be used to find
latency by calculating the deviation. This is done by using a Kibana functionality called
scripted fields. Scripted fields can be used to perform calculations on the fly, by analyzing
the incoming Elasticsearch data.
Figure 60 show how the two timestamp fields can be used to calculate the latency added
by Logstash. The format used to display latency shows the time in minutes, seconds and
milliseconds.
Figure 60: Calculating latency
Page 71
Henrik Waagsnes SCADA Intrusion Detection System Test Framework
71
The implemented dashboard in figure 61, compares latency for Suricata and Snort alerts.
The dashboards display the maximum and minimum latency experienced by Suricata and
Snort. The dashboard plots the average latency in a line chart every second and calculates
max, min, average, median and standard deviation (upper/lower) on the fly. The dashboard
also visualize the latency in a pie chart.
Figure 61: Latency Dashboard
4.2.5 Automation
To achieve automation in the framework, system daemons, bash scripts and time
synchronization are used. Automation means that all necessary components are started
automatically at startup and have the same time settings.
4.2.5.1 System daemons
The fundamental purpose of a system daemon is to initialize the components that must be
started after the Linux kernel is booted. The Elastic software provides system daemons by
default. Some of the implemented tools in the framework do not provide system daemons
by default. Therefore, I had to create my own system daemon for the following tools;
Suricata, Snot, py-idstools:u2eve, Conpot. The daemons is by default localized in either
“/lib/systemd/system” or “/etc/systemd/system”. Figure 62 shows the system daemon
created for Snort. The [Unit] fields used for defining metadata for the unit and configuring
the relationship of the unit to other. The [Service] fields specifies the command used to run
snort on interface eth0. The [Install] fields is optional and is used to define the behavior
or a unit if it is enabled or disabled [54].
Page 72
Henrik Waagsnes SCADA Intrusion Detection System Test Framework
72
Figure 62: Snort IDS SystemD
The system deamon can be enabled on boot. The following command shows how to
enable the Snort system daemond on boot; systemctl enable snort.service
On machines running Windows can automation be achived by running the shell:startup
command and copy shortcuts to software in the startup folder.
4.2.5.2 Log rotation and index cleaning
In some cases, I discovered that IDS implementations became less effective when the size
of the log file become too large. This was especially noticed in The Snort implementation
where a conversion tool is used to convert from unified2 to eve json format. The solution
to this is to archive the existing log file in an archive and clear the log file.
To achieve this I have written a BASH script scheduled to execute once a day. Another
option could be to use the tool Logrotate. Initially the script was programmed to clean the
log file while the snort process still runs. This turned out to be more difficult than initially
assumed. I used the truncate command to clear the file, but the Snort process then
continues write entries to the log file at whichever offset it was at last. The BASH script or
Logrotate approach truncates the file to size is zero. When the snort process writes to the
file again, it continues at the offset it was left of. The result is a log file with the same size
or even larger size than before [55].
The solution this this problem is either to restart the snort process or use some kind of a
middleware pipelining tool. Figure 63 shows the BASH script implemented in this
framework. One drawback with this approach is that the IDS will be unavailable for about
one second. Figure 64 shows the output of the BASH script when it is executed manually.
A similar BASH script was implemented on the Suricata implementation.
Page 73
Henrik Waagsnes SCADA Intrusion Detection System Test Framework
73
Figure 63: BASH script used to archive and clear the snort log
Figure 64: Output of BASH script
To make this approach automatic, the system daemon called crontab is used to execute
the BASH script periodically at scheduled timing. Crontab can configured by running the
command “crontab -e”. Then a line must be added referring the script that should be
executed and the timing interval. The BASH script above was configured to run at five
o'clock every afternoon, by adding the line “0 17 * * * /scripts/rotatelog.sh”. To minimize
the risk that the IDS implementation is unavailable for about a second. The Suricata and
Snort BASH script are scheduled to run at different times. This approach ensures that at
least one of the IDS implementation is available at any time.
I also created a BASH script that removes all filebeat and monitoring indexes older than
thirty days from the Elasticsearch cluster. This script is executed daily using crontab.
Page 74
Henrik Waagsnes SCADA Intrusion Detection System Test Framework
74
4.2.5.3 Time synchronization
It is important that the time settings on IDS and SIEM solutions is correct, so that the
detected attacks can be linked to a given point of time. This framework use the Network
Time Protocol (NTP) to achieve time synchronization in the management network. A NTP
client is installed on the IDS and SIEM machines, and configured to with default settings
(approved by Ubuntu) [56]. The NTP clients retrieve time information from publicly
available NTP Servers over the Internet. Another option is to host a local NTP server, and
connect the clients to this server. If the framework was connected to a production network,
the second option would be preferable. The NTP client can be configured by editing
“/etc/ntp.conf”.
Page 75
Henrik Waagsnes SCADA Intrusion Detection System Test Framework
75
5 Experiments and Results
This chapter discusses experiments performed in the context of validation and testing of
the implemented framework. The results of the experiments will also be presented in this
chapter.
5.1 IEC 60870-5-104 client/server communication
The main goal of carrying out these experiments, is to trigger the alerts specified in the
implemented IEC 60870-5-104 rule-set, developed by researchers at the Queen’s
University Belfast [30]. This is done by generating realistic IEC 60870-5-104 traffic in the
lab network and perform attacks and Illegal actions. The alerts triggered by Suricata and
Snort are compared by log analysis and real-time visualization. The signatures included in
the rule set can be categorized into three categories; signature-based rules, protocol
based rules and traffic-pattern-based rules.
5.1.1 Normal communication
These experiments simulate normal traffic patterns between authorized IEC 60870-5-104
clients and servers. The parameters in table 9 defines the authorized client IP addresses,
server IP addresses and port numbers, set in Suricata and Snort configuration files.
The experiment is performed by starting the IEC Server software on a virtual machine with
IP address 10.0.0.75, listening on port number 2404. QTester104 is used as a IEC client
on a virtual machine with IP address 10.0.0.66. Wireshark is used to validate that IEC
60870-5-104 traffic are traversing the lab network.
Figure 65: Wireshark analysis of normal IEC 60870-5-104 traffic
Since Suricata is configured to log all data traffic, Kibana can be used to analyse normal
traffic as well. No alerts are triggered either by Suricata or Snort during this experiment.
104_CLIENT 10.0.0.66
104_SERVER 10.0.0.75
104_PORTS 2404
Table 9: IEC 60870-5-104 variables set in configuration files (normal communication)
Page 76
Henrik Waagsnes SCADA Intrusion Detection System Test Framework
76
5.1.2 Signature-based rules
This experiment uses different methods to simulate illegal SCADA operations. These
methods should trigger the signature-based rules.
5.1.2.1 Non-IEC/104 communication on an IEC/104 port
The tool packet sender was used to establish non-IEC104 communication on port 2404.
The server side was configured to listen on TCP port 2404 And the client side was
configured to connect the server on port 2404.
Figure 66: Packet Sender client side
Figure 67: Packet Sender server side
The signature with ID 6666601 was triggered only by Snort during this experiment.
Suricata did not trigger any alerts. By analyzing Suricata in debugging mode, I discovered
that there was a compatibility issue with this signature in Suricata. The error message
contains the following message; pcre with /R (relative) needs preceeding match in the
same buffer. This issue can be resolved by removing the “R” from the regular expression.
Both Suricata and Snort triggered alerts after this modification.
5.1.2.2 Spontaneous messages storm
This experiment simulates a spontaneous messages storm, by sending a single point
information (M_SP_NA_1) message with COT value equal 3 (spontaneous), from the IEC
Server to Qtester104. The IEC Server is configured to send ON/OFF (1/0) values every
second.
Page 77
Henrik Waagsnes SCADA Intrusion Detection System Test Framework
77
Figure 68: Configured IEC Server to send single point information (M_SP_NA_1) messages every second
The signature with ID 6666602 was triggered only by Snort during this experiment.
Suricata did not trigger any alerts. By analyzing Suricata in debugging mode, I discovered
that this signature had the same compatibility issue as the signature described above. This
issue was solved the same way, by removing the “R” from the regular expression. Both
Suricata and Snort triggered the same number of alerts after this modification.
5.1.2.3 Unauthorized read command to an IEC/104 Server
This experiment simulates a read command send by an unauthorized client to the IEC
server on port 2404. This is simulated by editing the 104_CLIENT variable in the IDS
configuration files to another IP address than the one used. Qtester104 does not support
read command (C_RD_NA_1) messages. For this reason, The OpenMUC j60870 client is
used for sending a read command (C_RD_NA_1) message to the IEC Server.
Figure 69: Sending read command (C_RD_NA_1) message from OpenMUC j60870 client
Both Suricata and Snort could detect this illegal operation
5.1.2.4 Unauthorized interrogation command to an IEC/104 server
This experiment simulates a interrogation command send by an unauthorized client to the
IEC server on port 2404. This experiment used the same configuration as in chapter
5.1.2.3. The OpenMUC j60870 client script is used for sending a interrogation command
(C_IC_NA_1) message to the IEC Server.
Figure 70: Sending interrogation command (C_IC_NA_1) message from OpenMUC j60870 client
Both Suricata and Snort could detect this illegal operation.
Page 78
Henrik Waagsnes SCADA Intrusion Detection System Test Framework
78
5.1.2.5 Unauthorized counter interrogation command to an IEC/104 Server
This experiment simulates a counter interrogation command send by an unauthorized
client to the IEC server on port 2404. This experiment used the same configuration as in
chapter 5.1.2.3. The OpenMUC j60870 client script is used for sending a counter
interrogation command (C_CI_NA_1) message to the IEC Server.
Figure 71: Sending counter interrogation command (C_CI_NA_1) message from OpenMUC j60870 client
Both Suricata and Snort could detect this illegal operation
5.1.2.6 Remote command from unauthorized 104 client
This experiment simulates a remote control or remote adjustment command sent by a
unauthorized client to the IEC server on port 2404. This is simulated using the same
configuration as above. Then Qtester104 is used to send a single command (C_SC_NA_1)
message to the IEC Server.
Figure 72: Sending a single command (C_SC_NA_1) message from an unauthorized client
Both Suricata and Snort could detect this illegal operation.
5.1.2.7 Set point command from an unauthorized IEC/104 client
This experiment simulates a set point command sent by an unauthorized client to the IEC
server on port 2404. This is simulated using the same configuration as above. Qtester104
are used to send a “set point command, normalized value” (C_SE_NA_1) message to the
IEC Server.
Figure 73: Sending a “set point command, normalized value” (C_SE_NA_1) message from an unauthorized client
Both Suricata and Snort could detect this illegal operation.
5.1.2.8 Reset process command from unauthorized client
This experiment simulates a reset process command send by an unauthorized client to the
IEC server on port 2404. The experiment used the same configuration as in chapter
5.1.2.3. The OpenMUC j60870 client script is used for sending a reset process command
(C_RP_NA_1) message to the IEC Server.
Page 79
Henrik Waagsnes SCADA Intrusion Detection System Test Framework
79
Figure 74: Sending reset process command (C_RP_NA_1) message from OpenMUC j60870 client
Both Suricata and Snort could detect this illegal operation.
5.1.2.9 Broadcast request from unauthorized client
This experiment simulates a broadcast request sent by an unauthorized client to the IEC
server on port 2404. I changed the originator address to 255 in the qtester104.ini
configuration file. Then I used Qtester104 to connect to the IEC server.
Figure 75: Broadcast request from an unauthorized client
Both Suricata and Snort could detect this illegal operation.
5.1.2.10 Potential Butter Overflow
The signature 6666610 include a keyword to detect abnormal payload sized of TCP
packets. The rule is originally written to alert on packet with payload larger than 2048 bytes.
To simulate a how the IDS can detect a buffer overflow attack, I temporary changed this
value to 1 byte. Then I started QTester104 and IEC Server to generate traffic.
No alerts were initially triggered either for Snort or Suricata. I therefore looked an extra
time on the signature and found a typo in the original rule. The filed sid referred to
66666010, while sid field in the sid-msg.map file referred to 6666610 (a zero too much). I
therefore corrected this typo and conducted the experiment again. This time the signature
was triggered for both Snort and Suricata.
5.1.2.11 Results
Table 10 shows the results of the experiments conducted in chapter 5.1.2. Both Suricata
and Snort detected all malicious traffic generated and triggered alerts based on the
signature-based rules. The results show that both IDS implementations could detect
approximately the same number of events. Suricata is compatible with signatures written
in snort lightweight rules description language. I did however, discovered some
compatibility issues. The most significant error, contains the following message; pcre with
/R (relative) needs preceeding match in the same buffer. The /R refers to a previous match,
but there is no buffer keeping track of previous matches. This was the case for two of the
signatures in this rule set, sid: 6666601 and sid: 6666602. This issue could be resolved by
removing the “R” from the regular expression.
Page 80
Henrik Waagsnes SCADA Intrusion Detection System Test Framework
80
Table 10: Signature-based rules triggered by various methods
5.1.3 Protocol-based rules
This experiment monitors the IEC 60870-5-104 communication between a client and a
server, and injects packet into the network. The main goal of this experiment is to trigger
the protocol-based rules.
5.1.3.1 Man-in-the-middle packet injection
The tool Ettercap is used to perform a man-in-the-middle (MITM) attack between the IEC
104 client and server, by taking advantage of a vulnerability in the ARP protocol. The
Address Resolution Protocol (ARP) is a protocol used for resolution between IP addresses
and link layer addresses. Hosts and network devices keeps track of IP addresses and
associated MAC address in a ARP table stored in memory. The man-in-the-middle (MITM)
attack performed in this experiment is done by sending fake ARP messages and forward
response messages to the actual destination. A MITM attack allows the attacker to monitor
and modify traffic between hosts.
IP addresses are used in the network layer (layer 3) while MAC addresses are used in the
link layer (layer 2). The optimal method for preventing man-in-the-middle attacks based on
ARP poisoning is to implement security features at the link layer (layer 2). It is however
possible to detect ARP poisoning attacks by using security features implemented at the
network layer (layer 3). Suricata does not provide any functionality to detect ARP spoofing.
Snort provides a preprocessor that can be configured to detect ARP spoofing by specifying
allowed IP/MAC address pairs. The Snort preprocessor did not seem to work as robustly
as expected [57]. Snort detected the ARP spoofing, but could not resolve the correct
source and destination address of the spoofed connection.
SCADA protocol IEC 60870-5-104
IDS Engine Suricata Snort Description
Signature ID
6666601 X (modification) X Non-IEC/104 Communication on an IEC/104 Port
6666602 X (modification) X Spontaneous Messages Storm
6666603 X X Unauthorized Read Command to an IEC/104 Server
6666604 X X Unauthorized Interrogation Command to an IEC/104
Server
6666605 X X Unauthorized Counter Interrogation Command to an
IEC/104 Server
6666606 X X Remote Control or Remote Adjustment Command from
Unauthorized 104 Client
6666607 X X Set Point Command from an Unauthorized IEC/104 Client
6666608 X X Reset Process Command from Unauthorized Client
6666609 X X Broadcast Request from Unauthorized Client
6666610 X X Potential Butter Overflow
Page 81
Henrik Waagsnes SCADA Intrusion Detection System Test Framework
81
Figure 76: Snort ARP Spoof Preprocessor
Another possibility is to use an application like xARP. xARP is a security application that
use using active and passive modules to detects intruders inside the lab network [58].
Figure 68 show that xARP could detect the performed ARP spoofing man-in-the-middle
attack.
Figure 77: Using xARP to detect ARP spoofing
During this man-in-the-middle attack, an Ettercap plugin was used to trigger the protocol-
based signatures in the IEC 60870-5-104 ruleset. This plugin is available on GitHub,
developed by PMaynard and written in C [59]. The figure 78 shows how this plugin
analyses the IEC 60870-5-104 packets, and inject data into the traffic. The left side of the
figure shows an excerpt from the C code that analyses packets. The right side of the figure
shows the output in Ettercap, when this plugin is activated during an MITM attack.
Figure 78: Ettercap-104-mitm plugin code and output
5.1.3.2 Results
Table 11 shows the results of this experiment. Both Suricata and Snort detected all
malicious traffic injected in the experiment, and triggered alerts based on the protocol-
based rules. The results show that both IDS implementations could detect approximately
the same number of events.
Page 82
Henrik Waagsnes SCADA Intrusion Detection System Test Framework
82
Table 11: Protocol-based rules triggered by Ettercap plugin
5.1.4 Traffic-pattern-based rules
This experiment uses different methods to simulate illegal SCADA traffic patterns. These
methods should trigger the traffic-pattern-based rules.
5.1.4.1 Unauthorized connection attempt from an IEC/104 server
An unauthorized connection attempt to a non-IEC/104 port of a server can be simulated
by using QTester104 to connect to IEC Server on another port. The port numbers that shall
be accepted by the IDS are configured by changing the 104_PORTS variable defined in
the IDS’s configuration. The IDS’s implemented in this experiment is configured to allow
connections on port number 2404 (default). QTester104 is in this experiment configured
to connect to the IEC Server on TCP port 3333.
Figure 79: Editing the tcp port in the QTester104 configuration file
5.1.4.2 Unauthorized connection attempt to a non-IEC/104 port of a server
An unauthorized connection attempt from an IEC/104 Server can be simulated by using a
tool like Packet Sender to connect any IP address on a non-IEC104 port. Packet Sender
are in this experiment configured to connect the client with IP address 10.0.0.66 on TCP
port 3333 [60].
SCADA protocol IEC 60870-5-104
IDS Engine Suricata Snort Description
Signature ID
6666611 X X Suspicious Value of Type Identification Field in the Control
Direction with I Format
6666612 X X Suspicious Value of Type Identification Field in the Monitor
Direction with I Format
6666613 X X Suspicious Value of Transmission Cause Field in I Format
APDU
6666614 X X Incorrect Length Field of the Packet with S Format
6666615 X X Incorrect Length Field of the Packet with U Format
6666616 X X Incorrect Length Field of the Packet with I Format
6666617 X X Suspicious Value of Transmission Cause Field
6666618 X X Suspicious Value of Transmission Cause Field
6666619 X X Suspicious Value of Transmission Cause Field
6666620 X X Suspicious Value of Transmission Cause Field
6666621 X X Suspicious Value of Transmission Cause Field
Page 83
Henrik Waagsnes SCADA Intrusion Detection System Test Framework
83
Figure 80: Using Packet Sender to connect a Client on a non-IEC104 port
5.1.4.3 Unauthorized traffic between IEC/104 server and client
Unauthorized IEC 60870-5-104 traffic between server and client can be simulated by
connecting an unauthorized client to the IEC server. Authorized clients are in this
experiment configured by filling in allowed IP addresses in the IEC_CLIENT variable the
IDS configuration files. Then QTester104 is used to connect to the IEC server, using an
unauthorized client IP address.
5.1.4.4 Results
All the methods in this experiment successfully triggered the intended traffic-pattern-based
rules. Both Suricata and Snort trigged exactly the same number of alerts during the
experimentation period.
Table 12: Traffic-pattern-based rules triggered by various methods
5.2 DNP3 communication
The goal of carrying out these experiments, is to trigger the alerts specified in the
implemented DNP3 rule-set, developed by Digital Bond [29].
5.2.1 Captured DNP3 traffic
In this experiment Bittwist is used to regenerate DNP3 traffic from the pcap file provided
by Digital Bound. Bittwist regenerate the traffic on the eth0 interface of both IDS
implementations. This experiment consists for two parts. First Bittwist was used to
regenerate the traffic onto interface eth0 in normal mode. The second part floods the IDS,
by regenerating 36200 packets within 3 seconds. The commands below configures Bittwist
to send all packet immediately and loop the pcap file 200 times.
SCADA protocol IEC 60870-5-104
IDS Engine Suricata Snort Description
Signature ID
6666622 X X Unauthorized Connection Attempt from an IEC/104 Server
6666623 X X Unauthorized Connection Attempt to a non-IEC/104 Port
of a Server
6666624 X X Unauthorized Traffic Between IEC/104 Server and Client
Page 84
Henrik Waagsnes SCADA Intrusion Detection System Test Framework
84
This experiment was executed two times. The first using authorized clients and then with
unauthorized clients.
5.2.2 Results
Table 14 shows the results of the experiments conducted in chapter 5.2.1. Both Suricata
and Snort detected the malicious traffic regenerated by bittwist, and triggered 13 of 14
signatures. The two IDS implementations detect approximately the same number of
events. I did experience same incompatibility error for signature 1111202 as in chapter
5.1.2. This issue could be resolved by removing the “R” from the regular expression. The
experiment did however fail to trigger the Points List Scan alert, because this command is
not included in the pcap file.
Table 14: DNP3 rules triggered by pcap regeneration
SCADA protocol DNP3
IDS Engine Suricata Snort Description
Signature ID
1111201 X X Disable Unsolicited Responses
1111202 X (modification) X Non-DNP3 Communication on a DNP3 Port
1111203 X X Unsolicited Response Storm
1111204 X X Cold Restart From Authorized Client
1111205 X X Cold Restart From Unauthorized Client
1111206 X X Unauthorized Read Request to a PLC
1111207 X X Unauthorized Write Request to a PLC
1111208 X X Unauthorized Miscellaneous Request to a PLC
1111209 X X Stop Application
1111210 X X Warm Restart
1111211 X X Broadcast Request from Authorized Client
1111212 X X Broadcast Request from Unauthorized Client
1111213 Points List Scan
1111214 X X Function Code Scan
bittwist -i eth0 /etc/suricata/test-files/dnp3_test_data_part1.pcap
bittwist -i eth0 /etc/snort/test-files/dnp3_test_data_part1.pcap -m 0 -l 200
Table 13: Regeneration DNP3 pcap-files using Bittwist
Page 85
Henrik Waagsnes SCADA Intrusion Detection System Test Framework
85
5.3 Modbus communication
The goal of carrying out these experiments, is to trigger the alerts specified in the
implemented Modbus rule-set, developed by Digital Bond [29].
5.3.1 Captured Modbus traffic
In this experiment Bittwist is used to regenerate Modbus traffic from the pcap file provided
by Digital Bound. Bittwist regenerates the traffic on the eth0 interface of both IDS
implementations. This experiment consists for two parts. First Bittwist was used to
regenerate the traffic onto interface eth0 in normal mode. The second part floods the IDS,
by regenerating 23600 packets within 1 second. The commands below configure bittwist
to send all packet immediately and loop the pcap file 200 times.
This experiment was executed two times. The first using authorized clients and then with
unauthorized clients. This pcap experiment triggered the first twelve signatures (1111001-
1111012).
5.3.2 Reconnaissance on the Simens SIMATIC S7-200 PCL
A Python tool called plcscan is used in this experiment to scan for modbus devices [61].
The tool found a lot of information about the PLC. By using this tool, we can find out that
the device is a Simens SIMATIC S7-200 PCL with serial number 88111222.
Figure 81: Using plcscan to scan for modbus devices
Both Suricata and Snort triggered the signature 1111004, alerting that somebody is
reading device identification.
5.3.3 Unauthorized read and write requests to PLC
The metasploit module “auxiliary/scanner/scada/modbusdetect” is use in this experiment
to send read and write requests to the PLC. Before this experiments starts, the client and
server variables are changed. The IP address of the attacker is now not included in the list
of allowed client IP addresses. This experiment consists of two parts. The first part sends
a read request to the PCL. The second sends a write request to the PLC.
bittwist -i eth0 /etc/suricata/test-files/modbus_test_data_part1.pcap
bittwist -i eth0 /etc/snort/test-files/modbus_test_data_part1.pcap -m 0 -l 200
Table 15: Regeneration modbus pcap-files using Bittwist
Page 86
Henrik Waagsnes SCADA Intrusion Detection System Test Framework
86
Figure 82: Using metasploit to send read request to PLC
Figure 83: Using metasploit to send write request to PLC
These to exploits triggered the two signatures 1111006 and 1111007, alerting that a
read/write request was sent to the PLC.
5.3.4 Non-Modbus communication on TCP port 502
In this experiment, I use NMAP to performed reconnaissance in the SCADA system. By
using NMAP in version detection (sV) mode I scan for all information about a specific
service running on an open port, including the product names and version numbers.
Figure 84: NMAP scanning in version detection mode
This NMAP scan generates non-modbus communication on TCP port 502. Both Suricata
and Snort triggers the signature 1111009.
5.3.5 Points list scan and function code scan
In this experiment, I use a Modbus penetration testing framework called SMOD. By using
the “modbus/scanner/getfunc” module I can perform a points list scan and a function code
scan.
Page 87
Henrik Waagsnes SCADA Intrusion Detection System Test Framework
87
Figure 85:Using SMOD to perform points list and function code scan
Both Suricata and Snort trigger the last two signatures in the Modbus rules rule-set
(1111013 and 1111014).
5.3.6 Results
Table 16 shows the results of the experiments conducted in chapter 5.3.1 - 5.3.2. Both
Suricata and Snort detected all the malicious traffic regenerated by bittwist, and triggered
the signatures 1111001 to 1111012. I was also able to trigger the two reminding
signatures, by using the getfunction module in the SMOD framework. The two IDS
implementations detect approximately the same number of events.
Table 16: Modbus rules triggered by pcap regeneration
SCADA protocol Modbus
IDS Engine Suricata Snort Description
Signature ID
1111001 X X Force Listen Only Mode
1111002 X X Restart Communications Option
1111003 X X Clear Counters and Diagnostic Registers
1111004 X X Read Device Identification
1111005 X X Report Server Information
1111006 X X Unauthorized Read Request to a PLC
1111007 X X Unauthorized Write Request to a PLC
1111008 X X Illegal Packet Size, Possible DOS Attack
1111009 X X Non-Modbus Communication on TCP Port 502
1111010 X X Slave Device Busy Exception Code Delay
1111011 X X Acknowledge Exception Code Delay
1111012 X X Incorrect Packet Length, Possible DOS Attack
1111013 X X Points List Scan
1111014 X X Function Code Scan
Page 88
Henrik Waagsnes SCADA Intrusion Detection System Test Framework
88
5.4 Other experiments
This chapter contains a collection of other experiments relevant to SCADA systems.
5.4.1 Remote access to RTU
Many RTU vendors provide remote access to the RTU via Telnet or web browser, when
connected to an Ethernet LAN. The major weakness of Telnet is that all communications
are sent in plain text. This is a vulnerability that hackers could abuse to get unauthorized
access to the RTU. In this experiment, I use two different approaches to get unauthorized
access to the RTU. The first approach I use Ettercap perform a man-in-the-middle (MITM)
attack, and use dsniff to gather the username and password. The second approach is
simply a brute force attack against the Telnet server.
5.4.1.1 Man-in-the-middle sniffing
In this experiment, I used the same man-in-the-middle attack as in chapter 5.1.3.1. In
addition, I used dsniff to gather the username and password used in a Telnet connection.
To form a Telnet connection, I used PuTTy to connect to the Telnet server.
Figure 86: Using PuTTy to connect via Telnet
Figure 87: Using dsniff to sniff username and password used in Telnet connection
By analyzing the Telnet traffic was this method able to sniff the username (henrik) and the
password (toor).
5.4.1.2 Brute force
In this experiment, I perform a brute force attack using ncrack. The attack was targeting
one user (henrik), by trying every password in the password file (pwd). By define a timing
parameter (-T 5) each attempt is performed “instantly”, with no delay. Finally, the target
destination IP address (10.0.0.88) and port number (23) is specified.
Figure 88: Using ncrack to brute force telnet passwords
Ncrack was able to crack the Telnet password by checking every password in the list.
Page 89
Henrik Waagsnes SCADA Intrusion Detection System Test Framework
89
5.4.1.3 Results
Both Suricata and Snort include signatures that can detect illegal Telnet traffic. These
signatures are writen to detect Telnet communication from external networks, which
means mean that the two Telnet attacks above cannot be detected by these signatures.
The traffic monitor dashboard included in the SCADA Intrusion Detection System Test
Framework can be used to visualize the network traffic. The dashboard shows that almost
80% of the traffic is Telnet traffic. This could indicate that a brute force attack is going on.
Figure 89: Traffic monitor dashboard
5.4.2 Denial-of-service
A denial-of-service (DoS) or distributed denial-of-service (DDoS) attack is when a hacker
attempt to make a machine/server unavailable to its intended users. The main idea is to
overload the system, until its forced to shut down. There are many different denial-of-
service attacks and tools [26].
5.4.2.1 SYN flood
In this experiment, I use hping3 to perform a SYN flood attack. The attack generates
multiple SYN at the target machine. All the packages generated had a random source IP
address. The attacker will not send back ACK message, when the it receives a SYN/ACK.
This way target will continue to retransmit the packet [26].
Figure 90: Using hping3 to perform SYN flood attack
The figure below shows the network usage at the target before and during the attack. The
upper graph in the figure below shows normal traffic conditions. The next graph show how
the network traffic increases during the attack. This traffic originates from only one host
Page 90
Henrik Waagsnes SCADA Intrusion Detection System Test Framework
90
(DoS). In a case where multiple hosts are attacking (DDoS), the target would be
overloaded. This is difficult to simulate in a virtual environment with limited resources [26].
Figure 91: Network monitoring on target
5.4.2.2 Results
Most of today’s IDS solutions are best suited for signature-based application layer (layer
5) intrusion detection. Since DDoS attacks are classified as abnormal activity at layers 3
and 4, current IDS technologies are not optimized for DDoS detection [26].
This framework utilizes a rule-set that alerts and classifies network traffic that includes IP
addresses from the Spamhaus DROP list [62]. The Spamhaus DROP is an advisory "drop
all traffic" list, consisting of networks that are "hijacked" or leased by professional spam or
cyber-crime operations [62]. This rule-set is compatible with both Snort and Suricata. By
using this rule-set, an attack launched from a network on the Spamhaus DROP list would
be easily detected.
Another way to detect a possible DDoS attack could be by looking at the map in the traffic
monitoring dashboard. This map plots the geographical location of where each traffic flow
is originating from. If it suddenly comes traffic from an area in the world where there usually
not is traffic, it might indicate malicious traffic.
5.4.3 Latency
The two different IDS implementations in the SCADA Intrusion Detection System Test
Framework detects malicious traffic, and use Filebeat to transmit the log entries to
Logstash. Logstash analyses, modifies and ships the data to a Elasticsearch cluster. The
time it takes from malicious traffic is detected by an IDS until the event is indexed and
stored in the cluster can be regarded as latency.
This experiment uses latency dashboards implemented in framework two to analyse the
additional latency added by Logstash. The monitoring feature included in X-pack is also
used to analyse performance. The experiment consists of two parts. First, normal amounts
of data are sent through the network. Then the network is flooded with large amounts of
data.
Page 91
Henrik Waagsnes SCADA Intrusion Detection System Test Framework
91
5.4.3.1 Normal traffic flow
Normal amounts of network traffic are generated using the same methods as in chapter
5.1.1, 5.2.1 and 5.3.1. Normal amounts of IEC 60870-5-104 traffic are sent between client
and server, using the QTester104 and IEC Server tools. Modbus and DNP3 traffic are
generated using the Bittwist utility.
5.4.3.2 Flooded traffic
The capacity of the framework can be tested by flooding the network with large amounts
of traffic. Two different methods are used to perform network flooding in this experiment.
The first method uses the same approach as chapter 5.2.1 and 5.3.1. Where the tool
Bittwist regenerates pcap traffic in flood mode. The other method uses the hping3 utility to
perform a denial-of-service attack as instructed in chapter 5.4.2. These experiments
generate large amounts of data and challenge the performance of the framework.
5.4.3.3 Results
The first experiment lasted ten minutes and triggered approximately 200 alerts for both
Suricata and Snort during normal conditions. The boxplot in figure 92 shows an ensemble
of ten latency measurements to get a representative picture of the variance of the test
data. The figure show a comparison of Suricata and Snort under normal conditions. The
thin line describes the highest and lowest latency measured for both IDS solutions. Values
that are higher than 3/2 of the edges are not included in the figure. The box represents the
upper and lower quartile in statistics lingo of the latency and the yellow line in the middle
represent the median. Out of the figure it appears Snort generally has higher latency a
Suricata. The highest value for Snort is 17.5 seconds. The highest value for Suricata was
11 seconds. The upper and lower quartile of Snort latency is higher and takes a larger
span than Suricata. Both solutions have a bit skewed distribution compared to a normal
distribution.
Figure 92: Boxplot comparison of latency in Suricata and Snort under normal traffic
Page 92
Henrik Waagsnes SCADA Intrusion Detection System Test Framework
92
The difference was even greater under abnormal conditions. Suricata generally have lower
latency than Snort. The reason why Snort generally has higher latency in all the
experiment, is most likely the additional processing time applied by the unified2 to eve.json
conversion. I also carried out an extreme experiment where I flooded the IDS solutions
with huge amount of traffic. The traffic triggered up to million alerts in a matter of minutes.
It appears that both IDS solutions are vulnerable to denial-of-service (DoS) attacks by
causing many alerts. Although It appears to be somewhat easier to cause a DoS attack on
the Snort IDS compared to Suricata. Snort stopped sending data to Logstash after about
half a million events, and the u2eve process stopped when the eve.json file exceeds
approximately 350 MB.
Page 93
Henrik Waagsnes SCADA Intrusion Detection System Test Framework
93
6 Discussion
During this master thesis, I have implemented and demonstrated a SCADA Intrusion
Detection System Test Framework. The framework consists of four parts; attacker side,
SCADA target side, IDS side and SIEM side. The attacker side consists mainly of a Kali
Linux installation. There are several alternative solutions that can be used as attack
platform, for example BackBox Linux. My personal experience is that Kali Linux has more
available penetration testing tools.
The SCADA side of the framework consists of four machines, where three machines
simulate real-time IEC 60870-5-104 traffic, and one machine simulates a Siemens
SIMATIC S7 -200 PLC. The attacker side and SCADA side is connected to the same
internal network, and used to perform experiments. The IEC Server software is used to
simulate the server side of IEC 60870-5-104 communication. IEC Server can be configured
to send data at specified time intervals and return configured response messages when
receiving certain message types. The client side of IEC 60870-5-104 communication is
stimulated by QTester104 and OpenMUC j60870. These two programs can poll
information and send control commands to the server. The main reason that I chose these
programs to simulate the communication is the ability of graphical interfaces and the ability
to automatically generate traffic. One disadvantage of QTester104 is that not all IEC
60870-5-104 message types are supported. Therefore, I have also used the OpenMUC
j60870 library to simulate the client side in some of the experiments.
Both Suricata and Snort have been implemented on the IDS side to compare the two
solutions. The biggest difference between Suricata and Snort is that Suricata is multi-
threaded and Snort is single-threaded. Suricata has in my eyes a more modern interface
and configuration format. It is compatible with signatures written in Snort’s lightweight rules
description language, and supports snort VRT and emerging threats rules-sets. To get
both IDS solutions to use the same logging format, I applied a unified2 to eve.json
conversion tool. Due the additional processing time applied by the unified2 to eve.json
conversion, Snort generally has higher latency that Suricata.
On the SIEM side, the ELK stack (Elasticsearch, Logstash and Kibana) is used to collect,
store, analyse and visualize flow data and alert data. Filebeat is used to transfer event
data from Suricata IDS and Snort IDS to a centralized Logstash server. Logstash filters
the data and ships them to a distributed Elasticsearch cluster. Kibana is connected to the
Elasticsearch cluster and provides a web interfaces for data analysis and visualisation. An
advantage of using the ELK stack is that it is open source and that there is no limitation on
the amount of data that can analysed or visualized. The company that have developed the
software used the ELK stack, are continuously launching new updates and patches to
improve their systems. The company also has a philosophy of launching updates for their
different programs simultaneously, so that they operate with the same version number.
Page 94
Henrik Waagsnes SCADA Intrusion Detection System Test Framework
94
The framework is very scalable. The IDS side can easily be extended with multiple IDS
solutions by adding new machines to the framework. Logstash has already been
configured to categorize events generated by Bro IDS. This configuration can easily be
extended to categorize all kinds IDS solutions. It is even possible to configure Logstash to
send emails to a network administrators, when certain event occurs. Logstash is
horizontally scalable and can form groups of nodes running the same pipeline. Adaptive
buffering capabilities provides smooth streaming even through variable throughput loads.
If Logstash becomes a bottleneck, then it is simple to add more nodes [51]. Newer versions
of Filebeat also provides the possibility the ship the data from Beat directly to the
Elasticsearch cluster. Elastic has also developed other lightweight data shippers that can
be used to monitor networks. The framework can be extended with for example Hartbeat
and Metricbeat, which can inform about devices status and notify at certain thresholds.
Elasticsearch is horizontally scalable and can be extended with huge amounts of nodes.
The nodes in a cluster form a full mesh topology, which means that each node maintains
a connection to each of the other nodes. The cluster has a single master node which is
chosen automatically by the cluster and which can be replaced if the current master node
fails. When a document is being indexed, it is indexed first on the primary shard, then on
all replicas of the primary shard. A replica is a copy of the primary shard, used to increase
failover and performance. The number of primary and replica shards can be manually
configured to optimize implementation.
The framework can be extended with multiple Kibana instances, and be connected to the
Elasticsearch cluster. All the data about dashboards and searches is stored in the cluster.
I have created several dashboards that can be used to monitor network traffic, IDS events
and latency. The X-pack plugin is also included in the framework, and allows monitoring
of Elasticsearch, Logstash and Kibana. This monitoring feature provides several
dashboards to give an overview of the system status and in-depth performance. The
framework can be extended to encrypt all traffic between cluster nodes and other units. It
is also possible to configure authentication to access the cluster.
To achieve automation in the framework I have created system daemons, BASHs script
and connected the machines in the management network to a NTP server. This provides
automatic start up at reboot, scheduled log rotation and synchronous time settings.
I have also tested and evaluated alternative SIEM implementations. The best option was
Splunk. Both Splunk and ELK stack are good options for analysis and visualization. Both
allow the administrator to create their own custom visualizations and dashboards, as well
as applying publicly available dashboards. Like Filebeat and Logstash, Splunk Universal
Forwarder can be used to ship IDS data to a distributed cluster. A disadvantage with
Splunk is that it is a commercial product. Splunk offers a free trial license of 60 days. During
this period, they set limitations of 500 MB indexed data per day, and a limited number of
simultaneous visualization jobs. I chose to use ELK stack in this framework rather than
Splunk because Elastic software is open source and has fewer limitations than Splunk.
Page 95
Henrik Waagsnes SCADA Intrusion Detection System Test Framework
95
I have also considered other tools such as Snorby and OSSIM. None of these tools were
implemented in the framework, because I want the ability to create custom visualizations
dashboards and distribute the data. Another option is to install Linux distributions
containing all necessary tools, including IDS and SIEM. Security Onion and SELKS are
two such distributions. None of these were either implemented in the framework, because
they contain additional tools not necessary in this framework.
In this project, I have used the implemented framework to carry out several experiments.
The experiments demonstrate which attacks and types of communication that triggers
different signatures in the rules for IEC 60870-5-104 [30] and the Digital Bond Quickdraw
SCADA rules for Modbus and DNP3 [29]. The experiments are categorized in four groups;
IEC 60870-5-104, DNP3, Modbus and other experiments.
The first experiment category has been the focus of this master thesis. The category aims
at demonstrating IEC 60870-5-104 and trigger alerts. Normal traffic did not trigger any of
the signatures specified in the IEC 60870-5-104 rule-set [28]. Several methods and tools
were used to trigger the signature-based rules. The protocol-based rules and traffic-
pattern-based rules were demonstrated using a man-in-the-middle packet injection and
demonstration unauthorized traffic. Every signature in the ruleset was triggered
successfully in these experiments. I did however, discover some compatibility issues. The
most significant error, contains the following message; pcre with /R (relative) needs
preceeding match in the same buffer for Suricata. The /R refers to a previous match, but
there is no buffer keeping track of previous matches. This issue could be resolved by
removing the “R” from the regular expression. I also detected a typo in the original rule-
set that prevented a rule form being triggered, in both IDS solutions.
The second experiment category demonstrated DNP3 traffic by regenerating pcap traffic
on the IDS’s network interface. All the signatures except one were triggered in the
experiment. This is because the command needed to trigger the remaining rule is not
included in the pcap file. The third experiment category demonstrated Modbus traffic by
regenerating pcap traffic, and perform attacks on a simulated PLC. Every signature in the
Modbus rule-set was triggered during this experiment. Of the SCADA protocols
demonstrated in this master thesis, modbus is clearly the protocol with most available
simulation and penetration testing tools.
In the fourth and last experiment category, other relevant experiments are performed.
Several SCADA vendors allow unencrypted remote access to control systems and RTUs.
This experiment demonstrates a man-in-the-middle attack and a brute force attack to show
how easy it is to sniff the password in a Telnet session. The experiment also demonstrates
a SYN flood denial-of-service attack and analysis of the additional latency applied by the
Logstash processing. During some of the experiments I experienced that Suricata
triggered a larger amount of alerts than Snort. This is because, the default threshold
settings are different for Suricata and Snort, respectively. These values can be manually
changed by editing the threshold configuration file for both solutions.
Page 96
Henrik Waagsnes SCADA Intrusion Detection System Test Framework
96
I have acquired a lot of new and exciting knowledge while working on my master's thesis.
I had some experience with IDS implementation and penetration testing from previous
projects. The SCADA and SIEM part of the assignment, on the other hand, was completely
new to me. I thought it was particularly exciting to work with the ELK stack. The software
introduced me to unprecedented opportunities. The tool is very powerful in analysis of IDS
events and network traffic, but can also be used to analyze other types of data. A concrete
example is the analysis of twitter feeds.
I am generally pleased with the results achieved in this master thesis. If I could start over,
I would focus more on implementing the OpenMUC j60870 library to simulate IEC 60870-
5-104 communication. The reason for this is that the OpenMUC j60870 is a library that
allows to simulation all IEC message types on both the client and server side. Both
QTester104 and IEC server have their limitations because they not are complete
implementations of the IEC 60870-5-104 protocol.
Page 97
Henrik Waagsnes SCADA Intrusion Detection System Test Framework
97
7 Conclusion
Supervisory control and data acquisition (SCADA) systems is implemented between
industrial processes and management systems. SCADA systems play an important role in
our critical infrastructure (CI), and is used for example to control power plants and water
supplies. Cyber-attacks on control systems can potentially cause disasters. It is therefore
important to implement security mechanisms to detect, and if possible prevent such
attacks.
The defense-in-depth principle is the idea that layered security mechanisms will increase
security of the whole system. This master thesis focus on the Intrusion detection systems
(IDS) layer of this principle, which is implemented behind a firewall. Several of the most
widely used SCADA communication protocols have major weaknesses in their security
architecture. The protocols often lack authentication and encryption mechanisms. Prior
research reveals the need for multiple layers of security to protect SCADA systems against
malicious activity.
This master thesis proposes a SCADA Intrusion Detection System Test Framework that
can be used to conduct research on security in SCADA communication and validate
existing IDS signatures before implementing them in a production network. The framework
consists of four parts; attacker side, SCADA target side, IDS side and SIEM side. The
framework simulates real-time IEC 60870-5-104 communication between a client and a
server. It also provides regeneration of DNP3 and Modbus communication. Both Suricata
IDS and Snort IDS are included in this framework to analyse the network traffic and detect
malicious activity. The two solutions can be compared by using a comparison dashboard
included in the framework. Both IDS solutions includes rule-sets for IEC 60870-5-104,
DNP3 and Modbus communication, developed by Digital Bound and Queen's University
Belfast [29], [30].
The framework is highly scalable, multiple IDS solutions and simulation tools can be added
to the framework. It also includes a SIEM solution called ELK stack (Elasticsearch,
Logstash and Kibana), used to collect, store, analyse and visualize flow data and alert data
generated by the IDS solutions. The ELK stack is a horizontally scalable SIEM approach,
which easily can be expanded if needed. Elasticsearch provides a search and analytics
engine, that indexes and stores the data in a distributed cluster, providing high
performance and fail over. The Kibana web interface is connected to the distributed
Elasticsearch cluster and include several custom dashboards, that can be to analyse
network traffic, IDS events and cluster performance.
The main goal of this master thesis was to perform experiments and demonstrate how the
proposed framework can be used to detect malicious SCADA activity. The conclusion of
all the experiments is that there generally is little difference between Suricata and Snort's
ability to detect malicious traffic. Suricata is compatible with signatures written in Snort
lightweight rules description language. I did however, discover some compatibility issues.
Page 98
Henrik Waagsnes SCADA Intrusion Detection System Test Framework
98
The most significant error, contains the following message; pcre with /R (relative) needs
preceeding match in the same buffer. The /R refers to a previous match, but there is no
buffer keeping track of previous matches. This issue could be resolved by removing the
“R” from the regular expression. During the experiments, I managed to trigger all IEC
60870-5-104 and Modbus signatures. All DNP3 signatures except one were also triggered.
The SCADA Intrusion Detection System Test Framework adds additional latency to the
analysis of IDS events. The latency is the additional time it takes from one of the IDS
implementations detects an event, until the event is stored in the cluster and can be viewed
in the Kibana web interface. The perceived latency is generally higher for Snort events
than for Suricata events. The reason for this is probably the additional processing time
applied by unified2 to eve.json conversion.
Page 99
Henrik Waagsnes SCADA Intrusion Detection System Test Framework
99
8 Future Work
As future work, I aim at expanding the SCADA Intrusion Detection System Test
Framework. The natural next step would be implement other rule-sets, create custom
signatures, utilize anomaly based intrusion detection features and experience with other
IDS solution, like Bro IDS. The HMI software that is implemented in the framework is
currently only used for simulation purposes. A possible extension of this implementation,
could be to interconnect the HMI software with the IEC 60870-5-104 client. Then it would
be possible to see the effect of an attack in the HMI.
Another possible extension is to implement host based IDS solutions in the framework.
This approach could analyze machine level activity, detect abnormal login patterns and file
changes. New entries in the HIDS and SCADA logs could be shipped to Logstash and be
stored in the cluster. This extension would provide the network administrators with more
information that can be used to detect malicious activity in the SCADA system.
It would very interesting to implement Apache Hadoop and connect it to the cluster using
the ES-Hadoop connector. This would connect the massive data storage and deep
processing power of Hadoop with the real-time search and analytics of Elasticsearch [63].
It would also be interesting to utilize the machine learning feature included in x-pack
(platinum license) to predict attacks based on past events.
It would also be interesting to implement the IEC 62351 security enhancement of IEC
60870-5-104 and DNP3 protocol, and perform usability testing of the framework.
Page 100
Henrik Waagsnes SCADA Intrusion Detection System Test Framework
100
9 References
[1] H.-P. Lamminmäki, ‘Information flows in the Network Control Center of Distribution
System Operator from the aspect of outage reporting’, Master of Science Thesis,
Tampere University of Technology.
[2] ‘OWASP’, www.owasp.org, 14-Aug-2015. [Online]. Available:
https://www.owasp.org/index.php/Defense_in_depth. [Accessed: 03-Aug-2017].
[3] Tom Olzak, ‘Brighthub’, www.brighthub.com, 07-May-2010. [Online]. Available:
http://www.brighthub.com/computing/smb-security/articles/2064.aspx. [Accessed: 03-
Aug-2017].
[4] Nick L. Petroni, Jr and Michael Hicks, ‘Automated Detection of Persistent Kernel
Control-Flow Attacks’, University of Maryland, Maryland, 2007.
[5] Bill Kuechler and Vijay Vaishnavi, ‘Theory Development in Design Science Research:
Anatomy of a Research Project’, University of Nevada and Georgia State University.
[6] ‘Supervisory Control and Data Acquisition (SCADA) Systems’, NCS TIB 04-1.
[7] ‘Smarte strømmålere (AMS)’, 21-Jan-2017. [Online]. Available:
https://www.nve.no/elmarkedstilsynet-marked-og-
monopol/sluttbrukermarkedet/smarte-strommalere-ams/.
[8] ANAM SAJID, HAIDER ABBAS, and KASHIF SALEEM, ‘Cloud-Assisted IoT-Based
SCADA Systems Security: A Review of the State of the Art and Future Challenges’.
31-Feb-2016.
[9] ‘Comparisons of SCADA Communication Protocols for Power Systems | Udara Perera
| Pulse | LinkedIn’. [Online]. Available: https://www.linkedin.com/pulse/comparisons-
scada-protocols-power-systems-udara-perera. [Accessed: 28-Mar-2017].
[10] Guillermo A. Francia III, Xavier P. Francia, and Anthony M. Pruit, ‘Towards an In-
depth Understanding of Deep Packet Inspection Using a Suite of Industrial Control
Systems Protocol Packets’, Journal of Cybersecurity Education, Research and
Practice, vol. Volume 2016, no. Number 2 Two, p. 20, Dec-2016.
[11] pgmaynard, ‘Man in the middle attacks on IEC 60870-5-104’, 06:37:18 UTC.
[12] ‘LIAN 98(en) : Protocol IEC 60870-5-104, Telegram structure’. [Online]. Available:
http://www.mayor.de/lian98/doc.en/html/u_iec104_struct.htm. [Accessed: 29-Mar-
2017].
[13] ‘MODBUS Messaging Implementation Guide 1 0 b -
Modbus_Messaging_Implementation_Guide_V1_0b.pdf’. [Online]. Available:
http://www.modbus.org/docs/Modbus_Messaging_Implementation_Guide_V1_0b.pdf
. [Accessed: 07-May-2017].
[14] ‘Simply Modbus - About Modbus TCP’. [Online]. Available:
http://www.simplymodbus.ca/TCP.htm. [Accessed: 07-May-2017].
[15] ‘Understanding the Modbus Protocol’. [Online]. Available:
http://jamod.sourceforge.net/kbase/protocol.html#sub_functions. [Accessed: 07-May-
2017].
[16] ‘Common SCADA System Threats and Vulnerabilities | Patriot Technologies’.
[Online]. Available: http://patriot-tech.com/blog/2015/10/27/common-scada-system-
threats-and-vulnerabilities/. [Accessed: 07-May-2017].
Page 101
Henrik Waagsnes SCADA Intrusion Detection System Test Framework
101
[17] ‘SCADAPASS/scadapass.csv at master · scadastrangelove/SCADAPASS’.
[Online]. Available:
https://github.com/scadastrangelove/SCADAPASS/blob/master/scadapass.csv.
[Accessed: 15-May-2017].
[18] ‘Sunshine’s Homepage - Online CRC Calculator Javascript’. [Online]. Available:
http://www.sunshine2k.de/coding/javascript/crc/crc_js.html. [Accessed: 15-May-2017].
[19] ‘SCADA MODBUS Protocol Vulnerabilities | Cyberbit’. [Online]. Available:
https://www.cyberbit.net/ot-security/scada-modbus-protocol-vulnerabilities/.
[Accessed: 07-May-2017].
[20] ‘IEC TC57 Security Standards for the Power System’s Information Infrastructure –
Beyond Simple Encryption - White Paper on Security Standards in IEC TC57’,
Standard.
[21] David Kushner, ‘The Real Story of Stuxnet’, IEEE Spectrum, vol. 50, no. 3, pp. 48–
53, 07-Mar-2013.
[22] Stamatis Karnouskos, ‘Stuxnet worm impact on industrial cyber-physical system
security’, SAP Research, Jan. 2012.
[23] Ellen Nakashima and Joby Warrick, ‘Stuxnet was work of U.S. and Israeli experts,
officials say’, The Washington Post, 02-Jun-2012.
[24] Robert M. Lee, Tim Conway, and Michael J. Assante, ‘Analysis of the Cyber Attack
on the Ukrainian Power Grid’.
[25] Kim Zetter, ‘Inside the Cunning, Unprecedented Hack of Ukraine’s Power Grid’,
Wired, 03-Mar-2016. [Online]. Available: https://www.wired.com/2016/03/inside-
cunning-unprecedented-hack-ukraines-power-grid/.
[26] Henrik Waagsnes, ‘A study of NIDS & HIDS in a controlled environment’, IKT441 –
Specialization Project, University of Agder, Grimstad, 2016.
[27] Muhammad Adeel, Ahsan Ahmad Chaudhry, Ejaz Ahmed, Kashan Samad, and
Noor Mustafa Shaikh, ‘HONEYNETS: AN ARCHITECTURAL OVERVIEW’, NUST
Institute of Information Technology, Nov. 2007.
[28] Fahim H. Abbasi and R. J. Harris, ‘Experiences with a Generation III Virtual
Honeynet’, Massey University, May 2010.
[29] ‘Digitalbond Quickdraw SCADA IDS’, digitalbond.com. [Online]. Available:
http://www.digitalbond.com/tools/quickdraw/.
[30] Y. Yang, K. McLaughlin, B. Pranggono, T. Littler, S. Sezer, and H. F. Wang,
‘Intrusion Detection System for IEC 60870-5-104 Based SCADA Networks’, Queen’s
University Belfast and Brunel University, Nov. 2013.
[31] Y. Yang, K. McLaughlin, B. Pranggono, T. Littler, S. Sezer, and H. F. Wang, ‘Multi-
Attribute SCADA-Specific Intrusion Detection System for Power Networks’, Queen’s
University Belfast and Brunel University.
[32] Michael Baker, David Turnbull, and Gerald Kaszub, ‘Finding Needles in Haystacks
(the Size of Countries)’. .
[33] Florian Skopik, Ivo Friedberg, and Roman Fiedler, ‘Dealing with Advanced
Persistent Threats in Smart Grid ICT Networks’, Austrian Institute of Technology, May
2014.
Page 102
Henrik Waagsnes SCADA Intrusion Detection System Test Framework
102
[34] P. García-Teodoro, J. Díaz-Verdejo, G. Maciá-Fernández, and E. Vázquez,
‘Anomaly-based network intrusion detection: Techniques, systems and challenges’,
Comput. Secur., vol. 28, no. 1–2, pp. 18–28, Feb. 2009.
[35] S.L.P. Yasakethu and J. Jiang, ‘Intrusion Detection via Machine Learning for
SCADA System Protection’, University of Surrey.
[36] W. Lee, S. J. Stolfo, and K. W. Mok, ‘A data mining framework for building intrusion
detection models’, in Proceedings of the 1999 IEEE Symposium on Security and
Privacy (Cat. No.99CB36344), 1999, pp. 120–132.
[37] Y. Qiao, X. W. Xin, Y. Bin, and S. Ge, ‘Anomaly intrusion detection method based
on HMM’, Electron. Lett., vol. 38, no. 13, pp. 663–664, Jun. 2002.
[38] ‘A Tutorial on Support Vector Machines for Pattern Recognition | SpringerLink’.
[Online]. Available: http://link.springer.com/article/10.1023%2FA%3A1009715923555.
[Accessed: 17-May-2017].
[39] K.-L. Li, H.-K. Huang, S.-F. Tian, and W. Xu, ‘Improving one-class SVM for anomaly
detection’, in Proceedings of the 2003 International Conference on Machine Learning
and Cybernetics (IEEE Cat. No.03EX693), 2003, vol. 5, p. 3077–3081 Vol.5.
[40] Daniel Krauß and Christoph Thomalla, ‘Ontology-based detection of cyber-attacks
to SCADA-systems in critical infrastructures’, Fraunhofer IOSB.
[41] Eduardo Germano da Silva, Anderson Santos da Silva, Juliano Araujo Wickboldt,
Paul Smith, Lisandro Zambenedetti Granville, and Alberto Schaeffer-Filho, ‘A One-
Class NIDS for SDN-Based SCADA Systems’, Federal University of Rio Grande do Sul
and Austrian Institute of Technology, Aug. 2016.
[42] Lukas Rist, ‘The Honeynet Project: Conpot’, 05-Oct-2013. [Online]. Available:
https://www.honeynet.org/node/1047. [Accessed: 28-Feb-2017].
[43] Arthur Jicha, Mark Patton, and Hsinchun Chen, ‘SCADA Honeypots An In-depth
Analysis of Conpot’, University of Arizona, Nov. 2016.
[44] ‘Digitalbond SCADA Honeynet’, www.digitalbond.com. [Online]. Available:
https://www.digitalbond.com/tools/scada-honeynet/. [Accessed: 28-Feb-1017].
[45] ‘HES-SO Valais/Wallis’, www.hevs.ch. [Online]. Available:
https://www.hevs.ch/en/minisites/projects-products/gridlab/pages-minisites/gridlab-
district-8449. [Accessed: 03-Jan-2017].
[46] Prageeth Gunathilaka, Daisuke Mashima, and Binbin Chen, ‘SoftGrid: A Software-
based Smart Grid Testbed for Evaluating Substation Cybersecurity Solutions’,
Advanced Digital Sciences Center, Oct. 2016.
[47] David M Laverty et al., ‘A Microgrid Testbed for Interdisciplinary Research on
Cyber-Secure Industrial Control in Power Systems’, Queen’s University Belfast, 2016.
[48] ‘IEC Server Manual’. [Online]. Available: http://area-x1.lima-city.de/. [Accessed: 17-
Apr-2017].
[49] ‘org.openmuc.j60870 (j60870 1.2.0 API)’. [Online]. Available:
https://www.openmuc.org/iec-60870-5-104/javadoc/. [Accessed: 14-May-2017].
[50] ‘README.decode’. [Online]. Available: https://www.snort.org/faq/readme-decode.
[Accessed: 30-Apr-2017].
Page 103
Henrik Waagsnes SCADA Intrusion Detection System Test Framework
103
[51] ‘Deploying and Scaling Logstash | Logstash Reference [5.0] | Elastic’. [Online].
Available: https://www.elastic.co/guide/en/logstash/5.0/deploying-and-scaling.html.
[Accessed: 01-May-2017].
[52] ‘Glossary of terms | Elasticsearch Reference [5.3] | Elastic’. [Online]. Available:
https://www.elastic.co/guide/en/elasticsearch/reference/current/glossary.html#index.
[Accessed: 02-May-2017].
[53] ‘X-Pack: Extend Elasticsearch, Kibana & Logstash | Elastic’. [Online]. Available:
https://www.elastic.co/products/x-pack. [Accessed: 03-May-2017].
[54] ‘Understanding Systemd Units and Unit Files | DigitalOcean’. [Online]. Available:
https://www.digitalocean.com/community/tutorials/understanding-systemd-units-and-
unit-files. [Accessed: 03-May-2017].
[55] ‘linux - Logrotate Successful, original file goes back to original size - Server Fault’.
[Online]. Available: https://serverfault.com/questions/221337/logrotate-successful-
original-file-goes-back-to-original-size. [Accessed: 05-May-2017].
[56] ‘Time Synchronisation with NTP’. [Online]. Available:
https://help.ubuntu.com/lts/serverguide/NTP.html#timedatectl. [Accessed: 09-May-
2017].
[57] Martin Zaefferer, Yavuz Selim Inanir, and Thomas Karanatsios, ‘Intrusion
Detection’, Apr. 2017.
[58] ‘XArp | Advanced ARP spoofing detection’. [Online]. Available: http://www.xarp.net/.
[Accessed: 24-Apr-2017].
[59] ‘PMaynard/ettercap-104-mitm: Plugin for IEC 60870-5-104’. [Online]. Available:
https://github.com/PMaynard/ettercap-104-mitm. [Accessed: 25-Apr-2017].
[60] ‘Packet Sender - Documentation’. [Online]. Available:
https://packetsender.com/documentation. [Accessed: 25-Apr-2017].
[61] ‘Google Code Archive - Long-term storage for Google Code Project Hosting.’
[Online]. Available: https://code.google.com/archive/p/plcscan/. [Accessed: 27-Apr-
2017].
[62] ‘DROP - Don’t Route or Peer lists - The Spamhaus Project’. [Online]. Available:
https://www.spamhaus.org/drop/. [Accessed: 28-Apr-2017].
[63] ‘Elasticsearch for Hadoop | Elastic’. [Online]. Available:
https://www.elastic.co/products/hadoop. [Accessed: 10-May-2017].
Page 104
Henrik Waagsnes SCADA Intrusion Detection System Test Framework
104
10 Appendices
Appendix A – Tools
Appendix B – Virtual machine specifications
Appendix C – Logstash configuration
Page 105
Appendix A – Tools
This appendix describes the software used in the SCADA Intrusion Detection
System Test Framework
Page 106
Appendix A
2
1 Operating systems and virtualization tools
Operating systems and hypervisors implemented in the framework.
1.1 Microsoft Windows 10
Windows 10 is an operating system developed by Microsoft, and released in 2015
under the codename “Windows Threshold”. Windows 10 is built on the Windows NT
kernel and follows Windows 8 [1].
1.2 Ubuntu 16.04
Ubuntu is a free open source Debian-based Linux distribution. The word “ubuntu” is
from the African Zulu language and translates as “humanity to others”. Ubuntu
operating systems is intentionally developed for personal computers, but they also
develops sever and cloud solutions. Most Ubuntu desktop operating systems utilize
GNU Network Object Model Environment (GNOME) as GUI [2].
1.3 Kali Linux
Kali Linux is a free open source operating system, maintained and funded by Offensive
Security. The operating system contains over 600 tools used for perpetration testing,
reverse engineering and forensics. Kail Linux was released in 2013, and is a complete
top-to-bottom rebuild of the prior operation system, BackTrack Linux [2].
1.4 VirtualBox
VirtualBox is a powerful x86 and AMD64/Intel64 virtualization tool. VirtualBox are free
and open source distributed under the GPLv2 licence. VirtualBox runs on Windows,
Linux, Macintosh, and Solaris platforms. VirtualBox was earlier owned by Sun
Microsystems, but is now owned by the Oracle Corporation [3].
Page 107
Appendix A
3
2 Penetration testing tools
Penetration testing and security tools implemented on the attacker machine.
2.1 Ettercap
Ettercap is a tool used to perform man in the middle attacks. It provides sniffing and
content filtering of live connections. It supports active and passive analysis of many
protocols hosts and network devices [4].
2.2 Nmap
Nmap also called Network Mapper is a free open source tool for network discovery and
security auditing. Nmap has many different port scanning techniques to determine
what hosts are available on the network, what services the hosts are serving and what
operating systems version they are running. Nmap are available for Linux, Windows,
and Mac OS X operating systems. The traditional NMAP tool is a command line (CLI)
tool. In addition, nmap also have developed GUI based tool, called Zenmap [5].
2.3 Ncrack
Ncrack is an open source command-line tool used for cracking network authentication.
It is originally designed to help companies secure their networks, by scanning all their
hosts and networking devices. The goal is to find out what devices that uses poor
passwords, so that they can be changed. Ncrack supports brute forcing on protocols
like RDP, SSH, http, SMB, pop3, VNC, FTP, and Telnet. The tool is very flexible and
provide the user full control of network operations [2].
2.4 Hping3
Hping3 is a command-line tool, used to generate and analyse TCP/IP packets. It
supports TCP, UDP, ICMP and RAW-IP protocols. It is possible to spoof random IP-
addresses, and flood the target with packages to test firewalls, IDS/IPS, network
limitations [6].
2.5 Bittwist
Bittwist is a libcap-based tool, used to regenerate packet captured (pcap/cap) traffic
onto a live network. The tool is designed to complete tcpdump functionality, by
specifying capture file and transmit the output onto an interface. The tool can be used
by network administrators, to simulate traffic scenarios, test firewall settings, IDS/IPS
and for troubleshooting purposes [7].
Page 108
Appendix A
4
2.6 Packet Sender
Packet Sender is a freely available open source tool capable of sending and receiving
TCP and UDP packets. Packer Sender is available for Windows, Mac, and Linux
platforms, and is licensed under the GNUv2 [8].
2.7 Dsniff
Dsniff is a tool often used in combination with arpspoof or ettercap, to sniff passwords
by capturing and analyse the network traffic. Dsniff supports password sniffing on
multiple protocols; FTP, Telnet, SMTP, HTTP, POP, IMAP, SNMP, LDAP, Rlogin and
many other protocols [2].
2.8 Metasploit
The Metasploit Project is a computer security project that provide security
vulnerabilities, penetration testing and IDS signature development. The Metasploit
Framework (msf) is a open source sub-project, used to develop and executing exploit
code against a remote target machines. The Metasploit Framework is distributed under
a Berkeley Software Distribution (BSD) license [2].
2.9 plcscan
plcscan is a Python tool for scanning PLC devices over s7comm or modbus protocols.
Plcscan is developed by a group of researchers and is distributed under the GPLv3
[9].
2.10 SMOD
SMOD is a modular framework that can be used to perform penetration testing on the
modbus protocol. SMOD implements the modbus protocol by using Python and Scapy.
SMOD is developed by Farzin Enddo and distributed under the GPLv2 [10].
Page 109
Appendix A
5
3 SCADA tools
Software implemented in the framework to simulate SCADA targets.
3.1 Open Substation HMI (OSHMI)
Open Substation HMI (OSHMI) is a tool developed by Ricardo Olsen at the Federal
University of Rio Grande do Sul and distributed under the LGPLv3 licence. OSHMI is
open source and can be used to simulate or control substations. OSHMI is written in
C++, Lua and JavaScript. Part of the code is written in Portuguese. This may lead to
some problems for non-portuguese speaking people. In addition to simulate
substations, OSHMI can be connected to real or simulated RTUs. OSHMI is according
to Ricardo Olsen used in multiple substations, up to 230kV level control centres [11].
QTester104 can be connected to the OSHMI software using a transfer protocol called
BDTR (QTester104 need configuration) [11].
3.2 QTester104
QTester104 is a tool developed by Ricardo Olsen at the Federal University of Rio
Grande do Sul. This tool is used to implement the IEC60870-5-104 protocol client side
for substation data acquisition and control via tcp/ip networks using the QT UI
Framework. QTester104 can be compiled on Linux and Windows platforms. It provides
the possibility to poll data, view data and send commands to/from substation systems
(RTUs) [12].
3.3 OpenMUC j60870
OpenMUC j60870 is a library implementing the IEC 60870-5-104 communication
standard. The library can be used to program clients as well as servers. OpenMUC
j60870 is distributed under the GPLv3 license. The library is developed by Stefan
Feuerhahn at Fraunhofer Institute for Solar Energy Systems in Freiburg, Germany.
The library also includes run-scripts and a test client/server [13].
3.4 IEC Server
This IEC Server in a tool used to implement the IEC60870-5-104 protocol server side
for substation data acquisition and control via tcp/ip networks. IEC server can be used
to simulate certain IEC message types, configure automatic simulation in cyclic periods
and configure feedback on receiving of control types messages. The IEC Server is
distributed under a public domain licence [14].
Page 110
Appendix A
6
4 Security and administration tools
Software implemented in the intrusion detection side of the framework.
4.1 Suricata
Suricata IDS is a free and open source next generation intrusion detection and
prevention system, developed by the Open Information Security Foundation (OISF).
Suricata is a rule-based IDPS engine that utilises externally developed rule sets to
monitor network traffic and provide alerts to the system administrator when suspicious
events occur. Suricata supports rule sets written in Snort lightweight rule description
language. Suricata also supports powerful Lua scripting for detection of complex
threats. Suricata is a multi-threaded engine that offers increased speed and efficiency
in network traffic analysis. It is distributed under the GPLv2 licence [15].
4.2 Snort
Snort is an open source network intrusion detection system (NIDS). It is a packet
sniffer, based on a packet capturing library, called libpcap. Snort monitors network
traffic and examines each packet closely to detect anomalies. Snort was originally
developed by Martin Roesch at a company called Sourcefire. This company is now a
part of Cisco Systems. Snort is distributed under the GPLv2 licence [16].
4.3 py-idstools
py-idstools is a collection of Python libraries for Snort and Suricata rule and event
utilities. py-idstools include multiple programs for rule management and conversion
tool (eve2pcap, u2json and u2eve). py-idstools is distributed under the BSD license
[17].
4.4 Wireshark
Wireshark is the world's most widely used network protocol analyzer. It lets you capture
and browse the traffic running in a computer network. It runs on most computing
platforms including Windows, OS X, Linux, and UNIX. Wireshark is a free open source
tool, released under the GPLv2 licence [18].
4.5 PuTTY
PuTTY is an open source SSH and Telnet client developed by Simon Tatham. The tool
is designed for Windows platforms, but is also available for Linux [19].
Page 111
Appendix A
7
5 Security information and event management (SIEM)
Software implemented in the framework to collect, store, analyse and visualize data.
5.1 Elasticsearch
Elasticsearch is a distributed, search and analytics engine based on Apache Lucene
and developed by Elastic. Elasticsearch provides a distributed full-text search engine
with web interface and schema-free JSON documents. Elasticsearch is written in Java
and released as open source software, under the Apache License 2.0 [20].
Elastic has developed Elasticsearch alongside a Logstash and Kibana. Elasticsearch
is an important part of the ELK stack / Elastic stack. At the time this master thesis is
written, Elasticsearch 5.4.0 is the newest version released [20].
5.2 Logstash
Logstash is an open source, server-side data processing pipeline that ingests data
from a multitude of sources simultaneously, transforms it, and then sends to other
systems (for example Elasticsearch). Logstash is an open source tool written in Ruby,
developed by Elastic and released under the Apache License 2.0 [21].
Elastic has developed Logstash alongside a Elasticsearch and Kibana. Logstash Is an
important part of the ELK stack / Elastic stack. At the time this master thesis is written,
Logstash 5.4.0 is the newest version released [21].
5.3 Kibana
Kibana is an open source data visualization and analysis tool for Elasticsearch. It
provides visualization of the content indexed in an Elasticsearch cluster. Kibana
provide the possibility to create visualization like graphs, pie charts and maps on top
of large volumes of data. The data can be visualized both in a historical perspective
and real-time. Kibana is an open source tool written in JavaScript, developed by Elastic
and released under the Apache License 2.0 [22].
Elastic has developed Kibana alongside a Elasticsearch and Logstash. Kibana Is an
important part of the ELK stack / Elastic stack. At the time this master thesis is written,
Kibana 5.4.0 is the newest version released. Elastic has also released an alpha version
of Kibana 6.0.0 [23].
Page 112
Appendix A
8
5.4 X-pack
X-pack is an extension of the ELK stack / Elastic stack which unlocks multiple features.
Security, alerting, monitoring, reporting, graph visualization and machine learning is
some of the features that is possible to unlock. Four different licenses are available,
open source, basic, gold, and platinum. The open source license does not provide any
additional features, other than Elasticsearch, Logstash, Kibana and Beats. The basic
license is free and unlocks a monitoring feature. The Gold and Platinum licenses
unlock almost every available feature [24].
5.5 Filebeat
Beats is an open source platform written in Go and developed by Elastic. The Beats
platform has one single purpose; be installed as lightweight agents and send data from
hundreds or thousands of machines to Logstash or Elasticsearch. It can transfer all
kinds of data and consists of multiple agents; Filebeat, Metricbeat, Packetbeat,
Winlogbeat and Hartbeat. Filebeat offers a simple lightweight tool to forward and
centralize logs and files [25], [26].
Page 113
Appendix A
9
References
[1] ‘Windows 10 Definition from PC Magazine Encyclopedia’. [Online]. Available: http://www.pcmag.com/encyclopedia/term/67052/windows-10. [Accessed: 21-Apr-2017].
[2] Henrik Waagsnes, ‘A study of NIDS & HIDS in a controlled environment’, IKT441 – Specialization Project, University of Agder, Grimstad, 2016.
[3] ‘Oracle VM VirtualBox’. [Online]. Available: https://www.virtualbox.org/. [Accessed: 21-Apr-2017].
[4] ‘Ettercap Home Page’. [Online]. Available: http://ettercap.github.io/ettercap/index.html. [Accessed: 21-Apr-2017].
[5] ‘Nmap: the Network Mapper - Free Security Scanner’. [Online]. Available: https://nmap.org/. [Accessed: 20-Apr-2017].
[6] ‘hping3 | Penetration Testing Tools’. [Online]. Available: http://tools.kali.org/information-gathering/hping3. [Accessed: 20-Apr-2017].
[7] ‘Bit-Twist: Libpcap-based Ethernet packet generator’. [Online]. Available: http://bittwist.sourceforge.net/. [Accessed: 20-Apr-2017].
[8] ‘Packet Sender - Documentation’. [Online]. Available: https://packetsender.com/documentation. [Accessed: 25-Apr-2017].
[9] ‘Google Code Archive - Long-term storage for Google Code Project Hosting.’ [Online]. Available: https://code.google.com/archive/p/plcscan/. [Accessed: 27-Apr-2017].
[10] ‘enddo/smod: MODBUS Penetration Testing Framework’. [Online]. Available: https://github.com/enddo/smod. [Accessed: 13-May-2017].
[11] ‘OSHMI - Open Substation HMI download | SourceForge.net’. [Online]. Available: https://sourceforge.net/projects/oshmiopensubstationhmi/?source=directory. [Accessed: 17-Apr-2017].
[12] ‘QTester104 download | SourceForge.net’. [Online]. Available: https://sourceforge.net/projects/qtester104/. [Accessed: 21-Apr-2017].
[13] Stefan Feuerhahn, ‘j60870 User Guide - j60870-doc.pdf’, Fraunhofer Institute for Solar Energy Systems in Freiburg, Germany, May 2017.
[14] ‘IEC Server Manual’. [Online]. Available: http://area-x1.lima-city.de/. [Accessed: 17-Apr-2017].
[15] ‘What is Suricata - Suricata - Open Information Security Foundation’. [Online]. Available: https://redmine.openinfosecfoundation.org/projects/suricata/wiki/What_is_Suricata. [Accessed: 20-Mar-2017].
[16] ‘Snort Frequently Asked Questions’. [Online]. Available: https://www.snort.org/faq. [Accessed: 21-Apr-2017].
[17] ‘jasonish/py-idstools: idstools: Snort and Suricata Rule and Event Utilities in Python (Including a Rule Update Tool)’. [Online]. Available: https://github.com/jasonish/py-idstools. [Accessed: 21-Apr-2017].
[18] ‘Wireshark · Go Deep.’ [Online]. Available: https://www.wireshark.org/#aboutWS. [Accessed: 20-Apr-2017].
[19] ‘Download PuTTY - a free SSH and telnet client for Windows’. [Online]. Available: http://www.putty.org/. [Accessed: 20-Apr-2017].
[20] ‘Elasticsearch: RESTful, Distributed Search & Analytics | Elastic’. [Online]. Available: https://www.elastic.co/products/elasticsearch. [Accessed: 21-Apr-2017].
Page 114
Appendix A
10
[21] ‘Logstash: Collect, Parse, Transform Logs | Elastic’. [Online]. Available: https://www.elastic.co/products/logstash. [Accessed: 21-Mar-2017].
[22] ‘Kibana: Explore, Visualize, Discover Data | Elastic’. [Online]. Available: https://www.elastic.co/products/kibana. [Accessed: 21-Apr-2017].
[23] ‘elastic/kibana: Kibana analytics and search dashboard for Elasticsearch’. [Online]. Available: https://github.com/elastic/kibana. [Accessed: 21-Apr-2017].
[24] ‘Subscriptions · Elastic Stack Products & Support | Elastic’. [Online]. Available: https://www.elastic.co/subscriptions. [Accessed: 21-Apr-2017].
[25] ‘Beats: Data Shippers for Elasticsearch | Elastic’. [Online]. Available: https://www.elastic.co/products/beats. [Accessed: 21-Apr-2017].
[26] ‘Filebeat: Lightweight Log Analysis & Elasticsearch | Elastic’. [Online]. Available: https://www.elastic.co/products/beats/filebeat. [Accessed: 21-Apr-2017].
Page 115
Appendix B – Virtual machine specifications
This appendix describes the virtual machines implemented in the SCADA Intrusion
Detection System Test Framework
Page 116
Appendix B
2
SCADA Target side VM specification
Simulation: HMI and IEC 60870-5-104 Client
Operating system Microsoft Windows 10 64bit
CPU 2 Processor kernels
RAM 1GB
Graphics 128 MB
NIC Adapter 1: Internal network – lab
Storage 32GB
Software Open Substation HMI (OSHMI) version 4.2
QTester104 version 1.19
Simulation: Second IEC 60870-5-104 Client
Operating system Ubuntu 16.04 LTS 64bit
CPU 2 Processor kernels
RAM 1GB
Graphics 128 MB
NIC Adapter 1: Internal network – lab
Storage 32GB
Software OpenMUC j60870 version 1.2.0
Simulation: IEC 60870-5-104 Server
Operating system Microsoft Windows 10 64bit
CPU 2 Processor kernels
RAM 1GB
Graphics 128MB
NIC Adapter 1: Internal network – lab
Storage 32GB
Software IEC Server version 1.03
PuTTy (Telnet Client)
Honeypot: Conpot siemens S7- 200 PLC
Operating system Ubuntu 16.04 LTS 64bit
CPU 1 Processor kernel
RAM 1GB
Graphics 12 MB
NIC Adapter 1: Internal network – lab
Storage 40GB
Software Conpot version 0.5.1
Telnet Server
Page 117
Appendix B
3
Attacker side VM specification
Attacker
Operating system Kali Linux 64 bit
CPU 2 Processor kernels
RAM 2GB
Graphics 128 MB
NIC’s Adapter 1: Internal network – lab
Storage 40GB
Intrusion Detection Systems (IDSs)
VM specification
Suricata IDS
Operating system Ubuntu 16.04 LTS 64bit
CPU 2 Processor kernels
RAM 2GB
Graphics 12 MB
NIC’s Adapter 1: Internal network – lab
(Promiscuous mode)
Adapter 2: Bridged Adapter – eth0
Storage 40GB
Software Suricata IDS version 3.1.4
Filebeat 5.3.0
Bit-Twist 2.0
NTP client daemon
Snort IDS
Operating system Ubuntu 16.04 LTS 64bit
CPU 2 Processor kernels
RAM 2GB
Graphics 12 MB
NIC’s Adapter 1: Internal network – lab (Promiscuous mode)
Adapter 2: Bridged Adapter – eth0
Storage 40GB
Software Snort IDS version 2.9.9
Filebeat 5.3.0
Bit-Twist 2.0
NTP client daemon
Page 118
Appendix B
4
Security information and event management (SIEM) VM specification
ELK Monitor VM (node -1)
Operating system Ubuntu 16.04 LTS 64bit
CPU 3 Processor kernels
RAM 4GB
Graphics 12 MB
NIC’s Adapter 1: Bridged Adapter – eth0
Storage 40GB
Software Elasticsearch version 5.3.0
Logstash version 5.3.0
Kibana version 5.3.0
NTP client daemon
Plugins X-Pack version 5.3.0 (with Basic Licence)
External plugins:
• kibana_health_metric_vis
• Network Plugin for Kibana 5
Elasticsearch node-2
Operating system Ubuntu 16.04 LTS 64bit
CPU 1 Processor kernels
RAM 2GB
Graphics 12 MB
NIC’s Adapter 1: Bridged Adapter – eth0
Storage 40GB
Software Elasticsearch version 5.3.0
NTP client daemon
Elasticsearch node-3
Operating system Ubuntu 16.04 LTS 64bit
CPU 1 Processor kernels
RAM 2GB
Graphics 12 MB
NIC’s Adapter 1: Bridged Adapter – eth0
Storage 40GB
Software Elasticsearch version 5.3.0
NTP client daemon
Page 119
Appendix C – Logstash configuration This appendix includes the code used to configure Logstash in the SCADA
Intrusion Detection System Test Framework
Page 120
Appendix C
2
Code:
input { beats {
port => 5044
codec => json
}
}
filter {
if "Suricata" in [tags] {
mutate {
add_field => {
"engine" => "suricata"
}
}
}
else if "Snort" in [tags] {
mutate {
add_field => {
"engine" => "snort"
}
}
}
else if "Bro" in [tags] {
mutate {
add_field => {
"engine" => "bro"
}
}
}
else{
mutate {
add_field => {
"engine" => "unknown"
}
}
}
if "beats_input_codec_json_applied" in [tags]{
mutate{
remove_tag => ["beats_input_codec_json_applied"]
remove_field => ["type", "input_type"]
rename => {"timestamp" => "IDS_timestamp"}
}
}
if [src_ip] {
geoip {
source => "src_ip"
target => "geoip"
add_field => [ "[geoip][coordinates]", "%{[geoip][longitude]}" ]
add_field => [ "[geoip][coordinates]", "%{[geoip][latitude]}" ]
add_tag => ["geoip"]
}
Page 121
Appendix C
3
mutate {
convert => [ "[geoip][coordinates]", "float" ]
}
if ![geoip.ip] {
if [dest_ip] {
geoip {
source => "dest_ip"
target => "geoip"
add_field => [ "[geoip][coordinates]", "%{[geoip][longitude]}" ]
add_field => [ "[geoip][coordinates]", "%{[geoip][latitude]}" ]
add_tag => ["geoip"]
}
mutate {
convert => [ "[geoip][coordinates]", "float" ]
remove_tag => ["_geoip_lookup_failure"]
}
}
}
# Add severity level
if [event_type] == "alert" {
if [alert][severity] == 1 {
mutate {
add_field => { "severity" => "High" }
}
}
else if [alert][severity] == 2 {
mutate {
add_field => { "severity" => "Medium" }
}
}
else if [alert][severity] == 3 {
mutate {
add_field => { "severity" => "Low" }
}
}else{
mutate {
add_field => { "severity" => "Unknown" }
}
}
}
}
}
output {
elasticsearch {
hosts => "192.168.0.125:9200"
index => "filebeat-%{+YYYY.MM.dd}"
document_type => "IDS-event"
template => "/etc/logstash/templates/elasticsearch-filebeat-*.json"
template_name => "filebeat-*"
}
}