Scanning Electron Microscopy in Concrete Petrography by Paul E. Stutzman Building and Fire Research Laboratory National Institute of Standards and Technology Gaithersburg, MD 20899 USA Reprinted from Materials Science of Concrete Special Volume: Calcium Hydroxide in Concrete (Workshop on the Role of Calcium Hydroxide in Concrete). Proceedings. J. Skalny, J. Gebauer and I. Odler, eds., The American Ceramic Society. November 1-3, 2000, Anna Maria Island, Florida, 59-72 pp, 2001. NOTE: This paper is a contribution of the National Institute of Standards and Technology and is not subject to copyright.
Transcript
Scanning Electron Microscopy in Concrete Petrography
by
Paul E. StutzmanBuilding and Fire Research Laboratory
National Institute of Standards and TechnologyGaithersburg, MD 20899 USA
Reprinted from Materials Science of Concrete Special Volume: Calcium Hydroxide inConcrete (Workshop on the Role of Calcium Hydroxide in Concrete). Proceedings. J.Skalny, J. Gebauer and I. Odler, eds ., The American Ceramic Society. November 1-3, 2000,Anna Maria Island, Florida, 59-72 pp, 2001.
NOTE: This paper is a contribution of the National Institute of Standards andTechnology and is not subject to copyright.
Calcium Hydroxide in Concrete 61
Figure 1. Secondary electron images showing the hexagonal habit of calciumhydroxide, needle-like habit of ettringite, and the sheet-like habit of calcium-silicate-hydrate. In the upper image, crystal growth into a void, where spacerestrictions are minimal, allowing development of euhedral forms. The lowerimage, being a more mature paste with limited space, exhibits crystal forms aremore subhedral to anhedral. Here one may identify the plate-like CH morphologyand fine bundles of Type I C-S-H, platy-Type II C-S-H, and ettringite needles.
Calcium Hydroxide
Ettringite
Calcium Hydroxide
Ettringite
Calcium-Silicate-Hydrate
15 µµm
10 µµm
Calcium Hydroxide in Concrete 63
Figure 2. BE imaging of hardened cement paste at 1 day. Identification ofcalcium hydroxide is made by its relative brightness (between CSH andanhydrous cement), morphological characteristics (cross-sections of the plate-likecrystals), and spot chemical analysis (calcium and oxygen). The BE image from aplanar cross section, is amenable to both image analysis and x-ray microanalysis.
X-Ray Microanalysis: X-radiation is produced when a specimen is bombardedby high-energy electrons. X-ray microanalysis systems generally employ an energy-dispersive detector with the other detector type being a wavelength detector. Theenergy-dispersive detector has the advantage of collecting the entire spectrum at onetime while the wavelength detector acquires the spectrum sequentially. The X-rayenergy level is displayed as the number of counts at each energy interval andappears as a set of peaks on a continuous background (Figure 3). The positions ofthe peaks are characteristic of a particular element, so identifications are made byexamination of peak positions and relative intensities. The X-ray signal can beused for: A) spectrum analysis to determine which elements are present and in
7 µµm
Calcium HydroxideCalcium-Silicate-Hydrate
Residual CementPores
25 µµm
66 Materials Science of Concrete
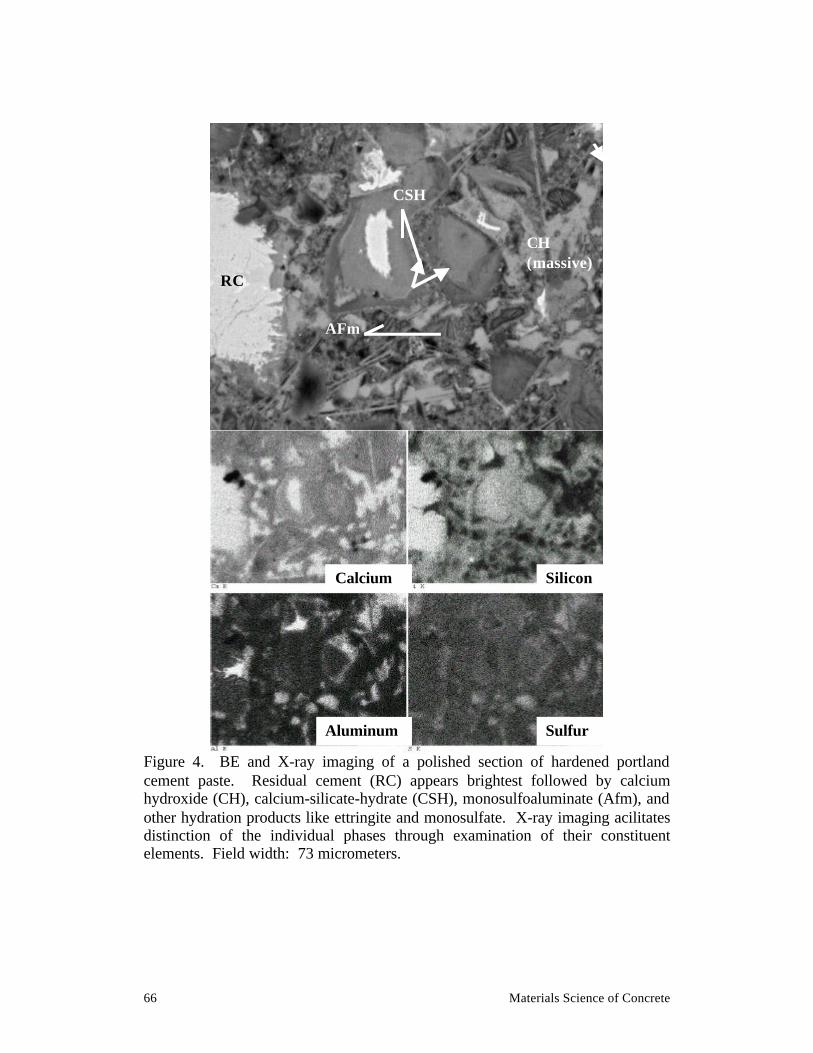
Figure 4. BE and X-ray imaging of a polished section of hardened portlandcement paste. Residual cement (RC) appears brightest followed by calciumhydroxide (CH), calcium-silicate-hydrate (CSH), monosulfoaluminate (Afm), andother hydration products like ettringite and monosulfate. X-ray imaging acilitatesdistinction of the individual phases through examination of their constituentelements. Field width: 73 micrometers.
CH(massive)
AFm
CSH
RC
Calcium Silicon
SulfurAluminum
Calcium Hydroxide in Concrete 69
binary image. This image may then be analyzed to estimate area fraction, phaseshape, and distribution.
In Figures 6 and 7, the interfacial transition zone microstructure is assessed usingSEM/BE imaging and image analysis. Four constituents are identified using theBE gray levels in Figure 6; residual cement being the brightest followed bycalcium hydroxide, C-S-H gel, and pores showing as black. A gray-levelhistogram to the right of the image plots the number of image pixels across thegray scale. In Figure 7, the image is segmented into the four phases on the basis ofgray level, and the constituents area fractions are estimated as a function ofdistance from the interface. This provides a graphical display of the changes inpaste microstructure with distance. This plot is scaled to fit the image and isbased upon single 10 µm-wide field estimates from the interface so no uncertaintyvalues are available.
Figure 5. Image processing of BE and calcium X-ray images here highlightscalcium hydroxide location. Analysis of the binary image of CH distribution(lower-right image) estimates 12% of the image field to be occupied by calciumhydroxide.
70 Materials Science of Concrete
Figure 6. The paste / aggregate interfacial transition zone often shows increasedporosity (dark) and calcium hydroxide, and less residual cement than the bulkcement paste. 150 µm field width.
Summary
The application of scanning electron microscopy enhances our ability tocharacterize cement and concrete microstructure, and will aid in evaluating theinfluences of supplementary cementing materials, evaluating concrete durabilityproblems, and in the prediction of service life. SEM and X-ray imagingtechniques allow imaging the complex microstructure of concrete with sub-micrometer definition. Careful specimen preparation is important as both BE andXR imaging require highly polished surfaces. Through combination of theinformation available in the backscattered electron and X-ray images, an accuratesegmentation of the image into its constituent phases may be achieved. Thisallows measurement of those features using image analysis.
Calcium Hydroxide in Concrete 71
Figure 7. Thresholded backscattered electron image and gray-level histogram ofinterfacial transition zone allows identification and plot (to scale) of lateraldistribution of porosity, C-S-H gel, calcium hydroxide, and residual cement: 150µm field width.