Schedules 50-149 Management Review & Statutory Reports 150-414 Financial Statements 415-425 Embedded Value Results and Glossary of Terms 01-49 Corporate Overview Annual Report 2019-20 175 Schedule 16 - Significant Accounting Policies and Notes to the Accounts Corporate Information HDFC Life Insurance Company Limited ('HDFC Life' or 'The Company') (Formerly HDFC Standard Life Insurance Company Limited), is formed as a joint venture between Housing Development Finance Corporation Limited ('HDFC Limited') and Standard Life Aberdeen plc. The Company was incorporated at Mumbai on August 14, 2000 as a public limited company under the Companies Act, 1956. The Company obtained a certificate of commencement of business on October 12, 2000 and a certificate of registration from the Insurance Regulatory and Development Authority of India ('IRDAI') on October 23, 2000 for carrying on the business of life insurance. The Company offers a range of individual and group insurance solutions. The portfolio comprises of various insurance and investment products such as Protection, Pension, Savings, Investment, Annuity and Health. The Shares of the Company are listed on National Stock Exchange of India Limited (NSE) and BSE Limited (BSE). A. SIGNIFICANT ACCOUNTING POLICIES 1. Basis of preparation These financial statements for the year ended March, 31 (‘the period’), 2020 are prepared under the historical cost convention, on an accrual basis of accounting in accordance with the accounting principles generally accepted in India (Indian GAAP) and in the manner prescribed by the Insurance Regulatory and Development Authority (Preparation of Financial Statements and Auditor’s Report of Insurance Companies) Regulations, 2002 (‘the Financial Statements Regulations’), the Master Circular on Preparation of Financial Statements and Filing of Returns of Life Insurance Business Ref No. IRDA/F&A/Cir/232/12/2013 dated December 11, 2013 (‘the Master Circular’) and other circulars issued by the IRDAI from time to time, provisions of the Insurance Act, 1938, as amended from time to time, including amendment brought by Insurance Laws (Amendment) Act, 2015, the Insurance Regulatory and Development Authority Act, 1999 as amended from time to time, the Companies Act, 2013 and amendments and rules made thereto, as applicable and the Act, as amended from time to time, to the extent applicable. Pursuant to Section 133 of the Companies Act, 2013, read with Rule 7 of the Companies (Accounts) Rules, 2014, whereby till the accounting standards or any addendum thereto are prescribed by the Central Government in consultation and recommendation of the National Financial Reporting Authority, the existing accounting standards notified under Companies Act, 1956, shall continue to apply. Consequently, these financial statements have been prepared also to comply in all material aspects with the accounting standards notified under Section 211 (3C), of the Companies Act, 1956 i.e. Companies (Accounting Standards) Rules, 2006, as amended and to the extent applicable. Accounting policies have been consistently applied to the extent applicable and in the manner so required. Use of estimates The preparation of financial statements in conformity with generally accepted accounting principles in India (‘Indian GAAP’) requires that the Company’s management makes estimates and assumptions that affect the reported amounts of income and expenses for the year, reported balances of assets and liabilities and disclosures relating to contingent liabilities as of the date of the financial statements. The estimates and assumptions used in the accompanying financial statements are based upon management’s evaluation of the relevant facts and circumstances upto and as of the date of the financial statements. Actual results could differ from the estimates. Any revision to the accounting estimates is accounted for prospectively. 2. Revenue recognition i) Premium income Premium income from non-linked business including rider premium is accounted for when due from the policyholders and as reduced for lapsation expected based on the experience of the Company. In case of linked business, premium income is accounted for when the associated units are created. Premium on lapsed policies is accounted for as income when such policies are reinstated. Top up premium is considered as single premium. ii) Income from linked policies Income from linked policies, which includes fund management charges, policy administration charges, mortality charges and other charges, wherever applicable, is recovered from the linked funds in accordance with the terms and conditions of the insurance contracts and is accounted for as income when due. iii) Income from investments Interest income on investments is accounted for on an accrual basis. Amortisation of premium or accretion of discount computed at the time of purchase of debt securities is recognised over the remaining period of maturity/ holding on a straight line basis. Dividend income is accounted for on "ex-dividend" date in case of listed equity and preference shares
Transcript
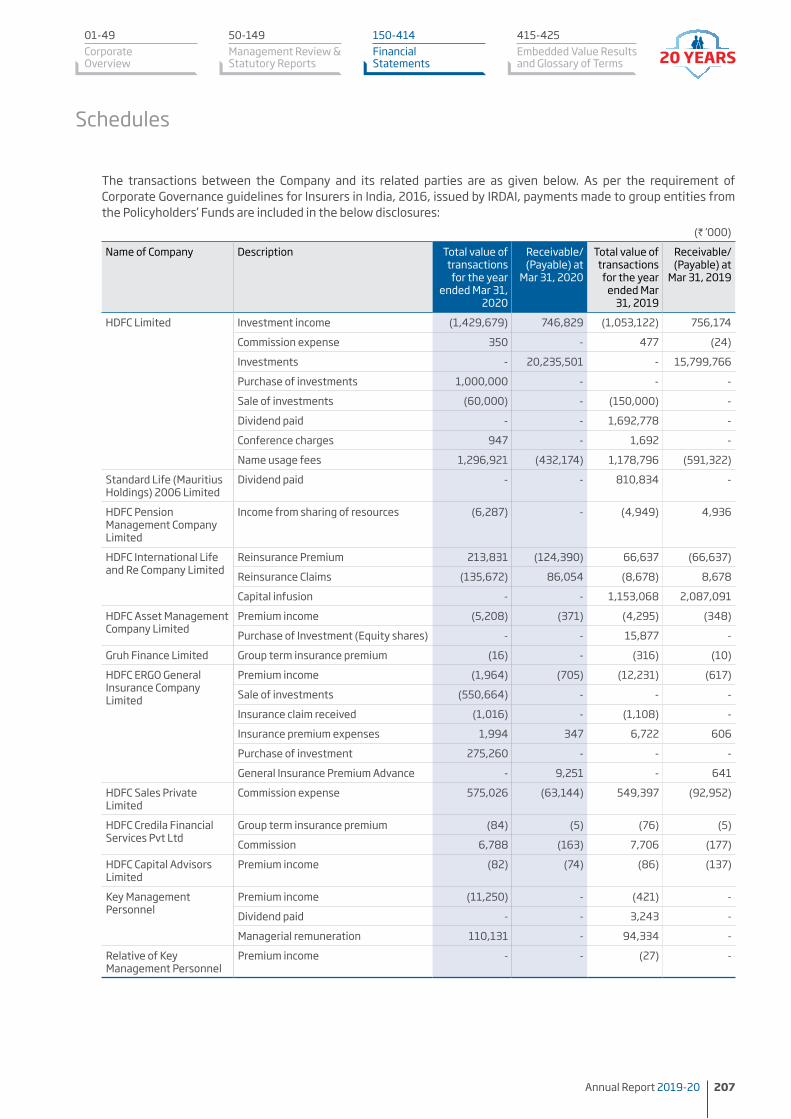
Schedules
50-149Management Review & Statutory Reports
150-414Financial Statements
415-425Embedded Value Results and Glossary of Terms
01-49Corporate Overview
Annual Report 2019-20 175
Schedule 16 - Significant Accounting Policies and Notes to the AccountsCorporate InformationHDFC Life Insurance Company Limited ('HDFC Life' or 'The Company') (Formerly HDFC Standard Life Insurance Company Limited), is formed as a joint venture between Housing Development Finance Corporation Limited ('HDFC Limited') and Standard Life Aberdeen plc.
The Company was incorporated at Mumbai on August 14, 2000 as a public limited company under the Companies Act, 1956. The Company obtained a certificate of commencement of business on October 12, 2000 and a certificate of registration from the Insurance Regulatory and Development Authority of India ('IRDAI') on October 23, 2000 for carrying on the business of life insurance. The Company offers a range of individual and group insurance solutions. The portfolio comprises of various insurance and investment products such as Protection, Pension, Savings, Investment, Annuity and Health.
The Shares of the Company are listed on National Stock Exchange of India Limited (NSE) and BSE Limited (BSE).
A. SIGNIFICANT ACCOUNTING POLICIES1. Basis of preparation These financial statements for the year ended
March, 31 (‘the period’), 2020 are prepared under the historical cost convention, on an accrual basis of accounting in accordance with the accounting principles generally accepted in India (Indian GAAP) and in the manner prescribed by the Insurance Regulatory and Development Authority (Preparation of Financial Statements and Auditor’s Report of Insurance Companies) Regulations, 2002 (‘the Financial Statements Regulations’), the Master Circular on Preparation of Financial Statements and Filing of Returns of Life Insurance Business Ref No. IRDA/F&A/Cir/232/12/2013 dated December 11, 2013 (‘the Master Circular’) and other circulars issued by the IRDAI from time to time, provisions of the Insurance Act, 1938, as amended from time to time, including amendment brought by Insurance Laws (Amendment) Act, 2015, the Insurance Regulatory and Development Authority Act, 1999 as amended from time to time, the Companies Act, 2013 and amendments and rules made thereto, as applicable and the Act, as amended from time to time, to the extent applicable. Pursuant to Section 133 of the Companies Act, 2013, read with Rule 7 of the Companies (Accounts) Rules, 2014, whereby till the accounting standards or any addendum thereto are prescribed by the Central Government in consultation and recommendation of the National Financial Reporting Authority, the existing accounting standards notified under Companies Act, 1956, shall
continue to apply. Consequently, these financial statements have been prepared also to comply in all material aspects with the accounting standards notified under Section 211 (3C), of the Companies Act, 1956 i.e. Companies (Accounting Standards) Rules, 2006, as amended and to the extent applicable. Accounting policies have been consistently applied to the extent applicable and in the manner so required.
Use of estimates The preparation of financial statements in conformity
with generally accepted accounting principles in India (‘Indian GAAP’) requires that the Company’s management makes estimates and assumptions that affect the reported amounts of income and expenses for the year, reported balances of assets and liabilities and disclosures relating to contingent liabilities as of the date of the financial statements. The estimates and assumptions used in the accompanying financial statements are based upon management’s evaluation of the relevant facts and circumstances upto and as of the date of the financial statements. Actual results could differ from the estimates. Any revision to the accounting estimates is accounted for prospectively.
2. Revenue recognitioni) Premium income Premium income from non-linked business including
rider premium is accounted for when due from the policyholders and as reduced for lapsation expected based on the experience of the Company. In case of linked business, premium income is accounted for when the associated units are created. Premium on lapsed policies is accounted for as income when such policies are reinstated. Top up premium is considered as single premium.
ii) Income from linked policies Income from linked policies, which includes fund
management charges, policy administration charges, mortality charges and other charges, wherever applicable, is recovered from the linked funds in accordance with the terms and conditions of the insurance contracts and is accounted for as income when due.
iii) Income from investments Interest income on investments is accounted for on an
accrual basis.
Amortisation of premium or accretion of discount computed at the time of purchase of debt securities is recognised over the remaining period of maturity/holding on a straight line basis.
Dividend income is accounted for on "ex-dividend" date in case of listed equity and preference shares
Schedules
176 Annual Report 2019-20
and in case of unlisted equity and preference shares, when the right to receive dividend is established.
Fees received on lending of equity shares under Securities Lending and Borrowing scheme (SLB) is recognised as income over the period of the lending on a straight-line basis.
In case of linked business, profit or loss on sale/redemption of equity shares/Equity Exchange Traded funds (ETFs), Infrastructure Investment Trusts (InvITs), Real Estate Investments Trusts (REITs), preference shares and units of mutual fund is calculated as the difference between sale proceeds/redemption proceeds net of sale expenses and the weighted average book value.
In case of other than linked business, profit or loss on sale/redemption of equity shares/equity ETFs, InvITs, REITs, preference shares, Additional Tier I Bonds and units of mutual fund includes the accumulated changes in the fair value previously recognised under “Fair Value Change Account” in the Balance Sheet.
In case of linked business, profit or loss on sale/redemption of debt securities is calculated as the difference between net sale proceeds/redemption proceeds and the weighted average book cost. In case of other than linked business, profit or loss on sale/redemption of debt securities is calculated as the difference between sales proceeds/redemption proceeds net of sale expenses and the weighted average amortised cost.
iv) Interest income on loans (Including policy loans) Interest income on loans is accounted for on an accrual
basis.
v) Interest income on policy reinstatement Interest income on policy reinstatement is accounted
for on received basis and is included in “Others” under "Other Income” in the Revenue Account.
3. Reinsurance premium ceded Reinsurance premium ceded is accounted for on due
basis in accordance with the terms and conditions of the reinsurance treaties. Profit commission on reinsurance ceded is netted off against premium ceded on reinsurance.
4. Acquisition costs Acquisition costs are the costs that vary with and
are primarily related to the acquisition of new and renewal insurance contracts and consist of costs like commission to insurance intermediaries, rewards and incentives, sales staff costs, office rent, medical
examination costs, policy printing expenses, stamp duty and other related expenses. These costs are expensed in the period in which they are incurred.
5. Benefits paid Benefits paid consist of policy benefit amounts and
claim settlement costs, where applicable.
Non-linked business Death and rider claims are accounted for on receipt of
intimation. Annuity benefits, money back and maturity claims are accounted for when due. Surrenders are accounted for on the receipt of consent from the insured to the quote provided by the Company.
Linked business Death and rider claims are accounted for on receipt
of intimation. Maturity claims are accounted for on due basis when the associated units are cancelled. Surrenders and withdrawals are accounted for on receipt of intimation when associated units are cancelled. Amount payable on lapsed/discontinued policies are accounted for on expiry of lock in period of these policies.Surrenders, withdrawals and lapsation are disclosed at net of charges recoverable.
Reinsurance claims receivable are accounted for in the period in which the concerned claims are intimated.
Repudiated claims and other claims disputed before judicial authorities are provided for on prudent basis as considered appropriate by management.
6. Investments Investments are made in accordance with the
provisions of the Insurance Act,1938, as amended from time to time including the amendment brought by the Insurance Laws (Amendment) Act, 2015, the Insurance Regulatory and Development Authority (Investment) Regulations, 2000 and amendments made thereto, the Insurance Regulatory and Development Authority of India (Investment) Regulations, 2016, wherever applicable and various other circulars/notifications/clarifications issued by the IRDAI in this context from time to time.
Investments are recognised at cost on the date of purchase, which includes brokerage and taxes, if any, but excludes interest accrued (i.e. since the previous coupon date) as on the date of purchase.
A) Classification of investments: Investments maturing within twelve months from
the Balance Sheet date and investments made with the specific intention to dispose them within twelve months from the Balance Sheet date are classified
Schedules
50-149Management Review & Statutory Reports
150-414Financial Statements
415-425Embedded Value Results and Glossary of Terms
01-49Corporate Overview
Annual Report 2019-20 177
as “short term’’ investments. Investments other than short term investments are classified as “long term” investments.
B) Valuation of investmentsI. Real estate - investment property Land or building or part of a building or both held
to earn rental income or capital appreciation or for both, if any, rather than for use in services or for administrative purposes is classified as “real estate investment property” and is valued at historical cost, subject to revaluation, if any. Revaluation of the real estate investment property is done at least once in three years. Any change in the carrying amount of the investment property is recognised in Revaluation Reserve in the Balance Sheet. Impairment loss, if any, exceeding the amount in Revaluation Reserve is recognised as an expense in the Revenue Account or the Profit and Loss Account.
II. Debt securitiesa) Non-linked business, non-unit reserve investments
and shareholders’ investments Debt securities, including Government Securities
are considered as “held to maturity” and accordingly valued at historical cost, subject to amortisation of premium or accretion of discount, if any, over the period of maturity/holding, on a straight line basis.
Money market instruments like Commercial Papers, Certificate of Deposit, Treasury Bills (T-Bills) and Tri-Party Repo (TREPS) are valued at historical cost, subject to amortisation of premium or accretion of discount over the period of maturity/holding on a straight line basis.
Investments in Venture Funds and Security Receipts are valued at cost, subject to provision for diminution, if any, in the value of such investments determined separately for each individual investment. Fixed Deposits and Reverse Repo are valued at cost.
b) Linked business Debt securities, including Government Securities
are valued at market value, using Credit Rating Information Services of India Limited (‘CRISIL’) Bond Valuer/CRISIL Gilt Prices, as applicable.
Money market instruments like Commercial Papers, Certificate of Deposits, Treasury Bills (T-Bills) and Tri-Party Repo (TREPS) are valued at historical cost, subject to amortisation of premium or accretion of discount over the period of maturity/holding on a straight line basis.
Investments in Venture Funds and Security Receipts are valued at the latest available net asset values of the respective underlying funds. Fixed Deposits and investment in Reverse Repo are valued at cost.
Unrealised gains or losses arising on valuation of debt securities including Government Securities are accounted for in the Revenue Account.
Securities with call options are valued at the lower of the values as obtained by valuing the security to the final maturity date or to the call option date by using the benchmark rate based on the matrix released by CRISIL on daily basis. In case there are multiple call options, the security is valued at the lowest value obtained by valuing the security to the various call dates or to the final maturity date. Securities with put options are valued at the higher of the value as obtained by valuing the security to the final maturity date or to the put option date by using the benchmark rate based on the matrix released by CRISIL on daily basis. In case there are multiple put options, the security is valued at the highest value obtained by valuing the security to the various put option dates or to the final maturity date.
Securities with both put and call options on the same day are deemed to mature on the put and call option day and would be valued on a yield to maturity basis, by using the benchmark rate based on the matrix released by CRISIL on daily basis.
III. Equity shares, Equity Exchange Traded Funds (ETFs), Infrastructure Investment Trusts (InvITs), Real Estate Investment Trusts (REITs) and Additional Tier I Bonds (AT1 Bonds)
a) Non-linked business, non-unit reserve investments and shareholders’ investments
Listed equity shares, equity ETFs, InvITs and REITs are valued at fair value, being the last quoted closing price on the Primary Exchange i.e. National Stock Exchange (NSE) at the Balance Sheet date. In case, the equity shares and equity ETFs, InvITs and REITs are not traded on the Primary Exchange on the Balance Sheet date, the closing price on the Secondary Exchange i.e. Bombay Stock Exchange (BSE) are considered.
If the equity shares are not traded either on the Primary or the Secondary Exchange on the Balance Sheet date, then the price at which the equity shares are traded on the Primary or the Secondary Exchange, as the case may be, on the earliest previous day is considered for valuation, provided such previous day price is not more than 30 days prior to the Balance Sheet date.
Schedules
178 Annual Report 2019-20
Equity shares lent under the Securities Lending and Borrowing scheme (SLB) continue to be recognised in the Balance Sheet as the Company retains all the associated risks and rewards of these securities.
In case the equity ETFs, InvITs and REITs are not traded either on the Primary or the Secondary Exchange on the Balance Sheet date, then the equity ETFs and REITs are valued at the latest available Net Asset Value (NAV). In case of InvITs and REITs where the market quote is not available for the last 30 days, the InvITs and REITs shall be valued at the latest NAV (not more than 6 months old) as published by the Infrastructure Investment Trust /Real Estate Trusts.The AT1 Bonds are valued at market value, using applicable market yields published by Securities and Exchange Board of India (SEBI) registered rating agency Credit Rating Information Services of India Limited (‘CRISIL’), using Bond Valuer.
Unrealised gains or losses arising due to changes in fair value are recognised under the head ‘Fair Value Change Account’ in the Balance Sheet.
Unlisted equity shares and listed equity shares that are not regularly traded in active markets and which are classified as “thinly traded” as per the guidelines governing Mutual Funds for valuation of thinly traded securities laid down by Securities Exchange Board of India (SEBI) are valued at historical cost, subject to provision for diminution, if any, in the value of such investments determined separately for each individual investment.
Listed equity ETFs that are not regularly traded in the active markets and which are classified as “thinly traded” as per the guidelines governing Mutual Funds for valuation of thinly traded securities laid down by SEBI, are valued at the latest available NAV.
Bonus entitlements are recognised as investments on the ‘ex-bonus date’. Right entitlements are accrued and recognised on the date the original share (on which the right entitlement accrues) are traded on the stock exchange on an ‘ex-rights date’.
b) Linked business Listed equity shares, equity ETFs, Infrastructure
Investment Trusts (InvITs) and Real Estate Investment Trusts (REITs are valued and stated at fair value, being the last quoted closing price on the Primary Exchange i.e. the NSE at the Balance Sheet date. In case, the equity shares, equity ETFs, InvITs and REITs are not traded on the Primary Exchange on the Balance Sheet date, the closing price on the Secondary Exchange i.e. the BSE are considered.
If equity shares are not traded either on the Primary or the Secondary Exchange on the Balance Sheet date, then the price at which the equity shares are traded on the Primary or the Secondary Exchange, as the case may be, on the earliest previous day is considered for valuation, provided such previous day price is not more than 30 days prior to the Balance Sheet date.
Equity shares lent under the Securities Lending and Borrowing scheme (SLB) continue to be recognised in the Balance Sheet as the Company retains all the associated risks and rewards of these securities.
In case the equity ETFs,InvITs and REITs are not traded either on the Primary or the Secondary Exchange on the Balance Sheet date, then the equity ETFs are valued at the latest available NAV. In case of InvITs and REITs where the market quote is not available for the last 30 days, the InvITs shall be valued at the latest NAV (not more than 6 months old) as published by the Infrastructure Investment Trust/Real Estate Trusts.
Unrealised gains or losses arising on such valuations are accounted for in the Revenue Account.
Listed equity shares that are not regularly traded in active markets and which are classified as “thinly traded” as per the guidelines governing Mutual Funds for valuation of thinly traded securities laid down by SEBI, are valued at historical cost, subject to provision for diminution, if any, in the value of such investment determined separately for each individual investment.
Listed equity ETFs,InvITs and REITs that are not regularly traded in the active markets and which are classified as “thinly traded” as per the guidelines governing Mutual Funds for valuation of thinly traded securities laid down by SEBI, are valued at the latest available NAV.
Bonus entitlements are recognised as investments on the ‘ex-bonus date’. Right entitlements are accrued and recognised on the date the original shares (on which the right entitlement accrues) are traded on the stock exchange on the ‘ex-rights date’.
IV. Preference Sharesa) Non-linked business, non-unit reserve investments
and shareholders’ investments Redeemable preference shares are considered as
“held to maturity” and accordingly valued at historical cost, subject to amortisation of premium or accretion of discount.
Listed preference shares other than redeemable preference shares are valued at fair value, being the
Schedules
50-149Management Review & Statutory Reports
150-414Financial Statements
415-425Embedded Value Results and Glossary of Terms
01-49Corporate Overview
Annual Report 2019-20 179
last quoted closing price on the Primary Exchange i.e. National Stock Exchange (NSE) at the Balance Sheet date. In case, the preference shares are not traded on the Primary Exchange on the Balance Sheet date, the closing price on the Secondary Exchange i.e. Bombay Stock Exchange (BSE) are considered.
If preference shares are not traded either on the Primary or the Secondary Exchange on the Balance Sheet date, then the price at which the preference shares are traded on the Primary or the Secondary Exchange, as the case may be, on the earliest previous day is considered for valuation, provided such previous day price is not more than 30 days prior to the Balance Sheet date.
Unrealised gains or losses arising due to changes in fair value are recognised under the head ‘Fair Value Change Account’ in the Balance Sheet.
Unlisted preference shares (other than redeemable preference shares) and listed preference (other than redeemable preference) shares that are not regularly traded in active markets and which are classified as “thinly traded” as per the guidelines governing Mutual Funds for valuation of thinly traded securities laid down by Securities Exchange Board of India (SEBI) are valued at historical cost, subject to provision for diminution in the value, if any, of such investments determined separately for each individual investment.
b) Linked business Listed preference shares are valued and stated at
fair value, being the last quoted closing price on the Primary Exchange i.e. the NSE at the Balance Sheet date. In case, the preference shares are not traded on the Primary Exchange on the Balance Sheet date, the closing price on the Secondary Exchange i.e. the BSE are considered.
If preference shares are not traded either on the Primary or the Secondary Exchange on the Balance Sheet date, then the price at which the preference shares are traded on the Primary or the Secondary Exchange, as the case may be, on the earliest previous day is considered for valuation, provided such previous day price is not more than 30 days prior to the Balance Sheet date.
Unrealised gains or losses arising on such valuations are accounted for in the Revenue Account.
Listed preference shares that are not regularly traded in active markets and which are classified as “thinly traded” as per the guidelines governing Mutual Funds for valuation of thinly traded securities laid down by
SEBI, are valued at historical cost, subject to provision for diminution in the value, if any, of such investment determined separately for each individual investment.
V. Mutual fundsa) Non-linked business, non-unit reserve investments
and shareholders’ investments Mutual fund units held at the Balance Sheet date are
valued at previous business day’s Net Asset Value (NAV) per unit. Unrealised gains or losses arising due to changes in the fair value of mutual fund units are recognised under the head ‘Fair Value Change Account’ in the Balance Sheet.
b) Linked business Mutual fund units held at the Balance Sheet date
are valued at previous business day’s NAV per unit. Unrealised gains or losses arising due to change in the fair value of mutual fund units are recognised in the Revenue Account.
VI. Interest Rate Derivatives Interest rate derivative (IRD) contracts for hedging of
highly probable forecasted transactions on insurance contracts and investment cash flows in life, pension and annuity business, are accounted for in the manner specified in accordance with ‘Guidance Note on Accounting for Derivative Contracts’ issued by the Institute of Chartered Accountants of India (ICAI) in June 2015 effective from FY 2016-17, IRDAI circular no. IRDA/F&I/INV/CIR/138/06/2014 dated June 11, 2014 (‘the IRDAI circular on Interest Rate Derivatives’) and IRDAI Investment Master Circular issued in May 2017.
At the inception of the hedge, the Company documents the relationship between the hedging instrument and the hedged item, the risk management objective, strategy for undertaking the hedge and the methods used to assess the hedge effectiveness. Hedge effectiveness is the degree to which changes in the fair value or cash flows of the hedged item that are attributable to a hedged risk are offset by changes in the fair value or cash flows of the hedging instrument. Hedge effectiveness is ascertained at the time of inception of the hedge and periodically thereafter at Balance Sheet date.
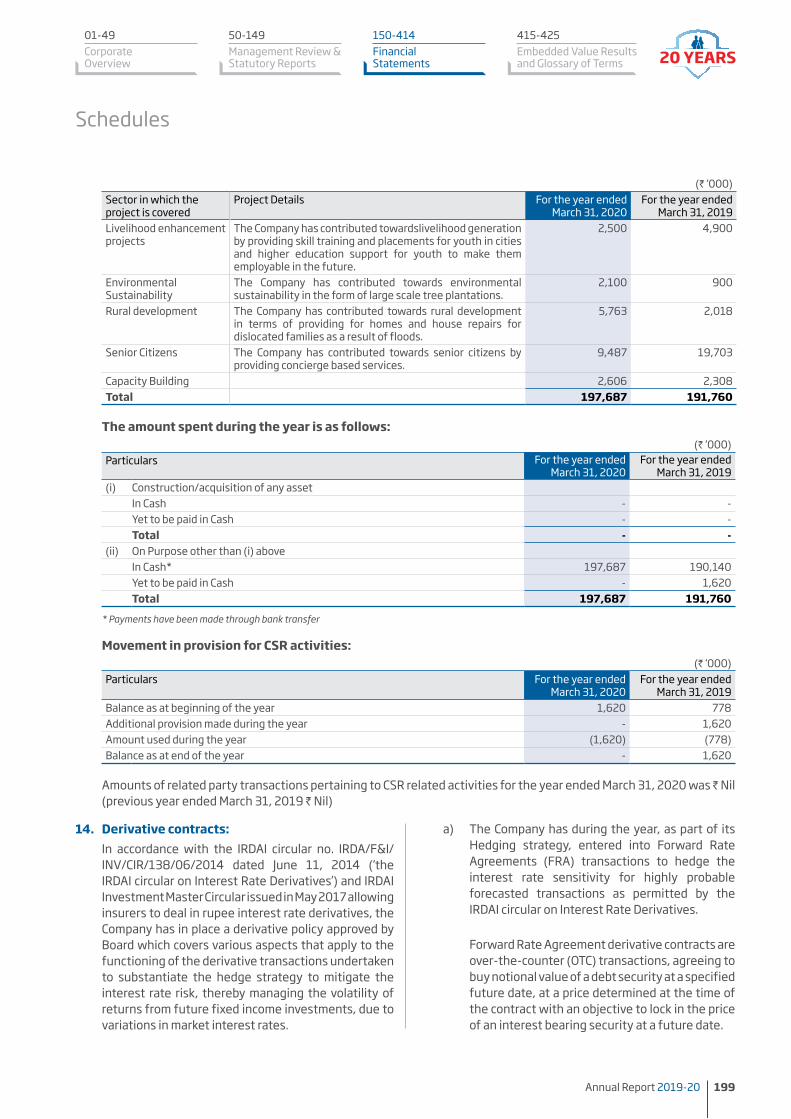
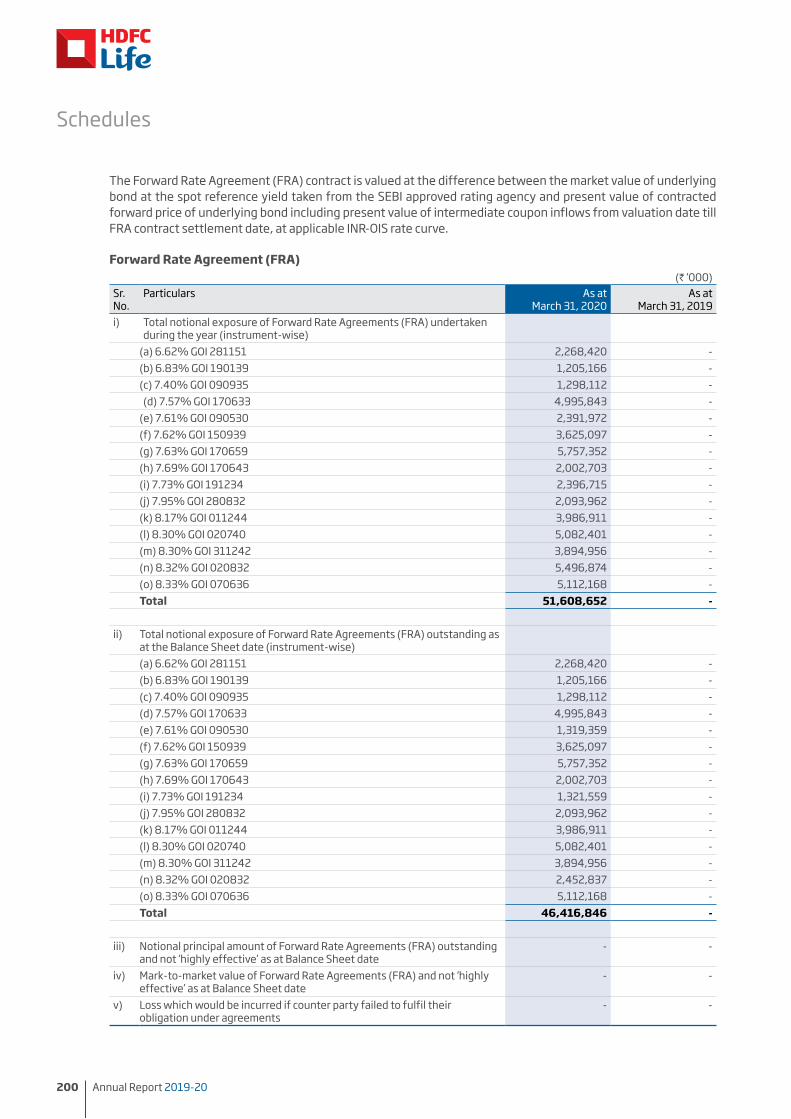
The Forward Rate Agreement (FRA) contract is valued at the difference between the market value of underlying bond at the spot reference yield taken from the SEBI approved rating agency and present value of contracted forward price of underlying bond including present value of intermediate coupon inflows from valuation date till FRA contract settlement date, at applicable INR-OIS rate curve.
Schedules
180 Annual Report 2019-20
The portion of fair value gain/loss on the IRD that is determined to be an effective hedge is recognised directly in appropriate equity account i.e. ‘Hedge Reserve’ under the head ‘Credit/(Debit) Fair Value Change Account’’ in the Balance Sheet and the portion of IRD fair value gain/loss that gets determined as ineffective hedge or ineffective portion of effective hedge, basis the hedge effectiveness assessment is recognized in the Revenue Account.
The accumulated gains or losses that were recognised directly in the Hedge Reserve are reclassified into Revenue Account, in the same period during which the income from hedged forecasted cash flows affect the Revenue Account (such as in the periods that income on the investments acquired from underlying forecasted cashflow is recognized in the Revenue Account). In the event that all or any portion of loss or gain, recognised directly in the Hedge Reserve is not expected to be recovered in future periods, the amount that is not expected to be recovered is reclassified to the Revenue Account. Gains or losses arising from hedge ineffectiveness, if any, are recognised in the Revenue Account. Costs associated with derivative contracts are considered as at a point in time cost.
C) Impairment of investments The Company periodically assesses at each Balance
Sheet date, whether there is any indication of impairment of investments or reversal of impairment loss earlier recognised. An impairment loss is accounted for as an expense and disclosed under the head ‘Provision for diminution in the value of investment (net)’ in the Revenue Account or the Profit and Loss Account to the extent of the difference between the remeasured fair value of the investments and its weighted acquisition cost as reduced by any earlier impairment loss accounted for as an expense in the Revenue Account or the Profit and Loss Account.
Any reversal of impairment loss, earlier recognised for in the Revenue Account or the Profit and Loss Account, is accounted in the Revenue Account or the Profit and Loss Account respectively.
D) Provision for Non Performing Assets (NPA) All assets where the interest and/or instalment of
principal repayment remain overdue for more than 90 days at the Balance Sheet date are classified as NPA and provided for in the manner required by the IRDAI regulations on this behalf.
E) Transfer of investments from Shareholders’ fund to Policyholders’ fund
Transfers of investments, other than debt securities, as and when made from the Shareholders’ fund to
the Policyholders’ fund to meet the deficit in the Policyholders’ account are made at the cost price or market price, whichever is lower.
Transfers of debt securities, from the Shareholders’ fund to the Policyholders’ fund are made at the net amortised cost or the market value, whichever is lower.
F) Transfer of investments between non-linked Policyholders’ funds
No transfers of investments are made between non-linked Policyholders’ funds.
G) Purchase and sale transactions between unit linked funds
The purchase and sale of equity, preference shares, ETF’s, InvIT’s, REITs and Government Securities between unit linked funds is accounted for at the prevailing market price on the date of purchase or sale of investments, if prevailing market price of any security is not available on the date of transfer of investment, then the last available price is considered.
In case of debt securities other than Government Securities, transfer of investments is accounted at previous day valuation price w.e.f. January 1 2017 (applicable date of IRDAI (Investment) Regulations, 2016). Prior to this, such transfers were accounted at prevailing market price on the date of purchase or sale of investments and if prevailing market price of any security was not available on the date of transfer of investment, then the last available price was considered.
7. Policy liabilities The actuarial liabilities, for all inforce policies and
policies where premiums are discontinued but a liability exists as at the valuation date, are calculated in accordance with the generally accepted actuarial principles and practices, requirements of Insurance Act, 1938 as amended from time to time including amendment brought by the Insurance Laws (Amendment) Act, 2015, regulations notified by the IRDAI and Actuarial Practice Standard (APS) issued by the Institute of Actuaries of India with the concurrence of the IRDAI.
The specific principles adopted for the valuation of policy liabilities are set out as per the IRDA (Assets, Liabilities and Solvency Margin of Life Insurance Business) Regulations, 2016 and the APS2 & APS7 issued by the Institute of Actuaries of India.
A brief of the methodology used for various lines of business is as given below:
1. The policy liabilities are valued on policy by policy basis, i.e. each policy is valued separately.
Schedules
50-149Management Review & Statutory Reports
150-414Financial Statements
415-425Embedded Value Results and Glossary of Terms
01-49Corporate Overview
Annual Report 2019-20 181
2. The reserves for linked business (individual and group) comprise unit reserves and non-unit reserves. The unit reserves are determined on the basis of NAV of the units outstanding as at the valuation date and non-unit reserves are calculated using gross premium valuation method.
3. The liabilities for individual non-linked non-participating and participating business are calculated using gross premium valuation method and are subject to the minimum floor of surrender value. Additionally, individual non-linked participating policies also have a reference to the asset share of policies at valuation date.
4. The liabilities for one year renewable group protection business are calculated on the unexpired risk premium basis. For other than one year renewable group protection business, the liabilities are calculated using gross premium valuation method.
5. The liabilities for the group non-linked savings products are determined as the higher of policy account balances (including accrued interest/bonuses) and reserves calculated by gross premium valuation method.
6. The liabilities in respect of rider benefits are determined as the higher of unexpired premium reserves and reserves calculated by gross premium valuation method.
7. Additional reserves are determined to:
a. allow for the claims that may have occurred already but not yet reported (Incurred But Not Reported)
b. allow for the servicing of existing policies if the Company were to close the new business one year from the valuation date (Closure to New Business)
c. meet the expected liabilities that would arise on the revival of lapsed policies, on the basis of the proportion of the policies expected to be revived based on the revival experience of the Company (Revival Reserve)
d. allow for the additional amount required to be paid on account of cancellation of policies due to look in, on the basis of the proportion of the policies expected to exercise the look-in option based on the experience of the Company (Look-in Reserve)
e. allow for the cost of guarantees, wherever applicable
8. Funds for Future Appropriations The Funds for Future Appropriations (FFA), in the
participating segment, represents the surplus, which is not allocated to policyholders or shareholders as at the Balance Sheet date. Transfers to and from the fund reflect the excess or deficit of income over expenses respectively and appropriations in each accounting period arising in the Company’s Policyholders’ Fund. Any allocation to the par policyholders would also give rise to a transfer to Shareholders’ Profit and Loss Account in the required proportion.
9. Unclaimed amount of policyholders: Assets held for unclaimed amount of policyholders
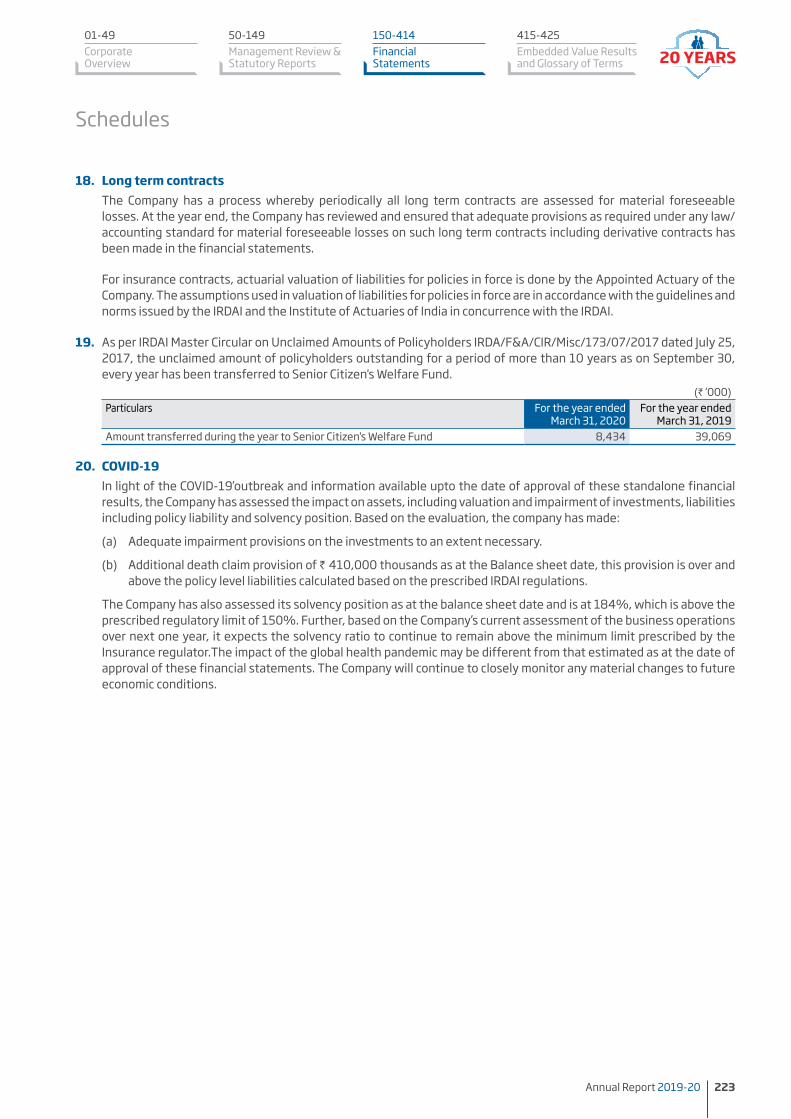
is created and maintained in accordance with the requirement of IRDAI circular No, IRDA/F&A/CIR/GLD/195/08/124 dated August 14, 2014, IRDA/F&A/CIR/CPM/134/07/2015 dated July 24, 2015, IRDA/F&A/CIR/CLD/114/05/2015 dated May 28, 2015, Master circular on Unclaimed Amount of Policyholders IRDA/F&A/CIR/Misc/173/07/2017 dated July 25, 2017 and Investment Regulations, 2016 as amended from time to time:
a) Unclaimed amount of policyholders is invested in money market instruments, Liquid mutual funds and / or fixed deposits of scheduled banks which is valued at historical cost, subject to amortisation of premium or accretion of discount over the period of maturity/holding on a straight line basis. Such assets of unclaimed amount of policyholders is disclosed in Schedule 12 “Advances and Other Assets” in Balance Sheet with corresponding income being shown under “Income on Unclaimed amount of Policyholders” under “Other Income” in Revenue Account.
b) Income on unclaimed amount of policyholders is accreted to respective unclaimed fund and is accounted for on an accrual basis, net of fund management charges and is disclosed under the head “Interest on unclaimed amount of policyholders” in Schedule 4 “Benefits paid” in Revenue Account.
c) Unclaimed amount of policyholders liability is determined on the basis of NAV of the units outstanding as at the valuation date and is disclosed in Schedule 13 “Current Liabilities” in Balance Sheet.
d) Amounts remaining unclaimed for a period of 10 years along with all respective accretions to the fund are deposited into the Senior Citizen Welfare Fund (SCWF) as per requirement of IRDAI regulations.
Schedules
182 Annual Report 2019-20
10. Fixed assets and depreciation/amortisation The fixed assets are stated at cost less accumulated
depreciation and impairment, if any. Cost includes the purchase price and any cost directly attributable to bring the asset to its working condition for its intended use. Fixed assets individually costing less than ` 5,000, being low value assets are fully depreciated in the month of purchase. Subsequent expenditure incurred on existing fixed assets is expensed out except where such expenditure increases the future economic benefits from the existing assets. Any additions to the original fixed assets are depreciated over the remaining useful life of the original asset.
Cost of assets as at the Balance Sheet date not ready for its intended use as at such date are disclosed as capital work in progress. Advances given towards acquisition of fixed assets are disclosed in ‘Advance and other assets’ in Balance Sheet.
Depreciation/amortisation is charged on pro-rata basis from the month in which the asset is put to use and in case of asset sold, up to the previous month of sale. In respect of expenditure incurred on acquisition of fixed assets in foreign exchange, the net gain or loss arising on conversion/settlement is recognised in the Revenue Account.
Tangible assets The Company has adopted straight line method of
depreciation so as to depreciate the cost of following type of assets over the useful life of these respective assets which are as follows:
Asset class Useful life of assets (years)
Building 60Information technology equipment-End user devices^
3
Information technology equipment-Servers and network*^
4
Furniture & Fixtures*^ 5 Motor Vehicles*^ 4 Office Equipment^ 5
* For these class of assets, based on internal and/or external assessment/ technical evaluation carried out by the management, the management believes that the useful lives as mentioned above best represent the useful life of these respective assets, however these are lower than as prescribed under Part C of Schedule II of the Companies Act, 2013.
For these class of assets, based on internal assessment carried out by the management, the residual value at the end of life being very negligible is considered to be nil.
Leasehold improvements are depreciated over the lock in period of the leased premises subject to a maximum of five years.
Intangible assets Intangible assets comprising of computer software
are stated at cost of acquisition, including any cost attributable for bringing the same to its working condition for its intended use, less accumulated amortisation and impairment, if any. These are amortised over the useful life of the software subject to a maximum of four years. Subsequent expenditure incurred on existing assets is expensed out except where such expenditure increases the future economic benefits from the existing assets, in which case the expenditure is amortised over the remaining useful life of the original asset.
Any expenditure for support and maintenance of the computer software is charged to the Revenue Account.
11. Impairment of assets The Company periodically assesses, using internal
and external sources of information and indicators, whether there is any indication of impairment of asset. If any such indication of impairment exists, the recoverable amount of such assets is estimated. An impairment loss is recognised where the carrying value of these assets exceeds its recoverable amount. The recoverable amount is the higher of the asset’s net selling price and their value in use, which is the present value of the future cash flows expected to arise from the continuing use of asset and its ultimate disposal. When there is an indication that an impairment loss recognised for an asset in earlier accounting periods is no longer necessary or may have decreased, such reversal of impairment loss is recognised, except in case of revalued assets.
12. Loans Loans are valued at historical cost (less repayments),
subject to adjustment for accumulated impairment losses and provision for NPA, if any.
13. Foreign currency transactions In accordance with the requirements of Accounting
Standard (AS) 11, “The Effects of Changes in Foreign Exchange Rates”, transactions in foreign currency are recorded in Indian Rupees at the rate of exchange prevailing on the date of the transaction, at the time of initial recognition. Monetary items denominated in foreign currency are converted in Indian Rupees at the closing rate of exchange prevailing on the Balance
Schedules
50-149Management Review & Statutory Reports
150-414Financial Statements
415-425Embedded Value Results and Glossary of Terms
01-49Corporate Overview
Annual Report 2019-20 183
Sheet date. Non-monetary items like fixed assets, which are recorded at historical cost, denominated in foreign currency, are reported using the closing exchange rate at the date of transaction. Non-monetary items other than fixed assets, which are recognised at fair value or other similar valuation, are reported using exchange rates that existed when the values were determined.
Exchange gains or losses arising on such conversions or on settlement are recognised in the period in which they arise either in the Revenue Account or the Profit and Loss Account, as the case may be.
14. Segmental reporting Identification of segments As per Accounting Standard (AS) 17 on “Segment
Reporting”, read with the Financial Statements Regulations, the Company has prepared the Revenue Account and the Balance Sheet for the primary business segments namely Participating Life (Individual & Group), Participating Pension (Individual & Group), Participating Pension Group Variable, Non Participating Life (Individual & Group), Non Participating Pension (Individual & Group), Non Participating Life Group Variable, Non Participating Pension Group Variable, Non Participating –Individual & Group Annuity, Non Participating –Individual & Group Health, Unit Linked - Individual Life, Unit Linked - Individual Pension, Unit Linked - Group Life, Unit Linked - Group Pension. Since the business operations of the Company are given effect to in India and all the policies are written in India only, this is considered as one geographical segment.
Allocation / Apportionment methodology The allocation of revenue, expenses, assets and
liabilities to the business segments is done on the following basis:
a) Revenue, expenses, assets and liabilities, which are directly attributable and identifiable to the respective business segments, are directly allocated for in that respective segment; and
b) Revenue, expenses which are not directly identifiable to a business segment though attributable, other indirect expenses, assets and liabilities which are not attributable to a business segment, are apportioned based on one or combination of some of the following parameters, as considered appropriate by the management in adherence with the policy approved by the board of directors :
i) effective premium income
ii) number of policies
iii) number of employees
iv) man hours utilised
v) premium income
vi) commission
vii) sum assured
viii) mean fund size
ix) operating expenses
x) benefits paid
The accounting policies used in segmental reporting are the same as those used in the preparation of the financial statements.
15. Employee benefits A) Short term employee benefits All employee benefits payable within twelve months
of rendering the service are classified as short term employee benefits. Benefits such as salaries and bonuses, short term compensated absences, premium for staff medical insurance (hospitalisation), premium for Employee Group Term Insurance Scheme, Employee State Insurance Corporation Scheme, Employee Deposit Linked Insurance Scheme and Employee Labour Welfare Fund Scheme are accounted for in the period in which the employee renders the related service. All short term employee benefits are accounted for on an undiscounted basis.
B) Post-employment benefits The Company has both defined contribution and
defined benefit plans.
(i) Defined contribution plans: The Superannuation Scheme, Employee
Provident Fund Scheme (Company contribution) and the National Pension Scheme (Company contribution) are the defined contribution plans. The contributions paid/payable under the plan are made when due and charged to the Revenue Account on an undiscounted basis during the period in which the employee renders the related service. The Company does not have any further obligation beyond the contributions made to the funds.
(ii) Defined benefit plans: The Gratuity plan of the Company is the defined
benefit plan, which is a funded plan. The gratuity benefit payable to the employees of the Company is in compliance with the provisions of ‘The Payment of Gratuity Act, 1972”. The
Schedules
184 Annual Report 2019-20
present value of the obligations under such defined benefit plan is determined on the basis of actuarial valuation using the projected unit credit method, which considers each period of service as giving rise to an additional unit of benefit entitlement and measures each unit separately to build up the final obligation. The discount rate used for actuarial valuation is based on the yield of Government Securities. The Company fully contributes the net ascertained liabilities under the plan to the HDFC Life Insurance Company Limited Employees Group Gratuity Plan. The Company recognises the net defined benefit obligation of the gratuity plan, taking into consideration the defined benefit obligation using actuarial valuation and the fair value of plan assets at the Balance Sheet date, in accordance with Accounting Standard (AS) 15 (Revised), ‘Employee Benefits’. Actuarial gains or losses, if any, due to experience adjustments and the effects of changes in actuarial assumptions are accounted for in the Revenue Account, in the period in which they arise.
C) Other long term employee benefits Other long term employee benefits include
accumulated long term compensated absences and long term incentive plans.
Accumulated long term compensated absences are entitled to be carried forward for future encashment or availment, at the option of the employee subject to Company’s policies and are accounted for based on actuarial valuation determined using the projected unit credit method.
Long term incentive plans are subject to fulfilment of criteria prescribed by the Company and are accounted for at the present value of future expected benefits payable using an appropriate discount rate.
Actuarial gains or losses, if any, due to experience adjustments and the effects of changes in actuarial assumptions are accounted for in the Revenue Account, as the case may be, in the period in which they arise.
16. Employee Stock Option Scheme(ESOS) The Company has formulated Employee Stock
Option Scheme 2005 (ESOS 2005), Employee Stock Option Scheme 2010 (ESOS 2010), Employee Stock Option Scheme 2011 (ESOS 2011), Employee Stock Option Scheme 2012 (ESOS 2012) and, ESOS (Trust) 2017 which are administered through the HDFC Life Employees Stock Option Trust (''the Trust)
and Employee Stock Option Scheme 2014 (ESOS 2014), Employees Stock Option Scheme (ESOS 2015), Employee Stock Option Scheme 2016 (ESOS 2016), Employee Stock Option Scheme 2017 (ESOS 2017), Employees Stock Option Scheme 2018 (ESOS 2018) and Employees Stock Option Scheme 2019 (ESOS 2019) which are directly administered by the Company. The schemes provide that eligible employees are granted options that vest in a graded manner to acquire equity shares of the Company. The options are accounted for on an intrinsic value basis in accordance with the Guidance Note on Accounting for Employee Share based Payments, issued by the Institute of Chartered Accountants of India (ICAI). The intrinsic value is the amount by which the fair value of the underlying share exceeds the exercise price of an option on the grant date.For all grants issued up to ESOS 2016, the fair value of the underlying share is as determined by an independent valuer. The fair market price in case of all grants issued after ESOS 2016 is the latest closing price, immediately prior to the grant date, on the stock exchange on which the shares of the Company are listed. If the shares are listed on more than one stock exchange, then the stock exchange which records the highest trading volume on the date, immediately prior to the grant date is considered. The intrinsic value of options, if any, at the grant date is amortised over the vesting period.
17. Provisions, contingent liabilities and contingent assets
Provisions are accounted for in respect of present obligations arising out of past events where it is probable that an outflow of resources will be required to settle the obligation and the amounts of which can be reliably estimated. Provisions are determined on the basis of best estimate of the outflow of economic benefits required to settle the obligation at the Balance Sheet date. Where no reliable estimate can be made, a disclosure is made as contingent liability.
Contingent liabilities are disclosed in respect of;
a) possible obligations arising out of past events, but their existence or otherwise would be confirmed by the occurrence or non-occurrence of one or more uncertain future events not wholly within the control of the Company or
b) present obligations that arise from past events, where it is probable but not likely that an outflow of resources embodying economic benefits will be required to settle the obligations or a reliable estimate of the amounts of the obligations cannot be made.
Schedules
50-149Management Review & Statutory Reports
150-414Financial Statements
415-425Embedded Value Results and Glossary of Terms
01-49Corporate Overview
Annual Report 2019-20 185
Where there is a possible obligation or a present obligation where the likelihood of outflow of resources is remote, no provision is recognised nor disclosure is made.
Contingent assets are neither accounted for nor disclosed.
18. LeasesA) Finance leases Leases under which the lessee assumes substantially
all the risk and rewards of ownership of the asset are classified as finance leases. Such leased asset acquired are capitalised at fair value of the asset or present value of the minimum lease rental payments at the inception of the lease, whichever is lower.
B) Operating leases Leases where the lessor effectively retains
substantially all the risk and the benefits of ownership over the lease term are classified as operating leases. Leased rental payments under operating leases including committed increase in rentals are accounted for as an expense, on a straight line basis, over the non-cancellable lease period.
19. Taxation: A) Direct tax I) Provision for income tax Provision for income tax is made in accordance
with the provisions of Section 44 of the Income Tax Act, 1961 read with Rules contained in the First Schedule and other relevant provisions of the Income Tax Act, 1961 as applicable to a company carrying on life insurance business.
II) Deferred tax In accordance with the provisions of the
Accounting Standard (AS) 22, “Accounting for Taxes on Income”, with respect to the carry forward of losses under the Income Tax regulations, the deferred tax asset is recognised
only to the extent that there is a virtual certainty supported by convincing evidence that future taxable income will be available against which the deferred tax asset can be realised.
B) Indirect tax The Company claims credit of Goods and Services Tax
on input services, which is set off against Goods and Services Tax on output services. Unutilised credits, if any, are carried forward under “Advances and other assets” for future set off and are deferred for recognition to the extent there is reasonable certainty that the assets can be realised in future.
20. Earnings per share In accordance with the requirement of Accounting
Standard (AS) 20, “Earnings Per Share”, basic earnings per share is calculated by dividing the net profit or loss for the year attributable to equity shareholders by the weighted average number of equity shares outstanding during the period. For the purpose of calculating diluted earnings per share, the net profit or loss for the year attributable to equity shareholders and the weighted average number of shares outstanding during the period are adjusted for the effects of all dilutive potential equity shares. Potential equity shares are treated as dilutive only if their conversion to equity shares would decrease the net profit per share from continuing ordinary operations.
21. Cash and cash equivalents Cash and cash equivalents for the purposes of Receipts
and Payments Account comprise of cash and cheques in hand, bank balances, fixed deposits with original maturity of three months or less, Reverse Repo, highly liquid mutual funds and highly liquid investments that are readily convertible into measurable amounts of cash and which are subject to insignificant risk of change in value. Receipts and Payments Account is prepared and reported using the Direct Method in accordance with Accounting Standard (AS) 3, “Cash Flow Statements” as per requirements of Para 2.2 of the Master Circular.
Schedules
186 Annual Report 2019-20
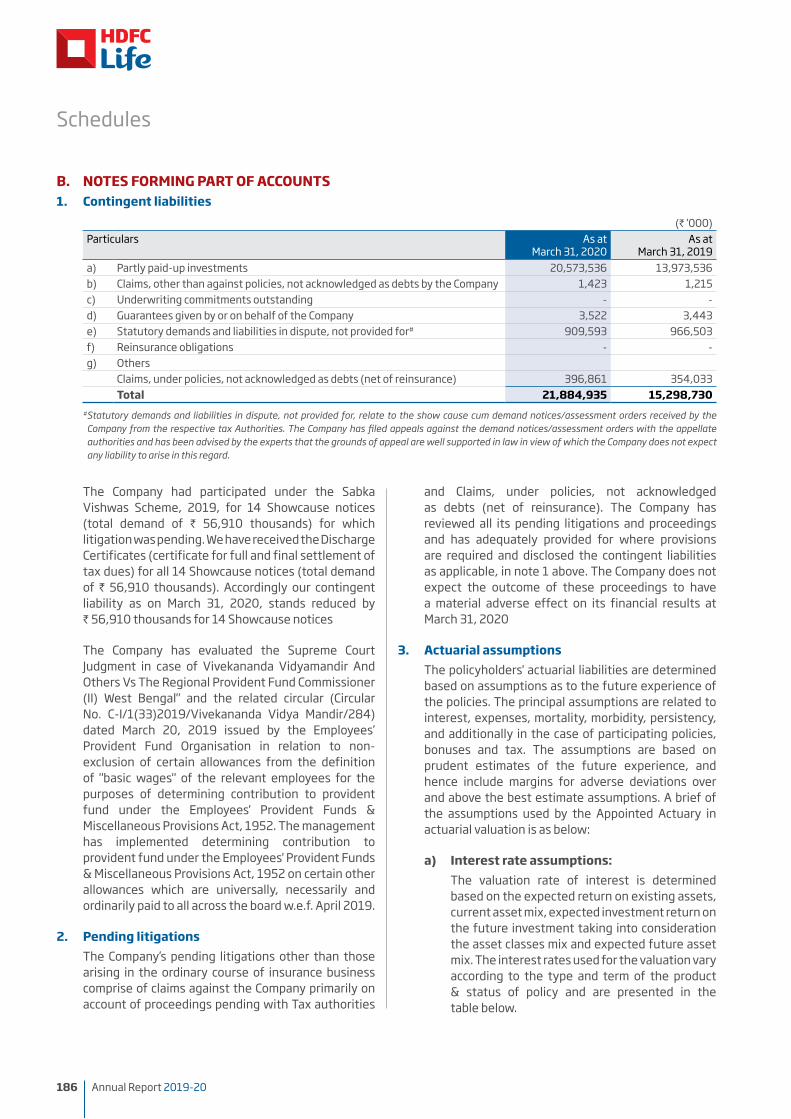
B. NOTES FORMING PART OF ACCOUNTS1. Contingent liabilities
(` ‘000)Particulars As at
March 31, 2020As at
March 31, 2019a) Partly paid-up investments 20,573,536 13,973,536 b) Claims, other than against policies, not acknowledged as debts by the Company 1,423 1,215 c) Underwriting commitments outstanding - - d) Guarantees given by or on behalf of the Company 3,522 3,443 e) Statutory demands and liabilities in dispute, not provided for# 909,593 966,503 f) Reinsurance obligations - - g) Others
Claims, under policies, not acknowledged as debts (net of reinsurance) 396,861 354,033 Total 21,884,935 15,298,730
# Statutory demands and liabilities in dispute, not provided for, relate to the show cause cum demand notices/assessment orders received by the Company from the respective tax Authorities. The Company has filed appeals against the demand notices/assessment orders with the appellate authorities and has been advised by the experts that the grounds of appeal are well supported in law in view of which the Company does not expect any liability to arise in this regard.
The Company had participated under the Sabka Vishwas Scheme, 2019, for 14 Showcause notices (total demand of ` 56,910 thousands) for which litigation was pending. We have received the Discharge Certificates (certificate for full and final settlement of tax dues) for all 14 Showcause notices (total demand of ` 56,910 thousands). Accordingly our contingent liability as on March 31, 2020, stands reduced by ` 56,910 thousands for 14 Showcause notices
The Company has evaluated the Supreme Court Judgment in case of Vivekananda Vidyamandir And Others Vs The Regional Provident Fund Commissioner (II) West Bengal" and the related circular (Circular No. C-I/1(33)2019/Vivekananda Vidya Mandir/284) dated March 20, 2019 issued by the Employees’ Provident Fund Organisation in relation to non-exclusion of certain allowances from the definition of "basic wages" of the relevant employees for the purposes of determining contribution to provident fund under the Employees' Provident Funds & Miscellaneous Provisions Act, 1952. The management has implemented determining contribution to provident fund under the Employees' Provident Funds & Miscellaneous Provisions Act, 1952 on certain other allowances which are universally, necessarily and ordinarily paid to all across the board w.e.f. April 2019.
2. Pending litigations The Company’s pending litigations other than those
arising in the ordinary course of insurance business comprise of claims against the Company primarily on account of proceedings pending with Tax authorities
and Claims, under policies, not acknowledged as debts (net of reinsurance). The Company has reviewed all its pending litigations and proceedings and has adequately provided for where provisions are required and disclosed the contingent liabilities as applicable, in note 1 above. The Company does not expect the outcome of these proceedings to have a material adverse effect on its financial results at March 31, 2020
3. Actuarial assumptions The policyholders' actuarial liabilities are determined
based on assumptions as to the future experience of the policies. The principal assumptions are related to interest, expenses, mortality, morbidity, persistency, and additionally in the case of participating policies, bonuses and tax. The assumptions are based on prudent estimates of the future experience, and hence include margins for adverse deviations over and above the best estimate assumptions. A brief of the assumptions used by the Appointed Actuary in actuarial valuation is as below:
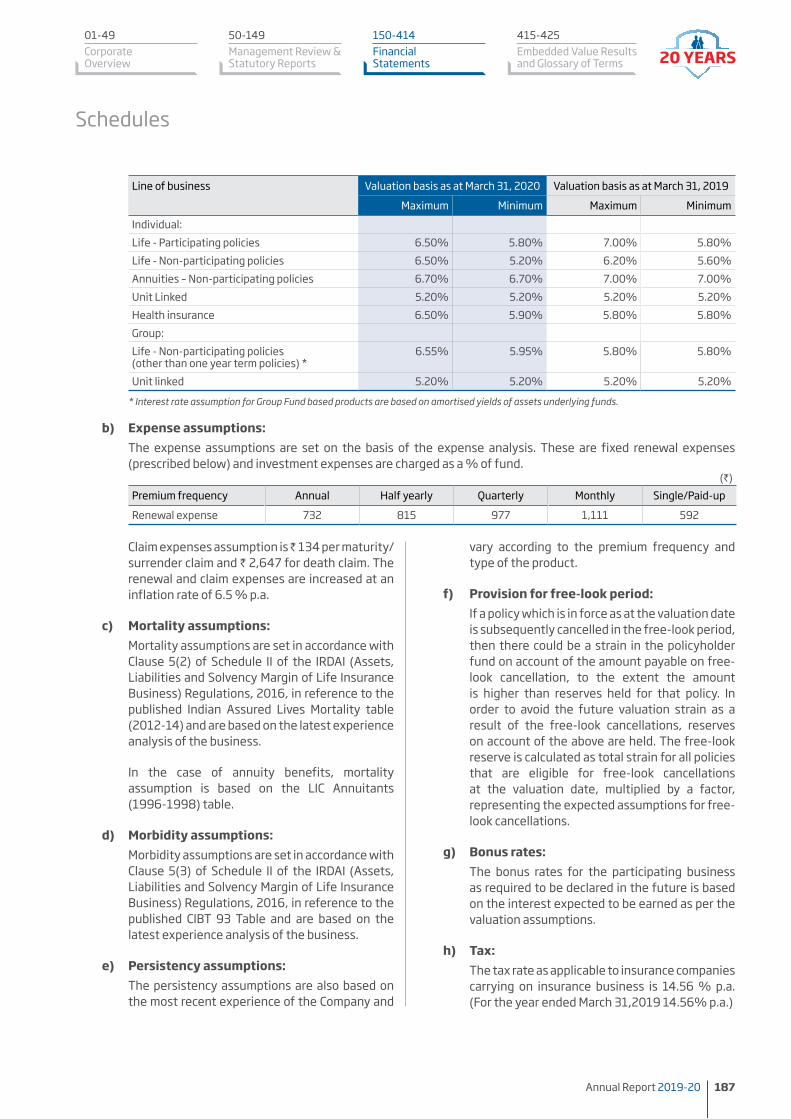
a) Interest rate assumptions: The valuation rate of interest is determined
based on the expected return on existing assets, current asset mix, expected investment return on the future investment taking into consideration the asset classes mix and expected future asset mix. The interest rates used for the valuation vary according to the type and term of the product & status of policy and are presented in the table below.
Schedules
50-149Management Review & Statutory Reports
150-414Financial Statements
415-425Embedded Value Results and Glossary of Terms
01-49Corporate Overview
Annual Report 2019-20 187
Line of business Valuation basis as at March 31, 2020 Valuation basis as at March 31, 2019
Maximum Minimum Maximum MinimumIndividual:Life - Participating policies 6.50% 5.80% 7.00% 5.80%Life - Non-participating policies 6.50% 5.20% 6.20% 5.60%Annuities – Non-participating policies 6.70% 6.70% 7.00% 7.00%Unit Linked 5.20% 5.20% 5.20% 5.20%Health insurance 6.50% 5.90% 5.80% 5.80%Group:Life - Non-participating policies (other than one year term policies) *
6.55% 5.95% 5.80% 5.80%
Unit linked 5.20% 5.20% 5.20% 5.20%
* Interest rate assumption for Group Fund based products are based on amortised yields of assets underlying funds.
b) Expense assumptions: The expense assumptions are set on the basis of the expense analysis. These are fixed renewal expenses
(prescribed below) and investment expenses are charged as a % of fund.(`)
Premium frequency Annual Half yearly Quarterly Monthly Single/Paid-up
Renewal expense 732 815 977 1,111 592
Claim expenses assumption is 134 per maturity/surrender claim and ` 2,647 for death claim. The renewal and claim expenses are increased at an inflation rate of 6.5 % p.a.
c) Mortality assumptions: Mortality assumptions are set in accordance with
Clause 5(2) of Schedule II of the IRDAI (Assets, Liabilities and Solvency Margin of Life Insurance Business) Regulations, 2016, in reference to the published Indian Assured Lives Mortality table (2012-14) and are based on the latest experience analysis of the business.
In the case of annuity benefits, mortality assumption is based on the LIC Annuitants (1996-1998) table.
d) Morbidity assumptions: Morbidity assumptions are set in accordance with
Clause 5(3) of Schedule II of the IRDAI (Assets, Liabilities and Solvency Margin of Life Insurance Business) Regulations, 2016, in reference to the published CIBT 93 Table and are based on the latest experience analysis of the business.
e) Persistency assumptions: The persistency assumptions are also based on
the most recent experience of the Company and
vary according to the premium frequency and type of the product.
f) Provision for free-look period: If a policy which is in force as at the valuation date
is subsequently cancelled in the free-look period, then there could be a strain in the policyholder fund on account of the amount payable on free-look cancellation, to the extent the amount is higher than reserves held for that policy. In order to avoid the future valuation strain as a result of the free-look cancellations, reserves on account of the above are held. The free-look reserve is calculated as total strain for all policies that are eligible for free-look cancellations at the valuation date, multiplied by a factor, representing the expected assumptions for free-look cancellations.
g) Bonus rates: The bonus rates for the participating business
as required to be declared in the future is based on the interest expected to be earned as per the valuation assumptions.
h) Tax: The tax rate as applicable to insurance companies
carrying on insurance business is 14.56 % p.a. (For the year ended March 31,2019 14.56% p.a.)
Schedules
188 Annual Report 2019-20
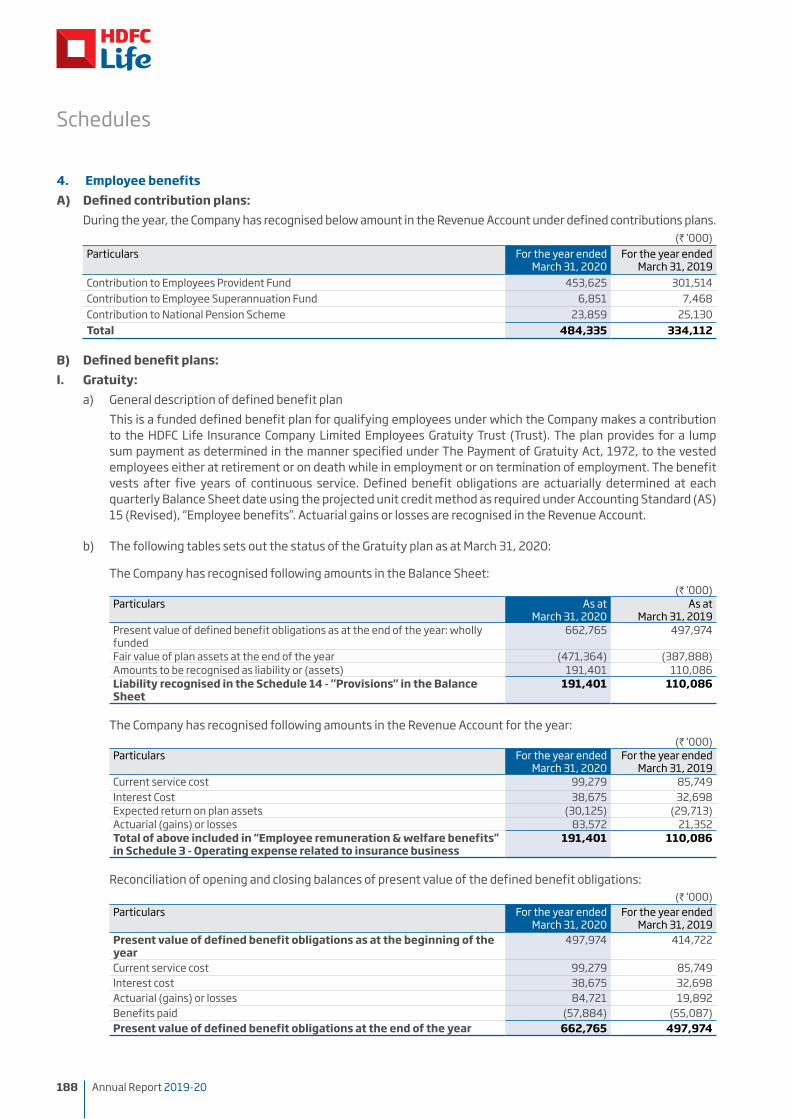
4. Employee benefitsA) Defined contribution plans: During the year, the Company has recognised below amount in the Revenue Account under defined contributions plans.
(` ‘000)Particulars For the year ended
March 31, 2020For the year ended
March 31, 2019Contribution to Employees Provident Fund 453,625 301,514 Contribution to Employee Superannuation Fund 6,851 7,468 Contribution to National Pension Scheme 23,859 25,130 Total 484,335 334,112
B) Defined benefit plans:I. Gratuity: a) General description of defined benefit plan This is a funded defined benefit plan for qualifying employees under which the Company makes a contribution
to the HDFC Life Insurance Company Limited Employees Gratuity Trust (Trust). The plan provides for a lump sum payment as determined in the manner specified under The Payment of Gratuity Act, 1972, to the vested employees either at retirement or on death while in employment or on termination of employment. The benefit vests after five years of continuous service. Defined benefit obligations are actuarially determined at each quarterly Balance Sheet date using the projected unit credit method as required under Accounting Standard (AS) 15 (Revised), “Employee benefits”. Actuarial gains or losses are recognised in the Revenue Account.
b) The following tables sets out the status of the Gratuity plan as at March 31, 2020:
The Company has recognised following amounts in the Balance Sheet:(` ‘000)
Particulars As at March 31, 2020
As at March 31, 2019
Present value of defined benefit obligations as at the end of the year: wholly funded
662,765 497,974
Fair value of plan assets at the end of the year (471,364) (387,888)Amounts to be recognised as liability or (assets) 191,401 110,086 Liability recognised in the Schedule 14 - "Provisions" in the Balance Sheet
191,401 110,086
The Company has recognised following amounts in the Revenue Account for the year:(` ‘000)
Particulars For the year ended March 31, 2020
For the year ended March 31, 2019
Current service cost 99,279 85,749 Interest Cost 38,675 32,698 Expected return on plan assets (30,125) (29,713)Actuarial (gains) or losses 83,572 21,352 Total of above included in “Employee remuneration & welfare benefits” in Schedule 3 - Operating expense related to insurance business
191,401 110,086
Reconciliation of opening and closing balances of present value of the defined benefit obligations:(` ‘000)
Particulars For the year ended March 31, 2020
For the year ended March 31, 2019
Present value of defined benefit obligations as at the beginning of the year
497,974 414,722
Current service cost 99,279 85,749 Interest cost 38,675 32,698 Actuarial (gains) or losses 84,721 19,892 Benefits paid (57,884) (55,087)Present value of defined benefit obligations at the end of the year 662,765 497,974
Schedules
50-149Management Review & Statutory Reports
150-414Financial Statements
415-425Embedded Value Results and Glossary of Terms
01-49Corporate Overview
Annual Report 2019-20 189
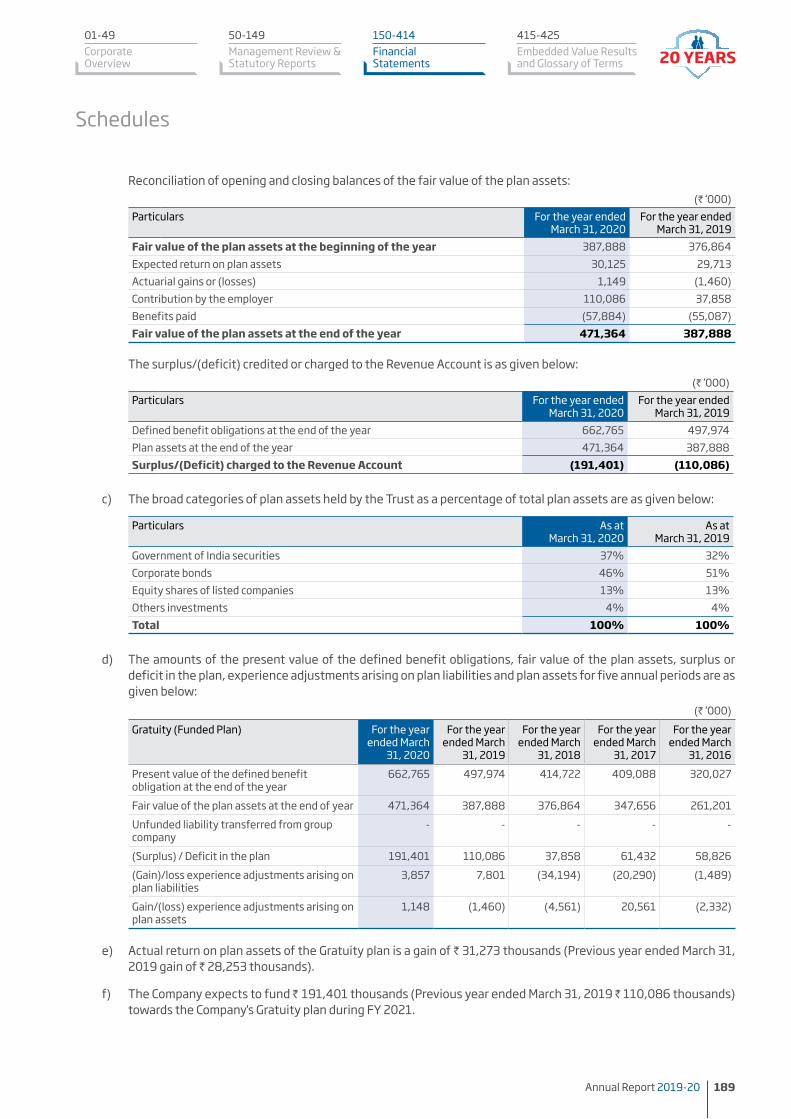
Reconciliation of opening and closing balances of the fair value of the plan assets:(` ‘000)
Particulars For the year ended March 31, 2020
For the year ended March 31, 2019
Fair value of the plan assets at the beginning of the year 387,888 376,864 Expected return on plan assets 30,125 29,713 Actuarial gains or (losses) 1,149 (1,460)Contribution by the employer 110,086 37,858 Benefits paid (57,884) (55,087)Fair value of the plan assets at the end of the year 471,364 387,888
The surplus/(deficit) credited or charged to the Revenue Account is as given below:(` ‘000)
Particulars For the year ended March 31, 2020
For the year ended March 31, 2019
Defined benefit obligations at the end of the year 662,765 497,974 Plan assets at the end of the year 471,364 387,888 Surplus/(Deficit) charged to the Revenue Account (191,401) (110,086)
c) The broad categories of plan assets held by the Trust as a percentage of total plan assets are as given below:
Particulars As at March 31, 2020
As at March 31, 2019
Government of India securities 37% 32%Corporate bonds 46% 51%Equity shares of listed companies 13% 13%Others investments 4% 4%Total 100% 100%
d) The amounts of the present value of the defined benefit obligations, fair value of the plan assets, surplus or deficit in the plan, experience adjustments arising on plan liabilities and plan assets for five annual periods are as given below:
(` ‘000)Gratuity (Funded Plan) For the year
ended March 31, 2020
For the year ended March
31, 2019
For the year ended March
31, 2018
For the year ended March
31, 2017
For the year ended March
31, 2016Present value of the defined benefit obligation at the end of the year
662,765 497,974 414,722 409,088 320,027
Fair value of the plan assets at the end of year 471,364 387,888 376,864 347,656 261,201 Unfunded liability transferred from group company
- - - - -
(Surplus) / Deficit in the plan 191,401 110,086 37,858 61,432 58,826 (Gain)/loss experience adjustments arising on plan liabilities
3,857 7,801 (34,194) (20,290) (1,489)
Gain/(loss) experience adjustments arising on plan assets
1,148 (1,460) (4,561) 20,561 (2,332)
e) Actual return on plan assets of the Gratuity plan is a gain of ` 31,273 thousands (Previous year ended March 31, 2019 gain of ` 28,253 thousands).
f) The Company expects to fund ` 191,401 thousands (Previous year ended March 31, 2019 ` 110,086 thousands) towards the Company's Gratuity plan during FY 2021.
Schedules
190 Annual Report 2019-20
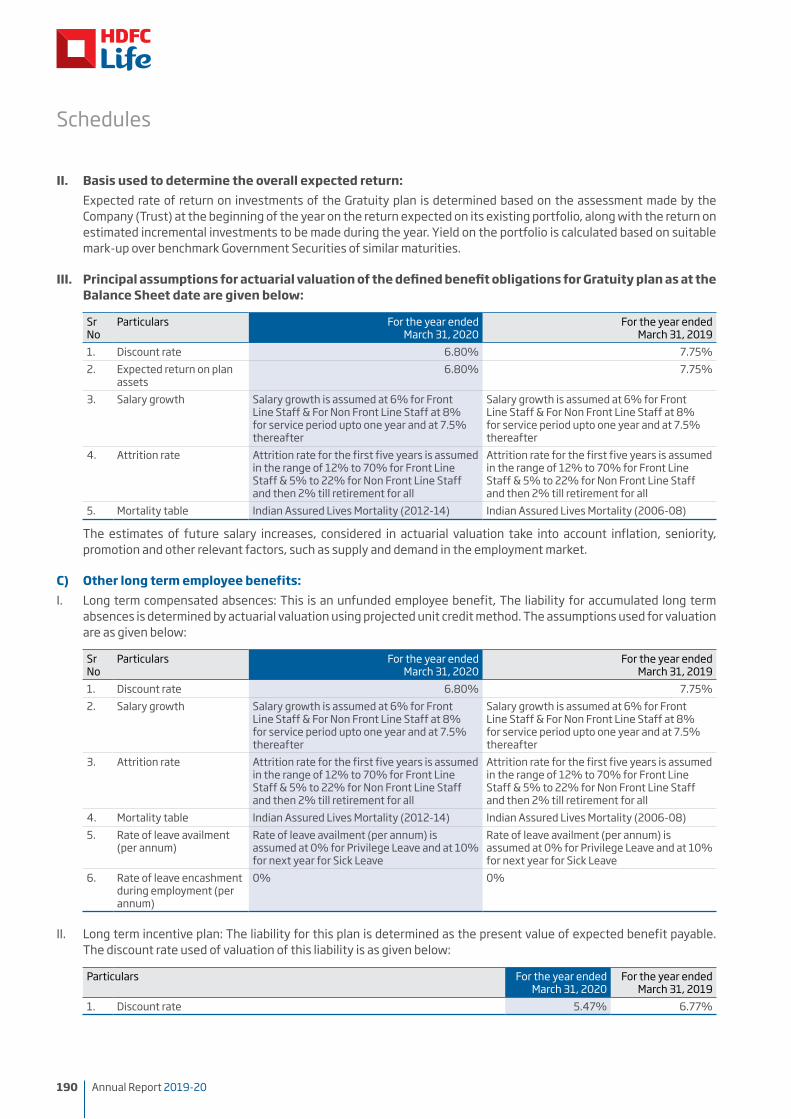
II. Basis used to determine the overall expected return: Expected rate of return on investments of the Gratuity plan is determined based on the assessment made by the
Company (Trust) at the beginning of the year on the return expected on its existing portfolio, along with the return on estimated incremental investments to be made during the year. Yield on the portfolio is calculated based on suitable mark-up over benchmark Government Securities of similar maturities.
III. Principal assumptions for actuarial valuation of the defined benefit obligations for Gratuity plan as at the Balance Sheet date are given below:
Sr No
Particulars For the year ended March 31, 2020
For the year ended March 31, 2019
1. Discount rate 6.80% 7.75%2. Expected return on plan
assets6.80% 7.75%
3. Salary growth Salary growth is assumed at 6% for Front Line Staff & For Non Front Line Staff at 8% for service period upto one year and at 7.5% thereafter
Salary growth is assumed at 6% for Front Line Staff & For Non Front Line Staff at 8% for service period upto one year and at 7.5% thereafter
4. Attrition rate Attrition rate for the first five years is assumed in the range of 12% to 70% for Front Line Staff & 5% to 22% for Non Front Line Staff and then 2% till retirement for all
Attrition rate for the first five years is assumed in the range of 12% to 70% for Front Line Staff & 5% to 22% for Non Front Line Staff and then 2% till retirement for all
5. Mortality table Indian Assured Lives Mortality (2012-14) Indian Assured Lives Mortality (2006-08)
The estimates of future salary increases, considered in actuarial valuation take into account inflation, seniority, promotion and other relevant factors, such as supply and demand in the employment market.
C) Other long term employee benefits:I. Long term compensated absences: This is an unfunded employee benefit, The liability for accumulated long term
absences is determined by actuarial valuation using projected unit credit method. The assumptions used for valuation are as given below:
Sr No
Particulars For the year ended March 31, 2020
For the year ended March 31, 2019
1. Discount rate 6.80% 7.75%2. Salary growth Salary growth is assumed at 6% for Front
Line Staff & For Non Front Line Staff at 8% for service period upto one year and at 7.5% thereafter
Salary growth is assumed at 6% for Front Line Staff & For Non Front Line Staff at 8% for service period upto one year and at 7.5% thereafter
3. Attrition rate Attrition rate for the first five years is assumed in the range of 12% to 70% for Front Line Staff & 5% to 22% for Non Front Line Staff and then 2% till retirement for all
Attrition rate for the first five years is assumed in the range of 12% to 70% for Front Line Staff & 5% to 22% for Non Front Line Staff and then 2% till retirement for all
4. Mortality table Indian Assured Lives Mortality (2012-14) Indian Assured Lives Mortality (2006-08)5. Rate of leave availment
(per annum)Rate of leave availment (per annum) is assumed at 0% for Privilege Leave and at 10% for next year for Sick Leave
Rate of leave availment (per annum) is assumed at 0% for Privilege Leave and at 10% for next year for Sick Leave
6. Rate of leave encashment during employment (per annum)
0% 0%
II. Long term incentive plan: The liability for this plan is determined as the present value of expected benefit payable. The discount rate used of valuation of this liability is as given below:
Particulars For the year ended March 31, 2020
For the year ended March 31, 2019
1. Discount rate 5.47% 6.77%
Schedules
50-149Management Review & Statutory Reports
150-414Financial Statements
415-425Embedded Value Results and Glossary of Terms
01-49Corporate Overview
Annual Report 2019-20 191
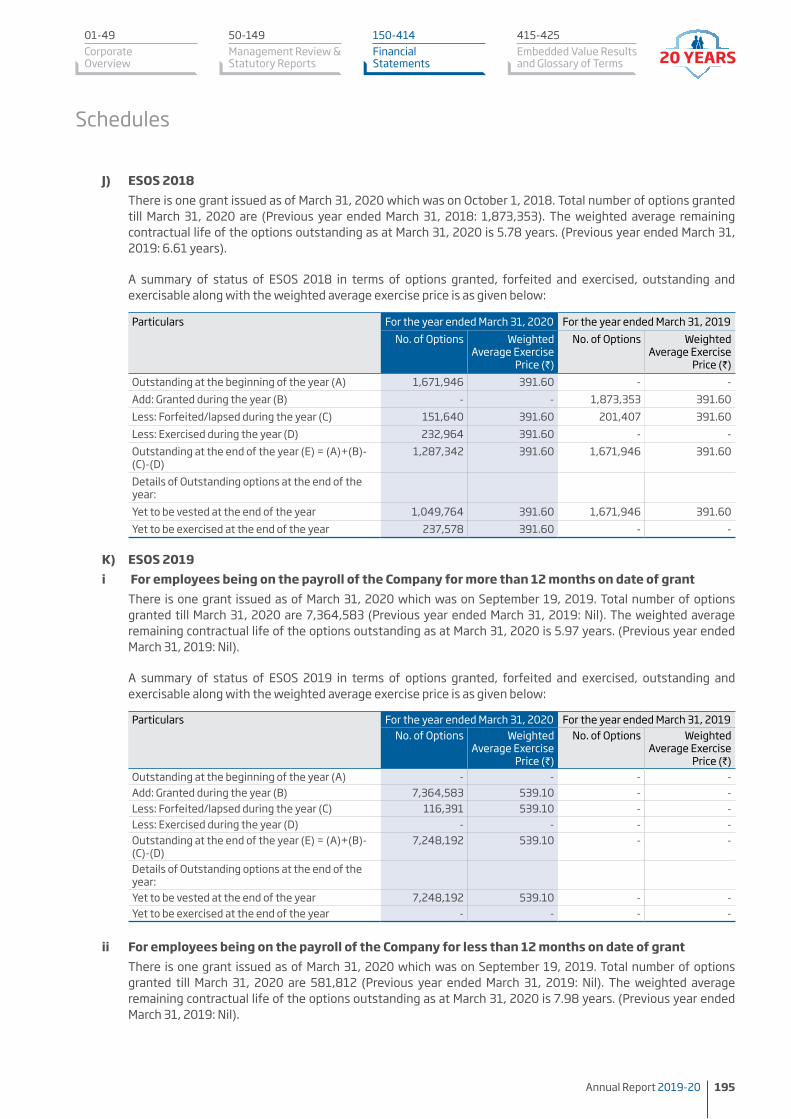
5. Employee Stock Option Scheme (ESOS)(i) The Company has granted options to employees under
the ESOS 2005, ESOS 2010, ESOS 2011 and ESOS 2012 and ESOS (Trust) 2017 schemes. These schemes are administered by the HDFC Life Employees Stock Option Trust. The Trust had subscribed to the capital of the Company and also acquired shares of the Company from Housing Development Finance Corporation Limited, the holding company. The options are granted to the employees from these tranches of shares. For all the grants, the mode of settlement is through equity shares. All the grants have graded vesting. The exercise price of ESOS 2005 is based on the holding cost of the shares in the books of the Trust and that of ESOS 2010, ESOS 2011 and ESOS 2012 is based on the fair market value as determined by the Category I Merchant Banker registered with SEBI. The exercise price, of the options granted under ESOS (Trust) 2017 is based on the market price of the shares of the Company, as defined in the ESOS (Trust) 2017 scheme.
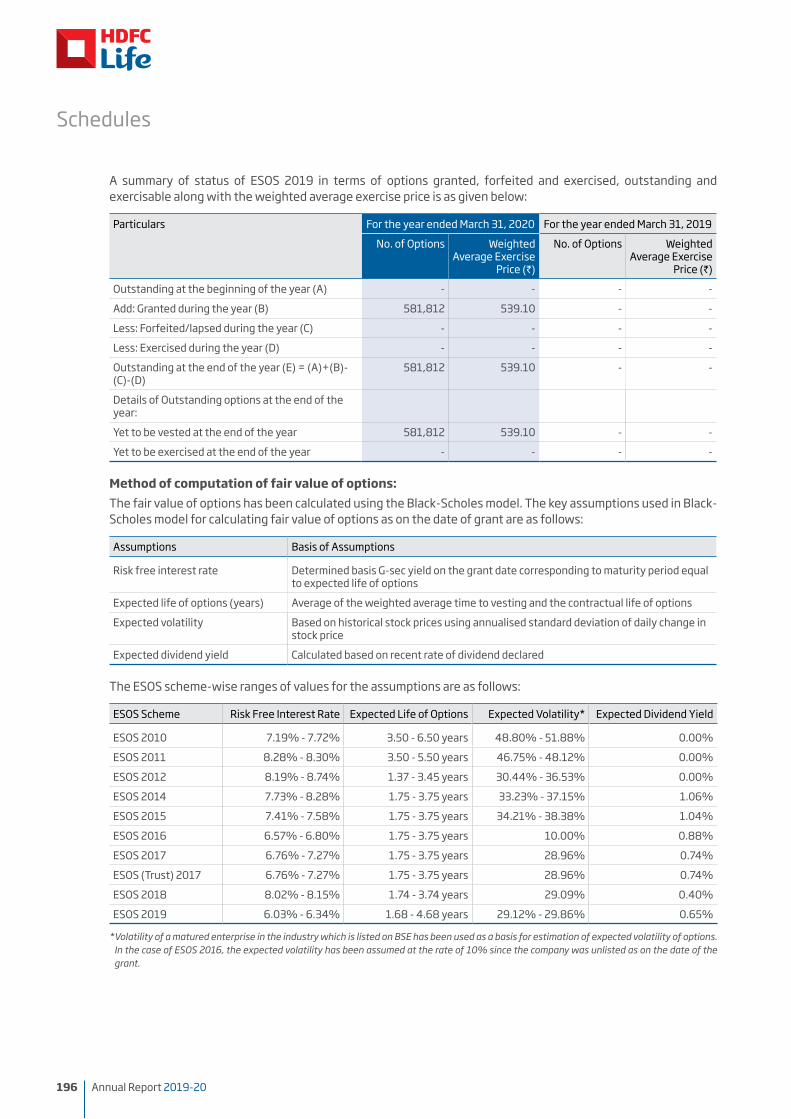
(ii) The Company has also granted options to its employees under the ESOS 2014 scheme, ESOS 2015 scheme, ESOS 2016 scheme, ESOS 2017, ESOS 2018 and ESOS 2019 scheme. The said schemes are directly administered by the Company. For all the grants, the mode of settlement is through equity shares. All the grants have graded vesting. The exercise price of ESOS 2014, ESOS 2015 and of ESOS 2016 schemes is based on the fair market value as determined by the Category I Merchant Banker registered with SEBI. The exercise price, of the options granted under ESOS 2017, ESOS 2018 and ESOS 2019 is based on the market price of the shares of the Company, as defined in the respective ESOS scheme.
(iii) The Company follows the intrinsic value method of accounting for stock options granted to employees. The intrinsic value of the options issued under the above referred schemes is ‘` Nil’ as the exercise price of the option is the same as fair value of the underlying share on the grant date and accordingly, no expenses are recognised in the books. Had the Company followed the fair value method for valuing its options, the charge to the Revenue Account/Profit & Loss Account for the year would have been aggregated to ` 483,919 thousands (Previous year ended March 31, 2019 ` 279,466 thousands) and the profit after tax would have been lower by ` 313,174 thousands (Previous year ended March 31, 2019 ` 174,116 thousands). Consequently, Company’s
basic and diluted earnings per share would have been ` 6.26 and ` 6.26 respectively (Previous year: ` 6.25 and ` 6.24 respectively).
(iv) Exercise Period under the various ESOS:
The Company's shares were listed on National Stock Exchange (NSE) and Bombay Stock Exchange (BSE) on November 17, 2017. Prior to listing, for all grants issued under the ESOS 2010, ESOS 2011, ESOS 2012, ESOS 2014, ESOS 2015 and ESOS 2016 schemes, the vested options were required to be exercised by the employees within five years from the date of vesting or the date of an Initial Public Offering (IPO) whichever is later subject to the norms prescribed by the Nomination & Remuneration Committee. Under ESOS 2005, the vested options were required to be exercised by the employees within three years from the date of vesting subject to the norms prescribed by the Nomination & Remuneration Committee. Post listing of the company's shares, vested options under all ESOS schemes are required to be exercised by the employees within five years from the date of vesting subject to the norms prescribed by the Nomination & Remuneration Committee.
Salient features of all the existing grants under the ten schemes are as stated below:
A) ESOS 2005 There are seven grants upto March 31, 2020
which are those issued on September 1, 2005 (two grants), November 8, 2006, August 3, 2007, July 15, 2008, August 16, 2009 and December 3, 2009. Total number of options granted upto March 31, 2020 are 9,964,650 (Previous year ended March 31, 2019: 9,964,650).
There are no options outstanding and exercisable for ESOS 2005 in the year ended March 31, 2020 and in the year ended March 31, 2019.
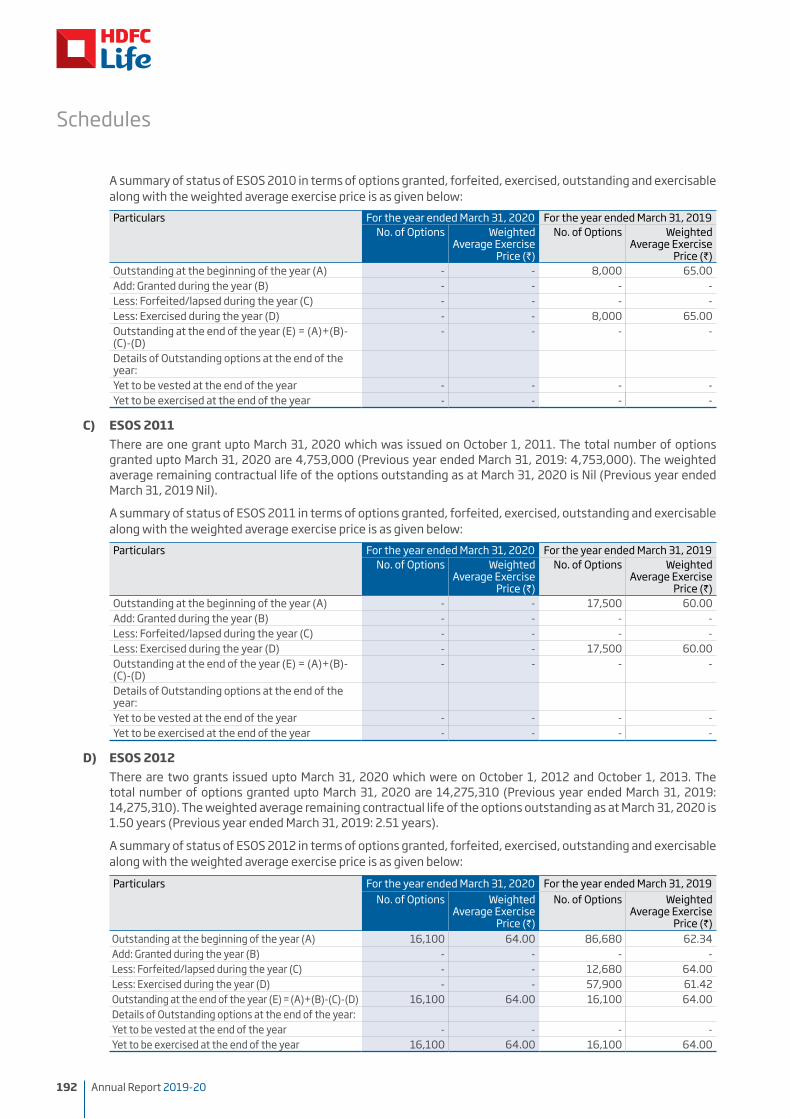
B) ESOS 2010 There are two grants issued upto March 31,
2020 which are those issued on June 30, 2010 and October 1, 2010. The total number of options granted upto March 31, 2020 are 5,158,000 (Previous year ended March 31, 2019: 5,158,000). The weighted average remaining contractual life of the options outstanding as at March 31, 2020 is Nil (Previous year ended March 31, 2019 Nil).
Schedules
192 Annual Report 2019-20
A summary of status of ESOS 2010 in terms of options granted, forfeited, exercised, outstanding and exercisable along with the weighted average exercise price is as given below:Particulars For the year ended March 31, 2020 For the year ended March 31, 2019
No. of Options Weighted Average Exercise
Price (`)
No. of Options Weighted Average Exercise
Price (`)Outstanding at the beginning of the year (A) - - 8,000 65.00Add: Granted during the year (B) - - - - Less: Forfeited/lapsed during the year (C) - - - - Less: Exercised during the year (D) - - 8,000 65.00 Outstanding at the end of the year (E) = (A)+(B)-(C)-(D)
- - - -
Details of Outstanding options at the end of the year:Yet to be vested at the end of the year - - - - Yet to be exercised at the end of the year - - - -
C) ESOS 2011 There are one grant upto March 31, 2020 which was issued on October 1, 2011. The total number of options
granted upto March 31, 2020 are 4,753,000 (Previous year ended March 31, 2019: 4,753,000). The weighted average remaining contractual life of the options outstanding as at March 31, 2020 is Nil (Previous year ended March 31, 2019 Nil).
A summary of status of ESOS 2011 in terms of options granted, forfeited, exercised, outstanding and exercisable along with the weighted average exercise price is as given below:Particulars For the year ended March 31, 2020 For the year ended March 31, 2019
No. of Options Weighted Average Exercise
Price (`)
No. of Options Weighted Average Exercise
Price (`)Outstanding at the beginning of the year (A) - - 17,500 60.00Add: Granted during the year (B) - - - - Less: Forfeited/lapsed during the year (C) - - - - Less: Exercised during the year (D) - - 17,500 60.00Outstanding at the end of the year (E) = (A)+(B)-(C)-(D)
- - - -
Details of Outstanding options at the end of the year:Yet to be vested at the end of the year - - - - Yet to be exercised at the end of the year - - - -
D) ESOS 2012 There are two grants issued upto March 31, 2020 which were on October 1, 2012 and October 1, 2013. The
total number of options granted upto March 31, 2020 are 14,275,310 (Previous year ended March 31, 2019: 14,275,310). The weighted average remaining contractual life of the options outstanding as at March 31, 2020 is 1.50 years (Previous year ended March 31, 2019: 2.51 years).
A summary of status of ESOS 2012 in terms of options granted, forfeited, exercised, outstanding and exercisable along with the weighted average exercise price is as given below:Particulars For the year ended March 31, 2020 For the year ended March 31, 2019
No. of Options Weighted Average Exercise
Price (`)
No. of Options Weighted Average Exercise
Price (`)Outstanding at the beginning of the year (A) 16,100 64.00 86,680 62.34 Add: Granted during the year (B) - - - - Less: Forfeited/lapsed during the year (C) - - 12,680 64.00 Less: Exercised during the year (D) - - 57,900 61.42 Outstanding at the end of the year (E) = (A)+(B)-(C)-(D) 16,100 64.00 16,100 64.00 Details of Outstanding options at the end of the year:Yet to be vested at the end of the year - - - - Yet to be exercised at the end of the year 16,100 64.00 16,100 64.00
Schedules
50-149Management Review & Statutory Reports
150-414Financial Statements
415-425Embedded Value Results and Glossary of Terms
01-49Corporate Overview
Annual Report 2019-20 193
E) ESOS 2014 There are two grants issued upto March 31, 2020 which were on December 1, 2014 and February 1, 2015. The
total number of options granted upto March 31, 2020 are 15,034,250 (Previous year ended March 31, 2019: 15,034,250). The weighted average remaining contractual life of the options outstanding as at March 31, 2020 is 2.06 years (Previous year ended March 31, 2019: 3.25 years).
A summary of status of ESOS 2014 in terms of options granted, forfeited, exercised, outstanding and exercisable along with the weighted average exercise price is as given below:
Particulars For the year ended March 31, 2020 For the year ended March 31, 2019No. of Options Weighted
Average Exercise Price (`)
No. of Options Weighted Average Exercise
Price (`)Outstanding at the beginning of the year (A) 464,428 90.00 2,912,842 90.00 Add: Granted during the year (B) - - - - Less: Forfeited/lapsed during the year (C) 9,000 90.00 800 90.00 Less: Exercised during the year (D) 150,282 90.00 2,447,614 90.00 Outstanding at the end of the year (E) = (A)+(B)-(C)-(D)
305,146 90.00 464,428 90.00
Details of Outstanding options at the end of the year:Yet to be vested at the end of the year - - - - Yet to be exercised at the end of the year 305,146 90.00 464,428 90.00
F) ESOS 2015 There are two grants issued as of March 31, 2020 which were on October 1, 2015 and November 1, 2015. Total
number of options granted till March 31, 2020 are 9,733,300 (Previous year ended March 31, 2019: 9,733,300). The weighted average remaining contractual life of the options outstanding as at March 31, 2020 is 3.27 years (Previous year ended March 31, 2019: 4.25 years).
A summary of status of ESOS 2015 in terms of options granted, forfeited and exercised, outstanding and exercisable along with the weighted average exercise price is as given below:
Particulars For the year ended March 31, 2020 For the year ended March 31, 2019No. of Options Weighted
Average Exercise Price (`)
No. of Options Weighted Average Exercise
Price (`)Outstanding at the beginning of the year (A) 848,320 95.00 3,810,110 95.00 Add: Granted during the year (B) - - - - Less: Forfeited/lapsed during the year (C) - - 618,400 95.00 Less: Exercised during the year (D) 315,649 95.00 2,343,390 95.00 Outstanding at the end of the year (E) = (A)+(B)-(C)-(D)
532,671 95.00 848,320 95.00
Details of Outstanding options at the end of the year:Yet to be vested at the end of the year - - - - Yet to be exercised at the end of the year 532,671 95.00 848,320 95.00
G) ESOS 2016 There are two grants issued as of March 31, 2020 which were on October 1, 2016 and November 1, 2016.Total
number of options granted till March 31, 2020 are 3,836,850 (Previous year ended March 31, 2019: 3,836,850). The weighted average remaining contractual life of the options outstanding as at March 31, 2020 is 4.13 years (Previous year ended March 31, 2019: 5.30 years)
Schedules
194 Annual Report 2019-20
A summary of status of ESOS 2016 in terms of options granted, forfeited and exercised, outstanding and exercisable along with the weighted average exercise price is as given below:Particulars For the year ended March 31, 2020 For the year ended March 31, 2019
No. of Options Weighted Average Exercise
Price (`)
No. of Options Weighted Average Exercise
Price (`)Outstanding at the beginning of the year (A) 1,366,935 190.00 2,675,125 190.00 Add: Granted during the year (B) - - - - Less: Forfeited/lapsed during the year (C) 63,200 190.00 521,720 190.00 Less: Exercised during the year (D) 688,300 190.00 786,470 190.00 Outstanding at the end of the year (E) = (A)+(B)-(C)-(D)
615,435 190.00 1,366,935 190.00
Details of Outstanding options at the end of the year:Yet to be vested at the end of the year - - 1,099,340 190.00 Yet to be exercised at the end of the year 615,435 190.00 267,595 190.00
H) ESOS 2017 There is one grant issued as of March 31, 2020 which was on March 14, 2018. Total number of options granted
till March 31, 2020 are 3,069,206 (Previous year ended March 31, 2019: 3,069,206). The weighted average remaining contractual life of the options outstanding as at March 31, 2020 is 5.10 years. (Previous year ended March 31, 2019: 6.06 years).
A summary of status of ESOS 2017 in terms of options granted, forfeited and exercised, outstanding and exercisable along with the weighted average exercise price is as given below:Particulars For the year ended March 31, 2020 For the year ended March 31, 2019
No. of Options Weighted Average Exercise
Price (`)
No. of Options Weighted Average Exercise
Price (`)Outstanding at the beginning of the year (A) 2,633,906 441.95 3,069,206 441.95 Add: Granted during the year (B) - - - - Less: Forfeited/lapsed during the year (C) 319,330 441.95 435,300 441.95 Less: Exercised during the year (D) 257,920 441.95 - - Outstanding at the end of the year (E) = (A)+(B)-(C)-(D)
2,056,656 441.95 2,633,906 441.95
Details of Outstanding options at the end of the year:Yet to be vested at the end of the year 901,602 441.95 1,771,884 441.95 Yet to be exercised at the end of the year 1,155,054 441.95 862,022 441.95
I) ESOS (Trust) 2017 There is one grant issued as of March 31, 2020 was on March 14, 2018. Total number of options granted till
March 31, 2020 are 536,394 (Previous year ended March 31, 2019: 536,394). The weighted average remaining contractual life of the options outstanding as at March 31, 2020 is 5.24 years. (Previous year ended March 31, 2019: 6.06).
A summary of status of ESOS (Trust) 2017 in terms of options granted, forfeited and exercised, outstanding and exercisable along with the weighted average exercise price is as given below:Particulars For the year ended March 31, 2020 For the year ended March 31, 2019
No. of Options Weighted Average Exercise
Price (`)
No. of Options Weighted Average Exercise
Price (`)Outstanding at the beginning of the year (A) 242,794 441.95 536,394 441.95 Add: Granted during the year (B) - - - - Less: Forfeited/lapsed during the year (C) - - 293,600 441.95 Less: Exercised during the year (D) 35,160 441.95 - - Outstanding at the end of the year (E) = (A)+(B)-(C)-(D) 207,634 441.95 242,794 441.95 Details of Outstanding options at the end of the year:Yet to be vested at the end of the year 97,118 441.95 169,956 441.95 Yet to be exercised at the end of the year 110,516 441.95 72,838 441.95
Schedules
50-149Management Review & Statutory Reports
150-414Financial Statements
415-425Embedded Value Results and Glossary of Terms
01-49Corporate Overview
Annual Report 2019-20 195
J) ESOS 2018 There is one grant issued as of March 31, 2020 which was on October 1, 2018. Total number of options granted
till March 31, 2020 are (Previous year ended March 31, 2018: 1,873,353). The weighted average remaining contractual life of the options outstanding as at March 31, 2020 is 5.78 years. (Previous year ended March 31, 2019: 6.61 years).
A summary of status of ESOS 2018 in terms of options granted, forfeited and exercised, outstanding and exercisable along with the weighted average exercise price is as given below:
Particulars For the year ended March 31, 2020 For the year ended March 31, 2019No. of Options Weighted
Average Exercise Price (`)
No. of Options Weighted Average Exercise
Price (`)Outstanding at the beginning of the year (A) 1,671,946 391.60 - - Add: Granted during the year (B) - - 1,873,353 391.60 Less: Forfeited/lapsed during the year (C) 151,640 391.60 201,407 391.60 Less: Exercised during the year (D) 232,964 391.60 - - Outstanding at the end of the year (E) = (A)+(B)-(C)-(D)
1,287,342 391.60 1,671,946 391.60
Details of Outstanding options at the end of the year:Yet to be vested at the end of the year 1,049,764 391.60 1,671,946 391.60 Yet to be exercised at the end of the year 237,578 391.60 - -
K) ESOS 2019 i For employees being on the payroll of the Company for more than 12 months on date of grant There is one grant issued as of March 31, 2020 which was on September 19, 2019. Total number of options
granted till March 31, 2020 are 7,364,583 (Previous year ended March 31, 2019: Nil). The weighted average remaining contractual life of the options outstanding as at March 31, 2020 is 5.97 years. (Previous year ended March 31, 2019: Nil).
A summary of status of ESOS 2019 in terms of options granted, forfeited and exercised, outstanding and exercisable along with the weighted average exercise price is as given below:
Particulars For the year ended March 31, 2020 For the year ended March 31, 2019No. of Options Weighted
Average Exercise Price (`)
No. of Options Weighted Average Exercise
Price (`)Outstanding at the beginning of the year (A) - - - - Add: Granted during the year (B) 7,364,583 539.10 - - Less: Forfeited/lapsed during the year (C) 116,391 539.10 - - Less: Exercised during the year (D) - - - - Outstanding at the end of the year (E) = (A)+(B)-(C)-(D)
7,248,192 539.10 - -
Details of Outstanding options at the end of the year:Yet to be vested at the end of the year 7,248,192 539.10 - - Yet to be exercised at the end of the year - - - -
ii For employees being on the payroll of the Company for less than 12 months on date of grant There is one grant issued as of March 31, 2020 which was on September 19, 2019. Total number of options
granted till March 31, 2020 are 581,812 (Previous year ended March 31, 2019: Nil). The weighted average remaining contractual life of the options outstanding as at March 31, 2020 is 7.98 years. (Previous year ended March 31, 2019: Nil).
Schedules
196 Annual Report 2019-20
A summary of status of ESOS 2019 in terms of options granted, forfeited and exercised, outstanding and exercisable along with the weighted average exercise price is as given below:
Particulars For the year ended March 31, 2020 For the year ended March 31, 2019
No. of Options Weighted Average Exercise
Price (`)
No. of Options Weighted Average Exercise
Price (`)
Outstanding at the beginning of the year (A) - - - -
Add: Granted during the year (B) 581,812 539.10 - -
Less: Forfeited/lapsed during the year (C) - - - -
Less: Exercised during the year (D) - - - -
Outstanding at the end of the year (E) = (A)+(B)-(C)-(D)
581,812 539.10 - -
Details of Outstanding options at the end of the year:
Yet to be vested at the end of the year 581,812 539.10 - -
Yet to be exercised at the end of the year - - - -
Method of computation of fair value of options: The fair value of options has been calculated using the Black-Scholes model. The key assumptions used in Black-
Scholes model for calculating fair value of options as on the date of grant are as follows:
Assumptions Basis of Assumptions
Risk free interest rate Determined basis G-sec yield on the grant date corresponding to maturity period equal to expected life of options
Expected life of options (years) Average of the weighted average time to vesting and the contractual life of options
Expected volatility Based on historical stock prices using annualised standard deviation of daily change in stock price
Expected dividend yield Calculated based on recent rate of dividend declared
The ESOS scheme-wise ranges of values for the assumptions are as follows:
ESOS Scheme Risk Free Interest Rate Expected Life of Options Expected Volatility* Expected Dividend Yield
* Volatility of a matured enterprise in the industry which is listed on BSE has been used as a basis for estimation of expected volatility of options. In the case of ESOS 2016, the expected volatility has been assumed at the rate of 10% since the company was unlisted as on the date of the grant.
Schedules
50-149Management Review & Statutory Reports
150-414Financial Statements
415-425Embedded Value Results and Glossary of Terms
01-49Corporate Overview
Annual Report 2019-20 197
6. Managerial remuneration The appointment and remuneration of managerial personnel is in accordance with the requirements of Section 34A
of the Insurance Act, 1938 as amended from time to time including the amendment brought by the Insurance Laws (Amendment) Act, 2015 and has been approved by the IRDAI.
(` ‘000)Particulars For the year ended
March 31, 2020For the year ended
March 31, 2019Salary 19,519 19,480 Company’s contribution to Provident fund, Gratuity, Superannuation funds and National Pension Scheme
5,533 5,593
Allowances/Perquisites 85,079 69,261
The managerial remuneration mentioned above does not include the perquisite value as per Income Tax Act, 1961 of employee stock options exercised and the actuarially valued employee benefits that are accounted as per Accounting Standard (AS) 15 (Revised), “Employee Benefits”, that are determined on an overall Company basis. Managerial remuneration in excess of the prescribed limits by IRDAI has been charged to the Shareholder's Profit and Loss Account and disclosed under the head "Remuneration of MD/CEOs/WTDs over specified limits"
7. Remuneration payable/paid to non-whole time independent directors ` 6167 thousands (Previous year ended March 31, 2019 ` 8,000 thousands) is included under Schedule 3A under the head “Directors Commission”.
8. As prescribed by IRDAI vide its letter Ref: 75/IRDA/Life/HSLIC dated March 13, 2015, details of options granted to and exercised by Key Managerial Personnel as defined under the Companies Act, 2013, are as follows:
Particulars No. of OptionsFor the year ended
March 31, 2020For the year ended
March 31, 2019Granted during the year * 680,000 221,489 Exercised during the year ** 368,337 1,266,680
* Granted subject to approval of the IRDAI
** Relates to options granted in the past years
9. Operating expenses Details of expenses incurred under the following heads as required by the IRDAI vide the Master Circular are as given
below:(` ‘000)
Particulars For the year ended March 31, 2020
For the year ended March 31, 2019
Marketing Support and Advertisement 10,695,689 9,836,533 Business Development 6,120,905 6,226,976 Outsourcing Expenses 8,440,628 6,797,625
10. Leases In accordance with the Accounting Standard (AS)
19, “Leases”, the following disclosures are made in respect of operating leases:
a) The Company has hired motor vehicles on cancellable operating lease for a term of up to five years. In respect of these operating leases, the lease rentals debited to the Revenue Account are ` 1,372 thousands (Previous year ended March 31, 2019: ` 74 thousands).
The terms of the lease agreements do not contain any exceptional/restrictive covenants
which will have significant detrimental impact on the Company’s financials nor are there any options given to the Company to purchase the motor vehicles. The agreements provide for pre-decided increase in lease rentals over the lease period and for change in the rentals if the taxes leviable on such rentals are revised.
b) The Company has taken properties under operating lease. In respect of these operating leases, the lease rentals debited to rent under the head Rent rates and taxes in the Revenue Account are 6,37,228. thousands (Previous year ended March 31, 2019: ` 5,99,347 thousands).
Schedules
198 Annual Report 2019-20
The minimum future lease rentals payable under non-cancellable operating leases for specified duration in respect of such leases amount to the following:
(` ‘000)Particulars As at
March 31, 2020As at
March 31, 2019Not later than 1 year 66,592 67,778 Later than 1 year but not later than 5 years 39,264 63,404 Later than 5 years - -
The lease arrangements contain provisions for renewal and escalation. The terms of the lease agreements do not contain any exceptional/restrictive covenants which will have significant detrimental impact on the Company’s financials.
c) The Company has taken furniture and generators under cancellable operating lease. In respect of these operating leases, the lease rentals debited to rent under the head Rent rates and taxes in the Revenue Account are ` 11,622 thousands (Previous year ended March 31, 2019: ` 13,358 thousands).
d) The company has taken cloud services, networking equipment etc under operating lease. In respect of these operating leases, the lease rentals debited to rent under the head Rent rates and taxes in the Revenue Account are ` 1,53,973 thousands (Previous year ended March 31, 2019: ` 59,985 thousands).
11. Provision for tax During the year, the Company has made provision for
taxation in accordance with the Income tax Act, 1961 and Rules and Regulations there under as applicable to the Company.
(` ‘000)Particulars As at
March 31, 2020As at
March 31, 2019Revenue Account 1,490,341 2,267,885 Profit and Loss Account 164,780 130,947 Total 1,655,121 2,398,832
12. Foreign exchange gain/(loss) The amount of net foreign exchange gain/(loss) debited to Revenue Account which included in Schedule 3 - Operating
expenses related to insurance business is as follows.(` ‘000)
Particulars As at March 31, 2020
As at March 31, 2019
Foreign exchange gain/(loss) (4,553) (2,101)
13. Corporate Social Responsibility (CSR) As per section 135 of the Companies Act, 2013, the gross amount suggested to be spent by the Company during the
year ended March 31, 2020 is ` 1,42,315 thousands (Previous year ended March 31, 2019 ` 1,13,498 thousands). The Company has spent ` 1,97,687 thousands (Previous year ended March 31, 2019: ` 1,91,760 thousands) on various CSR initiatives.
(` ‘000)Sector in which the project is covered
Project Details For the year ended March 31, 2020
For the year ended March 31, 2019
Health The Company has contributed towards healthcare for the underprivileged in the form of reducing protein energy malnutrition amongst children, surgeries for congenital heart defects in children, cancer treatment support for children, WASH sessions in schools, general health check up camps and provision of clean drinking water access to rural communities.
108,004 44,011
Education The Company has contributed towards supporting the education of underpriviledged children across the country, in terms of providing scholarships, infrastructural development in schools, distribution of books, providing mid-day meals in schools and career counselling for children.
67,227 117,920
Schedules
50-149Management Review & Statutory Reports
150-414Financial Statements
415-425Embedded Value Results and Glossary of Terms
01-49Corporate Overview
Annual Report 2019-20 199
(` ‘000)Sector in which the project is covered
Project Details For the year ended March 31, 2020
For the year ended March 31, 2019
Livelihood enhancement projects
The Company has contributed towardslivelihood generation by providing skill training and placements for youth in cities and higher education support for youth to make them employable in the future.
2,500 4,900
Environmental Sustainability
The Company has contributed towards environmental sustainability in the form of large scale tree plantations.
2,100 900
Rural development The Company has contributed towards rural development in terms of providing for homes and house repairs for dislocated families as a result of floods.
5,763 2,018
Senior Citizens The Company has contributed towards senior citizens by providing concierge based services.
9,487 19,703
Capacity Building 2,606 2,308Total 197,687 191,760
The amount spent during the year is as follows:(` ‘000)
Particulars For the year ended March 31, 2020
For the year ended March 31, 2019
(i) Construction/acquisition of any assetIn Cash - - Yet to be paid in Cash - - Total - -
(ii) On Purpose other than (i) aboveIn Cash* 197,687 190,140 Yet to be paid in Cash - 1,620 Total 197,687 191,760
* Payments have been made through bank transfer
Movement in provision for CSR activities:(` ‘000)
Particulars For the year ended March 31, 2020
For the year ended March 31, 2019
Balance as at beginning of the year 1,620 778 Additional provision made during the year - 1,620 Amount used during the year (1,620) (778)Balance as at end of the year - 1,620
Amounts of related party transactions pertaining to CSR related activities for the year ended March 31, 2020 was ` Nil (previous year ended March 31, 2019 ` Nil)
14. Derivative contracts: In accordance with the IRDAI circular no. IRDA/F&I/
INV/CIR/138/06/2014 dated June 11, 2014 (‘the IRDAI circular on Interest Rate Derivatives’) and IRDAI Investment Master Circular issued in May 2017 allowing insurers to deal in rupee interest rate derivatives, the Company has in place a derivative policy approved by Board which covers various aspects that apply to the functioning of the derivative transactions undertaken to substantiate the hedge strategy to mitigate the interest rate risk, thereby managing the volatility of returns from future fixed income investments, due to variations in market interest rates.
a) The Company has during the year, as part of its Hedging strategy, entered into Forward Rate Agreements (FRA) transactions to hedge the interest rate sensitivity for highly probable forecasted transactions as permitted by the IRDAI circular on Interest Rate Derivatives.
Forward Rate Agreement derivative contracts are over-the-counter (OTC) transactions, agreeing to buy notional value of a debt security at a specified future date, at a price determined at the time of the contract with an objective to lock in the price of an interest bearing security at a future date.
Schedules
200 Annual Report 2019-20
The Forward Rate Agreement (FRA) contract is valued at the difference between the market value of underlying bond at the spot reference yield taken from the SEBI approved rating agency and present value of contracted forward price of underlying bond including present value of intermediate coupon inflows from valuation date till FRA contract settlement date, at applicable INR-OIS rate curve.
Forward Rate Agreement (FRA)(` ‘000)
Sr. No.
Particulars As at March 31, 2020
As at March 31, 2019
i) Total notional exposure of Forward Rate Agreements (FRA) undertaken during the year (instrument-wise)
(a) 6.62% GOI 281151 2,268,420 - (b) 6.83% GOI 190139 1,205,166 - (c) 7.40% GOI 090935 1,298,112 - (d) 7.57% GOI 170633 4,995,843 -
(e) 7.61% GOI 090530 2,391,972 - (f) 7.62% GOI 150939 3,625,097 - (g) 7.63% GOI 170659 5,757,352 - (h) 7.69% GOI 170643 2,002,703 - (i) 7.73% GOI 191234 2,396,715 - (j) 7.95% GOI 280832 2,093,962 - (k) 8.17% GOI 011244 3,986,911 - (l) 8.30% GOI 020740 5,082,401 - (m) 8.30% GOI 311242 3,894,956 - (n) 8.32% GOI 020832 5,496,874 - (o) 8.33% GOI 070636 5,112,168 - Total 51,608,652 -
ii) Total notional exposure of Forward Rate Agreements (FRA) outstanding as at the Balance Sheet date (instrument-wise)(a) 6.62% GOI 281151 2,268,420 - (b) 6.83% GOI 190139 1,205,166 - (c) 7.40% GOI 090935 1,298,112 - (d) 7.57% GOI 170633 4,995,843 - (e) 7.61% GOI 090530 1,319,359 - (f) 7.62% GOI 150939 3,625,097 - (g) 7.63% GOI 170659 5,757,352 - (h) 7.69% GOI 170643 2,002,703 - (i) 7.73% GOI 191234 1,321,559 - (j) 7.95% GOI 280832 2,093,962 - (k) 8.17% GOI 011244 3,986,911 - (l) 8.30% GOI 020740 5,082,401 - (m) 8.30% GOI 311242 3,894,956 - (n) 8.32% GOI 020832 2,452,837 - (o) 8.33% GOI 070636 5,112,168 - Total 46,416,846 -
iii) Notional principal amount of Forward Rate Agreements (FRA) outstanding and not ‘highly effective’ as at Balance Sheet date
- -
iv) Mark-to-market value of Forward Rate Agreements (FRA) and not ‘highly effective’ as at Balance Sheet date
- -
v) Loss which would be incurred if counter party failed to fulfil their obligation under agreements
- -
Schedules
50-149Management Review & Statutory Reports
150-414Financial Statements
415-425Embedded Value Results and Glossary of Terms
01-49Corporate Overview
Annual Report 2019-20 201
b) The fair value mark to market (MTM) gains or losses in respect of Forward Rate Agreements (FRA) outstanding as at the Balance Sheet date is stated below:
(` ‘000)Hedging instrument As at
March 31, 2020As at
March 31, 2019(a) 6.62% GOI 281151 (69,855) - (b) 6.83% GOI 190139 3,504 - (c) 7.40% GOI 090935 (14,099) - (d) 7.57% GOI 170633 (103,147) - (e) 7.61% GOI 090530 9,235 - (f) 7.62% GOI 150939 31,685 - (g) 7.63% GOI 170659 63,594 - (h) 7.69% GOI 170643 (33,591) - (i) 7.73% GOI 191234 22,477 - (j) 7.95% GOI 280832 35,277 - (k) 8.17% GOI 011244 (122,460) - (l) 8.30% GOI 020740 67,114 - (m) 8.30% GOI 311242 (68,180) - (n) 8.32% GOI 020832 56,520 - (o) 8.33% GOI 070636 (12,292) - Total (134,219)
C) Movement in Hedge Reserve(` ‘000)
Hedge Reserve Account As at March 31, 2020 As at March 31, 2019Realised Unrealised Total Realised Unrealised Total
Balance at the beginning of the year
- - - - - -
Add: Changes in fair value during the year
75,506 441,731 517,236 - - -
Less: Amounts reclassified to Revenue /Profit & Loss Account included in ‘Interest, Dividends & Rent-Gross’
101 - 101 - - -
Balance at the end of the year 75,405 441,731 517,136 - - -
An amount of ` (584,834) thousands (Previous year ` Nil) was recognised in Revenue Account being the portion of loss determined to be ineffective portion of effective hedge
Amount that was removed from Hedge Reserve account during the year ended March 31, 2020 in respect of forecast transaction for which hedge accounting had previously been used, but is no longer expected to occur is Nil (Previous year Nil)
The cash flows from the hedges are expected to occur over the outstanding tenure of underlying policy liabilities and will accordingly flow to the Revenue Account.
Qualitative Disclosures on risk exposure in Fixed Income Derivatives:
Overview of business and processes:
a) Fixed Income Derivative Hedging instruments: Derivatives are financial instruments whose
characteristics are derived from the underlying assets, or from interest and exchange rates or indices. These include forward rate agreements, interest rate swaps and interest rate futures.
The Company during the financial year has entered into FRA derivative instrument to minimise exposure to fluctuations in interest rates on plan assets and liabilities. This hedge
Schedules
202 Annual Report 2019-20
is carried in accordance with its established policies, strategy, objective and applicable regulations. The Company does not engage in derivative transactions for speculative purposes.
b) Derivative policy/process and Hedge effectiveness assessment:
The Company has well defined Board approved Derivative Policy and Process document setting out the strategic objectives, regulatory and operational framework and risks associated with interest rate derivatives along with having measurement, monitoring processes and controls thereof. The accounting policy has been clearly laid out for ensuring a process of periodic effectiveness assessment and accounting.
The Company has clearly identified roles and responsibilities to ensure independence and accountability through the investment decision, trade execution, to settlement, accounting and periodic reporting and audit of the Interest Rate Derivative exposures. The overall policy, risk management framework for the Interest
Rate Derivatives are monitored by the Risk Management Committee.
c) Scope and nature of risk identification, risk measurement, and risk monitoring:
The Derivative and related Policies as approved by the Board sets appropriate market limits such as sensitivity limits and value-at-risk limits for exposures in interest rate derivatives.
All financial risks of the derivative portfolio are measured and monitored on periodic basis.
Quantitative disclosure on risk exposure in Forward Rate Agreement
A hedge is deemed effective, if it has a high statistical correlation between the change in value of the hedged item and the hedging instrument (FRA). Gains or losses arising from hedge ineffectiveness, if any, are recognised in the Revenue Account
The tenure of the hedging instrument may be less than or equal to the tenure of underlying hedged asset/liability
Forward Rate Agreements (FRA)(` ‘000)
Sr No
Particulars As at March 31, 2020
As at March 31, 2019
1 Name of counterparty 1.Citibank N.A. 2.Credit Suisse AG 3.HSBC Ltd 4. JPMorgan Chase Bank N.A.
-
2 Hedge Designation Cashflow Hedge -
3 Likely impact of one percentage change in interest rate (100*PV01)
- Underlying being hedged 3,829,135 -
- Derivative (3,596,613) -
4 Credit exposure 2,798,076 -
The exposure limit has been calculated on the basis of Credit Equivalent Amount using the Current Exposure Method (CEM) as detailed below:
The Credit Equivalent Amount of a market related off-balance sheet transaction calculated using the CEM is the sum of
a) the current credit exposure (gross positive mark to market value of the contract); and
b) potential future credit exposure which is a product of the notional principal amount across the outstanding contract and a factor that is based on the mandated credit conversion factors as prescribed under the IRDAI circular on Interest Rate Derivatives, which is applied on the residual maturity of the contract.
Schedules
50-149Management Review & Statutory Reports
150-414Financial Statements
415-425Embedded Value Results and Glossary of Terms
01-49Corporate Overview
Annual Report 2019-20 203
15. Encumbrances The assets of the Company are free from any encumbrances at March 31, 2020, except for Fixed Deposits and
Government Securities, mentioned below, kept as margin against bank guarantees with exchange and collateral securities issued:
(` ‘000)Particulars As at March 31, 2020 As at March 31, 2019
Amortised Cost Market Value Amortised Cost Market Value(i) issued in India Fixed Deposits against Margin with Exchange
for equity trades: - National Securities Clearing Corporation
Limited 397,200 397,200 350,000 350,000
- Indian Clearing Corporation Limited - - 60,000 60,000 Government Security collateral to CCIL under
TREPs segment 500,632 532,922 501,907 503,292
Fixed Deposit against Bank Guarantee 2,500 2,500 883,223 883,223 Sub-total 900,332 932,622 1,795,130 1,796,515 (ii) Issued outside India Fixed Deposit against Bank Guarantee 1,118 1,118 1,014 1,014 Total 901,450 933,739 1,796,144 1,797,529
16. Historical cost of investments The historical cost of those investments whose reported value is based on fair value is as given below:
(` ‘000)Particulars As at March 31, 2020 As at March 31, 2019
Reported Value Historical Cost Reported Value Historical CostA Non-linked investments Shareholders’ investments 16,306,728 20,304,440 11,290,591 11,429,458 Participating Life Fund 33,270,912 39,576,407 51,727,700 43,569,142 Participating Pension Fund 3,453,347 3,612,005 6,497,477 4,721,985 Non Linked Non Unit Fund - - 1,000,652 1,000,000 Annuity Fund 257,339 638,825 2,062,032 2,238,710 Non Par - Individual Life Fund - - 150,055 150,000 Non Par - Group Life Fund - - 1,200,737 1,200,000 Non Par - Group Variable Fund 6,188,785 5,826,516 8,616,414 8,352,866 Non Par - Group Traditional Fund 2,687,614 2,531,102 2,280,532 2,217,159 B Linked investments 510,805,186 546,543,303 585,226,485 494,666,842
Historical Cost - Unlisted Equity & Equity related Investments(` ‘000)
Particulars As at March 31, 2020 As at March 31, 2019(A) Non-linked
Purchase where payments are made but deliveries are pending
- - - - 14,514 14,514
Sales where receivables are pending
- 9,635,031 9,635,031 - 4,690,138 4,690,138
20. Claims outstanding As at March 31, 2020, there were 2,735 claims amounting to ` 1,35,479 thousands (Previous year ended March 31,
2019 2773 claims amounting to ` 145,924 thousands) settled and remaining unpaid for a period of more than six months. These claims remain unpaid awaiting receipt of duly executed discharge documents from the claimants. All claims are to be paid to claimants in India.
21. Provision for NPA (non standard assets) for debt portfolio Provision for doubtful debts is made In line with the ‘Guidelines on Prudential norms for income recognition, Asset
classification, Provisioning and other related matters in respect of Debt portfolio' as specified by IRDAI vide the Master Circular dated December 11, 2013 and has been recognised in the Revenue Account as per below table:
(` ‘000)Particulars For the year ended
March 31, 2020 March 31, 2019Provision/(reversal) of provision for doubtful debt 350,000 162,500
During the year ended March 31, 2020 the company has recognized NPA provision of ` 350,000 thousands (including ` 25,000 on matured NCD with corresponding impact of reversal of Fair value change account) on investment in NCDs of IL&FS Ltd, classified as NPA in previous financial year, owing to the default of interest payment on the Non-Convertible Debentures (NCD's) held in Unit Linked Funds.
22. Segmental reporting As per Accounting Standard (AS) 17, “Segment Reporting”, read with the IRDAI Financial Statements Regulations,
Segmental Accounts are disclosed in Annexure 1.
23. Policyholders’ surplus The surplus arising in the non-participating funds amounting to ` 10,079,112 thousands (Previous year ended March
31, 2019 ` 10,567,835 thousands) has been transferred to Profit and Loss account based on the recommendation by the Appointed Actuary.
24. Shareholders’ contribution(` ‘000)
Particulars For the year endedMarch 31, 2020 March 31, 2019
Towards excess EOM 953,642 2,214,016 Towards meeting deficit in Policyholders' Account 93,815 875,486 Total 1,047,457 3,089,502
*Contribution for previous year has been approved by shareholders at the Annual General Meeting held on July 23, 2019
The above contribution is subject to approval by shareholders at the Annual General Meeting and is irreversible in nature and will not be recouped to the Shareholders.
25. Unit Linked Funds The Company has presented the financial statements of the unit linked funds in Annexure 2 and 3 as required by the
Master Circular.
Schedules
50-149Management Review & Statutory Reports
150-414Financial Statements
415-425Embedded Value Results and Glossary of Terms
01-49Corporate Overview
Annual Report 2019-20 205
26. The Micro, Small and Medium Enterprises Development Act, 2006 According to information available with the management, on the basis of intimation received from suppliers, regarding
their status under the Micro, Small and Medium Enterprises Development Act, 2006 (MSMED Act), the details of amounts due to Micro and Small Enterprises under the said Act as on March 31, 2020 are as follows:
(` ‘000)Sr No
Particulars For the year ended March 31, 2020
For the year ended March 31, 2019
a) (i) Principal amount remaining unpaid to supplier under MSMED Act 126 770 (ii) Interest on a) (i) above Nil Nil
b) (i) Amount of principal paid beyond the appointed date Nil Nil (ii) Amount of interest paid beyond the appointed date
(as per Section 16) Nil Nil
c) Amount of interest due and payable for the period of delay in making payment, but without adding the interest specified under section 16 of the MSMED Act
Nil Nil
d) Amount of further interest remaining due and payable even in earlier years Nil Nil e) Total amount of interest due under MSMED Act Nil Nil
27. Earnings per equity share Basic earnings per share is calculated by dividing the net profit or loss for the year attributable to equity shareholders
by the weighted average number of equity shares outstanding during the year. For the purpose of calculating diluted earnings per share, the net profit or loss for the year attributable to equity shareholders and the weighted average number of equity shares outstanding during the year are adjusted for effects of all dilutive equity shares.
Sr No
Particulars For the year ended March 31, 2020
For the year ended March 31, 2019
1 Net Profit/(Loss) as per Profit and Loss Account (` '000) 12,952,662 12,767,9392 Weighted avg no of equity shares for Earnings Per Share
a) For Basic Earnings Per Share 2,017,924,622 2,014,555,195b) For Diluted Earnings Per Share i) Number of equity shares for basic earnings per share as per 2 (a) above 2,017,924,622 2,014,555,195 ii) Add : Weighted average outstanding options deemed to be issued for
no consideration 2,397,705 4,608,270
3 Weighted average number of equity shares for Diluted Earnings Per Share 2,020,322,327 2,019,163,4654 Basic Earnings Per Share (`) (1/2.a) 6.42 6.345 Diluted Earnings Per Share (`) (1/3) 6.41 6.326 Nominal value of shares (`) 10.00 10.00
28. Subsidiaries: The Company has two subsidiaries, for which
information is given as under:
i. HDFC Pension Management Company Limited (“HDFC Pension”) is a wholly owned subsidiary of HDFC Life Insurance Company Limited and has been a licensed pension fund manager since 2013 and also licensed as Point of Presence (PoP) for distribution of NPS and servicing to public at large since February 2019. HDFC Pension has been a preferred pension fund manager and its Assets Under Management have grown to ` 8,265 crore as at 31st March, 2020.
ii. HDFC International Life and Re Company Limited (“HDFC International Life & Re”) is a wholly owned foreign subsidiary incorporated in the Dubai International Financial Centre (“DIFC”) on January
10, 2016 under the Companies Law, DIFC Law No.2 of 2009 under registration number 2067. HDFC International Life & Re is regulated by the Dubai Financial Services Authority ("DFSA") and is licensed to undertake life reinsurance business. It provides risk-transfer solutions, prudent underwriting solutions and value added services, among others, across individual life, group life and group credit life lines of business. HDFC International Life & Re currently offers reinsurance solutions in the Gulf Cooperation Council (“GCC”) and Middle East & North Africa (“MENA”) regions.
In December 2018, HDFC International Life & Re has been assigned a long-term insurer financial strength rating of “BBB” with a stable outlook by S&P Global Ratings. In December 2019 S&P Global reaffirmed the rating of HDFC International Life & Re.
Schedules
206 Annual Report 2019-20
29. Interim Dividend The Company has taken the cognizance of IRDAI circular number IRDA/F&A/CIR/MISC/099/04/2020 dated April 24,
2020, and has not proposed any dividend for the financial year ending March 31, 2020. During the previous year ended March 31, 2019 the Board of Directors of the Company have approved at the Board Meeting held on March 7, 2019 an interim dividend @ 16.3% on equity share of the face value of ` 10 i.e. @ ` 1.63 per equity share, amounting to ` 3,964,202 thousands including dividend distribution tax.
30. During the year ended March 31, 2020, the Company had transactions with related parties, which have been identified by the management as per the requirements of the Accounting Standard (AS) 18, “Related Party Disclosures”. Details of these related parties, nature of the relationship, transactions entered into with them and the balances in related party accounts at year end are as mentioned below:
A) Related party disclosures as per Accounting Standard 18 Related parties and nature of relationship
Nature of relationship Name of the related party
Holding Company 1) Housing Development Finance Corporation Limited (HDFC Limited)
Investing Company 2) Standard Life (Mauritius Holdings) 2006 Limited (Till August 14, 2019)
Wholly Owned Subsidiary 3) HDFC Pension Management Company Limited
4) HDFC International Life and Re Company Limited
Fellow Subsidiary 5) HDFC Asset Management Company Limited
6) HDFC Holdings Limited
7) HDFC Trustee Company Limited
8) HDFC Investments Limited
9) HDFC ERGO General Insurance Company Limited
10) GRUH Finance Limited (Fellow Subsidiary up to 30th Aug 2019/Associate of Holding company from 30th Aug 2019 to 17th Oct 2019)
17) Griha Investments (subsidiary of HDFC Holdings Limited)
18) HDFC Education and Development Services Private Limited
19) Griha Pte Ltd., Singapore (Subsidiary of HDFC Investments Limited)
20) HDFC ERGO Health Insurance Company Limited (w.e.f. January 9, 2020)
Entities over which control is exercised 20) HDFC Investment Trust
21) HDFC Investment Trust II
Key Management Personnel 22) Mr. Amitabh Chaudhry - Managing Director and Chief Executive Officer (Till September 8, 2018)
23) Ms. Vibha Padalkar - Managing Director and Chief Executive Officer
24) Mr. Suresh Badami - Executive Director
Relative of Key Management Personnel 25) Ms. Preeti Chaudhry (relative of Mr. Amitabh Chaudhry) (Till September 8, 2018)
Schedules
50-149Management Review & Statutory Reports
150-414Financial Statements
415-425Embedded Value Results and Glossary of Terms
01-49Corporate Overview
Annual Report 2019-20 207
The transactions between the Company and its related parties are as given below. As per the requirement of Corporate Governance guidelines for Insurers in India, 2016, issued by IRDAI, payments made to group entities from the Policyholders’ Funds are included in the below disclosures:
(` ‘000)
Name of Company Description Total value of transactions
for the year ended Mar 31,
2020
Receivable/ (Payable) at
Mar 31, 2020
Total value of transactions
for the year ended Mar
31, 2019
Receivable/ (Payable) at
Mar 31, 2019
HDFC Limited Investment income (1,429,679) 746,829 (1,053,122) 756,174
Commission expense 350 - 477 (24)
Investments - 20,235,501 - 15,799,766
Purchase of investments 1,000,000 - - -
Sale of investments (60,000) - (150,000) -
Dividend paid - - 1,692,778 -
Conference charges 947 - 1,692 -
Name usage fees 1,296,921 (432,174) 1,178,796 (591,322)
Standard Life (Mauritius Holdings) 2006 Limited
Dividend paid - - 810,834 -
HDFC Pension Management Company Limited
Income from sharing of resources (6,287) - (4,949) 4,936
(` ‘000)Name of Company Description Total value of
transactions for the year
ended Mar 31, 2020
Receivable/ (Payable) at
Mar 31, 2020
Total value of transactions
for the year ended Mar
31, 2019
Receivable/ (Payable) at
Mar 31, 2019
HDFC Bank Limited Premium income (234,322) (15,735) (178,496) (13,083)Investment income (315,359) - (292,785) - Commission expense 8,399,286 (906,110) 6,908,232 (1,161,620)Bank charges paid 191,189 - 130,572 - Insurance claim paid 8,649 - 6,307 - Investments - 20,090,136 - 36,507,943 Purchase of investments 26,213,805 - 20,933,414 - Sale of investments (4,872,752) - - - The Bank provides space at its branches and ATMs for displaying publicity materials of HDFC Life Insurance’s products such as pamphlets, standees, posters, Wall Branding/window glazing at an agreed fees per branch/ATM
6,342,491 - 4,942,731 -
Bank balances - 6,148,751 - 9,352,519 FD against Bank Guarantee - - - 880,723
C) Other entities identified as group entities for disclosure under Corporate Governance guidelines for Insurers in India, 2016, issued by IRDAI
(` ‘000)Name of Company Description Total value of
transactions for the year
ended Mar 31, 2020
Receivable/ (Payable) at
Mar 31, 2020
Total value of transactions
for the year ended Mar
31, 2019
Receivable/ (Payable) at
Mar 31, 2019
HDB Financial Services Ltd
Commission 103,919 (9,113) 86,147 (17,704)Work Station and other support Fees (347) 1,677 (554) 1,710 Group Term Insurance Premium - - 13 (0)Group Term Insurance Claim 372 - - - Interest Accrued/ Received on Deposit/Advance
(599,716) 319,328 (137,335) 107,206
Sale/Redemption of Investment (FD,CD,Equity Shares)
Work Station and other support Fees (21,405) 9,503 (15,530) 19,421 Group Term Insurance Premium (192) (13) (156) (10)Brokerage 21,100 - 35,130 - Web and Branch branding 190,889 - 78,120 -
Schedules
50-149Management Review & Statutory Reports
150-414Financial Statements
415-425Embedded Value Results and Glossary of Terms
01-49Corporate Overview
Annual Report 2019-20 209
31. Regroupings or reclassificationFigures for the previous year have been re-grouped / reclassified wherever necessary, to confirm to current year’s classification.The details for regrouping are as follows:
Sl No
Regrouped to Regrouped from Reasons
1 Schedule 13- Current Liabilities: Agent balances
Schedule 13- Current Liabilities: Sundry Creditors
Provision for deferred & clawback commission reclassified for appropriate presentation
2 Schedule 13- Current Liabilities: Unallocated Premium
Schedule 13- Current Liabilities: Sundry Creditors
Policy receipts reclassifed for appropriate presentation
3 Schedule 12- Advances and Other Assets: Service Tax Deposits
Schedule 13- Current Liabilities: Goods and Service Tax Liability
Service tax refund reclassified for appropriate presentation
4 Policyholders' Revenue Account: Other Income-Others
Schedule 3 - Operating expenses related to insurance business: General office & other expenses
Net Profit on sale of fixed assets reclassfied for appropriate presentation
5 Profit & Loss Account: Remuneration of MD/CEOs/WTDs over specified limits
32. Disclosure on other work given to auditors Pursuant to clause 7.1 of Corporate Governance Guidelines for insurers in India, 2016 issued by IRDAI applicable
from FY 2017, the remuneration paid to statutory auditors/internal auditor or its associates for services other than statutory/internal audit are disclosed below:
(` ‘000)Name Nature of Work For the year ended
March 31, 2020For the year ended
March 31, 2019Statutory auditor - G M Kapadia & CO
a) Agreed upon procedures & certifications and others 1,248 1,488
b) Issuance of comfort letters for Qualified Institutional Placement and Medium Term Notes issue of HDFC Ltd*
b) Issuance of comfort letters for Qualified Institutional Placement and Medium Term Notes issue of HDFC Ltd*
- 2,250
Internal auditor -Deloitte Touche Tohmatsu India Limited Liability Partnership
a) On-site resources 2,767 1,200
b) Security Assessment 7,000 1,175
* This cost is reimbursed to the company from HDFC Ltd and does not reflect as a charge in Revenue/ Profit & Loss Account
33. Share application money received pending allotment of shares amounting to ` 55,918 thousands (Previous year ` 3,929 thousands) disclosed in the Balance Sheet as on March 31, 2020 relates to the application money received towards Employee Stock Option Plans under Company’s Employee Stock Options Scheme(s).
34. The Company claims credit of Goods and Services Tax (‘GST’) on input services, which is set off against GST on output services. The unutilised credits towards GST on input services are carried forward under ‘Schedule 12 -Advances and Other Assets’ in the Balance Sheet.
35. HDFC Life had invested across segments in Tata Sons Ltd. NCD's since 2010. Tata Sons converted to a Private Ltd. Company from Public Ltd. Company in August 2018. As per IRDAI Act 27A (4) Insurance companies are prohibited from investing in Private Limited Companies. After the conversion to a Private Limited Co. in the previous ending March 31, 2019, HDFC Life had to sell its investments in securities issued by Tata Sons to ensure compliance with the regulation. The sale in these NCD's resulted in realized loss of ` 333,263 thousands in Non-Par Individual and Group Life, ` 12,116 thousands in Par Individual Life and ` 114,822 thousands loss in Unit Linked Funds in the previous year ending March 31, 2019
Schedules
50-149Management Review & Statutory Reports
150-414Financial Statements
415-425Embedded Value Results and Glossary of Terms
01-49Corporate Overview
Annual Report 2019-20 211
C. ADDITIONAL DISCLOSURES1. Performing and non-performing investments The company did not hold any non-performing Investments during the year except as mentioned below.
(` ‘000)Asset Type Issuer Name As at March 31, 2020 As at March 31, 2019
Gross Net of NPA provision
Gross Net of NPA provision
Non-Convertible Debenture
IL&FS Ltd 512,500 - 487,500 325,000
During the year ended March 31, 2020 the company has recognized NPA provision of ` 350,000 thousands (including ` 25,000 on matured NCD with corresponding impact of reversal of Fair value change account) on investment in NCDs of IL&FS Ltd, classified as NPA in previous financial year, owing to the default of interest payment on the Non-Convertible Debentures (NCD's) held in Unit Linked Funds.
Owing to proportionate reversal of Mark to Market (MTM) impact of ` 25,000 thousands on one of the matured IL&FS NCDs during the year, gross NPA has been increased with corresponding adjustment in the Fair value change account.
2. Deposits made under local laws The Company has no deposit (For the year ended March 31, 2019: Nil) made under local laws or otherwise encumbered
in or outside India as of March 31, 2020, except investments and deposits detailed in Note 15 of Schedule 16(B).
3. Business for social and rural sector as required under IRDAI (Obligations of insurers to Rural and Social Sectors) Regulations, 2015, issued by IRDAISocial Sector For the year ended
March 31, 2020For the year ended
March 31, 2019Gross premium underwritten (` '000) 4,600,422 3,026,202 Total Business in the preceding financial year (` '000) 51,400,031 33,219,674 Total Group lives 62,055,130 50,405,031 No of lives covered under social sector 18,096,495 13,329,331 Social sector lives as % to total business in preceding financial year
35.21% 40.12%
Social sector lives as a % to total group lives 29.16% 26.44%No of policies issued 55 47 Required % or no. of lives as per the regulations 5.00% 5.00%
Rular Sector For the year ended March 31, 2020
For the year ended March 31, 2019
Total policies written 897,693 995,587No of policies covered under rural sector 179,712 200,136% of Rural sector policies to total policies 20.02% 20.10%Required % as per the regulations 20.00% 20.00%
4. Allocation of investments and investment income The underlying investments held on behalf of the shareholders and the policyholders are included in Schedules 8, 8A
and 8B. The investment income arising from the investments held on behalf of shareholders has been taken to the Profit and Loss Account and those held on behalf of policyholders to the Revenue Account.
5. Percentage of risks retained and risk reinsured as certified by the Appointed Actuary(` ‘000)
Particulars As at March 31, 2020 As at March 31, 2019Individual businessRisk retained 2,951,705,329 33% 2,634,377,908 37%Risk reinsured 5,883,080,590 67% 4,556,992,323 63%Group businessRisk retained 7,359,482,059 79% 6,044,370,145 86%Risk reinsured 1,940,270,074 21% 982,305,443 14%Total businessRisk retained 10,311,187,388 57% 8,678,748,053 61%Risk reinsured 7,823,350,664 43% 5,539,297,766 39%
Schedules
212 Annual Report 2019-20
6. Summary of financial statements (` ‘000)
Sr No Particulars FY 19-20 FY 18-19 FY 17-18 FY 16-17 FY 15-16POLICYHOLDER'S A/C
1 Gross premium income 327,068,938 291,860,241 235,644,133 194,454,858 163,129,776 2 Net premium income 322,236,007 289,240,079 233,709,665 192,748,644 161,787,796 3 Income from investments (Net) (33,108,722) 90,274,876 85,946,319 111,406,390 17,905,734 4 Other income 2,057,923 1,238,587 710,257 419,001 591,131 5 Contribution from Shareholder to
Total funds 1,203,855,250 1,192,272,608 1,010,858,816 874,473,400 708,867,448 Total investments 1,213,706,856 1,205,018,740 1,025,325,286 884,920,200 715,898,900 Yield on investments (%)* 6.31% 7.66% 7.60% 7.12% 7.83%(B) Shareholders' Account:Total funds 67,999,238 56,556,446 47,491,863 38,386,793 31,586,360 Total investments 58,554,800 50,497,887 40,703,311 32,455,808 26,401,505 Yield on investments (%)* 6.51% 7.73% 7.53% 7.04% 7.67%
25 Yield on total investments* 6.32% 7.66% 7.59% 7.12% 7.82%26 Paid up equity capital 20,187,984 20,173,812 20,117,400 19,984,753 19,952,881 27 Net worth 67,999,238 56,556,446 47,491,863 38,386,793 31,586,360 28 Total assets 1,271,854,487 1,248,829,054 1,058,350,679 912,860,193 740,453,808 29 Earnings per share (basic) (`) ** 6.42 6.34 5.53 4.47 4.10 30 Earnings per share (diluted) (`) ** 6.41 6.32 5.50 4.44 4.10 31 Book value per share (`) 33.68 28.03 23.60 19.21 15.83
* Investment yield is given for debt portfolio.
** In determining earnings per share, the company considers the net profit/(loss) after tax. The number of shares used in computing basic and diluted earnings per share is the weighted average number of shares outstanding during the year.
***including Contribution from Shareholders Account towards Excess EoM
Schedules
50-149Management Review & Statutory Reports
150-414Financial Statements
415-425Embedded Value Results and Glossary of Terms
01-49Corporate Overview
Annual Report 2019-20 213
Financial RatiosA. New business premium income growth (segment wise) ((New business premium current year - New business premium for previous year)/New business premium for the
previous year)Particulars For the year ended
March 31, 2020For the year ended
March 31, 2019Participating life - Individual & group 32.91% -34.47%Participating pension - Individual & group -68.27% -62.40%Non participating life - Individual & group 43.06% 57.13%Non participating pension - Individual & group 11.55% 1.50%Non participating - Life group variable -14.32% 92.67%Non participating - Pension group variable 65.90% 48.10%Non participating fund - Individual & group Annuity 3.92% 143.26%Non participating fund - Individual & Group Health -43.43% 84.16%Unit linked fund - Individual life -38.38% 4.59%Unit linked fund - Individual pension -45.61% -19.80%Unit linked fund - Group life 51.65% -34.50%Unit linked fund - Group pension 2.48% -30.69%
B. Net retention ratio (Net premium divided by gross premium)(` ‘000)
Particulars For the year ended March 31, 2020
For the year ended March 31, 2019
Net premium 322,236,007 289,240,079 Gross premium 327,068,938 291,860,241 Ratio 98.52% 99.10%
C. Ratio of Expenses of management (Expenses of management divided by Total gross direct premium)(` ‘000)
Particulars For the year ended March 31, 2020
For the year ended March 31, 2019
Management expenses 57,580,788 49,323,033 Total gross premium 327,068,938 291,860,241 Ratio 17.61% 16.90%
D. Commission ratio (Gross commission paid to gross premium)(` ‘000)
* includes investments in Fixed Assets – Building as per the Master Circular
K. Total investments/Total of (Capital + Surplus)(` ‘000)
Particulars As at March 31, 2020
As at March 31, 2019
Total investments 1,275,252,168 1,256,312,538 Capital 20,187,984 20,173,812 Reserves 49,675,008 36,408,811 Ratio 18.25 22.20
L. Total affiliated investments/Total of (Capital + Surplus)(` ‘000)
Particulars As at March 31, 2020
As at March 31, 2019
Total affiliated investments* 22,602,592 18,166,857 Capital 20,187,984 20,173,812 Reserves 49,675,008 36,408,811 Ratio 0.32 0.32
* Includes only related parties identified under Accounting Standard (AS) 18, “Related Party Disclosures"
Schedules
50-149Management Review & Statutory Reports
150-414Financial Statements
415-425Embedded Value Results and Glossary of Terms
01-49Corporate Overview
Annual Report 2019-20 215
M. Investment yield (gross and net)Particulars For the year ended
March 31, 2020For the year ended
March 31, 2019A Without Unrealised Gains/Losses Shareholders' Funds 6.52% 9.12% Policyholders' Funds Non Linked Participating 6.96% 7.42% Non Participating 9.58% 8.41% Linked Non Participating 6.30% 6.61%B With Unrealised Gains/Losses Shareholders' Funds 2.93% 7.51% Policyholders' Funds Non Linked Participating 5.43% 9.50% Non Participating 15.00% 9.59% Linked Non Participating -14.63% 7.50%
N. Conservation ratioParticulars For the year ended
March 31, 2020For the year ended
March 31, 2019Participating life - Individual & group 83.74% 84.38%Participating pension - Individual & group 90.85% 89.56%Non participating life - Individual & group 69.97% 83.66%Non participating pension - Individual & group 79.51% 77.44%Non participating - Life group variable NA NANon participating - Pension group variable NA NANon participating fund - Individual & group annuity NA NANon participating fund - Individual & Group Health 62.71% 57.57%Unit linked fund - Individual life 81.59% 84.31%Unit linked fund - Individual pension 74.59% 80.76%Unit linked fund - Group life NA NAUnit linked fund - Group pension NA NA
O. Persistency ratiosParticulars For the year ended
March 31, 2020For the year ended
March 31, 2019Premium Persistency Ratio (based on original annualised premiums)13th month 90.06% 87.24%25th month 80.22% 80.47%37th month 73.78% 72.00%49th month 67.21% 67.67%61st month 55.05% 52.25%
a. The persistency ratios have been calculated in accordance with the IRDAI circular no. IRDA/ACT/CIR/MISC/035/01/2014 dated January 23, 2014 and hence are with a lag of one month
b. The persistency ratios have been calculated for the policies issued in the March to February period of the relevant years. For eg: the 13th month persistency for current year is calculated for the policies issued from March 2018 to February 2019
c. Group business, where persistency is measurable, has been included in the calculations. Rural business policies issued from FY 2019 have been included in the calculations
d. Ratios for previous year have been reclassified/regrouped wherever necessary
Schedules
216 Annual Report 2019-20
P. NPA ratioParticulars For the year ended
March 31, 2020For the year ended
March 31, 2019A Gross NPA Ratio Shareholders' Funds NIL NIL Policyholders' Funds Non Linked Participating NIL NIL Non Participating NIL NIL Linked Non Participating 0.09% 0.10%B Net NPA Ratio Shareholders' Funds NIL NIL Policyholders' Funds Non Linked Participating NIL NIL Non Participating NIL NIL Linked Non Participating NIL 0.05%
Q. Solvency ratio
Particulars As at March 31, 2020
As at March 31, 2019
Solvency ratio 184% 188%
Solvency ratio has been stated on the basis of computation certified by Appointed Actuary and it excludes inadmissible assets as required by the IRDA (Assets, Liabilities and Solvency Margin of Insurers) regulations, 2016 and directions received from IRDAI from time to time.
7. Loan Assets restructured during the year are as follows:(` ‘000)
Sr No
Particulars As at March 31, 2020
As at March 31, 2019
1 Total amount of Loan Assets subject to restructuring Nil Nil2 Total amount of Standard Assets subject to restructuring Nil Nil3 Total amount of Sub-Standard Assets subject to restructuring Nil Nil4 Total amount of Doubtful Assets subject to restructuring Nil Nil
8. Impairment of investments In accordance with the Financial Statements Regulations, Schedule A Part I on Accounting Principle for Preparation
of Financial Statements on procedure to determine the value of investment and the relevant circular, the impairment in value of investments other than temporary diminution has been assessed as at March 31, 2020 and accordingly impairment provisions have been provided as below.
Listed equity shares A provision/(reversal) for impairment loss has been recognised in Revenue Account and Profit and Loss Account under
the head "Provision for diminution in the value of investments" and correspondingly, Policyholders’ and Shareholders' Fair Value Change Account under Policyholders’ and Shareholders' Funds respectively in the Balance Sheet have been adjusted for such (reversal)/provision of impairment loss, the details of which are given below:
(` ‘000)Sr No
Particulars As at March 31, 2020
As at March 31, 2019
1 Provision/(reversal) for diminution in the value of investments - Revenue Account 5,270,214 730,939 2 (Reversal)/provision in Policyholders' Fair Value change account - Balance Sheet (5,270,214) (730,939)3 Provision/(reversal) for diminution in the value of investments - Profit and Loss
Account 912,861 100,945
4 (Reversal)/provision in Shareholders' Fair Value change account - Balance Sheet (912,861) (100,945)
Schedules
50-149Management Review & Statutory Reports
150-414Financial Statements
415-425Embedded Value Results and Glossary of Terms
01-49Corporate Overview
Annual Report 2019-20 217
Security Receipts and Venture Fund A provision/(reversal) for impairment loss has been recognised in Revenue Account and Profit and Loss Account under
the head "Provision for diminution in the value of investments" and correspondingly, Other than Approved Investments under Schedule 8A (Policyholders' Investments) and Schedule 8 (Shareholders' Investments) respectively have been adjusted for such diminution, the details of which are been given below:
(` ‘000)Sr No
Particulars As at March 31, 2020
As at March 31, 2019
1 Provision/(reversal) for diminution in the value of investments - Revenue Account 699 9,730 2 Adjusted for diminution in Other than Approved Investments - Schedule 8A
(Policyholders' Investment) (699) (9,730)
3 Provision/(reversal) for diminution in the value of investments - Profit & Loss Account (3,329) (3,665)4 Adjusted for diminution in Other than Approved Investments - Schedule 8
(Shareholders' Investment) 3,329 3,665
Additional Tier1 (AT1) Bonds During the year ended March 31, 2020 the company has recognized Impairment provision, consequent to the RBI's
"Yes Bank Ltd Reconstruction Scheme 2020" wherein the Bank has fully written-down certain Basel III Additional Tier1 Bonds (AT1 Bonds).
As per Yes Banks (Bank) communication to exchanges; the Bank has informed that in line with the provisions of RBI's Basel III Capital Regulations 2015, the Perpetual Subordinated Basel III compliant AT1 Bonds issued by the Bank have been fully written down as Section 45 of Banking Regulation Act, 1949 has been invoked by RBI as part of the reconstruction scheme; the Bank thus was deemed to be non-viable or approaching non-viability and accordingly, the triggers for a write down of Basel III AT1 Bonds issued by the Bank was triggered. In view of the action taken by the Bank, an impairment provision of 100% of reporting value, amounting to ` 1,056,419 thousands was made in investment in Yes Bank AT1 Bonds, held in Shareholders Fund. Interest accrual of ` 20,168 thousands on these AT1 Bonds has also been reversed in the Profit & Loss Account.
A provision/(reversal) for impairment loss has been recognised in Profit & Loss Account under the head "Provision for diminution in the value of investments" and correspondingly, Other than Approved Investments under Schedule 8 (Shareholders' Investments) respectively have been adjusted for such diminution, the details of which are been given below:
(` ‘000)Sr No
Particulars As at March 31, 2020
As at March 31, 2019
1 Provision/(reversal) for diminution in the value of investments - Profit & Loss Account
1,056,419 -
2 (Reversal)/provision in Shareholders' Fair Value change account - Balance Sheet (268,919) - 3 Adjusted for diminution in Other than Approved Investments - Schedule 8
(Shareholders' Investment) (787,500) -
Non-Convertible Debentures (NCD's)/ Bonds During the year ended March 31, 2020 the company has provided for impairment on its investment in Yes Bank NCD's
owing to downgrade of the Yes Bank NCDs to Non-Investment grade investments by the SEBI approved Rating Agency. Impairment provision of ` 12,500 thousands and ` 37,500 thousands at 25% of Face Value (` 50,000 thousands and ` 150,000 thousands) has been recognized in the Profit & Loss Account and Revenue Account for investments held in Shareholder and Non-Linked Policyholder Fund respectively. In addition to the impairment provision, Mark to Market (MTM) impact of ` 149,616 thousands, in lines with the IRDAI valuation norms is recognized as Fair Value Change for Yes Bank NCDs (Face Value ` 750,000 thousands) held in Unit-Linked Policyholder Fund
(` ‘000)Sr No
Particulars As at March 31, 2020
As at March 31, 2019
1 Provision/(reversal) for diminution in the value of investments - Revenue Account 37,500 - 2 Adjusted for diminution in Other than Approved Investments - Short Term Schedule
8A (Policyholders' Investment) (37,500) -
3 Provision/(reversal) for diminution in the value of investments - Profit & Loss Account 12,500 - 4 Adjusted for diminution in Other than Approved Investments - Short Term Schedule
8 (Shareholders' Investment) (12,500) -
Schedules
218 Annual Report 2019-20
9. Statement containing names, descriptions, occupations of and directorships held by the persons in charge of management of the business under Section 11(3) of the Insurance Act, 1938 (amended by Insurance Laws (Amendment) Act, 2015)Sr No Name Description Directorship held as at March 31, 2020* Occupation
1 Ms. Vibha Padalkar Managing Director and Chief Executive Officer
HDFC Life Insurance Company Limited Employment
Director HDFC Pension Management Company Limited DirectorshipDirector HDFC Investments Limited DirectorshipDirector HDFC International Life and Re Company Limited DirectorshipDirector Tata Power Company Limited Directorship
2 Mr. Suresh Badami Executive Director HDFC Life Insurance Company Limited EmploymentDirector HDFC International Life and Re Company Limited Directorship
10. Following are the details of the controlled funds in pursuant to the Master Circulara) Statement showing the Controlled Fund
(` in crore)Particulars As at
March 31, 2020As at
March 31, 2019Computation of Controlled fund as per the Balance Sheet Policyholders' fund (Life fund)ParticipatingIndividual assurance 28,242.06 28,205.16 Group Assurance 2.92 2.87 Individual pension 2,664.60 2,598.51 Group Pension (0.37) (0.37)Group pension variable 0.00 0.00 Any other (Pl. Specify) - - Non-participatingIndividual assurance 7,502.38 3,844.85 Group assurance 8,990.18 7,391.29 Group assurance variable 2,953.31 2,449.31 Individual pension 1,071.80 889.27 Group pension 3,019.16 2,452.38 Group pension variable 3,545.10 2,669.48 Individual annuity 7,647.60 4,967.23 Group annuity 129.54 - Other (Health) 58.53 54.56 LinkedIndividual assurance 42,552.69 49,627.86 Group assurance - - Individual pension 6,148.64 8,472.55 Group superannuation 868.60 4,661.96 Group gratuity 4,988.78 940.36 Any other (Pl. Specify) - - Funds for Future Appropriations - - Credit (Debit) from Revenue Account - - Total (A) 120,385.52 119,227.26 Shareholders' fundPaid up capital 2,024.39 2,017.77 Reserves & Surpluses 398.21 366.86 Fair value change (191.97) (3.01)Total (B) 2,230.63 2,381.62 Misc. expenses not written off - - Credit / (Debit) from P&L A/c. 4,569.29 3,274.03 Total (C) 4,569.29 3,274.03 Total Shareholders' funds (B+C) 6,799.92 5,655.64 Controlled fund (Total (A+B+C)) 127,185.45 124,882.90
Schedules
50-149Management Review & Statutory Reports
150-414Financial Statements
415-425Embedded Value Results and Glossary of Terms
01-49Corporate Overview
Annual Report 2019-20 219
b) Reconciliation of the Controlled Fund with Revenue and Profit and Loss Account(` in crore)
Particulars As at March 31, 2020
As at March 31, 2019
Opening balance of Controlled fund 124,882.90 105,835.06 Add: InflowIncome - - Premium income 32,706.89 29,186.02 Less: Reinsurance ceded (483.29) (262.01)Net premium 32,223.60 28,924.00 Investment income (4,373.40) 9,517.59 Other income 243.95 176.12 Funds transferred from Shareholders' Accounts 104.75 308.95 Total income 28,198.90 38,925.60 Less: Outgo(i) Benefits paid (Net) 18,173.04 13,414.64 (ii) Interim & terminal bonus paid 848.44 574.27 (iii) Change in valuation of liability 2,440.76 17,507.46 (iv) Commission 1,491.18 1,131.53 (v) Operating expenses 4,266.90 3,800.77 (vi) Service tax charge on linked charges 353.24 339.82 (vii) Provision for taxation
(viii) Provisions (other than taxation)(a) Provision for diminution in the value of investment 530.84 74.07 (b) Others 36.58 16.50
Total Outgo 28,290.01 37,085.84 Surplus of the Policyholders' fund (91.11) 1,840.80 Less: Transferred to Shareholders' Account (1,191.39) (1,206.90)Net flow in Policyholders' account (1,282.50) 633.90 Add: Net income in Shareholders' fund 1,106.31 1,243.63 Net In Flow / Outflow (176.19) 1,877.52 Add: Change in valuation liabilities 2,440.76 17,507.46 Add: Increase in paid up capital 6.62 5.15 Less: Dividend and dividend distribution tax - (396.42)Add: Increase in Reserves & Surplus 31.35 54.11 Closing balance of Controlled fund 127,185.45 124,882.90 As per Balance Sheet 127,185.45 124,882.90 Difference, if any (Change in Fair Value - B/S) 0.00 0.00
c) Reconciliation with Shareholders' and Policyholders' Fund(` in crore)
Particulars As at March 31, 2020
As at March 31, 2019
Policyholders' funds Policyholders' funds - Traditional - Par and Non-ParOpening balance of the Policyholders' fund - Traditional - Par and Non-Par 55,524.52 43,565.94 Add: Surplus of the Revenue Account (219.97) 143.81 Add: Change in valuation liabilities 11,584.77 11,324.66 Add: Credit / [Debit] Fair Value change Account (1,062.52) 490.11 Total 65,826.80 55,524.52 As per Balance Sheet 65,826.80 55,524.52 Difference, if any (Change in Fair Value - B/S) (0.00) 0.00 Policyholders' funds – LinkedOpening balance of the Policyholders' funds - Linked 63,702.74 57,519.94 Add: Surplus of the Revenue Account - - Add: Change in valuation liabilities (9,625.73) 5,913.84 Add: Increase in discontinued Policies fund 481.72 268.96 Total 54,558.73 63,702.74
Schedules
220 Annual Report 2019-20
(` in crore)Particulars As at
March 31, 2020As at
March 31, 2019As per Balance Sheet 54,558.73 63,702.74 Difference, if any 0.00 0.00 Shareholders' fundsOpening balance of Shareholders' fund 5,655.64 4,749.19 Add: Net income of Shareholders' account (P&L) 1,106.31 1,243.63 Add: Infusion of capital 6.62 5.15 Less: Dividend and dividend distribution Tax - (396.42)Add: Increase in Reserves & Surplus 31.35 54.11 Total 6,799.92 5,655.64 As per Balance Sheet 6,799.92 5,655.64 Difference, if any 0.00 0.00
11. Penal actions taken during the year ended March 31, 2020 by various Government Authorities in pursuant to the Master Circular
(` ‘000)Sr No
Authority Non-Compliance/ Violation
Penalty Awarded
Penalty Paid
Penalty Waived/ Reduced
1 Insurance Regulatory and Development Authority NIL NIL NIL NIL 2 Income Tax Authorities NIL NIL NIL NIL 3 Service Tax Authorities NIL NIL NIL NIL 4 Any other Tax Authorities NIL NIL NIL NIL 5 Enforcement Directorate/ Adjudicating Authority/ Tribunal or
any Authority under FEMANIL NIL NIL NIL
6 Registrar of Companies/ NCLT/CLB/ Department of Corporate Affairs or any Authority under Companies Act, 2013
NIL NIL NIL NIL
7 Penalty awarded by any Court/ Tribunal for any matter including claim settlement but excluding compensation
NIL NIL NIL NIL
8 Securities and Exchange Board of India NIL NIL NIL NIL 9 Competition Commission of India10 Any other Central/State/Local Government / Statutory
AuthorityDamages against delayed payment to ESIC
40 40 NIL
12. Following is the statement showing the age-wise analysis of the unclaimed amount of the policyholders in pursuant to Master Circular on Unclaimed Amounts of Policyholders dated July 25, 2017
Statement showing age-wise analysis of the unclaimed amount of the policyholders as at March 31, 2020(` in lakh)
ParticularsTotal
Amount
AGE-WISE ANALYSIS 0-6
Months 7-12
Months 13-18
Months 19-24
Months 25-30
Months 31-36
Months 36-120 Months
Claims settled but not paid to the policyholders / beneficiaries due to any reasons except under litigation from the policyholders / beneficiaries
823 49 49 111 36 187 19 372
Sum due to policyholders / beneficiaries on maturity or otherwise
50,207 13,123 9,233 4,004 7,593 5,258 843 10,153
Any excess collection of premium / tax or any other charges which is refundable to the policyholders / beneficiaries either as terms of conditions of the policy or as per law or as may be directed by the Authority but not refunded so far
1,579 754 281 114 46 36 8 340
Cheques issued but not encashed by the policyholders / beneficiaries
18,795 4,233 8,225 4,568 109 3 3 1,654
Total 71,404 18,159 17,788 8,797 7,784 5,484 873 12,519
Schedules
50-149Management Review & Statutory Reports
150-414Financial Statements
415-425Embedded Value Results and Glossary of Terms
01-49Corporate Overview
Annual Report 2019-20 221
Statement showing age-wise analysis of the unclaimed amount of the policyholders as at March 31, 2019(` in lakh)
ParticularsTotal
Amount
AGE-WISE ANALYSIS 0-6
Months 7-12
Months 13-18
Months 19-24
Months 25-30
Months 31-36
Months 36-120*
Months Claims settled but not paid to the policyholders / beneficiaries due to any reasons except under litigation from the policyholders / beneficiaries
920 193 82 199 18 73 118 237
Sum due to policyholders / beneficiaries on maturity or otherwise
Any excess collection of premium / tax or any other charges which is refundable to the policyholders / beneficiaries either as terms of conditions of the policy or as per law or as may be directed by the Authority but not refunded so far
810 290 72 66 23 95 246 18
Cheques issued but not encashed by the policyholders / beneficiaries
5,134 3,452 374 230 5 292 127 654
Total 53,440 14,604 14,853 8,200 1,398 4,618 5,276 4,491
13. Following is the disclosure on movement in the unclaimed amounts in pursuant to Master Circular on Unclaimed Amounts of Policyholders
(` in lakh)Particulars For the year ended
March 31, 2020For the year ended
March 31, 2019Opening Balance 53,440 65,930 Add: Amount transferred to Unclaimed Fund 87,351 94,131 Add: Cheques issued out of unclaimed amount but not encashed by the policyholders (To be included only when the cheques are stale)
6,013 4
Add: Investment income on Unclaimed Fund 4,006 4,734 Less: Amount of claims paid during the year (79,322) (110,969)Less: Amount transferred to SCWF (net of claims paid in respect of amounts transferred earlier)
(84) (391)
Closing Balance of Unclaimed Amount Fund 71,404 53,440
14. Following is the disclosure relating to discontinued policies in accordance with the disclosure requirements of the Master Circular and the disclosure requirements under the IRDAI (Unit Linked Insurance Products) Regulations, 2019
(` ‘000)Particulars For the year ended
March 31, 2020For the year ended
March 31, 2019Fund for Discontinued policiesOpening Balance of Funds for Discontinued Policies 28,561,619 25,872,024 Add: Fund of policies discontinued during the year 15,342,710 11,219,319 Less: Fund of policies revived during the year (499,566) (605,639)Add: Net Income/ Gains on investment of the Fund 2,218,717 1,902,628 Less: Fund Management Charges levied (165,515) (143,252)Less: Amount refunded to policyholders during the year (12,079,103) (9,683,461)Closing Balance of Fund for Discontinued Policies 33,378,862 28,561,619 Other disclosuresNumber of policies discontinued during the year 177,150 141,879 Percentage of discontinued to total policies (product wise) during the year HDFC SL Crest 0.14% 0.16% HDFC SL ProGrowth Super II 1.46% 1.74% HDFC SL YoungStar Super II 0.00% 0.00% HDFC Pension Super Plus 0.03% 0.06%
Schedules
222 Annual Report 2019-20
(` ‘000)Particulars For the year ended
March 31, 2020For the year ended
March 31, 2019 HDFC SL Youngstar super premium 0.29% 0.43% HDFC SL Progrowth Flexi 0.51% 0.44% HDFC Click2Wealth 0.05% - HDFC ProGrowth Plus 1.87% 1.82% HDFC Click2Invest 0.52% 0.44% HDFC Click2Invest Plus 0.25% - HDFC Life Sampoorn Nivesh Plan 0.07% 0.06% HDFC Smart Woman 0.00% 0.00% HDFC Life Assured Pension Plan 0.04% 0.04% HDFC Life Click 2 Retire 0.00% 0.00% HDFC Life Capital Shield 0.02% 0.03% HDFC Life Investwise 0.00% - HDFC SL ProGrowth Maximiser 0.00% - HDFC Life Single Premium Pension Super 0.00% -Number of the policies revived during the year 13,098 25,743Percentage of the policies revived during the year 7% 18%Charges imposed on account of discontinued policies (`'000) 308,112 290,839 Charges readjusted on account of revival policies (`'000) 72,251 79,733
15. Following is the disclosure related to Participation of Insurers in Repo\Reverse Repo transactions in Government\Corporate Debt Securities in pursuant to IRDAI notification ref IRDA/F&I/CIR/INV/250/12/2012 dated December 4, 2012
* Includes Tri-Party Reverse Repo in Government Securities introduced by the Clearing Corporation of India Limited (CCIL) with effect from November 05, 2018.
16. In accordance with the IRDAI (Investment) Regulations 2016 and IRDAI circular IRDA/F&I/INV/CIR/062/03/2013 dated March 26, 2013, the Company has declared March 31, 2020 as a business day. NAV for all unit linked segments were declared on March 31, 2020. All applications received till 3 PM on March 31, 2020, were processed with NAV of March 31, 2020. Applications received after this cut-off for unit linked funds are taken into the next financial year.
17. On August 8, 2016, the Board of Directors of HDFC Life Insurance Company Limited ("HDFC Life"), Max Life Insurance Company Limited (“Max Life”), Max Financial Services Limited (“Max Financial”) and Max India Limited (“Max India”) at their respective board meetings, approved entering into definitive agreements for the amalgamation of the businesses between the above entities through a composite Scheme of Arrangement (“Scheme”). This transaction was mutually terminated on July 31, 2017 since the parties did not receive the requisite regulatory approvals.
Consequently, provisions no longer required were written back during the previous year ended March 31, 2019 under the expense head 'Legal & professional charges' amounting to ` 32,862 thousands in Schedule 3A - Shareholder Expenses.
Schedules
50-149Management Review & Statutory Reports
150-414Financial Statements
415-425Embedded Value Results and Glossary of Terms
01-49Corporate Overview
Annual Report 2019-20 223
18. Long term contracts The Company has a process whereby periodically all long term contracts are assessed for material foreseeable
losses. At the year end, the Company has reviewed and ensured that adequate provisions as required under any law/accounting standard for material foreseeable losses on such long term contracts including derivative contracts has been made in the financial statements.
For insurance contracts, actuarial valuation of liabilities for policies in force is done by the Appointed Actuary of the Company. The assumptions used in valuation of liabilities for policies in force are in accordance with the guidelines and norms issued by the IRDAI and the Institute of Actuaries of India in concurrence with the IRDAI.
19. As per IRDAI Master Circular on Unclaimed Amounts of Policyholders IRDA/F&A/CIR/Misc/173/07/2017 dated July 25, 2017, the unclaimed amount of policyholders outstanding for a period of more than 10 years as on September 30, every year has been transferred to Senior Citizen's Welfare Fund.
(` ‘000)Particulars For the year ended
March 31, 2020For the year ended
March 31, 2019Amount transferred during the year to Senior Citizen's Welfare Fund 8,434 39,069
20. COVID-19 In light of the COVID-19’outbreak and information available upto the date of approval of these standalone financial
results, the Company has assessed the impact on assets, including valuation and impairment of investments, liabilities including policy liability and solvency position. Based on the evaluation, the company has made:
(a) Adequate impairment provisions on the investments to an extent necessary.
(b) Additional death claim provision of ` 410,000 thousands as at the Balance sheet date, this provision is over and above the policy level liabilities calculated based on the prescribed IRDAI regulations.
The Company has also assessed its solvency position as at the balance sheet date and is at 184%, which is above the prescribed regulatory limit of 150%. Further, based on the Company’s current assessment of the business operations over next one year, it expects the solvency ratio to continue to remain above the minimum limit prescribed by the Insurance regulator.The impact of the global health pandemic may be different from that estimated as at the date of approval of these financial statements. The Company will continue to closely monitor any material changes to future economic conditions.