U.S. Department of Commerce Economics and Statistics Administration U.S. CENSUS BUREAU School Enrollment in the United States: 2008 Population Characteristics Issued June 2011 Current Population Reports By Jessica W. Davis and Kurt Bauman This report discusses school enrollment levels and trends in the population aged 3 and older based on data collected in 2008 by the U.S. Census Bureau in the American Community Survey (ACS) and the Current Population Survey (CPS). This is the second report in a series of reports using both ACS and CPS data to discuss school enrollment. The two surveys are used in this report because of their com- plimentary strengths in providing data on enrollment. The ACS is a valuable source of school enrollment data because of its large sample size and ability to provide statistics for small levels of geography. The CPS data offer a detailed selection of questions on school enrollment, allowing for unique analysis. Highlights of the report are: • Enrollment in Grades 1 through 12 fell from 50.0 million in 2000 to 49.3 million in 2008. • In 2008, college enrollment was at an all-time high with 18.6 million students enrolled, up 22 percent from 15.3 million in 2000. • Two-year college enrollment was also at an all-time high in 2008, with 5.3 million students enrolled, up 40 percent from 3.8 million in 2000. • In 2008, 1 million Hispanic students were enrolled in 2-year colleges, up 85 percent from 540,000 in 2000. • The number of students enrolled in nursery school in 2008 was not statisti- cally different from the number of stu- dents enrolled in 1998; however, there were changes in the race and Hispanic origin of the students. Hispanic students made up 18 percent of nursery school students, up from 13 percent in 1998. • In October 2008, the majority of kindergarten students, 72 percent, were enrolled in full-day kindergarten programs, up from 28 percent of stu- dents enrolled in full-day kindergarten programs in 1978. THE ACS AND THE CPS: TWO SOURCES OF SCHOOL ENROLLMENT DATA The ACS, part of the Census Bureau’s reengineered 2010 Census program, looks at a wide range of social, economic, and housing characteristics for the population by a multitude of demographic variables. The ACS is used to provide annual data on more than 7,000 areas, including all congressional districts as well as counties, cities, metro areas, and American Indian and Alaska Native areas with a population of 65,000 or more. In 2008, the Census Bureau released 3-year estimates from the ACS for areas with populations larger than 20,000. It started the release of 5-year estimates for all geographic areas down to the tract level beginning in 2010. The ACS information comes from a sample of about 3 million addresses, or 1.7 percent of the nation’s population each year. In contrast with the CPS, the ACS is admin- istered to the entire resident population, including those living in institutions and other group quarters. In this respect, data from the ACS are highly comparable with data collected in Census 2000 and earlier P20-564
Transcript
U.S. Department of CommerceEconomicsandStatisticsAdministration
U.S.CENSUSBUREAU
School Enrollment in the United States: 2008Population Characteristics
IssuedJune2011
CurrentPopulationReports
By Jessica W. Davis and Kurt Bauman
This report discusses school enrollment levels and trends in the population aged 3 and older based on data collected in 2008 by the U.S. Census Bureau in the American Community Survey (ACS) and the Current Population Survey (CPS). This is the second report in a series of reports using both ACS and CPS data to discuss school enrollment. The two surveys are used in this report because of their com-plimentary strengths in providing data on enrollment. The ACS is a valuable source of school enrollment data because of its large sample size and ability to provide statistics for small levels of geography. The CPS data offer a detailed selection of questions on school enrollment, allowing for unique analysis.
Highlights of the report are:
•EnrollmentinGrades1through12 fell from 50.0 million in 2000 to 49.3 million in 2008.
•In2008,collegeenrollmentwasat anall-timehighwith18.6million students enrolled, up 22 percent from15.3millionin2000.
•Two-yearcollegeenrollmentwas also at an all-time high in 2008, with 5.3 million students enrolled, up 40 percent from 3.8 million in 2000.
•In2008,1millionHispanicstudentswere enrolled in 2-year colleges, up 85 percent from 540,000 in 2000.
•Thenumberofstudentsenrolledinnursery school in 2008 was not statisti-cally different from the number of stu-dentsenrolledin1998;however,there
were changes in the race and Hispanic origin of the students. Hispanicstudentsmadeup18percentof nursery school students, up from 13percentin1998.
•InOctober2008,themajorityof kindergarten students, 72 percent, were enrolled in full-day kindergarten programs, up from 28 percent of stu-dents enrolled in full-day kindergarten programsin1978.
THE ACS AND THE CPS: TWO SOURCES OF SCHOOL ENROLLMENT DATA
The ACS, part of the Census Bureau’s reengineered2010Censusprogram,looksat a wide range of social, economic, and housing characteristics for the population by a multitude of demographic variables. The ACS is used to provide annual data on more than 7,000 areas, including all congressional districts as well as counties, cities,metroareas,andAmericanIndianand Alaska Native areas with a population of65,000ormore.In2008,theCensusBureau released 3-year estimates from the ACS for areas with populations larger than 20,000.Itstartedthereleaseof5-yearestimates for all geographic areas down tothetractlevelbeginningin2010.TheACS information comes from a sample of about3millionaddresses,or1.7percentofthenation’spopulationeachyear.Incontrast with the CPS, the ACS is admin-istered to the entire resident population, including those living in institutions and othergroupquarters.Inthisrespect,datafrom the ACS are highly comparable with data collected in Census 2000 and earlier
P20-564
2 U.S. Census Bureau
decennial censuses.1 The ACS asks respondents throughout the entire calendar year whether they were enrolled in regular school at any time in the 3 months before the interview. The survey also asks whether each person attended pub-lic school or private school, and in what grade or level the person was enrolled. Tables from the ACS about school enrollment can be accessed through the American FactFinder on the Census Bureau’s Web site at <http://factfinder.census.gov>.
The CPS samples approximately 72,000 housing units each month. Unlike the ACS, the reference popu-lation is the civilian noninstitution-alized population, so people living in institutions are not included. While the sample size is not suf-ficient to describe small geographic areas, the CPS is designed to meet reliability requirements for the 50 states and the District of Columbia.Estimatesofschoolenrollment from the CPS are based on a special supplement, admin-isteredeachOctobersince1956,allowing the construction of a time series of trends for school enroll-ment. The supplement on school enrollment asks detailed questions ofchildrenaged3to14andpeopleaged15andolder.Twentyques-tions are asked, gathering informa-tion on single year of enrollment, enrollment status and level for thepreviousyear;whethertherespondent goes to school full-time orpart-time;whethertheyattenda2-yearor4-yearinstitution;whether they are obtaining any vocationaltraining;andwhatyearthey received their most recent degree. Tables about students and
1OtherdifferencesbetweentheACSandCensus 2000 affect comparisons of school enrollment.Oneofthemostimportantisthe reference time of data collection, which is the 3 months preceding collection (which occurs year-round) in the ACS but is fixed to thetimeprecedingApril1inthecensus.Thisdifference especially affects comparisons of enrollment by age.
school enrollment from the CPS can be found on the Census Bureau’s Web site at <http://www.census .gov/population/www/socdemo /school.html>.
To learn more about the differ-ences between the ACS and CPS, see the comparison grid (Appendix Table A) at the end of this report.
SCHOOL ENROLLMENT
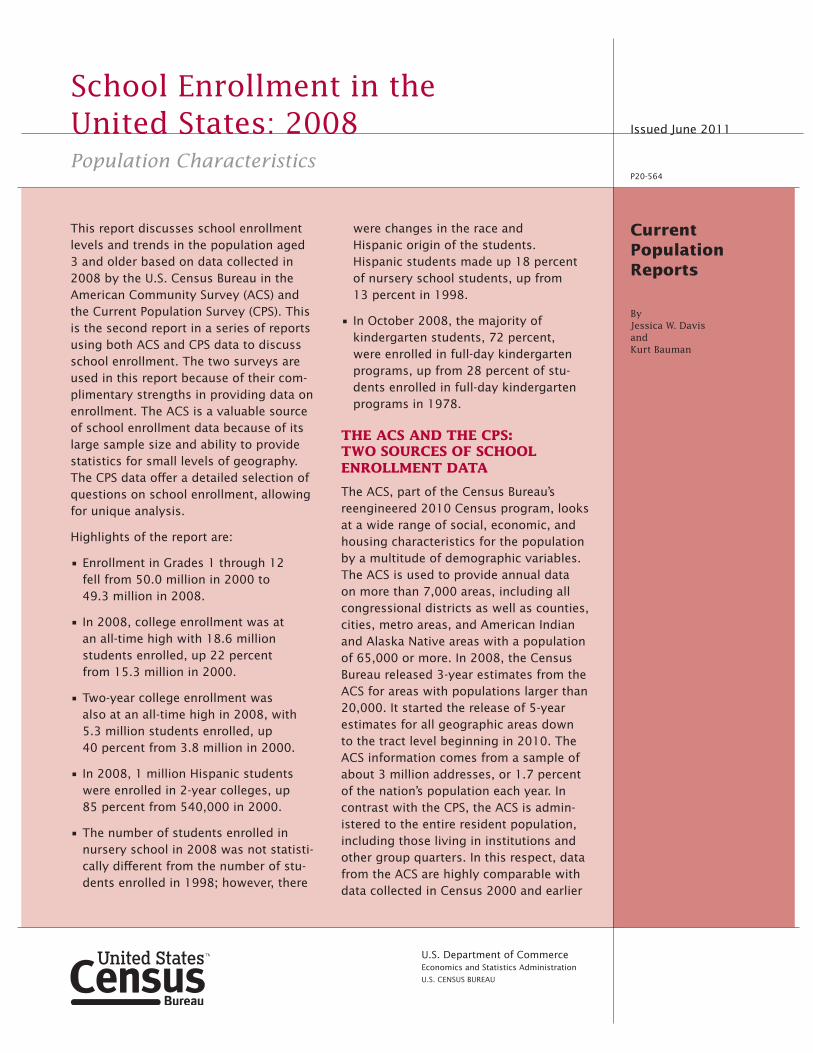
Due to its sample size, the ACS is used in this section to describe overall school enrollment in the UnitedStates.In2008therewere79.9 million people aged 3 and older enrolled in school. There were5.1millionchildrenenrolledin nursery school, 53.4 million students enrolled in kindergarten through twelfth grade, and 21.4millionstudentsenrolledincollegein2008(Figure1).More females than males were enrolled in school but their num-bers exceeded males only at the undergraduate and graduate school levels. More males were enrolled than females in nursery school,
kindergarten, and first through twelfthgrade(Table1).
Themajorityofstudentswerenon-Hispanic White (59 percent), followed by Hispanic students (18percent),Blackstudents (15percent),andAsianstudents(5 percent).2 Foreign-born stu-dents made up 7 percent of all enrolled students and 22 percent of
2 Federal surveys now give respondents the option of reporting more than one race. Therefore, two basic ways of defining a race group are possible. A group such as Asian may be defined as those who reported Asian and no other race (the race-alone or single-race concept) or as those who reported Asian regardless of whether they also reported another race (the race-alone-or-in-combina-tion concept). This report shows data using the first approach (race alone). This report will refer to the White-alone population as White, the Black-alone population as Black, the Asian-alone population as Asian, and the White-alone-non-Hispanic population as non-Hispanic White. Use of the single-race popula-tion does not imply that it is the preferred method of presenting or analyzing data. The Census Bureau uses a variety of approaches. Inthisreport,theterm“non-HispanicWhite”refers to people who are not Hispanic and who reported White and no other race. The Census Bureau uses non-Hispanic White as the comparison group for other race groups and Hispanics. Because Hispanics may be any race, data in this report for Hispanics overlap with data for racial groups.
Nursery
Kindergarten
Elementary(grades 1 through 4)
Elementary(grades 5 through 8)
High school(grades 9 through 12)
College(undergraduate)
College(graduate or professional)
5.1
4.1
15.9
17.5
16.2
17.2
3.9
Figure 1.Number of Students Aged 3 and Older Enrolled in School by Level: 2008(In millions)
Source: U.S. Census Bureau, 2008 American Community Survey. For information on sampling and nonsampling error, see <www.census.gov/acs/www/Downloads/data_documentation/Accuracy/accuracy2008.pdf>.
U.S. Census Bureau 3
graduate students. Most students (83 percent) attended public schools. Among students attending private schools, the largest propor-tion were enrolled at the under- graduate college level (29 percent), followed by the nursery school level(17percent).
The next section will examine nursery school enrollment and the following sections will examine
kindergarten through twelfth grade, high school drop-outs, modal grade, and college enrollment.
NURSERY SCHOOL
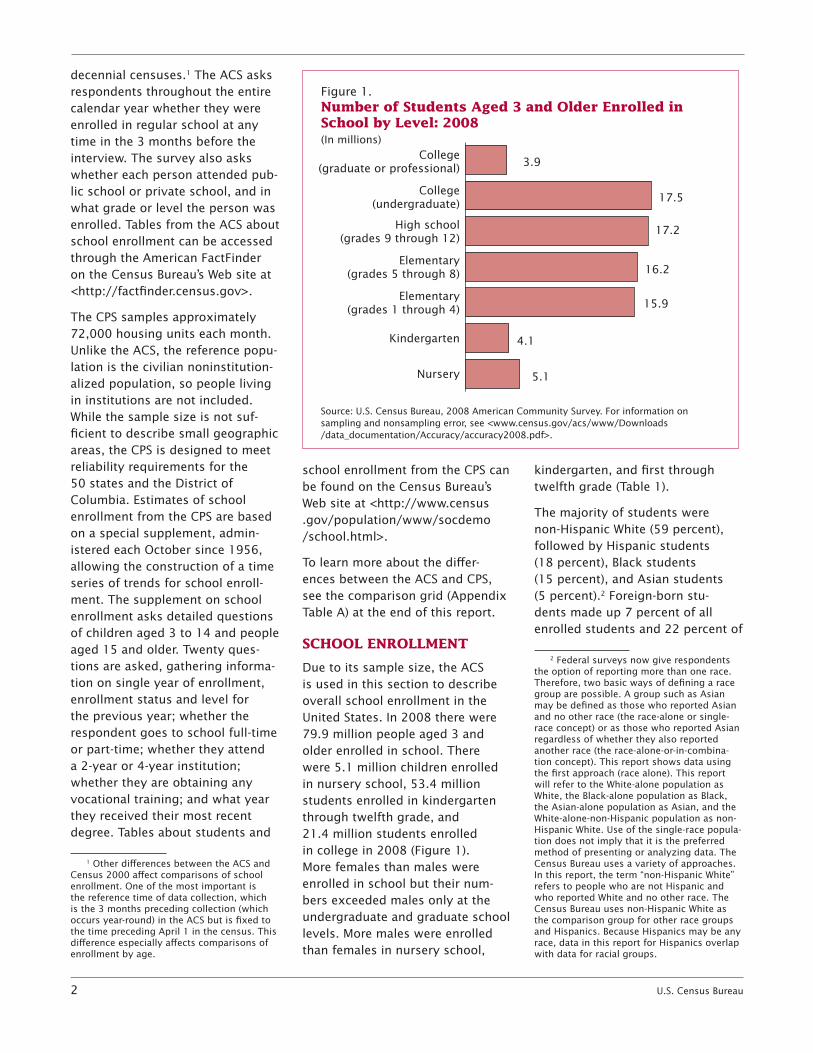
Since the CPS has been collected for decades, data from this survey can be used to examine changes over time in nursery school enrollment. The nursery school enrollment rates of both 3- and
4-year-oldsincreasedfrom1994 to 2008—from 54 percent to 59 percent for 4-year-olds and from 33 percent to 37 percent for 3-year-olds (Figure 2).3
Most of the increase in nursery school enrollment came before
3 In2008,overhalfofstudentsenrolledin nursery school were 4 years old (59 per-cent) and most of the rest were 3 years old (37 percent). Children aged 5 and older made up12percentofnurseryschoolstudents.
Table1.School Enrollment by Level of Enrollment and Selected Characteristic: 2008(Population aged 3 and older enrolled in school. Numbers in thousands)
Source: U .S . Census Bureau, 2008 American Community Survey . For information on sampling and nonsampling error, see <www .census .gov/acs/www/Downloads/data_documentation/Accuracy/accuracy2008 .pdf> .
4 U.S. Census Bureau
1998.Thenumberofstudentsenrolled in nursery school in 2008 was not statistically different from the number of students enrolled in1998.Enrollmentof4-year-oldsin1998(60percent)isnotstatisti-cally different from the percent-age enrolled in 2008 (59 percent). Enrollmentof3-year-oldshasalsoremained statistically unchanged since a decade ago.4
Themajorityofstudentsenrolledin nursery school in 2008 were non-Hispanic White (59 percent), followed by Hispanic students (18percent),Blackstudents (15percent),andAsianstudents (4 percent). Ten years ago, non-Hispanic White students made
4 There was no statistical difference betweenenrollmentof3-year-oldsin1998(37 percent) and enrollment in 2008 (37 percent). The 90 percent confidence interval includes zero. The Census Bureau does not have sufficient statistical evidence to conclude that the actual change is different from zero.
up64percentofnurseryschoolenrollment, followed by Black students(16percent),Hispanicstudents(13percent),andAsianstudents (4 percent).5
Overhalfofallstudentsenrolledinnursery school (57 percent) went to a public nursery school. More students attended a part-day nurs-ery school program than a full-day nursery school program.6
For some families, the cost of attending nursery school may prevent them from enrolling their children.In2008,56percentof3- and 4-year-olds from families with incomes of $40,000 or more
5 There was no statistical difference between the enrollment of Black students in nurseryschoolin1998(16percent)andin2008(15percent).Inaddition,therewasnostatistical difference between enrollment of Asianstudentsinnurseryschoolin1998 (4 percent) and in 2008 (4 percent).
6In2008part-daynurseryschoolatten-dance (52 percent) was higher than full-day nursery school attendance (48 percent).
attended nursery school, compared with 44 percent of those from families with incomes of less than $20,000.7
Nursery school enrollment is also related to the education and labor force participation of a child’s mother. Children of mothers who are college graduates were more likely to attend nursery school than children whose mothers did notfinishhighschool(62percentcompared to 33 percent).8 Chil-dren of mothers in the labor force were more likely to attend nursery school than those whose mothers were not in the labor force (54 per-centcomparedwith41percent).
KINDERGARTEN
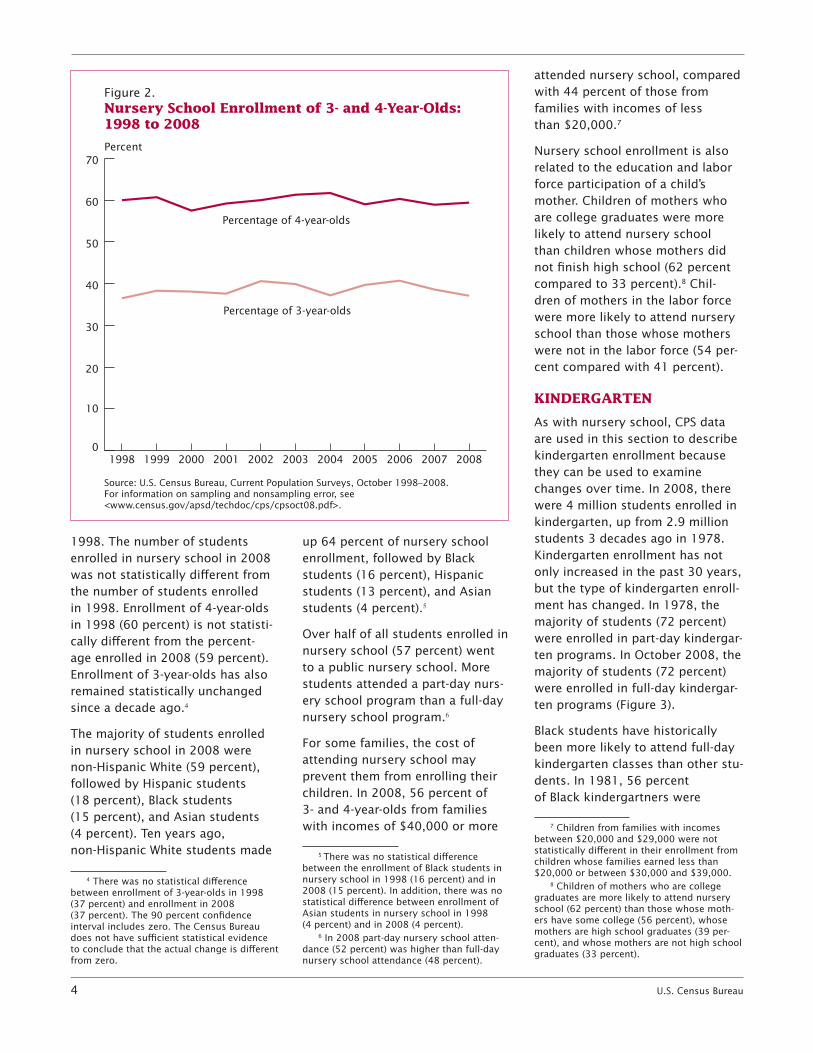
As with nursery school, CPS data are used in this section to describe kindergarten enrollment because they can be used to examine changesovertime.In2008,therewere 4 million students enrolled in kindergarten, up from 2.9 million students3decadesagoin1978.Kindergarten enrollment has not only increased in the past 30 years, but the type of kindergarten enroll-menthaschanged.In1978,themajorityofstudents(72percent)were enrolled in part-day kindergar-tenprograms.InOctober2008,themajorityofstudents(72percent)were enrolled in full-day kindergar-ten programs (Figure 3).
Black students have historically been more likely to attend full-day kindergarten classes than other stu-dents.In1981,56percent of Black kindergartners were
7 Children from families with incomes between $20,000 and $29,000 were not statistically different in their enrollment from children whose families earned less than $20,000 or between $30,000 and $39,000.
8 Children of mothers who are college graduates are more likely to attend nursery school(62percent)thanthosewhosemoth-ershavesomecollege(56percent),whosemothers are high school graduates (39 per-cent), and whose mothers are not high school graduates (33 percent).
Percentage of 4-year-olds
0
10
20
30
40
50
60
70
20082007200620052004200320022001200019991998
Percent
Figure 2.Nursery School Enrollment of 3- and 4-Year-Olds: 1998 to 2008
Source: U.S. Census Bureau, Current Population Surveys, October 1998–2008. For information on sampling and nonsampling error, see <www.census.gov/apsd/techdoc/cps/cpsoct08.pdf>.
Percentage of 3-year-olds
U.S. Census Bureau 5
enrolled in full-day programs, comparedto26percentof non-Hispanic White kindergart-ners.In2008,81percentofBlackstudents were enrolled in full-day kindergarten programs, compared to 70 percent of non-Hispanic Whitestudentsand69percentof Hispanic students.
The increase in attendance of full-day kindergarten programs may reflect the changing needs of chil-dren and their families. However, changes in kindergarten enrollment patterns are not perfectly associ-ated with changes in employment patternsoftheirparents.In1986,57 percent of married couples withchildrenunder18hadbothspouses in the labor force. The ercentageroseto68percentin2000 and was slightly lower at 66percentin2008.Thepercent-age of children enrolled in full-day kindergarten continued to increase
from60to72percentfrom2000to 2008.
In2008,41percentofstudentsenrolled in full-day kindergarten programs had a mother employed full-time, compared with the 15percentwhosemothers were employed part-time, and 32 percent of full-day kindergarten students whose mothers were not in the labor force.9Oneinfourstu-dents enrolled in full-day programs came from families with incomes of $75,000 or more.
PRIMARY AND SECONDARY ENROLLMENT
The ACS is used in this section because it provides a look at geographic variations in school enrollment.Overallenrollment inGrades1through12fellslightly
9Theremaining13percentofchildrenin full-day kindergarten programs were made up of children not living with a mother (7 percent) and children whose mother’s were unemployed(6percent)andthesewerenotstatistically different from one another.
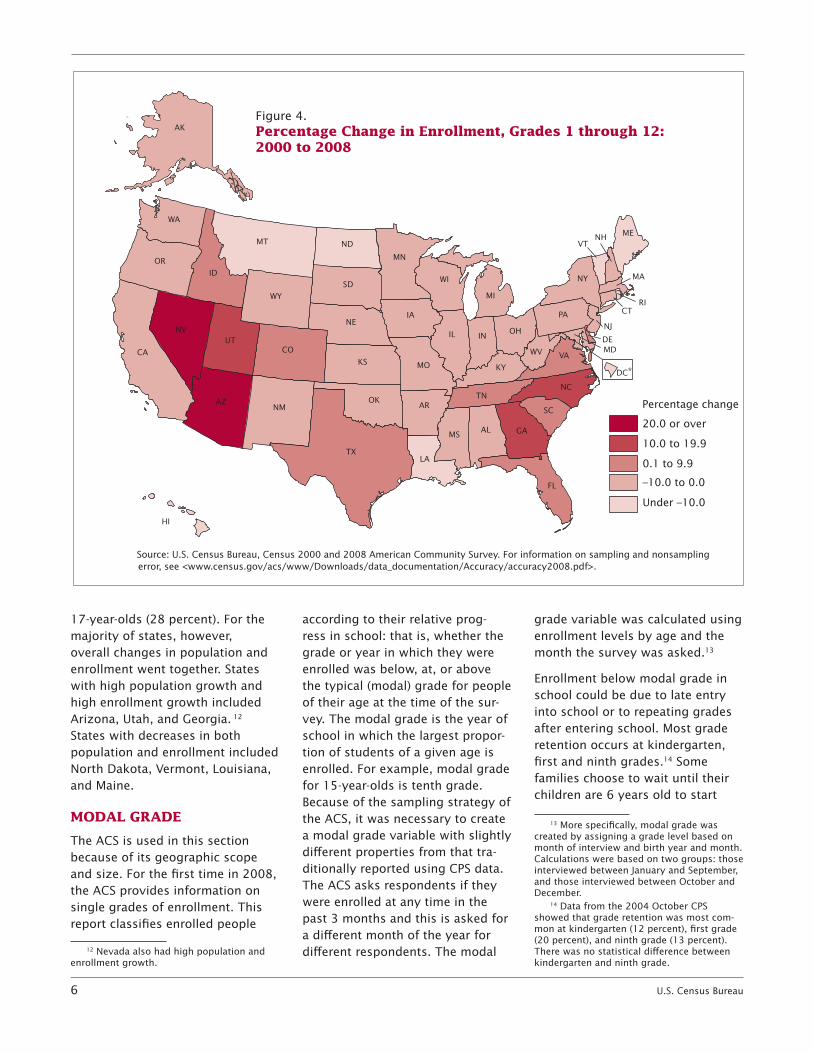
from 50 million in 2000 to 49.3 million in 2008.10 However, the decrease in enrollment was not experienced evenly across states. Data from 2000 and 2008 showedthatwhile13statessawanincreaseinenrollmentforGrades1through12,37statesexperiencedadecrease.Ofthe13stateswithan apparent increase in enrollment, only 7 had a statistically significant increase.Ofthe37stateswithanapparent decrease in enrollment, only16hadastatisticallysignifi-cant decrease (Figure 4).11 Change in enrollment across states was almost perfectly correlated with changeintheaged5to17popula-tion (a correlation of .998).
Enrollmentchangestrackcloselywithchangesintheaged5to17population. They also correlate with overall population change in astate(allages).InMontanaandAlaska school enrollment declined by10percentwhileoverallpopu-lation grew by 3 and 4 percent, respectively.Incontrast,Nevadahad the highest population growth rate in the overall population (24 percent), but even faster growth in enrollment of 5- to
10In2000,98.2percentof5-to17-year-oldswereenrolledinschooland in2008,96.8percentof5-to17-year-oldswere enrolled in school. There was no statis-tical difference between the number of 5- to 17-year-oldsin2000(53.1million)andthenumberof5-to17-year-oldsin2008 (53.0 million).
11The states whose decrease in first through twelfth grade enrollment from 2000 to 2008 was statistically significant were California,Iowa,Louisiana,Maine,Maryland,Massachusetts, Michigan, Minnesota, Montana,NewYork,NorthDakota,Ohio,Pennsylvania,RhodeIsland,Vermont,andWisconsin. The states whose decrease was not statistically significant were Alabama, Alaska, Arkansas, Connecticut, the District ofColumbia,Hawaii,Illinois,Indiana, Kansas, Kentucky, Mississippi, Missouri, Nebraska, New Hampshire, New Jersey, NewMexico,Oklahoma,Oregon,SouthDakota,Washington,WestVirginia,andWyoming. States with a statistically significant increase in enrollment from 2000 to 2008 wereArizona,Florida,Georgia,Nevada,NorthCarolina, Texas, and Utah. The states whose increase was not statistically significant were Colorado,Delaware,Idaho,SouthCarolina,Tennessee,andVirginia.
0
10
20
30
40
50
60
70
80
90
100
2008200319981993198819831978
Figure 3.Enrollment in Full- and Part-DayKindergarten: 1978 to 2008
Source: U.S. Census Bureau, Current Population Survey, October 1978–2008.For information on sampling and nonsampling error, see <www.census.gov/apsd/techdoc/cps/cpsoct08.pdf>.
Proportion part-day
Proportion full-day
6 U.S. Census Bureau
17-year-olds(28percent).Forthemajorityofstates,however, overall changes in population and enrollment went together. States with high population growth and high enrollment growth included Arizona,Utah,andGeorgia.12 States with decreases in both population and enrollment included NorthDakota,Vermont,Louisiana,and Maine.
MODAL GRADE
The ACS is used in this section because of its geographic scope and size. For the first time in 2008, the ACS provides information on single grades of enrollment. This report classifies enrolled people
12 Nevada also had high population and enrollment growth.
according to their relative prog-ress in school: that is, whether the grade or year in which they were enrolled was below, at, or above the typical (modal) grade for people of their age at the time of the sur-vey. The modal grade is the year of school in which the largest propor-tion of students of a given age is enrolled. For example, modal grade for15-year-oldsistenthgrade.Because of the sampling strategy of the ACS, it was necessary to create a modal grade variable with slightly different properties from that tra-ditionally reported using CPS data. The ACS asks respondents if they were enrolled at any time in the past 3 months and this is asked for a different month of the year for different respondents. The modal
grade variable was calculated using enrollment levels by age and the month the survey was asked.13
Enrollmentbelowmodalgradeinschool could be due to late entry into school or to repeating grades after entering school. Most grade retention occurs at kindergarten, first and ninth grades.14 Some families choose to wait until their childrenare6yearsoldtostart
13 More specifically, modal grade was created by assigning a grade level based on month of interview and birth year and month. Calculations were based on two groups: those interviewed between January and September, andthoseinterviewedbetweenOctoberandDecember.
14Datafromthe2004OctoberCPSshowed that grade retention was most com-monatkindergarten(12percent),firstgrade(20percent),andninthgrade(13percent).There was no statistical difference between kindergarten and ninth grade.
20.0 or over
10.0 to 19.9
0.1 to 9.9 –10.0 to 0.0 Under –10.0
MT
AK
NM
OR MN
KS
SD
ND
MO
WA
FL
IL IN
WI NY
PA
MI
OH
IA
ME
MA
CT
AZ
NV
TX
COCA
WY
UT
ID
NE
OK
GA
AR
AL
NC
MS
LA
TN
KY
VA
SC
WV
RI
DE MD
NJ
HI
VTNH
DC *
Percentage change
Figure 4.Percentage Change in Enrollment, Grades 1 through 12:2000 to 2008
Source: U.S. Census Bureau, Census 2000 and 2008 American Community Survey. For information on sampling and nonsamplingerror, see <www.census.gov/acs/www/Downloads/data_documentation/Accuracy/accuracy2008.pdf>.
U.S. Census Bureau 7
kindergarten to ensure that their children are mature enough, either physically or academically, for school. Sometimes this phenom-enonisreferredtoas“academic redshirting.”15
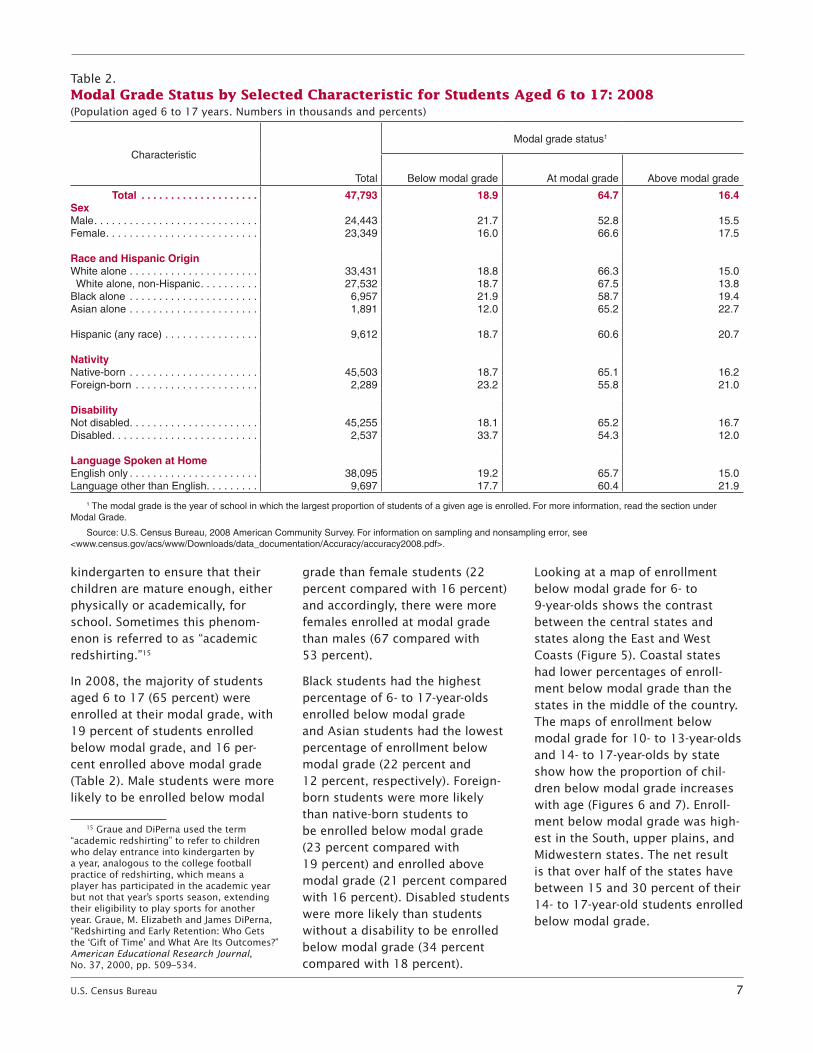
In2008,themajorityofstudentsaged6to17(65percent)wereenrolled at their modal grade, with 19percentofstudentsenrolledbelowmodalgrade,and16per-cent enrolled above modal grade (Table 2). Male students were more likely to be enrolled below modal
15GraueandDiPernausedtheterm“academicredshirting”torefertochildrenwho delay entrance into kindergarten by a year, analogous to the college football practice of redshirting, which means a player has participated in the academic year but not that year’s sports season, extending their eligibility to play sports for another year.Graue,M.ElizabethandJamesDiPerna,“RedshirtingandEarlyRetention:WhoGetsthe‘GiftofTime’andWhatAreItsOutcomes?”American Educational Research Journal,No. 37, 2000, pp. 509–534.
grade than female students (22 percentcomparedwith16percent)and accordingly, there were more females enrolled at modal grade thanmales(67comparedwith 53 percent).
Black students had the highest percentageof6-to17-year-oldsenrolled below modal grade and Asian students had the lowest percentage of enrollment below modal grade (22 percent and 12percent,respectively).Foreign-born students were more likely than native-born students to be enrolled below modal grade (23 percent compared with 19percent)andenrolledabovemodalgrade(21percentcomparedwith16percent).Disabledstudentswere more likely than students without a disability to be enrolled below modal grade (34 percent comparedwith18percent).
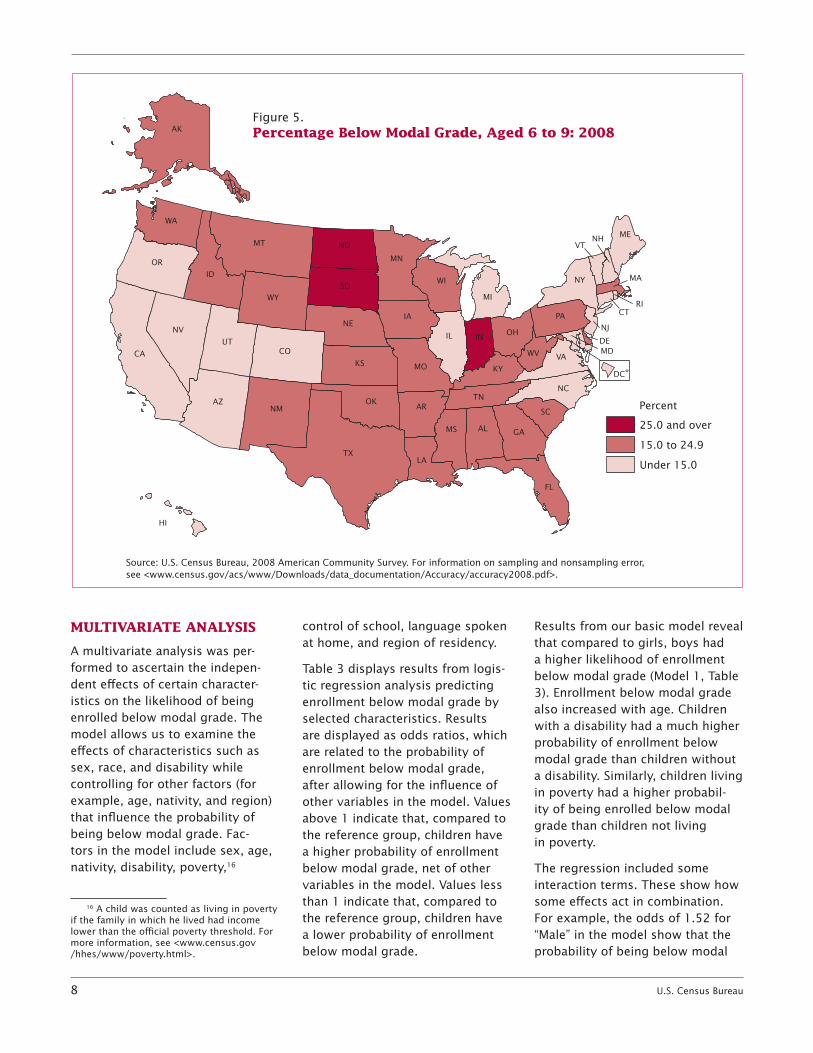
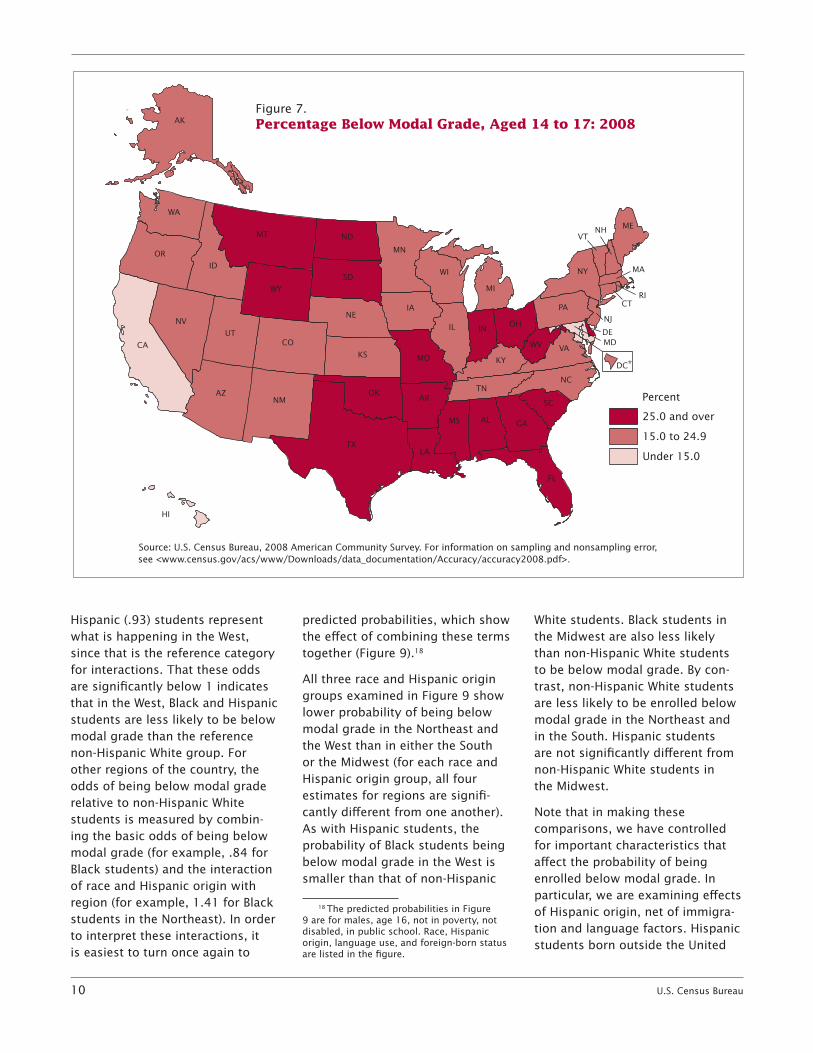
Lookingatamapofenrollmentbelowmodalgradefor6-to 9-year-olds shows the contrast between the central states and statesalongtheEastandWestCoasts (Figure 5). Coastal states had lower percentages of enroll-ment below modal grade than the states in the middle of the country. The maps of enrollment below modalgradefor10-to13-year-oldsand14-to17-year-oldsbystateshow how the proportion of chil-dren below modal grade increases withage(Figures6and7).Enroll-ment below modal grade was high-est in the South, upper plains, and Midwestern states. The net result is that over half of the states have between15and30percentoftheir14-to17-year-oldstudentsenrolledbelow modal grade.
Table 2.Modal Grade Status by Selected Characteristic for Students Aged 6 to 17: 2008(Populationaged6to17years.Numbersinthousandsandpercents)
Characteristic
Total
Modal grade status1
Below modal grade At modal grade Above modal grade
Language Spoken at HomeEnglish only . . . . . . . . . . . . . . . . . . . . . . 38,095 19 .2 65 .7 15 .0Language other than English . . . . . . . . . 9,697 17 .7 60 .4 21 .9
1 The modal grade is the year of school in which the largest proportion of students of a given age is enrolled . For more information, read the section under Modal Grade .
Source: U .S . Census Bureau, 2008 American Community Survey . For information on sampling and nonsampling error, see <www .census .gov/acs/www/Downloads/data_documentation/Accuracy/accuracy2008 .pdf> .
8 U.S. Census Bureau
MULTIVARIATE ANALYSIS
A multivariate analysis was per-formed to ascertain the indepen-dent effects of certain character-istics on the likelihood of being enrolled below modal grade. The model allows us to examine the effects of characteristics such as sex, race, and disability while controlling for other factors (for example, age, nativity, and region) that influence the probability of being below modal grade. Fac-tors in the model include sex, age, nativity, disability, poverty,16
16 A child was counted as living in poverty if the family in which he lived had income lower than the official poverty threshold. For more information, see <www.census.gov /hhes/www/poverty.html>.
control of school, language spoken at home, and region of residency.
Table 3 displays results from logis-tic regression analysis predicting enrollment below modal grade by selectedcharacteristics.Resultsare displayed as odds ratios, which are related to the probability of enrollment below modal grade, after allowing for the influence of othervariablesinthemodel.Valuesabove1indicatethat,comparedtothe reference group, children have a higher probability of enrollment below modal grade, net of other variablesinthemodel.Valueslessthan1indicatethat,comparedtothe reference group, children have a lower probability of enrollment below modal grade.
Resultsfromourbasicmodelrevealthat compared to girls, boys had a higher likelihood of enrollment belowmodalgrade(Model1,Table3).Enrollmentbelowmodalgradealso increased with age. Children with a disability had a much higher probability of enrollment below modal grade than children without a disability. Similarly, children living in poverty had a higher probabil-ity of being enrolled below modal grade than children not living in poverty.
The regression included some interaction terms. These show how some effects act in combination. Forexample,theoddsof1.52for“Male”inthemodelshowthattheprobability of being below modal
25.0 and over
15.0 to 24.9
Under 15.0
U.S. average: 11.2 percent
MT
AK
NM
OR MN
KS
SD
ND
MO
WA
FL
IL IN
WI NY
PA
MI
OH
IA
ME
MA
CT
AZ
NV
TX
COCA
WY
UT
ID
NE
OK
GA
AR
AL
NC
MS
LA
TN
KY
VA
SC
WV
RI
DE MD
NJ
HI
VTNH
DC *
Percent
Figure 5.Percentage Below Modal Grade, Aged 6 to 9: 2008
Source: U.S. Census Bureau, 2008 American Community Survey. For information on sampling and nonsampling error, see <www.census.gov/acs/www/Downloads/data_documentation/Accuracy/accuracy2008.pdf>.
U.S. Census Bureau 9
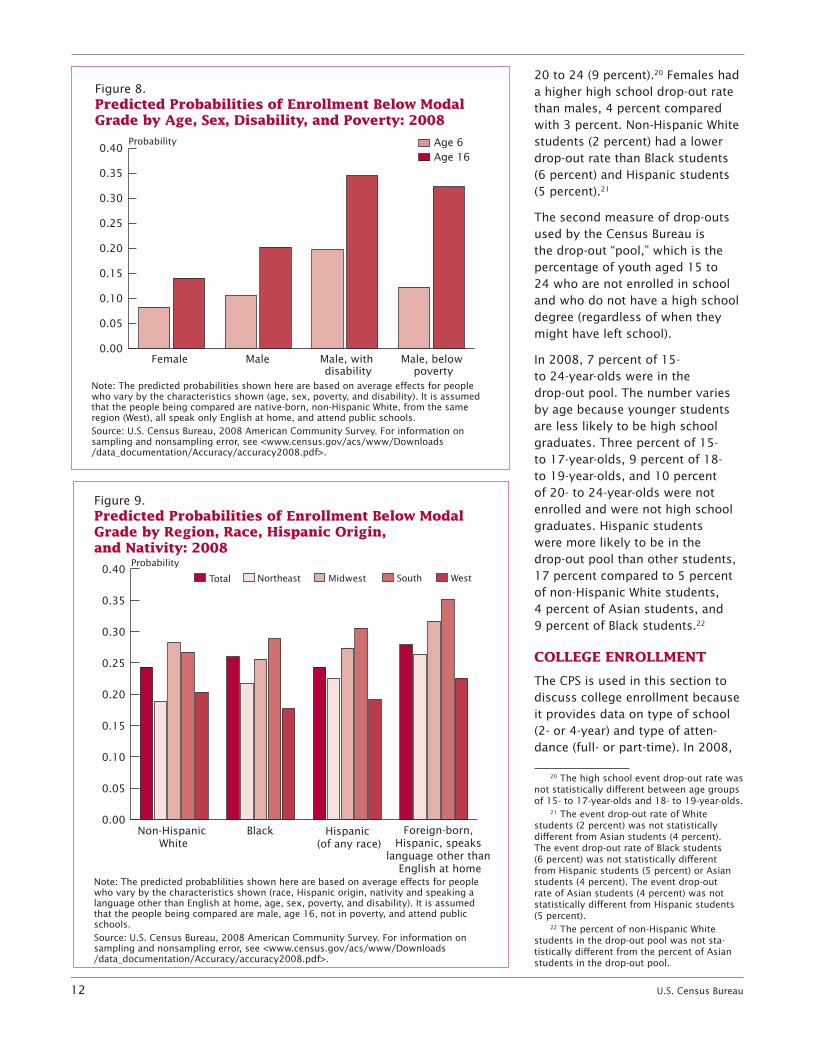
grade is higher for boys than for girls in the reference age category. Thevalueofoddsfor“Male*Age”isalsogreaterthan1,indicatingthat the probability of being below modal grade increases faster with age for boys than for girls. This can be seen by examining the predicted probabilities17 forenrollment below modal grade (Figure 8). The effects of disability and poverty on enrollment below modal grade are cumulative and
17Predicted probabilities are the probabili-ties expected for given types of people, based on a regression model, such as the regression of enrollment below modal grade shown in Table 3. The predicted probability for females age6,forexample,canbecomparedwiththepredictedprobabilityforfemalesage16withdifferences attributable to poverty, nativ-ity, language, type of school, race, Hispanic origin, and region all held constant.
have a larger effect at later ages. Boys with a disability have a much higher probability of enrollment below modal grade compared with boys without a disability. The effect of poverty on enrollment below modal grade is much higher at age16thanatage6.
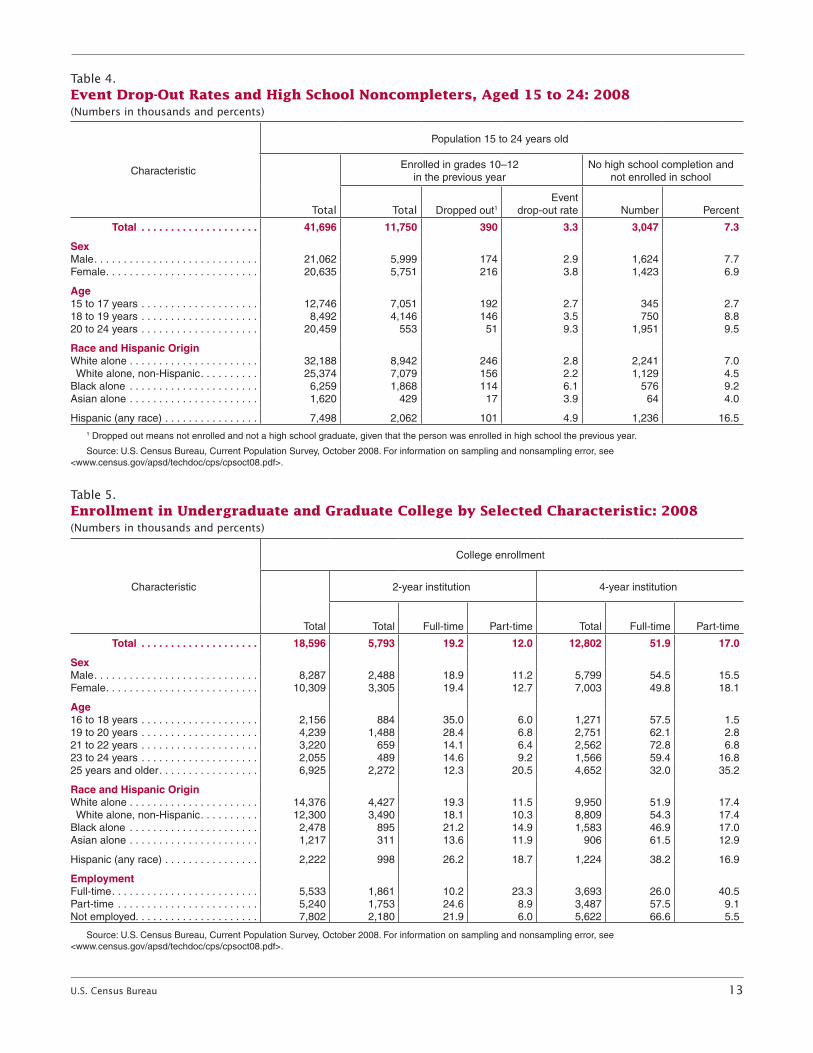
Amajoradvantageofthe regression model for enrollment below modal grade is that we can closely examine the effects ofraceandHispanicorigin.Inourtabular analysis presented earlier (Table 2), Hispanic students were found to be no more likely than non-Hispanic White students to be below modal grade. By contrast, our first regression model (Model 1,Table3)showsthatHispanic
students are more likely to be below modal grade. The main reason for this difference is that the effect of being below modal grade varied across regions of the coun-try. Students in the Midwest and in the South were more likely to be below modal grade than those intheWest.Inourfirstregression,the effect of Hispanic origin was obscured by the fact that many Hispanics are located in the West, where fewer students are below modal grade overall.
Oursecondmodelwasoneinwhich we examined how the effect of race and Hispanic origin varied byregion(Model2,Table3).Inthemodel, the odds of being below modal grade for Black (.84) and
25.0 and over
15.0 to 24.9
Under 15.0
MT
AK
NM
OR MN
KS
SD
ND
MO
WA
FL
IL IN
WI NY
PA
MI
OH
IA
ME
MA
CT
AZ
NV
TX
COCA
WY
UT
ID
NE
OK
GA
AR
AL
NC
MS
LA
TN
KY
VA
SC
WV
RI
DE MD
NJ
HI
VTNH
DC *
Percent
Figure 6.Percentage Below Modal Grade, Aged 10 to 13: 2008
Source: U.S. Census Bureau, 2008 American Community Survey. For information on sampling and nonsampling error,see <www.census.gov/acs/www/Downloads/data_documentation/Accuracy/accuracy2008.pdf>.
10 U.S. Census Bureau
Hispanic (.93) students represent what is happening in the West, since that is the reference category for interactions. That these odds aresignificantlybelow1indicatesthat in the West, Black and Hispanic students are less likely to be below modal grade than the reference non-Hispanic White group. For other regions of the country, the odds of being below modal grade relative to non-Hispanic White students is measured by combin-ing the basic odds of being below modal grade (for example, .84 for Black students) and the interaction of race and Hispanic origin with region(forexample,1.41forBlackstudentsintheNortheast).Inorderto interpret these interactions, it is easiest to turn once again to
predicted probabilities, which show the effect of combining these terms together (Figure 9).18
All three race and Hispanic origin groups examined in Figure 9 show lower probability of being below modal grade in the Northeast and the West than in either the South or the Midwest (for each race and Hispanic origin group, all four estimates for regions are signifi-cantly different from one another). As with Hispanic students, the probability of Black students being below modal grade in the West is smaller than that of non-Hispanic
18The predicted probabilities in Figure 9areformales,age16,notinpoverty,notdisabled,inpublicschool.Race,Hispanicorigin, language use, and foreign-born status are listed in the figure.
White students. Black students in the Midwest are also less likely than non-Hispanic White students to be below modal grade. By con-trast, non-Hispanic White students are less likely to be enrolled below modal grade in the Northeast and in the South. Hispanic students are not significantly different from non-Hispanic White students in the Midwest.
Note that in making these comparisons, we have controlled for important characteristics that affect the probability of being enrolledbelowmodalgrade.In particular, we are examining effects of Hispanic origin, net of immigra-tion and language factors. Hispanic students born outside the United
25.0 and over
15.0 to 24.9
Under 15.0
MT
AK
NM
OR MN
KS
SD
ND
MO
WA
FL
IL IN
WI NY
PA
MI
OH
IA
ME
MA
CT
AZ
NV
TX
COCA
WY
UT
ID
NE
OK
GA
AR
AL
NC
MS
LA
TN
KY
VA
SC
WV
RI
DE MD
NJ
HI
VTNH
DC *
Percent
Figure 7.Percentage Below Modal Grade, Aged 14 to 17: 2008
Source: U.S. Census Bureau, 2008 American Community Survey. For information on sampling and nonsampling error,see <www.census.gov/acs/www/Downloads/data_documentation/Accuracy/accuracy2008.pdf>.
U.S. Census Bureau 11
States and who speak a language otherthanEnglishathomearemore likely than non-Hispanic White students to be below modal grade in all regions of the country (Figure 9).
DROP-OUTS
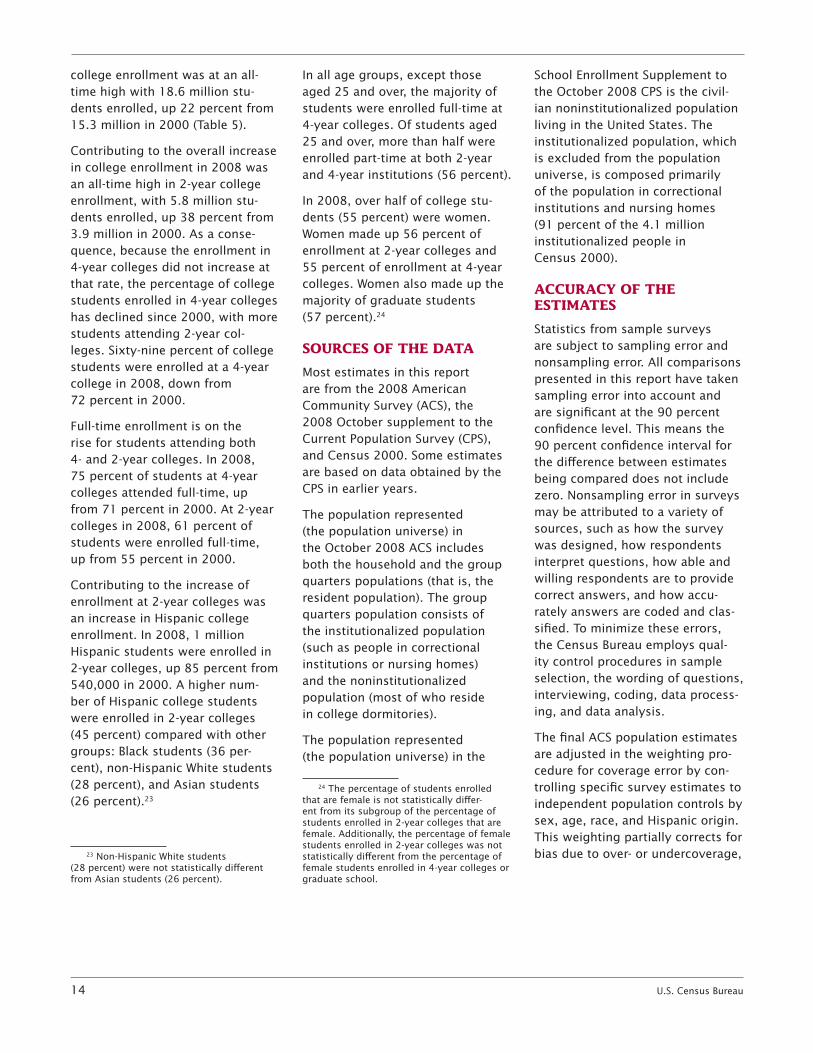
The Census Bureau calculates two types of drop-out rates. The event drop-out rate was first introduced intheOctober1983CPSSchoolEnrollmentreportasawaytoapproximate longitudinal data by asking persons what their enrollment status currently is, and what it was at some defined point in the past. The CPS asks a retrospective question on enroll-ment,“WereyouenrolledinschoollastOctober?”(1yearago).Basedon the answers to this question and the current enrollment item, the numbers of persons who were enrolled a year ago, but who pres-ently are not, are estimated. The event drop-out rate captures the percentageofyouthaged15to24whodroppedoutofGrades10through12inthe12monthsbetweenoneOctoberandthenext(October2007andOctober2008).
In2008,3.3percentof15-to24-year-olds who had been enrolled inGrades10through12theprevi-ous year had dropped out of school (event drop-outs, Table 4).19 The high school event drop-out rate was lowerforstudentsaged15to17(3 percent) than for students aged
19Asianstudents(4percent)and18-to19-year-old(4percent)drop-outrateswerenot statistically different from the total of 15-to24-year-olddrop-outs(3percent).
Source: U .S . Census Bureau, 2008 American Community Survey . For information on sampling and nonsampling error, see <www .census .gov/acs/www/Downloads/data_documentation/Accuracy /accuracy2008 .pdf> .
12 U.S. Census Bureau
20 to 24 (9 percent).20 Females had a higher high school drop-out rate than males, 4 percent compared with 3 percent. Non-Hispanic White students (2 percent) had a lower drop-out rate than Black students (6percent)andHispanicstudents(5 percent).21
The second measure of drop-outs used by the Census Bureau is thedrop-out“pool,”whichisthepercentageofyouthaged15to24 who are not enrolled in school and who do not have a high school degree (regardless of when they might have left school).
In2008,7percentof15- to 24-year-olds were in the drop-out pool. The number varies by age because younger students are less likely to be high school graduates.Threepercentof15- to17-year-olds,9percentof18- to19-year-olds,and10percentof 20- to 24-year-olds were not enrolled and were not high school graduates. Hispanic students were more likely to be in the drop-out pool than other students, 17percentcomparedto5percentof non-Hispanic White students, 4 percent of Asian students, and 9 percent of Black students.22
COLLEGE ENROLLMENT
The CPS is used in this section to discuss college enrollment because it provides data on type of school (2- or 4-year) and type of atten-dance(full-orpart-time).In2008,
20 The high school event drop-out rate was not statistically different between age groups of15-to17-year-oldsand18-to19-year-olds.
21 The event drop-out rate of Whitestudents (2 percent) was not statistically different from Asian students (4 percent). The event drop-out rate of Black students (6percent)wasnotstatisticallydifferentfrom Hispanic students (5 percent) or Asian students (4 percent). The event drop-out rate of Asian students (4 percent) was not statistically different from Hispanic students (5 percent).
22 The percent of non-Hispanic White students in the drop-out pool was not sta-tistically different from the percent of Asian students in the drop-out pool.
0.00
0.05
0.10
0.15
0.20
0.25
0.30
0.35
0.40
Male, below poverty
Male, with disability
MaleFemale
Figure 8.Predicted Probabilities of Enrollment Below Modal Grade by Age, Sex, Disability, and Poverty: 2008
Note: The predicted probabilities shown here are based on average effects for people who vary by the characteristics shown (age, sex, poverty, and disability). It is assumed that the people being compared are native-born, non-Hispanic White, from the same region (West), all speak only English at home, and attend public schools.Source: U.S. Census Bureau, 2008 American Community Survey. For information on sampling and nonsampling error, see <www.census.gov/acs/www/Downloads/data_documentation/Accuracy/accuracy2008.pdf>.
Age 6Age 16
Probability
0.00
0.05
0.10
0.15
0.20
0.25
0.30
0.35
0.40
Foreign-born, Hispanic, speaks
language other than English at home
Hispanic (of any race)
BlackNon-Hispanic White
Figure 9.Predicted Probabilities of Enrollment Below Modal Grade by Region, Race, Hispanic Origin, and Nativity: 2008
Note: The predicted probablilities shown here are based on average effects for people who vary by the characteristics shown (race, Hispanic origin, nativity and speaking a language other than English at home, age, sex, poverty, and disability). It is assumed that the people being compared are male, age 16, not in poverty, and attend public schools.Source: U.S. Census Bureau, 2008 American Community Survey. For information on sampling and nonsampling error, see <www.census.gov/acs/www/Downloads/data_documentation/Accuracy/accuracy2008.pdf>.
South
Probability
Total MidwestNortheast West
U.S. Census Bureau 13
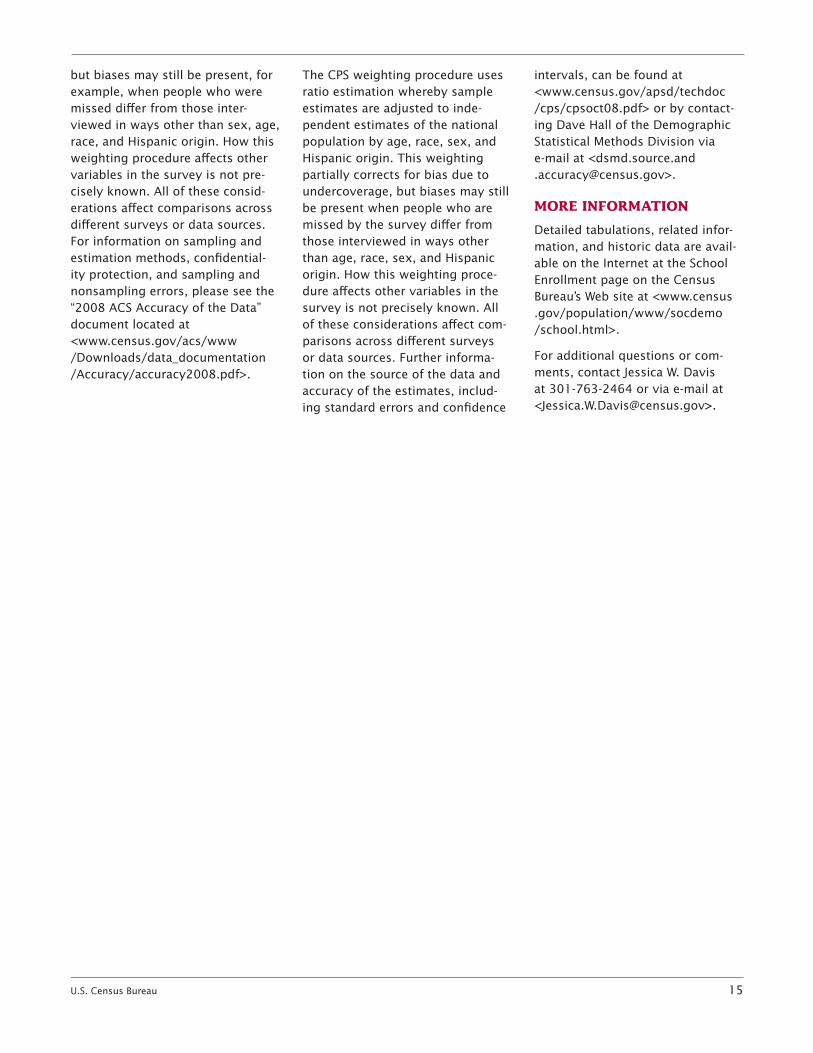
Table 5.Enrollment in Undergraduate and Graduate College by Selected Characteristic: 2008(Numbers in thousands and percents)
Characteristic
College enrollment
Total
2-year institution 4-year institution
Total Full-time Part-time Total Full-time Part-time
Source: U .S . Census Bureau, Current Population Survey, October 2008 . For information on sampling and nonsampling error, see <www .census .gov/apsd/techdoc/cps/cpsoct08 .pdf> .
Table 4.Event Drop-Out Rates and High School Noncompleters, Aged 15 to 24: 2008(Numbers in thousands and percents)
Characteristic
Population 15 to 24 years old
Total
Enrolled in grades 10–12 in the previous year
No high school completion and not enrolled in school
Hispanic (any race) . . . . . . . . . . . . . . . . 7,498 2,062 101 4 .9 1,236 16 .51 Dropped out means not enrolled and not a high school graduate, given that the person was enrolled in high school the previous year .
Source: U .S . Census Bureau, Current Population Survey, October 2008 . For information on sampling and nonsampling error, see <www .census .gov/apsd/techdoc/cps/cpsoct08 .pdf> .
14 U.S. Census Bureau
college enrollment was at an all-timehighwith18.6millionstu-dents enrolled, up 22 percent from 15.3millionin2000(Table5).
Contributing to the overall increase in college enrollment in 2008 was an all-time high in 2-year college enrollment, with 5.8 million stu-dents enrolled, up 38 percent from 3.9 million in 2000. As a conse-quence, because the enrollment in 4-year colleges did not increase at that rate, the percentage of college students enrolled in 4-year colleges has declined since 2000, with more students attending 2-year col-leges. Sixty-nine percent of college students were enrolled at a 4-year college in 2008, down from 72 percent in 2000.
Full-time enrollment is on the rise for students attending both 4-and2-yearcolleges.In2008,75 percent of students at 4-year colleges attended full-time, up from71percentin2000.At2-yearcollegesin2008,61percentofstudents were enrolled full-time, up from 55 percent in 2000.
Contributing to the increase of enrollment at 2-year colleges was an increase in Hispanic college enrollment.In2008,1millionHispanic students were enrolled in 2-year colleges, up 85 percent from 540,000 in 2000. A higher num-ber of Hispanic college students were enrolled in 2-year colleges (45 percent) compared with other groups:Blackstudents(36per-cent), non-Hispanic White students (28 percent), and Asian students (26percent).23
23 Non-Hispanic White students(28 percent) were not statistically different fromAsianstudents(26percent).
Inallagegroups,exceptthoseaged25andover,themajorityofstudents were enrolled full-time at 4-yearcolleges.Ofstudentsaged25 and over, more than half were enrolled part-time at both 2-year and4-yearinstitutions(56percent).
In2008,overhalfofcollegestu-dents (55 percent) were women. Womenmadeup56percentofenrollment at 2-year colleges and 55 percent of enrollment at 4-year colleges. Women also made up the majorityofgraduatestudents (57 percent).24
SOURCES OF THE DATA
Most estimates in this report are from the 2008 American Community Survey (ACS), the 2008OctobersupplementtotheCurrent Population Survey (CPS), and Census 2000. Some estimates are based on data obtained by the CPS in earlier years.
The population represented (the population universe) in theOctober2008ACSincludesboth the household and the group quarters populations (that is, the resident population). The group quarters population consists of the institutionalized population (such as people in correctional institutions or nursing homes) and the noninstitutionalized population (most of who reside in college dormitories).
The population represented (the population universe) in the
24 The percentage of students enrolled that are female is not statistically differ-ent from its subgroup of the percentage of students enrolled in 2-year colleges that are female. Additionally, the percentage of female students enrolled in 2-year colleges was not statistically different from the percentage of female students enrolled in 4-year colleges or graduate school.
SchoolEnrollmentSupplementtotheOctober2008CPSisthecivil-ian noninstitutionalized population living in the United States. The institutionalized population, which is excluded from the population universe, is composed primarily of the population in correctional institutions and nursing homes (91percentofthe4.1million institutionalized people in Census 2000).
ACCURACY OF THE ESTIMATES
Statistics from sample surveys aresubjecttosamplingerrorandnonsampling error. All comparisons presented in this report have taken sampling error into account and are significant at the 90 percent confidence level. This means the 90 percent confidence interval for the difference between estimates being compared does not include zero. Nonsampling error in surveys may be attributed to a variety of sources, such as how the survey was designed, how respondents interpret questions, how able and willing respondents are to provide correct answers, and how accu-rately answers are coded and clas-sified. To minimize these errors, the Census Bureau employs qual-ity control procedures in sample selection, the wording of questions, interviewing, coding, data process-ing, and data analysis.
The final ACS population estimates areadjustedintheweightingpro-cedure for coverage error by con-trolling specific survey estimates to independent population controls by sex, age, race, and Hispanic origin. This weighting partially corrects for bias due to over- or undercoverage,
U.S. Census Bureau 15
but biases may still be present, for example, when people who were missed differ from those inter-viewed in ways other than sex, age, race, and Hispanic origin. How this weighting procedure affects other variables in the survey is not pre-cisely known. All of these consid-erations affect comparisons across different surveys or data sources. For information on sampling and estimation methods, confidential-ity protection, and sampling and nonsampling errors, please see the “2008ACSAccuracyoftheData”document located at <www.census.gov/acs/www /Downloads/data_documentation /Accuracy/accuracy2008.pdf>.
The CPS weighting procedure uses ratio estimation whereby sample estimatesareadjustedtoinde-pendent estimates of the national population by age, race, sex, and Hispanic origin. This weighting partially corrects for bias due to undercoverage, but biases may still be present when people who are missed by the survey differ from those interviewed in ways other than age, race, sex, and Hispanic origin. How this weighting proce-dure affects other variables in the survey is not precisely known. All of these considerations affect com-parisons across different surveys or data sources. Further informa-tion on the source of the data and accuracy of the estimates, includ-ing standard errors and confidence
intervals, can be found at <www.census.gov/apsd/techdoc /cps/cpsoct08.pdf> or by contact-ing Dave Hall of the Demographic Statistical Methods Division via e-mail at <dsmd.source.and [email protected]>.
MORE INFORMATION
Detailed tabulations, related infor-mation, and historic data are avail-ableontheInternetattheSchoolEnrollmentpageontheCensusBureau’s Web site at <www.census .gov/population/www/socdemo /school.html>.
For additional questions or com-ments, contact Jessica W. Davis at301-763-2464orviae-mailat<[email protected]>.
16 U.S. Census Bureau
Appendix Table A.Comparison of Census Bureau Data Sources on School Enrollment
Survey Characteristics American Community Survey Current Population Survey
Geographic scope Annual estimates of the nation, regions, states, congressional districts, and geographies of 65,000 or more . Three-year estimates available for places of 20,000 or more and 5-year estimates of areas as small as census tracts .
National estimates and estimates of selected characteristics for regions and states .
Periodicity of collection Every year Every year
Timeliness Released year after collection cycle . Released after year of collection cycle .
Sample size Annual sample of about 3 million addresses . Data are collected from about one-twelfth of the sample each month .
The school enrollment data come from October CPS supplement, which is based on a sample of about 72,000 addresses .
Data collection method Mail, telephone, and personal-visit interviews for the 50 states, the District of Columbia, and Puerto Rico . About half the responses are obtained by mail . The ACS is a mandatory survey .
Telephone and personal-visit interviews for the 50 states and the District of Columbia . The CPS is a voluntary survey .
Questionnaire item(s) The ACS asks respondents every month, “At any time in the last 3 months, has this person attended regular school or college?” The respondent is asked what grade or level this person attended .
In the month of October, the CPS asks a detailed and extensive list of questions about school enrollment in the current and past year . There are separate questions for adults 15 years and older and for children 3–14 years old .
Unique measures/data ACS enrollment data can be produced at the national level and very small levels of geography .
The CPS provides data regarding single-year enroll-ment, enrollment status and level for the previous year, whether the respondent goes to school on a full-time or part-time basis, whether they attend a 2-year or a 4-year institution, whether they are obtaining any vocational training, what year they received their postsecondary degree, and whether they received a GED (general educational development test-based certification) .
Technical issues ACS statistics on school enrollment are based on interviews conducted during the entire year .
CPS statistics on enrollment are based on interviews conducted in October .
Population universe The ACS includes the resident population of the United States, including household and group quarters populations .
The CPS includes the civilian noninstitutionalized population and Armed Forces personnel living off post or with their families on post .
Tables available/detail ACS school enrollment tables can be accessed through American FactFinder showing school enrollment for the nation and smaller geographies by characteristics such as age, sex, educational attainment, and poverty status .
Detailed table package consists of eight tables with school enrollment for the nation shown by character-istics such as age, race, sex, family income, type of college, employment status, and vocational course enrollment .
Sampling error information Only for published tables . Can be computed by data user .
Historical data The ACS began in 1996 in a limited number of test sites and began national implementation in 2000 .
Enrollment data from the CPS have been gathered since 1947 .