Science of the Total Environment 580 (2017) 1162–1174
Contents lists available at ScienceDirect
Science of the Total Environment
j ourna l homepage: www.e lsev ie r .com/ locate /sc i totenv
Emissions of organic pollutants from traffic and roads: Priority pollutantsselection and substance flow analysis
Anna Markiewicz a,⁎, Karin Björklund a, Eva Eriksson b, Yuliya Kalmykova a,Ann-Margret Strömvall a, Anna Siopi a
a Department of Civil and Environmental Engineering, Water Environment Technology, Chalmers University of Technology, 412 96 Gothenburg, Swedenb School of Business and Economics, Linnaeus University, Växjö, Sweden
H I G H L I G H T S G R A P H I C A L A B S T R A C T
• Methodology to select organic prioritypollutants for stormwater treatment
• Sources of organic pollutant emissionsin a traffic environment were identified.
• The loads of PAH emitted in the roadcatchment area were estimated bymeans of SFA.
• 2–6% of the total PAHs emitted reachedroad runoff.
• Calculated quantities and measuredPAH and oxy-PAH loads show large dif-ferences.
Article history:Received 26 August 2016Received in revised form 25 November 2016Accepted 12 December 2016Available online 27 December 2016
Editor: D. Barcelo
A large number of organic pollutants (OPs) emitted from vehicles and traffic-related activities exhibit environmen-tal persistence and a tendency to bioaccumulate, and may have detrimental long-term effects on aquatic life. Theaimof the studywas to establish a list of significant sources of OPs occurring in road runoff, identify the OPs emittedfrom these sources, select a number of priority pollutants (PP), and estimate the quantity of PPs emitted in a roadenvironment case study using substance flow analysis (SFA). The priority pollutants included in the SFA were se-lected from a list of approximately 1100 compounds found after comprehensive screening, including literatureand database searches, expert judgments, the Ranking and Identification of Chemical Hazards method, and chem-ical analysis of sediments. The results showed the following priority order: polycyclic aromatic hydrocarbons(PAHs) N alkanes C20–C40 N alkylphenols N phthalates N aldehydes N phenolic antioxidants N bisphenol A N oxygen-ated-PAHs N naphtha C5–C12 N amides N amines. Among these, PAHs were chosen for a SFA, which was performedfor a highway case study area in Gothenburg (Sweden). The SFA showed that the main sources of PAHs emitted inthe area were vehicle exhaust gases, followed by tyre wear, motor lubricant oils, road surface wear, and brake lin-ings. Only 2–6% of the total 5.8–29 kg annually emitted PAHs/ha ended up in the stormwater sewer system. Themeasured PAH loadswere found inmuch smaller amounts than the calculated loads and the outflow to stormwatercontained much more of the hazardous PAHs than the total loads emitted in the catchment area.
Fig. 1. The iterative selection process used for identifying and selecting organic prioritypollutants in urban road environments.
1163A. Markiewicz et al. / Science of the Total Environment 580 (2017) 1162–1174
1. Introduction
The occurrence of organic pollutants (OPs) in the environment is aresult of vigorous global development, including the continuous in-crease in industrial production, farming and other human activitiesover the past decades. Organic pollutants are either unintentional by-products released into the environment, for example through combus-tion processes, or intentionally produced industrial chemicals. ManyOPs are persistent to degradation, capable of bioaccumulation in fat tis-sue, and have the ability to travel long distances through water-air-soilsystems and cause negative effects on animal and human health (UN-ECE, 1998a). Although certain OPs are subject to long-range transport,and have been detected in remote areas far from where they are pro-duced and used (Oehme and Manø, 1984; Scheringer, 2010), urbanareas are the most important sinks for organic pollutants (Björklundet al., 2011; Eriksson, 2002). Urban areas are affected by pollutantsemitted from activities such as transportation, commerce, constructionand combustion. Apart from the most volatile substances, OPs emittedfrom nonpoint sources will settle on urban surfaces and subsequentlybe washed off by stormwater, into sewer systems and receiving waters.Recently, OPs, including the most hydrophobic compounds, wereshown to be present in dissolved and colloidal forms in stormwater,which suggests that the mobility, and consequently the toxicity and as-sociated risks of the compounds, is potentially higher than previouslyassumed (Kalmykova et al., 2013). It has also been shown that the de-velopment of advanced stormwater treatment facilities will be neces-sary for retention of these forms of OPs (Kalmykova et al., 2014;Nielsen et al., 2015). Indeed, the urban runoff quality is recognized asone of the most significant pressures on aquatic ecosystems worldwide(Ellis, 1991;Malmqvist and Rundle, 2002). For this reason, it is vital thatthe dominant sources of OPs in urban areas are identified as this willallow actions to be taken to improve surface water quality through con-trol of the sources of emissions and ensure compliance with legal regu-lations and water quality standards, such as the European WaterFramework Directive (EC, 2000) and the American Clean Water Act(EPA, 2002).
Monitoring of urban runoff has revealed that traffic is one of the pri-mary sources of contamination in urban areas (Björklund, 2011;Jonsson et al., 2008; Motelay-Massei et al., 2006; Månsson et al.,2008). There is a myriad of possible traffic-related sources of OPs, in-cludingmaterials used in vehicles, such as tyres, auto body, motor com-ponents, and care products; exhaust gases and particles; road surfacesand markings; and road furniture such as traffic signs, sound berms, di-viders and barriers (Faure et al., 2000; Rogge et al., 1993; Sartor et al.,1974). The amount of pollutants generated and accumulated on roadsurfaces is dependent on both traffic-related factors, such as velocityof vehicles and traffic count, and on runoff-related factors including an-tecedent dry period, duration and intensity of rainfall, and the leachingrate from permanent structures (Barrett et al., 1995; Furumai et al.,2002; Helmreich et al., 2010; Lee et al., 2004). Previous studies showthat polycyclic aromatic hydrocarbons (PAHs) (Jensen et al., 2006;Kose et al., 2008), halogenated phenols (Zhang et al., 2008), alkanes, al-kenes together with other petroleum derivatives (Rogge et al., 1993),polychlorinated biphenyls (Zgheib et al., 2012), phthalates likediisononyl phthalate (DINP) and diisodecyl phthalate (DIDP), andalkylphenols and their ethoxylates (AP/EOs) (Björklund, 2010), are fre-quently found in road dust. However, the state of the art overview oftraffic-related OPs which risk being emitted to road runoff and couldhave hazardous effects on aquatic environments and human health iscurrently missing.
To date, analytical methods have only been developed for a selectionof the compounds that may potentially be emitted from road-relatedsources, and analysis costs are high. Additionally, the fact that the sameOPsmayoriginate fromdifferent sourcesmakes it difficult to identify spe-cific sources when analysing mixtures of molecules present in road-related environmental matrices. This hinders effective identification of
themajor sources ofOps, andmakes it difficult to put in place appropriatesource-control measures to prevent the emissions. For this reason, it isnecessary to prioritize certain OPs and their sources, both to enable effi-cient monitoring and to provide decision support for measures to de-crease emissions. The substance flow analysis (SFA) method isconsidered suitable for the monitoring of flows and stocks of pollutants.The SFA is an analytical tool developed for quantitative assessment of in-dividual substances through a given system, specified in space and time(Björklund, 2010; Bringezu, 2006; Huang et al., 2012). This method al-lowsmonitoring of the amounts of OPs emitted to aquatic environments,aswell as estimation of the scale of the potential contamination, based ontheir occurrence in the surrounding environment and emission factors.
The aim of this research has been to identify the occurrence andsources of OPs in road areas, quantify the emissions of selected OPs –so called priority pollutants (PPs) – from specific sources, and estimatethe flows of these OPs in a road case study area. Source identificationand emission flows have been researched through literature studies,and estimated PP flows have been compared to monitoring data fromthe case study area. In this paper, the SFAwas conducted on the highestpriority OPs to estimate their emitted loads in a case study catchment, aswell to illustrate the capability of the method.
2. Method
2.1. Selection of priority pollutants
Fig. 1 illustrates the methodology used to identify sources of OPs inroad environments and to select the PPs. Each step in the process is de-scribed in detail below.
2.1.1. Identification of organic pollutants present in traffic-related sourcesThe first step of the study was to identify substances or substance
groups that may be released from traffic-related sources, and maytherefore be present in road runoff. No pollutant ranking or judgment-based selection was implemented at this stage. The OPs expected tooccur in road environmentswere found through reviews of scientific lit-erature aswell as regional and federal reports onmonitoring campaignsfor OPs. The OPs detected through laboratory measurements of roadmaterials, road-side dust particles, road runoff and sediment were
1164 A. Markiewicz et al. / Science of the Total Environment 580 (2017) 1162–1174
extracted and the list of identified OPs was created. In addition, data onOPs and their sources in road environments were gathered through:
• An extensive literature search in abstract and citation databases aswell as common internet search engines, covering both internationaland national reports and scientific journals.
• Research of the database International Material Data System (IMDS)for substances present in polymeric vehicle components.
• Interviews with experts from car manufacturing companies and com-panies responsible for the production of road materials in Sweden.
2.1.2. Ranking and selection of priority pollutants using RICHThe Ranking and Identification of Chemical Hazards (RICH) method
has been developed to provide transparent ranking for a wide range ofsubstances in stormwater, using the substances' inherent physico-chemical properties and biological effects (Baun et al., 2006). The toolis used for assessing environmental partitioning and chemical hazardsand can help identify themost crucial pollutants for stormwater studies,i.e. priority pollutants (Fig. 2). In this study, RICHwas applied to classifythe compounds identified in the first stage of the study.
The RICHmethod is based on filtration using the pollutants' physico-chemical properties, which are set according to available internationalenvironmental and economic standards, described in detail by Baunet al. (2006). The first filter removes substances of high volatility(Henry's law constant KH), and divides the remaining compounds intowater- or sediment-bound, based on the organic carbon-waterpartitioning coefficient (Koc). In the subsequent filters, substances thatare persistent, based on degradation half-life (T1/2) and the water-octanol distribution coefficient (Kow); exhibit risk for bioaccumulation(bioconcentration factor, BCF) and toxicity (EC50 or LC50 b 1 mg/L);and exert long-term adverse effects, including carcinogenicity, teratoge-nicity, genotoxicity, mutagenicity and endocrine disruption, are“trapped” i.e. selected as possible PPs. It is up to an expert panel tojudgewhether or not the precautionary principle should be implement-ed for the remaining OPs that are not “trapped” in the filters.
Data for approximately 300 of the substances identified in the firstpart of the study was not yet available in RICH (data was available for171 substances). For these substances, database mining was requiredto find inherent properties and ecotoxicity responses. This was doneusing the ECOTOXdatabase (EPA, 1995), the Swedish chemical databaseKEMI, the online chemical database OCHEM, and the software Estima-tion Program Interface (EPI) Suite developed by the EPA US. AdvancedDatabase Query was used to extract data, including e.g. BCF and theconcentration-based EC50 or LC50.
2.1.3. Specialist decision-makingTo reduce the work required to find physico-chemical and ecotoxi-
cological data for all substances, the list of identified traffic-relatedOPs was reviewed by a Stormwater Advisory Group during a workshopwith, among others, experts on stormwater quality and chemicals, aswell as representatives from the transportation administration andlocal and regional environmental authorities. The specific objectives of
Fig. 2. The RICH method filtration process for Ranking and Id(Adopted from Baun et al., 2006)
the workshop were to discuss the overall concept of OPs present inroad runoff and to identify substances whose priority is unlikely to beestablished by e.g. literature or database searches. Subsequent steps inthe PP selection engaged the experts who, by applying personal knowl-edge and experience within the field, identified supplementary sub-stances according to the following criteria:
• Risk of emission/leaching of pollutants from sources to stormwatersystems.
• Specific (or groups of) substances emitted frommore than one sourcein the road environment.
• Quantity of OPs present in vehicles, fuels, road construction materialsand other sources in Sweden and in the EU.
• Hazardous effects on aquatic environments and human health, deter-mined through physico-chemical properties available in RICH.
• Ability of commercial or research laboratories to analyse the chosensubstances in sediment and water.
• No previous SFA study available for the particular pollutant or groupof pollutants.
2.1.4. Final PP listThe missing ecotoxicity data for the substances selected by the
stormwater advisory group and through expert judgment were re-trieved, and added to the RICH method. Additional screening in RICHwas consequently possible, and more pollutants were added to the PPlist. An additional selection of PPs, based on the experts' judgmentcriteria, led to a final list of PPs and made it possible to select whichPPs to include in the SFA. The final PP list was also confirmed by chem-ical analysis of suspended sediments trapped in an underground sedi-mentation treatment facility for stormwater from the Gårdacatchment area, which represents a highly-trafficked road environ-ment; see Section 2.2.3 for details.
2.2. Substance flow analysis
2.2.1. System definitionBased on the suggested PP list, and the expert judgment criteria de-
scribed above, 16 specific PAHs prioritized by the US EPA and releasedfromvehicles, road surfaces and other traffic-related sources, were select-ed for inclusion in the study (see Section 3.3. for details on the selection),see Fig. 3. The PAHs have been divided according to their molecularweight as follows: PAH-L(low) =∑ naphthalene + acenaphthylene +acenaphthene; PAH-M(medium) = ∑ fluorene + phenanthrene +anthracene + fluoranthene + pyrene; and PAH-H(high) = ∑benzo[a]anthracene + chrysene + benzo[b]fluoranthene + benzo[k]fluoranthene + benzo[a]pyrene + dibenz[a,h]anthracene +benzo[g,h,i]perylene + indeno[1,2,3-c,d]pyrene. The SFA covers sub-stance flows during one year; the system space boundary is an urbancatchment area, located in the Gothenburg municipality (Sweden). Ac-cording to the Transport Administration in Sweden, approximately78,500 vehicles/day use the E6/E20 highway passing through the catch-ment area. The total size of the catchment area is 5.5 ha, of which 2 ha
entification of Chemical Hazards and priority pollutants.
1165A. Markiewicz et al. / Science of the Total Environment 580 (2017) 1162–1174
of impervious surfaces. 94% of the impervious surfaces consist of roads,footpaths and parking lots (Björklund et al., 2008). It is assumed thatthe sources of OPs in theGårda area is 100% road- and traffic-related. Run-off from the area is treated in an underground facility with seven sedi-mentation chambers (Björklund et al., 2009; Jakobsson et al., 2006;Pettersson et al., 2005). The physico-chemical parameters of stormwater,including PAH concentrations and distribution between particulate, dis-solved and colloidal fractions in the inlet and outlet of the facility havebeen described elsewhere (Nielsen et al., 2015).
2.2.2. SFA procedureThe substance flows in the studied area were calculated using emis-
sion factors (EFs) for each source and individual pollutant. The EFs wereestimated from literature data on emission rates and substance contentin various source materials. Vehicle exhaust-related emissions werebased on data found in the air pollutant emission inventory guidebook,published by the European Environment Agency (EEA, 2013). Tyre, roadmaterial and break lining emissions were determined using data onwear per driven kilometre and content of substance in tread, asphaltand lining material, respectively. Emissions of motor oil and lubricantswere calculated from the substance content in used oils/lubricants andthe estimated loss of oil/lubricant by leakage per driven distance. Thefactors for vehicle-related emissions were expressed in the format [μg/vkm]; mass of substance emitted per travelled vehicle-kilometre. Thetotal substance flows were subsequently calculated using data on thelength of the road and the total number of vehicles traveling throughthe area in one year.
Emitted pollutant loads are either transported out of the systemwith air (volatilised or bound to small particles); deposited on impervi-ous surfaces in the catchment area, from where it could potentiallyreach the stormwater sewer system; or deposited on pervious areas,i.e. in sinks other than stormwater. The proportion of the exhaust emis-sions that end up on impervious surfaces (roads)was based on thefind-ings of Hewitt and Rashed (1990). They estimated, for example, thatonly 1.3% of the total phenanthrene exhausts emissions is depositedon or near the road surface, and the remaining 98.7% is transported byair away from the road surface. Based on these data, it was assumedthat PAH emissions remaining on or near the road represented 0.25%(naphthalene) to 30.8% (benzo[a]anthracene and chrysene) of the ex-haust loads. In contrast to exhaust, emissions from tyres, roadmaterials,brake linings and lubricants are assumed to collect entirely on the roadsurface. Lastly, it was assumed, based on the runoff coefficient for roadsurfaces, that 80% of the pollutant loads deposited on the road surfacereach the nearby stormwater sewer system. The amounts of PAHs
Fig. 3. Flow chart of the SFA for the Gårda catchment area, with main sources of inflow,outflow to the stormwater facility and other sinks of PAH-L, PAH-M and PAH-H.
transported by air into the studied system, i.e. the catchment area,were assumed to be negligible as evidenced by snow samples inGothenburg that exhibit low background concentrations of PAHs(Björklund et al., 2011).
2.2.3. Sediment sampling procedure and calculation of stormwater loadsTo validate the pollutant loads estimated with the SFA method, the
concentrations and loads of PAHs and oxy-PAHs (degradation productsof PAHs) were analytically determined on sediment samples collectedfrom the Gårda stormwater treatment facility in May 2015. To confirmthe importance of the compounds in the PP list, alkanes C5–C35,aromatics C8–C35, aldehydes C1–C5, twelve phthalates, octyl- andnonylphenols and their mono–tri ethoxylates were additionallyanalysed in the sediments; for results see Table A in Supporting infor-mation. Stormwater from the entire catchment area pass through thesedimentation system or an overflow bypass at times when the sedi-mentation chambers are filled up with stormwater, e.g. during heavyrainfalls.
One sediment sample was collected from each of the chambers 1, 3,5 and 7, using an Ekman bottom grab sampler, stored in glass con-tainers, and immediately sent to an accredited, commercial laboratoryto be analysed for selected OPs. Analyses of PAHs and oxy-PAHs wereperformed on GC–MS according to methods based on SPIMFAB's (theSwedish Petroleum and Biofuel Institute) quality manual. The pollutantconcentrations in chambers 2, 4 and 6 were estimated by interpolationof the measured quantities in chambers 1, 3, 5 and 7.
The sediment pollutant loads were estimated based on the analysedPAH and oxy-PAH concentrations in the sediment, the total dry weightof sediment in the facility, and the accumulation period of sediment(28months). The total dry weight was calculated from known chamberdimensions, measured sediment height, density, and water content(Jakobsson et al., 2006). In Jakobsson's study, detailed physical andchemical characteristics of the Gårda sediment, e.g. metal concentra-tions, organic content, particle size distribution, are reported.Pettersson et al. (2005) estimated that approximately 30% of the PAHsfound in stormwater in the Gårda catchment area is retained in the sed-iments; the remaining 70% is transported with the effluent or overflowwater to the receivingwater. The observed PAHs loads in the sedimentswere adjusted using Pettersson's data, after which the total annualstormwater load (reported in grams) of each PAHpollutant in the catch-ment area was determined.
3. Results and discussion
3.1. Sources of OPs in road environments
Possible sources of OPs in the road environment are summarized inTable 1, which contains information collected through literature re-views, national Swedish screening reports and interviews with experts.
3.1.1. TyresThe composition of tyre rubber is complex, and often depends on
quality demands as well as the vehicle for which it is designed. Tyresare believed to be a major source of OPs in road runoff, as a broad spec-trum of toxic and harmful substances are released as they wear (Roggeet al., 1993). Several studies have confirmed the content of toxic addi-tives used in the production process to enhance tyre performance andstability (Table 1). Examples include PAHs-containing highly aro-matic (HA) oils used as softeners, and plasticizing phthalates oralkylphenols (APs) and their ethoxylates (AP/EOs) for aging protec-tion (Ahlbom and Duus, 1994; Källqvist, 2005; Marcus, 2006). Since2010, European legislation restricts the use of HA oils in rubber pro-cessing, which may lead to future reductions in PAHs emissions (EC,2006). Despite this, there is still a relatively high number of tyrescontaining HA-oils on Swedish roads, due both to a delay in tyre
Table 1Sources of organic pollutants identified in the road and traffic environment.
Type of source Potential emitted substances References
oleic acid, stearanes, hopanes, natural resins, PAHsbAhlbom and Duus, 1994; Kose et al., 2008; Källqvist, 2005;Marcus, 2006; Norin and Strömvall, 2004; Rogge et al., 1993
PAHs and related substances, aldehydes, alkanes,phenols, fatty acids, ethers
Brorström-Lundén E. et al., 2010; Ichiki et al., 2008; Kose et al.,2008; Schauer et al., 2002
Road construction materialsBitumen/asphalt Phthalates, APs/EOs, PAHs, amides, amines, BPA,
antioxidantsKose et al., 2008; Norin and Strömvall, 2004; Wess et al., 2004;Zhang et al., 2011
Concrete APs/EOs Togerö, 2006Road paint Phthalates, APs/EOs, BPA, alkyd resins Andersson and Sörme, 2004; Aznar et al., 1997; Bauer, 1980;
Norin, 2004; Staples et al., 1998; Vikelsøe et al., 1999
a Alkylphenols and alkylphenol ethoxylates.b Polycyclic aromatic hydrocarbons.c Oxygenated PAHs.d Bisphenol A.e Alkylphenols.
1166 A. Markiewicz et al. / Science of the Total Environment 580 (2017) 1162–1174
replacement and to rubber recycling and international transport(ETRMA, 2010; ETRMA, 2011).
3.1.2. Brake liningsThe brake linings of a vehicle are subjected to high friction heat
during forced deceleration, which leads to lining wear. The wear,composed of particles containing various chemicals, is released intothe environment (Rogge et al., 1993; Warner et al., 2000). Approxi-mately 35% of the brake component mass loss is emitted as airborneparticulate matter (Garg et al., 2000). The most abundant organiccompounds identified in brake lining dust are polyglycol ethers(Table 1), used mainly in hydraulic fluids. Other compounds foundin trace amounts in the lining dust include alkanes, alkanoic acids,PAHs, oxy-PAHs, benzaldehydes, benzoic acids, and oleic acids(Rogge et al., 1993).
3.1.3. Vehicle componentsExternal polymeric materials used in e.g. bumpers, mudguards or
bodywork parts of vehicles are susceptible to extensive wear. Plastic el-ements of vehicle body parts may contain phthalates, phenols, PAHs oramines (Nielsen et al., 2000), and lacquers and paints may containphthalates or phenols (Hoffmann, 1996; Johansson and Zimerson,2000), see Table 1. Emissions may increase in summer as the releaseof e.g. phthalates fromplastic components strongly depends on temper-ature. Polymeric materials are widely used in the automobile indus-try to enhance appearance and increase cost effectiveness due tolower fuel consumption, and there has been a significant increasein their use over the past decades. The Global Automotive DeclarableSubstance List (GASDL) was set up to facilitate collaboration be-tween automotive industries in relation to declaration and restric-tion of the use of certain chemicals in automotive materials (Group,2016). The IMDS database (International Material Data System) pro-vides information on substances found in vehicle parts, which ac-cording to GASDL may pose a risk to humans and the environment.Because the composition of various vehicle parts depends on theirsuppliers, searches in the IMDS database were performed withregard to suppliers to car manufacturers in Sweden. Based on infor-mation on polymeric elements used in vehicles, gathered from
Štrumberger et al. (2005), around 70 organic substances whichmay be released from car parts were identified.
3.1.4. Car care productsProducts intended for protection and preservation of lacquered ve-
hicle surfaces are sources of AP/EOs, an abundant group of detergentchemicals (Table 1). In addition, cleaning agents, grease or wax aresources of substances such as phthalates, APs/EOs and naphtha residues(Andersson and Sörme, 2004; Björklund et al., 2007; Johansson andZimerson, 2000).
3.1.5. Fuels, oils and lubricantsFuel emissions make up a sizeable proportion of the on-road emis-
sions of organic pollutants (Table 1). In theUS EPA studies onmobile ex-haust and evaporative emissions, over 1000 OPs were recorded (EPA,2006). Identified organic compounds in diesel and gasoline exhaustsare e.g. (n-, branched, cyclo-) alkanes and alkenes; aromatic hydrocar-bons including PAHs and oxy-PAHs; biomarkers such as steranes,hopanes, terpanes; aldehydes and ketones; and alkanoic, alkanedioic,aromatic and benzoic acids (Rogge et al., 1993; Schauer et al., 1999;Schauer et al., 2002). The emission rates of individual organic pollutantsdepend on factors such as vehicle and fuel type, driving pattern, andwhether a catalytic converter is used.
Lubricant motor oil is used to protect the engine from corrosion andfriction, and contains a variety of protective chemicals (Denton, 2007).In addition to petroleum hydrocarbons, oil and lubricant spills are alsosources of phenols, e.g. bisphenol A (BPA) and AP/EOs used as fuel addi-tives or in hydraulic fluids (Ahlbom and Duus, 1992; Johansson andZimerson, 2000). Antioxidants including 2,6- and 2,4-di-tert-butylphenols are used as lubricants in the petroleum industry or as ad-ditives in hydraulic oil (Remberger et al., 2003).
3.1.6. Asphalt and concreteAbrasion of roadmaterials is an important source of emissions of or-
ganic pollutants in road environments (Table 1). Road wear dependsstrongly on factors such as traffic characteristics, use of studded tyres,the material's susceptibility to abrasion, and weather conditions(Klint, 2001). Asphalt, a mixture of bitumen and mineral matter, canvary in composition depending on applicability, manufacturing process,
1167A. Markiewicz et al. / Science of the Total Environment 580 (2017) 1162–1174
and the chemical formation of the crude oil fromwhich bitumen is pro-duced (Wess et al., 2004). The production of asphalt involves supple-mentation with additives; in recent years the proportion of theseadditives has increased, to meet higher demands for resistance and du-rability (Andersson et al., 2006). The most common additives includeliquid and mineral adhesives, such as amines and amides; polymerslike elastomers and plastomers; synthetic wax; and fibres (Huntsman,2007; Morgan et al., 2013; NVF, 2006), but also recycled tyre granules,which are a source of phthalates and PAHs (Burstyn et al., 2000;Chauhan et al., 2012; Klint, 2001; Källqvist, 2005).
Concrete pavement materials contain various additives and admix-tures (Table 1) used to improve their performance in areas such aswater reduction, faster hardening, greater strength and durability, andgeneral resistance to abrasion, consequently reducing leachability tothe runoff (Ramachandran, 1996; Rixom and Mailvaganam, 1986;Tiruta-Barna et al., 2006; Togerö, 2006). The types of admixtures usedin concrete include water reducers and accelerators, as well as air-entraining, water-proofing and de-foaming agents (Rixom andMailvaganam, 1986). Some of these admixtures are based on organicsubstances like sodium thiocyanate, resin acids and nonylphenolethoxylate, of which all have been proven to be susceptible to leaching(Togerö, 2006).
3.1.7. Road paintRoad paint is heavily exposed to abrasion and needs to be renewed
every 5–10 years. Alkylphenol ethoxylates, phthalates, and alkyd resinsare present in road paint components, such as emulsifiers, gradationagents and hardeners (Andersson and Sörme, 2004; Aznar et al.,1997). According to ECB (2002) typical paint mixtures can contain upto 3% of nonylphenol ethoxylates.
3.2. Results from the RICH screening process
For the first RICH filtration, the intention was to assess 306 com-pounds identified from the literature search. However, due to limita-tions in the available ecotoxicity data in RICH, only 171 of thesesubstances were screened. As a result, 93 of the compounds were“trapped” in all RICH filters (defined in Fig. 2), i.e. classified as com-pounds with high toxicity and of high priority for further studies. Ofthese 93 compounds, 18 occur predominantly in the water phase and75 in the sediment phase (Table 2). For the remaining 79 substances,which were removed by the respective filters of the RICH method, nofurther assessment was required. These substances are not associatedwith the water or sediment phase, exhibit low potential for bioaccumu-lation and toxicity, and/or do not cause long term-effects. An additionalliterature search of potential PPs to be screened in RICH provided a listof another 741 compounds, which was considered too many for a man-ual search for the required ecotoxicity data in RICH. After the workshopand expertmeetings, the number of organic compoundswas reduced to61, and included amides, amines, aldehydes, alkanes and naphtha. Itwas decided that a manual search for ecotoxicity data would be per-formed for these compounds. Sufficient data was found for 53 of thecompounds. An additional screening of RICH was then performed,after which 16 sediment-bound compounds were added to the total re-sults (Table 2). Despite the fact that not all the data were available forRICH filtration, the obtained results indicate the level of hazard for spe-cific groups of organic compounds.
Table 2Number of organic pollutants classified as hazardous by the RICH method, and of high priority
First RICH screening (171a)
Hazardous in water phase 18Hazardous in sediment phase 75Total hazardous compounds 93
a Total number of compounds screened.
3.3. The PP list and the highest PPs for SFA
From the RICH evaluation, a list of 109 compounds with high impacton the environment and/or humanswas identified. This list was furtherevaluated at an expertmeetingwith four researchers and experts in thearea of OPs. After the expert meeting, ten groups of compounds(Table 3) were chosen to be on the PP list of OPs emitted from theroad and traffic environment. In Table 3, the compounds are presentedin order from the highest priority to the lowest. With the exception ofphenolic antioxidants, amides and amines (analytical methods notavailable), all these compounds were measured in high concentrationsin sediment from Gårda (Table A in Supporting information). This listwas also in line with the outcomes of the Stormwater Advisory Groupworkshop (14 participants), where compounds were deemed high pri-ority depending on their sources and potentially high emitted volumes.The following groups of compounds met all the selection criteria (“no”in the column for availability of SFA means that the criterion is met):PAHs, alkanes and aldehydes. In this paper, a SFA of PAHs is presented.The reasons why PAHs were given the highest priority for SFA werethat all the selection criteria weremet, that PAHs are often themost fre-quently detected OPs in road environments (Eriksson et al., 2007;Gasperi et al., 2008), and that several of the PAHs are included in the pri-ority pollutant list from the EuropeanWater Framework Directive. SFAshave already been performed for phthalates and nonylphenols and theirethoxylates (NP/EOs) in the Gårda catchment area, and the resultshowed that approximately 4.1 kg of four selected phthalates and400 g of NP/EOs were emitted annually (Björklund, 2010). It was con-cluded that vehicles are the main source of these compounds inGårda. The sum concentration of octyl- and nonylphenols and their cor-responding mono, di and tri ethoxylates was 4.0 mg/kg DS in sedimentfromGårda. Four of 12 analysed phthalates weremeasured in high con-centrations (mg/kgDS): di-isononylphthalate (160) N di-(2-ethylhexyl)phthalate (17) ≫ di-n-butylphthalate (0.19) ~ di-isobutylphthalate(0.15).
3.3.1. PAHs and oxy-PAHsAs indicated in Section 3.1, PAHs arise from many sources and are
among the most abundant pollutants emitted in road environments(Ravindra et al., 2008). PAHs are released from several traffic relatedsources, mainly exhausts and tyre wear, and represent a high risk ofleaching to surfacewaters (formore details, see Section 3.4). In addition,PAHs deserve special attention due to their severe toxicity, includingcarcinogenicity. In the Gårda sediment, the concentrations of PAH-Mand PAH-H reached 5.2 and 3.9 mg/kg DS respectively, which exceedsthe Swedish EPA guidelines for sensitive land use of 3.0 mg/kg DS forPAH-M and 1.0 mg/kg DS for PAH-H (Naturvårdsverket, 2009).
Oxygenated PAHs (oxy-PAHs), i.e. oxidation products of PAHs, areoften found at contaminated sites (Lundstedt et al., 2007). Accordingto the RICH method, all identified oxy-PAHs met all the hazardouscriteria provided by the method. Oxy-PAHs are not emitted in largequantities, but their high levels of toxicity assign them to the PP list. Aproportion of the PAHs emitted from the road and traffic environmentto stormwatermay degrade to oxy-PAHs. In Gårda, oxy-PAH concentra-tions in the sediment reached 1.1 mg/kg DS, which is high comparedto previous studies (Lundstedt et al., 2007; Bandowe and Wilcke,2010). Eight of the nine analysed oxy-PAHs were identified in the sedi-ment: benz[a]anthracene-7,12-dion, a degradation product of
for further studies.
Second RICH screening (53a) Final list
0 1816 9116 109
Table 3Identified (groups of) priority pollutants according to the selection criteria method used.
PPgroup/compound
Criteria
Risk of transportfrom source tostorm-water
Emission frommore than onesource
Significant amounts in thesources estimated by theExpert groupd
Hazardouseffects accordingto RICHe
Chemicalanalysisavailable
SFA availablefor roadenvironment
High concentrations in thesediment in the Gårda casestudy area
Naphtha C5–C12 (petroleum) Yes Yes Yes Yes Yes No n.d.Amides Yes Yes No Yes No No n.m.Amines Yes Yes No Yes No Yesi n.m.
n.d. – not detected.n.m. – not measured.n.a. – detected, but soil quality guideline not available.
a Alkylphenols.b Bisphenol A.c Oxygenated PAHs.d High volumes of organic pollutants occurring in the road environment established on the basis of knowledge of the Expert group.e Ranking and Identification of Chemical Hazards.f Björklund, 2010.g KEMI, 2010.h KEMI, 2012.i KEMI, 2008.j Classification according to Swedish EPA general guidance for contaminated soil (Naturvårdsverket, 2009).k Classification according to Polish regulation of the Minister of the Environment on soil and ground quality standards (Żelichowski, 2002).l Compared to previous studies (Lundstedt et al., 2007; Bandowe andWilcke, 2010).
1168 A. Markiewicz et al. / Science of the Total Environment 580 (2017) 1162–1174
benz[a]anthracene, and 9,10-anthraquinone, a degradation product ofanthracene, occurred in the highest concentrations.
3.3.2. Alkanes, aldehydes, naphthaAlkanes and aldehydes are present in the largest quantities in the
traffic and road environment (Schauer et al., 1999; Schauer et al.,2002). Based on the RICH method, mainly C20–C40 alkanes and C1–C20aldehydes were identified as toxic. In the Gårda sediment, alkanesC10–C35 were measured in concentrations ranging between 1.0 and10 g/kg DS. Several studies confirm that n-alkanes and aldehydes,such as formaldehyde and acetaldehyde, are among themost abundantorganic compounds identified in vehicle exhausts, and thatcrotonaldehyde is also found in significant amounts (Davis et al.,2007; Perrone et al., 2014; Schauer et al., 2002). In sediments fromGårda, the presence of both formaldehyde (5.7mg/kg DS) and acetalde-hyde (1.7 mg/kg DS) was confirmed.Moreover, in the current study thesource apportionment of alkanes and aldehydes showed on-road emis-sions, such as exhausts and fuel spillage, to be themost common sources(EPA, 2006; Schauer et al., 1999; Schauer et al., 2002). Brake linings andtyre wearwere also important sources of alkanes and aldehydes (Roggeet al., 1993).
Naphtha is derived from crude oil and includes molecules rangingfrom C5 to C12 (Devold, 2013; Ramadhan et al., 1997). Naphtha can beused for a broad spectrum of applications, including as feedstock forproducing additives for (high octane) gasoline, a solvent in cleaning liq-uids such as glass cleaners, corrosion removers or degreasers, and in theproduction of lubrication agents (Johansson and Zimerson, 2000). Dataon hazardous effects of complex mixtures such as naphtha were notavailable in the RICH method. In addition, naphtha can be found underdifferent technical names and its chemical composition varies depend-ing on its use and crude oil quality. For this reason, it is difficult to defineits impact on aquatic organisms. Despite this, the Stormwater AdvisoryGroupworkshop recommended that naphtha be included on the PP list,mainly due to the large volumes used. The concentrations of naphthawere below the detection limits of the analytical method used inGårda. The low sediment concentrations are explained by the high
volatility of the C5–C12 alkanes; these hydrocarbons should preferablybe measured in the water and vapor phases.
3.3.3. Phenolic compounds, including antioxidants, bisphenol AThemost commonly detected phenols in stormwater or stormwater
sediments are alkylphenols and their ethoxylates, as well asmethylphenols, bisphenol A and antioxidants such as tertiarybutylphenols (Björklund et al., 2007; Boyd et al., 2004; Flint et al.,2012; Remberger et al., 2003; Rosqvist, 2004).
In this study several antioxidants in the formof tertiary butylphenolswere assigned to the PP list because of their abundance in road-relatedsources. In Sweden, 400 tons of butylphenols are used annually in a va-riety of products and materials, e.g. asphalt, lubricants, stabilisers, fuelsand rubber or plastic components (Björklund et al., 2007; Rembergeret al., 2003; Rosqvist, 2004). Antioxidants such as 4-t-butylfenol, 2,4-di-t-butylfenol, 2,6-di-t-butylfenol and t-butylhydroquinone havebeen found in elevated concentration in surface waters (Rembergeret al., 2003; Rosqvist, 2004) and the ranking performed in RICH con-firmed the compounds' toxicity and tendency to bioaccumulate inaquatic organisms as well as their resistance to degradation and possi-ble endocrine disrupting effects.
Bisphenol A was identified as a PP based on its high production vol-ume (approximately 3.8 million tons worldwide), many applicationareas and continuous release to the environment from final products(Oehlmann et al., 2009). BPA is used mainly as a monomer in the pro-duction of polycarbonate and epoxy resins (Flint et al., 2012; Hoekstraand Simoneau, 2013; Michałowicz, 2014; Staples et al., 1998), as an an-tioxidants in products used in the plastics and rubber industry (KEMI,2012) and as an inhibitor of end polymerisation in PVC manufacturing(EFSA, 2010). Uses of BPA in road-related components include asphaltmodifiers (Zhang et al., 2011), road paints (Bauer, 1980; Staples et al.,1998) and vehicle parts such as automotive lenses, dashboards andbumpers (APME, 1999). The RICH method classified BPA as a chemicallikely to be found in the sediment phase, resistant to degradation andexhibiting endocrine disrupting properties. BPA meets all the selection
1169A. Markiewicz et al. / Science of the Total Environment 580 (2017) 1162–1174
criteria (Table 3), although an SFA has previously been performed forSweden (KEMI, 2012).
3.3.4. Amines and amidesAmines are common products of roadwear as they are often used as
liquid adhesives in asphalt and admixtures, and as hardening accelera-tors for concrete and cement (Andersson et al., 2006; Rixom andMailvaganam, 1986). Several amines and amides have been identifiedin vehicle parts (Hewlett, 2013), and amides are also used as blockingresistant agents in asphalt modifiers (Nakanishi et al., 2010). However,as indicated by the expert panel during the selection process, bothgroups are only found in trace amounts in the identified sources.Water and sediment analysis for these groups are currently not avail-able, why sediment concentrations in the Gårda treatment facilitywere not measured. The RICH screening identified several toxic aminesand a few amides, supporting the decision to grant both groups priorityover other stormwater related pollutants.
3.4. Substance flow analysis of PAHs
3.4.1. Emission factors of PAH-16 from road-related sourcesEmission factors (Table 4) for each specific EPA-priority PAH were
determined to enable the calculation of compound flows in the Gårdaarea. The main sources are vehicle exhausts, tyre wear (mainly fromHA oils), motor lubricant oils, road surface wear and brake linings. Thetotal amounts of PAHs emitted from traffic and roads are calculated tobe in the range of 990–3900 μg per vehicle kilometres (vkm).
The PAHs emitted in the largest quantities are 2–4 rings (Table 4), inthe following order [μg/vkm]: naphthalene N chrysene N pyrene N
phenanthreneN fluoranthene. Themain sources of these PAHs are dieselpassenger cars (PC) and light commercial vehicles (LCV,weight b 3.5 tons), which emit a total of 740–2300 μg/vkm, followedby PCs and LCVs fuelled by gasoline/E85 (ethanol)/compressed naturalgas (CNG), tyre wear, heavy-duty vehicles (HDV, weight N 3.5 tons),motor oils and lubricants, road surface wear and brake linings.
PAHs are emitted in high quantities in exhaust gases (Table 4) fromall types of vehicles and fuels (Ntziachristos and Samaras, 2013). ThePAHs most commonly found in vehicle exhausts are 2–4 rings:naphthalene N phenanthrene N fluoranthene N pyrene. The PAHs occur-ring in the highest concentrations in tyres are 4–6 rings:chrysene N pyrene N fluoranthene N benzo[g,h,i]perylene, mostlyfound in HA oils. As mentioned, the use of HA oils in tyres is now re-stricted in Europe, but since the lifetime of tyres is 50,000–60,000 km(Ntziachristos and Boulter, 2009; UKEA, 1998) or 4 years, and wearout refers to approximately 1 kg per tyre (Baumann and Ismeier,1998), HA oils still occur in the road and traffic environment. SpecificPAHs dominating in the lubricant motor oils are 3–6 rings:phenanthrene N benzo[a]pyrene N benzo[g,h,i]perylene ~ indeno[1,2,3-c,d]pyrene ~ anthracene = pyrene. The content of PAHs in the oil de-pends on the age of the oil and is due to the pyrolysis and pyrosynthesisof the oil at the high temperature in the engine, and the contaminationby fuel combustion products (Wong and Wang, 2001). Used engine oilfrom gasoline cars contain considerably more PAHs than that from die-sel cars and trucks (Clonfero et al., 1996).
PAHs also occur in the bituminous binder in asphalt (Brandt and DeGroot, 2001). The PAHs dominating in emissions from asphalt are 4–6rings: benzo[a]anthracene N benzo[g,h,i]perylene=chrysene N fluoran-thene (Table 4). The amount of brake wear emitted depends on thebrake pad composition, the vehicle type and the driver behaviour. TheEF was estimated to 8.8–84 mg/vkm, based on data from Rogge et al.(1993), Westerlund (2001), Ntziachristos and Boulter (2009) andLuhana et al. (2004). Benzo[g,h,i]perylene followed by chrysene andbenzo[a]anthracene (4–6 rings) are the PAHs mostly emitted frombrake linings.
3.4.2. Estimated loads of PAHs in case study areaThe results of the SFA (Fig. 4) indicate that the total amount of
PAHs emitted annually in the Gårda catchment area (5.5 ha) is32–160 kg. Through recalculation, this gives an annual emissionload of 5.8–29 kg/ha for the urban road environment. The resultssuggest that only 2–6%, i.e. 500–9700 g/year, of the total amount ofPAHs emitted in Gårda end up in the stormwater treatment facility.The majority of the PAHs are distributed to other sinks, throughemissions to air, and immobilized in surrounding soils and onurban surfaces. Unaccountable losses of water and PAHs, e.g. throughdegradation, in the underground pipe system is also a possible sink.The results are surprising, as chemical analysis of PAHs in sedimentsshow substantially lower emissions to the stormwater in Gårda thanthe loads calculated using emission factors. Possible uncertainties inthe load estimations, sediment sampling and analysis are furtherdiscussed in Section 3.4.3.
The largest sources of PAHs in the Gårda catchment area, i.e. the in-flow (Fig. 4), are exhaust gases ≫ tyres N motor oil leakage N road sur-face wear = brake linings. The PAHs that dominate in the emissionsare PAH-L and PAH-M–naphthalene≫phenanthreneN fluoranthene=pyrene – all deriving from emissions from vehicles run on diesel, gaso-line, E85 or CNG, and from both cars and LCVs (see Table 3). In the out-flow, i.e. the flow to stormwater (Fig. 4), the composition of the PAHs isvery different from the inflow, and here the PAH-M and PAH-H domi-nate, specifically chrysene N pyrene ≫ indeno[1,2,3-c,d]pyrene = fluo-ranthene = phenanthrene. This implies that PAHs present in thestormwater are found in much smaller amounts compared to the totalloads, but contain much more of the hazardous PAHs as both chryseneand indeno[1,2,3-c,d]pyrene are classified as probable human carcino-gen agents (ATSDR, 2009). The main source of the PAHs found instormwater is tyres, followed by motor oil leakage, exhaust gases,road surface wear and brake linings. For this reason, it is of high impor-tance to prioritize the environmental work to remove all tyres contain-ing HA oils, or remainders of HA oils, from the market. It is alsoimportant to focus on developing innovative engine combustion tech-niques, to minimise the use of motor oils that contain PAHs, but alsoto develop techniques that prevent motor oil spills, whether from theengine or the exhaust system, from reaching the surroundingenvironment.
3.4.3. Comparison of SFA results and quantitative sediment-derived loadsThe total PAH loads in the Gårda catchment area, estimated using
EFs, are approximately 6 to 52 times (min/max EF loads, respectively)higher than the loads estimated from sediment concentrations andmasses (Fig. 5). The measured concentrations of oxy-PAHs, whichoccur as a product of postemission oxidation of PAHs in sediment(Lundstedt et al., 2007), were added to the total PAH loads. Measure-ment uncertainties relating to sedimentmasses and PAHconcentrationshave been accounted for in the sediment load calculations. However, as-sumptions and estimations of EFs and the proportions of pollutants thatreach the stormwater system also include uncertainties. The percentageof PAHs deposited on the road, as presented by Hewitt and Rashed(1990), were used in this study to calculate the proportion of PAHsreaching the stormwater system. The PAHs deposited on the nearbysoil and grass, i.e. not on the road surface, are much less likely to reachthe stormwater system. The partitioning of PAHs between road surfaceand soil/grass was not reported for all studied PAHs (Hewitt andRashed, 1990). Accordingly, assumptions were made for certain com-pounds,which adds to the uncertainty of calculated PAHs loads. In addi-tion, load calculations do not take into account the proportion of PAHssorbed to stationary road-side sediments (not transported withstormwater) or to sediments which are removed through streetcleaning. As mentioned previously, a considerable share of the PAHsfound in stormwater is in the dissolved and colloidal phases, which pre-vents sorption and precipitation of the PAHs and facilitates their trans-port through the sedimentation facility (Kalmykova et al., 2013;
Table 4Minimum and maximum emission factors of polycyclic aromatic hydrocarbons from traffic and roads.
16 US EPA-priority PAH Vehicle exhausta Tyre (withHA-oils) wearb
a Ntziachristos and Samaras, 2013.b ETRMA, 2011; Björklund, 2010; Denier van der Gon et al., 2008.c Wong and Wang, 2001; Klein et al., 2013; EEA, 2013.d Lindgren, 1998; Denier van der Gon et al., 2008.e Warner et al., 2000; Ntziachristos and Boulter, 2009; Rogge et al., 1993.f Vehicle kilometres.g Compressed natural gas.h Passenger cars.i Light commercial vehicles (b3.5 tons).j Heavy-duty vehicle (N3.5 tons).
1170 A. Markiewicz et al. / Science of the Total Environment 580 (2017) 1162–1174
Nielsen et al., 2015). Previous studies also showed that the calculatedKOW values for certain organic pollutants were lower than the theoreti-cal values (Kalmykova et al., 2013). For this study, it should be notedthat the distribution of PAHs to the sediment, and the amounttransported out from theGårda facility, is determined onmeasured con-centrations in a few sediment samples. It is also possible that some ofthe underground sewer pipes are leaching or incorrectly connected,and thus contribute to the loss of stormwater transported to the sedi-mentation facility. Taken together, it is assumed that the PAH loads ac-tually reaching the sedimentation system in Gårda, i.e. the calculatedsediment loads, are underestimated.
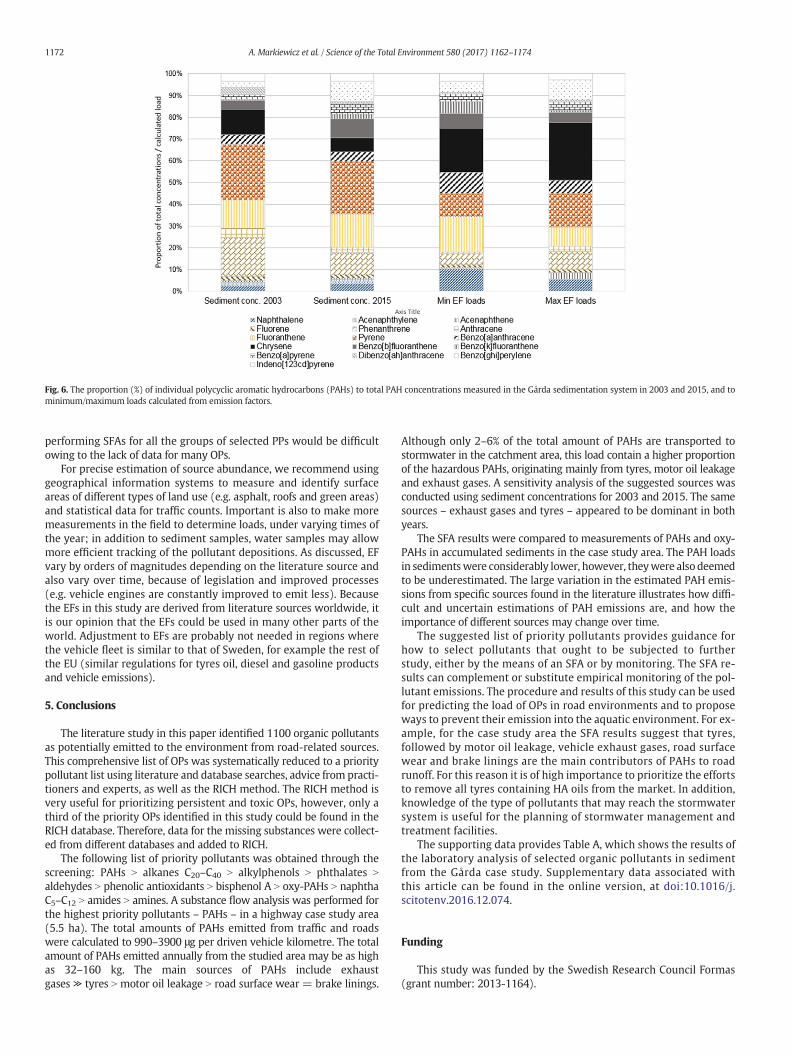
The highest discrepancy between EF and sediment loads was foundfor chrysene, followed by naphthalene and benzo[a]anthracene(26–260, 20–90 and 15–79 times higher loads estimated from EFs, re-spectively). This trend is visualized in Fig. 6 (theproportion of individualPAHs is the same for sediment concentrations and sediment loads).Naphthalene is volatile and more water soluble (approximately20 mg/L) than the other PAHs, and has been found predominantly inthe dissolved phase in contaminated waters (Kalmykova et al., 2013),why monitored concentrations in sediments may not reflect the trueloads emitted to the stormwater system. Chrysene was previouslyfound in high concentrations in tyres, and low sediment concentrationsmay be due to the decreased use of HA oils in rubber, as a result of theEuropean restrictions that came into force in 2010. Emission patternsand loads of PAHs in traffic areas tend to fluctuate over time and followchanges in source occurrence, such as preferred type of fuel, efficiencyof combustion engines, and restrictions imposed on for example the
use of HA oils in rubber tyres and coal-tar-based pavement sealcoats(Ravindra et al., 2008; Shen et al., 2011; Van Metre and Mahler, 2014).For this reason, EFs based on outdated references may lead to incorrectPAH loads. Furthermore, reported EFs (Table 4 and Fig. 6) vary by sever-al orders of magnitude, illustrating how difficult and uncertain estima-tions of PAH emissions indeed are. Consequently, this leads to largeuncertainties when PAH loads are estimated using EFs.
A comparison of the proportions of PAHs in sediments collected inGårda in 2003 (Jakobsson et al., 2006) and 2015 (same sampling proce-dure) revealed that the PAH concentrations were on average 1.5 timeshigher in samples collected in 2015. These results indicate that PAH emis-sions accumulate and vary over time. Samples collected in 2003 containeda significantly (independent samples t-test, p N 0.005) higher proportionof phenanthrene, anthracene, chrysene and dibenzo[a,h]anthracene, i.e.mostly PAH-M (Fig. 6). Samples collected in 2015 contained a higher pro-portion of fluoranthene, benzo[b,k]fluoranthene, benzo[a]pyrene andbenzo[g,h,i]perylene, i.e. mostly PAH-L (Fig. 6). To investigate whetherthe source apportionment has changed over time, the proportions ofPAHs in 2003 and 2015 were compared with calculated loads using EFs.No strong trends in source apportionment were seen between theyears; exhaust gases and tyres are major sources of the most abundantPAHs in samples collected in both 2003 and 2015. Tyres were expectedto be less important in the more recent samples due to the reduced useof HA oils in rubber. One indication of this is that chrysene, with highEFs for tyres, was much more abundant in the 2003 samples. However,benzo[b,k]fluoranthene, benzo[a]pyrene and benzo[g,h,i]perylene, whichwere more abundant in the 2015 samples, are also mainly emitted from
Fig. 4. Estimated fluxes of polycyclic aromatic hydrocarbons in the Gårda case study area.
1171A. Markiewicz et al. / Science of the Total Environment 580 (2017) 1162–1174
tyres, although the tyre EFs for these PAH-H are one to two magnitudeslower than for chrysene (Table 4).
In sedimentmeasurements from2003 andprevious studies, the con-centration of pollutants were highest in chamber 7 of the Gårda facility(Fig. 6 and Pettersson et al., 2005). In contrast, the sampling performedin 2015 (Supporting information Table A) revealed that concentrationsof all parameters in chamber 7 are lower than in chambers 3 and 5. Forthis reason, sample 7 may not be representative. If that is the case, thePAH loads estimated from sediment concentrations are likely to beunderestimated.
4. Impact of this study
The results from this studywill be used to proposemethods to coun-teract the emissions of OPs in road runoff to the aquatic environment,using a multi-criteria decision analysis (MCDA) approach. MCDA hasfrequently been used for assessment of environmental problems, al-though it has been sparsely used for stormwater management (Elliset al., 2004; Jia et al., 2013). Development of anMCDAmethodwill con-tribute to the implementation of Best Management Practices includinge.g. road sweeping, inlet control, infiltration areas and investments inlocal treatment facilities in the urban area. Identification of PP sourcesshould call on relevant stakeholders within the vehicle and oil industry,as well as planning departments to formulate strategies for the up-stream pollution control at the local, national and international scale.
Fig. 5. Estimated loads of total polycyclic aromatic hydrocarbons (PAHs) in stormwater from thecalculated from quantified PAH and oxy-PAH concentrations in the Gårda sedimentation facianalytical error and a ±20% measurement error in the sediment mass. The data is presented in
There are a few limitations in the implementation of the findings ofthis study. For the SFA of PAHs, the information available is quite exten-sive yet plenty is missing or outdated. For other compounds on the PP-list, reliable emission factors are missing. This imply that identifying themost important sources of OPs is complex, which means that counter-measures to reduce OP sources and emissions are difficult to outline.Therefore further studies on emissions and determination of emissionfactors of OPs are in demand. Additionally, in this research a casestudy of a small road catchment was presented; thus it was possibleto monitor the fluxes of pollutants in stormwater. Other urban areasmay present a mix of different activities and constructions, and moredifficult to monitor, hence comparing SFA results with measured loadsmay not be possible.
To successfully implement reduction measures, it is of high impor-tance to identify the dominant sources of OPs in the catchment. Howev-er, it is challenging to estimate accurately the sources of OPs from roadsand vehicles to road runoff. In the source identification stage of the SFA,quantities of the released OPs were neglected. Data found on emissionsor occurrences of specific OPs, from different entities found in road andtraffic environments, served to establish them as possible sources ofOPs. Studies thatwere used to establish the sources of OPs to road runoffmay have limitations related to outdated emission factors or agglomer-ation of multiple source deposits that hinders accurate source recogni-tion. Additionally, long-range transport of low molecular weightpollutants means that the location of a source is not clear. Also, findingliterature covering the most important sources is time consuming and
Gårda catchment area using emission factors (minimumandmaximumreported EFs) andlity. Minimum/maximum sediment loads are estimated based on a ±20% PAH/oxy-PAHtwo panes as the values are of different magnitude.
Fig. 6. The proportion (%) of individual polycyclic aromatic hydrocarbons (PAHs) to total PAH concentrations measured in the Gårda sedimentation system in 2003 and 2015, and tominimum/maximum loads calculated from emission factors.
1172 A. Markiewicz et al. / Science of the Total Environment 580 (2017) 1162–1174
performing SFAs for all the groups of selected PPs would be difficultowing to the lack of data for many OPs.
For precise estimation of source abundance, we recommend usinggeographical information systems to measure and identify surfaceareas of different types of land use (e.g. asphalt, roofs and green areas)and statistical data for traffic counts. Important is also to make moremeasurements in the field to determine loads, under varying times ofthe year; in addition to sediment samples, water samples may allowmore efficient tracking of the pollutant depositions. As discussed, EFvary by orders of magnitudes depending on the literature source andalso vary over time, because of legislation and improved processes(e.g. vehicle engines are constantly improved to emit less). Becausethe EFs in this study are derived from literature sources worldwide, itis our opinion that the EFs could be used in many other parts of theworld. Adjustment to EFs are probably not needed in regions wherethe vehicle fleet is similar to that of Sweden, for example the rest ofthe EU (similar regulations for tyres oil, diesel and gasoline productsand vehicle emissions).
5. Conclusions
The literature study in this paper identified 1100 organic pollutantsas potentially emitted to the environment from road-related sources.This comprehensive list of OPs was systematically reduced to a prioritypollutant list using literature and database searches, advice from practi-tioners and experts, as well as the RICH method. The RICH method isvery useful for prioritizing persistent and toxic OPs, however, only athird of the priority OPs identified in this study could be found in theRICH database. Therefore, data for the missing substances were collect-ed from different databases and added to RICH.
The following list of priority pollutants was obtained through thescreening: PAHs N alkanes C20–C40 N alkylphenols N phthalates N
aldehydes N phenolic antioxidants N bisphenol A N oxy-PAHs N naphthaC5–C12 N amides N amines. A substance flow analysis was performed forthe highest priority pollutants – PAHs – in a highway case study area(5.5 ha). The total amounts of PAHs emitted from traffic and roadswere calculated to 990–3900 μg per driven vehicle kilometre. The totalamount of PAHs emitted annually from the studied area may be as highas 32–160 kg. The main sources of PAHs include exhaustgases ≫ tyres N motor oil leakage N road surface wear = brake linings.
Although only 2–6% of the total amount of PAHs are transported tostormwater in the catchment area, this load contain a higher proportionof the hazardous PAHs, originating mainly from tyres, motor oil leakageand exhaust gases. A sensitivity analysis of the suggested sources wasconducted using sediment concentrations for 2003 and 2015. The samesources – exhaust gases and tyres – appeared to be dominant in bothyears.
The SFA results were compared to measurements of PAHs and oxy-PAHs in accumulated sediments in the case study area. The PAH loadsin sedimentswere considerably lower, however, theywere also deemedto be underestimated. The large variation in the estimated PAH emis-sions from specific sources found in the literature illustrates how diffi-cult and uncertain estimations of PAH emissions are, and how theimportance of different sources may change over time.
The suggested list of priority pollutants provides guidance forhow to select pollutants that ought to be subjected to furtherstudy, either by the means of an SFA or by monitoring. The SFA re-sults can complement or substitute empirical monitoring of the pol-lutant emissions. The procedure and results of this study can be usedfor predicting the load of OPs in road environments and to proposeways to prevent their emission into the aquatic environment. For ex-ample, for the case study area the SFA results suggest that tyres,followed by motor oil leakage, vehicle exhaust gases, road surfacewear and brake linings are the main contributors of PAHs to roadrunoff. For this reason it is of high importance to prioritize the effortsto remove all tyres containing HA oils from the market. In addition,knowledge of the type of pollutants that may reach the stormwatersystem is useful for the planning of stormwater management andtreatment facilities.
The supporting data provides Table A, which shows the results ofthe laboratory analysis of selected organic pollutants in sedimentfrom the Gårda case study. Supplementary data associated withthis article can be found in the online version, at doi:10.1016/j.scitotenv.2016.12.074.
Funding
This study was funded by the Swedish Research Council Formas(grant number: 2013-1164).
1173A. Markiewicz et al. / Science of the Total Environment 580 (2017) 1162–1174
Acknowledgements
The authors would like to thank the Stormwater Advisory Group forparticipation in the workshop and providing valuable information re-garding the selection of PPs.
References
Ahlbom, J., Duus, U., 1992. Rena smörjan? Smörjmedel - möjlighet till förändring (Thepure grease? Lubricants - opportunity for change). KemIs rapportserie, p. 146.
Ahlbom, J., Duus, U., 1994. Nya hjulspår – en produktstudie av gummidäck (New wheeltracks – a study of rubber tyres). In: KemI (Ed.)KEMI Report Series. The SwedishChemicals Agency, Sundbyberg, Sweden, p. 78.
Andersson, Å., Sörme, L., 2004. Substansflödesanalys – av alkylfenoler ochalkylfenoletoxilater i Stockholms stad 2004 (Substance Flow Analysis - of Alkylphenolsand Alkylphenol in the City of Stockholm 2004). p. 89.
Andersson, A., Jacobsson, T., Persson, B.-O., 2006. In: Väg- och transportforskningsinstitutet(Ed.), Tillsatsmedel i asfalt - påverkan på arbetsmiljö och omgivning. Slutrapport (Ad-ditives in asphalt - impact on theworking environment and surroundings. Final report).Peab Asfalt AB, Malmö, p. 26.
APME, 1999. A material of Choice for the Automotive Industry - Insight Into Consumptionand Recovery in Western Europe. 12. Association of Plastics Manufacturers inEurope.
ATSDR, 2009. Case Studies in Environmental Medicine. Toxicity of Polycyclic AromaticHydrocarbons (PAHs). Agency for Toxic Substances and Disease Registry, p. 68.
Aznar, A.C., Caprari, J.J., Meda, J.F., Slutzky, O., 1997. Study of formulation variables of ther-moplastic reflecting materials for traffic marking. J. Coatings Technol. 69, 33–44.
Bandowe, B.A.M., Wilcke, W., 2010. Analysis of polycyclic aromatic hydrocarbons andtheir oxygen‐containing derivatives and metabolites in soils. J. Environ. Qual. 39,1349–1358.
Barrett, M.E., Zuber, R.D., Collins, E.R., Malina, J.F., Charbeneau, R.J., Ward, G.H., 1995. A re-view and evaluation of literature pertaining to the quantity and control of pollutionfrom highway runoff and construction. Center For Research In Water Resources, Bu-reau of Engineering Research. The University of Texas at Austin. J.J. Pickle ResearchCampus, Austin, TX 78712-4497, p. 180.
Bauer RS. Epoxy resin traffic paint compositions. Google Patents, 1980, pp. 6.Baumann, W., Ismeier, M., 1998. Emissionen beim bestimmungsgemässen Gebrauch von
Reifen (Emissions from tires in dedicated use). Kautsch. Gummi Kunstst. 51,182–186.
Baun, A., Eriksson, E., Ledin, A., Mikkelsen, P.S., 2006. A methodology for ranking and haz-ard identification of xenobiotic organic compounds in urban stormwater. Sci. TotalEnviron. 370, 29–38.
Björklund, K., 2010. Substance flow analyses of phthalates and nonylphenols instormwater. Water Sci. Technol. 62 (5), 1154–1160.
Björklund, K., 2011. Sources and Fluxes of Organic Contaminants in Urban Runoff.Institutionen för bygg- och miljöteknik, Vatten Miljö Teknik. (PhD thesis). Chalmerstekniska högskola, p. 140.
Björklund, K., Malmqvist, P.-A., Strömvall, A.-M., 2007. In: Vatten Miljö Teknik Cth,Göteborg (Ed.), Källor till och flöden av ftalater och nonylfenoler i Stockholmsdagvatten (Sources and fluxes of phthalates and nonylphenols in stormwater inStockholm), p. 190.
Björklund, K., Almqvist, H., Malmqvist, P.-A., Strömvall, A.-M., 2008. Best managementpractices to reduce phthalate and nonylphenol loads in urban runoff. 11th Interna-tional Conference on Urban Drainage, Edinburgh, Scotland, UK, p. 10.
Björklund, K., Cousins, A.P., Strömvall, A.-M., Malmqvist, P.-A., 2009. Phthalates andnonylphenols in urban runoff: occurrence, distribution and area emission factors.Sci. Total Environ. 407, 4665–4672.
Björklund, K., Malmqvist, P.A., Strömvall, A.M., 2011. Simulating organic pollutant flows inurban stormwater: development and evaluation of a model for nonylphenols andphthalates. Water Sci. Technol. 63, 508–515.
Boyd, G.R., Palmeri, J.M., Zhang, S., Grimm, D.A., 2004. Pharmaceuticals and personal careproducts (PPCPs) and endocrine disrupting chemicals (EDCs) in stormwater canalsand Bayou St. John in New Orleans, Louisiana, USA. Sci. Total Environ. 333, 137–148.
Brandt, H.C.A., De Groot, P.C., 2001. Aqueous leaching of polycyclic aromatic hydrocarbonsfrom bitumen and asphalt. Water Res. 35, 4200–4207.
Bringezu, S., 2006. Material Flow Analysis and the Use of Renewables From a Systems Per-spective. Renewables-based Technology: Sustainability Assessment. pp. 127–142.
Brorström-Lundén E., R.M., Kaj, L., Hansson, K., Palm Cousins, A., Andersson, H., Haglund,P., Ghebremeskel, M., Schlabach, M., 2010. Results From the Swedish National Screen-ing Programme 2008. Screening of Unintentionally Produced Organic Contaminants.IVL Svenska Miljöinstitutet, p. 71.
Burstyn, I., Kromhout, H., Boffetta, P., 2000. Literature review of levels and determinantsof exposure to potential carcinogens and other agents in the road construction indus-try. American Industrial Hygiene Association Journal]–>Am. Ind. Hyg. Assoc. J. 61,715–726.
Chauhan, S.K., Shukla, A., Gangopadhyay, S., Sharma, S., 2012. Recent trends of the emis-sion characteristics from the road construction industry. Environ. Sci. Pollut. Res. 19,301.
Clonfero, E., Nardini, B., Marchioro, M., Bordin, A., Gabbani, G., 1996. Mutagenicity andcontents of polycyclic aromatic hydrocarbons in used and recycled motor oils.Mutat. Res. Genet. Toxicol. 368, 283–291.
Davis, M.E., Blicharz, A.P., Hart, J.E., Laden, F., Garshick, E., Smith, T.J., 2007. Occupationalexposure to volatile organic compounds and aldehydes in the U.S. trucking industry.Environ. Sci. Technol. 41, 7152–7158.
Denier van der Gon, H., Broeke, H., Hulskotte, J., 2008. Road Surface Wear Emission Esti-mates for Diffuse Sources. Netherlands Emission Inventory. Netherlands nationalwater board - water unit, p. 18.
Denton, E.J., 2007. A Review of the Potential Human and Environmental Health Impacts ofSynthetic Motor Oils. Office of Environmental Health Hazard Assessment, CaliforniaEnvironmental Protection Agency, p. 16.
Devold, H., 2013. Oil and gas production handbook. An introduction to oil and gas produc-tion, transport, refining and petrochemical industry. ABB Oil and Gas. ABB, p. 162.
EC, 2000. In: Comission, E. (Ed.), Directive 2000/60/EC of the European Parliament and ofthe Council, p. 72.
EC, 2006. In: Union TEPATCOTE (Ed.), Regulation (Ec) No 1907/2006 of the European Par-liament and of the Council, p. 520.
ECB, 2002. 4-Nonylphenol (Branched) and Nonylphenol. European Union Risk Assess-ment Report. Institute for Health and Consumer Protection, p. 244.
EEA, 2013. EMEP/EEA Air Pollutant Emission Inventory Guidebook 2013. Technical Guid-ance to Prepare National Emission Inventories, Luxembourg, p. 26.
EFSA, 2010. Scientific Opinion on Bisphenol A: Evaluation of a Study Investigating ItsNeurodevelopmental Toxicity, Review of Recent Scientific Literature on Its Toxicityand Advice on the Danish Risk Assessment of Bisphenol A. European Food Safety Au-thority, p. 116.
Ellis, B., 1991. Urban runoff quality in the UK: problems, prospects and procedures. Appl.Geogr. 11, 187–200.
Ellis, J.B., Deutsch, J.C., Mouchel, J.M., Scholes, L., Revitt, M.D., 2004. Multicriteria decisionapproaches to support sustainable drainage options for the treatment of highway andurban runoff. Sci. Total Environ. 334–335, 251–260.
EPA, 2002. In: Agency UEP (Ed.), Federal Water Pollution Control Act, p. 132.EPA, 2006. Master List of Compounds Emitted by Mobile Sources. United States Environ-
mental Protection Agency, p. 16.EPA U, 1995. In: EPA U (Ed.), ECOTOX Database.Eriksson, E., 2002. Potential and Problems Related to Reuse of Water in Households. Envi-
ronment & Resources. (PhD thesis). Technical University of Denmark, Kgs. Lyngby,Denmark, p. 51.
Eriksson, E., Baun, A., Scholes, L., Ledin, A., Ahlman, S., Revitt, M., et al., 2007. Selectedstormwater priority pollutants — a European perspective. Sci. Total Environ. 383,41–51.
ETRMA, 2010. Replacement of highly aromatic oils in tyres. In: Associationa ETaRM (Ed.),FAQ and Definitions, p. 6.
ETRMA, 2011. Second testing program confirms: REACH compliance tests continue togive failing grades to tyre imports. In: Associationa ETaRM (Ed.), Etrma ConcernedAbout Enforcement of European Legislation, p. 2.
Faure, P., Landais, P., Schlepp, L., Michels, R., 2000. Evidence for diffuse contamination ofriver sediments by road asphalt particles. Environ. Sci. Technol. 34, 1174–1181.
Flint, S., Markle, T., Thompson, S., Wallace, E., 2012. Bisphenol A exposure, effects, and pol-icy: a wildlife perspective. J. Environ. Manag. 104, 19–34.
Furumai, H., Balmer, H., Boller, M., 2002. Dynamic behavior of suspended pollutants andparticle size distribution in highway runoff. Water Sci. Technol. 46, 413–418.
Gasperi, J., Garnaud, S., Rocher, V., Moilleron, R., 2008. Priority pollutants in wastewaterand combined sewer overflow. Sci. Total Environ. 407, 263–272.
Group GAS, 2016. Global Automotive Declarable Substance List (GADSL). 2015 GADSLVersion 1.0. p. 13.
Helmreich, B., Hilliges, R., Schriewer, A., Horn, H., 2010. Runoff pollutants of a highly traf-ficked urban road – correlation analysis and seasonal influences. Chemosphere 80,991–997.
Hewitt, N.C., Rashed, M.B., 1990. An integrated budget for selected pollutants for a majorrural highway. Sci. Total Environ. 93, 375–384.
Hewlett, P., 2013. International Material Data System (IMDS). Copyright (C) Hewlett-Packard GmbH 2013. .
Hoekstra, E.J., Simoneau, C., 2013. Release of bisphenol A from polycarbonate-a review.Crit. Rev. Food Sci. Nutr. 53, 386–402.
Hoffmann, L., 1996. Massestrømsanalyse for phthalater (Flow analysis of phthalates).Miljøprojekt nr. 320. Miljø- og Energiministeriet Miljøstyrelsen, p. 108.
Huang, C.L., Vause, J., Ma, H.W., CP, Y., 2012. Using material/substance flow analysis tosupport sustainable development assessment: a literature review and outlook.Resour. Conserv. Recycl. 68, 104–116.
Huntsman, 2007. Ethyleneamines. A Global Profile of Products and Services. p. 76.Ichiki, A., Ido, F., Minami, T., 2008. Runoff characteristics of highway pollutants based on a
long-term survey through a year. Water Sci. Technol. 8.Jakobsson, A., TJR, P., Strömvall, A.-M., 2006. Tungmetaller och PAH i ett
efterbehandlingssystem för vägdagvatten i Gårda (Heavymetals and PAH in an under-ground treatment system for highway runoff in Gårda). Vägverket, Borlänge, p. 84.
Jensen, M.B., Holm, P.E., Laursen, J., Hansen, H.C., 2006. Contaminant aspects of blackishsurface deposits on highway roadsides. Water Air Soil Pollut. 175, 305–321.
Jia, H., Yao, H., Tang, Y., SL, Y., Zhen, J.X., Lu, Y., 2013. Development of a multi-criteria indexranking system for urban runoff best management practices (BMPs) selection. Envi-ron. Monit. Assess. 185, 7915–7933.
Johansson, H., Zimerson, E., 2000. Tox-info handboken: D. 14, Bilvårdsprodukter (Tox-infomanual: D.14, Car Care Products). Toxinfo, Lund.
Jonsson, A., Fridén, U., Thuresson, K., Sörme, L., 2008. Substance flow analyses of organicpollutants in Stockholm. Water Air Soil Pollut. Focus 8, 433–443.
Källqvist, T., 2005. Methods for Calculating the Emissions of Transport in the Netherlands.Norwegian Pollution Control Authority, p. 96.
Kalmykova, Y., Björklund, K., Strömvall, A.M., Blom, L., 2013. Partitioning of polycyclic ar-omatic hydrocarbons, alkylphenols, bisphenol A and phthalates in landfill leachatesand stormwater. Water Res. 47, 1317–1328.
1174 A. Markiewicz et al. / Science of the Total Environment 580 (2017) 1162–1174
Kalmykova, Y., Moona, N., Strömvall, A.M., Björklund, K., 2014. Sorption and degradationof petroleum hydrocarbons, polycyclic aromatic hydrocarbons, alkylphenols,bisphenol A and phthalates in landfill leachate using sand, activated carbon andpeat filters. Water Res. 56, 246–257.
KEMI, 2008. Aminer. Kemikalieinspektionen. Flödesanalyser för kemiska ämnen (FlowAnalysis for Chemical Substances).
KEMI, 2010. Butylfenoler. Kemikalieinspektionen. Flödesanalyser för kemiska ämnen(Flow Analysis for Chemical Substances).
KEMI, 2012. Bisfenol A. Kemikalieinspektionen. Flödesanalyser för kemiska ämnen (FlowAnalysis for Chemical Substances).
Klein, J., Geilenkirchen, G., Hulskotte, J., Hensema, A., Ligterink, N., Fortuin, P., et al., 2013.Methods for Calculating the Emissions of Transport in the Netherlands CBS-Environmental Statistics. PBL- Netherlands Environmental Assessment Agency.TNO.DG for Public Works and Water Management-DVS. CBS-Transport Statistics, p. 96.
Klint, M., 2001. In: Universitet S (Ed.), Vägmaterialets bidrag till dagvattenföroreningarnainom Stockholms stad (Contribution of road construction materials to stormwaterpollution in the city of Stockholm). Institutionen för geologi och geokemi, p. 64.
Kose, T., Yamamoto, T., Anegawa, A., Mohri, S., Ono, Y., 2008. Source analysis for polycyclicaromatic hydrocarbon in road dust and urban runoff using marker compounds. Desa-lination 226, 151–159.
Lee, H., Lau, S.-L., Kayhanian, M., Stenstrom, M.K., 2004. Seasonal first flush phenomenonof urban stormwater discharges. Water Res. 38, 4153–4163.
Lindgren, Å., 1998. Road Construction Materials as a Source of Pollutants. (PhD thesis).Luleå tekniska universitet, p. 147.
Luhana, L., Sokhi, R., Warner, L., Mao, H., Boulter, P., McCrae, I., et al., 2004. Measurementof Non-exhaust Particulate Matter PARTICULATES Deliverable 8. European Commis-sion. Directorate General Transport and Environment, p. 103.
Lundstedt, S., White, P.A., Lemieux, C.L., Lynes, K.D., Lambert, I.B., Oberg, L., et al., 2007.Sources, fate, and toxic hazards of oxygenated polycyclic aromatic hydrocarbons(PAHs) at PAH-contaminated sites. Ambio 36, 475–485.
Malmqvist, B., Rundle, S., 2002. Threats to the running water ecosystems of theworld. En-viron. Conserv. 29, 134–153.
Månsson, N., Sörme, L., Wahlberg, C., Bergbäck, B., 2008. Sources of alkylphenols andalkylphenol ethoxylates in wastewater—a substance flow analysis in Stockholm,Sweden. Water Air Soil Pollut. Focus 8, 445–456.
Marcus, H.-O., 2006. Litteraturstudie av miljö- och arbetsmiljöeffekter av inblandning avdäck i vägbeläggningar (Literature Review of Environment and Working Environ-ment Effects of Implications of Tyres in Road Surfaces). IVL Svenska Miljöinstitutet,p. 20.
Michałowicz, J., 2014. Bisphenol A – sources, toxicity and biotransformation. Environ.Toxicol. Pharmacol. 37, 738–758.
Morgan B, Stark JL, Draper JD. Process for improving the physical properties of bitumen.Google Patents, 2013, pp. 9.
Motelay-Massei, A., Garban, B., Tiphagne-larcher, K., Chevreuil, M., Ollivon, D., 2006. Massbalance for polycyclic aromatic hydrocarbons in the urban watershed of Le Havre(France): transport and fate of PAHs from the atmosphere to the outlet. Water Res.40, 1995–2006.
Nakanishi H, Takei S, Goto K. Asphalt modifier, asphalt composition, asphalt mixture, andmethods for producing them. Google Patents, 2010.
Naturvårdsverket, 2009. Riktvärden för förorenad mark - Modellbeskrivning ochvägledning (Guide Values for Contaminated Soil - Model Description and guidance).Rapport 5976. Bromma. p. 272.
Nielsen, U., Pedersen, B.M., Larsen, H.F., Knudsen, H.H., 2000. Bilvaskehaller - status ogstrategier (Car Washing Facilities - Status and Strategies). Miljøprojekt Nr. 5372000. DHI - Institut for Vand og Miljø. Instituttet for Produktudvikling, p. 164.
Nielsen, K., Kalmykova, Y., Strömvall, A.M., Baun, A., Eriksson, E., 2015. Particle phase dis-tribution of polycyclic aromatic hydrocarbons in stormwater - using humic acid andiron nano-sized colloids as test particles. Sci. Total Environ. 532, 103–111.
Norin, M., 2004. Subsurface Environmental Impact in Urban Areas: Shallow GroundwaterComposition, Corrosion of Soil-buried Constructions, and Leachates From ReclaimedAsphalt Pavement. (PhD thesis). Chalmers tekniska högsk, Göteborg, p. 104.
Norin, M., Strömvall, A.M., 2004. Leaching of organic contaminants from storage ofreclaimed asphalt pavement. Environ. Technol. 25, 323–340.
Ntziachristos, L., Boulter, P., 2009. Road vehicle tyre and brake wear. Road Surface WearEMEP/EEA Emission Inventory Guidebook 2009, p. 32.
Ntziachristos, L., Samaras, Z., 2013. EMEP/EEA Emission Inventory Guidebook 2013. Ex-haust Emissions From Road Transport. p. 158.
NVF, 2006. Prestandahöjande tillsatser i asfaltbeläggning: Erfarenheter från de nordiskaländerna (A Performance Enhancing Additives in Asphalt: Experience of the NordicCountries). Utskott 33, Beläggningar. Nordiska Vägtekniska Förbundet, Uppsala,p. 25.
Oehlmann, J., Schulte-Oehlmann, U., Kloas, W., Jagnytsch, O., Lutz, I., Kusk, K.O., et al.,2009. A critical analysis of the biological impacts of plasticizers on wildlife. Philos.Trans. R. Soc. B Biol. Sci. 364, 2047–2062.
Oehme, M., Manø, S., 1984. The long-range transport of organic pollutants to the Arctic.Fresenius' Z. Anal. Chem. 319, 141–146.
Perrone, M.G., Carbone, C., Faedo, D., Ferrero, L., Maggioni, A., Sangiorgi, G., et al., 2014. Ex-haust emissions of polycyclic aromatic hydrocarbons, n-alkanes and phenols from ve-hicles coming within different European classes. Atmos. Environ. 82, 391–400.
Pettersson, T.J.R., Strömvall, A.-M., Ahlman, S., 2005. Underground sedimentation systemsfor treatment of highway runoff in dense city areas. Proceedings of the 10th
International Conference on Urban Drainage, August 21–26 2005/Eva Eriksson,Hülya Genc-Fuhrman, Jes Vollertsen, Anna Ledin, Thorkild Hvitved-Jacobsen, PeterSteen Mikkelsen, p. 30.
Ramachandran, V.S., 1996. 3 - Admixture Interactions in Concrete. Concrete AdmixturesHandbook. second ed. William Andrew Publishing, Park Ridge, NJ, pp. 95–136.
Ramadhan, O.M., Buker, R.A., Thanoon, A.A.A., 1997. Study of aromatic hydrocarbons inQaiyarah Naptha fraction 50–165 °C using gas chromatography/mass spectroscopy.Pet. Sci. Technol. 15, 127–135.
Ravindra, K., Sokhi, R., Van Grieken, R., 2008. Atmospheric polycyclic aromatic hydrocar-bons: source attribution, emission factors and regulation. Atmos. Environ. 42,2895–2921.
Remberger, M., Kaj, L., Palm, A., Sternbeck, J., Kvernes, E., Lunden, E.B., 2003. ScreeningTertiary Butylphenols, Methylphenols, and Long-chain Alkylphenols in the SwedishEnvironment. IVL Svenska Miljöinstitutet AB, p. 96.
Rixom, M.R., Mailvaganam, N.P., 1986. Chemical Admixtures for Concrete. E.&F.N. SponLtd.
Rosqvist, L., 2004. Screening av fenoler i Skånes miljö: utvärdering av provtagning 2003 ireningsverk, sjöar och hav (Screening of Phenols in Skåne's Environment: Evaluationof Sampling 2003 From Treatment Plants, Lakes and Seas). 2004. Länsstyrelsen iSkåne Län, p. 92.
Sartor, J.D., Boyd, G.B., Agardy, F.J., 1974.Water pollution aspects of street surface contam-inants. J. Water Pollut. Control Fed. 46, 458–467.
Schauer, J.J., Kleeman, M.J., Cass, G.R., Simoneit, B.R.T., 1999. Measurement of emissionsfrom air pollution sources. 2. C1 through C30 organic compounds from mediumduty diesel trucks. Environ. Sci. Technol. 33, 1578–1587.
Schauer, J.J., Kleeman, M.J., Cass, G.R., Simoneit, B.R.T., 2002. Measurement of emissionsfrom air pollution sources. 5. C1–C32 organic compounds from gasoline-poweredmotor vehicles. Environ. Sci. Technol. 36, 1169–1180.
Scheringer, M., 2010. Atmospheric emissions and long-range transport of persistent or-ganic chemicals. EPJ Web Conf. 9, 35–42.
Shen, H., Tao, S., Wang, R., Wang, B., Shen, G., Li, W., et al., 2011. Global time trends in PAHemissions from motor vehicles. Atmos. Environ. 45, 2067–2073.
Staples, C.A., Dorn, P.B., Klecka, G.M., O'Block, S.T., Harris, L.R., 1998. A review of the envi-ronmental fate, effects, and exposures of bisphenol A. Chemosphere 36, 2149–2173.
Štrumberger, N., Gospočić, A., Hvu, M., Bartulić, Č., 2005. Polymeric materials in automo-biles. Promet Traffic Traffico 17, 149–160.
Tiruta-Barna, L., Fantozzi-Merle, C., de Brauer, C., Barna, R., 2006. Leaching behaviour oflow level organic pollutants contained in cement-based materials: experimentalmethodology and modelling approach. J. Hazard. Mater. 138, 331–342.
Togerö, Å., 2006. Leaching of hazardous substances from additives and admixtures in con-crete. Environ. Eng. Sci. 23, 102–117.
UKEA, 1998. Tyres in the Environment. UK Environment Agency, Rio House, WatersideDrive Aztec West, Almondsbury, Bristol.
UN-ECE, 1998a. Draft protocol to the convention on long-range. Air pollution on persis-tent organic pollutants. In: Economic Commission for Europe (Ed.), Convention onLong-range Transboundary Air Pollution UNEaSC, p. 49 EB.AIR:1998:2.
Van Metre, P.C., Mahler, B.J., 2014. PAH concentrations in lake sediment decline followingban on coal-tar-based pavement sealants in Austin, Texas. Environ. Sci. Technol. 48,7222–7228.
Vikelsøe, J., Thomsen, M., Johansen, E., Carlsen, L., 1999. Phthalates and Nonylphenols inSoil. NERI Technical Report No. 268. Ministry of Environment and Energy, NationalEnvironmental Research Institute, p. 128.
Warner, L.R., Sokhi, R., Luhana, L., Boulter, P.G., 2000. Non-exhaust Particle EmissionsFrom Road Transport: A Literature Review. Atmospheric Science Research Group(ASRG), University of Hertfordshire. TRL Limited, p. 8.
Wess, J.A., Olsen, L.D., Sweeney, M.H., 2004. ASPHALT (BITUMEN). Concise InternationalChemical Assessment Document 59. National Institute for Occupational Safety andHealth, Cincinnati, Ohio, USA, Geneva, p. 56.
Westerlund, K.-G., 2001. Metal emissions from Stockholm traffic–wear of brake linings.REPORTS FROM SLB. The Stockholm Environment and Health Protection Administra-tion, p. 12.
Wong, P.K., Wang, J., 2001. The accumulation of polycyclic aromatic hydrocarbons in lu-bricating oil over time - a comparison of supercritical fluid and liquid-liquid extrac-tion methods. Environ. Pollut. 112, 407–415.
Żelichowski, S., 2002. Rozporządzenie Ministra Środowiska z dnia 9 września 2002 r. wsprawie standardów jakości gleby oraz standardów jakości ziemi (Regulation of theMinister of the Environment From September 2002 on Soil and Ground Quality Stan-dards). In: Środowiska, M. (Ed.), Dziennik Ustaw Nr 165/Poz. 1359, p. 6.
Zgheib, S., Moilleron, R., Chebbo, G., 2012. Priority pollutants in urban stormwater: part 1- case of separate storm sewers. Water Res. 46, 6683–6692.
Zhang, W., Zhang, S., Wan, C., Yue, D., Ye, Y., Wang, X., 2008. Source diagnostics of polycy-clic aromatic hydrocarbons in urban road runoff, dust, rain and canopy throughfall.Environ. Pollut. 153, 594–601.
Zhang, R., Duan, J., Yin, Y., 2011. Research on pavement characteristics of epoxy resin andrubber modified asphalt. Adv. Mater. Res. 150–151, 433–440.