1 CORRELATION BETWEEN POLLUTANTS EMISSION AND INHABITANT’S MORBIDITY: SÃO PAULO CITY STUDY CASE Gheisa R. T. Esteves Sonia R.C.S. Barbosa Campinas, Brazil Paper presented to the PRIPODE workshop on Urban Population, Development and Environment Dynamics in Developing Countries Jointly organized by CICRED, PERN and CIESIN With support from the APHRC, Nairobi 11-13 June 2007 Nairobi, Kenya
Transcript
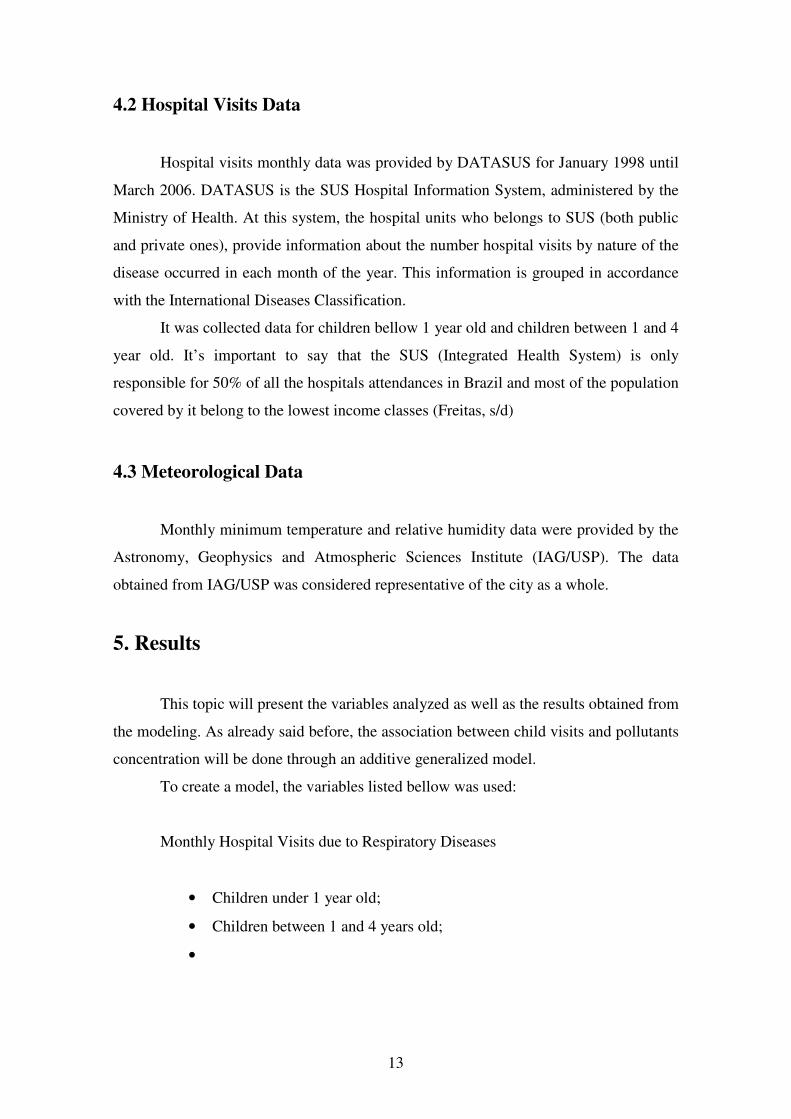
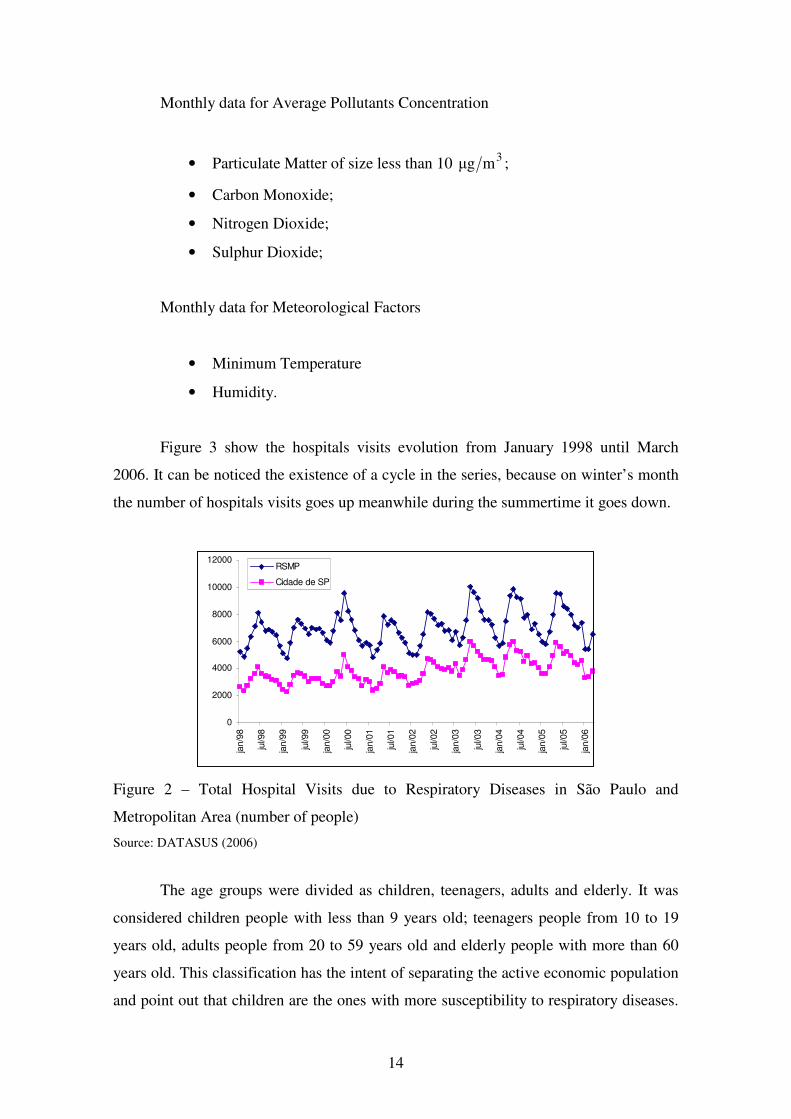
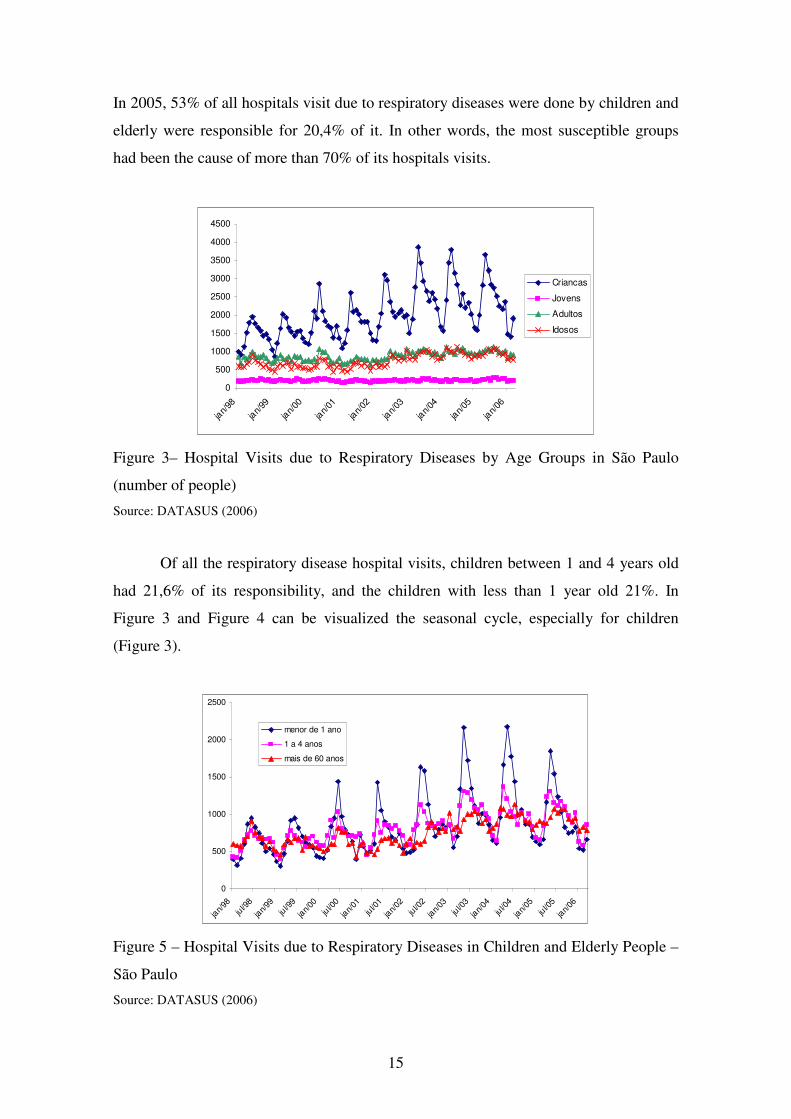
1
CORRELATION BETWEEN POLLUTANTS EMISSION AND
INHABITANT’S MORBIDITY:
SÃO PAULO CITY STUDY CASE
Gheisa R. T. Esteves
Sonia R.C.S. Barbosa Campinas, Brazil
Paper presented to the PRIPODE workshop on
Urban Population, Development and Environment Dynamics in Developing
Countries
Jointly organized by CICRED, PERN and CIESIN
With support from the APHRC, Nairobi
11-13 June 2007
Nairobi, Kenya
2
CORRELATION BETWEEN POLLUTANTS EMISSION AND
INHABITANT’S MORBIDITY:
SÃO PAULO CITY STUDY CASE1
Gheisa R. T. Esteves2 Sonia R.C.S. Barbosa3
1. Introduction
The humanity lives a moment in its history where it is ascending the
environmental concern. Not so long ago, the human kind believed that energy sources
were inexhaustible and that it could be consumed without attempting for problems like
scarcity and the harming effects of pollutants on human health and the environment. In
the end of XX century, a number of episodes pointed out the actual development model
have a extremely predatory character.
Air pollution is a growing problem in big urban centers. Cities like Los Angeles,
Tokyo, Mexico City and São Paulo has a huge vehicle fleet, not just for having high
concentration of population, but also due to the actual world socioeconomic conjuncture
(Goldenberg, 1998). Its conjuncture tends to prioritize the individual transport when
compared with the collective transports. When the focus is the developing countries, it
is necessary to add that, the collective transport usually has really bad conditions and it
ends up encouraging people to use individual transport.
In the beginning of the capitalism, during the industrial revolution, most of the
air pollution came from industries. After the introduction of rigid control to industrial
emission, the main source of emission became the vehicle fleet and therefore it is
nowadays the most responsible for the deleterious effects that air pollution has human
health.
The first episode of increase in the respiratory diseases morbidity and mortality
in a region due to the unexpected increases of pollutants concentrations was notified in
1 This paper is part of the doctoral research that Gheisa Roberta Telles Esteves has been developing under the supervision of Sonia R. C. S. Barbosa with financial support of National Council for Scientific and Technological Development (CnPq), Brazil. 2 PhD Student in Energy Planning - Mechanical Engineering Faculty – State University of Campinas (UNICAMP). Email: [email protected]. 3 Associate Researcher of Environmental Studies Center (NEPAM) at State University of Campinas (UNICAMP), Brazil.
3
1930, in an area between the cities of Huy and Liége (Belgium). The two cities are
located in the Muse Valley, which is a region with high concentration of industries. In
that occasion, the numbers of respiratory morbidity and mortality went up due to a
junction of some factors: adverse meteorological conditions (among them the absence
of wind flows), that made difficult for the pollutants to be dispersed. Other similar
events occurred some years later, in Pennsylvania (1948) and the most notorious and
serious one, in London (1952). In the “London Fog” episode, there was, approximately,
4.000 deaths and some thousands visits to the emergency rooms in just 3 days. Most of
the hospitals visits and deaths were caused by thermal inversion that made difficult the
dispersion of the pollutants emitted by the industries.
Due to the events listed above, it was created the “Clean Air Acts” in Europe
and the establishment of air quality standards in the United States. In developing
countries, especially in São Paulo city and Metropolitan area, not so serious episodes
motivated the government to adopt control measures for air quality and pollutants
emission both for transport and industrial sectors.
In São Paulo City, the LPAE (Atmospheric Pollution Laboratory) was the first to
study the effects of air pollution on human health, animals and plants. According to
LPAE, in São Paulo city, the risk of death by respiratory and cardiovascular diseases
increases 12% in days with high levels of air pollution. The most susceptible part of the
population is children and elderly people, besides from people with chronic respiratory
diseases (Saldiva, Braga&Pereira, 2001).
It’s well known the actual pollutants levels are bellow from the numbers
registered some decades ago (CETESB, 2006). However, those levels still are harming
to the population living in the area. It’s out of question that there was a mitigation of
those effects, but they remain causing problems on people’s health. In fact, any
pollutant level will have some adverse effects on the population.
Based on the problems remarked in the previous paragraphs, the objective of the
study is to establish the relation between air pollutants concentration and the number of
children visiting to hospitals in São Paulo. In the first part of the study, it will be
established the spearman correlation between the number of people going to public
health clinics monthly as well the monthly variation of each pollutant. The age groups
will be divided as follow: less than 1 year old, between 1 and 4 years old, between 5 and
9 years old, between 10 and 14 years old, between 15 and 19 years old, between 20 and
59 years old, between 60 and 69 years old, between 70 and 79 years old and more than
4
80 years old. Then, it will be modeled the group of children under 1 year old and
between 1 and 4 years old to using a generalized additive model, supposing that it
follows a Poisson distribution. In the final part it will be presented conclusions taken
from the results obtained.
2. Air Pollution and Impacts on Human Health: The Case of São Paulo
City
The air quality in São Paulo city is determined not just by its topographic
characteristics and meteorological conditions but also by the way the vehicles circulate
in the city and the localization of industries (Cetesb, 2004). Also the urban development
process occurred in the city after the fifties is responsible for the air quality problems,
because it end up causing the creation of a heat island in the area (Carmo, 1995, Cetesb,
2005).
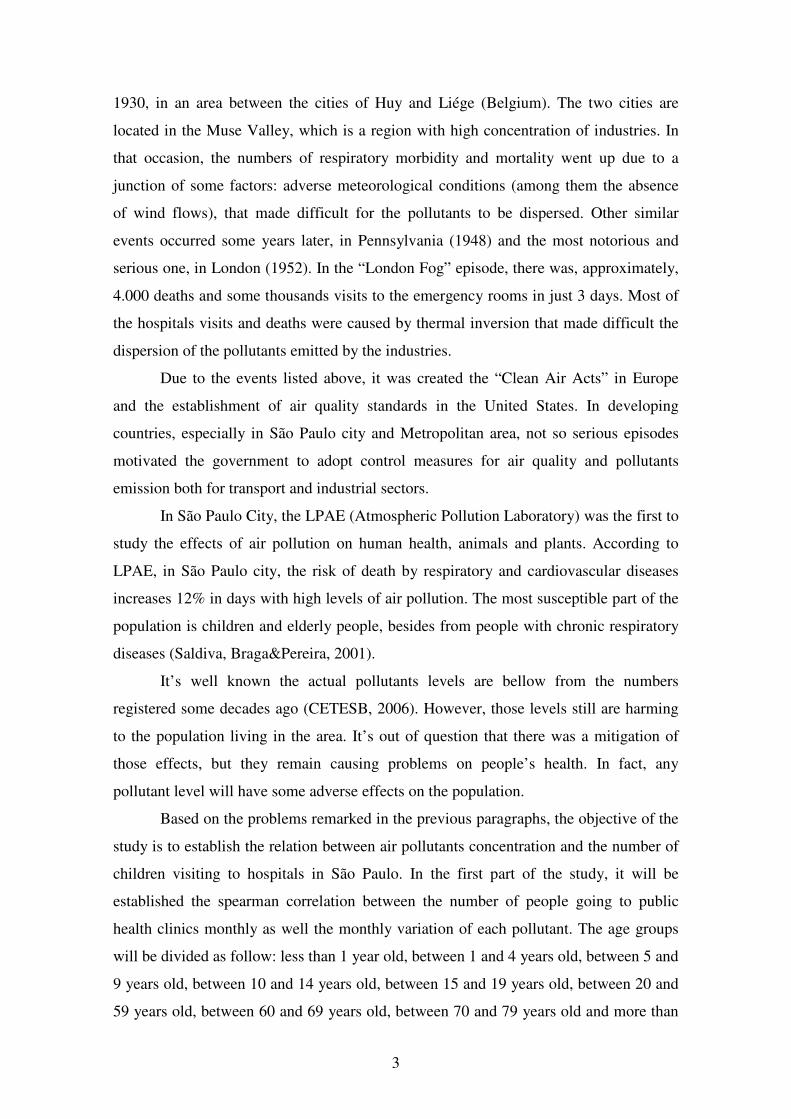
In 2004, São Paulo city had its vehicle fleet composition as it’s shown on Figure
1. Most of the fleet is composed by vehicles and motorbikes. Even though, buses
corresponds to just 3% and trucks to 8% of the fleet, it’s necessary to take into
consideration that its daily circulation is much higher than of the other vehicles.
Caminhonetas
23%
Onibus
3%
Motos
25%
Automoveis
41%
Caminhoes
8%
Figure 1 – Organization of São Paulo City Vehicle Fleet – 2004
Source: Prodesp/Detran (2006)
Concerning the fuels used by the fleet, 77% of the vehicles run with gasoline,
16% with alcohol and 6% with diesel. It is important to say that the vehicles which run
with gasoline and alcohol follow the Otto cycle and the main pollutants emitted by them
5
are carbon monoxide, nitrogen oxides, hydrocarbons and aldehydes. In the case of
vehicles that run with gasoline, it also emits particulate matter and sulphur oxides. In
the vehicles moved by diesel the main pollutants emitted are particulate matter, nitrogen
oxides and sulphur oxides (Alvarez, 2002).
Facing the fact of the great gravity of the air pollution problem, it was created by
the government in 1980 a program fixing limits of pollutants emission. PROCONVE –
Programa de Controle da Poluição do Ar por Veículos Automotores (Vehicles Air
Pollution Control Program) was created based on international experiences and
determine maximum limits to vehicle and engines emissions. With the implementation
of this program, in 2000, the pollutants emissions reduced in 90% when compared with
1986.
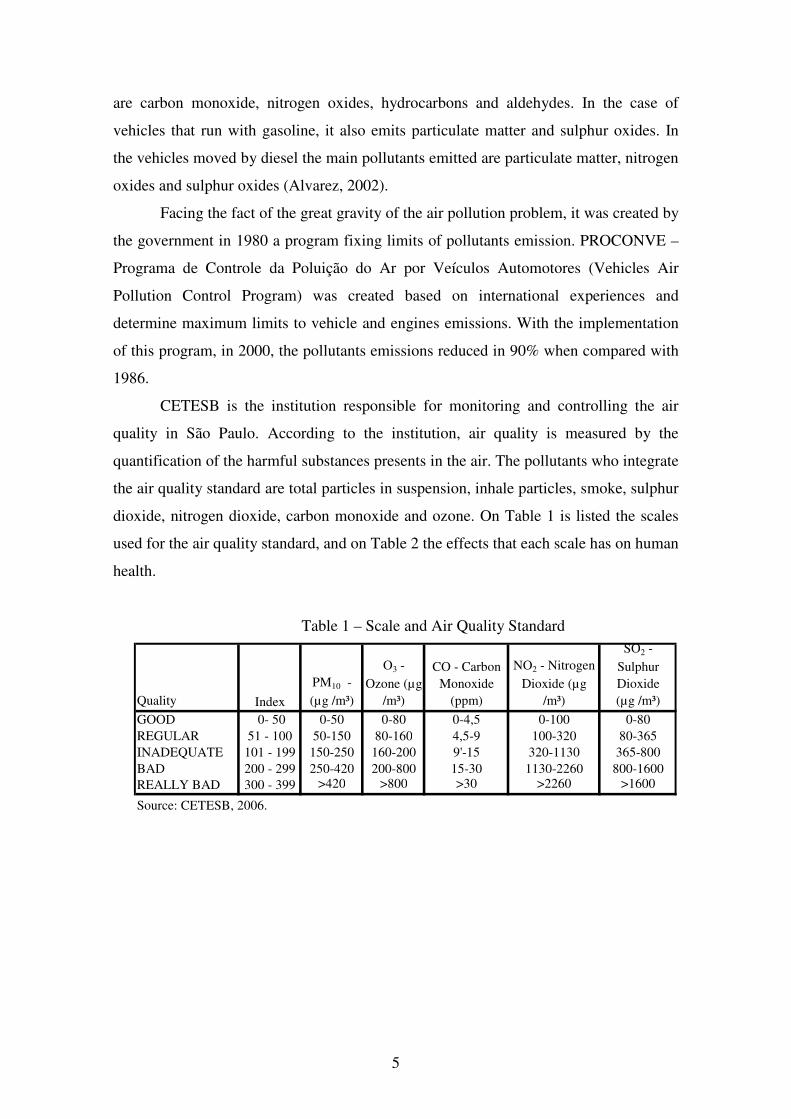
CETESB is the institution responsible for monitoring and controlling the air
quality in São Paulo. According to the institution, air quality is measured by the
quantification of the harmful substances presents in the air. The pollutants who integrate
the air quality standard are total particles in suspension, inhale particles, smoke, sulphur
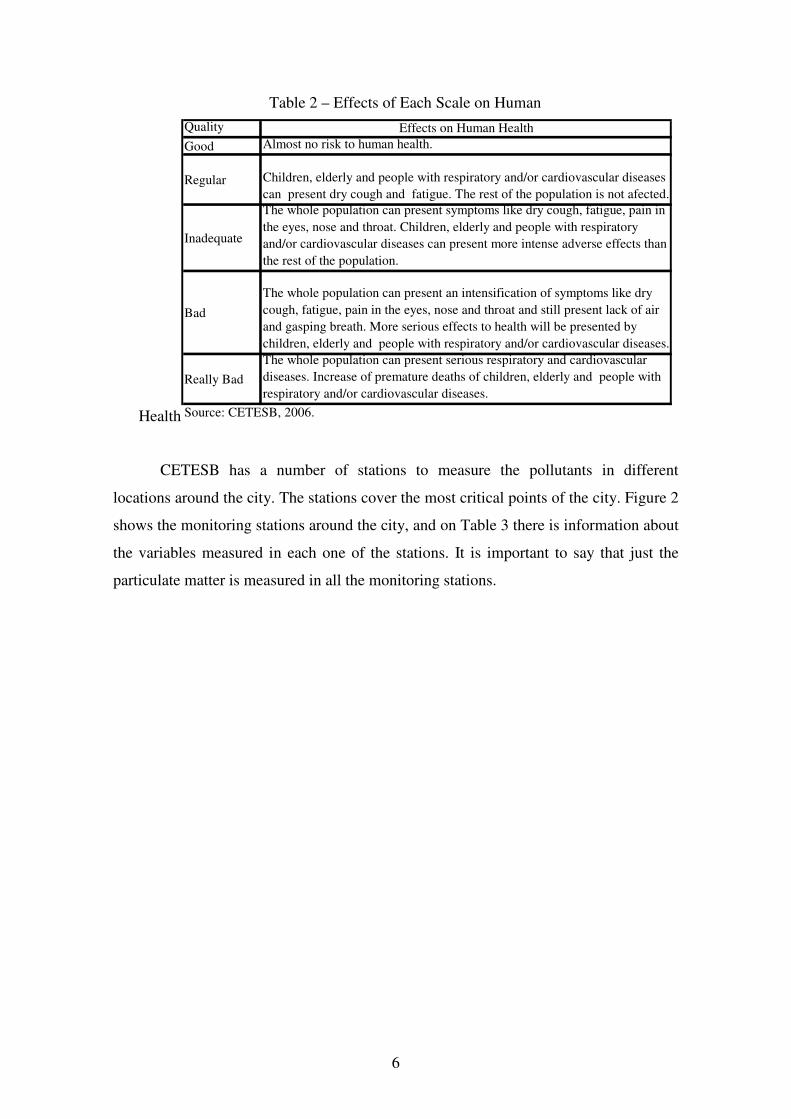
dioxide, nitrogen dioxide, carbon monoxide and ozone. On Table 1 is listed the scales
used for the air quality standard, and on Table 2 the effects that each scale has on human
Regular Children, elderly and people with respiratory and/or cardiovascular diseases can present dry cough and fatigue. The rest of the population is not afected.
Inadequate
The whole population can present symptoms like dry cough, fatigue, pain in the eyes, nose and throat. Children, elderly and people with respiratory and/or cardiovascular diseases can present more intense adverse effects than the rest of the population.
Bad
The whole population can present an intensification of symptoms like dry cough, fatigue, pain in the eyes, nose and throat and still present lack of air and gasping breath. More serious effects to health will be presented by children, elderly and people with respiratory and/or cardiovascular diseases.
Really Bad
The whole population can present serious respiratory and cardiovascular diseases. Increase of premature deaths of children, elderly and people with respiratory and/or cardiovascular diseases.
Source: CETESB, 2006.
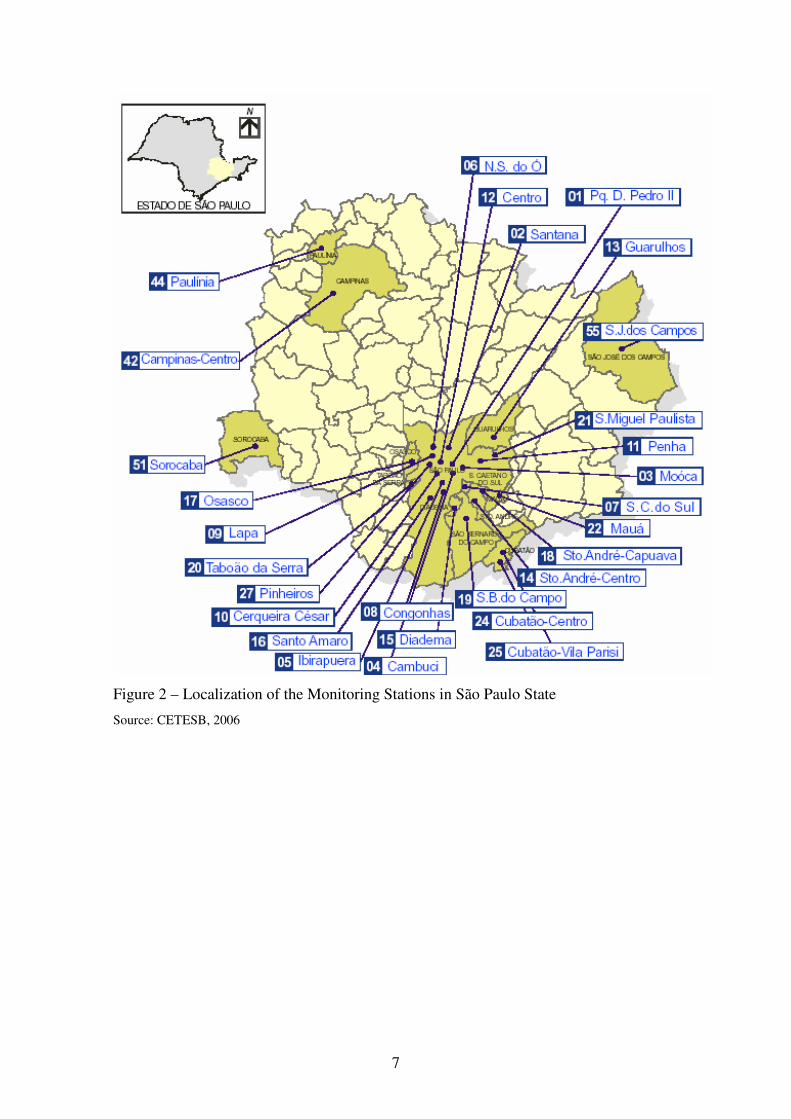
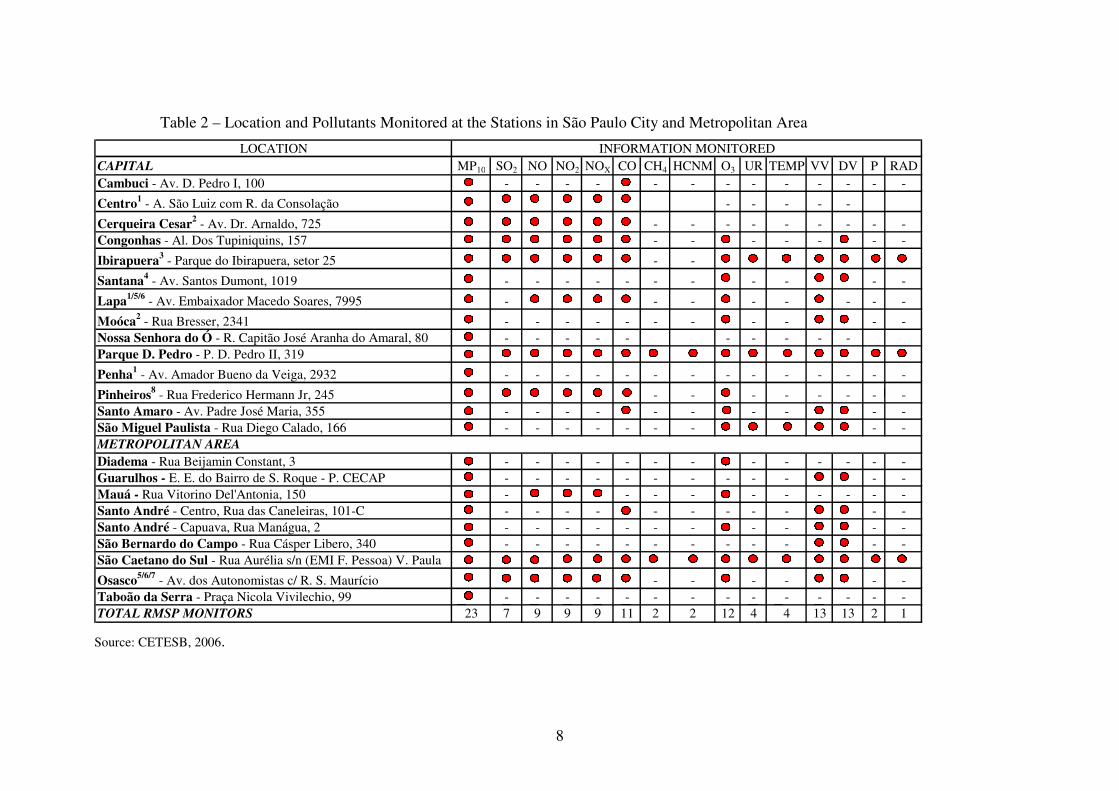
CETESB has a number of stations to measure the pollutants in different
locations around the city. The stations cover the most critical points of the city. Figure 2
shows the monitoring stations around the city, and on Table 3 there is information about
the variables measured in each one of the stations. It is important to say that just the
particulate matter is measured in all the monitoring stations.
7
Figure 2 – Localization of the Monitoring Stations in São Paulo State
Source: CETESB, 2006
8
Table 2 – Location and Pollutants Monitored at the Stations in São Paulo City and Metropolitan Area
LOCATIONCAPITAL MP10 SO2 NO NO2 NOX CO CH4 HCNM O3 UR TEMP VV DV P RADCambuci - Av. D. Pedro I, 100 - - - - - - - - - - - - - -
Centro1 - A. São Luiz com R. da Consolação - - - - -
Cerqueira Cesar2 - Av. Dr. Arnaldo, 725 - - - - - - - - -Congonhas - Al. Dos Tupiniquins, 157 - - - - - - -
Moóca2 - Rua Bresser, 2341 - - - - - - - - - - -Nossa Senhora do Ó - R. Capitão José Aranha do Amaral, 80 - - - - - - - - - -Parque D. Pedro - P. D. Pedro II, 319
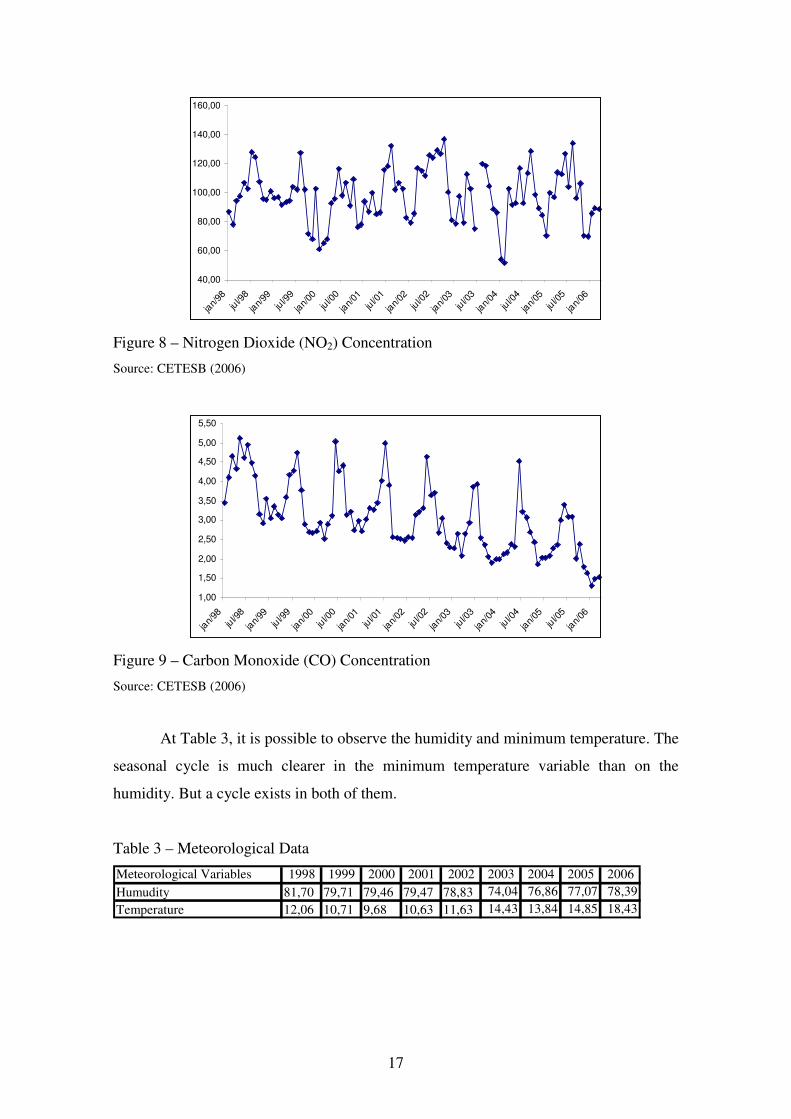
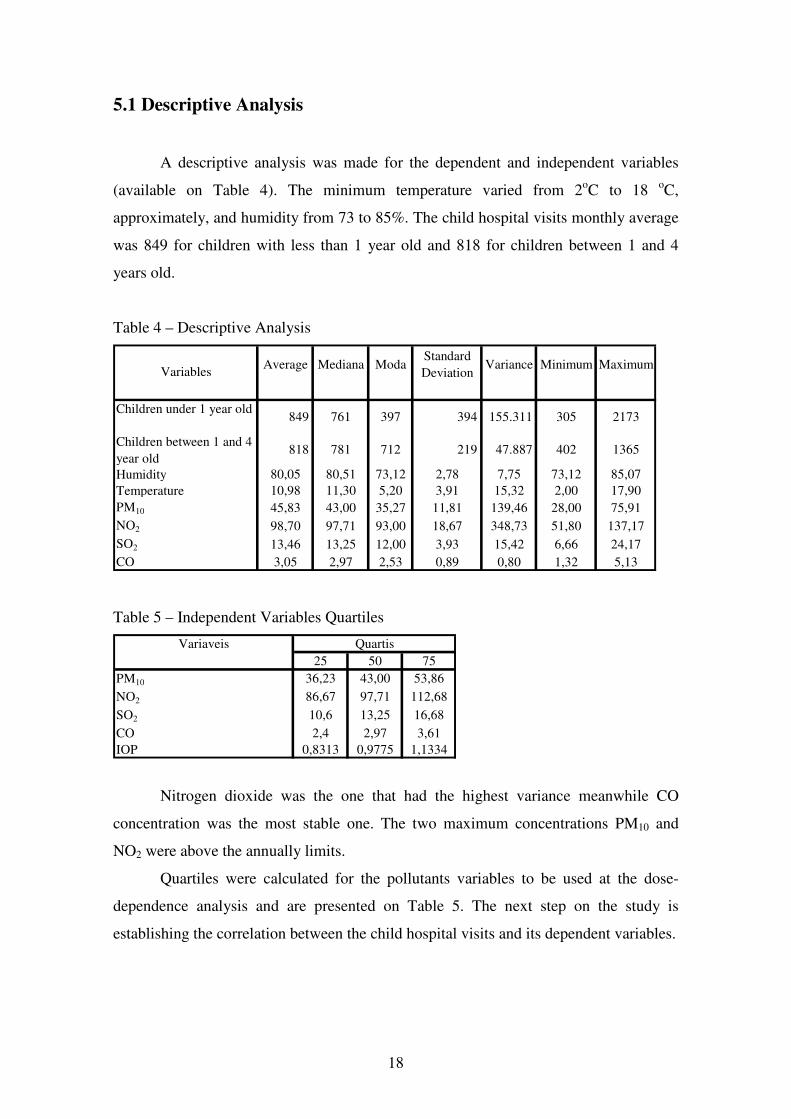
Nitrogen dioxide was the one that had the highest variance meanwhile CO
concentration was the most stable one. The two maximum concentrations PM10 and
NO2 were above the annually limits.
Quartiles were calculated for the pollutants variables to be used at the dose-
dependence analysis and are presented on Table 5. The next step on the study is
establishing the correlation between the child hospital visits and its dependent variables.
19
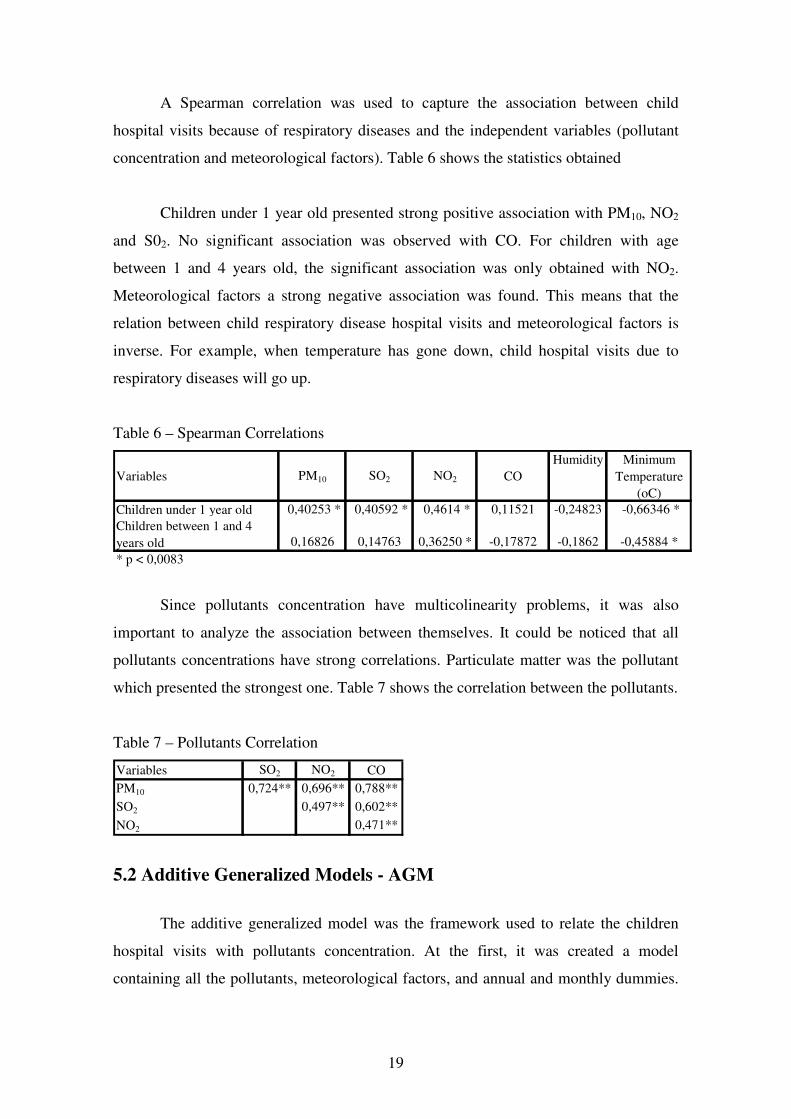
A Spearman correlation was used to capture the association between child
hospital visits because of respiratory diseases and the independent variables (pollutant
concentration and meteorological factors). Table 6 shows the statistics obtained
Children under 1 year old presented strong positive association with PM10, NO2
and S02. No significant association was observed with CO. For children with age
between 1 and 4 years old, the significant association was only obtained with NO2.
Meteorological factors a strong negative association was found. This means that the
relation between child respiratory disease hospital visits and meteorological factors is
inverse. For example, when temperature has gone down, child hospital visits due to
respiratory diseases will go up.
Table 6 – Spearman Correlations
Variables PM10 SO2 NO2 COHumidity Minimum
Temperature (oC)
Children under 1 year old 0,40253 * 0,40592 * 0,4614 * 0,11521 -0,24823 -0,66346 *Children between 1 and 4 years old 0,16826 0,14763 0,36250 * -0,17872 -0,1862 -0,45884 ** p < 0,0083
Since pollutants concentration have multicolinearity problems, it was also
important to analyze the association between themselves. It could be noticed that all
pollutants concentrations have strong correlations. Particulate matter was the pollutant
which presented the strongest one. Table 7 shows the correlation between the pollutants.
Table 7 – Pollutants Correlation
Variables SO2 NO2 COPM10 0,724** 0,696** 0,788**
SO2 0,497** 0,602**
NO2 0,471**
5.2 Additive Generalized Models - AGM
The additive generalized model was the framework used to relate the children
hospital visits with pollutants concentration. At the first, it was created a model
containing all the pollutants, meteorological factors, and annual and monthly dummies.
20
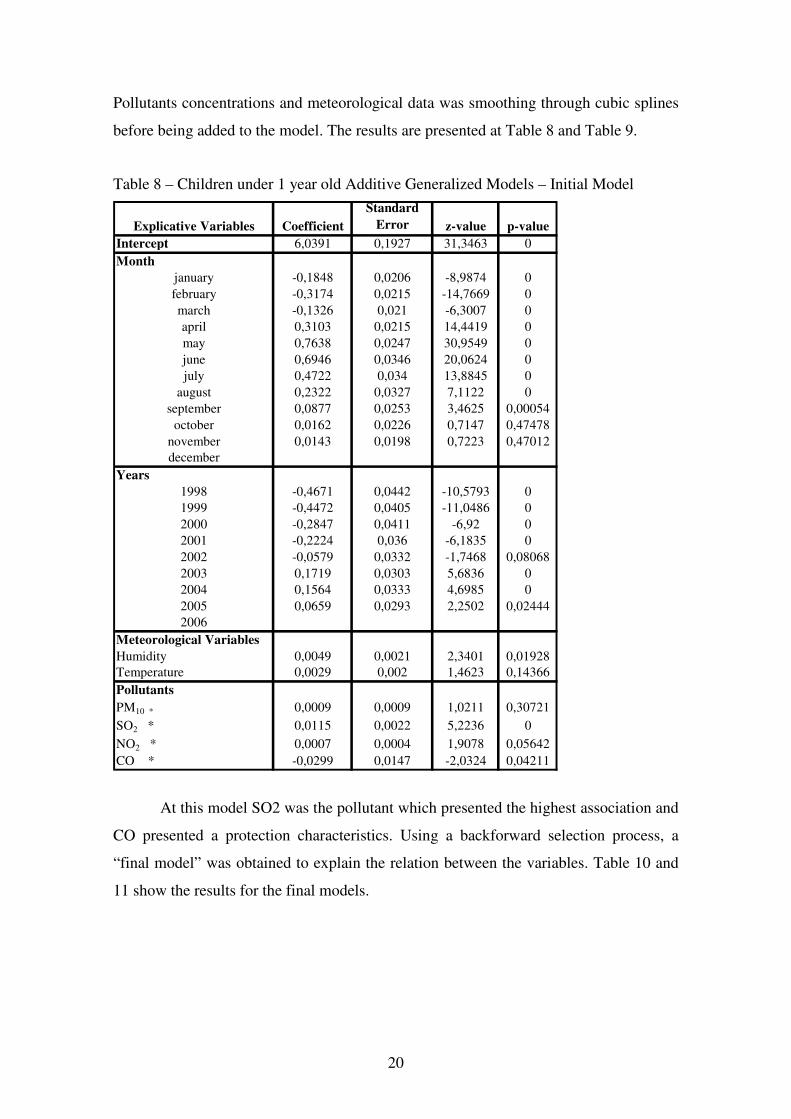
Pollutants concentrations and meteorological data was smoothing through cubic splines
before being added to the model. The results are presented at Table 8 and Table 9.
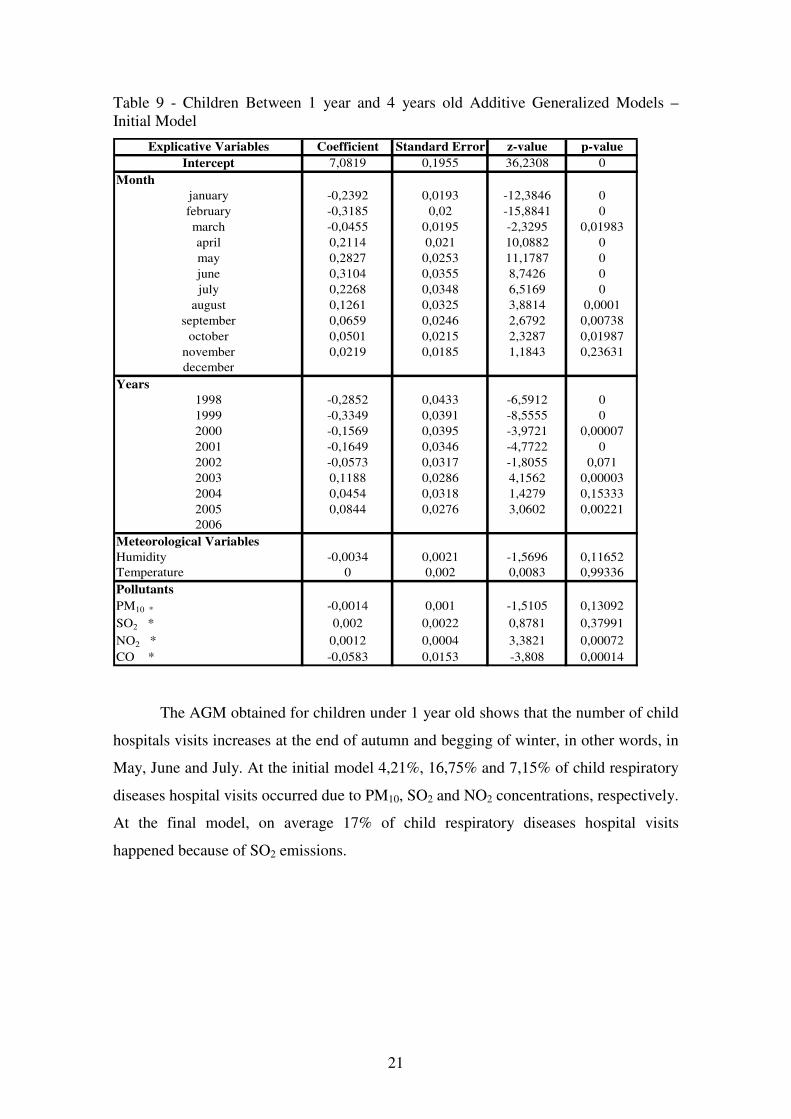
Table 8 – Children under 1 year old Additive Generalized Models – Initial Model
Meteorological VariablesHumidity -0,0034 0,0021 -1,5696 0,11652Temperature 0 0,002 0,0083 0,99336PollutantsPM10 * -0,0014 0,001 -1,5105 0,13092SO2 * 0,002 0,0022 0,8781 0,37991NO2 * 0,0012 0,0004 3,3821 0,00072CO * -0,0583 0,0153 -3,808 0,00014 The AGM obtained for children under 1 year old shows that the number of child
hospitals visits increases at the end of autumn and begging of winter, in other words, in
May, June and July. At the initial model 4,21%, 16,75% and 7,15% of child respiratory
diseases hospital visits occurred due to PM10, SO2 and NO2 concentrations, respectively.
At the final model, on average 17% of child respiratory diseases hospital visits
happened because of SO2 emissions.
22
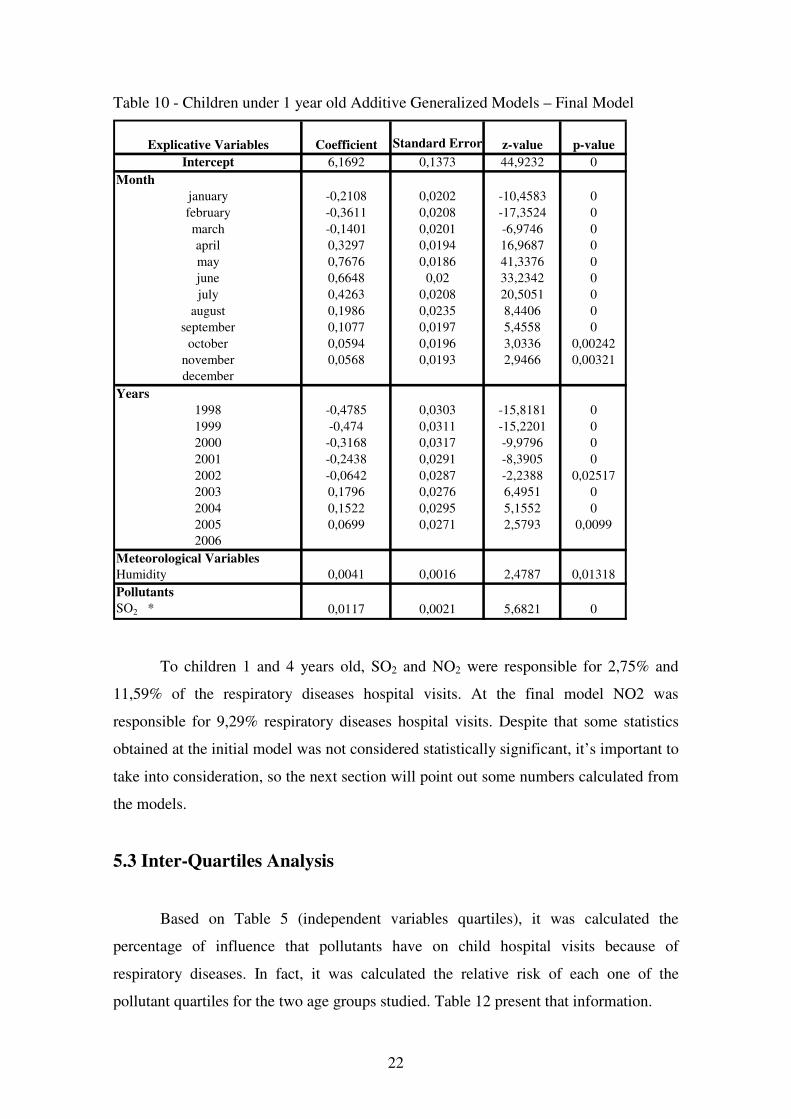
Table 10 - Children under 1 year old Additive Generalized Models – Final Model
Meteorological VariablesHumidity 0,0041 0,0016 2,4787 0,01318PollutantsSO2 * 0,0117 0,0021 5,6821 0 To children 1 and 4 years old, SO2 and NO2 were responsible for 2,75% and
11,59% of the respiratory diseases hospital visits. At the final model NO2 was
responsible for 9,29% respiratory diseases hospital visits. Despite that some statistics
obtained at the initial model was not considered statistically significant, it’s important to
take into consideration, so the next section will point out some numbers calculated from
the models.
5.3 Inter-Quartiles Analysis
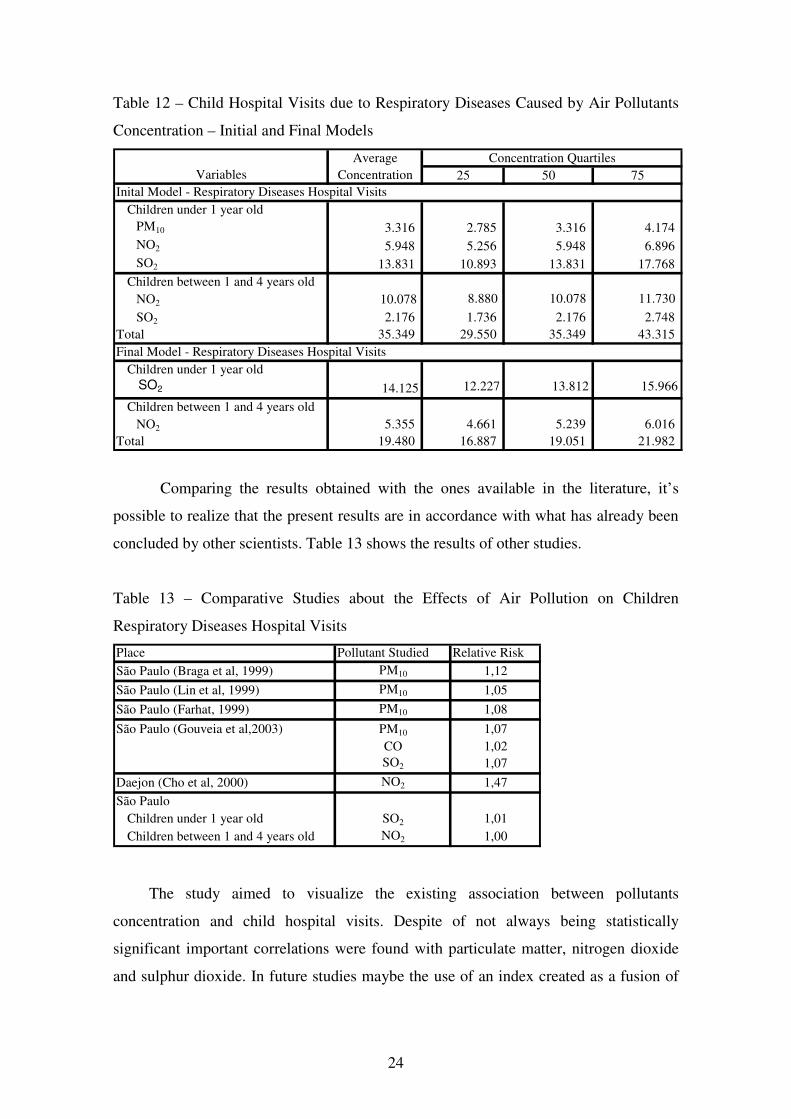
Based on Table 5 (independent variables quartiles), it was calculated the
percentage of influence that pollutants have on child hospital visits because of
respiratory diseases. In fact, it was calculated the relative risk of each one of the
pollutant quartiles for the two age groups studied. Table 12 present that information.
23
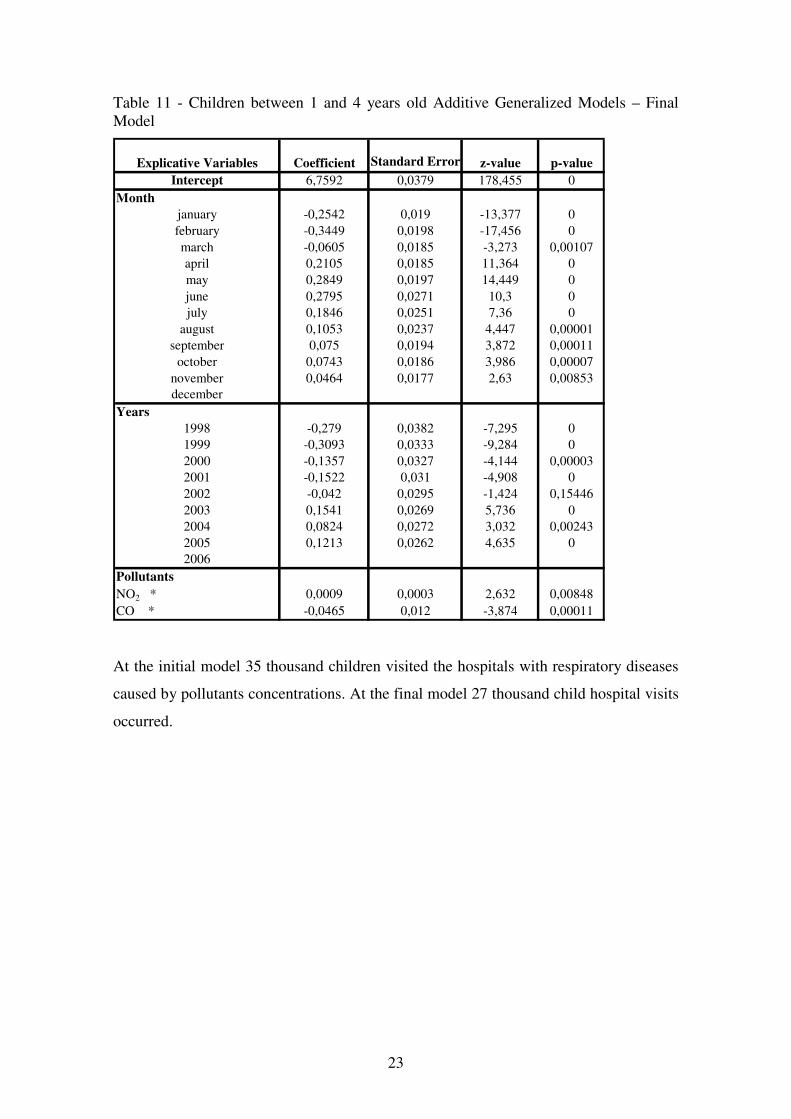
Table 11 - Children between 1 and 4 years old Additive Generalized Models – Final Model

![Transport processes Emission – [mass/time] pollutants released into the environment Imission – [mass/volume] amount of pollutants received by a living.](https://static.documents.pub/doc/80x56/56649f4e5503460f94c6f192/transport-processes-emission-masstime-pollutants-released-into-the-environment.jpg)


